
Synthetic Theft Attacks and Long Short Term Memory-Based Preprocessing for Electricity Theft Detection Using Gated Recurrent Unit

 ,
,  , ,
, ,  ,
, 
Abstract
:1. Introduction
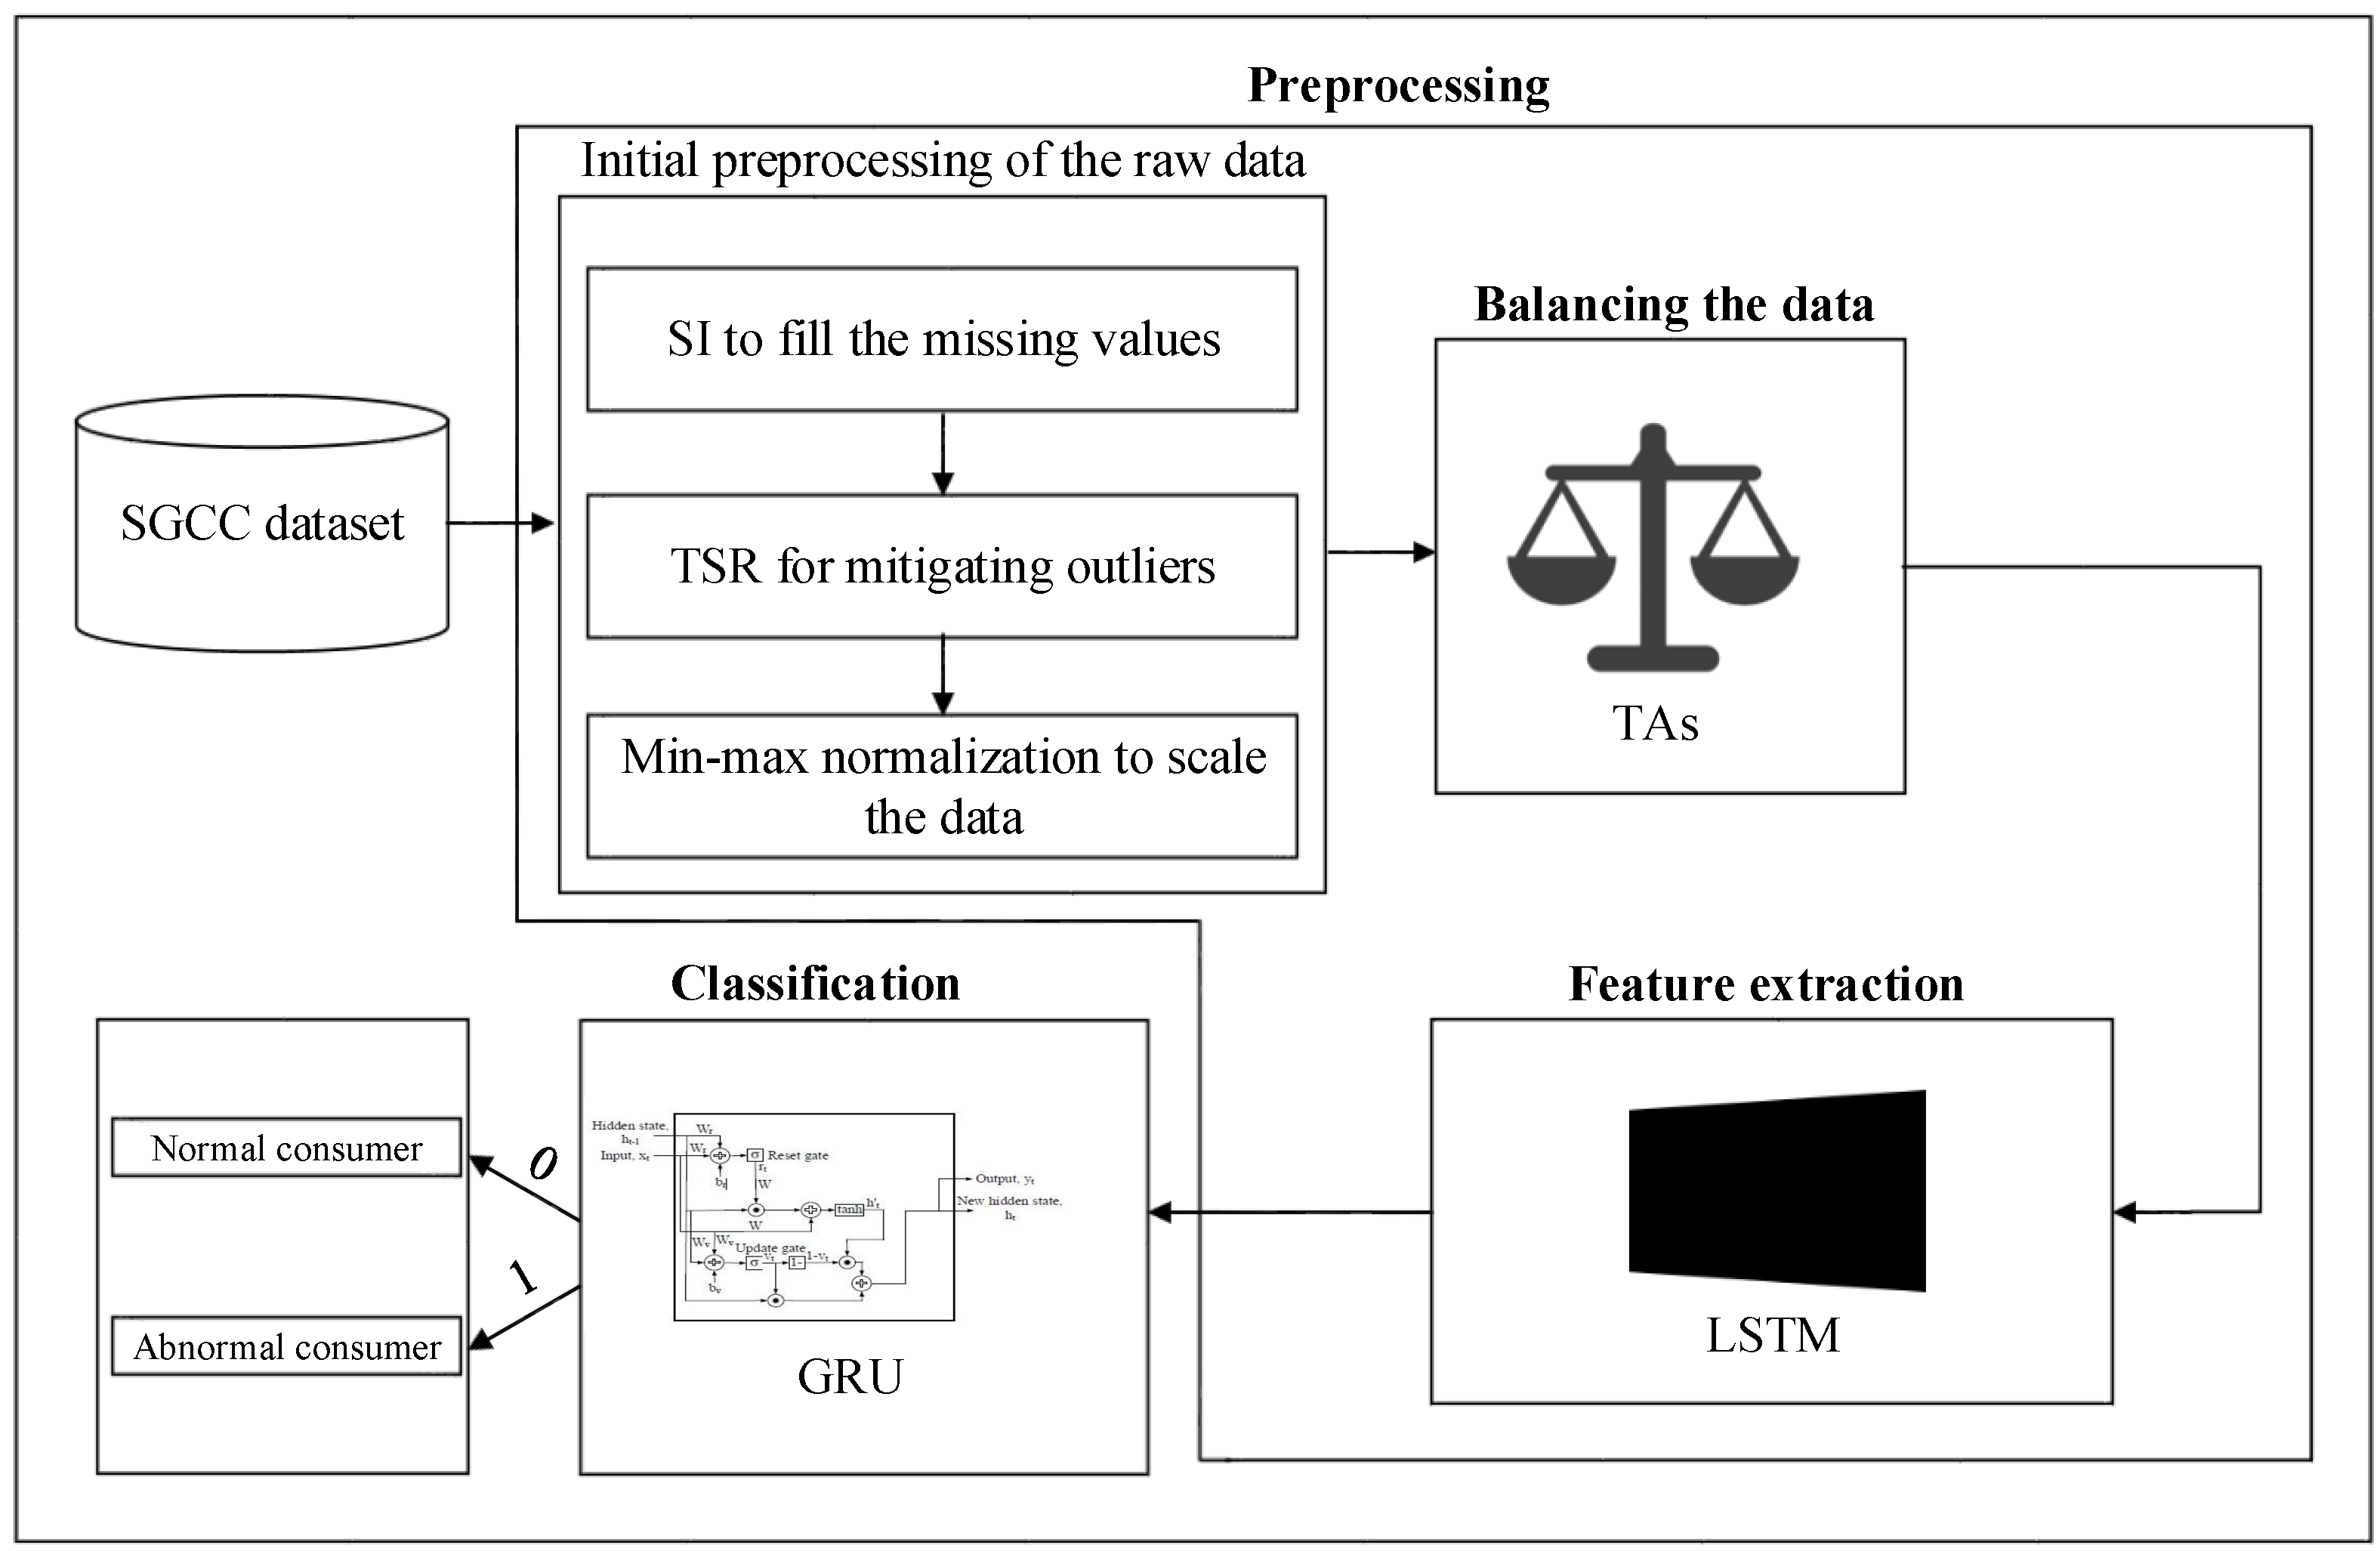
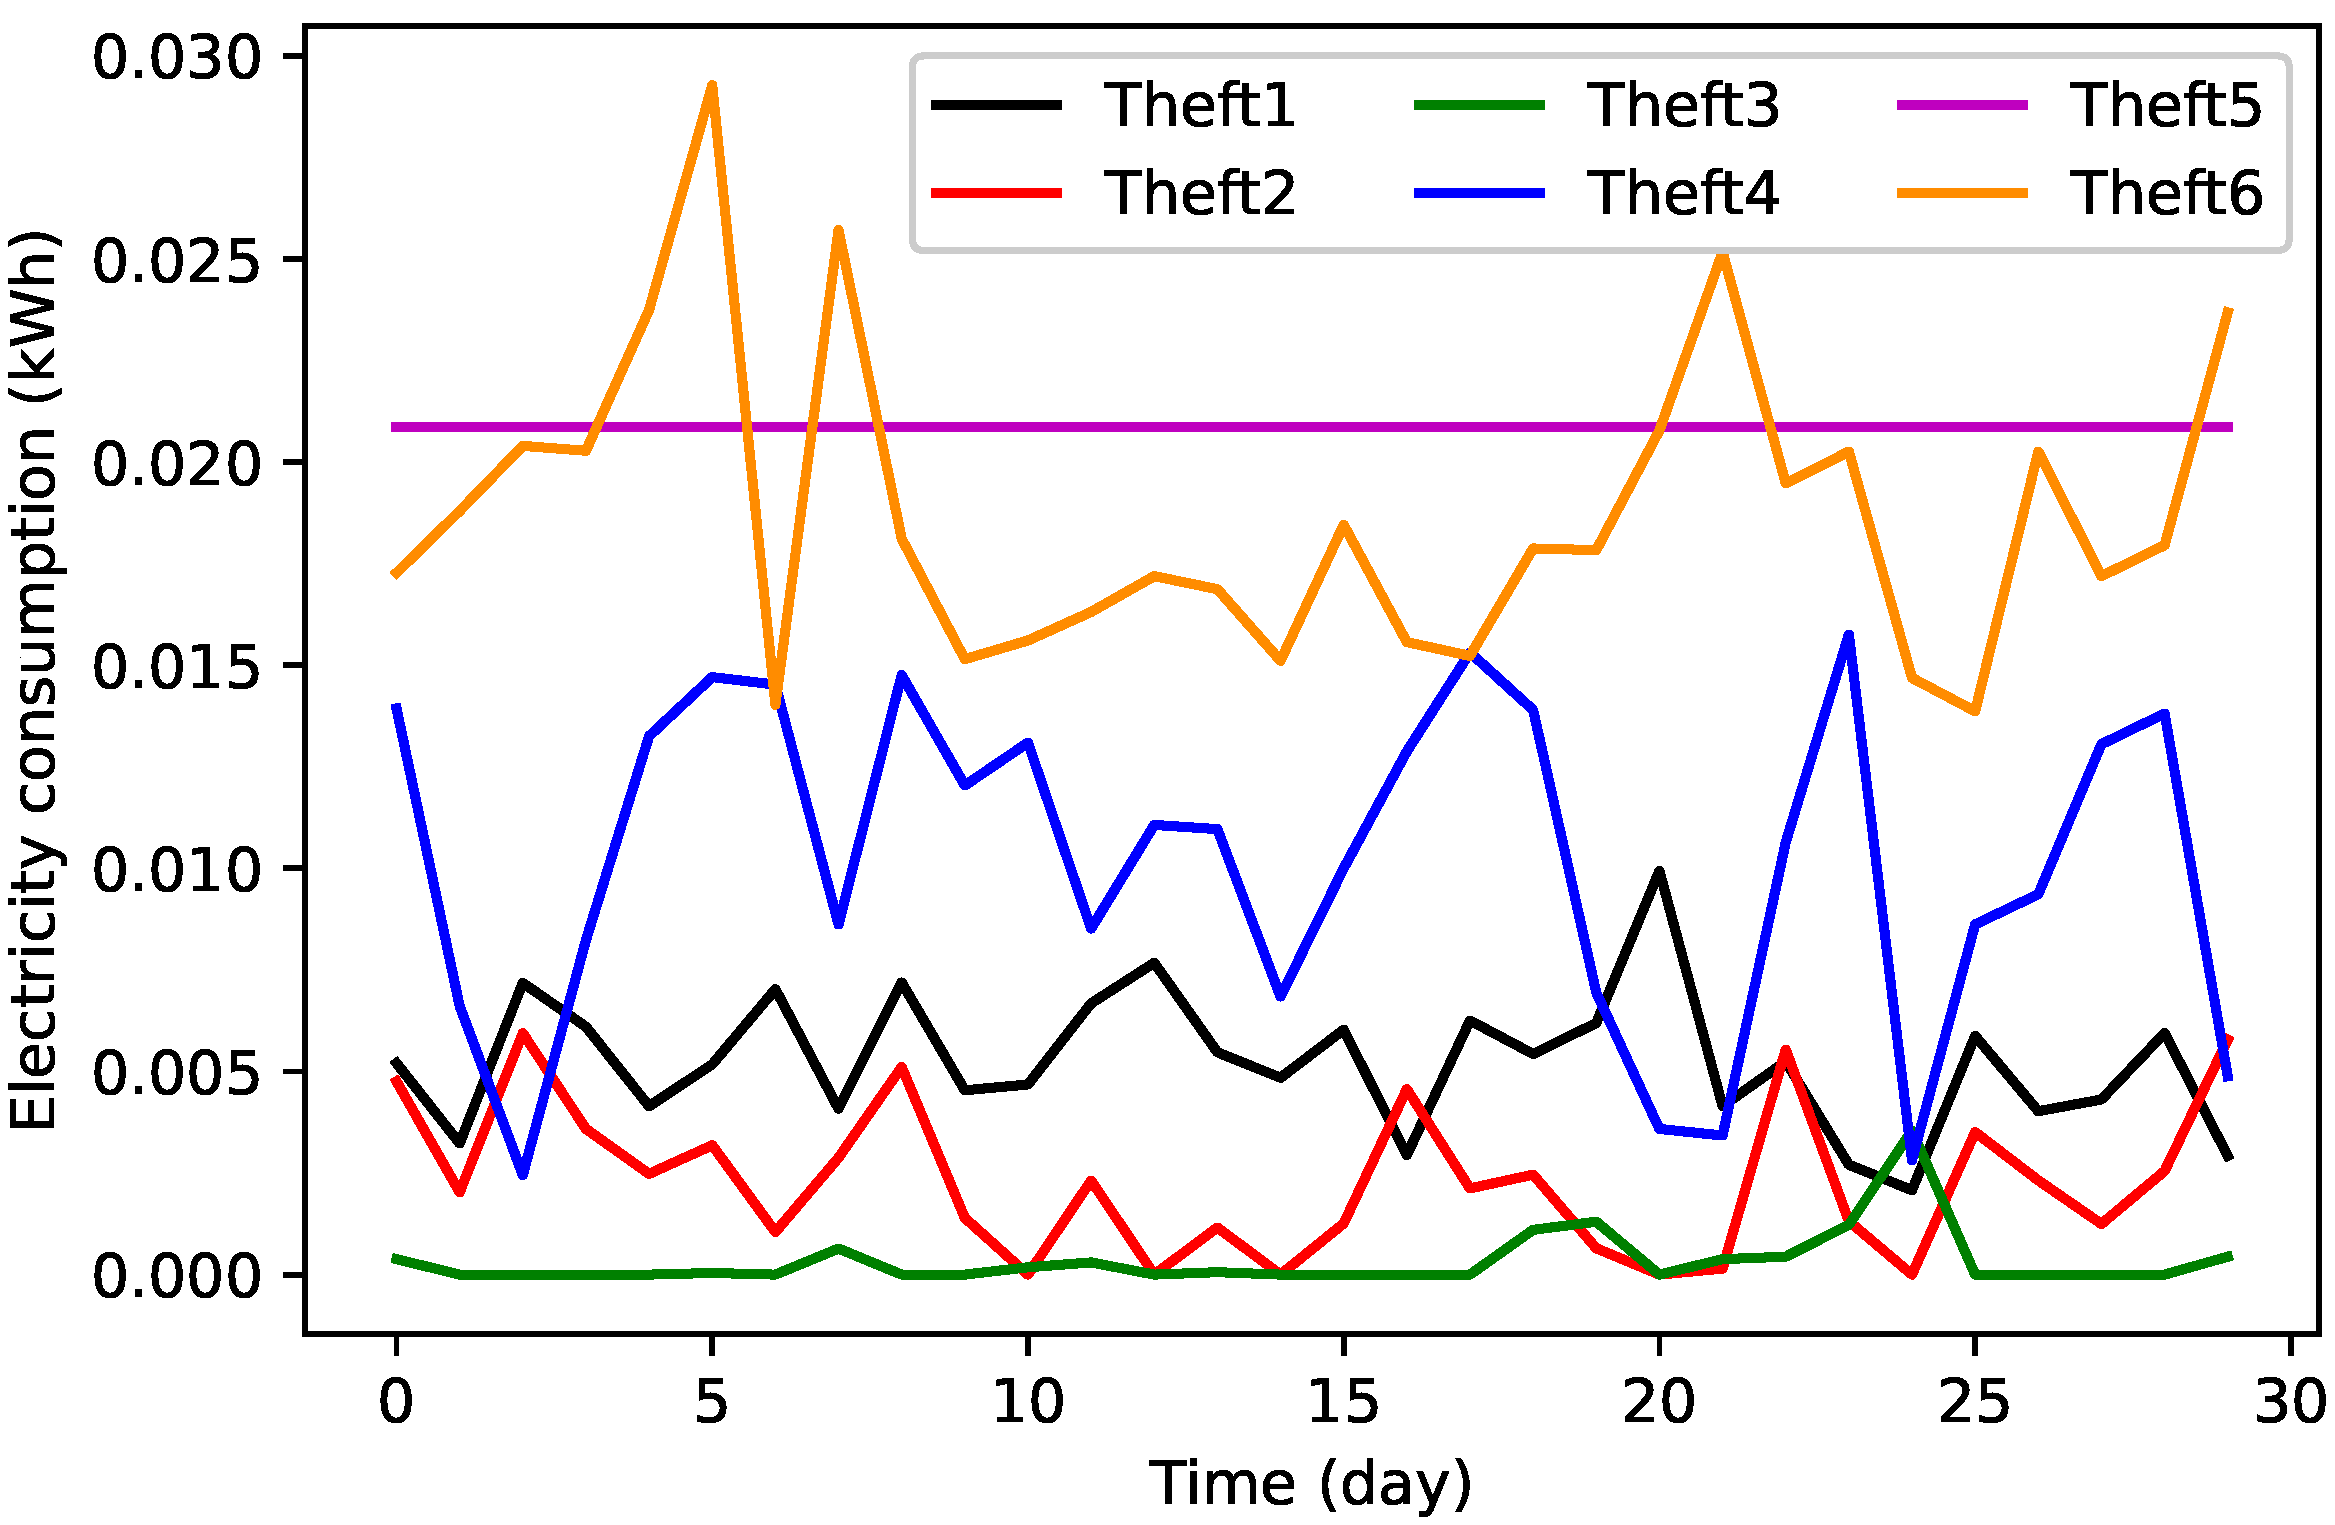
- A TLGRU model is proposed for effective and reliable ETD in SGs. In the proposed model, the synthetic TAs are implemented to generate theft samples in the dataset acquired from state grid corporation of China (SGCC) for tackling imbalance problem. Moreover, LSTM is employed to efficiently extract and maintain the vital characteristics from the huge time series data, which handle curse of dimensionality problem.
- A powerful recurrent memory network, termed as GRU, is utilized to initially investigate the electricity consumption (EC) profiles of consumers and then tackle the problem of drift accordingly.
- An efficient regularization technique, known as dropout, is integrated in the proposed TLGRU model to avoid overfitting and increase the convergence speed.
2. Literature Review
3. Proposed System Model
3.1. Dataset Description
3.2. Preprocessing Unit
3.2.1. Initial Preprocessing of the Raw Data
3.2.2. Data Balancing by TAs’ Implementation
3.2.3. Long Short Term Memory Based Feature Extraction
3.3. Theft Classification Unit
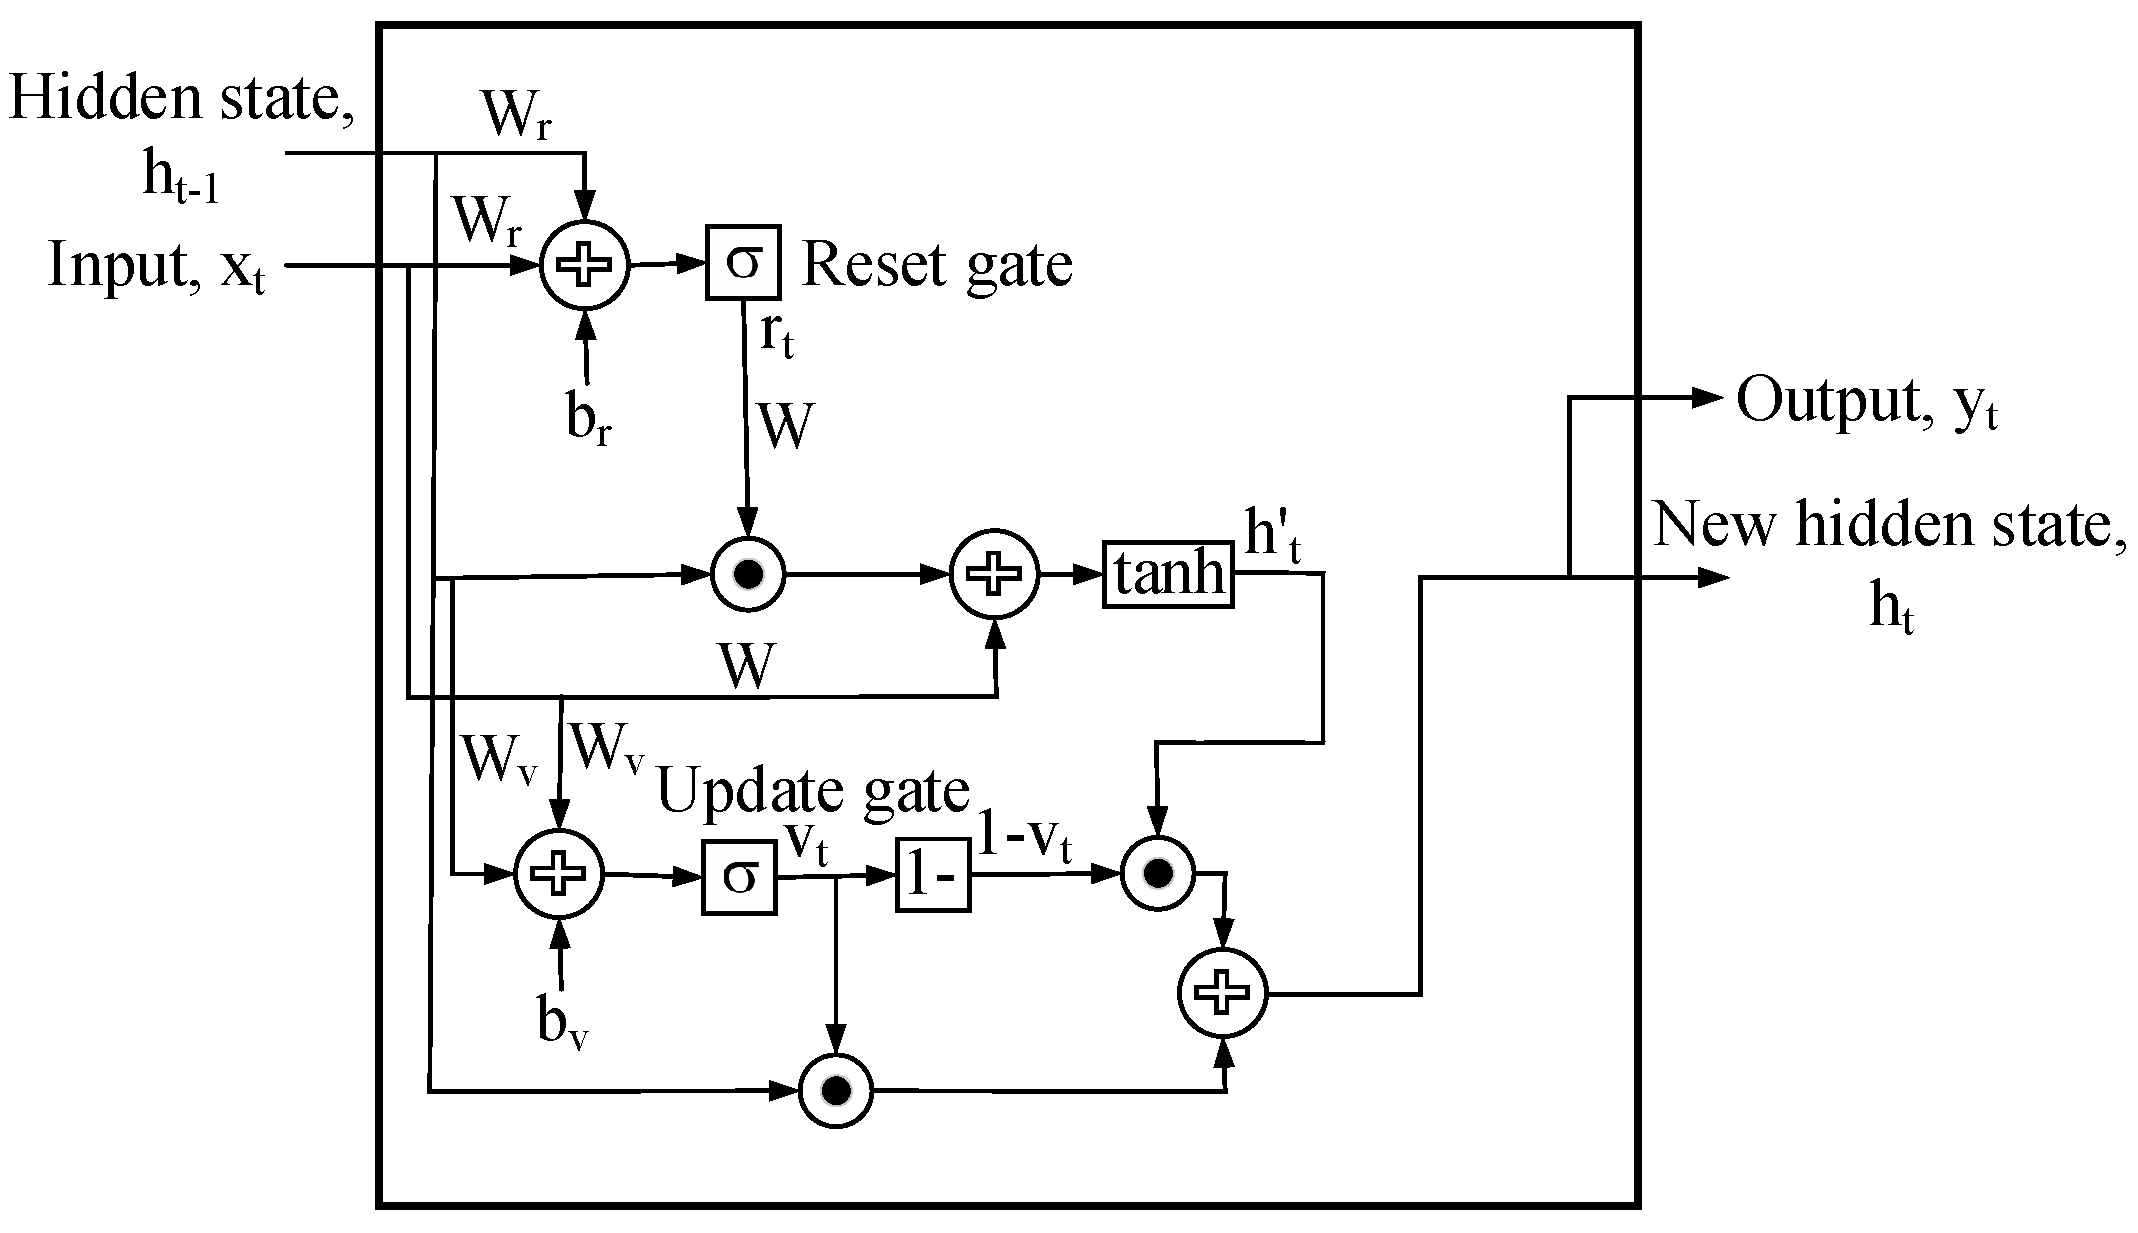
3.3.1. GRU
3.3.2. Support Vector Machine
3.3.3. Logistic Regression
3.3.4. Decision Tree
4. Simulation Results
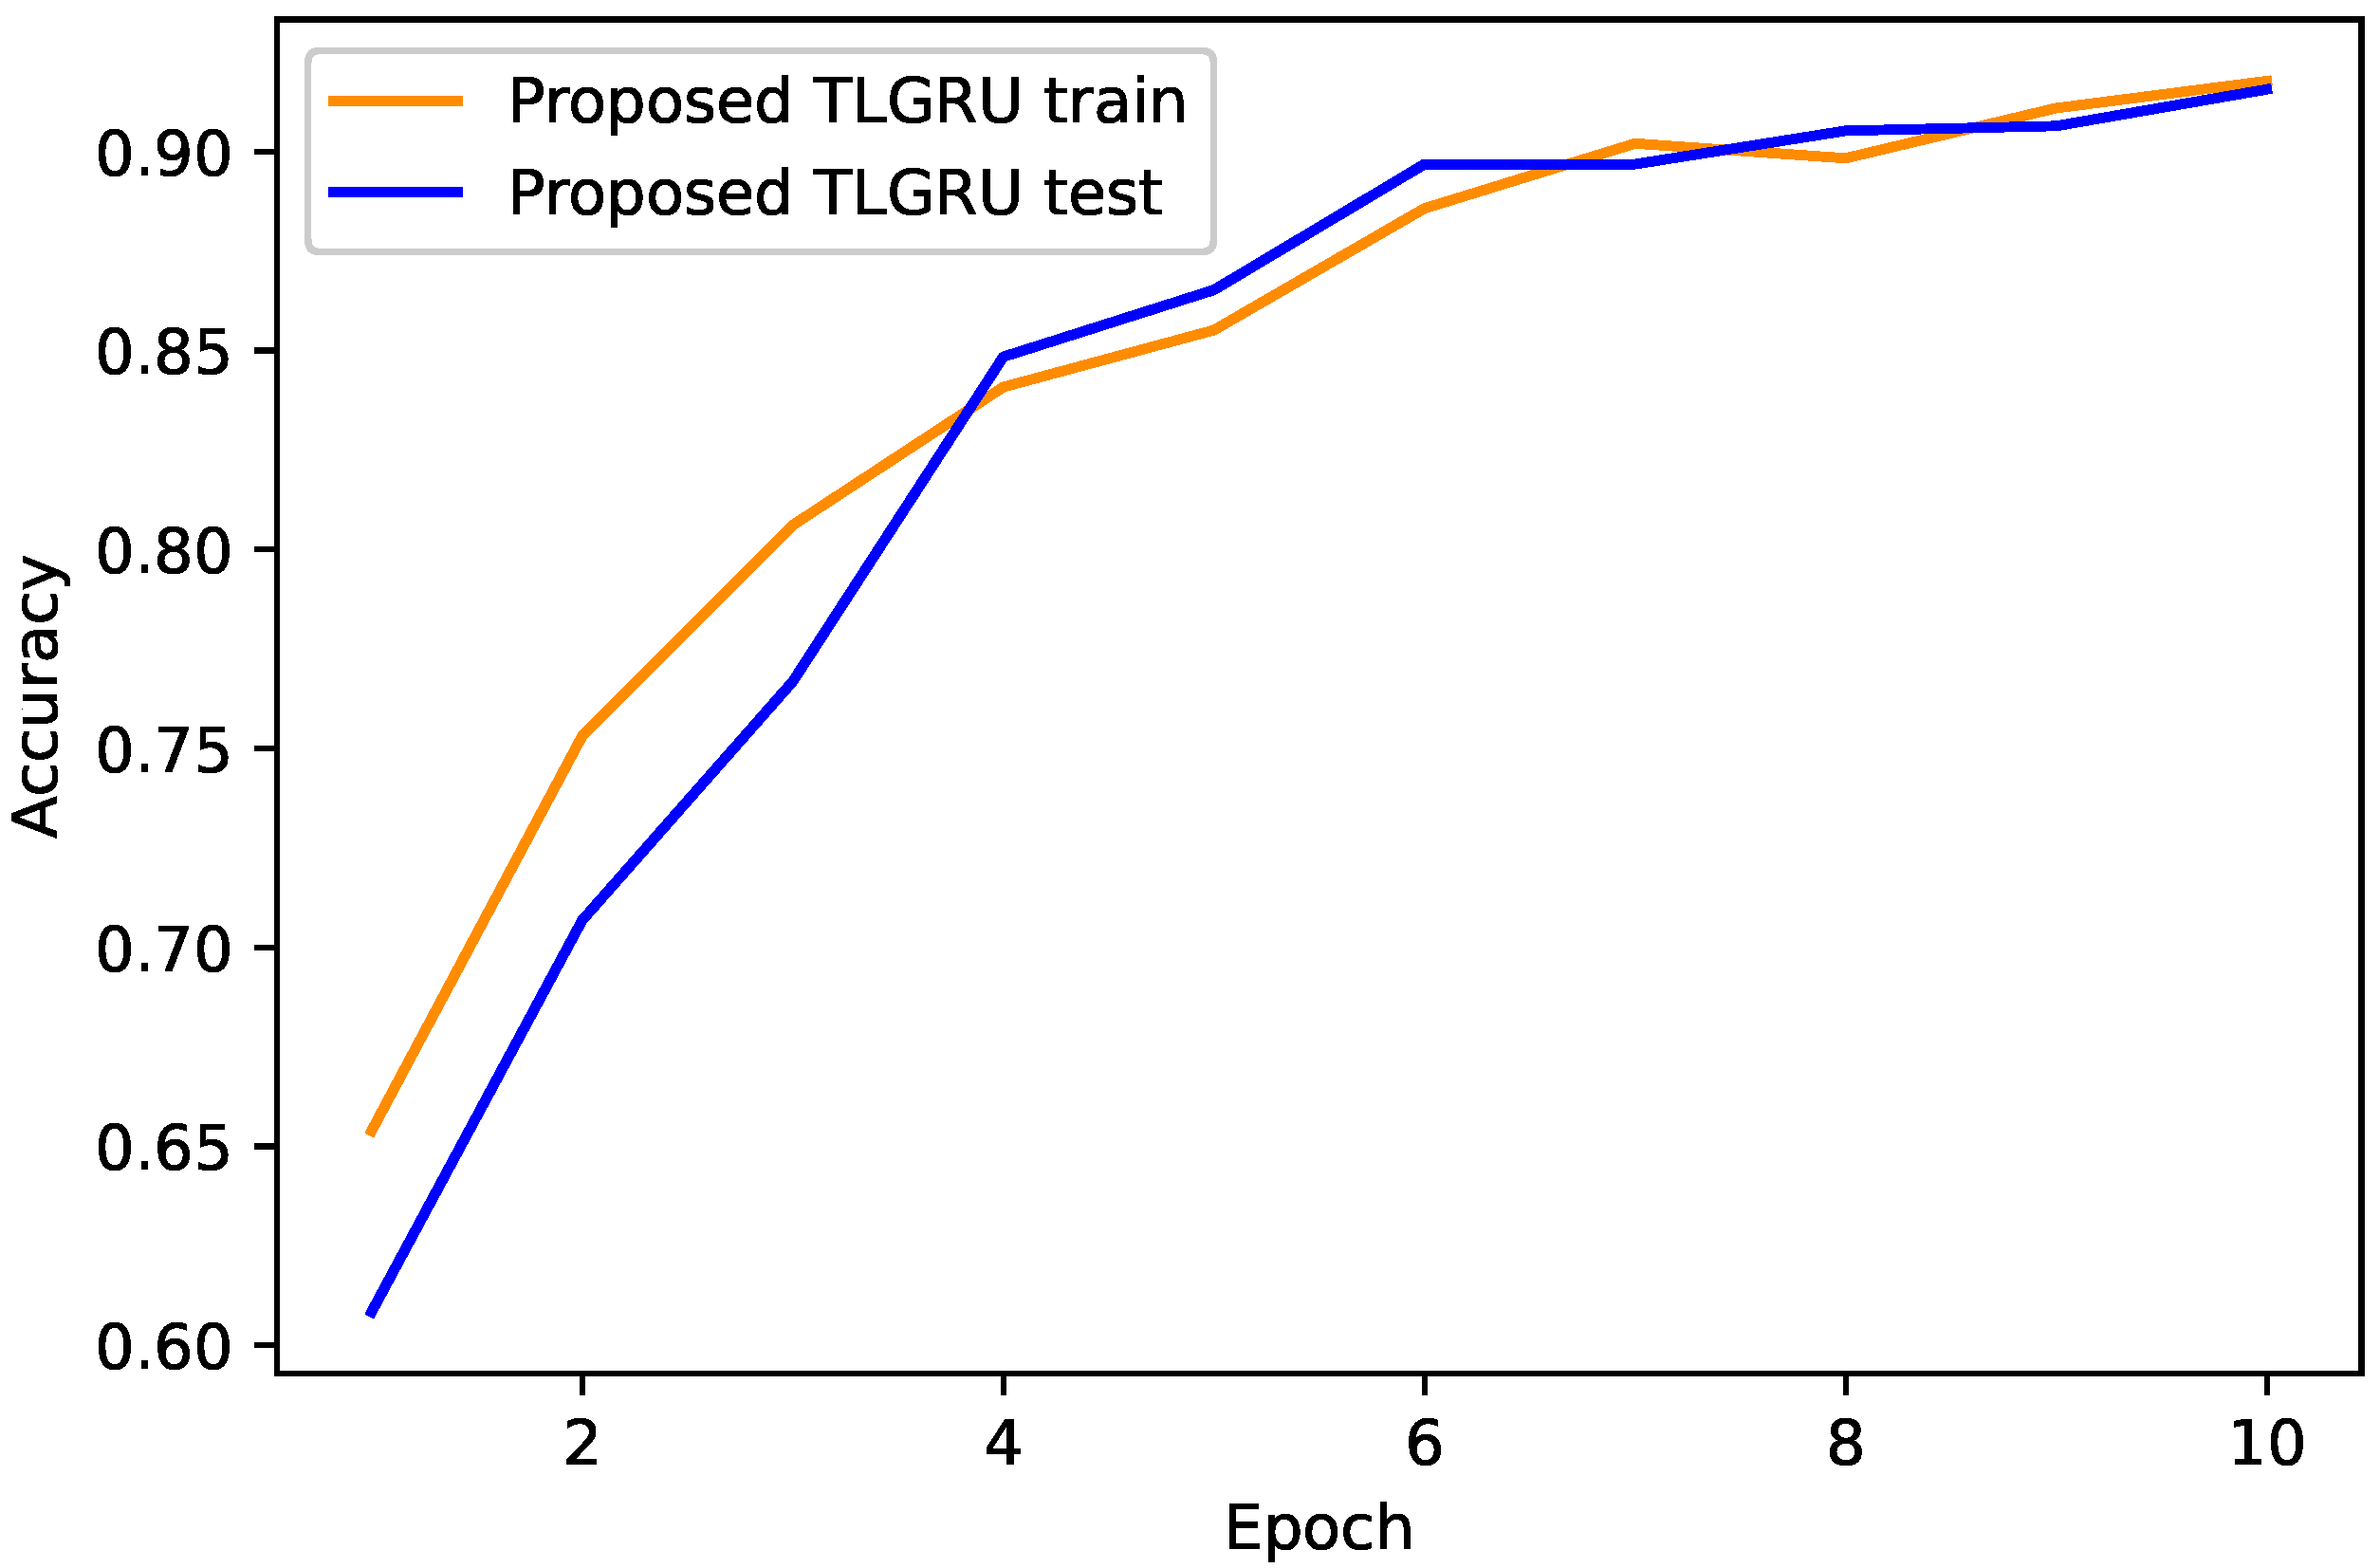
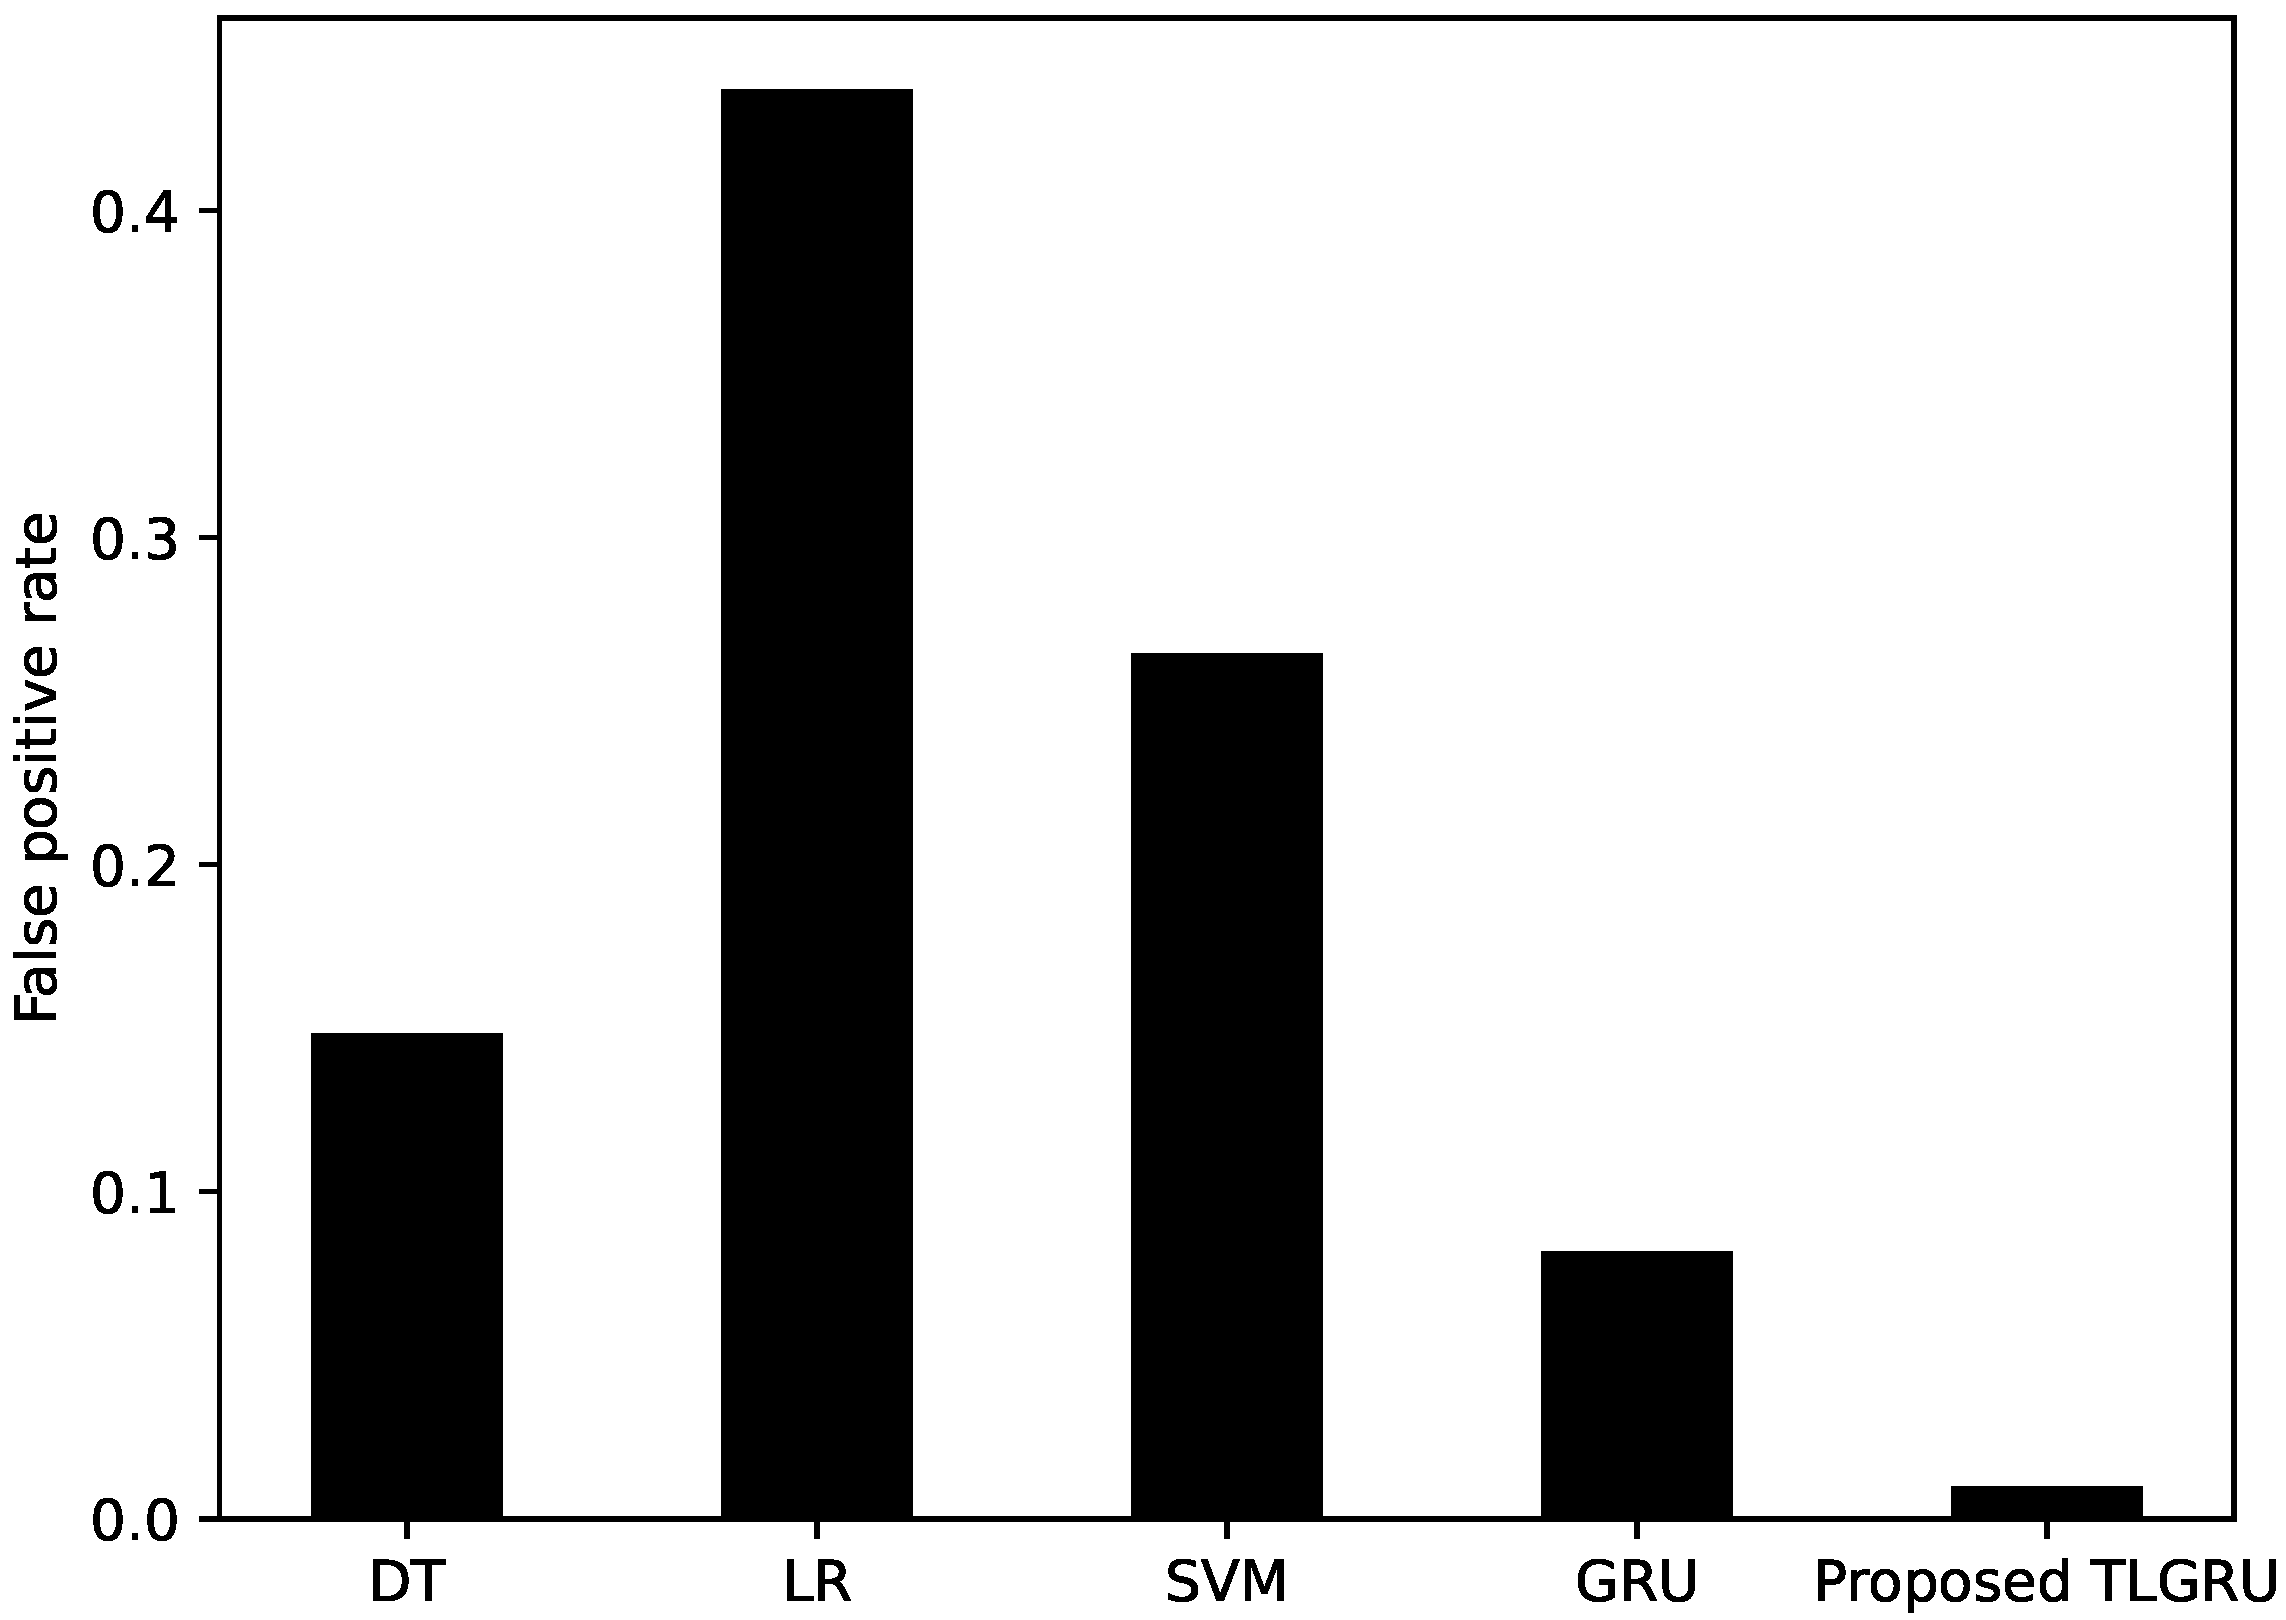
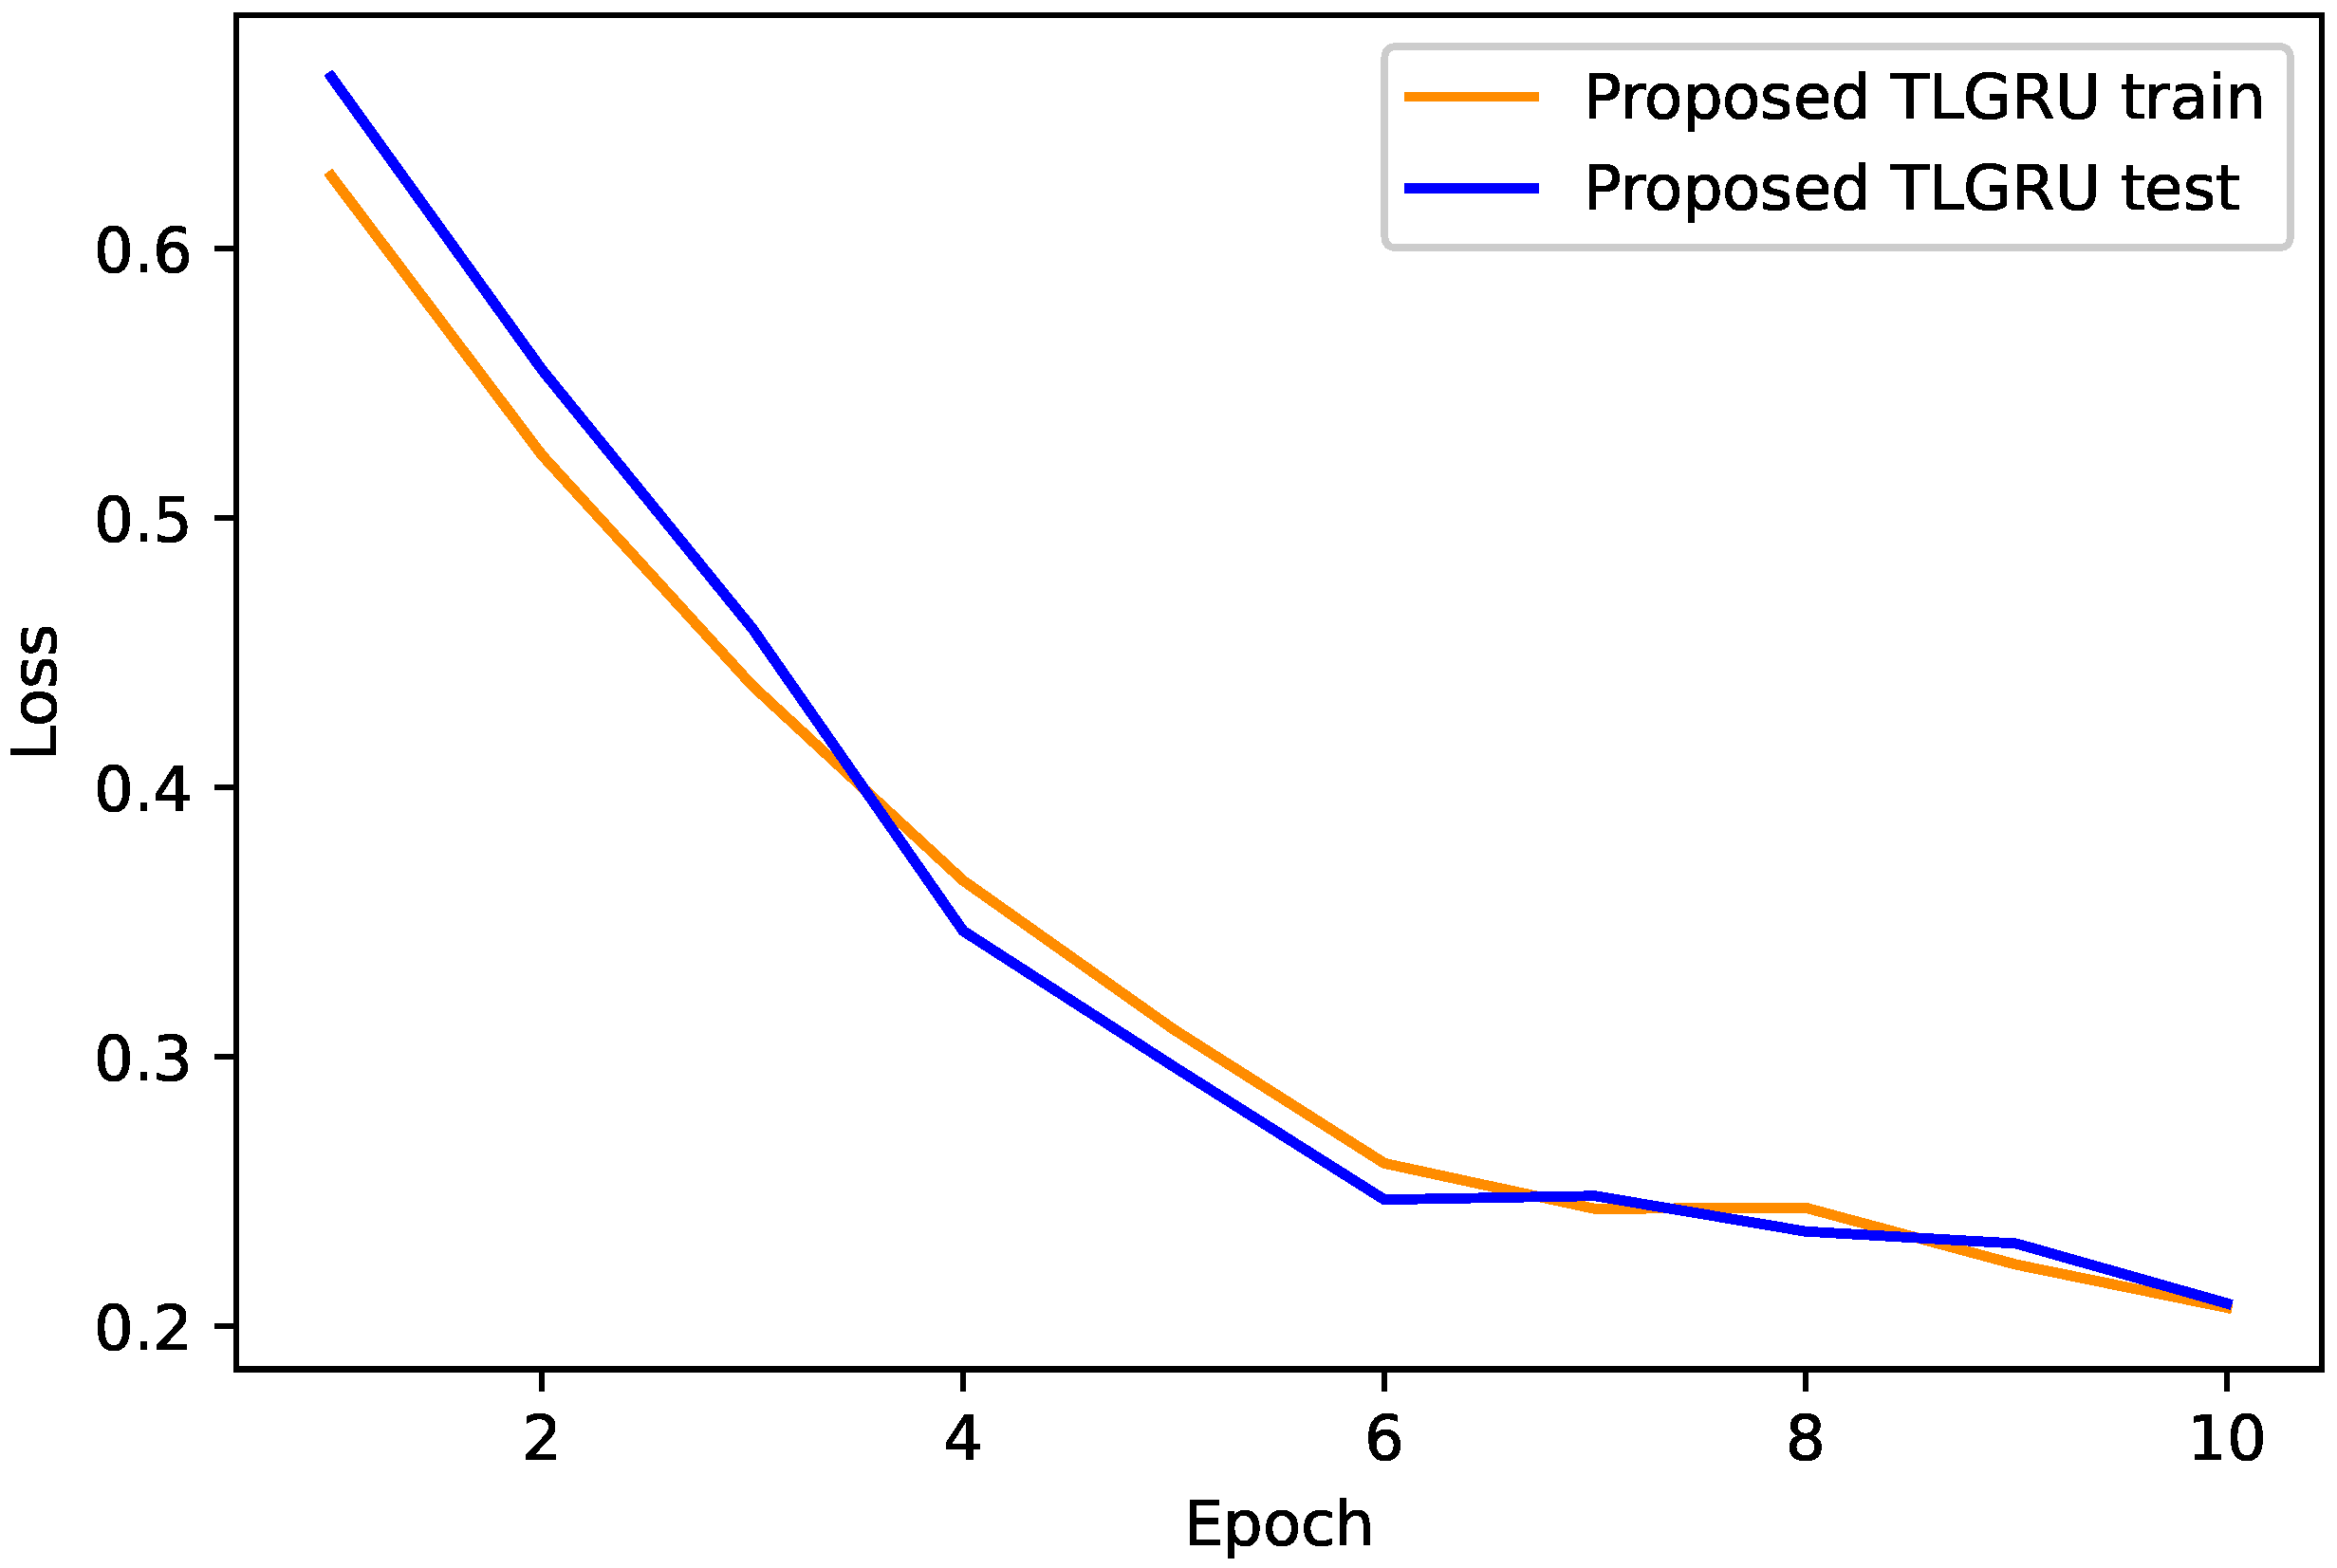
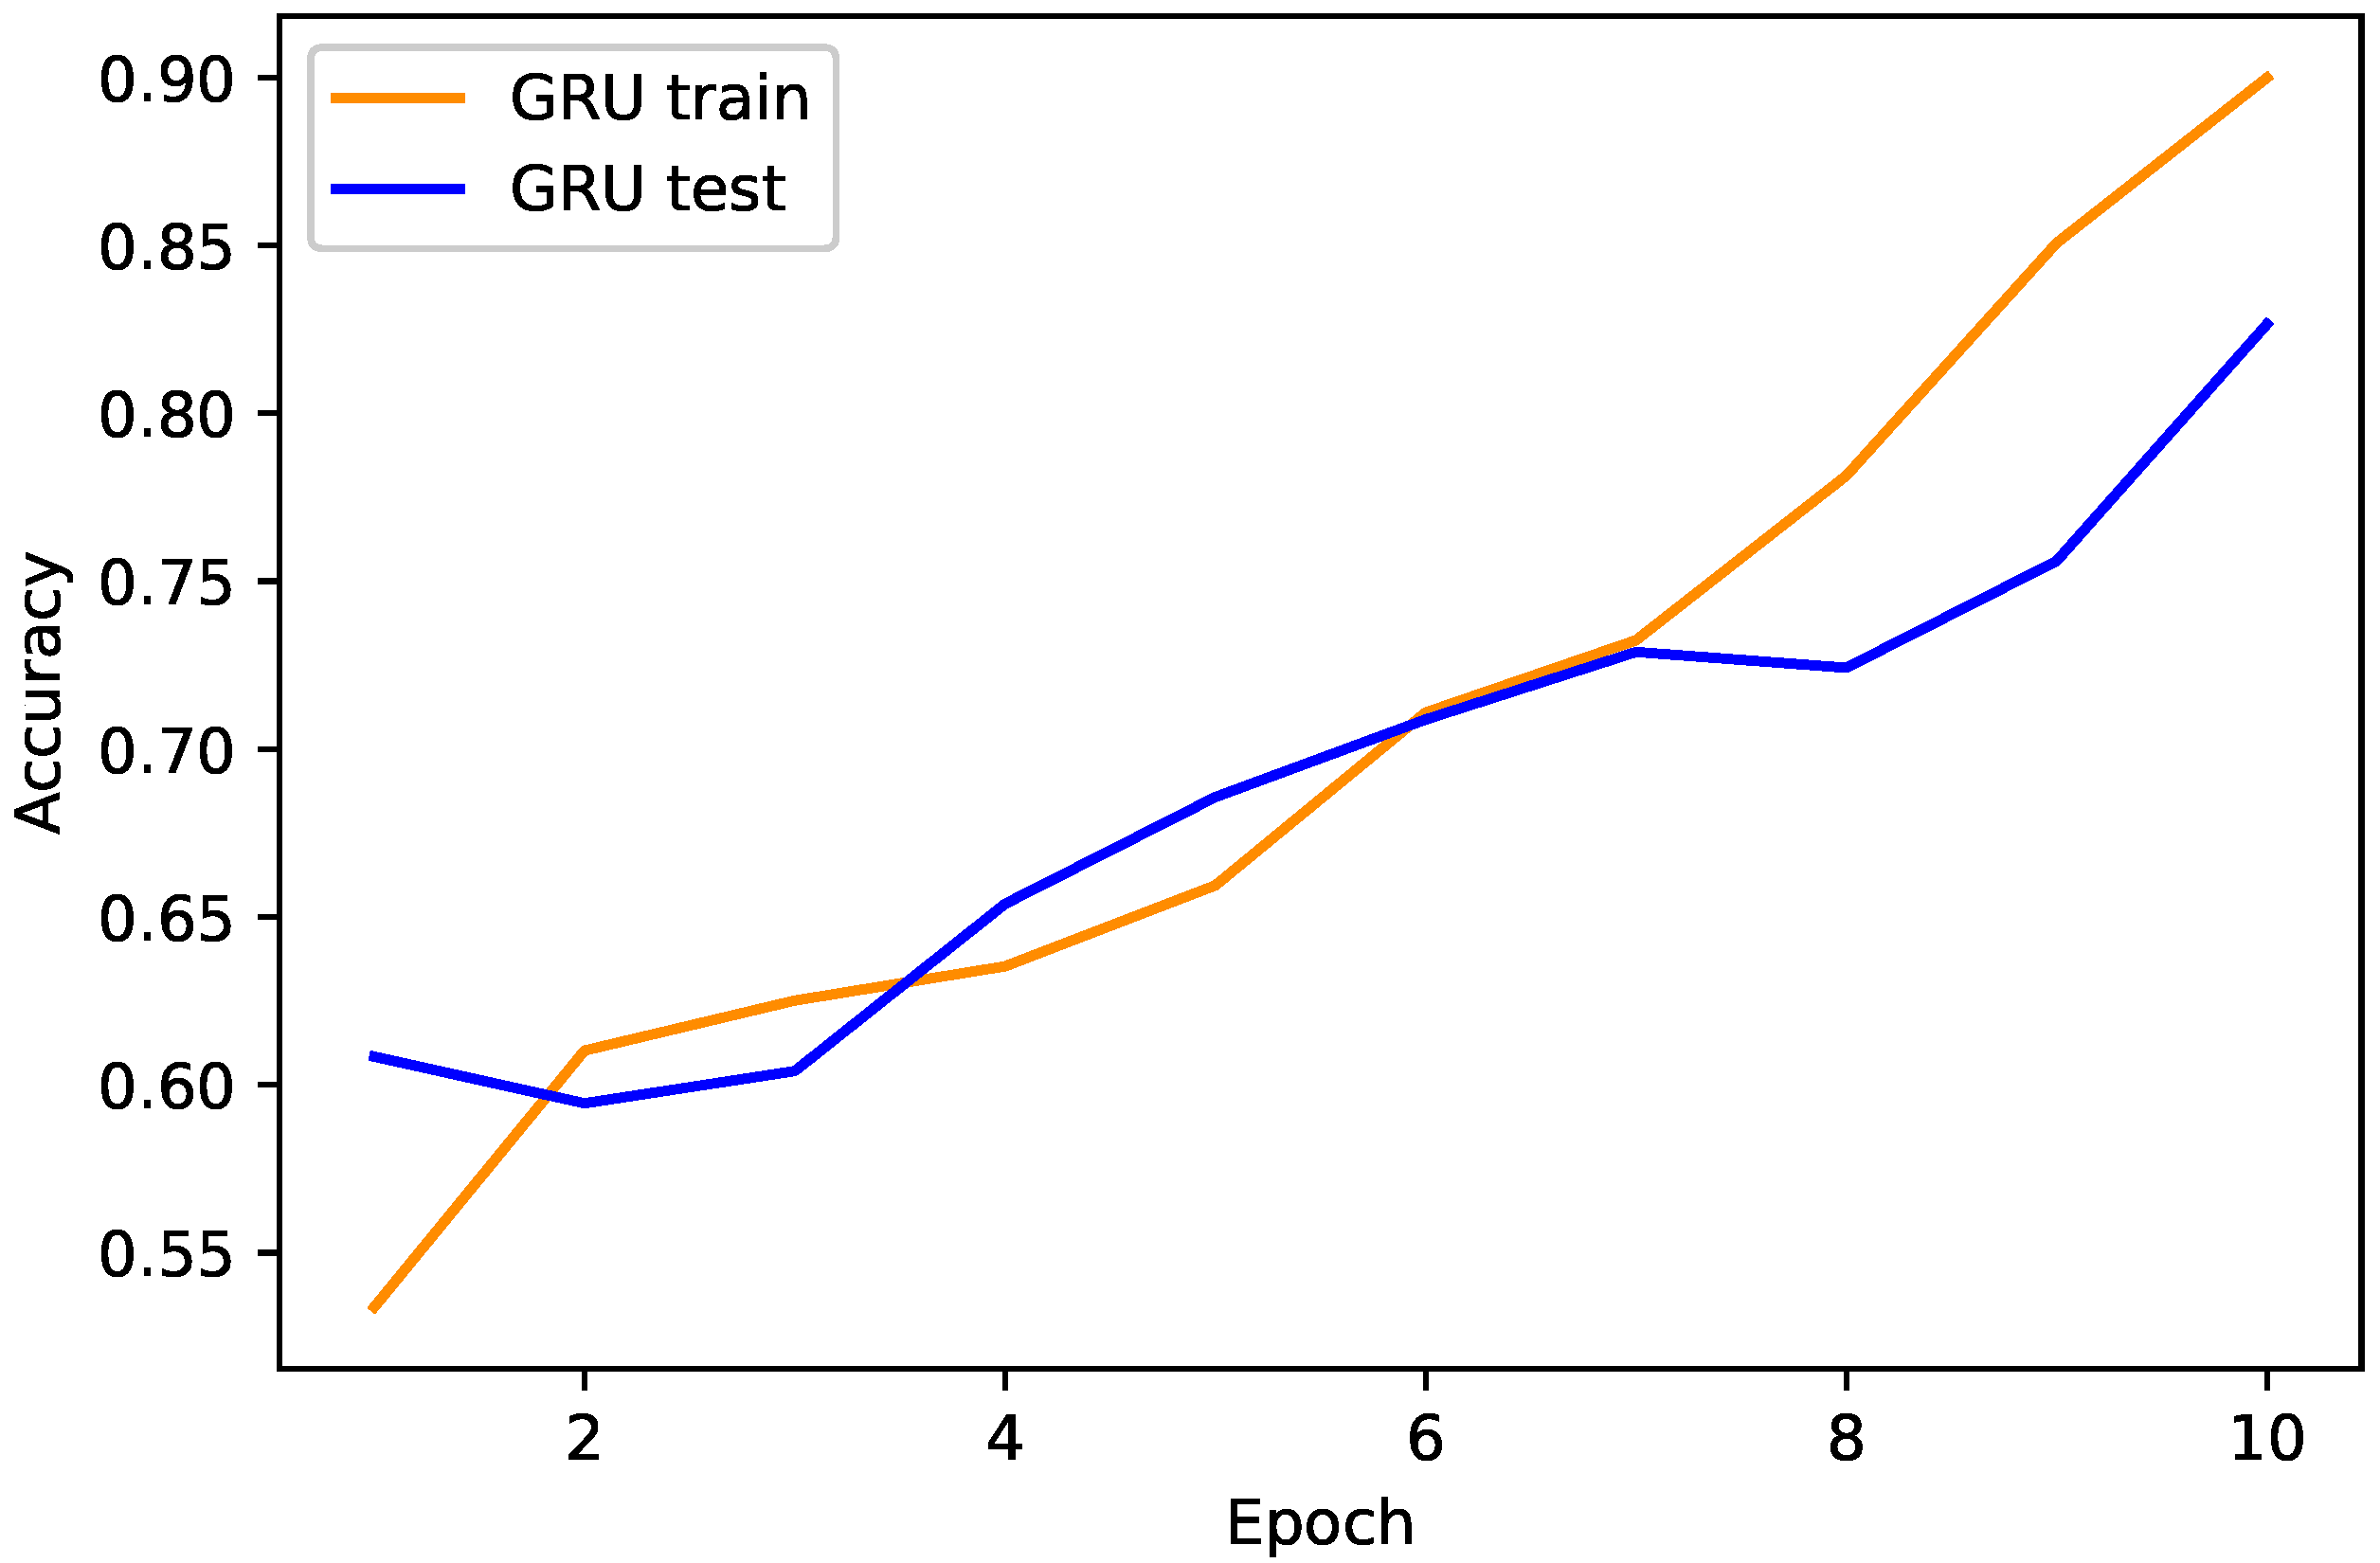
4.1. Proposed TLGRU and Other Benchmark Techniques’ Results
4.2. Strengths and Weaknesses of the Proposed Work
5. Conclusions and Future Work
Author Contributions
Funding
Institutional Review Board Statement
Informed Consent Statement
Data Availability Statement
Conflicts of Interest
References
- Garcia Deluno, F.; Marafão, F.P.; de Souza, W.A.; da Silva, L.C.P. Power metering: History and future trends. In Proceedings of the 2017 Ninth Annual IEEE Green Technologies Conference (GreenTech), Denver, CO, USA, 29–31 March 2017; pp. 26–33. [Google Scholar]
- Weranga, K.S.K.; Kumarawadu, K.; Chandima, D.P. Smart Metering Design and Applications; Springer: Singapore, 2014. [Google Scholar]
- Foudeh Husam, A.; Mokhtar, A.S. Automated meter reading and advanced metering infrastructure projects. In Proceedings of the 2015 9th Jordanian International Electrical and Electronics Engineering Conference, Amman, Jordan, 12–14 November 2015; pp. 1–6. [Google Scholar]
- Huang, Y.; Qifeng, X. Electricity theft detection based on stacked sparse denoising autoencoder. Int. J. Electr. Power Energy Syst. 2021, 125, 106448. [Google Scholar] [CrossRef]
- Zheng, Z.; Yatao, Y.; Xiangdong, N.; Dai, H.; Zhou, Y. Wide and deep convolutional neural networks for electricity-theft detection to secure smart grids. IEEE Transact. Ind. Inform. 2017, 14, 1606–1615. [Google Scholar] [CrossRef]
- Buzau, M.-M.; Tejedor-Aguilera, J.; Cruz-Romero, P.; Gómez-Expósito, A. Hybrid deep neural networks for detection of non-technical losses in electricity smart meters. IEEE Trans. Power Syst. 2019, 35, 1254–1263. [Google Scholar] [CrossRef]
- Khoo, B.; Ye, C. Using RFID for anti-theft in a Chinese electrical supply company: A cost-benefit analysis. In Proceedings of the 2011 Wireless Telecommunications Symposium (WTS), New York, NY, USA, 13–15 April 2011; pp. 1–6. [Google Scholar]
- McLaughlin, S.; Brett, H.; Fawaz, A.; Berthier, R.; Zonouz, S. A multi-sensor energy theft detection framework for advanced metering infrastructures. IEEE J. Select. Areas Commun. 2013, 31, 1319–1330. [Google Scholar] [CrossRef]
- Cárdenas, A.A.; Saurabh, A.; Schwartz, G.; Dong, R.; Sastry, S. A game theory model for electricity theft detection and privacy-aware control in AMI systems. In Proceedings of the 2012 50th Annual Allerton Conference on Communication, Control, and Computing (Allerton), Monticello, IL, USA, 1–5 October 2012; pp. 1830–1837. [Google Scholar]
- Amin, S.; Schwartz, G.A.; Tembine, H. Incentives and security in electricity distribution networks. In Proceedings of the International Conference on Decision and Game Theory for Security, Virtual Conference, 25–27 October 2012; pp. 264–280. [Google Scholar]
- Jokar, P.; Arianpoo, N.; Leung, V.C.M. Electricity theft detection in AMI using customers’ consumption patterns. IEEE Trans. Smart Grid 2015, 7, 216–226. [Google Scholar] [CrossRef]
- Gunturi Kumar, S.; Sarkar, D. Ensemble machine learning models for the detection of energy theft. Electr. Power Syst. Res. 2021, 192, 106904. [Google Scholar] [CrossRef]
- Kong, X.; Zhao, X.; Liu, C.; Li, Q.; Dong, D.; Ye, L. Electricity theft detection in low-voltage stations based on similarity measure and DT-KSVM. Int. J. Electr. Power Energy Syst. 2021, 125, 106544. [Google Scholar] [CrossRef]
- Buzau, M.M.; Tejedor-Aguilera, J.; Cruz-Romero, P.; Gómez-Expósito, A. Detection of non-technical losses using smart meter data and supervised learning. IEEE Trans. Smart Grid 2018, 10, 2661–2670. [Google Scholar] [CrossRef]
- Qu, Z.; Li, H.; Wang, Y.; Zhang, J.; Abu-Siada, A.; Yao, Y. Detection of electricity theft behavior based on improved synthetic minority oversampling technique and random forest classifier. Energies 2020, 13, 2039. [Google Scholar] [CrossRef]
- Lu, X.; Zhou, Y.; Wang, Z.; Yi, Y.; Feng, L.; Wang, F. Knowledge embedded semi-supervised deep learning for detecting non-technical losses in the smart grid. Energies 2019, 12, 3452. [Google Scholar] [CrossRef] [Green Version]
- Ashraf Ullah, P.; Shoaib, M.; Muhammad, A.; Kabir, B.; Javaid, N. Synthetic Theft Attacks Implementation for Data Balancing and a Gated Recurrent Unit Based Electricity Theft Detection in Smart Grids. In Proceedings of the Conference on Complex Intelligent, and Software Intensive Systems, Asan, Korea, 1–3 July 2021; Springer: Cham, Switzerland, 2021; pp. 395–405. [Google Scholar]
- Hochreiter, S.; Schmidhuber, J. Long short-term memory. Neural Comput. 1997, 9, 1735–1780. [Google Scholar] [CrossRef] [PubMed]
- Cho, K.B.; Merrienboer, V.; Bahdanau, D.; Bengio, Y. On the properties of neural machine translation: Encoder-decoder approaches. arXiv 2014, arXiv:1409.1259. [Google Scholar]
- Goodfellow, I.; Pouget-Abadie, J.; Mirza, M.; Xu, B.; Warde-Farley, D.; Ozair, S.; Courville, A.; Bengio, Y. Generative adversarial nets. Adv. Neural Inform. Process. Syst. 2014, 27. [Google Scholar]
- Fabian, A.N.; Figueroa, G.; Chu, C. NTL detection in electric distribution systems using the maximal overlap discrete wavelet-packet transform and random undersampling boosting. IEEE Trans. Power Syst. 2018, 33, 7171–7180. [Google Scholar]
- Hasan, M.; Toma, R.N.; Abdullah-Al, N.; Islam, M.M.; Kim, J. Electricity theft detection in smart grid systems: A CNN-LSTM based approach. Energies 2019, 12, 3310. [Google Scholar] [CrossRef] [Green Version]
- Saeed Salman, M.; Mustafa, M.W.; Sheikh, U.U.; Jumani, T.A.; Mirjat, N.H. Ensemble bagged tree based classification for reducing non-technical losses in multan electric power company of Pakistan. Electronics 2019, 8, 860. [Google Scholar] [CrossRef] [Green Version]
- Wang, X.; Yang, I.; Ahn, S. Sample efficient home power anomaly detection in real time using semi-supervised learning. IEEE Access 2019, 7, 139712–139725. [Google Scholar] [CrossRef]
- Liu, H.; Li, Z.; Li, Y. Noise reduction power stealing detection model based on self-balanced data set. Energies 2020, 13, 1763. [Google Scholar] [CrossRef] [Green Version]
- Ibrahem, M.I.; Nabil, M.; Fouda, M.M.; Mahmoud, M.M.E.A.; Alasmary, W.; Alsolami, F. Efficient Privacy-Preserving Electricity Theft Detection with Dynamic Billing and Load Monitoring for AMI Networks. IEEE Internet Things J. 2020, 8, 1243–1258. [Google Scholar] [CrossRef]
- Nabil, M.; Ismail, M.; Mahmoud, M.M.E.A.; Alasmary, W.; Serpedin, E. PPETD: Privacy-preserving electricity theft detection scheme with load monitoring and billing for AMI networks. IEEE Access 2019, 7, 96334–96348. [Google Scholar] [CrossRef]
- Micheli, G.; Soda, E.; Vespucci, M.T.; Gobbi, M.; Bertani, A. Big data analytics: An aid to detection of non-technical losses in power utilities. Comput. Manag. Sci. 2019, 16, 329–343. [Google Scholar] [CrossRef]
- Punmiya, R.; Choe, S. Energy theft detection using gradient boosting theft detector with feature engineering-based preprocessing. IEEE Trans. Smart Grid 2019, 10, 2326–2329. [Google Scholar] [CrossRef]
- Razavi, R.; Gharipour, A.; Fleury, M.; Akpan, I.J. A practical feature-engineering framework for electricity theft detection in smart grids. Appl. Energy 2019, 238, 481–494. [Google Scholar] [CrossRef]
- Ramos, C.; Rodrigues, D.; de Souza, A.N.; Papa, J.P. On the study of commercial losses in Brazil: A binary black hole algorithm for theft characterization. IEEE Trans. Smart Grid 2016, 9, 676–683. [Google Scholar] [CrossRef] [Green Version]
- Ghasemi, A.A.; Gitizadeh, M. Detection of illegal consumers using pattern classification approach combined with Levenberg-Marquardt method in smart grid. Int. J. Electr. Power Energy Syst. 2018, 99, 363–375. [Google Scholar] [CrossRef]
- LeCun, Y.; Bengio, Y. Convolutional networks for images, speech, and time series. In The Handbook of Brain Theory and Neural Networks; MIT Press: Cambridge, MA, USA, 1995; Volume 3361. [Google Scholar]
- Li, S.; Han, Y.; Yao, X.; Yingchen, S.; Wang, J.; Zhao, Q. Electricity theft detection in power grids with deep learning and random forests. J. Electr. Comput. Eng. 2019, 2019, 4136874. [Google Scholar] [CrossRef]
- Adil, M.; Javaid, N.; Qasim, U.; Ullah, I.; Shafiq, M.; Choi, J. LSTM and bat-based RUSBoost approach for electricity theft detection. Appl. Sci. 2020, 10, 4378. [Google Scholar] [CrossRef]
- Rumelhart, D.E.; Hinton, G.E.; Williams, R.J. Learning representations by back-propagating errors. Nature 1986, 323, 533–536. [Google Scholar] [CrossRef]
- Javaid, N. A PLSTM, AlexNet and ESNN Based Ensemble Learning Model for Detecting Electricity Theft in Smart Grids. IEEE Access 2021, 9, 162935–162950. [Google Scholar] [CrossRef]
- Chung, J.; Gulcehre, C.; Cho, K.; Bengio, Y. Empirical evaluation of gated recurrent neural networks on sequence modeling. arXiv 2014, arXiv:1412.3555. [Google Scholar]
- Zhang, Y.G.; Tang, J.; He, Z.; Tan, J.; Li, C. A novel displacement prediction method using gated recurrent unit model with time series analysis in the Erdaohe landslide. Nat. Hazards 2021, 105, 783–813. [Google Scholar] [CrossRef]
- Aniruddha, D.; Kumar, S.; Basu, M. A gated recurrent unit approach to bitcoin price prediction. J. Risk Financ. Manag. 2020, 13, 23. [Google Scholar]
- Niu, Z.; Yu, Z.; Tang, W.; Wu, Q.; Reformat, M. Wind power forecasting using attention-based gated recurrent unit network. Energy 2020, 196, 117081. [Google Scholar] [CrossRef]
- Luo, H.; Wang, M.; Wong, P.K.; Tang, J.; Cheng, J.C.P. Construction machine pose prediction considering historical motions and activity attributes using gated recurrent unit (GRU). Automat. Construct. 2021, 121, 103444. [Google Scholar] [CrossRef]
- Cortes, C.; Vapnik, V. Support-vector networks. Mach. Learn. 1995, 20, 273–297. [Google Scholar] [CrossRef]
- Available online: www.tutorialspoint.com (accessed on 5 June 2021).
- Gul, H.; Javaid, N.; Ullah, I.; Qamar, A.M.; Afzal, M.K.; Joshi, G.P. Detection of non-technical losses using SOSTLink and bidirectional gated recurrent unit to secure smart meters. Appl. Sci. 2020, 10, 3151. [Google Scholar] [CrossRef]
- Aslam, Z.; Javaid, N.; Ahmad, A.; Ahmed, A.; Gulfam, S.M. A Combined Deep Learning and Ensemble Learning Methodology to Avoid Electricity Theft in Smart Grids. Energies 2020, 13, 5599. [Google Scholar] [CrossRef]
- Jindal, A.; Dua, A.; Kaur, K.; Singh, M.; Kumar, N.; Mishra, S. Decision tree and SVM-based data analytics for theft detection in smart grid. IEEE Trans. Ind. Inform. 2016, 12, 5–1016. [Google Scholar] [CrossRef]
- Available online: www.machinelearningmastery.com (accessed on 17 April 2021).
- Javaid, N.; Jan, N.; Javed, M.U. An adaptive synthesis to handle imbalanced big data with deep siamese network for electricity theft detection in smart grids. J. Parallel Distrib. Comput. 2021, 153, 44–52. [Google Scholar] [CrossRef]


| Methodology | Objectives | Dataset | Performance Metrics | Limitations |
|---|---|---|---|---|
| SSDAE [4] | To tackle NTLs | SGCC hourly data | FPR, TPR and AUC | Inadequate evaluation metrics |
| WDCNN [5] | To secure SGs by detecting electricity theft | SGCC daily data | AUC and MAP | Data imbalance issue |
| LSTM-MLP [6] | To overcome NTLs | Endesa | AUC, precision, recall and precision-recall-AUC | Data imbalance issue |
| CPBETD [11] | To improve ETD performance | SEAI | TPR, FPR and BDR | No feature extraction is performed |
| RF, AdaBoost, XGBoost, LGB, ensemble tree and CatBoost [12] | To detect energy theft in power grids | CER | Precision, AUC and accuracy | Ensemble techniques are computationally complex |
| DT-KSVM [13] | To decrease power losses | SEAI | AUC and accuracy | Inadequate performance metrics |
| XGBoost [14] | To enhance ETD performance | Endesa | AUC, precision-recall and execution time | High computational time |
| RF [15] | To detect NTL behavior | Hebei province | AUC and accuracy | No feature extraction is done |
| SSAE [16] | To reduce NTLs by employing semi-supervised data | SGCC daily data | Accuracy, TPR, FPR, precision, recall and F1-score | Inappropriate hyperparameter tuning |
| MODWPT, RUSBoost [21] | To reduce NTLs | Honduras | F1-score, MCC, precision, recall, AUC and accuracy | Important information is lost due to RUS |
| CNN-LSTM [22] | To detect abnormal EC profiles of consumers | SGCC daily data | F1-score., MCC, precision, recall and accuracy | Classes overlap due to SMOTE |
| EBT [23] | To minimize NTLs | MEPCO | Accuracy, sensitivity, specificity, F1-score and FPR | Curse of dimensionality problem is not tackled |
| ETDFE [26] | To detect ET by preserving consumers’ privacy | CER | Highest difference (HD), FPR, DR and Accuracy | High computational complexity due to improper hyperparameter optimization |
| PPETD [27] | To perform ETD while maintaining consumers’ privacy | CER | HD, DR and FPR | Improper hyperparameter tuning |
| MLRM [28] | To overcome NTLs | Neighborhood area network dataset | Accuracy, sensitivity and specificity | Curse of dimensionality problem is not handled |
| Dataset Description | Values |
|---|---|
| Dataset acquisition intervals | 2014–2016 |
| Total abnormal users count before the data balancing | 3615 |
| Total benign users count before the data balancing | 38,752 |
| Total abnormal users count after the data balancing | 21,183 |
| Total benign users count after the data balancing | 21,184 |
| Total users count before the initial preprocessing of raw data | 42,372 |
| Total users count after the initial preprocessing of raw data | 42,367 |
| Hyperparameters | Values |
|---|---|
| Units | 200 and 100 |
| Alpha | 0.001 |
| Dropout | 0.2 |
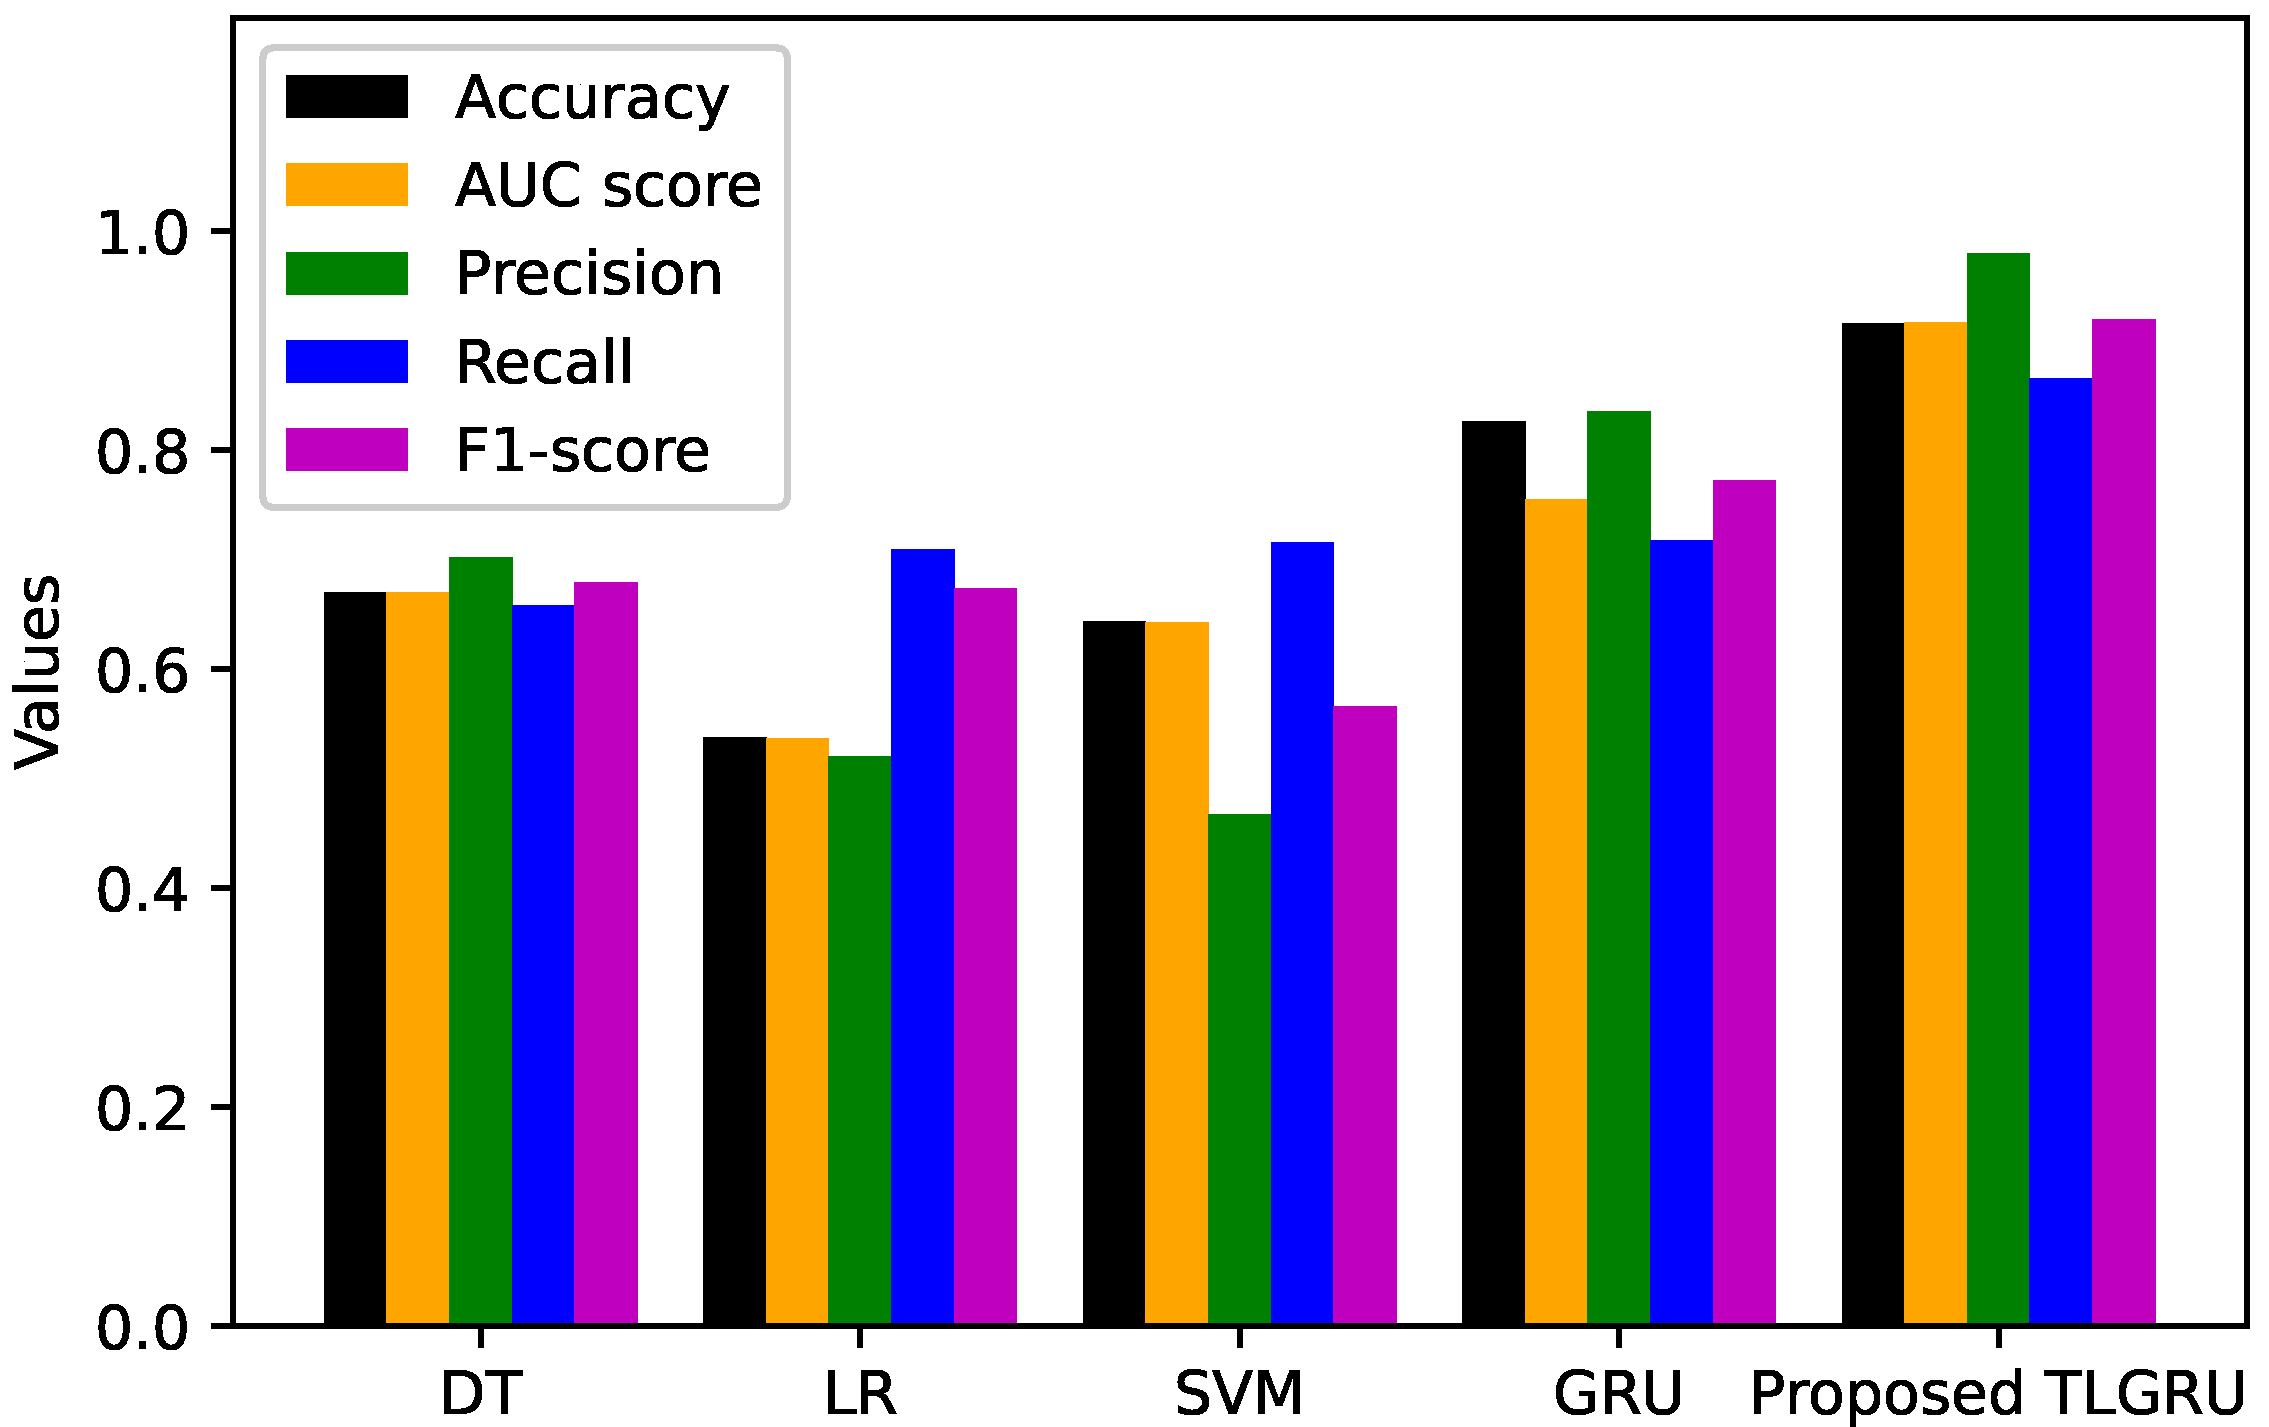
| Classifier | Accuracy | AUC Score | Precision | Recall | F1-Score | FPR |
|---|---|---|---|---|---|---|
| DT | 0.6701 | 0.6702 | 0.7019 | 0.6585 | 0.6795 | 0.1485 |
| LR | 0.5379 | 0.5365 | 0.5207 | 0.7097 | 0.6736 | 0.4370 |
| SVM | 0.6433 | 0.6423 | 0.4678 | 0.7162 | 0.5660 | 0.2646 |
| GRU | 0.8265 | 0.7552 | 0.8355 | 0.7176 | 0.7721 | 0.0818 |
| Proposed TLGRU | 0.9156 | 0.9168 | 0.9796 | 0.8659 | 0.9192 | 0.0100 |
Publisher’s Note: MDPI stays neutral with regard to jurisdictional claims in published maps and institutional affiliations. |
© 2022 by the authors. Licensee MDPI, Basel, Switzerland. This article is an open access article distributed under the terms and conditions of the Creative Commons Attribution (CC BY) license (https://creativecommons.org/licenses/by/4.0/).
Share and Cite
Pamir; Javaid, N.; Javaid, S.; Asif, M.; Javed, M.U.; Yahaya, A.S.; Aslam, S. Synthetic Theft Attacks and Long Short Term Memory-Based Preprocessing for Electricity Theft Detection Using Gated Recurrent Unit. Energies 2022, 15, 2778. https://doi.org/10.3390/en15082778
Pamir, Javaid N, Javaid S, Asif M, Javed MU, Yahaya AS, Aslam S. Synthetic Theft Attacks and Long Short Term Memory-Based Preprocessing for Electricity Theft Detection Using Gated Recurrent Unit. Energies. 2022; 15(8):2778. https://doi.org/10.3390/en15082778
Chicago/Turabian StylePamir, Nadeem Javaid, Saher Javaid, Muhammad Asif, Muhammad Umar Javed, Adamu Sani Yahaya, and Sheraz Aslam. 2022. "Synthetic Theft Attacks and Long Short Term Memory-Based Preprocessing for Electricity Theft Detection Using Gated Recurrent Unit" Energies 15, no. 8: 2778. https://doi.org/10.3390/en15082778
APA StylePamir, Javaid, N., Javaid, S., Asif, M., Javed, M. U., Yahaya, A. S., & Aslam, S. (2022). Synthetic Theft Attacks and Long Short Term Memory-Based Preprocessing for Electricity Theft Detection Using Gated Recurrent Unit. Energies, 15(8), 2778. https://doi.org/10.3390/en15082778