Abstract
To ensure well integrity, wellbore must be strongly cased using durable cement slurries with essential additives during downhole completion. The rubber materials that come from industrial waste are becoming extremely encouraged in the use as an additive in preparing cement slurries due to their growing environmental footprint. However, the proper design of cement slurry strongly depends on its rheological, mechanical, petrophysical, and creep properties, which can be altered by changing additives. This study aimed to examine the cement properties under alteration in different chemical admixtures to create efficient binding properties, and to estimate the optimum cement–rubber slurry composition for eco-sustainable completion. Three cement samples with different mesh sizes of the crumb rubber particles were prepared. This study examined the variation in rheological behaviors, elastic and failure characteristics, permeability, and creep behavior of the cement–rubber composites for petroleum well construction. The experimental study showed that the addition of 15% or more crumb rubber to the cement resulted in very thick slurries. Moreover, it was shown that the addition of crumb rubber with various particle sizes to the cement reduced the strength by more than 50%, especially for a higher amount of rubber added. It was also revealed that the addition of a superplasticizer resulted in an 11% increase in compressive strength. The results showed that cement–crumb-rubber composites with 12% by weight of cement (BWOC) represented the optimum composite, and considerably improved the properties of the cement slurry. Water-permeability tests indicated the addition of 12% BWOC with 200-mesh crumb rubber decreased the permeability by nearly 64% compared to the base cement. Creep tests at five different stress levels illustrated that the neat cement was brittle and did not experience strain recovery at all stress levels. Cement slurries with the largest rubber-particle size were elastic and demonstrated the highest amount of strain recovery. Finally, a relationship was established between the permeability, average strain, and mesh size of the rubber particles, which offered the strain recovery, satisfied the zonal isolation, and consequently reduced the microannulus problem to ensure the cement’s integrity.
1. Introduction
Downhole casing cementing is one of the most essential parts of the drilling and completion process [1]. Cement slurries are essentially injected into the annulus between the wellbore and casing after successfully drilling a well [2]. The primary functions of cement are isolating the cross-flow-occurring zones in the formations, strongly supporting the casing weight, and upholding any applied load [3]. Other functions are actively preventing the casing from corrosion and protecting it, lost circulation, and unwanted downhole fluids from being produced [4], as well as controlling abnormal pore pressure. A petroleum well possibly will never achieve its highest potential of production without appropriate isolations of its trouble zones [5]. A schematic of petroleum well-cementing operations is provided [6] in Figure 1.
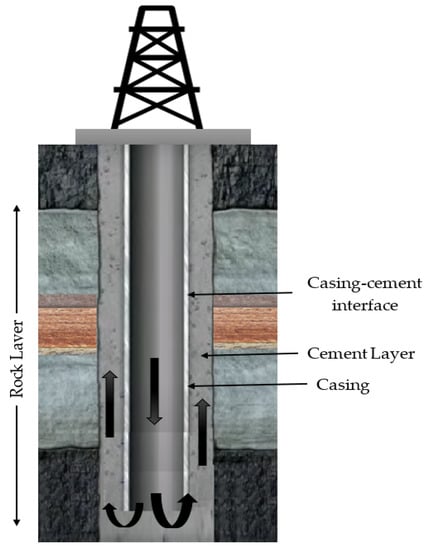
Figure 1.
Representation of oil and gas well-cementing operations.
Portland cement has been used in downhole cementing applications for a long time, but this type of use has encountered numerous difficulties, and as a result, wellbore cement integrity is compromised with time [7]; The dominant problems due to cement failure include the development of a microannulus, radial cracking, chemical attacks, and loss of durability, thereby resulting in leakage and environmental damages [8]. Cement-sheath failure begins in the wellbore, mostly right after the cement sets. The process of casing cementing involves the pumping of cement slurry up to the desired depth. To ensure the wellbore integrity, high-quality cementing is crucial, which has triggered researchers to seek to design fit-for-purpose cement slurries [9].
Several different additives and materials are usually used to optimize the cement slurry design to enhance the different desirable properties in cement mixtures [10,11]. It is desirable that the selected cement composition for a particular downhole cementing should maintain the appropriate rheological, mechanical, petrophysical, and creep properties.
To optimize cement design and improve cement properties, researchers have been conducting experimental works using various materials; for example, weighting constituents, accelerators, retarders, plasticizers, dispersants, fluid-loss agents, and defoamers, [11,12,13,14,15,16], as well as mixing cement paste with various materials such as polypropylene fibers, laponite, nano clay, nanofibers, metakaolin, iron ore, biomass waste, granite sludge, tire waste, silicon carbide powder, olive waste, rice husk ash, and silica flour [17,18,19,20,21,22,23,24,25,26,27,28,29].
Cement pumping subjects the cement to phase changes, thereby affecting its rheological properties, while flowing leads to either shear thinning or thickening. The hydration superplasticizers are prolonged by adding other superplasticizers to the slurry, which also impacts the cement-hydration process, the formation structure, and the cement’s characteristics [30]. Thickening time is one of the critical properties of cement slurries and is of the highest importance [31,32] among all properties, as it is largely affected by pressure and temperature. Based on real measurements, API recommended the use of thermal gradients of 0.9–1.9 °F per 100 ft by using the bottom-hole cementing temperature relationship [33]. Once the cement is pumped to the desired depth, it is usually left for more than 24 h to set and harden, thereby requiring an understanding of its postsetting mechanical behavior and its ability to resist cracks for well-integrity assurance [34]. The general field practices require that the cement should build to a minimum strength of 3.5 MPa within 24 h and 13.8 MPa during applications [35]; bulk cement shrinkage is the critical factor by which the formation of outer microannulus cracks [35,36] occurs.
Cement failure may also take place while executing the well-completion workflow, which comprises well stimulation, fluid injection, production, and workover operation. In addition, the higher temperature and pressure of the fluid developed inside the set casing cause the casing to expand circumferentially and longitudinally, thereby causing cement failure, and consequently, environmental hazards and high overburden cost [37,38,39,40].
Researchers have continuously increased their efforts to mitigate cement cracking by adding crumb rubber [41]. Although rubber particles have a progressive use in the construction industry, research has shown a substantial decrease in mechanical properties [42,43] and an increase in ductility [44]. Long et al. [44] showed that the compressive strength of cementitious materials was reduced by 4.5% for every 1% addition of crumb rubber by volume. In most cases, the added amount of crumb rubber to cement by weight was limited to 25%, and any further increase in rubber deteriorated the mechanical strength significantly [45,46,47]. This was mainly due to the hydrophobic nature and low Young’s modulus of the rubber particles compared to the cement [48].
After completion of the operation, the cement settles down, but for continuous high pressure and temperature in the bottom-hole condition, the cement may become deformed over time. This time-dependent property is known as creep. Compared to other properties, ensuring creep recovery is critical to maintaining wellbore integrity, cement durability, and serviceability of the casing for long-term extended loading when the cement is subjected to constant bottom-hole pressure [49,50,51,52,53,54].
From an ecological perspective, rubber-material utilization in petroleum well-cementing is extremely encouraged, because inappropriate disposal of these wastes can lead to environmental and human health issues. This is why researchers have been attempting to use this industrial waste in any suitable applications in order to decrease the impacts of waste removal [55,56,57,58,59,60] and reduce the cost.
The objective of this study was to determine the optimum cement–rubber slurry composition that offered acceptable rheological, mechanical, petrophysical, and creep properties, and that enhanced the cement’s properties in downhole cement applications when using crumb–rubber composites. Using different concentrations of crumb rubber, the current study conducted an extensive experimental investigation of the rheological (yield stress, plastic viscosity, thickening time, and segregation test), mechanical (compressive strength and failure pattern), petrophysical (permeability), scanning electron microscope (SEM) analysis (bonding of cement rubber), and creep properties (strain recovery) of cement–rubber slurries.
2. Materials and Methods
2.1. Materials Used and Elemental Analysis
Class H Portland cement and crumb rubber with various mesh sizes were used in this experiment. The chemical compositions of the as-received cement and crumb rubber are shown in Table 1. It can be seen that the 40-mesh rubber contained zinc (Zn), while the 200-mesh rubber exhibited the presence of sodium (Na) and aluminum (Al) (Figure 1). We believed that the occurrence of zinc was probably due to the vulcanization process of the rubber. According to the manufacturer, the rubber comprised cured natural rubber, styrene–butadiene (SBR), and 30% carbon black. The presence of sodium was not surprising, since in earlier days, SBR was called “Buna”; i.e., butadiene (Bu) and sodium (Na).

Table 1.
Element analysis for neat cement, 40-mesh, and 200-mesh rubber particles.
The apparent density of the rubber was approximately 1.02 g/cm3. A lignosulfonate retarder (0.1–0.4% by weight) was used to lower the thickening time of the cement mixture by hindering hydration for easy pumping. Moreover, an ADVA 575 superplasticizer (0.03–0.2% by weight) was used as a dispersant and water-reducing agent to increase the bonding between the cement and rubber particles after solidification.
The particle-size distribution (PSD) of the cement and rubber particles with rated sizes of 40, 80, 140, and 200 mesh presented in Figure 2 indicated that the mean diameters were 328.6, 106.95, 64.51, and 59.11 µm, respectively. The reported mean values were equivalent to the spherical diameter of the cement and rubber particles measured on a volume basis. This paper intended to study the effects of the weight fraction of the rubber particles, rubber-particle sizes, retarder, and superplasticizer. Figure 3 shows the elemental concentrations of the samples investigated in this study.
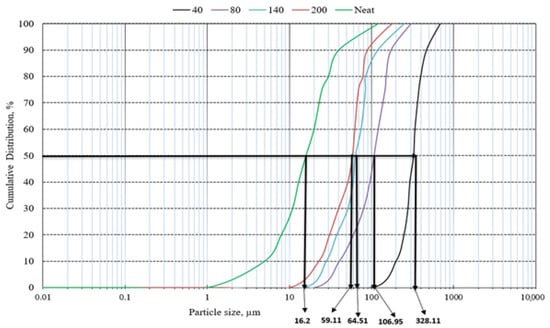
Figure 2.
Particle-size distribution for 40-mesh and 200-mesh rubber and neat cement.
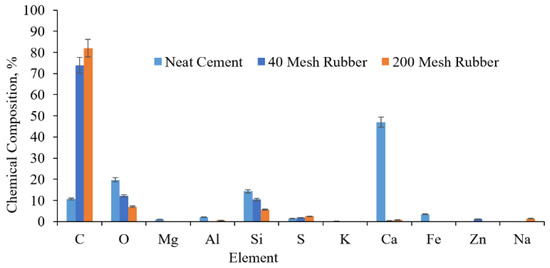
Figure 3.
Elemental concentrations.
2.2. Sample Preparation
The effects of crumb rubber at various particle sizes in combination with a retarder and more superplastic on the rheology and compressive strength of the cement–crumb-rubber composites were evaluated. The thickening time of the cement–crumb-rubber slurry was measured using a consistometer set at a 7000 psi pressure and 200 °F temperature, reflecting the field conditions of high pressure–high temperature (HPHT) wells. Four mesh sizes of crumb rubber (40, 80, 140, and 200) were used in this study. Various cement–crumb-rubber slurries created by adding 2%, 12%, 15%, and 18% BWOC crumb-rubber particles were prepared, and their rheological parameters were determined using an OFITE 800 rotational viscometer.
The slurries were prepared by blending class H cement, rubber particles, water, and additives according to the API 10B-2 procedure [38]. All cement materials were dried, weighed, and mixed before mixing them into the liquid. Water and other liquid additives such as the retarder and superplasticizer were stirred together and measured in the mixer using a high-precision weighing balance. Neat cement and crumb-rubber particles were mixed and added to the liquid solution for slurry preparation. The density of the slurry was measured as suggested by API 10B-2 [38] and was found to be within the range of 1.8–2.0 g/cm3.
After completion of the rheological tests, the slurry was poured inside 2 in (diameter) × 4 in (length) cylindrical molds, and Vaseline petroleum jelly was used to coat the molds internally so that the cement samples could be easily removed after curing. The molds filled with the slurries were then placed inside an oven set at 200 °F and cured for 24 h. The cured samples were removed from the molds and prepared for mechanical testing to measure the unconfined compressive strength (UCS) of the cement–crumb-rubber composites according to ASTM C 39-04a. Three samples for each material type were tested, from which an average value was obtained. A scanning electron microscope (SEM) was employed to examine the interfacial bonding between the cement and rubber particles. A flowchart of the statement and objectives of this study is shown in Figure 4.
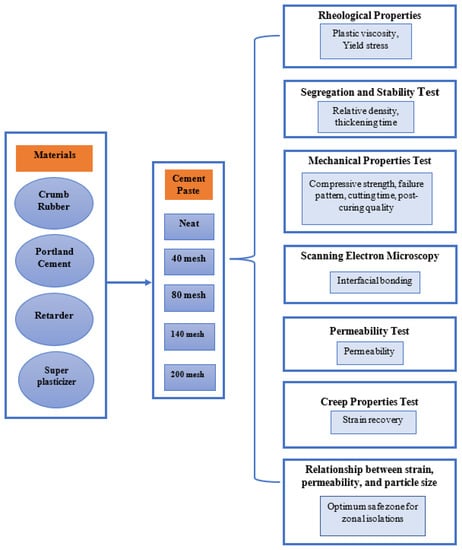
Figure 4.
Flowchart of this study.
2.3. Testing Methods
2.3.1. Rheological Properties Measurement
In the initial phase of this research work, several tests were conducted using the finest and coarsest rubber-particle sizes (40- and 200-mesh sizes corresponding to particle sizes of 425 and 75 μm) to observe any significant differences in the thickening time and the rheological properties. Experiments were carried out to obtain a general understanding of the rheology of the slurries and to design subsequent cement slurries for quality purposes. The preliminary results revealed that the plastic viscosity of the 200-mesh rubber was increased by a factor of two to three times that of the 40-mesh rubber, depending on the quantity of crumb rubber added to the cement.
It was also shown that the addition of 15% and 18% crumb-rubber particles to the neat cement combined with retarder and plasticizer resulted in very thick slurries, making it difficult for them to flow. This effect became more apparent for particles with mesh sizes higher than 80, resulting in inflow indexes higher than 1. In both cases, the slurry exhibited some shear thickening caused by the excessive addition of rubber particles, and thereby became a dilatant fluid in which the changes in viscosity and shear rate were proportional. To obtain an acceptable slurry viscosity for Portland cement, the recommended and optimum water percentage is 38% [61]. During the cement slurry preparation, it was observed that the slurries became very thick, and 38% water was not sufficient. Then, to reduce the dilatant effect, we decided to increase the amount of water to obtain the acceptable slurries. A total of four trials were conducted with rubber particles of sizes 140 and 200 mesh using the equations shown below, and several multiplying factors (0.2, 0.33, 0.32, and 0.42) were achieved after multiple trials:
where C2 and D2 were samples containing 15% rubber of 140 mesh and 200 mesh sizes, while C3 and D3 were samples containing 18% rubber of 140 mesh and 200 mesh sizes, respectively. The above proportions provided good guidance to prepare slurries with different particle sizes and weight percentages. The superplasticizer was added to enhance bonding between the cement and crumb-rubber particles, thereby providing an acceptable viscosity range. Several trials showed that the slurries containing 15% crumb-rubber particles BWOC or more continuously thickened. Therefore, it was decided to focus only on 2% and 12% cement–crumb-rubber slurries.
% water in C2 = 38% + (0.2 × 15%) = 41%
% water in C3 = 38% + (0.33 × 18%) = 44%
% water in D2 = 38% + (0.32 × 15%) = 43%
% water in D3 = 38% + (0.42 × 18%) = 46%
The rheological properties were evaluated using an OFITE 800 model viscometer at 200° F and atmospheric pressure. Cement slurries were subjected to a series of shear forces at rates of 3, 6, 100, 200, 300, and 600 rpm in the rotational viscometer. A total of three readings were carefully taken and recorded, and the arithmetic average was then calculated from the three readings. Then, the yield stress and plastic viscosity were calculated using these values.
2.3.2. Segregation and Stability Test
Using the API-suggested procedure 10B-2 [2], a segregation test was performed to compare the density variance between slurry and set cement, and in the entirely cured cement samples from top to bottom. The sample lengths of the cement–crumb-rubber composites were measured, marked at 0.75 inches from the top and bottom, and equally divided into four parts. Marked parts of the samples were carefully cut from top to bottom in that order using a saw (see Figure 5). The final dimensions of each cement sample was 2 inches in diameter and 0.625 inch in length.
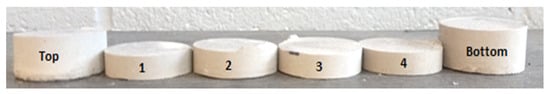
Figure 5.
Cement sample cut into segments for stability test.
A beaker containing water and a high-precision digital balance were used for the density measurement. First, each segment was placed on the balance next to the beaker, and the mass was recorded. Then, dental floss was employed to suspend the sample segment in the beaker while ensuring that the segment did not touch the beaker. The wet-segment mass was recorded while ensuring that air bubbles did not adhere to the segment. This process was undertaken for all the sample segments, from which the relative density was estimated using Equation (5):
where = relative density, = mass (g) in air, and = mass in water. The experiments showed that the prepared rubber–cement composite was stable ( = 1.64–1.82) for all particle sizes, and that segregation rarely took place while curing. Therefore, we concluded that the rubber particles were evenly distributed throughout the sample volume.
2.3.3. Scanning Electron Microscopy Analysis
Interfacial bonding between the crumb rubber and cement sample was investigated using a scanning electron microscope (SEM). Four different samples were analyzed using a Hitachi SU3500 equivalent scanning electron microscope at the University of Louisiana at Lafayette’s Microscopy Center. All samples were coated with gold to obtain the best image. The operating condition maintained in secondary electron (SE) mode with an accelerating voltage of 15 kV and magnification varied at 100X–200X with a fixed resolution of 500 µm.
2.3.4. Mechanical Properties Measurement
The compressive strengths and failure patterns were investigated in this study for the cement–crumb-rubber composites with varying meshes using an MTS brand, 100 kN (22 kips) universal testing machine at room temperature. The cement samples underwent curing for 24 h at 200 °F and 7000 psi. The compressive strength was estimated as an average from three observations for each cement sample with a 2 in diameter and a 0.625 in length.
2.3.5. Permeability Measurement
All of the permeability tests in this study were conducted at the Halliburton Cementing lab facility in Houston, TX, USA. The permeability tests were conducted using water flow and a cylindrical sample with a 2 in diameter × 0.625 in length. To hold the cylindrical sample in place, a rubber seal was used. On one side, high-pressure water was pumped into the sample until the water flowed through the cement sample and reached atmospheric pressure. Then, the permeability was estimated as a function of the flow rate of the water and the pressure drop, viscosity, and sample dimensions using Darcy’s law,
where q = flow rate, A = cross-sectional area, µ = fluid viscosity, k = permeability, and ΔP/L = pressure drop across the length.
2.3.6. Strain-Recovery Tests
The time-dependent behavior of the cement slurries was determined by the creep test. This test was conducted by utilizing the MTS universal load frame and an extensometer. Before commencing the test, an extensometer was firmly attached to each cement sample to measure the strain and track the deformation behavior. During the test, the load frame and extensometer were synchronized to track the strain reading simultaneously. The test duration was one hour for each test. A constant load was applied for 30 min for strain development in the sample, and then kept unloaded for another 30 min for each sample to measure the amount of strain recovery. The strain evolution was continuously monitored during the recovery process.
3. Results and Discussion
3.1. Rheological Properties
The rheological results showed that the excessive addition of rubber particles (15% BWOC or higher) to the cement slurry resulted in very thick slurries that had much difficulty in flowing. The retarder’s effects on the cement’s rheological properties containing 2% and 12% crumb rubber by weight for the two mesh sizes of 40 and 200 were assessed. Figure 6 shows that the viscosity and yield stress decreased as the retarder was increased from 0.1% to 0.4% and the mesh increased. This indicated that the slurry was thinning with an increase in the retarder, which acted as a dispersant. Moreover, it can be seen that the addition of 2% rubber resulted in almost similar properties for the neat cement for the 200 mesh, but a higher plastic viscosity and a lower yield stress when 12% rubber particles was added.
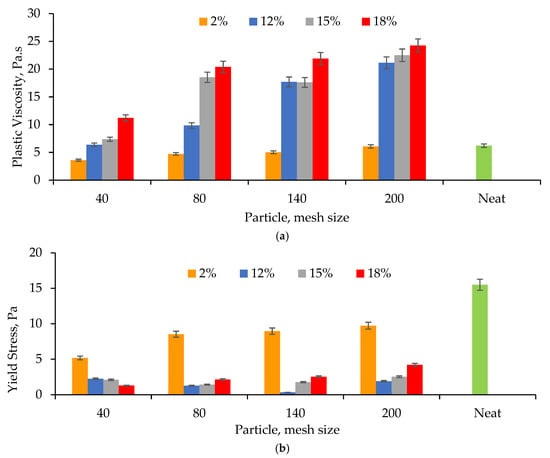
Figure 6.
(a) Plastic viscosity and (b) yield stress for various particles sizes using three different weight percentages of rubber particles (for 0.3% retarder and various plasticizers (0.03–0.24%; plasticizers were varied and conducted several trials to obtain the optimum amount of plasticizer; e.g., 0.11% was found to be optimum for 40 mesh after trials from 0.03–0.11%; similarly, 0.16% was obtained for 80 mesh and 0.24% for both 140 and 200 mesh).
The effects of adding the superplasticizer to the cement, crumb rubber, and retarder mixture on the rheological properties of the composite slurries were also assessed. Figure 6a,b show the effect of the rubber-particle size on the plastic viscosity and yield stress for 2%, 12%, 15%, and 18% of rubber BWOC. The amount of retarder was adjusted according to the number of rubber particles present in the slurry. It was observed that the plastic viscosity increased, whereas the yield stress decreased, as the weight percentage and particle size increased. The plastic viscosity for the 2% and 12% rubber particles with mesh sizes less than 80 were not affected much as compared to the neat cement, which had a plastic viscosity of 6.2 Pa. However, the plastic viscosity became high for smaller particles sizes (higher mesh sizes) and higher rubber concentration (weight fractions). This increase in plastic viscosity indicated that the shear stress between the particles and cement increased. It became more dominant in the cement paste when the concentration of rubber particles was increased with higher-mesh-size particles. Moreover, the figure shows that the yield stress was a bit lower than that of the neat cement of 15.5 Pa. Similar rheological behaviors were also investigated by Long et al. [44].
3.2. Thickening Time
Thickening time is of great importance when cementing a long casing string. Shorter thickening times are hazardous in these situations, as the cement will harden before reaching the set depth. A consistometer was used to measure the thickening time for three slurries consisting of (i) 2% BWOC and retarder at 0.2% BWOC, (ii) 12% BWOC and retarder at 0.4% BWOC, and (iii) 12% containing 0.3% retarder and superplasticizer at varying concentrations. Figure 7 shows the thickening time for the cement slurries with different rubber sizes and concentrations. The figure also shows that the effect of the superplasticizer on the thickening time was significant with an increase in mesh size. For a given mass concentration of rubber particles in the cement, the rubber volume was inversely proportional to its density. Since the 200-mesh rubber had a lower density (0.43 g/cm3) than that of the 40 mesh (0.5 g/cm3), the volume occupied by finer particles was more than that of the coarser ones, resulting in a better distribution of rubber particles in the cement slurry. Thus, higher thickening times were produced for finer mesh sizes, accompanied by an increase in viscosity (time-independent).
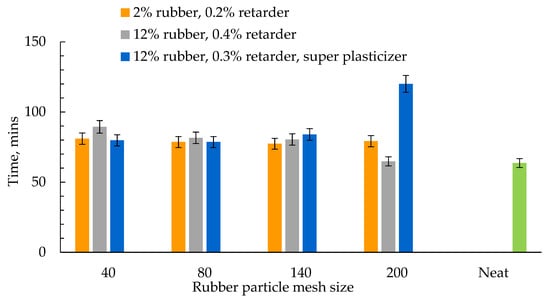
Figure 7.
Thickening Time vs. Rubber Particle Size.
3.3. Cement–Crumb-Rubber Postcuring Quality
The quality of the cement slurries after curing was also studied. During the first phase of our investigation, it was found that most of the rubber particles migrated to the top of the slurry due to their hydrophobic nature while curing, thereby resulting in an uneven particle distribution within the samples and poor bonding between the cement and rubber (see Figure 8a) with no other additives. Thus, the samples could be chipped off with the tip of a finger. Based on these observations, we felt it was necessary to enhance the bonding strength between the cement and rubber particles by adding a retarder and superplasticizer. A transition from poor to excellent bonding is shown in Figure 8. This was achieved by adding the retarder to the cement and rubber particles, which moderately improved the bonding (see Figure 8b). The bonding was further enhanced (Figure 8c) by adding a superplasticizer, ADVA 575, which behaved as a water-reducing agent and dispersant in the slurry containing particles of the cement, rubber, and retarder. Proper care had to be taken while adding the superplasticizer, as an excess of this water-reducing agent in cement slurries may cause the slurry material to separate and become unstable.
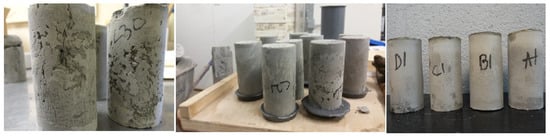
Figure 8.
Cement–crumb-rubber samples showing (a) poor, (b) moderate, and (c) excellent bonding strength between rubber particles and Portland cement.
3.4. Bonding between Cement and Crumb-Rubber Particles
SEM analyses of several cement pastes vividly illustrated the bonding between the cement and crumb-rubber particles (Figure 9). Figure 9a,b show an SEM picture of cement material for only rubber particles under 100X and 200X magnifications, respectively. The figure shows that the rubber particles were surrounded by a cement matrix with no bonding between the cement and rubber particles, resulting in poor-quality samples; whereas Figure 9c shows that the addition of a retarder lessened the space between the cement paste and rubber particles, leading to better bonding. The bonding was enhanced even further by adding a plasticizer with the retarder, as seen in Figure 9d in which the gap between the rubber particles and cement was almost closed, thereby leading to good bonding.
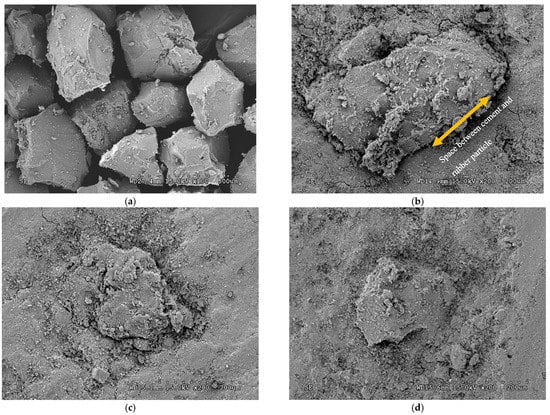
Figure 9.
Cement sample containing: (a) only rubber particles at 100X; (b) only rubber particles at 200X; (c) rubber particles and retarder; (d) rubber particles, retarder, and plasticizer.
3.5. Mechanical Properties Measurement: Unconfined Compression Strength and Failure Pattern
This section summarizes the compressive strength of the cement–rubber composites for four different mesh sizes and containing 2% and 12% rubber particles. Figure 10 shows a reduction in the compressive strength for all cement composites. The figure shows that the addition of 12% rubber particles BWOC resulted in drops in strength of almost 55% and 40% for the 40- and 200-mesh sizes, respectively. This reduction was more pronounced for all meshes with 12% rubber particles. Nevertheless, this reduction was still acceptable, as the minimum required cement strength ranges between 3.4 and 17.0 MPa [38], thereby identifying the use of rubber particles at 12% BWOC as the optimum composition for field applications. It was found that the cement paste with 140-mesh rubber particles at 12% BWOC, 0.3% retarder, and 0.16% superplasticizer was the optimum concentration with favorable operating rheological properties (consistency index, K ~ 0.22 lb/(100 ft2 × sn); flow behavior index, n ~ 0.7; yield stress ~ 6 Pa, and plastic viscosity ~ 15 Pa).
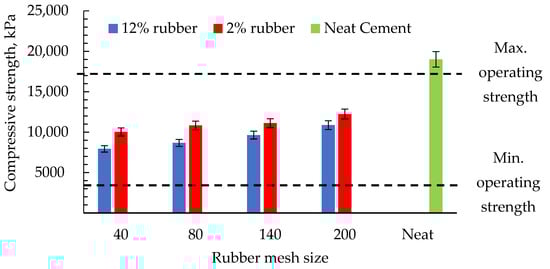
Figure 10.
The effect of rubber-particle size on the compressive strength of cement slurries.
The addition of the superplasticizer was observed to augment the bonding between the cement and rubber particles. This effect is depicted in Figure 11; the compressive strength increased by almost 15% after adding a superplasticizer.
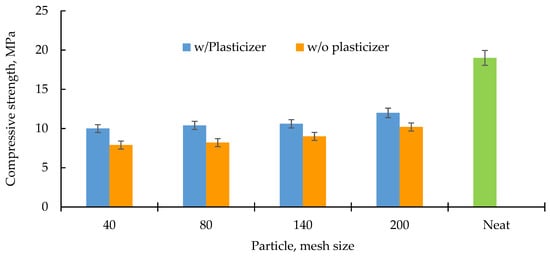
Figure 11.
Effect of plasticizer on the compressive strength of cement slurries.
The effect of curing time was also studied, and revealed that the composite strength containing 12% crumb rubber and additives improved the compressive strength of the composite. Figure 12 shows an increase in the compressive strength for higher curing times and as the particle mesh size increased.
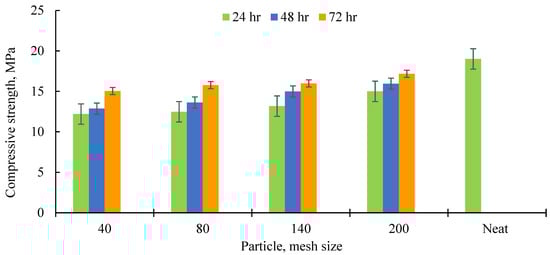
Figure 12.
Effect of curing time on the compressive strength of cement slurries.
The fracture mode of the samples under compression was also investigated. It was observed that the neat cement exhibited a brittle type of failure (see Figure 13a); however, the cement slurries containing substantial amounts of crumb-rubber particles had high levels of ductility, which is a desirable quality in cementing operations. This behavior resulted in a reduction in crack development in the cement–rubber composite samples as compared to the neat cement (see Figure 13b,c). We also noticed that the composite samples bulged as a result of their ductile behavior, thereby delaying the development of cracks.
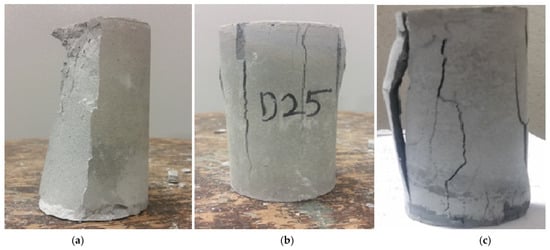
Figure 13.
Comparison of fracture patterns (a) neat cement; (b) rubber–cement; (c) rubber–cement and additives.
3.6. Permeability Results
It is usually expected to have the lowest permeability present in the cement paste to ensure cement integrity and high-quality completion. The permeability results demonstrated that the cement–rubber slurry with the largest particle size (40 mesh) had the highest permeability (0.04102 md), whereas the smallest rubber-particle size (20 mesh) exhibited the lowest permeability, with a value of 0.00319 md. Thus, it was evident that the permeability was reduced with a reduction in the rubber-particle size compared to the neat cement’s permeability, 0.0087 md. We observed that the addition of 12% BWOC with 200-mesh crumb rubber decreased the permeability by nearly 64% compared to the base cement. Figure 14 shows the permeability distribution of the cement paste for different sizes of rubber particles compared to that of the neat cement.
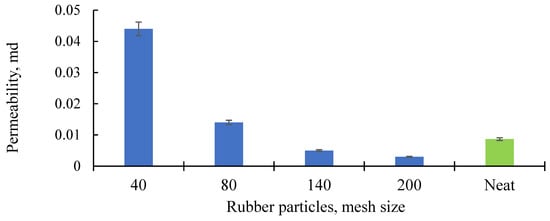
Figure 14.
Permeability test plot.
The relationship between the permeability and rubber-grain size can be found in the following equation:
where k is the permeability in md and dr is the rubber grain size in µm. Figure 15 shows the relationship between the permeability and the rubber-grain size.
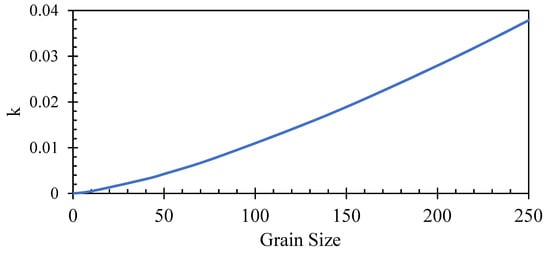
Figure 15.
Relationship between permeability and rubber-grain size.
3.7. Creep Testing for Strain Recovery
Analyzing the deformation characteristics in cement materials is of great importance to sustainable well completion. Downhole cementing undergoes sustained and continuous in situ stress, which causes deformation in the cement materials; failure to ensure proper cement integrity to withstand such deformation in the long term has resulted in serious consequences in hydrocarbon production [54].
A creep test usually measures the strain developed in a material under a constant load with time. Creep is a time-dependent property of cement materials. When cement materials are loaded under compression, they exhibit a small amount of strain that is invisible and difficult to observe visually. That is why sensitive deformation-measuring devices such as extensometers are utilized to track the strain.
In this study, creep tests were conducted with cement slurries exposed to five different stress levels—1000, 1300, 1600, 1800, and 2000 pounds of load. The total test duration was 1 h, and the total time was split equally for loading and unloading to half an hour to quantify the mechanical response of the cement. Three samples were tested under the loading and unloading cycle, and the average strain was calculated from the three consecutive observations. Since the strain value was small, each strain value was multiplied by a factor of 106. Figure 16 shows the creep behaviors of the rubber–cement composites with different rubber meshes compared to that of the neat cement.
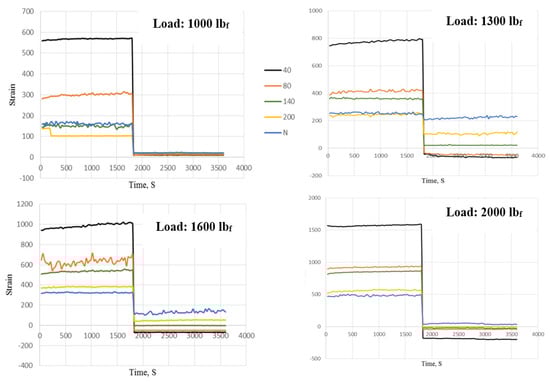
Figure 16.
Strain plot during and after loading at 1000–2000 lbs.
Materials return to their original positions after unloading due to elasticity, and plasticity is responsible for not fully returning back to the original positions. The rubber-particle size affected the strain development in the specimens. The creep results illustrated the relationship between the rubber-particle size and the amount of the strain was proportional. After unloading, the cement with 40-mesh rubber showed a high amount of recovery by returning back to its original position, since it reached or crossed below the zero origins, as seen in Figure 16 (1300 lbf, 1600 lbf, and 2000 lbf).
The obtained results showed that the neat cement did not exhibit strain recovery at any of the applied loads, which substantiated the brittle nature of the neat cement. The cement slurries with the largest size of the crumb-rubber particles showed the highest strain recoveries, which was the signature of the elastic nature of the cement slurries, which might have had the capability to reduce the microcracking in the cement-casing bonding.
3.7.1. Strain Comparison for Different Mesh Sizes
To provide a better understanding of how the permeability and strain were related, an extensive comparison was made based on the obtained strain results in the experiment. Figure 17 shows the averaged strain recovery for all samples (40, 80, 140, and 200 mesh; and neat cement) after unloading at 1000 to 2000 lbf. The graph was constructed using a total of 20 strain-recovery values at different applied stresses for each rubber-particle mesh size.
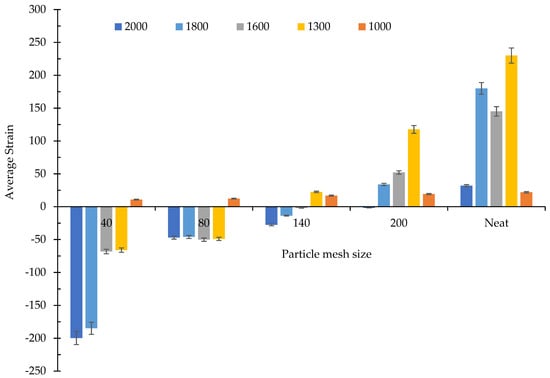
Figure 17.
Averaged strain recovery for all samples (40, 80, 140, and 200 mesh; and neat cement) after unloading at 1000 to 2000 lbf.
To ensure strong wellbore integrity, the lowest permeability of the cement slurries was desirable. The current experiment showed that the cement–rubber composite with the smallest particle size (200 mesh) exhibited the lowest permeability, while the largest rubber-particle size (40 mesh) showed the highest permeability value. We believe that the finer the mesh, the better interlocking between particles. However, at all applied stresses, the 40-mesh-rubber–cement had the highest amount of strain recovery, and the 200-mesh formulation exhibited the lowest strain recovery.
3.7.2. Relationship between Permeability, Strain, and Mesh Size
With the help of the strain and permeability values, a relationship was developed between three parameters; namely, the permeability, average strain, and mesh size of rubber particles (Figure 18). As shown in the figure, the strain values for the 1000 lbf load were all positive, which was in contrast to what the scope of this research demanded. The majority of the strain values for the other loads fell well below the threshold value, which in this case was set at zero. The permeability values for the composite were expected to be lower than the values for the neat cement to satisfy zonal isolation. Concerning the mesh size of the rubber particles, the upper and lower limits were set to 140 mesh and 100 mesh. These mesh-size limits were determined based on the levels at which the optimum strain and permeability were obtained.
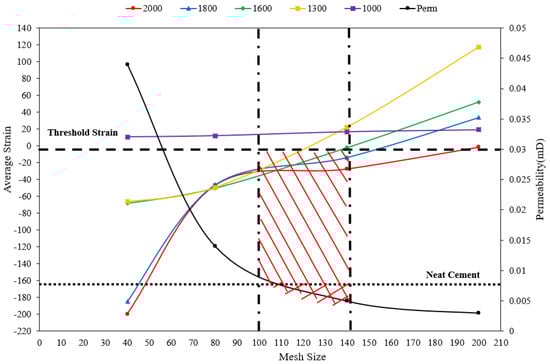
Figure 18.
Relationship between permeability, average strain, and mesh size.
The inclined red line region in Figure 18 shows the optimum relationship between permeability, average strain, and mesh size. The optimum mesh operating region will result in better creep, and consequently, will help to lessen the problem of the microannulus.
4. Conclusions
Rubber particles of four different sizes (40, 80, 140, and 200) were used in this research. Cement slurries with 12%, 15%, and 18% BWOC of the crumb-rubber material were prepared in this study to assess the prospect of utilizing crumb-rubber composites to enhance the cement’s rheology, mechanical properties, strain recovery, and permeability. The results demonstrated that the cement slurry, after mixing in the crumb-rubber material, had improved properties. The following conclusions were drawn from this study:
- The quantity and size of the rubber particles affected the rheology of the cement slurry, which showed a transition from thinning to thickening behavior; crack generation was minimized when crumb-rubber particles were added to the cement as compared to the neat cement. The addition of 15% and 18% crumb-rubber particles to the cement was not feasible for application in the field.
- The addition of rubber particles at 2% BWOC slightly affected the cement slurry’s viscosity as compared to 12% rubber particles, and increased the viscosity of the cement slurry by 50% and 300% for 40- and 200-mesh sizes, respectively.
- The addition of the superplasticizer resulted in a 15% increase in the compressive strength as compared to that of the cement–crumb-rubber composite with the retarder, and improved the bonding between the cement and crumb-rubber particles. We also found that the addition of rubber particles reduced the cement’s strength, which mostly depended on the variation in the rubber-particle size and the quantity.
- Water-permeability tests showed that the addition of 12% BWOC with 200-mesh crumb rubber decreased the permeability by nearly 64% compared to the base cement.
- At all applied loads, the neat cement did not exhibit any strain recovery, which substantiated that the neat cement was brittle. The cement slurries with the largest rubber particles exhibited an elastic nature by demonstrating the highest strain recoveries, thereby offering the capability of reducing the microcracking of the cement-casing sheath.
- Based on the relationship between the permeability, strain, and mesh sizes at different loads, an optimum operating region was established that included cement pastes with 100–140-mesh rubber particles at 12% BWOC, retarder, and superplasticizer with favorable permeability and rheological properties. The plastic viscosity substantially increased beyond this concentration.
Author Contributions
Conceptualization, A.C.S. and F.N.; methodology, A.C.S. and F.N.; validation, A.C.S. and F.N.; formal analysis, F.N. and A.B.A.; investigation, A.C.S. and F.N.; resources, A.C.S. and F.N.; data curation, A.B.A., F.N., and K.G.S.; writing—original draft preparation, A.B.A., A.C.S., and F.N.; writing—review and editing, F.N.; supervision, A.C.S. and F.N.; project administration, A.C.S. and F.N.; funding acquisition, F.N. All authors have read and agreed to the published version of the manuscript.
Funding
This research received no external funding.
Institutional Review Board Statement
Not applicable.
Informed Consent Statement
Not applicable.
Data Availability Statement
The data presented in this study are available upon request from the corresponding author.
Acknowledgments
The authors appreciate the support of Halliburton, which provided the class H cement and its additives, as well as that of Lehigh Technologies Inc., which supplied various crumb-rubber particles used in this research work. The authors thank Texas A & M International University for supporting this work through a university research grant.
Conflicts of Interest
The authors declare no conflict of interest.
References
- El-Gamal, S.M.A.; Hashem, F.S.; Amin, M.S. Influence of carbon nanotubes, nano-silica, and nanometakaolin on some morphological-mechanical properties of oil well cement pastes subjected to elevated water curing temperature and regular room air curing temperature. Constr. Build. Mater. 2017, 146, 531–546. [Google Scholar] [CrossRef]
- Ahmed, R.M.; Takach, N.E.; Khan, U.M.; Taoutaou, S.; James, S.; Saasen, A.; Godøy, R. Rheology of foamed cement. Cem. Concr. Res. 2009, 39, 353–361. [Google Scholar] [CrossRef]
- Rodrigues, E.C.; de Andrade Silva, F.; de Miranda, C.R.; de Sá Cavalcante, G.M.; de Souza Mendes, P.R. An appraisal of procedures to determine the flow curve of cement slurries. J. Pet. Sci. Eng. 2017, 159, 617–623. [Google Scholar] [CrossRef]
- Mahmoud, A.A.; Elkatatny, S. Mitigating CO2 Reaction with Hydrated Oil Well Cement under Geologic Carbon Sequestration Using Nanoclay Particles. J. Nat. Gas Sci. Eng. 2019, 68, 102902. [Google Scholar] [CrossRef]
- Nelson, E.B. Well Cementing; Elsevier: New York, NY, USA, 1990. [Google Scholar]
- Tao, C.; Kutchko, B.G.; Rosenbaum, E.; Wu, W.-T.; Massoudi, M. Steady Flow of a Cement Slurry. Energies 2019, 12, 2604. [Google Scholar] [CrossRef] [Green Version]
- Kiran, R.; Teodoriu, C.; Dadmohammadi, Y.; Nygaard, R.; Wood, D.A.; Mokhtari, M.; Salehi, S. Identification and evaluation of well integrity and causes of failure of well integrity barriers (A review). J. Nat. Gas Sci. Eng. 2017, 45, 511–526. [Google Scholar] [CrossRef]
- Nygaard, R.; Salehi, S.; Weideman, B.; Lavoie, R.G. Effect of Dynamic Loading on Wellbore Leakage for the Wabamun Area CO2-Sequestration Project. J. Can. Pet. Technol. 2014, 53, 69–82. [Google Scholar] [CrossRef]
- Nath, F.; Kimanzi, R.J.; Mokhtari, M.; Salehi, S. A novel method to investigate cement-casing bonding using digital image correlation. J. Pet. Sci. Eng. 2018, 166, 482–489. [Google Scholar] [CrossRef]
- Kremieniewski, M.; Rzepka, M. Correlation of permeability and parameters describing the structure of hardened cement slurries used to seal boreholes in the area of the Pomeranian Basin. Naft. Gaz. 2015, 10, 737. [Google Scholar] [CrossRef]
- Kremieniewski, M.; Rzepka, M. The causes and effects of gas flow in the cemented annular space of borehole and methods to prevent this phenomenon. Naft. Gaz. 2016, 72, 722. [Google Scholar] [CrossRef]
- Taylor, H.F.W. Cement Chemistry, 2nd ed.; Thomas Telford Publishing: London, UK, 1997. [Google Scholar]
- Ahmed, A.; Mahmoud, A.A.; Elkatatny, S.; Chen, W. The Effect of Weighting Materials on Oil-Well Cement Properties While Drilling Deep Wells. Sustainability 2019, 11, 6776. [Google Scholar] [CrossRef] [Green Version]
- Kremieniewski, M. Recipe of Lightweight Slurry with High Early Strength of the Resultant Cement Sheath. Energies 2020, 13, 1583. [Google Scholar] [CrossRef] [Green Version]
- Kremieniewski, M. Improvement of the early mechanical strength of cement sheath formed from lightweight cement slurry. Naft. Gaz. 2018, 74, 606. [Google Scholar] [CrossRef]
- Eric, B.-B.; Joel, F.; Grace, O. Oil Well Cement Additives: A Review of the Common Types. Oil Gas Res. 2016, 2, 112. [Google Scholar] [CrossRef]
- Calvert, D.G.; Smith, D.K. API oil well-cementing practices. J. Pet. Technol. 1990, 42, 1364–1373. [Google Scholar] [CrossRef]
- Mahmoud, A.A.; Elkatatny, S. Improved durability of Saudi Class G oil-well cement sheath in CO2 rich environments using olive waste. Constr. Build. Mater. 2020, 262, 120623. [Google Scholar] [CrossRef]
- Elkatatny, S. Development of a Homogenous Cement Slurry Using Synthetic Modified Phyllosilicate while Cementing HPHT Wells. Sustainability 2019, 11, 1923. [Google Scholar] [CrossRef] [Green Version]
- Sun, X.; Wu, Q.; Zhang, J.; Qing, Y.; Wu, Y.; Lee, S. Rheology, curing temperature and mechanical performance of oil well cement: Combined effect of cellulose nanofibers and graphene nano-platelets. Mater. Des. 2017, 114, 92–101. [Google Scholar] [CrossRef] [Green Version]
- Mahmoud, A.A.; Elkatatny, S.; Mahmoud, M. Improving Class G Cement Carbonation Resistance Using Nanoclay Particles for Geologic Carbon Sequestration Applications. In Proceedings of the 2018 Abu Dhabi International Petroleum Exhibition & Conference, Abu Dhabi, United Arab Emirates, 12–15 November 2018. [Google Scholar]
- Mahmoud, A.A.; Elkatatny, S. Effect of the Temperature on the Strength of Nanoclay-Based Cement under Geologic Carbon Sequestration. In Proceedings of the 2019 AADE National Technical Conference and Exhibition, Denver, CO, USA, 9–10 April 2019. [Google Scholar]
- Medina, G.; Sáez del Bosque, I.F.; Frías, M.; Sánchez de Rojas, M.I.; Medina, C. Energy performance and calorimetric behavior of cements bearing granite sludge. Powder Technol. 2019, 356, 517–527. [Google Scholar] [CrossRef]
- Bu, Y.; Du, J.; Guo, S.; Liu, H.; Huang, C. Properties of oil well cement with a high dosage of metakaolin. Constr. Build. Mater. 2016, 112, 39–48. [Google Scholar] [CrossRef]
- Soares, L.W.O.; Braga, R.M.; Freitas, J.C.O.; Ventura, R.A.; Pereira, D.S.S.; Melo, D.M.A. The effect of rice husk ash as pozzolan in addition to cement Portland class G for oil well cementing. J. Pet. Sci. Eng. 2015, 131, 80–85. [Google Scholar] [CrossRef]
- Mahmoud, A.A.; Elkatatny, S. The Effect of Silica Content on the Changes in the Mechanical Properties of Class G Cement at High Temperature from Slurry to Set. In Proceedings of the 53rd US Rock Mechanics/Geomechanics Symposium, New York, NY, USA, 23–26 June 2019. [Google Scholar]
- Jeon, I.K.; Qudoos, A.; Jakhrani, S.H.; Kim, H.G.; Ryou, J.-S. Investigation of sulfuric acid attack upon cement mortars containing silicon carbide powder. Powder Technol. 2020, 359, 181–189. [Google Scholar] [CrossRef]
- Yao, G.; Wang, Q.; Wang, Z.; Wang, J.; Lyu, X. Activation of hydration properties of iron ore tailings and their application as supplementary cementitious materials in cement. Powder Technol. 2020, 360, 863–871. [Google Scholar] [CrossRef]
- Anjos, M.A.S.; Martinelli, A.E.; Melo, D.M.A.; Renovato, T.; Souza, P.D.P.; Freitas, J.C. Hydration of oil well cement containing sugarcane biomass waste as a function of curing temperature and pressure. J. Pet. Sci. Eng. 2013, 109, 291–297. [Google Scholar] [CrossRef]
- Nagrockiene, D.; Pundiene, I.; Kicaite, A. The Effect of Cement Type and Plasticizer Addition on Concrete Properties. Constr. Mater. 2013, 45, 324–331. [Google Scholar] [CrossRef]
- Calvert, D.J.; Smith, D.K. API oil-well cementing practices. In Proceedings of the Offshore Technology Conference, Houston, TX, USA, 7 May 1990. [Google Scholar]
- Bourgoyne, A.T.; Millheim, K.T.; Chenevert, M.E. Applied Drilling Engineering; Evers, J.F., Pye, D.S., Eds.; SPE Textbook Series: Richardson, TX, USA, 1991; Chapter 3; pp. 85–103. [Google Scholar]
- Klieger, P. Significance of Tests and Properties of Concrete and Concrete Materials; Klieger, P., Lamond, J.F., Eds.; ASTM International: Washington, DC, USA, 1994; Issue 169 part. [Google Scholar]
- Baumgarte, C.; Thiercelin, M.; Klaus, D. Case Studies of Expanding Cement to Prevent Microannular Formation. In Proceedings of the SPE Annual Technical Conference and Exhibition, Houston, TX, USA, 3–6 October 1999. [Google Scholar] [CrossRef]
- Bois, A.P.; Garnier, A.; Rodot, F.; Saint-Marc, J. How to prevent loss of Zonal isolation through a comprehensive analysis of micro-annulus formation. SPE-124719-PA. SPE Drill. Completion 2011, 26, 13–31. [Google Scholar] [CrossRef]
- Karakurt, C. Microstructure properties of waste tire rubber composites. J. Mater. Cycles Waste Manag. 2015, 17, 422–433. [Google Scholar] [CrossRef]
- Abdul-Rahman, R.; Chong, A. Cementing multilateral well with latex cement. In Proceedings of the SPE/IADC 37623, SPE/IADC Drilling Conference, Amsterdam, The Netherlands, 4–6 March 1997. [Google Scholar] [CrossRef]
- API. API 10B-2 Recommended Practice for Testing Well Cements, 2nd ed.; API: Washington, DC, USA, 2013. [Google Scholar]
- Atrushi, D. Tensile and Compressive Creep of Early Age Concrete: Testing and Modeling. Ph.D. Thesis, Norwegian University of Science and Technology, Trondheim, Norway, March 2003. [Google Scholar]
- Chou, L.; Lin, C. Improving rubber concrete by waste organic sulfur compounds. Waste Manag. Resour. 2009, 28, 29–35. [Google Scholar] [CrossRef]
- Clark, P.E.; Sundaram, L.; Balakrishnan, M. Yield points in Oilfield cement Slurries. In Proceedings of the SPE Eastern Regional Meeting, Columbus, OH, USA, 31 October–2 November 1990. SPE 21279. [Google Scholar] [CrossRef]
- Najim, K.B.; Hall, M.R. A review of the fresh/hardened properties and applications for plain- (PRC) and self-compacting rubberized concrete (SCRC). Constr. Build. Mater. 2010, 24, 2043–2051. [Google Scholar] [CrossRef]
- Fiore, A.; Marano, G.C.; Marti, C. On the fresh/hardened properties of cement composites incorporating rubber particles from recycled tires. Adv. Civ. Eng. 2014, 2014, 876158. [Google Scholar] [CrossRef]
- Long, G.; Fyes, D.; Khayat, K.; Yahia, A. Efficiency of waste tire rubber aggregate on the rheological properties and compressive strength of cementitious materials. J. Sustain. Cem. -Based Materials. 2014, 3, 201–211. [Google Scholar] [CrossRef]
- Huang, B.; Shu, X.; Cao, J. A two-staged surface treatment to improve properties of rubber-modified cement composites. Constr. Build. Mater. 2012, 7, 270–274. [Google Scholar] [CrossRef]
- Onana, D.D.; Goodwin, K.J.; McPherson, T.W. Elastomeric Composites for use in Well Cementing Operations. SPE-26572-MS. In Proceedings of the SPE Annual Technical Conference and Exhibition, Houston, TX, USA, 3–6 October 1993. [Google Scholar] [CrossRef]
- Shafieyzadeh, M. Prediction of compressive strength of concretes containing silica fume and styrene-butadiene rubber (SBR) with the mechanical model. Int. J. Concr. Struct. Mater. 2013, 7, 295–301. [Google Scholar] [CrossRef] [Green Version]
- Wu, H.; Lim, Y.M.; Li, V.C. Application of Recycled Tyre Cord in Concrete for Shrinkage Crack Control. J. Mater. Sci. Lett. 1996, 15, 1828–1831. [Google Scholar] [CrossRef]
- Carrier, B.; Vandamme, M.; Pellenq, R.J.; Bornert, M.; Ferrage, E.; Hubert, F.; Van Damme, H. Effect of Water on Elastic and Creep Properties of Self-Standing Clay Films. Langmuir 2016, 32, 1370–1379. [Google Scholar] [CrossRef] [PubMed]
- Al Awad, M.N.; Fattah, F. Utilization of Shredded Waste Car Tyres as a Fracture Seal Material (FSM) in Oil and Gas Drilling Operations. J. Pet. Environ. Biotechnol. 2017, 8, 21. [Google Scholar] [CrossRef]
- Sprince, A.; Pakrastinsh, L.; Korjakins, A. Experimental Creep Tests on Concrete Made With Montmorillonite Nano Particles. In Proceedings of the 8th International Conference: 2012, Concrete in the Low Carbon Era, Dundee, UK, 9–11 July 2012. [Google Scholar]
- Padevět, P.; Bittnar, P. Measuring the Creep and Material Properties of Cement Paste Specimens. Wseas Trans. Appl. Theor. Mech. 2010, 5, 81–92, ISSN: 1991-8747. [Google Scholar]
- Reddy, D.H.; Ramaswamy, A. Experimental and numerical modeling of creep in different types of concrete. Heliyon 2018, 4, e00698. [Google Scholar] [CrossRef] [Green Version]
- Kammouna, Z.; Briffaut, M.; Malecot, M. Experimental Study of the Creep Effect on the Mechanical Properties of Concrete. Adv. Civ. Eng. 2019, 2019, 5907923. [Google Scholar] [CrossRef]
- Hanbing, L.; Wang, X.; Jiao, Y.; Sha, T. Experimental Investigation of the Mechanical and Durability Properties of Crumb Rubber Concrete. Materials 2016, 9, 172. [Google Scholar] [CrossRef]
- Yong, Y.; Zhu, H. Influence of Rubber Size on Properties of Crumb Rubber Mortars. Materials 2016, 9, 527. [Google Scholar] [CrossRef] [Green Version]
- Cheng, X.; Huang, S.; Guo, X.; Duan, W. Crumb waste tire rubber surface modification by plasma polymerization of ethanol and its application on oil-well cement. Appl. Surf. Sci. 2017, 409, 325–342. [Google Scholar] [CrossRef]
- Gwon, S.; Jeong, Y.; Oh, J.E.; Shin, M. Sustainable sulfur composites with enhanced strength and lightweightness using waste rubber and fly ash. Constr. Build. Mater. 2017, 135, 650–664. [Google Scholar] [CrossRef]
- Mohammed, Shahabas; Poornima, V Strength and durability study of sulfur concrete with replaced fine aggregate. Mater. Today Proc. 2018, 5, 23888–23897. [CrossRef]
- Ahmed, A.; Mahmoud, A.A.; Elkatatny, S.; Gajbhiye, R. Improving Saudi Class G Oil-Well Cement Properties Using the Tire Waste Material. ACS Omega 2020, 5, 27685–27691. [Google Scholar] [CrossRef] [PubMed]
- Brothers, L.; Onan, D.; Morgan, R. Well Cement Compositions Containing Rubber Particles and Methods of Cementing Subterranean Zones. U.S. Patent No. US 5779787A, 14 July 1998. [Google Scholar]
Publisher’s Note: MDPI stays neutral with regard to jurisdictional claims in published maps and institutional affiliations. |
© 2022 by the authors. Licensee MDPI, Basel, Switzerland. This article is an open access article distributed under the terms and conditions of the Creative Commons Attribution (CC BY) license (https://creativecommons.org/licenses/by/4.0/).