Article

Relationships between the Petrographic and Abrasive Properties of Sandstones in the Aspect of Their Cutting

1
Faculty of Mining, Safety Engineering and Industrial Automation, Silesian University of Technology, Akademicka 2 Street, 44-100 Gliwice, Poland
2
Faculty of Mechanical Engineering and Robotics, AGH University of Science and Technology, Mickiewicza 30 Street, 30-059 Kraków, Poland
*
Author to whom correspondence should be addressed.
Energies 2022, 15(7), 2692; https://doi.org/10.3390/en15072692
Submission received: 16 February 2022 / Revised: 15 March 2022 / Accepted: 18 March 2022 / Published: 6 April 2022
(This article belongs to the Special Issue Volume II: Mining Innovation)

Abstract

:
The research described in this article was carried out on samples of sandstone obtained from the underground excavations of four hard coal mines that operate in the region of Poland with the highest energy resources, i.e., Upper Silesia. The majority of underground tunnel excavations are mainly drilled using roadheaders, the organs of which are equipped with conical picks. The selection of pick type is usually based on rock compressive strength. However, sandstones often cause more problems during cutting compared to other waste rocks because of their variety. This article’s primary purpose is to emphasize the importance of researching various properties of waste rock in addition to uniaxial compression strength, which is crucial in the selection of both the appropriate cutting method and appropriate cutting tools. Accordingly, relations between mineralogical, petrographic, physical and mechanical properties were examined in this study, with special attention paid to the abrasive properties that comprise rock abrasivity. Sandstones from the regions of Upper Silesia are characterized by a heterogeneity of mineralogical and petrographic features that strongly affect the physical and mechanical properties of these rocks, especially their abrasive properties. The determined correlations can aid understanding of the behavior of rocks during their mechanical cutting and facilitate the selection of appropriate cutting tools.

1. Introduction

Although global coal production is declining, it is still a vast industrial sector in many countries. In 2016, 7.4 billion tons of coal were extracted worldwide, 6.7 billion tons of which was steam coal and 700 million tons of which was coking coal. China is currently the largest coal producer globally; second is the USA, and India is third. Among the European Union countries, which are producers of hard coal, Poland is at the forefront and extracted 63.4 million tons of coal in 2018. In the same year, Polish hard coal mines employed over 80,000 employees [1].
However, to exploit the coal resources mentioned above, accessing excavations should be made. About 200–300 km of workings of this type are performed annually in Poland [1]. Many aspects are considered when preparing work related to drilling excavations, including the properties of the rocks in which the excavation will be drilled. Unfortunately, mines mainly pay attention to the value of the uniaxial compressive strength of rocks. The mining method, cutting machine and cutting tools are often selected on this basis, and this can cause severe consequences that lead to negative impacts on the volume of extraction via the increased drilling time [2,3].
Although uniaxial compressive strength is a significant parameter, mechanical parameters alone do not provide all the information needed to assess the actual behavior of a material during cutting [4]. Such an assessment can be rationally conducted by understanding mineralogical, petrographic, physical, and mechanical rock properties, as well as their correlations [5]. This article’s primary purpose is to emphasize the importance of conducting research regarding the determination of the properties of waste rock to explain the different states of the behavior of these rocks during cutting. Particular attention was paid during research to the relationship between mineralogical, petrographic, and abrasive properties because, apart from the strength properties, rock abrasivity has the most significant impact on the wear of cutting tools (Figure 1) and rock workability.
There are two frequently confused terms associated with abrasive rock properties: abrasiveness and abrasivity. Abrasiveness is defined as the ability of rocks to reduce their volume and mass under the action of abrasive forces [6]. It can also be defined as the effect of a tool on a rock, i.e., how easily the rock wears away. It is determined using Boehme Shield, Amsler Shield, Los Angeles drum, or Micro-Deval drum [7,8]. However, these methods are more often used to determine the abrasion resistance of aggregates [8].
Rock abrasivity is more interesting in the case of the cutting tool selection. Abrasivity is defined as the effect of a rock on a tool, i.e., the amount of the tool’s abrasive wear [9]. It can be determined using the Cerchar method [10,11] or the proprietary method developed at the AGH University of Science and Technology [3,12].
In this research, tests were carried out for Carboniferous sandstones (characterized by mineralogical and petrographic features) and selected physical and mechanical properties. Sandstones have higher uniaxial compressive strength than other waste rocks and are very abrasive [13,14]. Additionally, mineral composition, especially the quantitative share of quartz in the crumb material, and the type of binder-building mineral have significant impacts on the determination of these properties in sandstones.

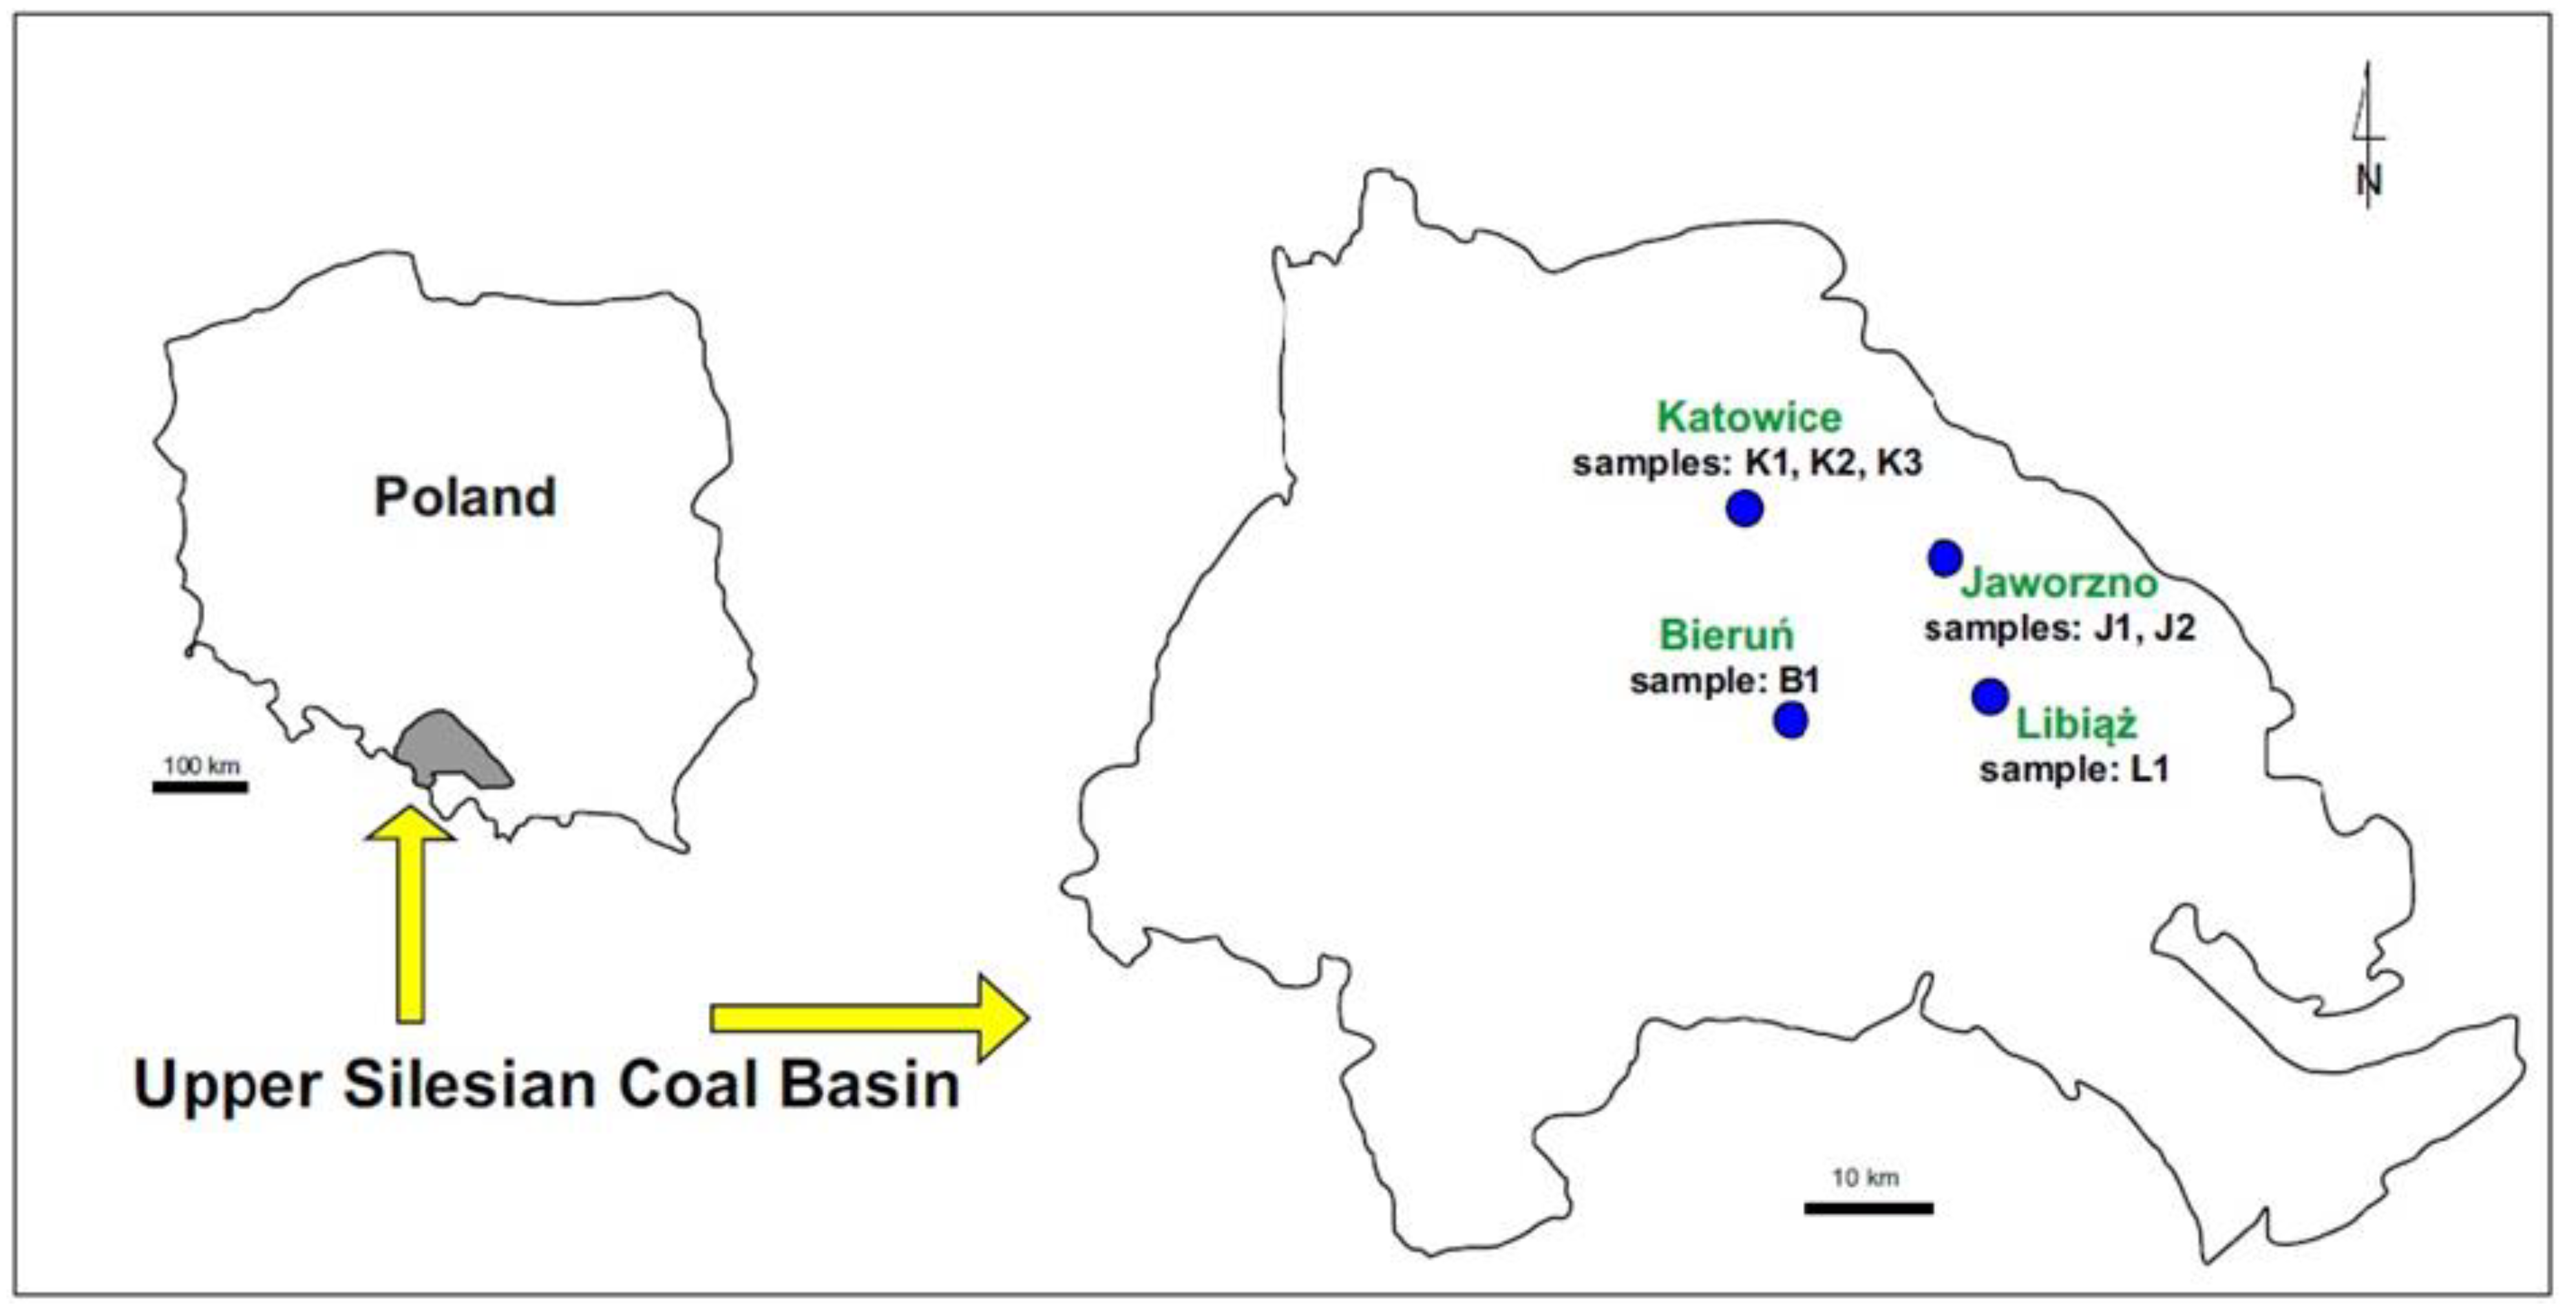
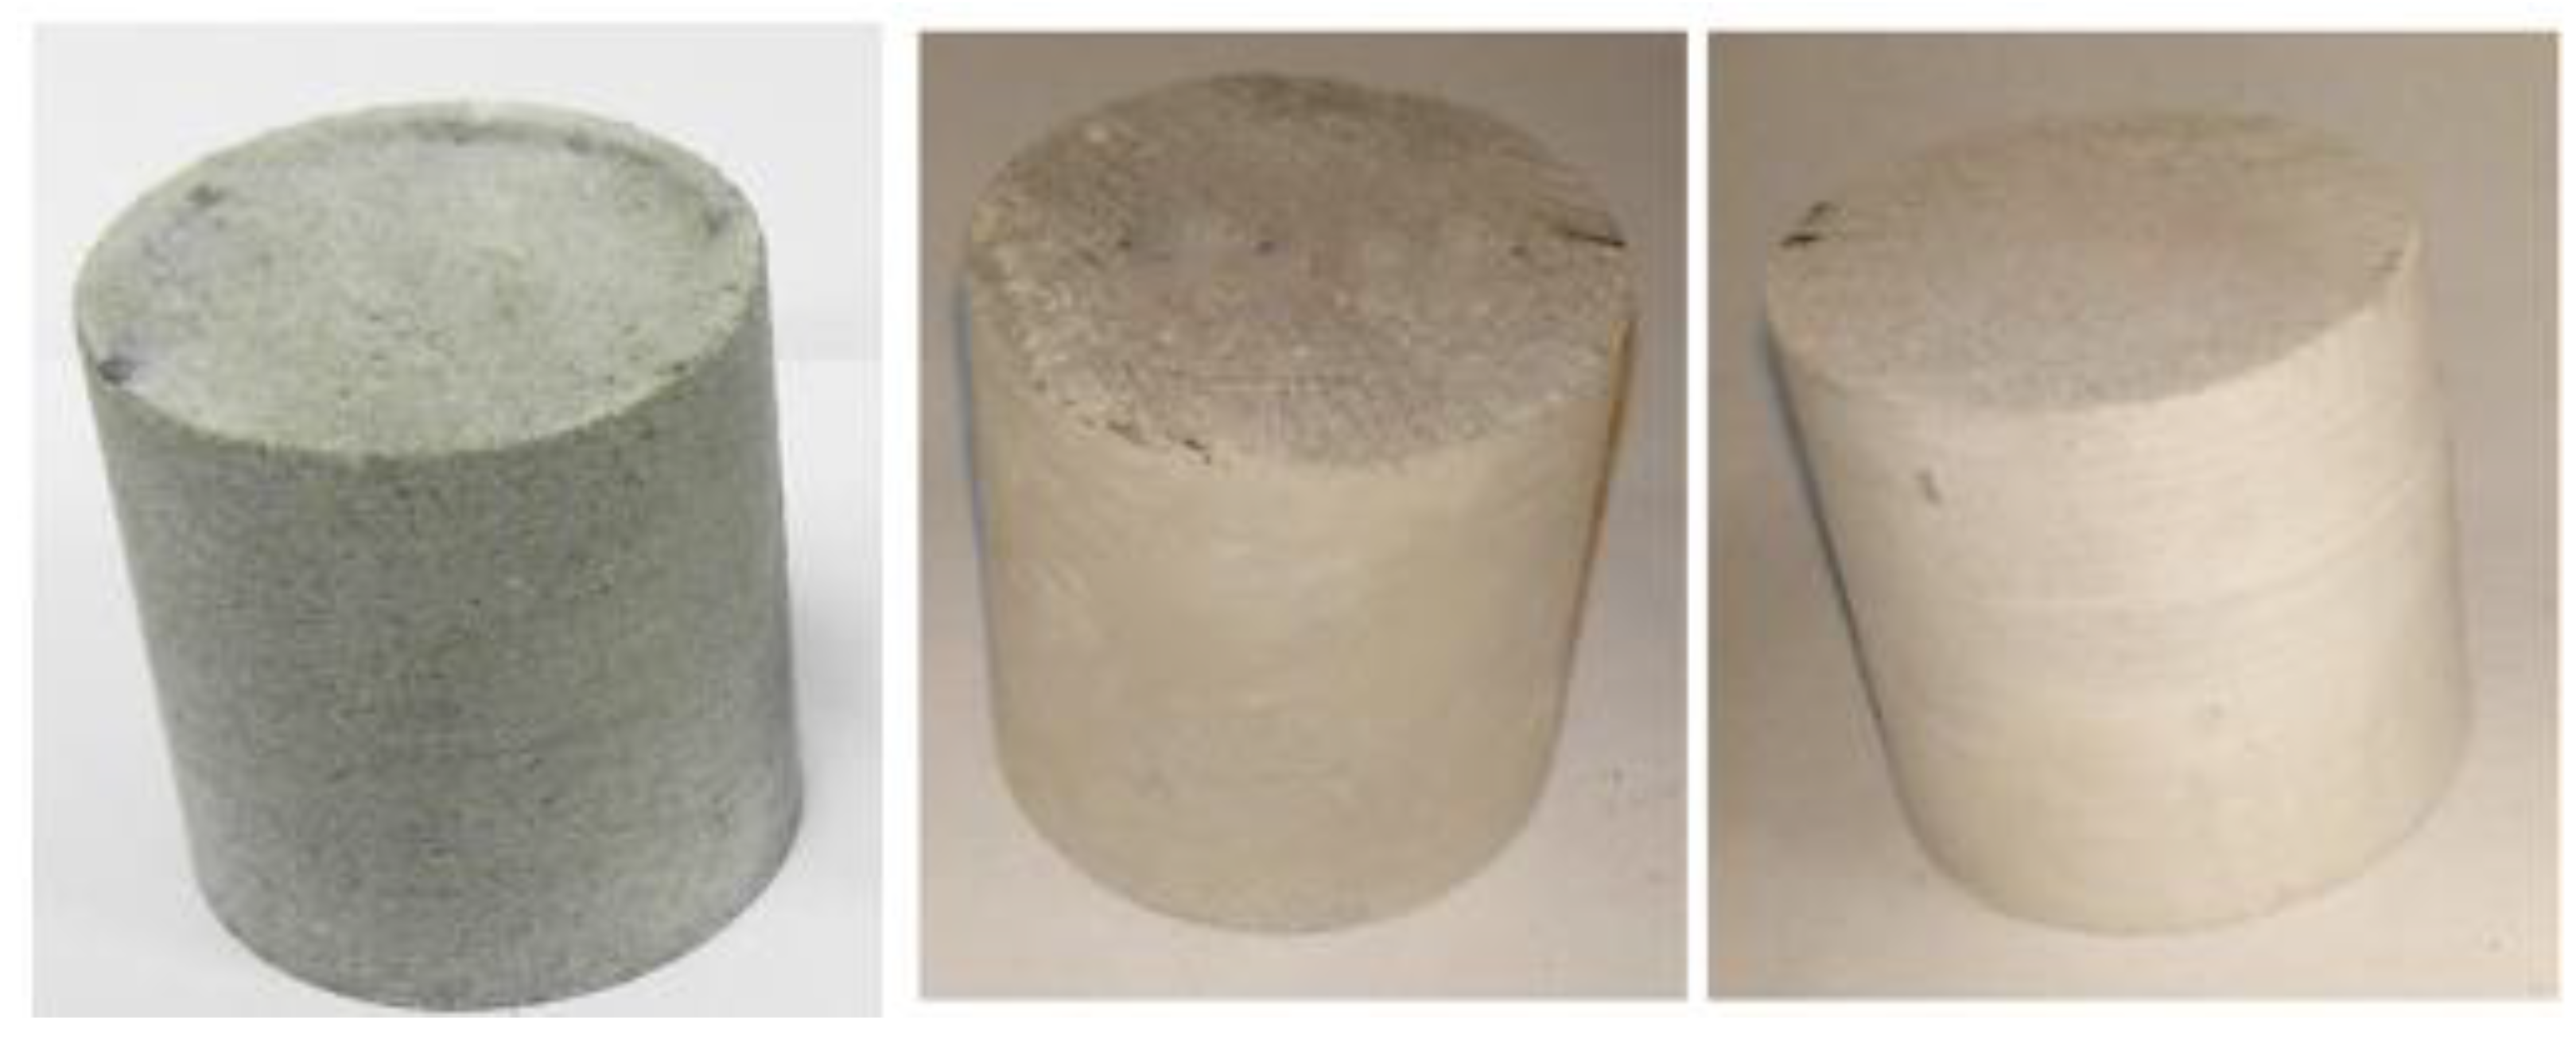
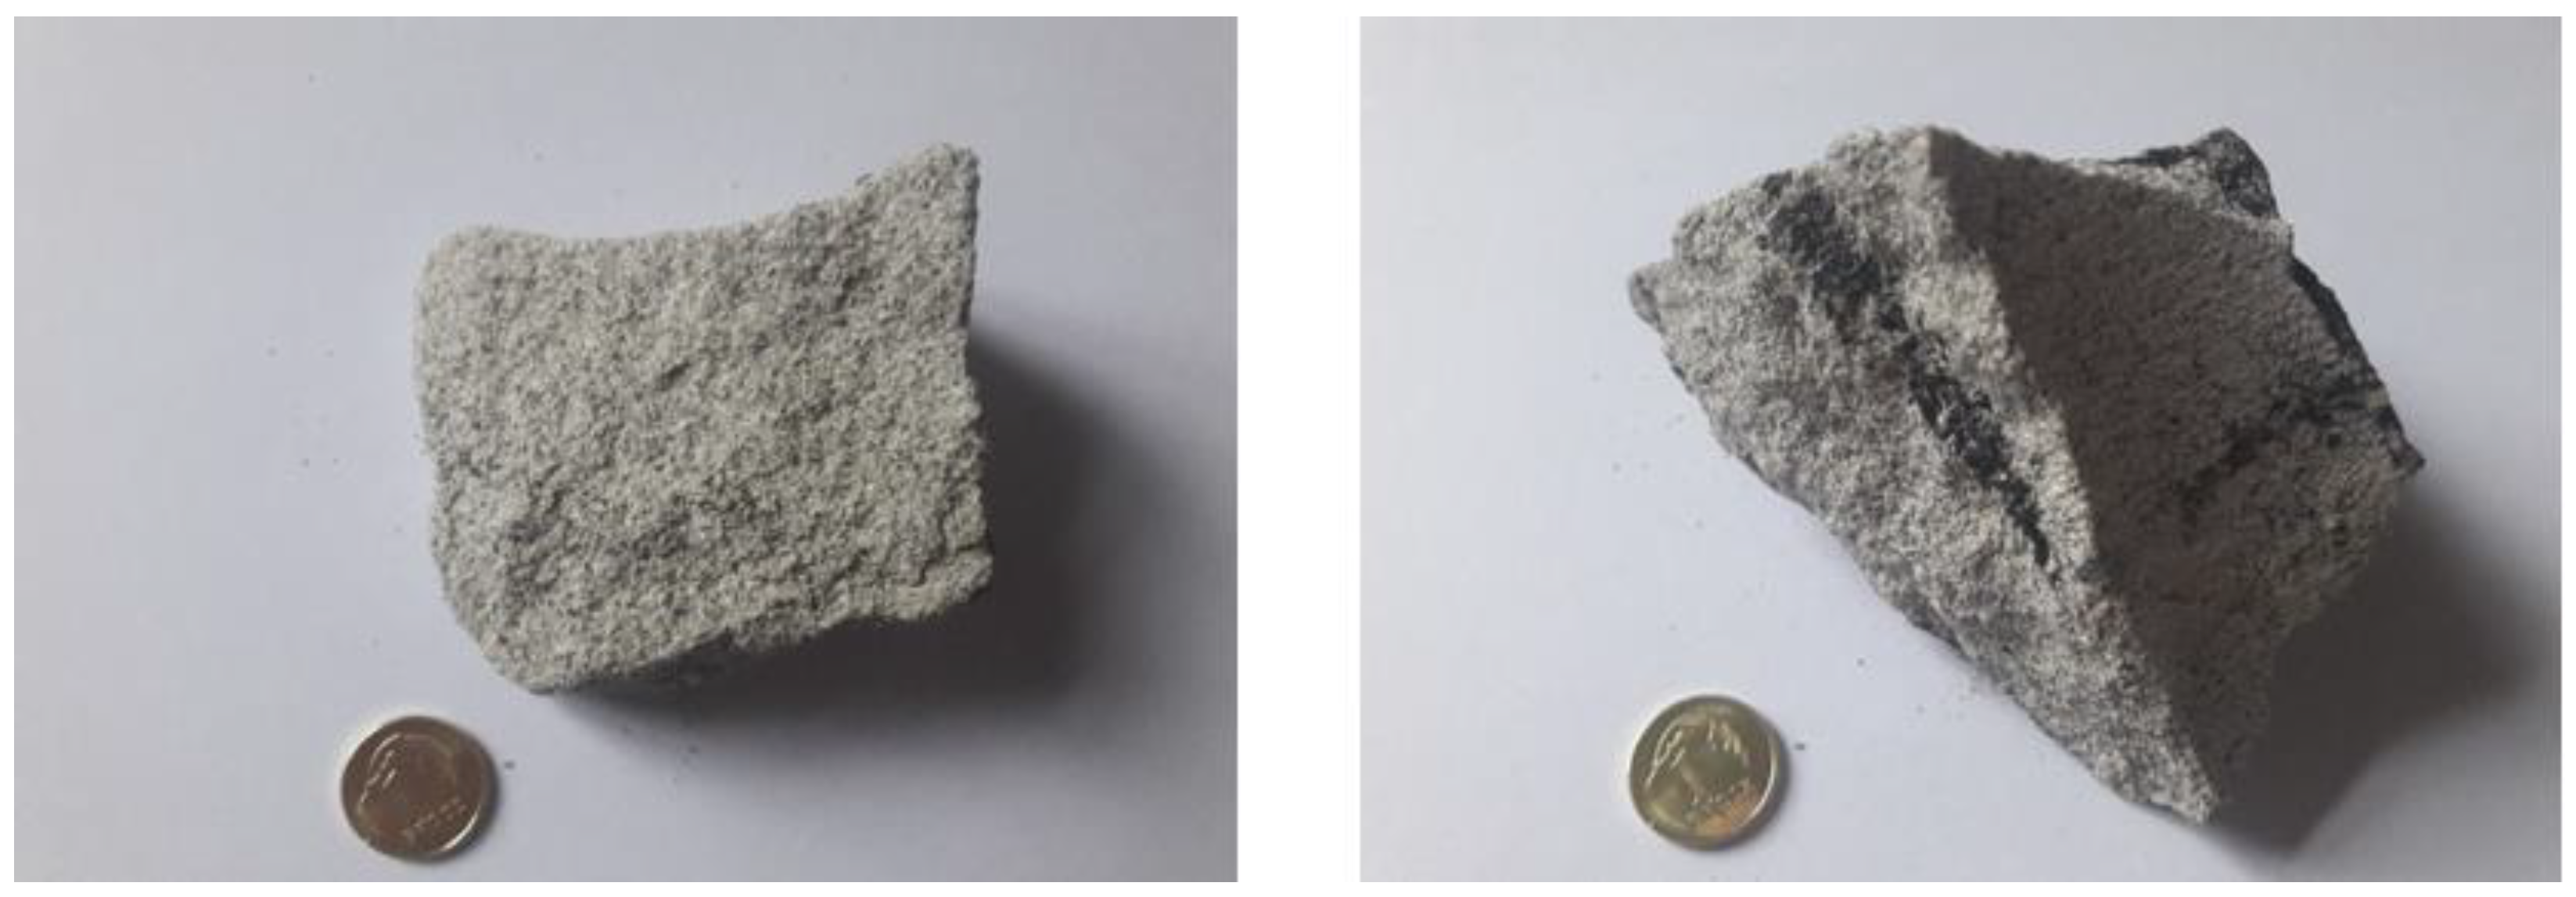
2. Research Material

The tests were carried out for seven different sandstones taken from the underground mining excavations of four hard coal mines located in the following cities: Katowice, Jaworzno, Bieruń, and Libiąż, all located within the Upper Silesian Coal Basin (Southern Poland) (Figure 2).
The Upper Silesian Coal Basin is a triangular basin filled with Upper Carboniferous formations. Its area is about 6100 km2, 1600 km2 of which lies on the Czech side, forming the Ostrava–Karviná Basin. The Upper Silesian Coal Basin is an orogenic basin formed in the foothills of the Moravian–Silesian fold zone of variscite, with paralic and limnic formations. The coal-bearing zone occurs at various depths: down to 2400 m deep in the eastern part and down to 4600 min the western part. With drilling, it can reach even deeper to 6000 m. A significant position of the rocks accompanying coal seams next to claystone and silt is occupied by sandstone [15,16].

3. Research Methodology

After collecting sandstones from mining excavations, appropriate laboratory samples were prepared and tests were carried out following the established plan and research methodology. Thanks to the research, mineralogical and petrographic analyses were performed and physical and mechanical properties were assessed.

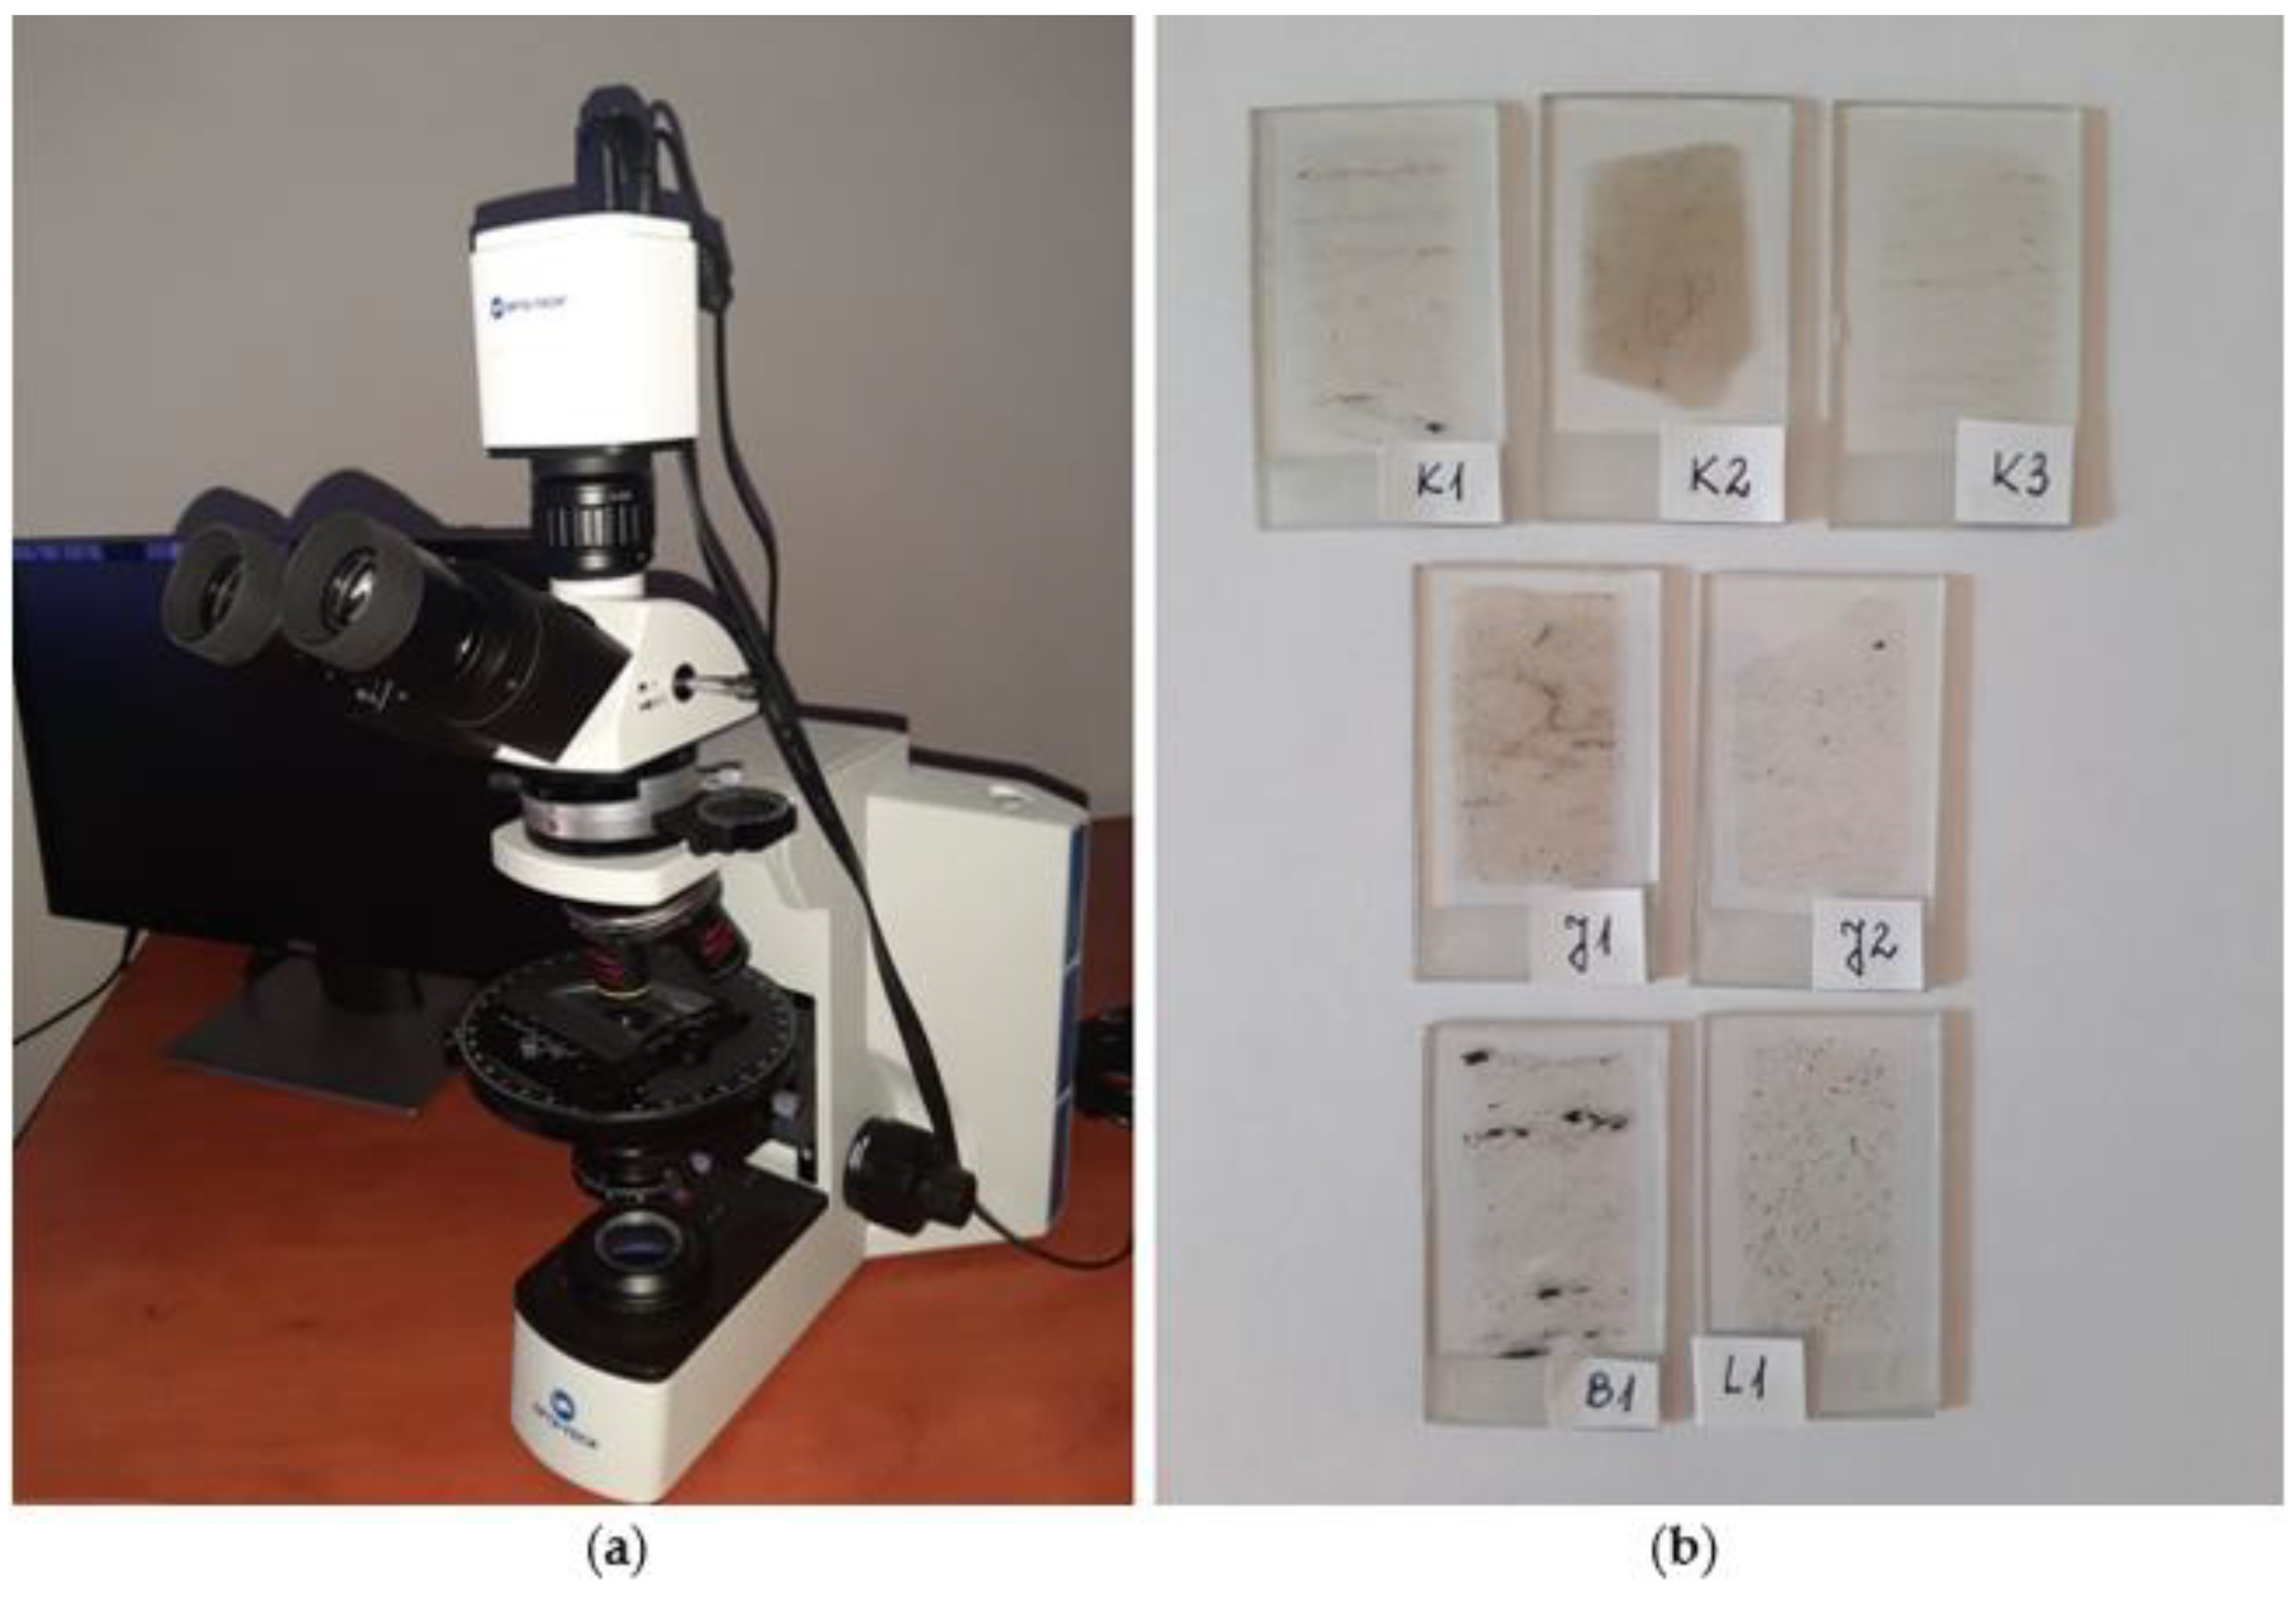
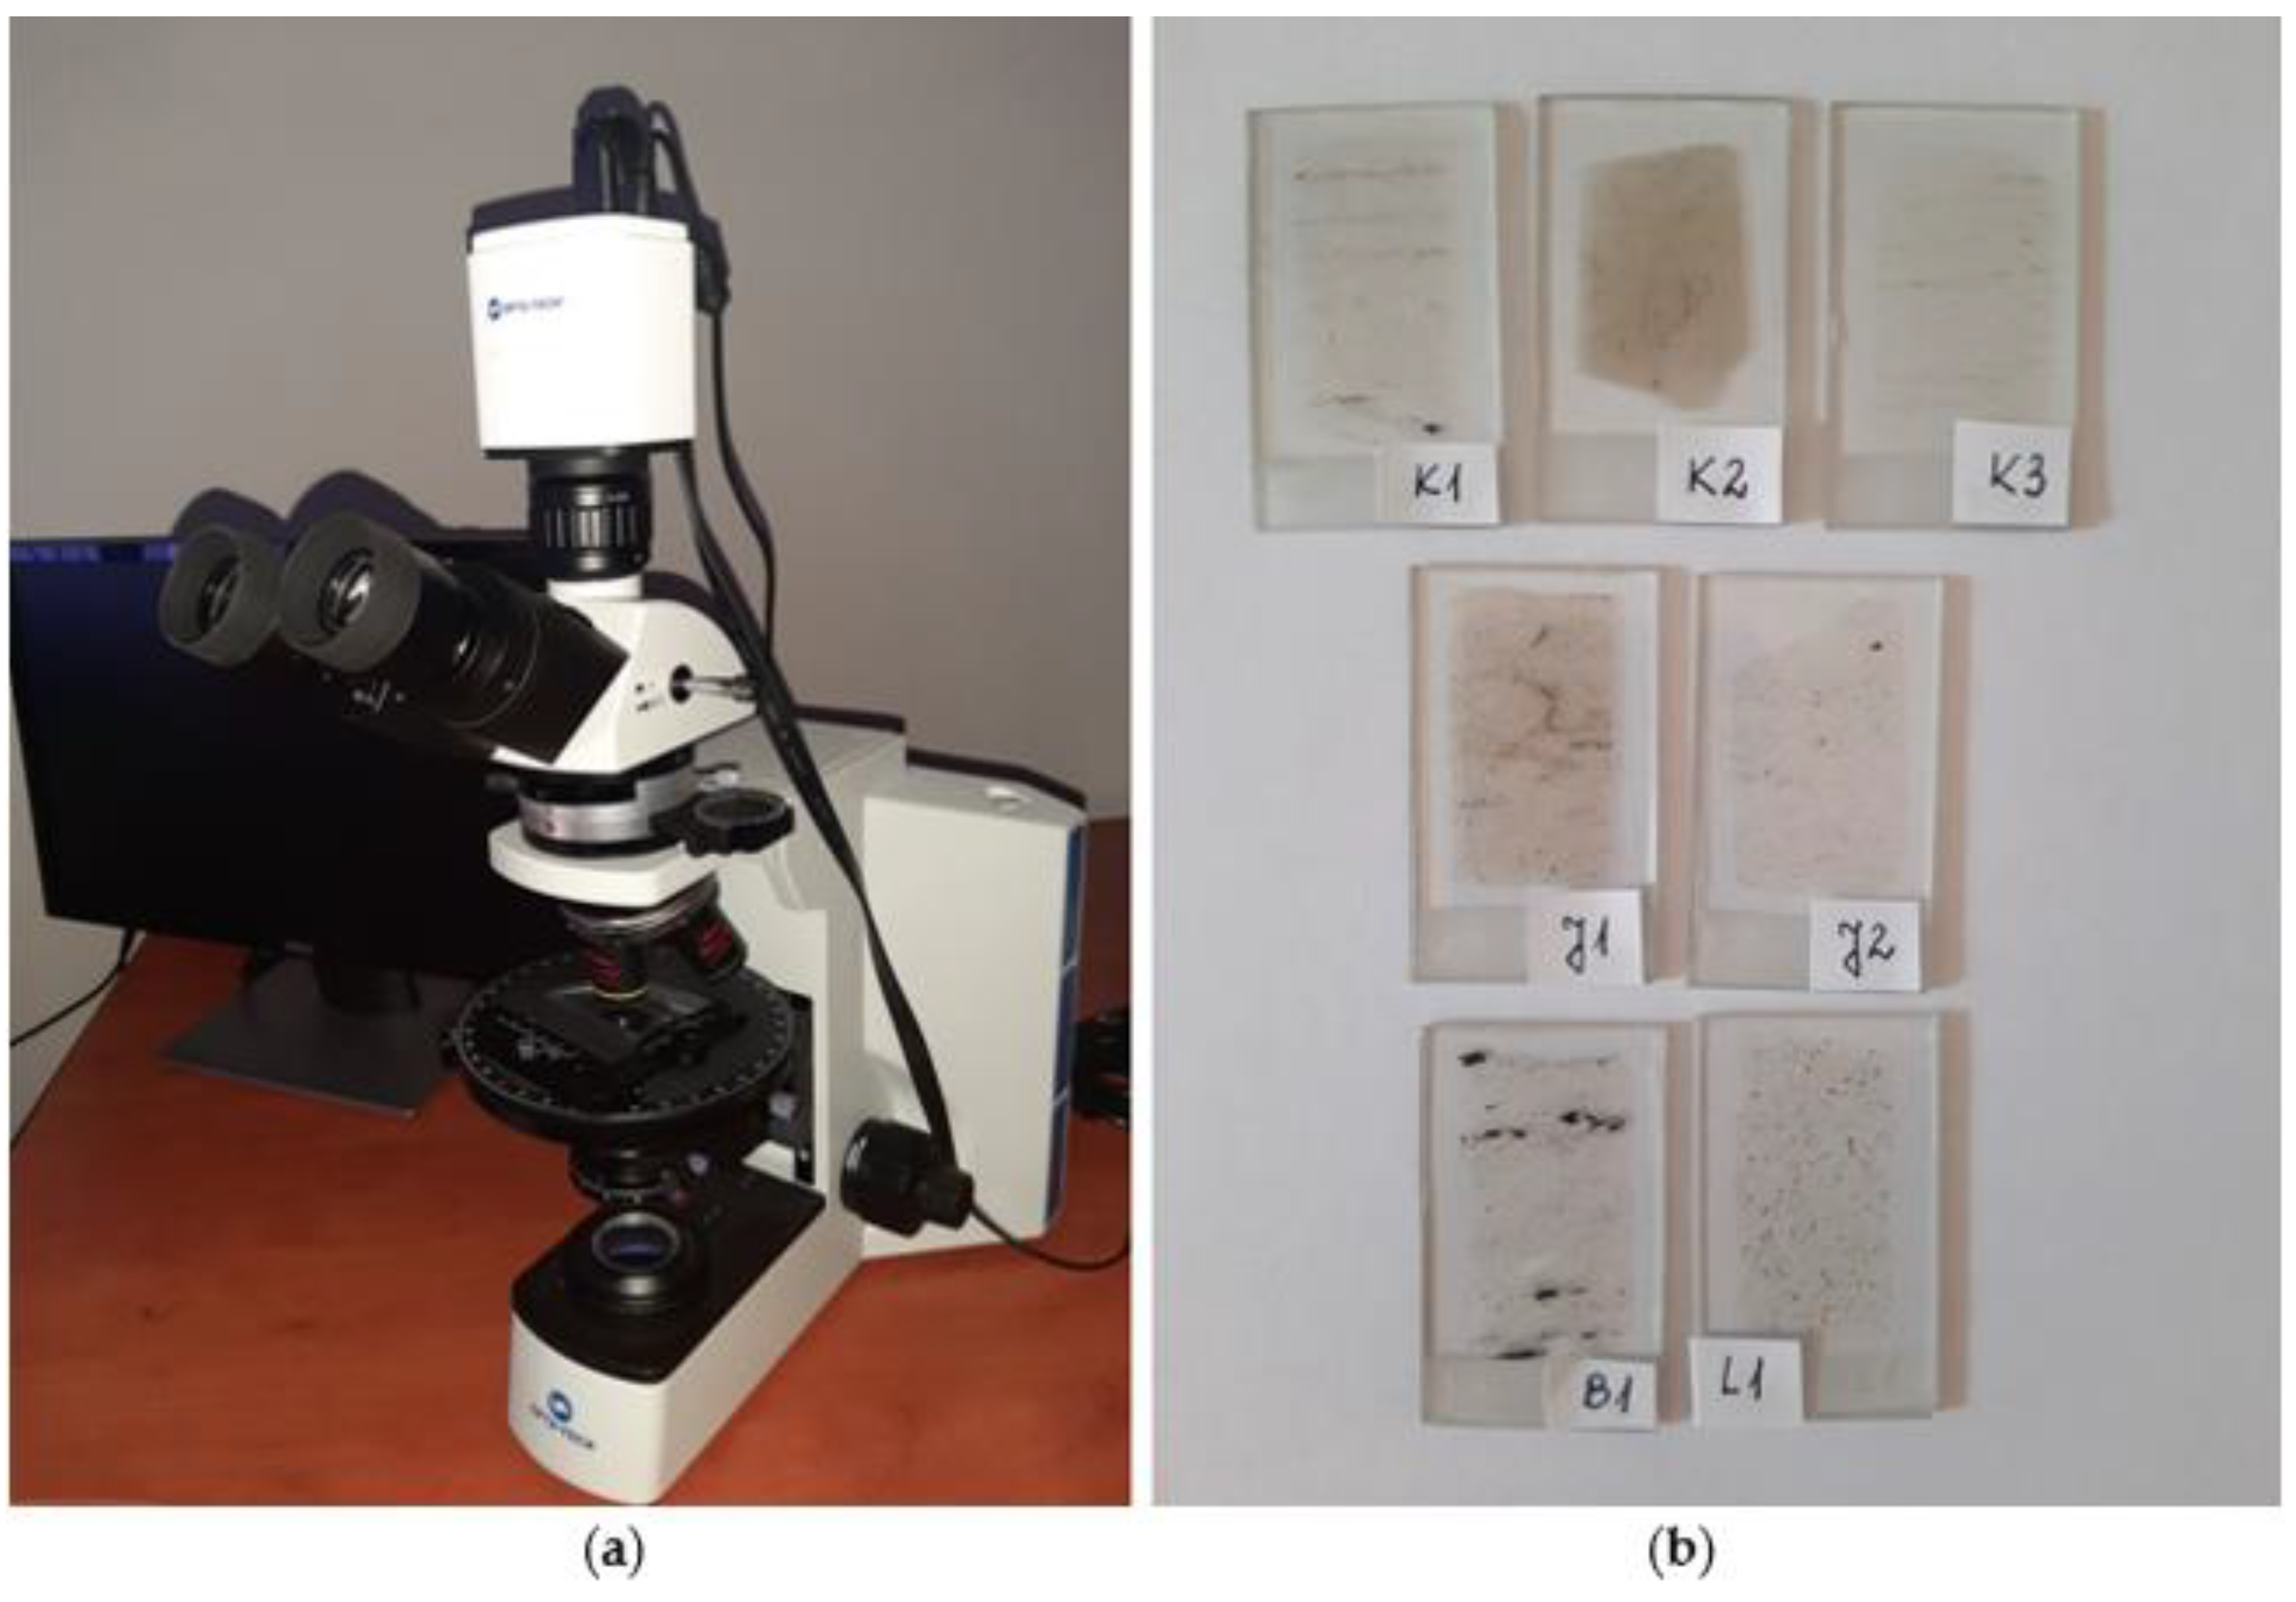
3.1. Petrographic and Mineralogical Analyses

Microscopic observations were carried out with transmitted light in thin sections (Figure 3a) using the OPTA-TECH LAB-40 HAL polarizing diagnostic microscope from the OPTA-TECH company equipped with an image analyzer (Figure 3b).
The quantitative analysis of the components was performed using the point method using a polarizing microscope equipped with an eyepiece with a cross of spider threads and an integration table. A planimetric analysis of the entire surface of the preparations was performed, with about 500 counts from each sample in 0.2 mm increments.

3.2. Analysis of Physical Properties

In terms of physical properties, the effective porosity, bulk density, and water absorption of the tested sandstones were determined. Effective porosity, also known as active or discovered porosity, is the content of pores that connect with the outer surface of the rock (i.e., open pores), allowing the liquid to move through the medium. Effective porosity is determined by saturating samples of known volume with a liquid of known bulk density. Five cylindrical samples with a diameter and height equal to 50 ± 0.5 mm were prepared for each type of sandstone (Figure 4). Effective porosity was determined using a hydrostatic balance using the following formulas based on Archimedes’ law [5]:
V w = W w W d γ w   cm 3
V s = W w W h γ w   cm 3
where Wd is the mass of the dry sample measured in the air, Ww is the mass of the saturated sample measured in the air, Wh is the mass of the saturated sample measured on the hydrostatic balance, γw is the density of the liquid at ambient temperature, Vs is the volume of the sample, and Vw is the volume of water in the pores [5]. Therefore, the effective porosity Pw can be calculated as [17]:
P w = V w V s · 100   %
After calculating the mass of the above-mentioned rock samples and their dimensions, it was also possible to determine the bulk density γs as the ratio of the mass of the dry sample to its volume:
γ s = W d V s   g cm 3
The Ns water absorption of the tested sandstones, i.e., their ability to absorb water, was determined as the third physical property. To that end, five cylindrical samples with a diameter and height equal to 50 ± 0.5 mm were also prepared for each type of sandstone. After determining their dry weight (Wd), each sample was dipped in distilled water and weighed regularly until saturation was stabilized. The water absorption coefficient in weight percentage was determined as the ratio of the mass of water absorbed to the mass of the sample in the dry state, and it was calculated as [5]:
N s = W w W d W d · 100   %

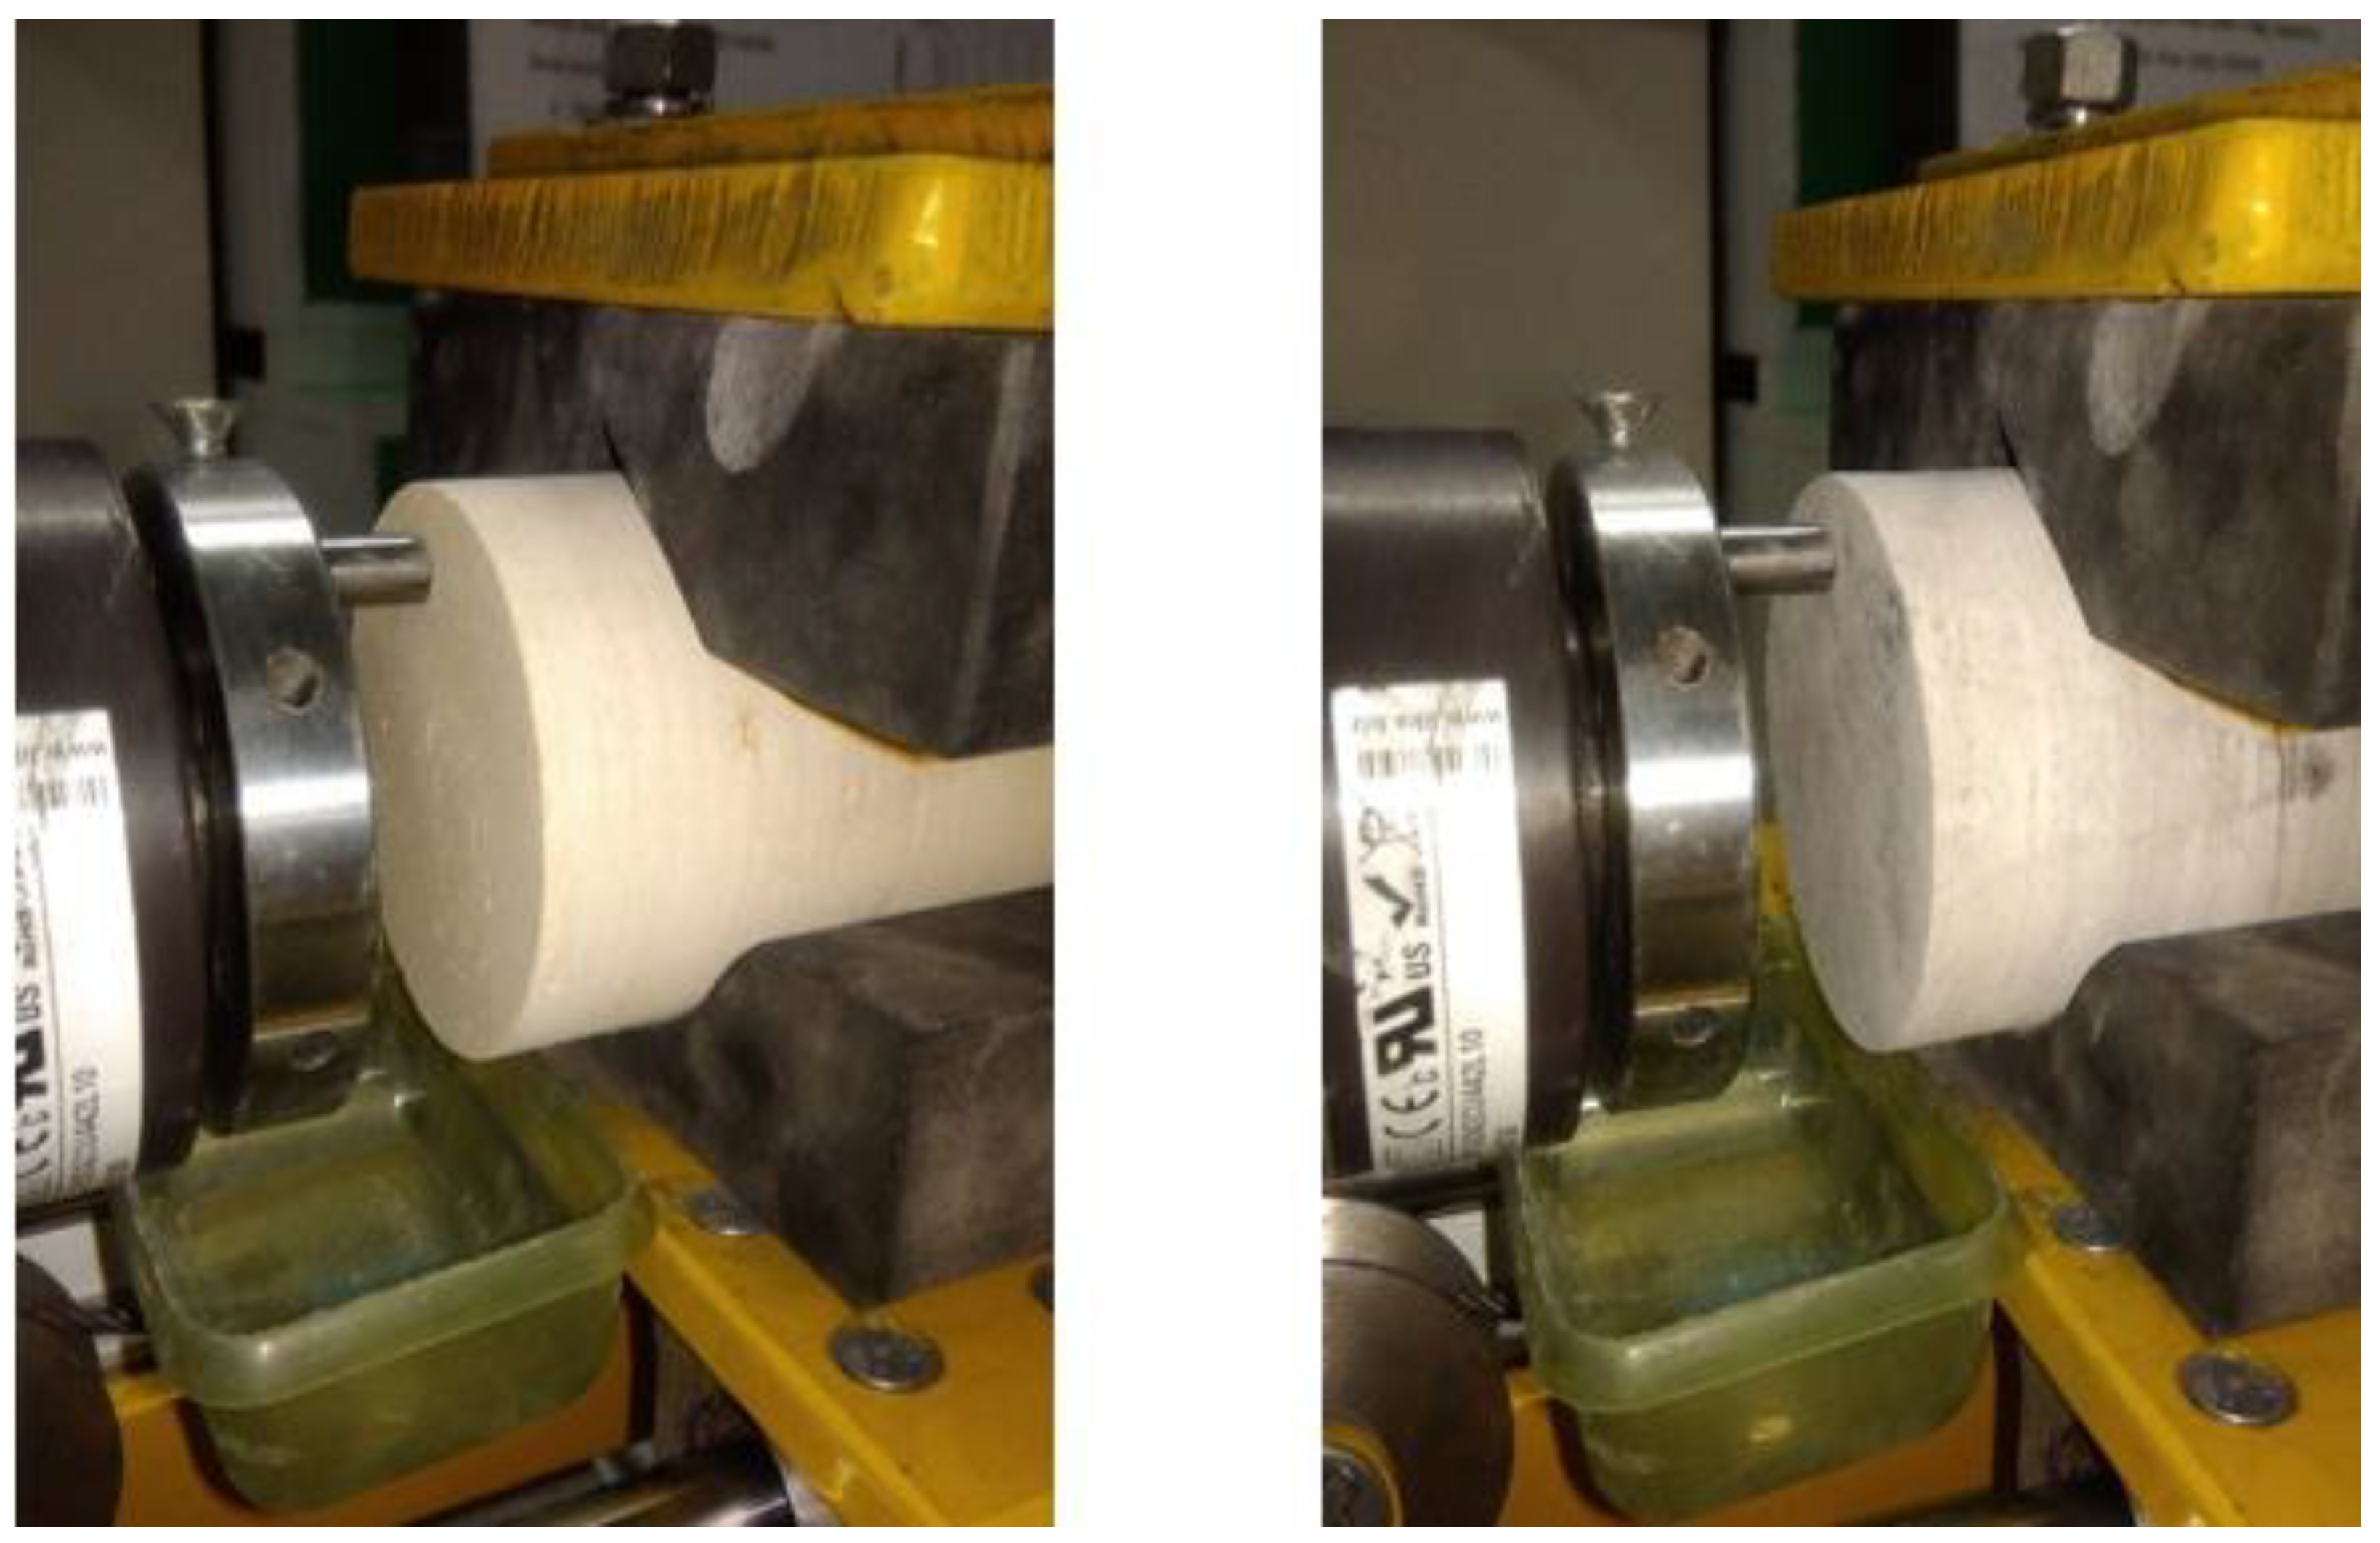
3.3. Analysis of Mechanical Properties

The considered mechanical properties of the tested sandstones were their uniaxial compression strength and tensile strength, which were determined using the Brazilian method, and abrasivity, which was determined using the proprietary rock abrasivity assessment method that has been described in several publications [3,12,18].
To determine the value of uniaxial compressive strength (UCS) for each tested sandstone, five cylindrical samples with a diameter and height equal to 50 ± 0.5 mm were prepared in accordance with the EN 1926:2007 standard. Laboratory tests were carried out using a testing machine in accordance with the PN-G-04303:1997 standard. The load was perpendicularly applied to the bedding planes at a constant stress rate of 1 ± 0.5 MPa/s. The uniaxial compressive strength (Rc) of each sample was expressed as the ratio of the failure load (F) and its cross-sectional area (A) before the test:
R c = F A MPa
The Brazilian method (BTS—Brazilian Tensile Strength Test) was used to determine tensile strength by compressing the cylinder on the side surface with two linear balancing loads. Loading the cylindrical sample perpendicular to the sample axis causes cracking along the surface passing through the cylinder axis and is mainly caused by tensile forces [19]. In this case, five cylindrical samples with a diameter of 50 ± 0.5 mm but a sample thickness of 25 ± 0.5 mm were also prepared for each tested sandstone, as the thickness to diameter ratio had to have been 0.5–0.6. The load was applied with a constant stress rate of 0.1 ± 0.05 MPa/s. The uniaxial tensile strength was determined as:
R t = 2 F π d h MPa
where Rt is uniaxial tensile strength, F is the maximum force at which the sample is destroyed, d is the diameter of the sample, and h is the thickness of the sample [20].
The third mechanical property that was determined for the tested sandstones was abrasivity. It was determined with a method comprising the assessment of the mass abrasive wear of a standard steel sampler that was in contact with a rock sample with a constant clamping force of 300 N and was moving in a uniform motion along a circle at a speed of 50 rpm for 8 min (Figure 5). The parameter characterizing rock abrasivity is the abrasivity index (Wz), which is defined as the ratio of the weight loss of the steel pin to the weight loss of the sample and is calculated as:
W z = M p a M p i
where Wz is the abrasivity index, Mpi is the mass loss of the rock sample, and Mpa is the mass loss of the steel pin [3,12,18].

4. Results

The tests were carried out following the previously established and above-described methodology. Petrographic properties were determined for seven types of sandstone and the values of selected parameters, enabling the determination of physical and mechanical properties.

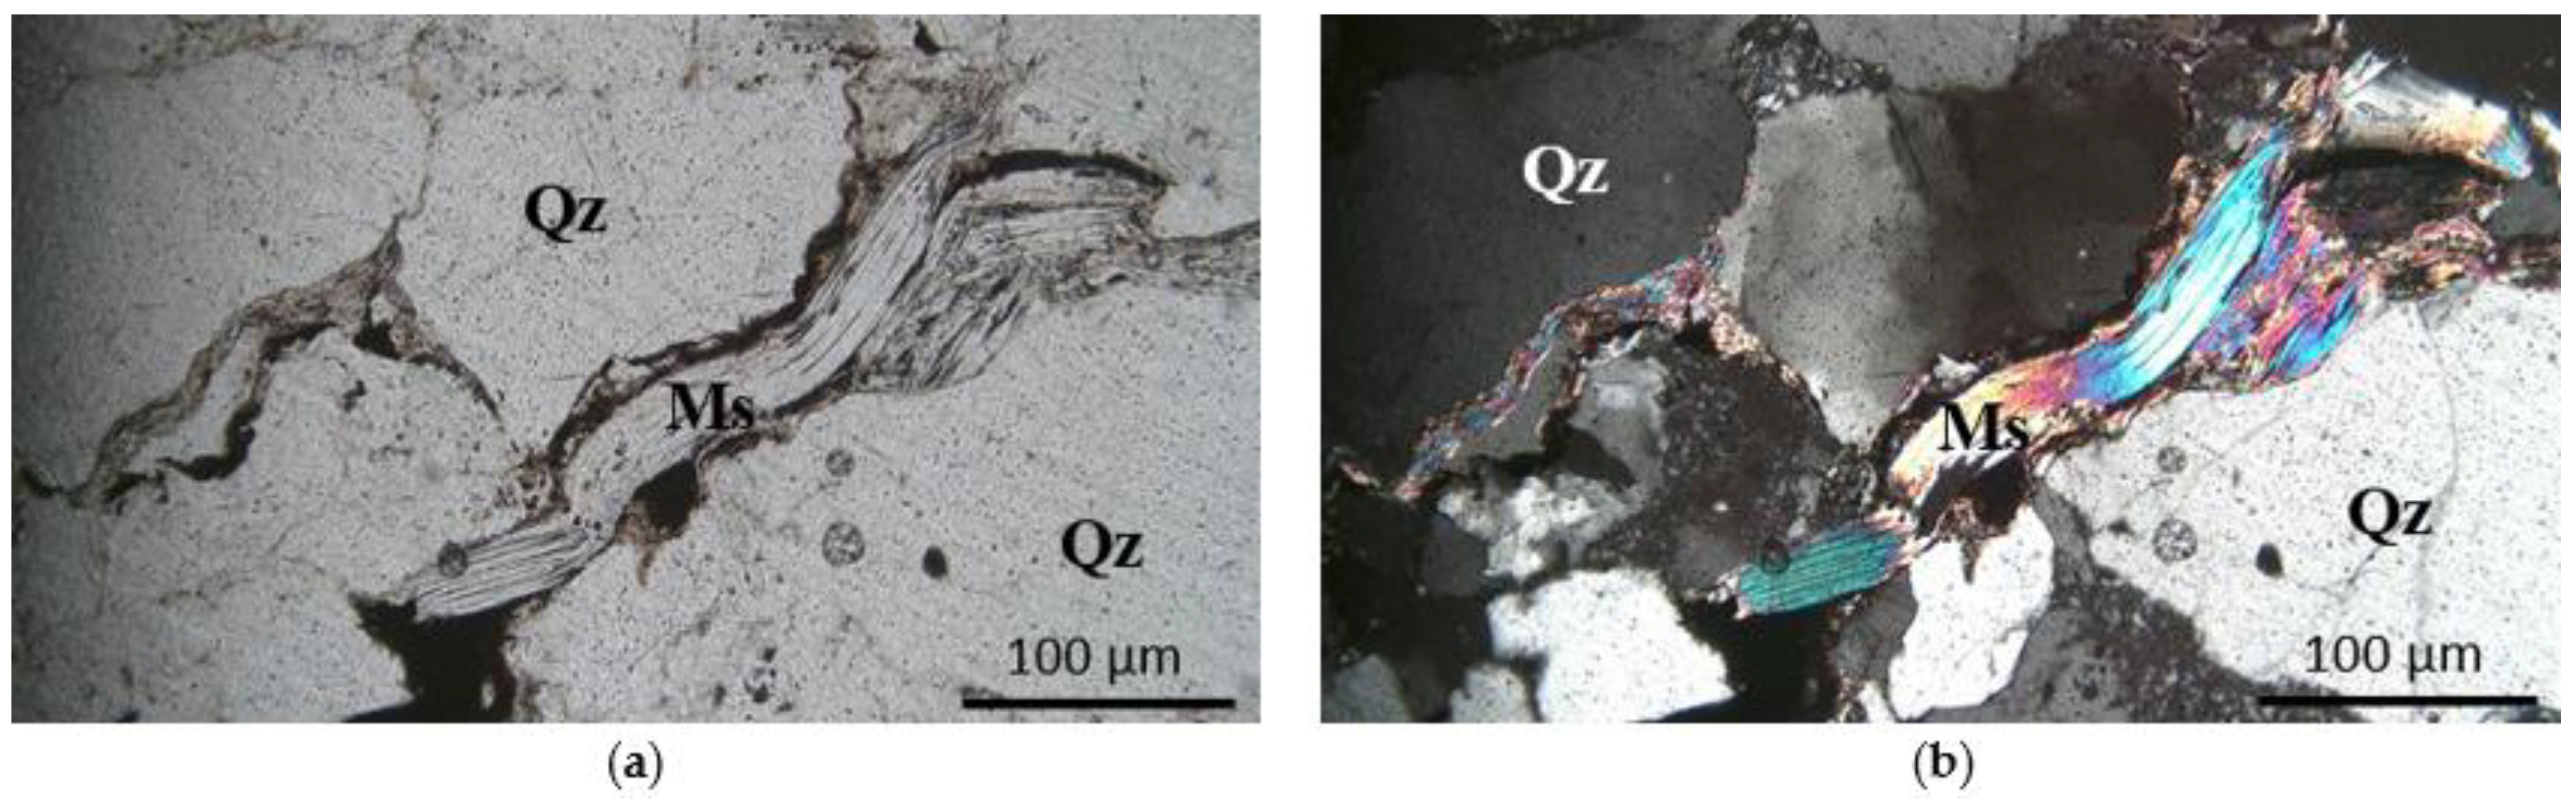
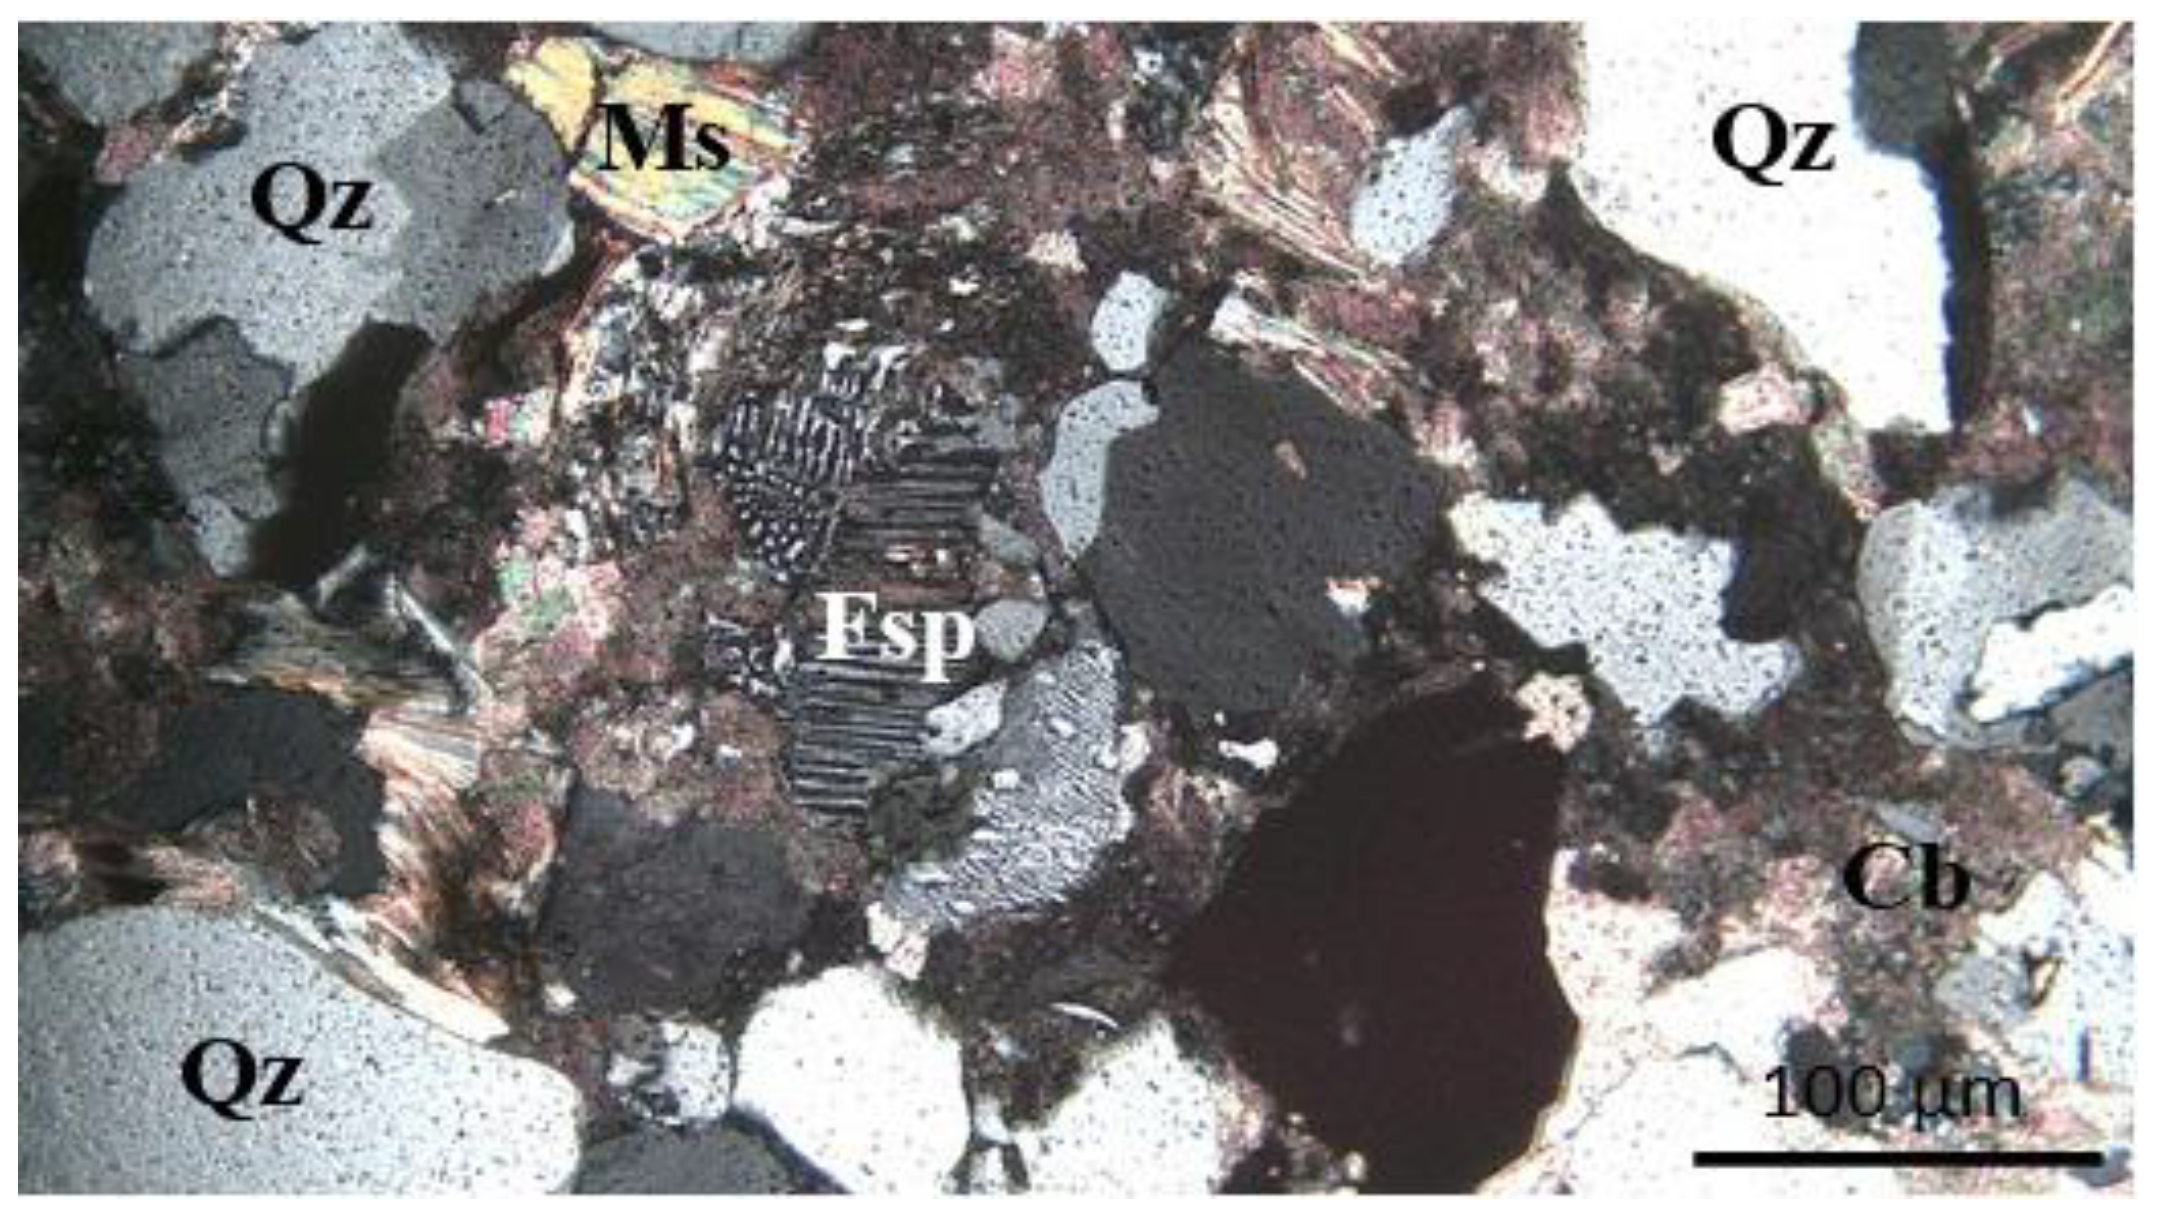
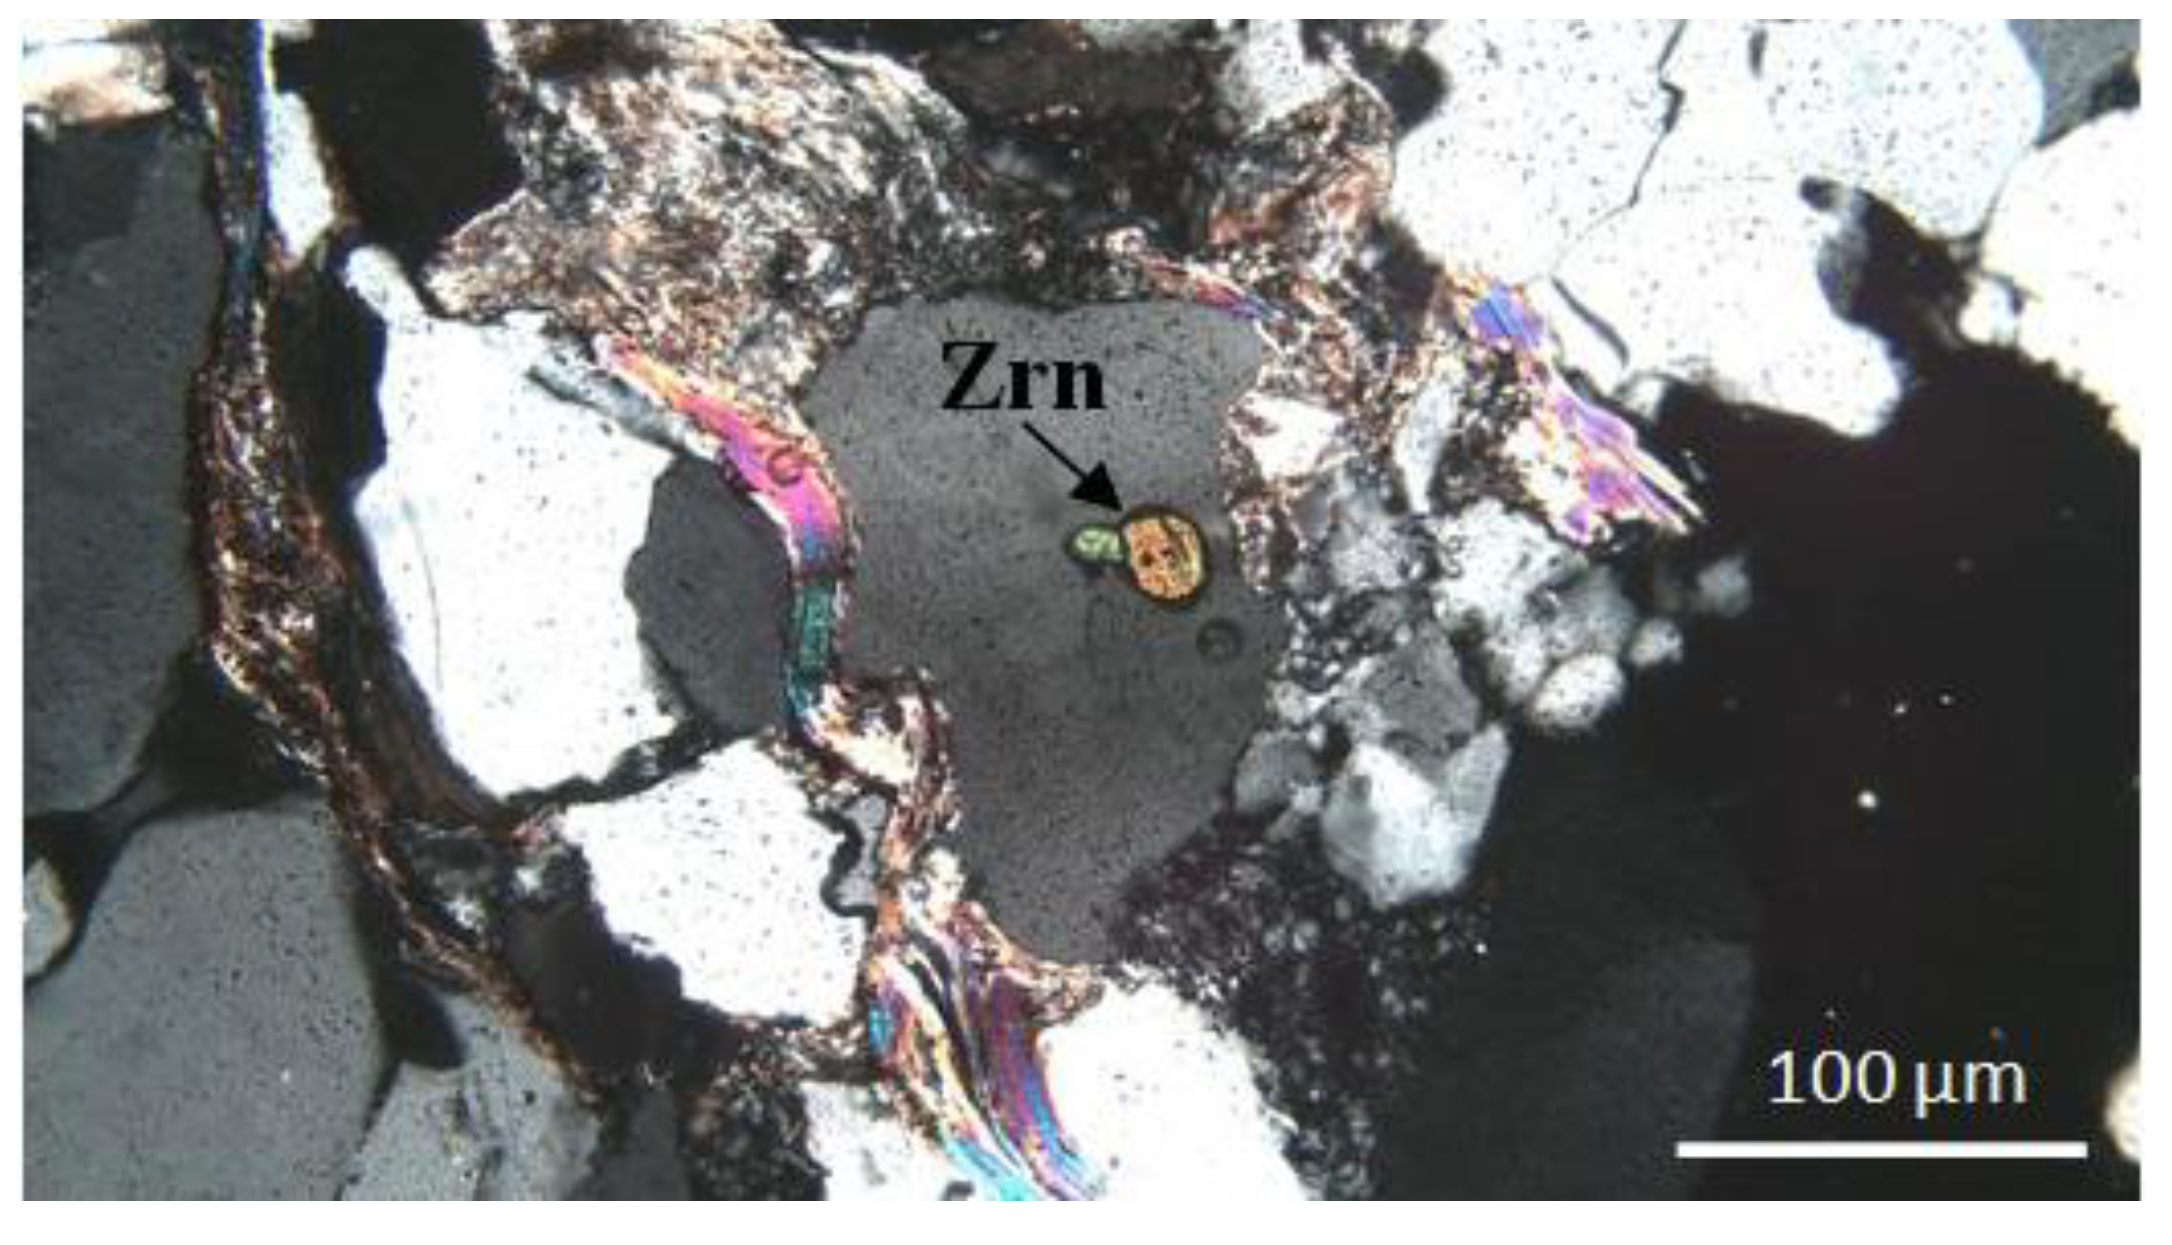
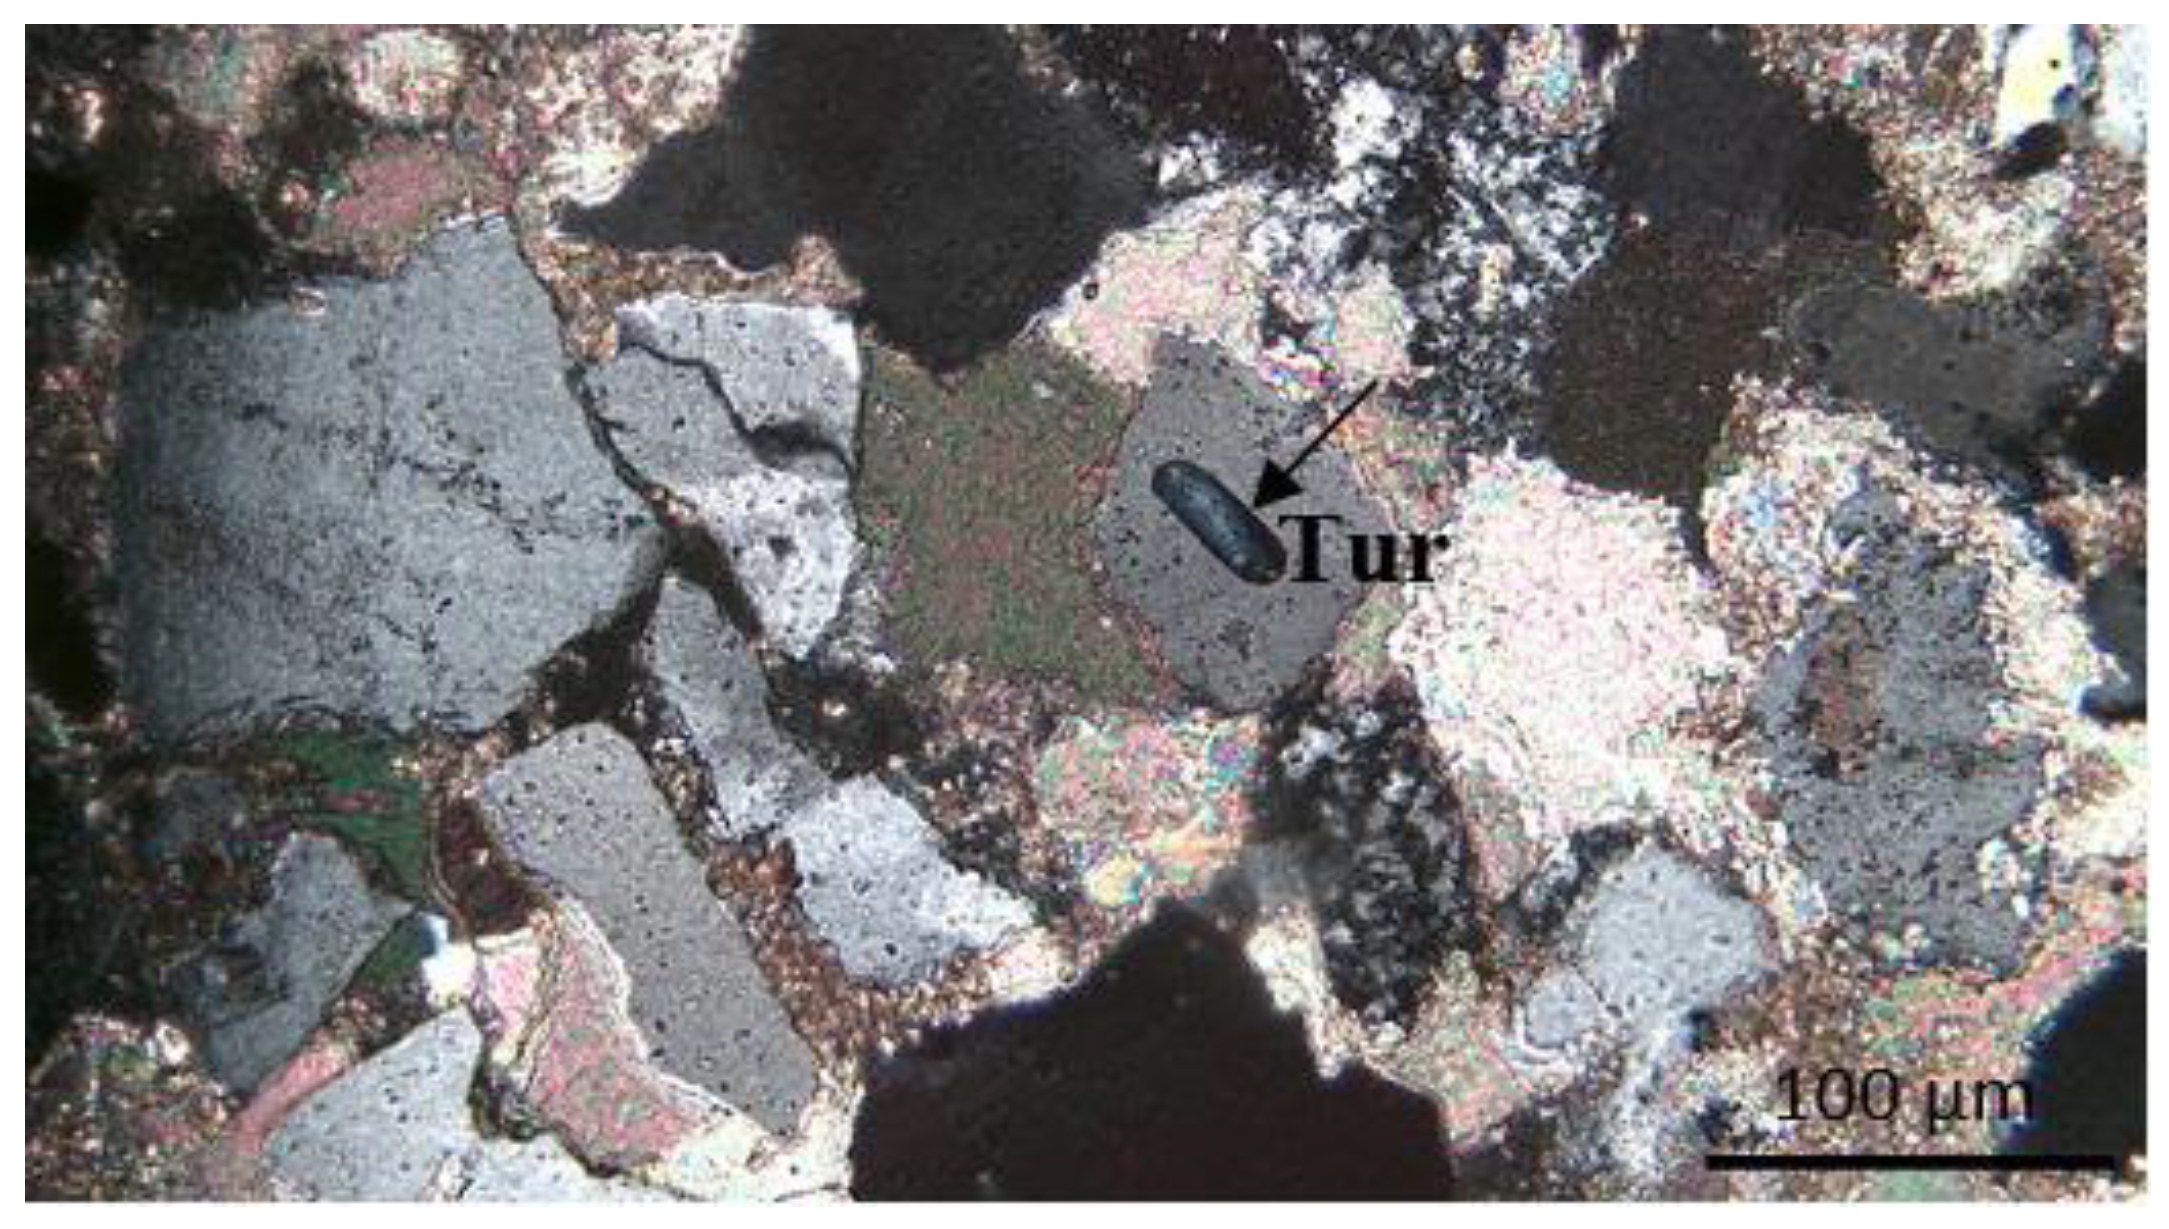
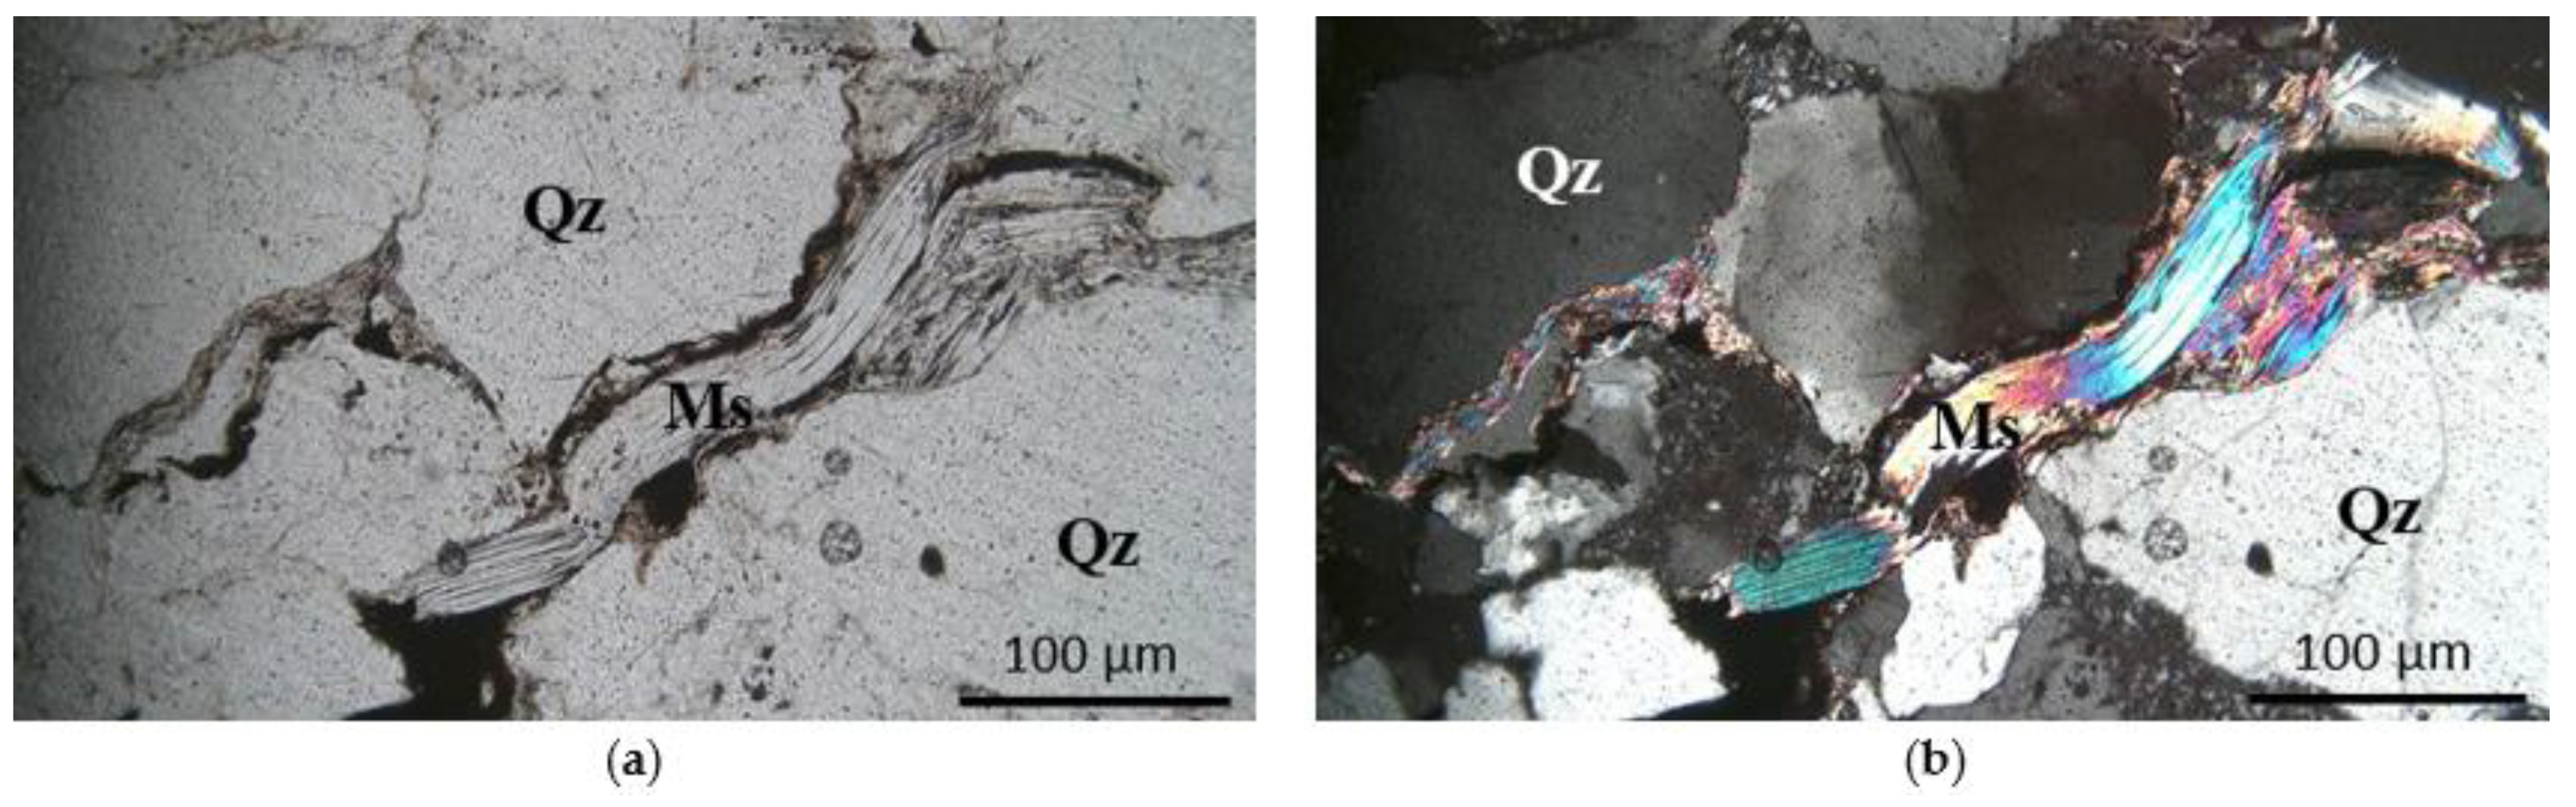
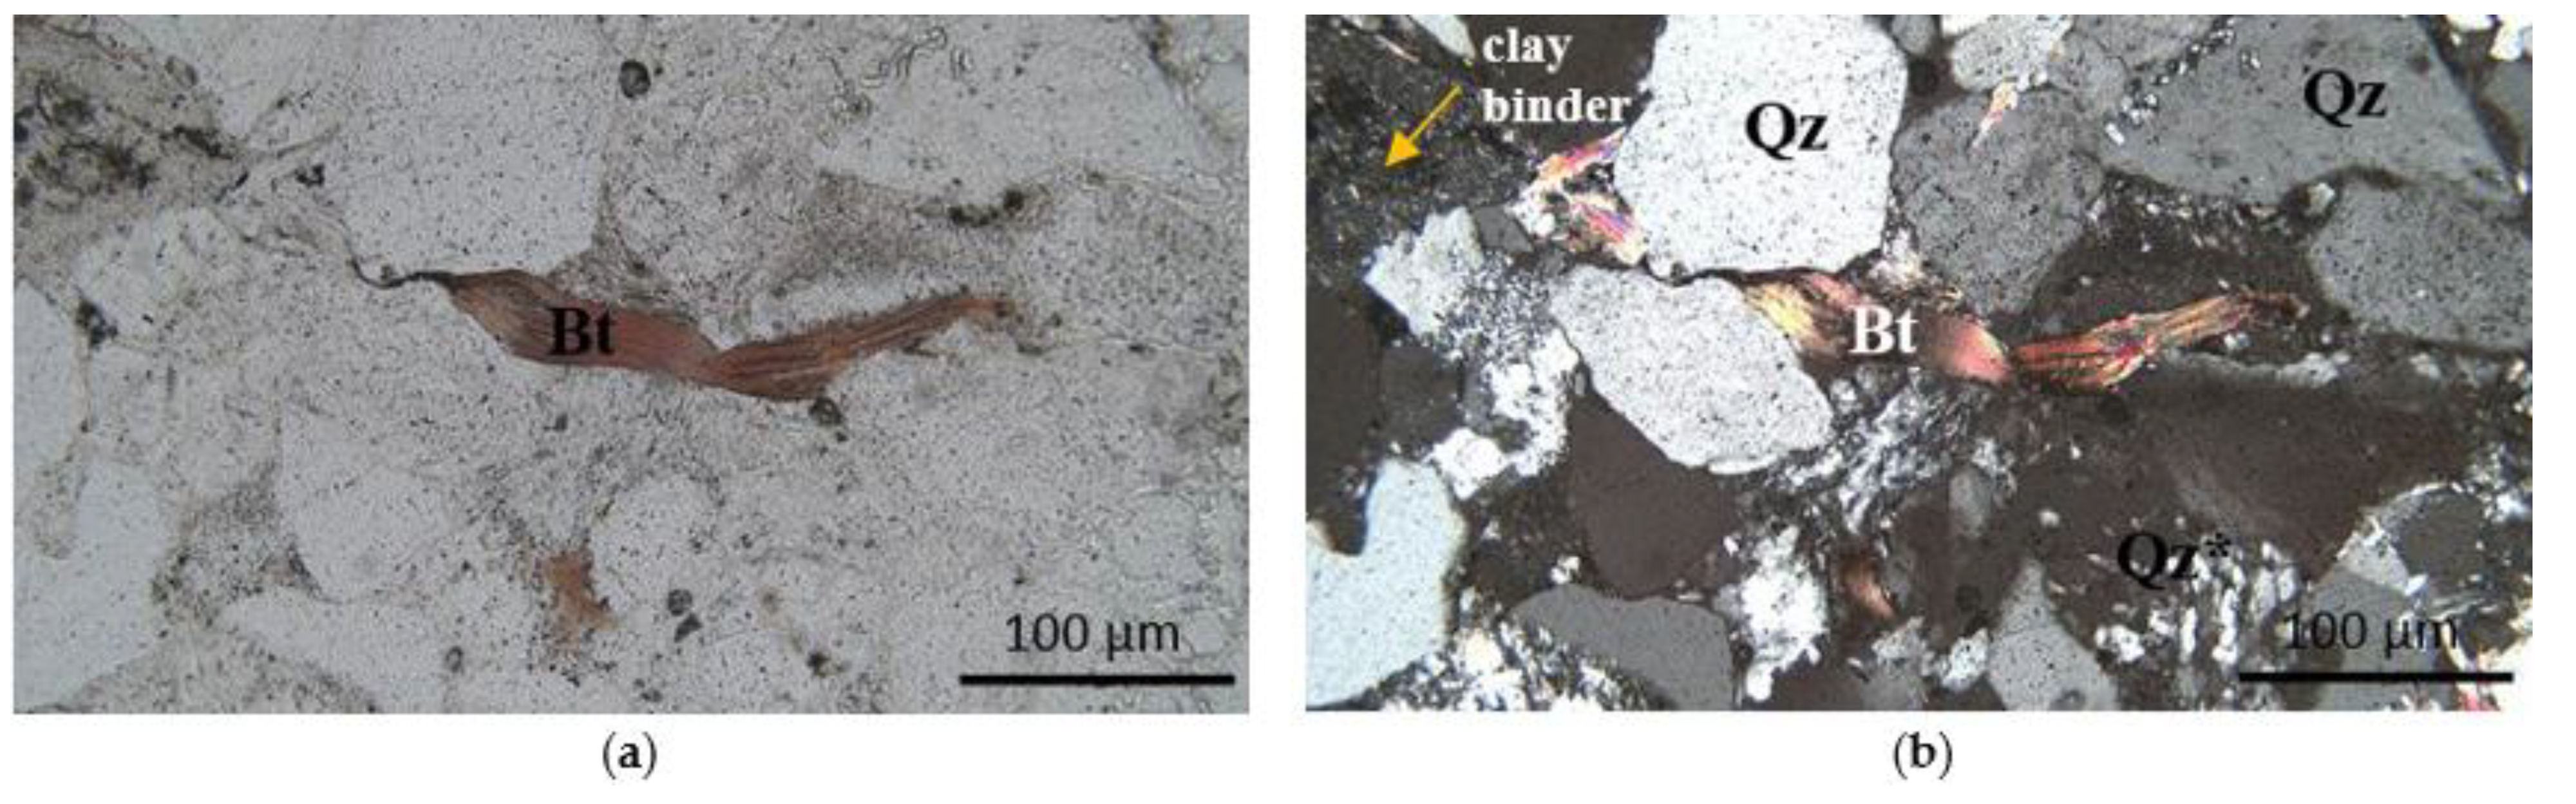
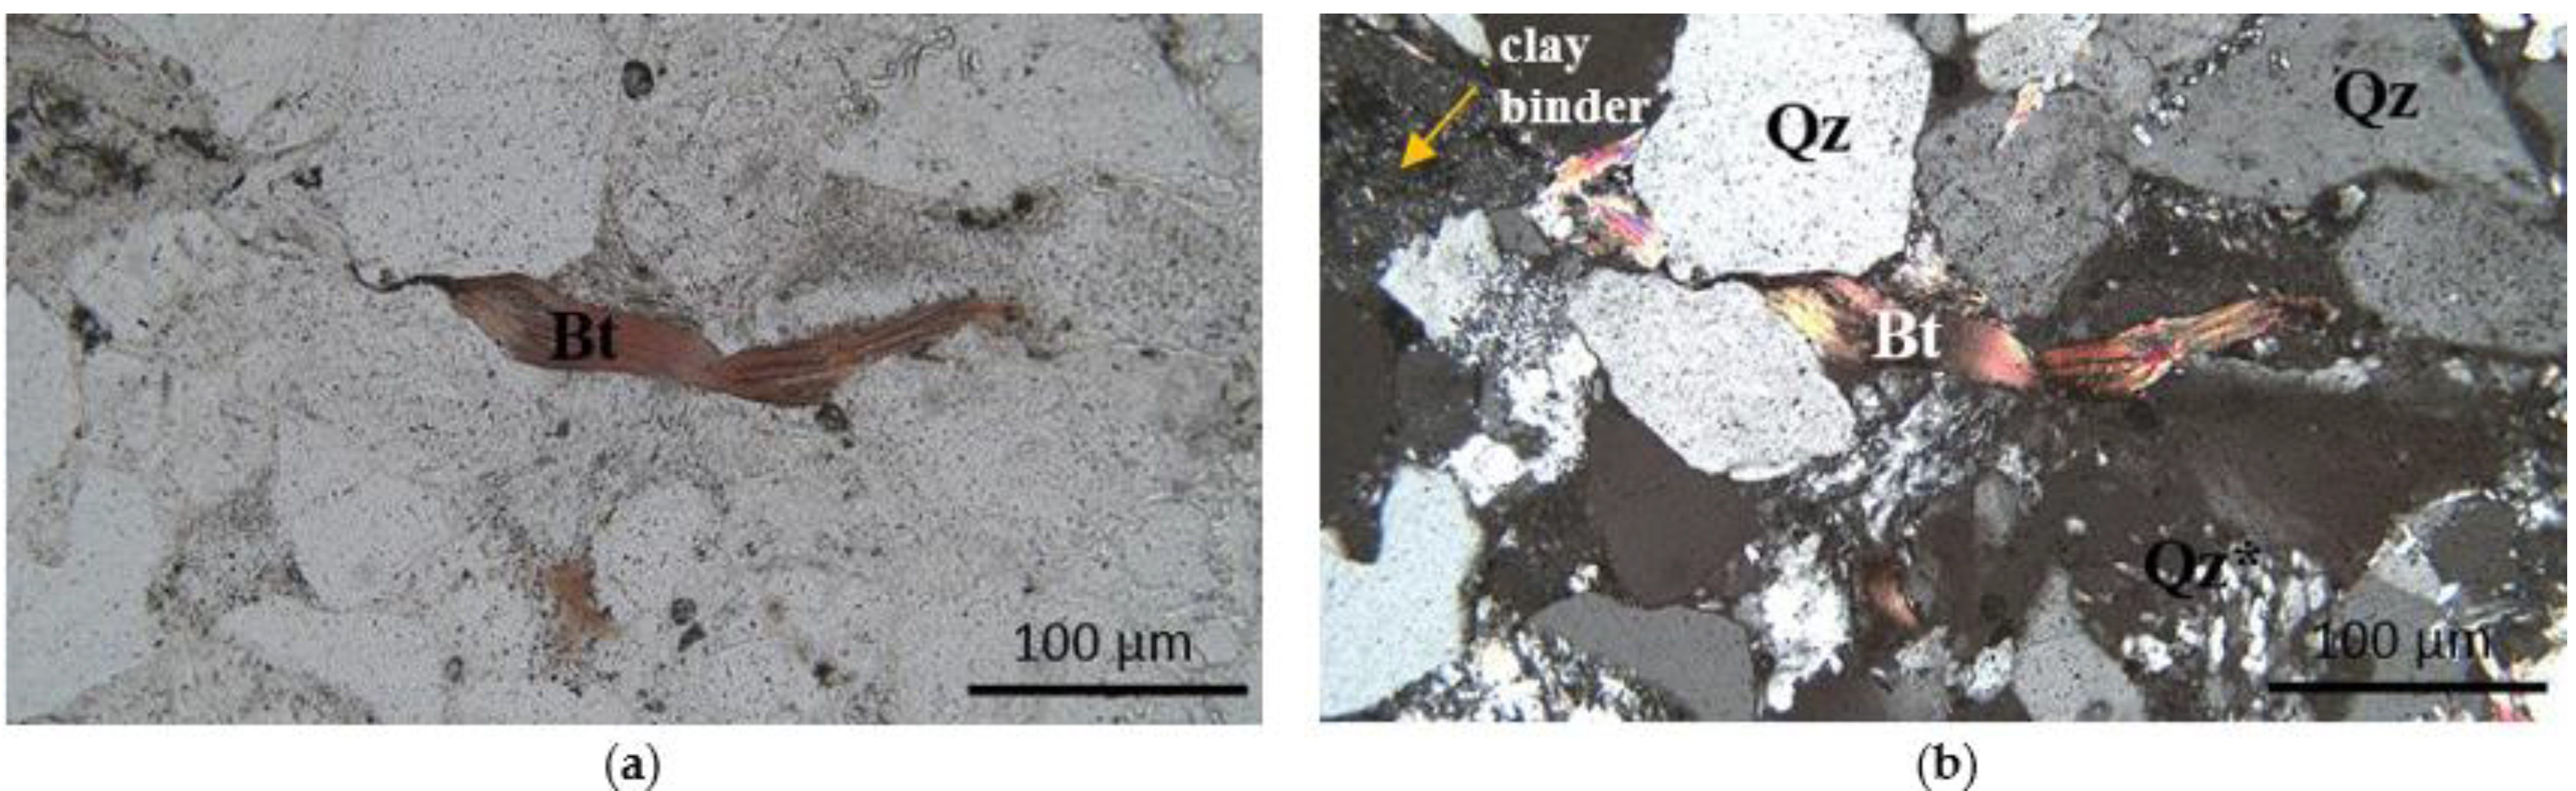
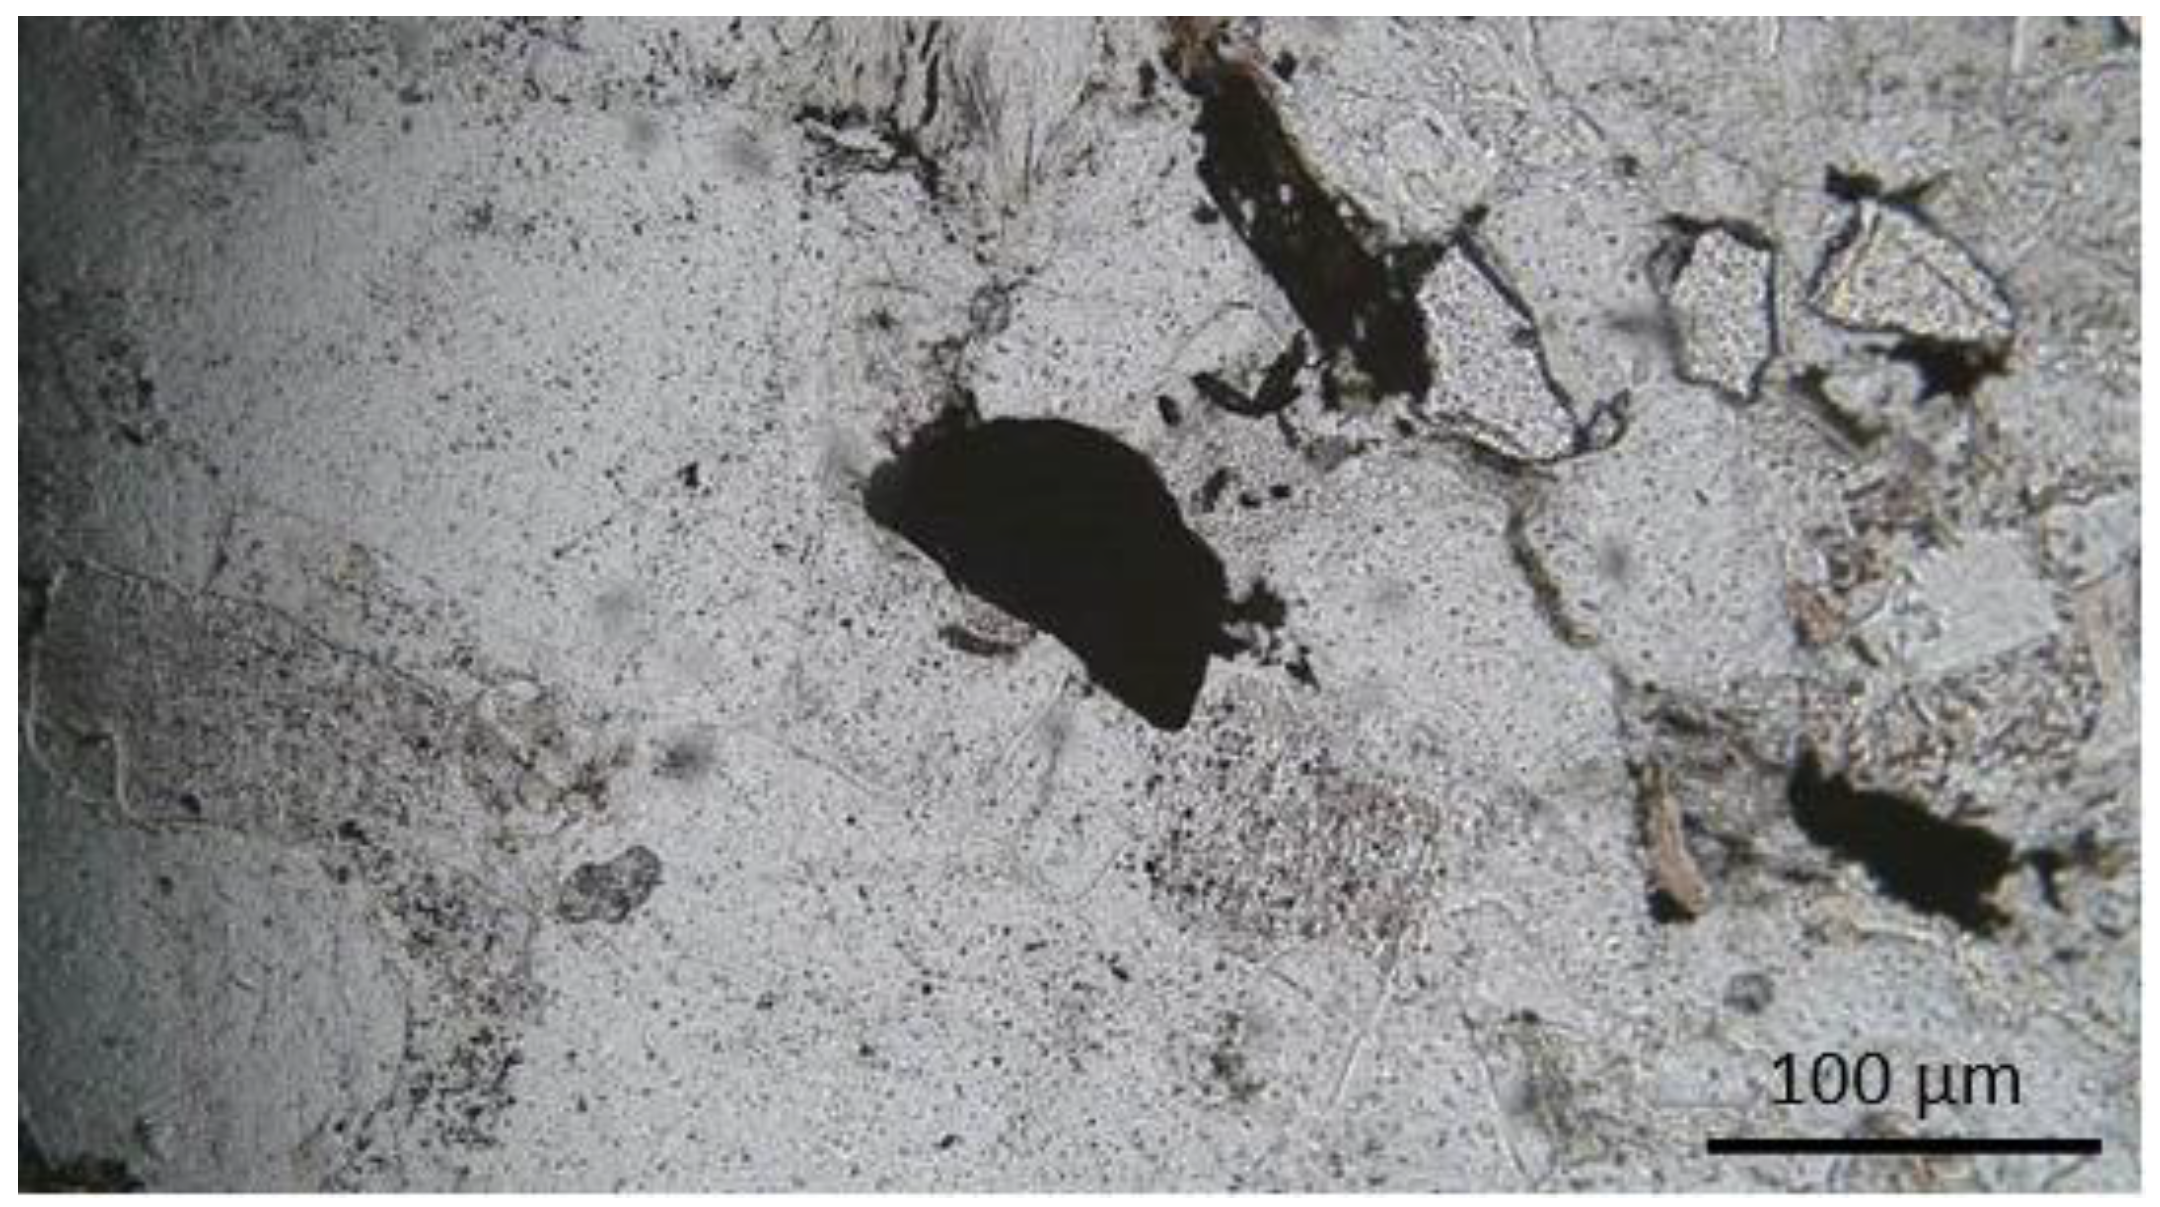
4.1. Mineralogical and Petrographic Characteristics of Sandstones

The analysis of the mineralogical and petrographic features of sandstones was carried out based on macroscopic observations, microscopic observations in transmitted light, and planimetric analysis. Macroscopic observations showed that the analyzed sandstones had similar features (Figure 6).
The sandstones were light to dark grey. Their structure was psammitic and fine-grained, and the degree of sorting of crumb material was high. The texture of the sandstones was usually dense and disorderly. A directional texture could be seen in some sandstones and was caused by fine laminates of a carbonaceous matter. Next to them, carbonaceous matter was observed in crumbs of irregular shapes and a scattered form throughout the rock volume as a pigment.
Macroscopically, in the mineral composition of sandstones, transparent or grey grains of quartz could be seen and were characterized by a glassy luster, pink feldspar grains with a matte luster, and single grains of mica: biotite with black color and transparent muscovite with a visible pearly luster. When in contact with moisture, the mortar could be smelled, which indicated the presence of clay minerals in the binder.
A detailed analysis of the mineral composition of sandstones was conducted during microscopic observations in thin sections. The mineral composition of the crumb material included quartz, muscovite, biotite, plagioclase and heavy minerals. The binder was represented by microcrystalline quartz, clay minerals, and carbonate minerals. An admixture of a carbonaceous matter was found in each tested sandstone.
Quartz grains were characterized by varying sizes from 0.1 to 1 mm and varying degrees of coating. Next to individuals with rounded edges, sharp-edged grains could be seen. Previous research indicates that sharp-edged quartz grains arise due to crushing larger individuals exhibiting network defects whose weak structure promotes the disintegration into smaller fragments [21,22]. With one polar, the surface of quartz grains was often scratched and covered with a network of irregular cracks, and the presence of slight inclusions could also be noted. The occurrence of inclusions in quartz is a fairly common phenomenon; quartz originating from plutonic rocks most often contains liquid and gas inclusions, while quartz of volcanic rocks is rich in glass inclusions. With crossed polars, optical anomalies caused by dynamic deformations of the quartz network structure could be observed. The effect of this was a wavy quenching of light. As a result of this phenomenon, the surface of individual grains was fragmentarily, not evenly, quenched, which was visible as locally quenched spots within the grain (Figure 7). This is usually the effect of quartz deformation due to dynamic deformations caused by, e.g., tectonic movements.
The micas were primarily represented by well-preserved muscovite grains that create idiomorphic and elongated forms, often bent on contact with other minerals. At one polar, muscovite was colorless with clearly visible unidirectional cleavage (Figure 8).
In addition to muscovite, biotite was found in smaller amounts in the tested sandstone. The biotite grains were strongly weathered, often with jagged edges, and rarely well preserved, and idiomorphic crystals could be observed. At one polar, biotite had a reddish to dark brown color and strong pleochroism. One-way cleavage was visible on the surface of the grains (Figure 9). The cleavage cracks were usually filled with biotite-weathering products, often emitting iron oxides. For some specimens, it was observed that iron oxides could also focus on the periphery of the grains, forming black borders around them. This phenomenon is called “opacite fringes”.
Feldspars formed table-like grains that were strongly weathered. Often, the edges of the grains were ragged and their surface was scratched. There were also signs of sericitization, i.e., the formation of sericite (a small-grain variety of light mica) due to the transformation of feldspar grains. Fine sericite plates usually formed in feldspars according to their cleavage planes. For feldspars, the phenomenon of peritite formation (on the micropertite scale) was also characteristic and is associated with the heterogeneous chemical composition of individual feldspar grains (Figure 10). The feldspars formed a series of mixed crystals with sodium and potassium and calcium cations. Because sodium and potassium are not diadochic elements, they cannot freely substitute in the structure of minerals. However, due to the significant network tolerance of feldspar structures, sodium–potassium feldspar crystallizing at high temperatures can produce a continuous series of homogeneous mixed crystals. As a result of lowering the temperature, these crystals become unstable and are mixed into more potassium feldspar with sodium and sodium feldspar with potassium [23]. During microscopic observations, fine lamellas were observed to be arranged parallel to each other within single feldspars. The way they generally develop depends on the conditions of temperature decrease during feldspar crystallization; the slower this process is, the thicker the structures of veins generally are.
In the group of feldspars, plagioclases could be distinguished. They formed fine grains with grey interference colors and polysynthetic twinning (Figure 11).
Heavy minerals were mainly represented by zirconium grains (Figure 12). Zirconium was found in the form of well-coated, oval, colorless grains with characteristic black pleochroic borders. Pleochroic borders or fields testified to the occurrence in the network structure of zirconium of substitutions of radioactive elements, mainly thorium and less often uranium. For crossed polars, the fourth order’s interference colors were characteristic of zirconium.
In the K2 sample, tourmaline grains were observed, forming characteristic elongated forms with rounded tops and not showing cleavage (Figure 13).
The sandstone binder represented a pore or primary type; its share ranged from 26% to 52.3%. It is a cement-type mixed binder in which the mineral composition was dominated by microcrystalline quartz, carbonate minerals, and clay minerals. No matrix type binder was found; in single samples only, these were small amounts associated with the presence of fine quartz grains.
The microcrystalline quartz created aggregates. Individual crystals were colorless, non-pleochroic with zero or slightly positive relief, and without cleavage (Figure 9).
Clay minerals formed microcrystalline aggregates with dark grey interference colors, often mixed with other binder components, e.g., carbonates (Figure 14).
Carbonates, like clay minerals, could occur in the form of microcrystalline aggregates or single, larger grains characterized by rhombohedral cleavage and variable relief (Figure 7).
Carbonaceous matter in the sandstones occurred in various forms. The elongated forms comprising laminates were macroscopically visible. Moreover, the presence of a dispersed carbonaceous matter in the form of a pigment, giving the sandstones a dark grey color, could be found. During microscopic observations, a carbonaceous substance was observed in the form of small crumbs (Figure 15).
Planimetric analysis (Table 1 and Table 2) showed varied contents of framework grain content in the tested sandstones. For the B1, L1, and J1sandstones, the framework grains’ contentswere75, 74, and 73%, respectively. The second group consisted of K1 and K3 sandstones, where the framework grains’ contents were 70.9 and 69.7% respectively, and the third group consisted J2 and K2 sandstones, where the framework grains’ contents were the lowest at 58.5 and 47.7%, respectively.
The dominant component in the crumb material was quartz (the K1 sandstone had the highest percentage of 61.5%, while the K2 sandstone had the lowest percentage of 45.7%); next were minerals from the group of feldspars (1.0–5.2%) and mica: muscovite (3.0–6.7%) and biotite (5.1–9.4%). Heavy minerals during observations in thin sections were found in only two sandstone samples, and their quantitative share was about 1%. The presence of rock crumbs (3%) was determined in a single sample.
According to the content of framework grains, the B1sandstone (25%) had the lowest percentage of binder, while the K2 sandstone had the highest (52.3%). Microcrystalline quartz, clay minerals, and carbonates were found in all sandstone samples in the binder. Their content varied within relatively wide limits: 2.9–15.3% for microcrystalline quartz, 3.8–15.6% for clay minerals, and 2.2–45.6% for carbonates. One sample was found to have a ferruginous binder (3%). In all sandstones, the binder was of a mixed type. However, the dominant component could be indicated. The binders of the K1, K3, and L1 sandstones were clay minerals—14.2, 11.6, and 15.6%, respectively. The second group comprised the J1 and B1sandstones, where the binder was full of microcrystalline quartz (J1: 15.3%; B1: 9.3%), while carbonates dominated the K2 and J2 binder sandstones. For the K2 sandstone binder, the content of carbonates was found as high as 45.6%.
Carbonaceous matter was observed in various forms among the sandstone components. Its content ranged from 3.0 to 5.2%.
The results of planimetric analysis enabled the classification of sandstones (Figure 16 and Figure 17). For this purpose, two triangular classifications were used: according to Folk and according to Dott–Pettijohn geological classification [24,25].
According to the Folk classification, the tested sandstones were classified as sublitharenite, while according to the Dott–Pettijohn classification, they were classified as subarcoses. Only the K1 sample, according to both classifications, was included in the quartz arenite group.

4.2. Characteristics of Physical and Mechanical Properties of Sandstones

The results obtained from the determination of the bulk density, effective porosity, and water absorption coefficient of seven types of sandstone are presented in Table 3. The table summarizes the average values of five replicates for the determination of a given parameter.
It can be seen that the highest effective porosity was found in the B1 and L1 sandstones at over 8%. This porosity was almost twice as high as for other sandstones. On the other hand, the most negligible effective porosity was in the K2 sandstone at only 1.5%. As can be seen, the porosity of individual sandstones directly affected their water absorption (Figure 18). The highest values of the water absorption coefficient were found in sandstones with the highest porosity, i.e., B1 and L1. Their water absorption coefficient was over 3%. The lowest values of the water absorption coefficient belonged to the K2 and J2 sandstones, and their coefficients were below 1%. While analyzing the bulk density of the tested sandstones, it could be seen that it was inversely proportional to both the effective porosity (Figure 19) and the water absorption coefficient. The highest bulk density was characteristic of the K2 and J2 sandstones at over 2.6 g/cm3, while the lowest density was found in theJ1, B1, and L1 sandstones and at below 2.3 g/cm3.
Table 4 presents the results obtained from the determination of uniaxial compressive and tensile strength, as well as the values of abrasivity indexes. As mentioned above, the tests were performed in five replicates for each sandstone, and the average values are summarized in the table. Due to uniaxial compressive strength values, the vast majority of the tested sandstones belonged to the rocks with a low uniaxial compressive strength [19], with values in the range of 20–30 MPa. Only the J2 sandstone had an average compressive strength of over 60 MPa. Comparing uniaxial compressive strength (UCS) with tensile strength (BTS), a linear relationship could be seen between these properties (Figure 20). The J2 sandstone with the highest uniaxial compressive strength also had the highest uniaxial tensile strength of over 6 MPa. The uniaxial tensile strength of other sandstones was in the range of 2.8–3.6 MPa. Analyzing the values of the abrasivity indexes (Wz) showed that the most abrasive sandstone wasK1, whose index was almost 4, which identifies it as a rock with a high abrasivity. The J1 sandstone was classified as medium abrasive. The most abrasive sandstones are K3, L1, J2 and B1. Only the K2 sandstone had a very low abrasivity index. Sandstones were classified based on the classification included in Mucha’s publication [3]. In addition, it could be seen that there was no clear relationship between uniaxial rock compressive strength and abrasive properties (Figure 21).

4.3. Influence of Petrographic Properties on Abrasive Properties of Tested Sandstones

The influence of the quartz percentage (Figure 22) and the binder (Figure 23) on the abrasivity of the tested rocks was also analyzed. In this case, it was only possible to compare the average values of the Wz index with the results of the petrographic analysis on the charts because analyses were performed once for each sandstone. However, in the case of the tested sandstones, it could be seen that the more quartz and minor binder (sample K1), the more abrasive the sandstone was. A similar dependence was also noticed by West [26].
However, in the case of the tested sandstones, the results did not clearly show this. For the K1, K3 and J1 sandstones, the quartz percentage was about 60% and the cement percentage was about 30%, but the sandstones significantly differed in their abrasive properties (the value of the Wz index). Hence, it can be assumed that another crucial factor influences the abrasivity index’s value. This factor could be the size of the quartz grains, as indicated by the research results of Kotwica [2], Käsling and Thuro [13], and Yarali et al. [27].

5. Discussion

Carboniferous sandstones’ physical and mechanical properties partially depend on the mineral composition, including the qualitative differentiation of components and their mutual quantitative relations, rock structures (with particular emphasis on the size of the mineral of the framework grains), and the degree of weathering of the rocks.
In the case of the tested Carboniferous sandstones, these relationships were particularly visible when analyzing the results of determinations of mechanical properties, i.e., strength and abrasivity tests. The mineral composition of the rocks played a crucial role in both cases. However, the uniaxial compressive strength test results did not show too much differentiation. The range of uniaxial compressive strength results was 19.4–30.1 MPa, which designates the tested sandstones as rocks of low strength (Polish standard specifies the range of 15–60 MPa for rocks of poor strength for uniaxial compressive strength). Only in the J2 sample did the value of this parameter slightly exceed the limit of 60 MPa, which designates it as a rock with a medium uniaxial compressive strength. Similarly, a small range of results was obtained regarding tensile strength (Table 4). However, as already mentioned, the higher the sandstone’s compressive strength, the higher its tensile strength, which was confirmed by Nazir [28], Karaman [19] and Ribeiro [29].
An extensive range of results was obtained while determining the rock abrasivity. Due to the abrasivity index values, the tested sandstones could be divided into four groups: insignificant abrasivity (sample K2), low abrasivity (samples K3, J2, B1, and L1), medium abrasivity (sample J1), and high abrasivity (sample K1). Abrasivity is a property that, in the case of polymineral rocks, is the resultant of the hardness of individual minerals, especially those that form the grain skeleton of the rock. The mineral of crucial importance for sandstones is quartz—a weatherproof mineral with a hardness of 7 on the Mohs scale. Its content in the tested sandstones was on average 55.4%, which is typical of Carboniferous sandstones from the Upper Silesian Coal Basin—Łukaszewski’s reports [30] showed that sandstones from the Katowice region contain about 60% quartz.
In the case of the tested rocks, the largest group comprised sandstones with low abrasivity—samples B1, J2, L1, and K3. The abrasivity index ranged from 1.2 to 1.7, with a quartz content from 46.4 to 61.3% and a relatively high proportion of silica binder, the primary component of which was finely crystalline microcrystalline quartz (6.9–9.3%). The J1sandstone was a rock with a medium abrasivity. The abrasivity index for this rock was 2.4—which was slightly higher than the abrasivity index for the K3, J2, B1, and L1 sandstones—due to the high content of quartz (60.0%) and an equally high proportion of silica binder (15.3%). Extreme abrasivity index values were obtained for two samples: 3.9 for the K1 sample and 0.2 for the K2 sample, which means that the first one was ahigh abrasivity sandstone and the second one was an insignificant abrasivity sandstone.
The highest abrasivity of the K1 sandstone was directly related to it having the highest quartz content (61.5%) of the tested sandstones. The K1 sandstone was characterized by a high content of crumb material (70.9%) and a low binder content (29.1%). In addition, the good abrasive properties of the K1 sandstone also influenced various grain structures, especially the abundant quartz grains that were larger than 1 mm, estimated based on observations in thin sections. However, issues related to the sandstone grain size and thus the determination of exact quartz grain sizes requires additional analyses, which the authors will carry out in the next stage of tests.
On the other hand, it was noted that the K2 sandstone had the lowest content of crumb material (47.7%), with a binder share of 52.3%. These values also directly led that K2 sandstone has the highest density value and lowest porosity (1.5%) and water absorption (0.58%) values of the tested samples.
The tested sandstones were also diverse in terms of their physical properties. Their density remained at the level of about 2.3 g/cm3. Only the K2 and J2 sandstones were characterized by higher densities of 2.69 and 2.62 g/cm3, respectively. They were much more diverse in porosity, ranging from 1.5% to 10.1%. In the case of the tested sandstones, the variable porosity was also associated with different water absorption values, which ranged from 0.58% to 3.88%. It can be seen that the quantity of binder had the most significant impact on porosity and water absorption, which was confirmed by the results of theB1 sandstone, which was characterized by the highest porosity value, water absorption value, and (thus) the smallest amount of binder with the highest content of crumb material. A similar relationship was noticed by Karman and Kesimal [31] when examining 22 types of rocks from the Black Sea region.
The results presented in this paper are directly connected to the rock workability of the tested sandstones. The K1, K3, and J1 sandstones were characterized by a high quartz content of 60%, a small amount of binder (28%), and a high abrasivity index Wz of 1.7–3.9. As a result, the K1, K3, and J1 sandstones were classified as middlingly hard to cut rocks. On the other hand, the J2sandstone—despite a lower quartz content (46.4%) and therefore higher amount of binder (41.5%) and abrasivity index value Wz = 1.5 but high compressive strength (64.6 MPa)—could also be classified as a middlingly hard to cut rock. The B1 and L1 sandstones, which had a quartz content of 56%, a binder amount of about 25%, a compressive strength value of 20–30 Mpa, and an abrasivity index value of Wz 1.2–1.6, could be classified as easy to cut rocks. Finally, the K2 sandstone, which was characterized by the lowest quartz content (45.7%), the highest binder content (52.3%), and the lowest abrasivity index Wz (only 0.2), could be classified as a very easy to cut rock. The rock workability classification was based on the efficiency and quantity of wear tools in excavations from which samples were taken. Detailed results were published by Mucha [3,12].
The above analysis was aimed to indicate how to improve cutting efficiency in mines from which the tested samples were taken, the properties of mined rocks have an especially significant influence on selecting appropriate cutting tools. The higher the compressive strength and abrasivity index value, the faster the tool is worn [3,27,32]. Thus, a tool of better quality with special protection should be selected, e.g., in the form of a particular hard-faced layer or sintered carbide rings [2,33]. If a cutting tool has better durability, the adequate working time of the mining machine becomes longer [4,34] and the energy demand decreases [35].

6. Conclusions

Based on the conducted petrographic tests and the determinations of selected physical and mechanical properties, it was found that:
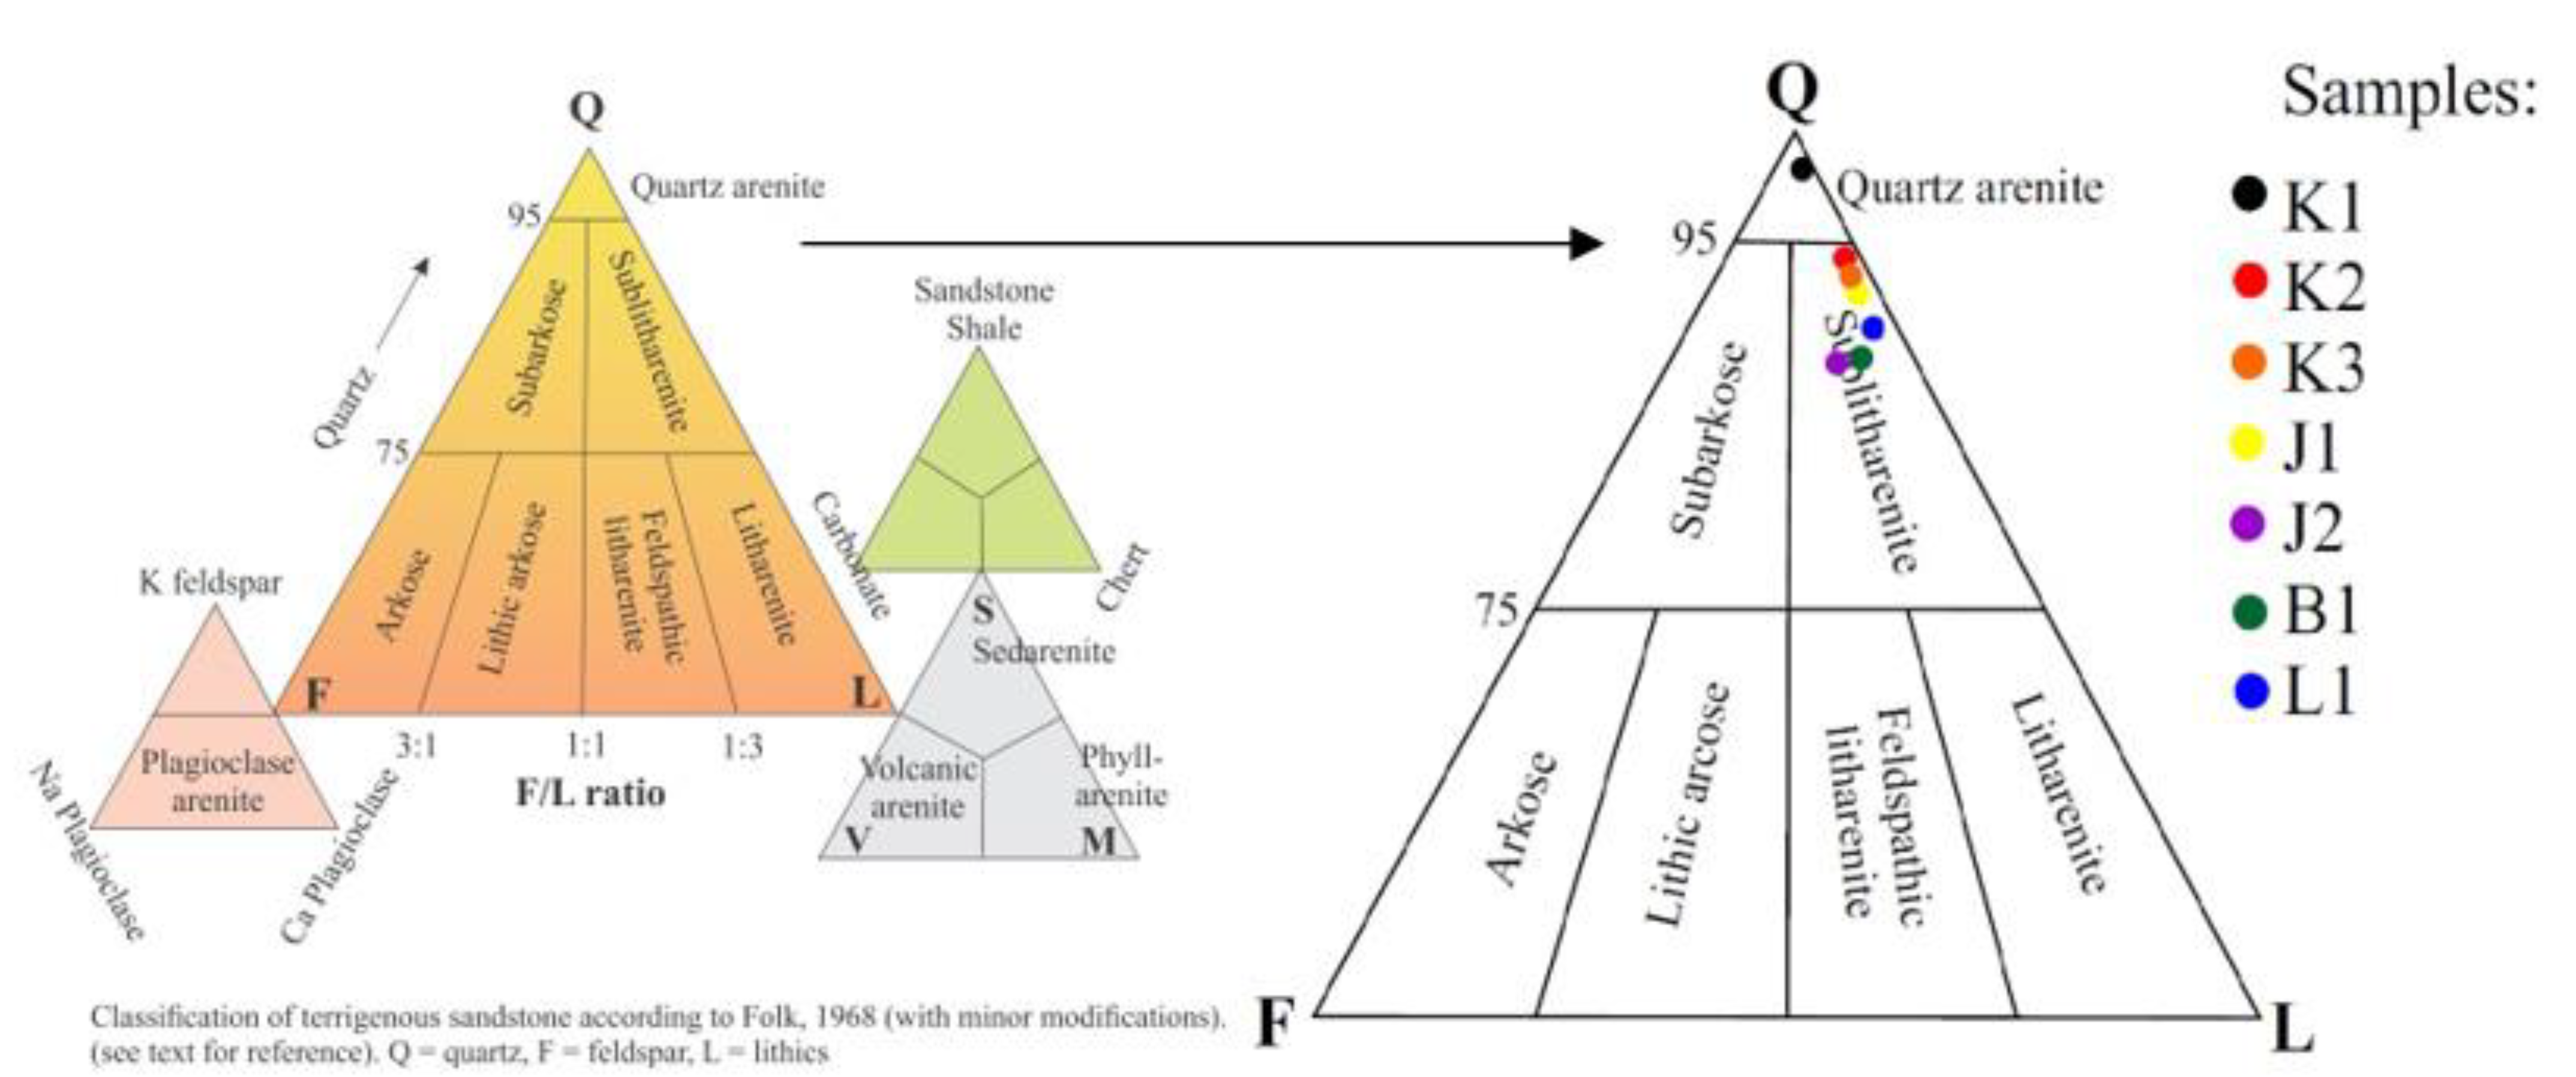
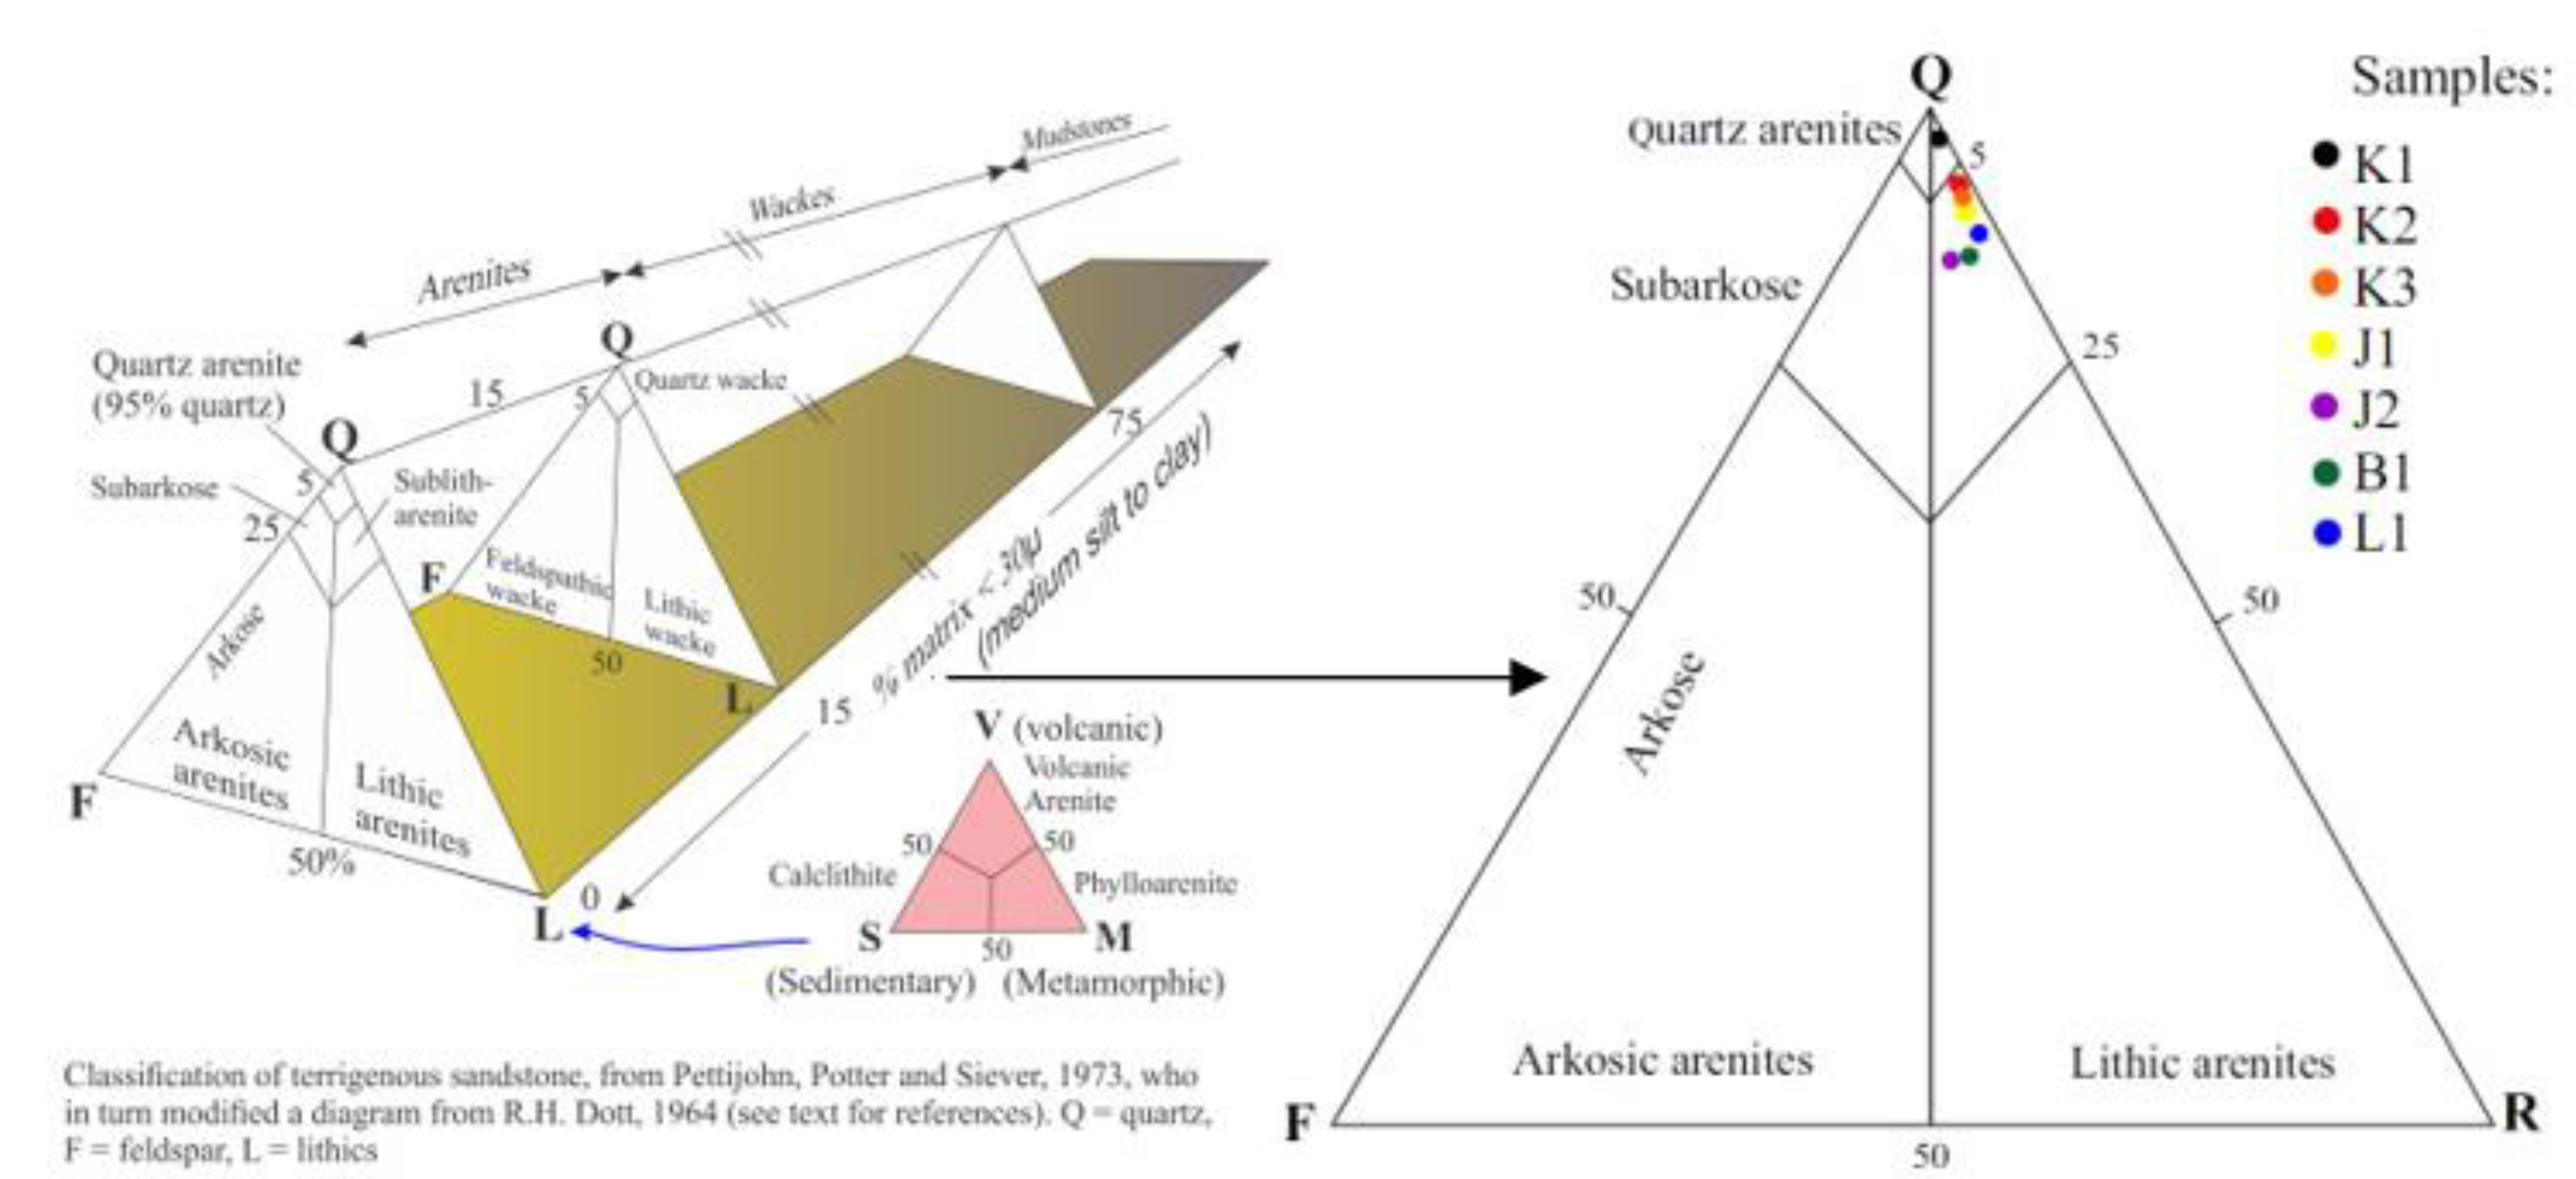
  • According to the Folk classification, the sandstones were classified as sublitharenite, and according to the Dott–Pettijohn classification, sandstones were classified as subarcoses. The exception was sample K1, in which both classifications represented quartz arenite.
  • Along with the decrease in the size of minerals and the increase in the amount of binder, the strength properties of sandstones increased.
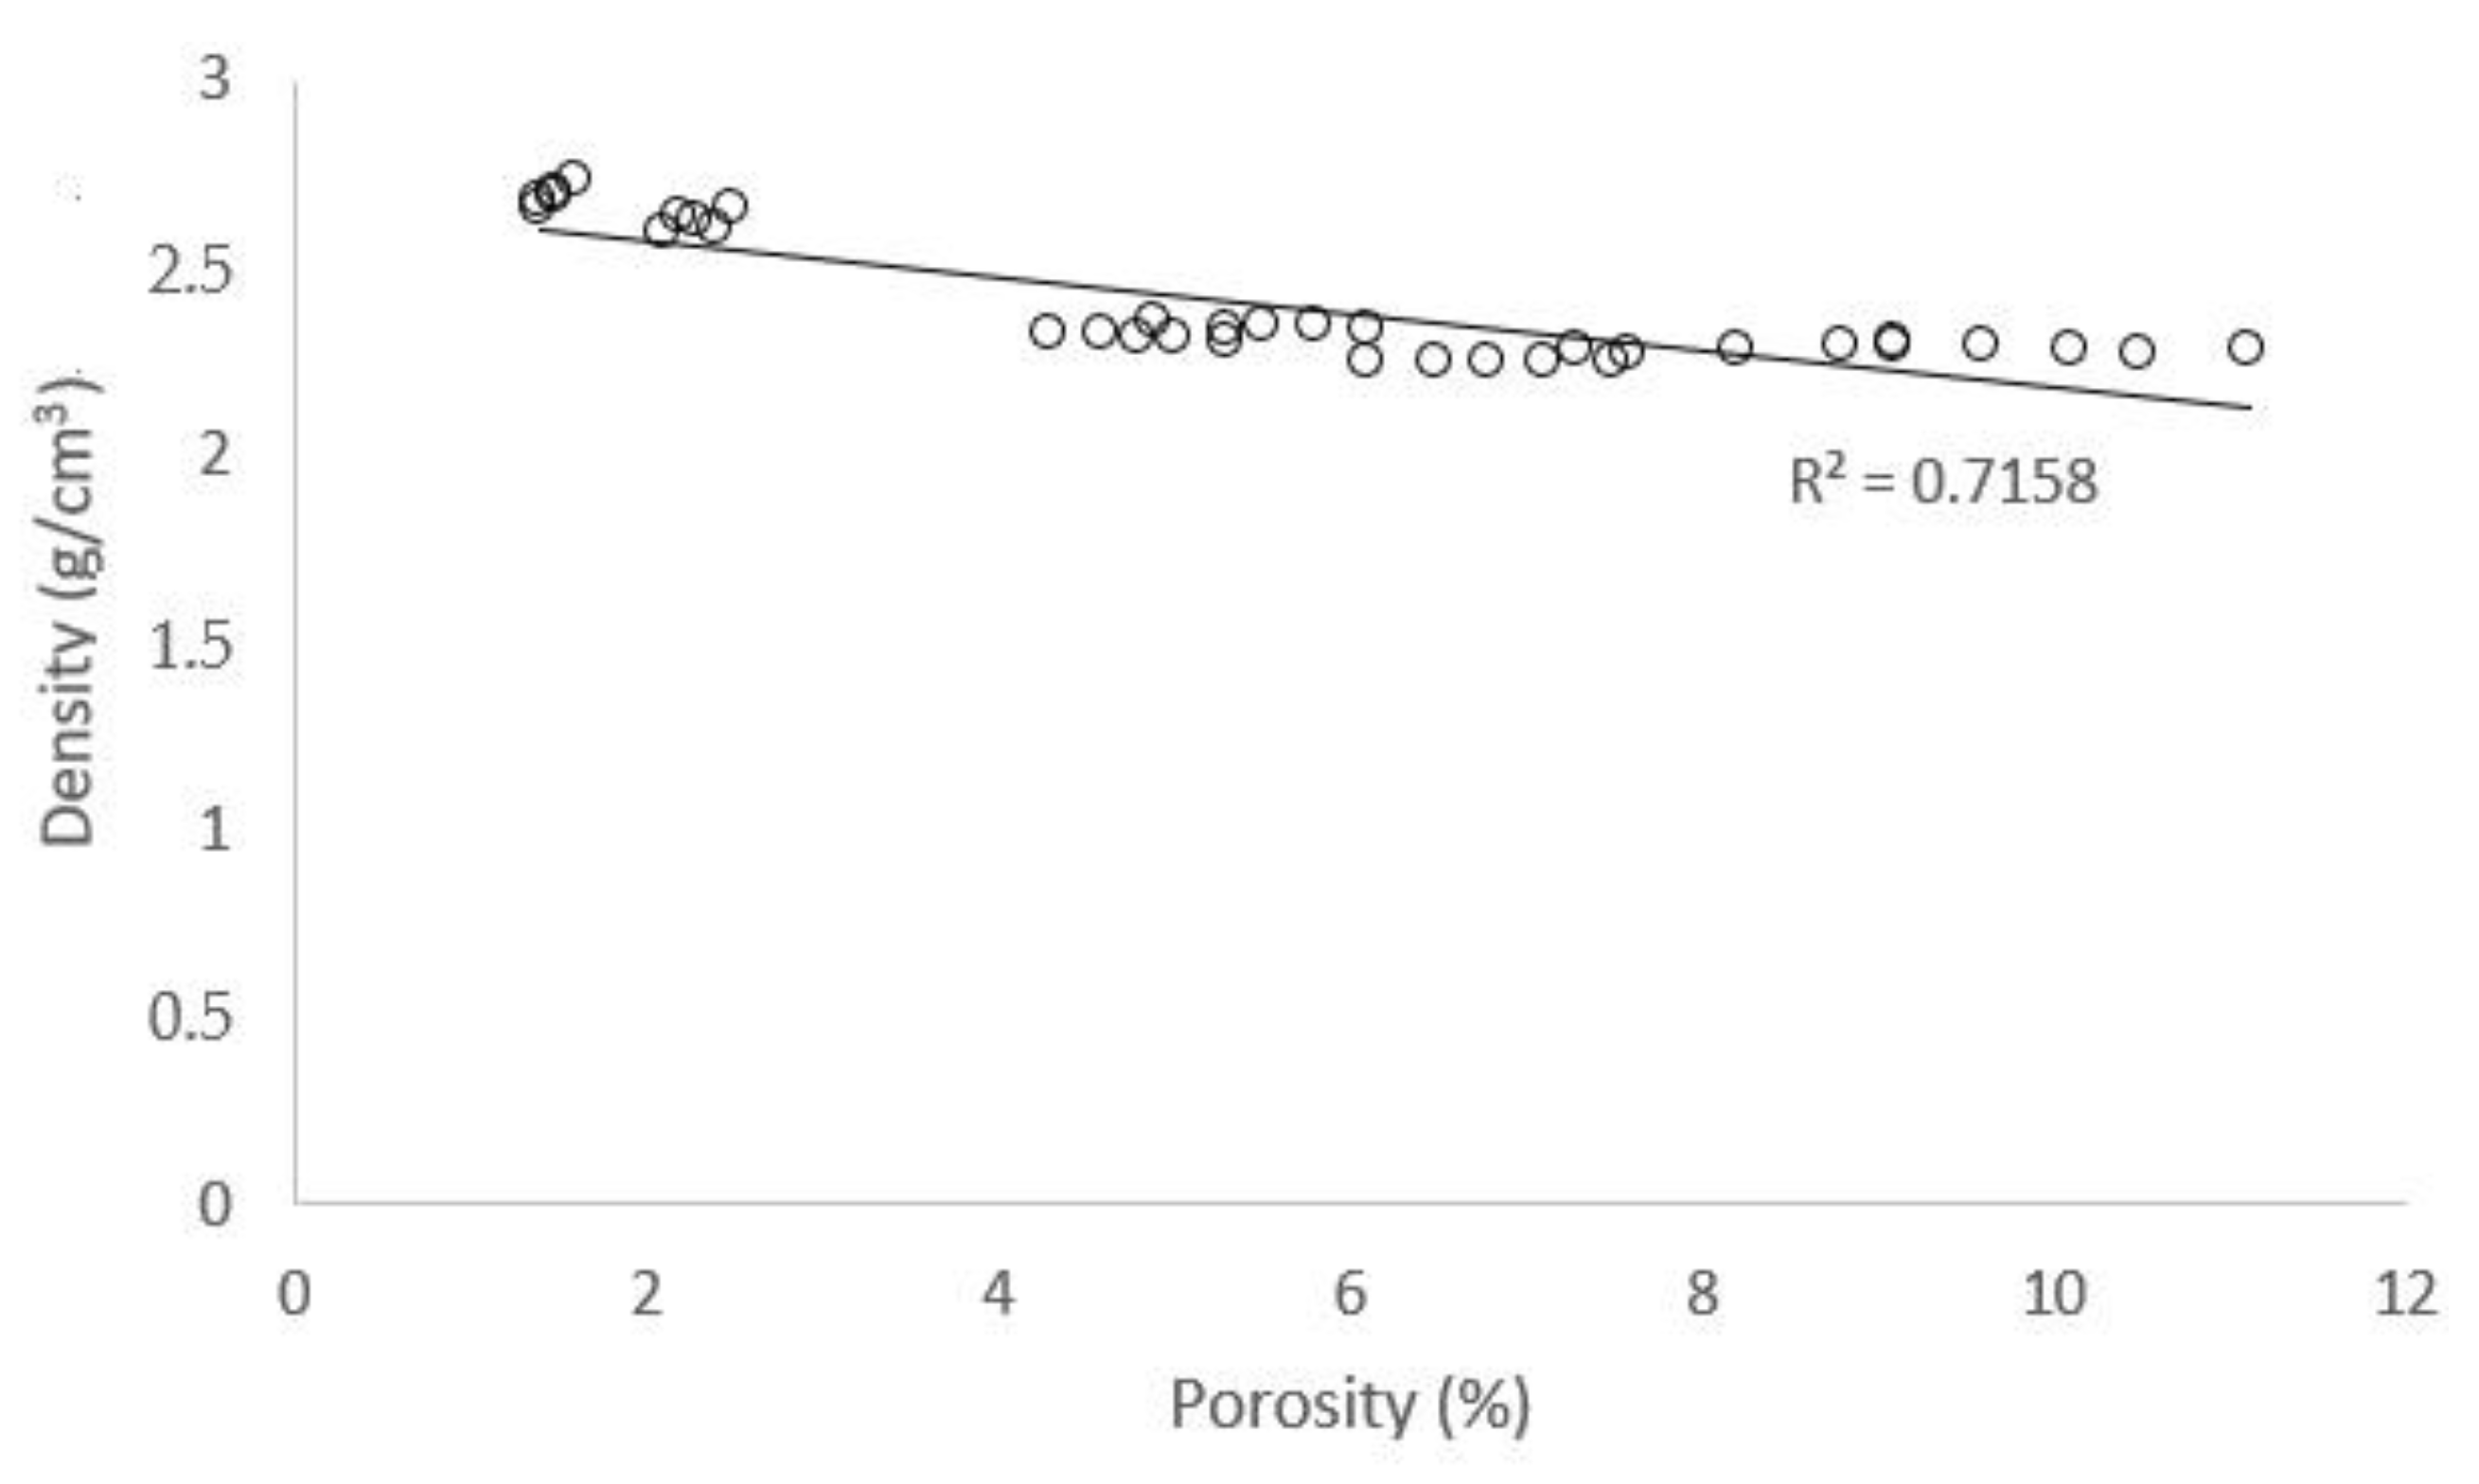
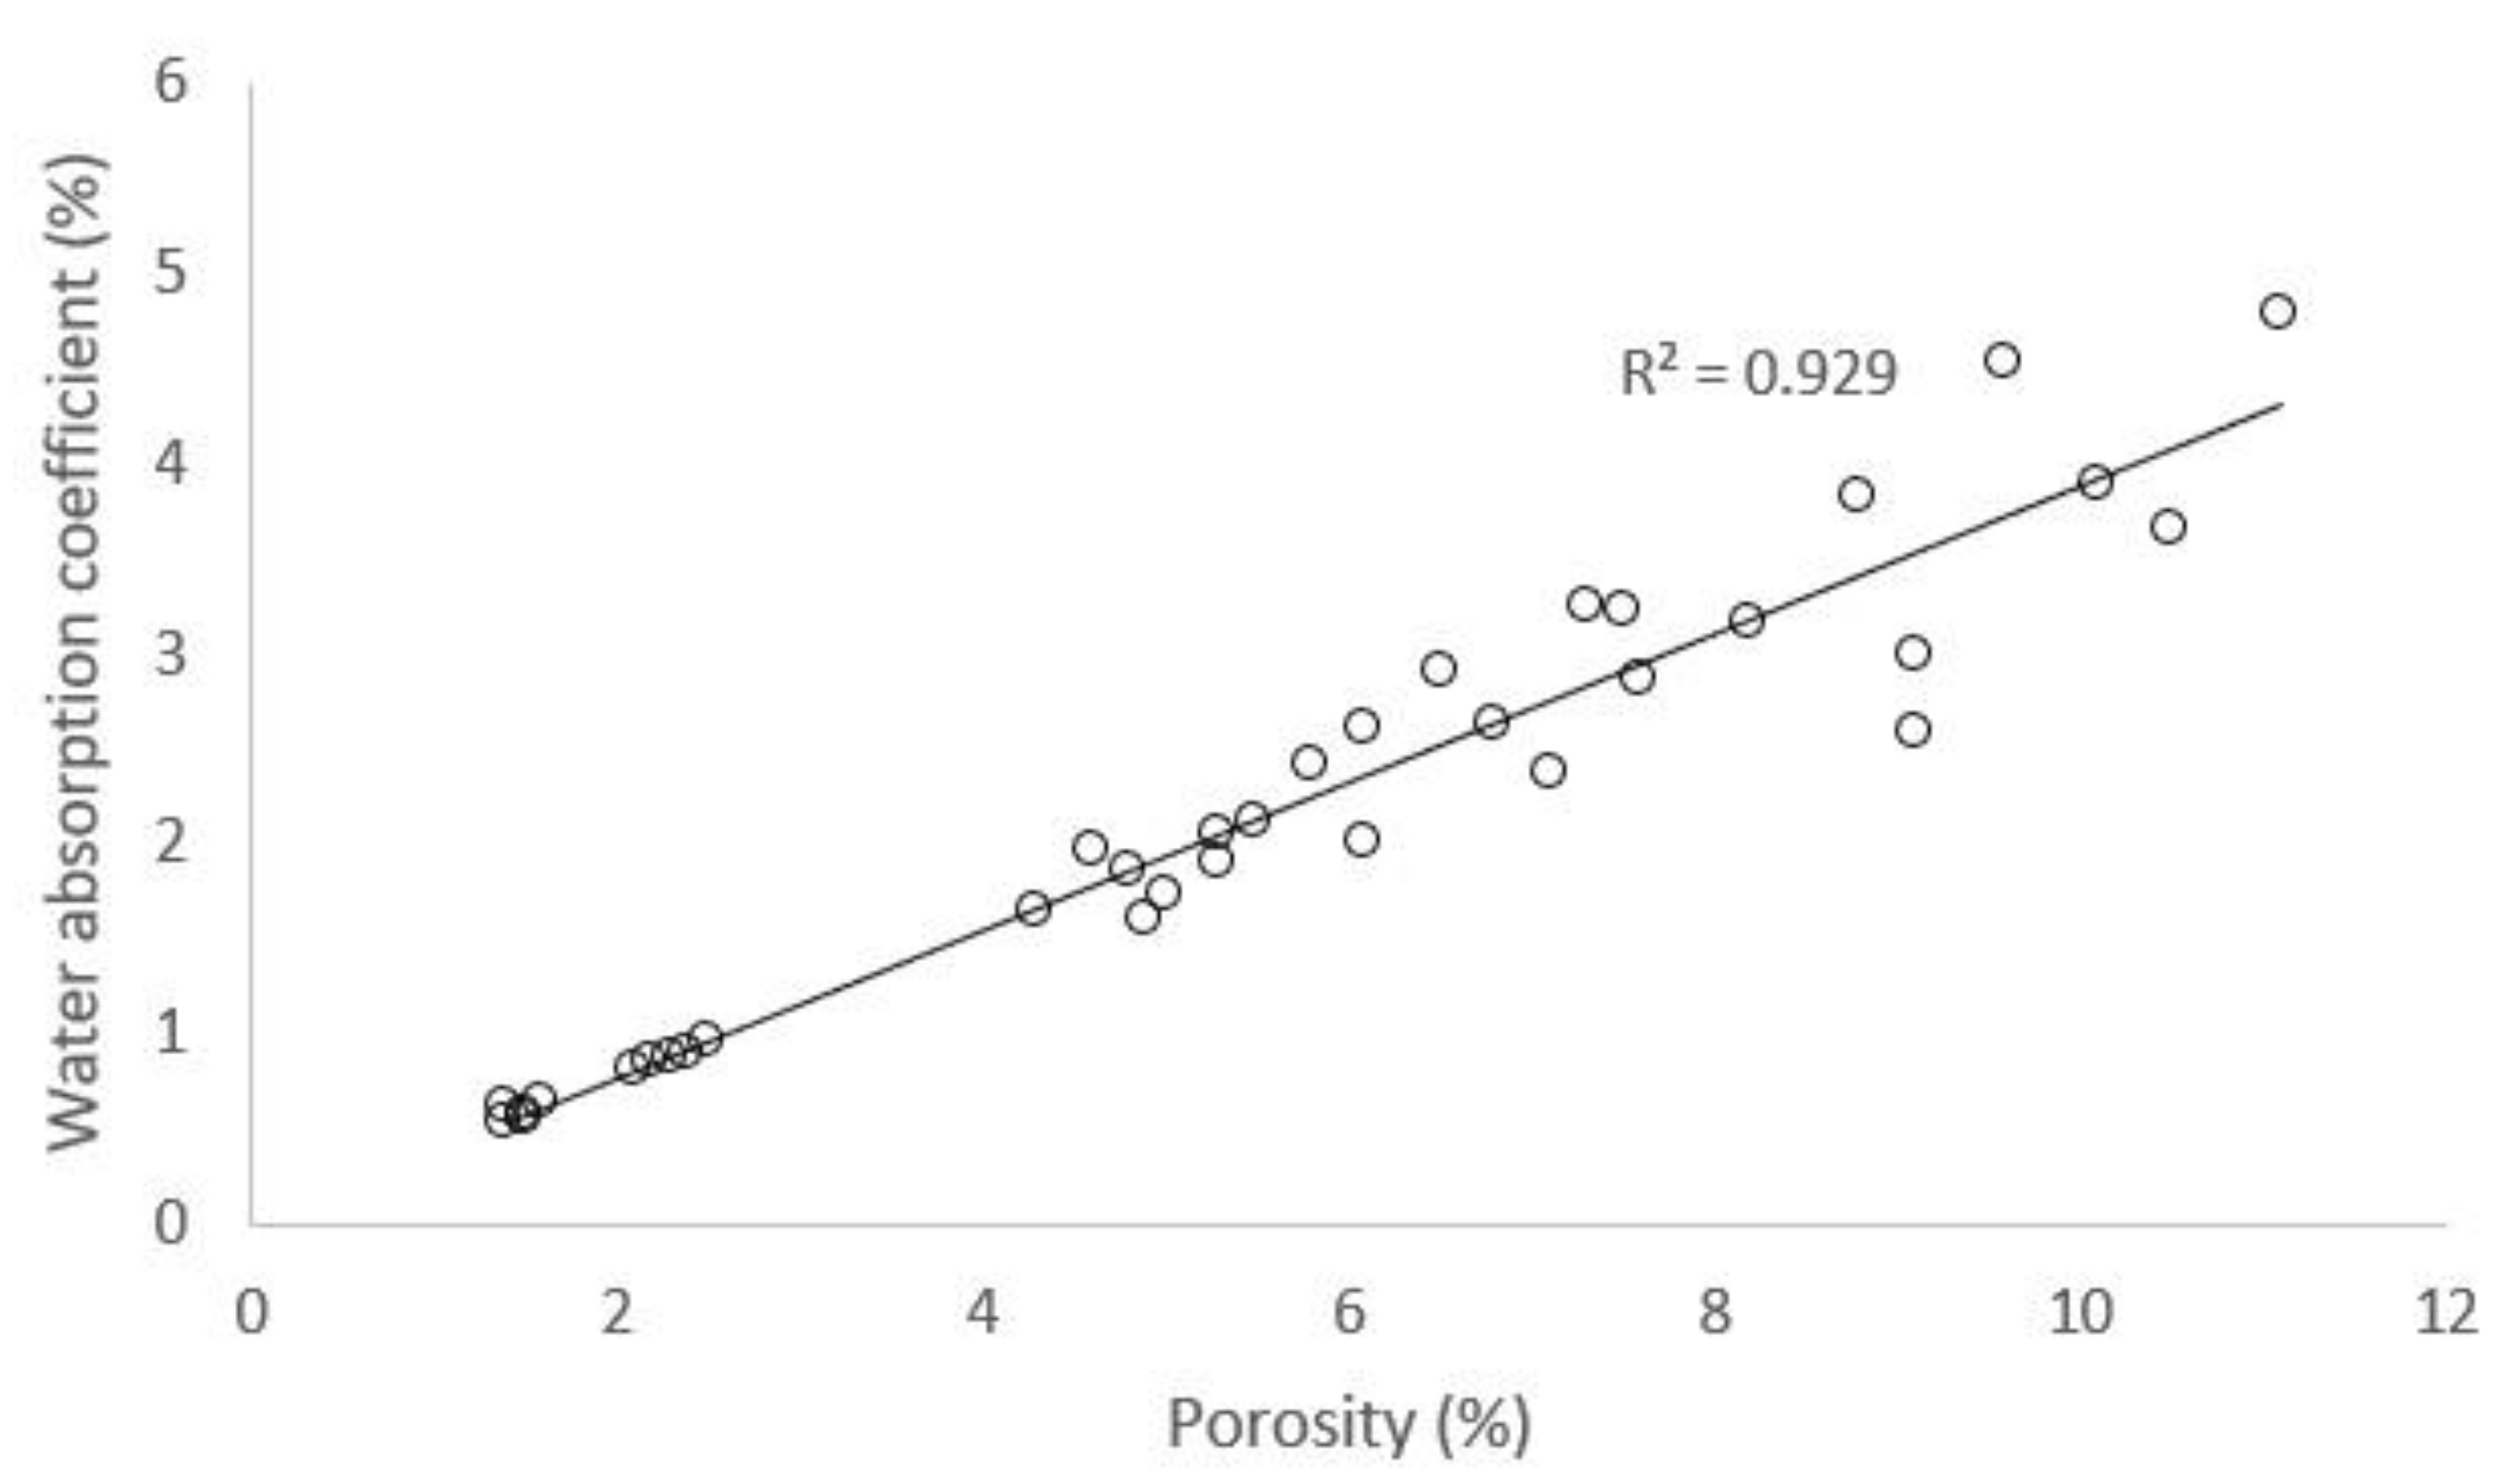
  • The determination of physical properties showed that the sandstones were diverse in porosity. The variable porosity was also associated with different water absorption values.
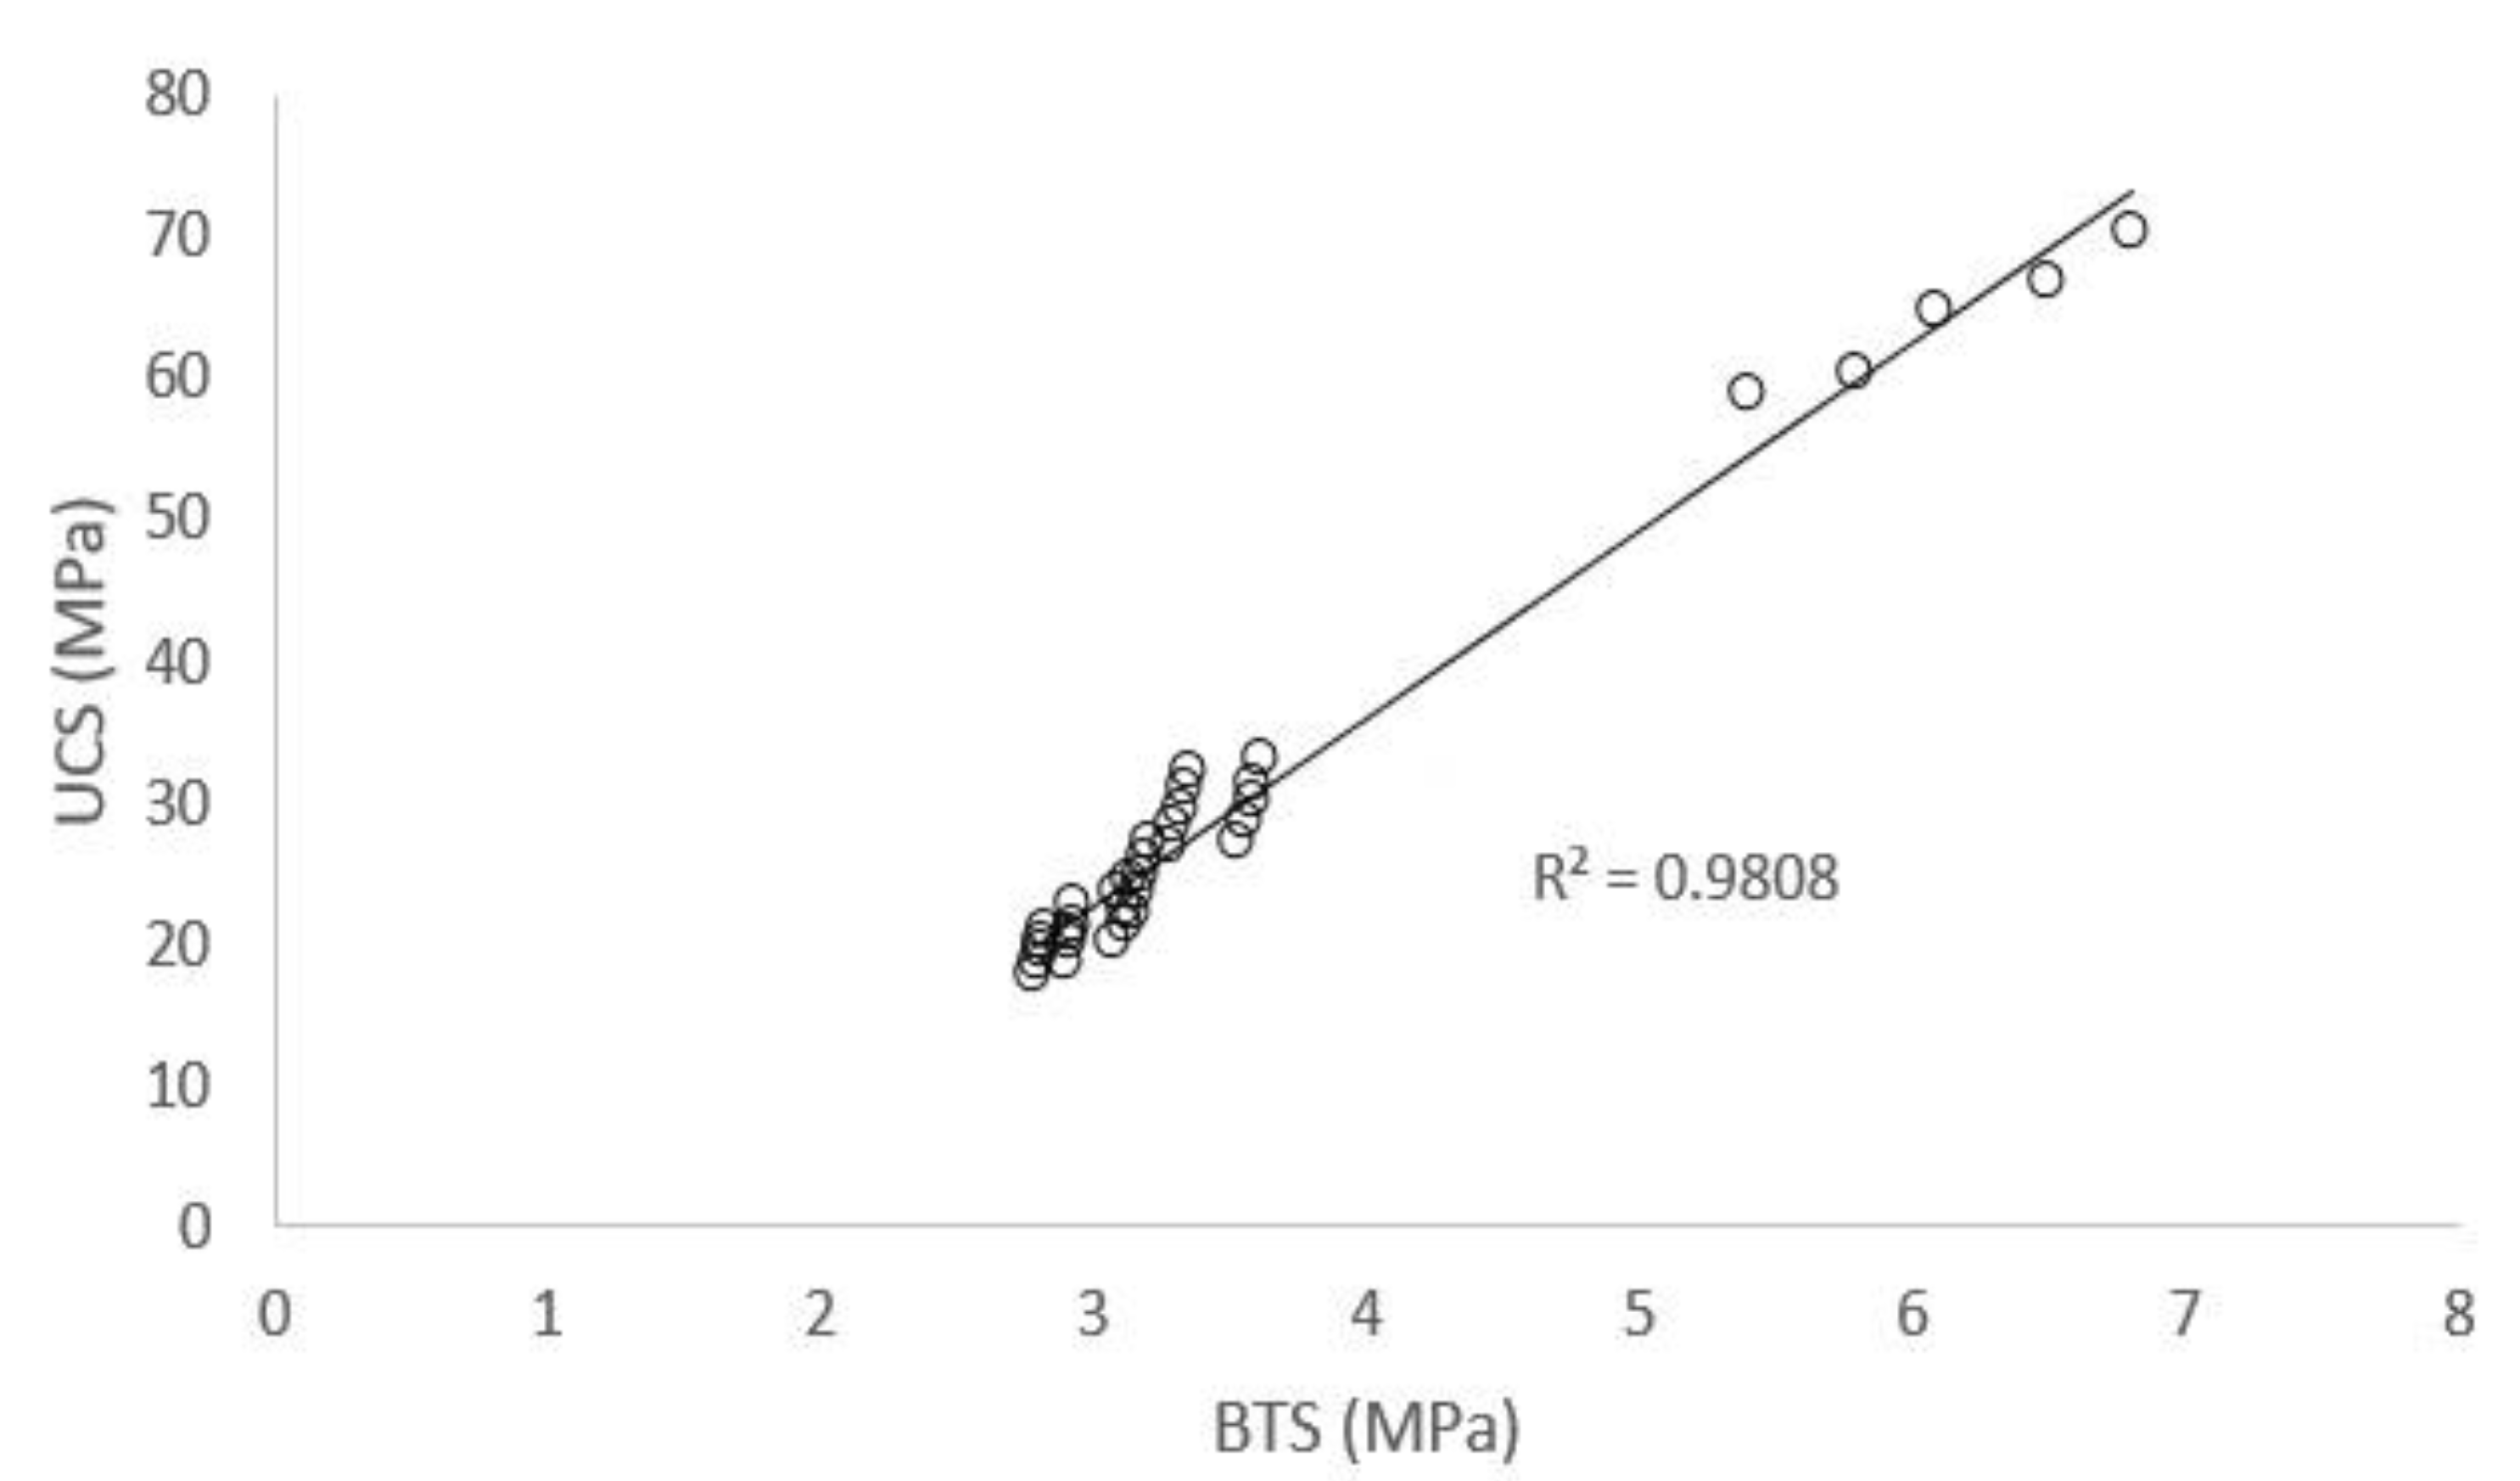
  • Various engineering properties were found to characterize the sandstones. The determination of uniaxial compressive strength showed that most sandstones from the regions of Upper Silesia were characterized as rocks of low strength. Only the J2 sandstone was classified as a rock with medium strength.
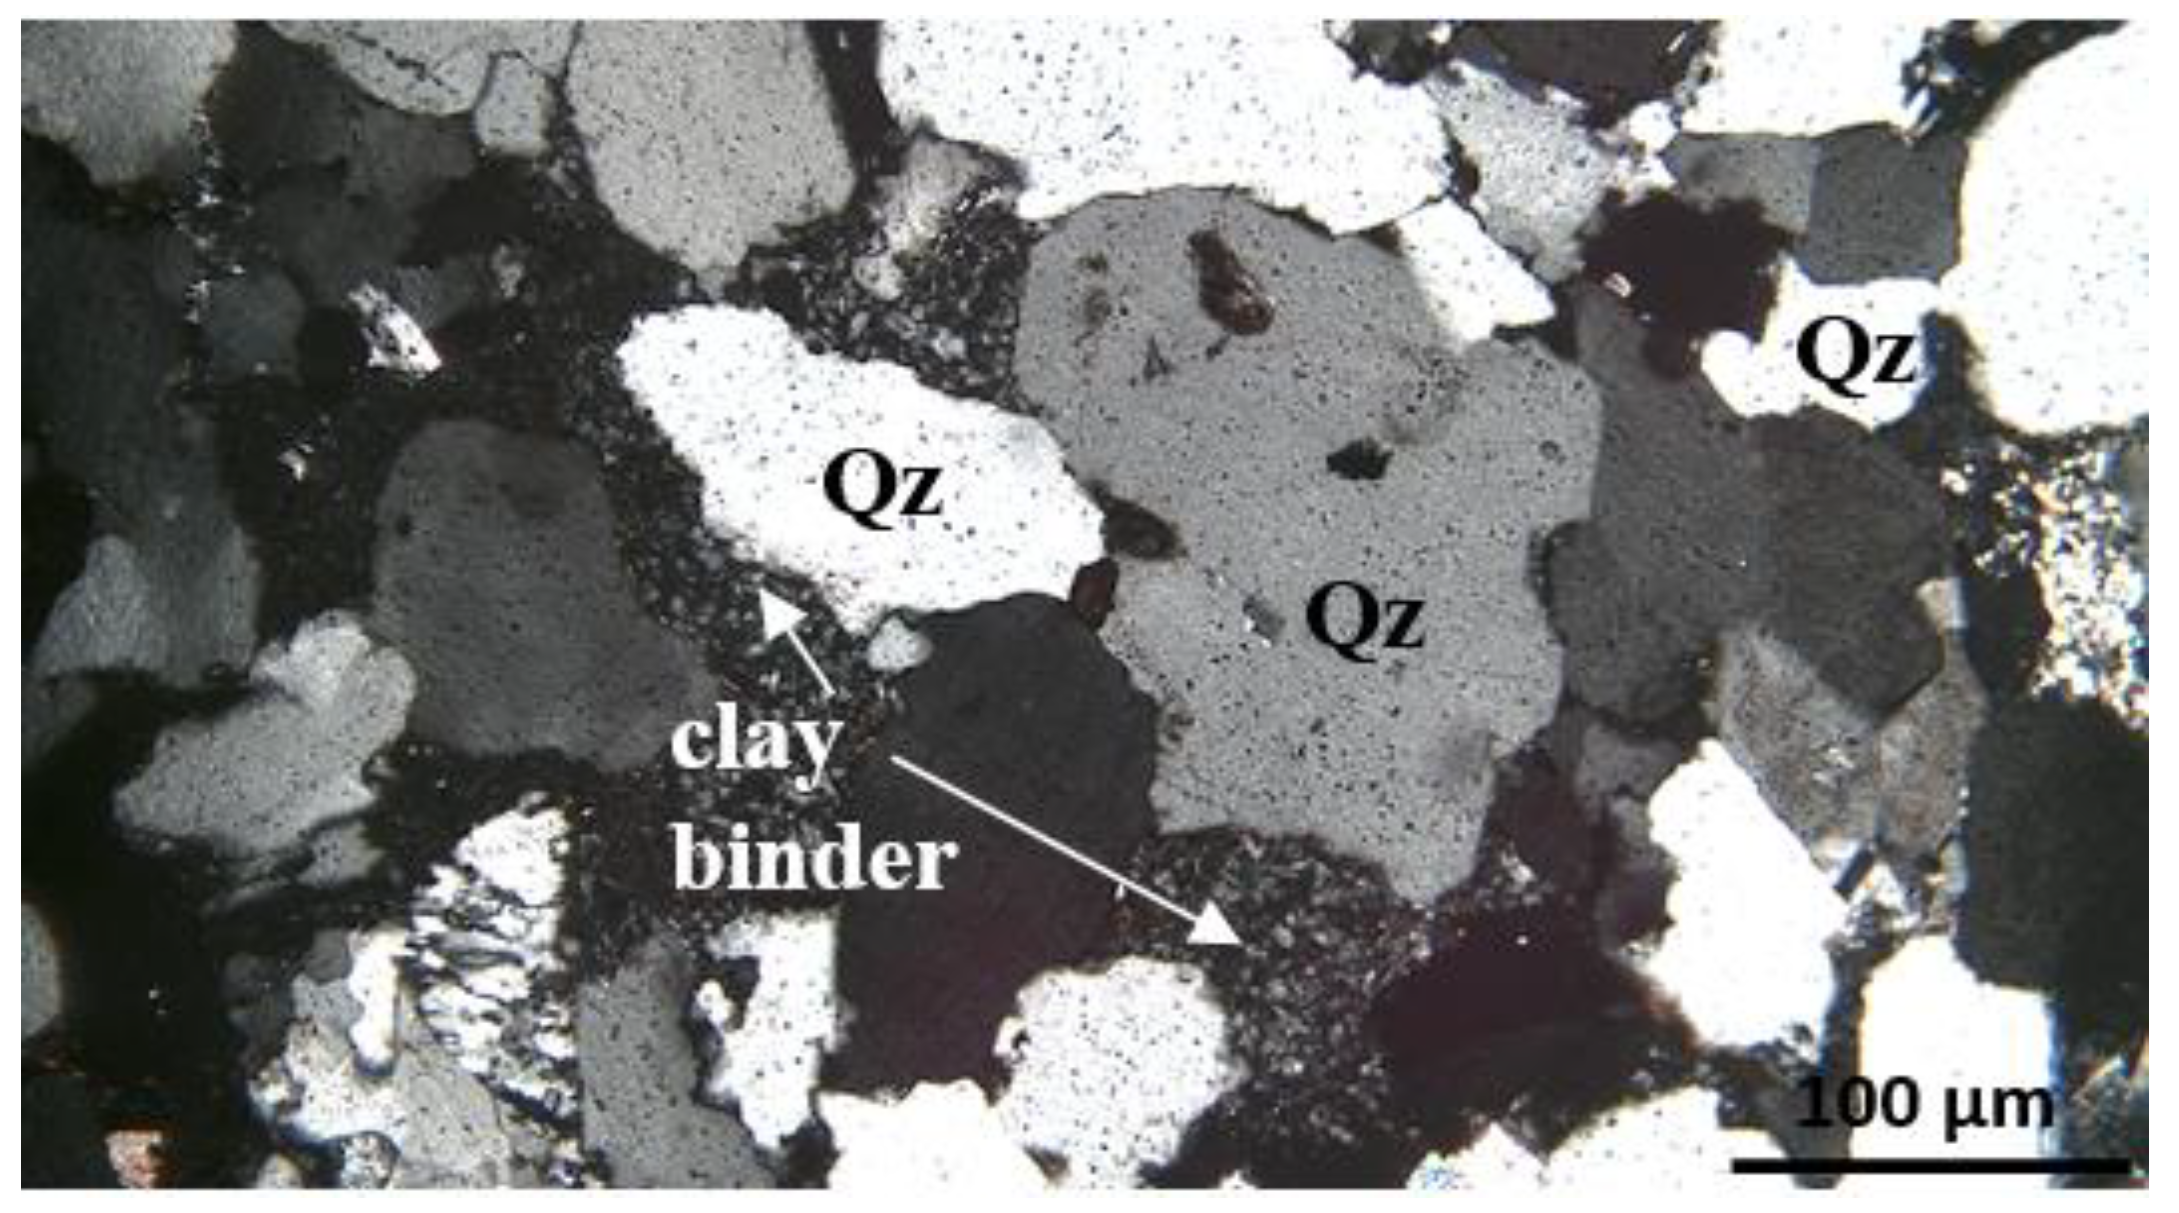
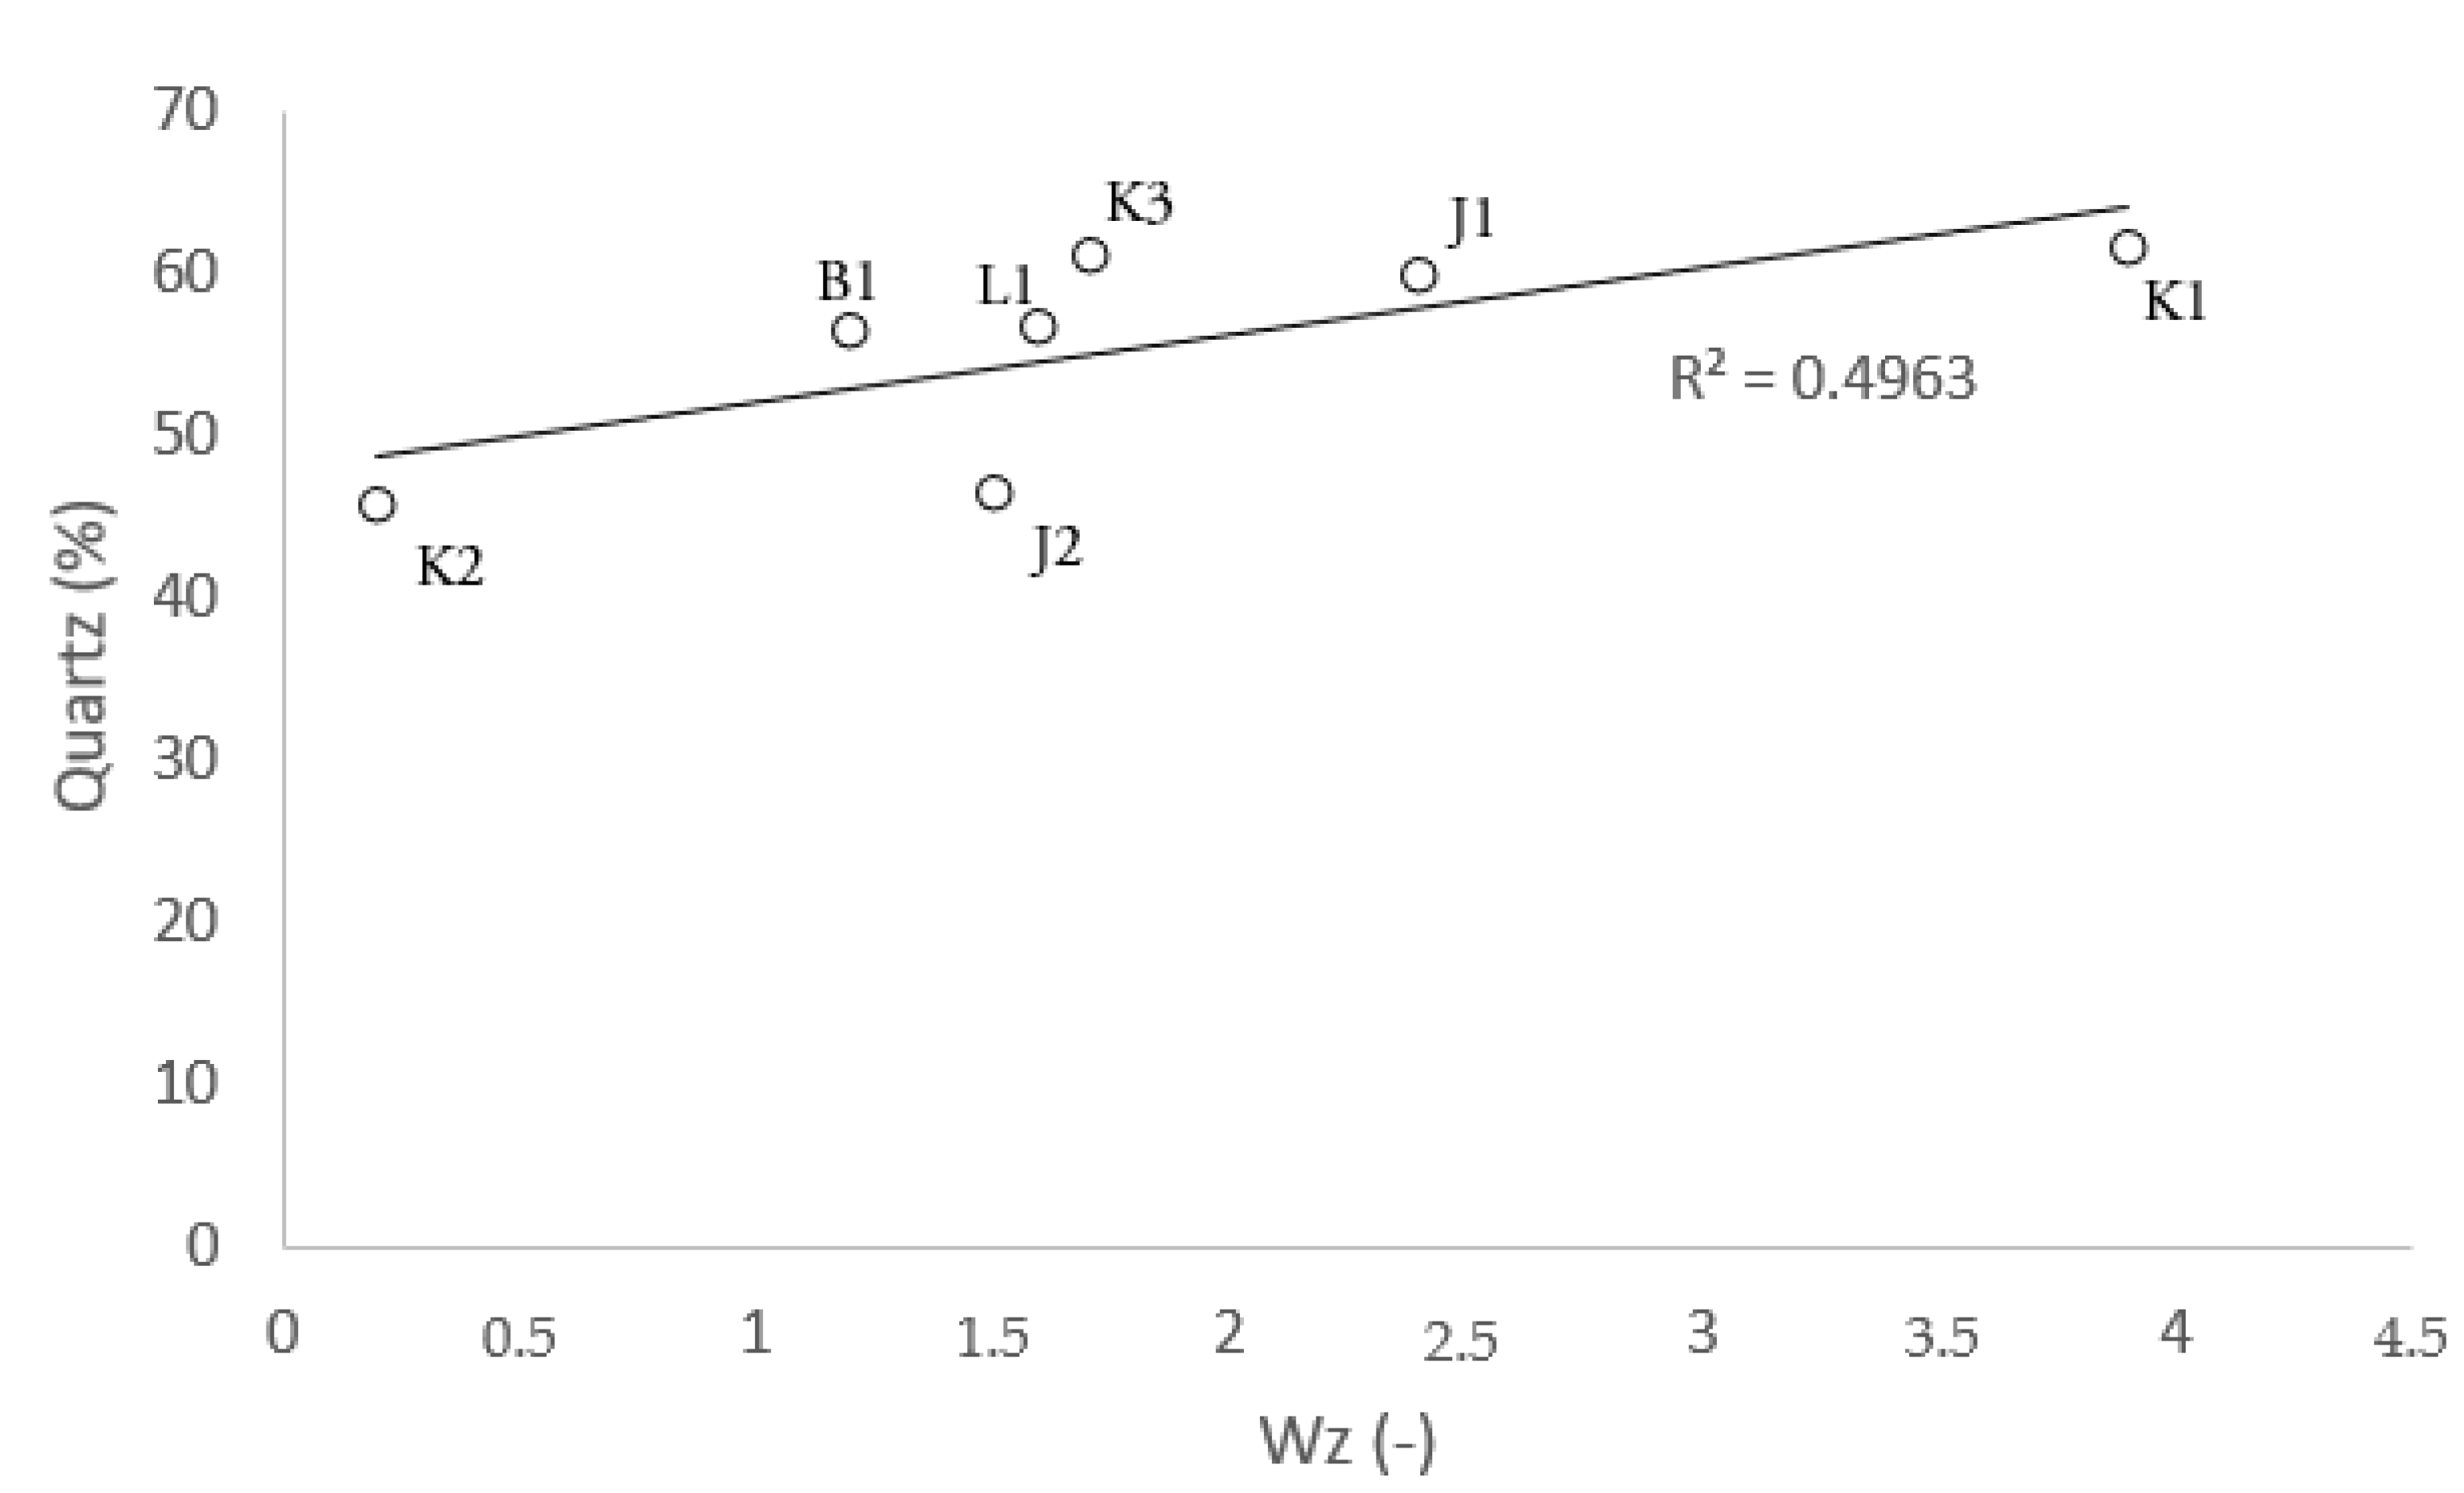
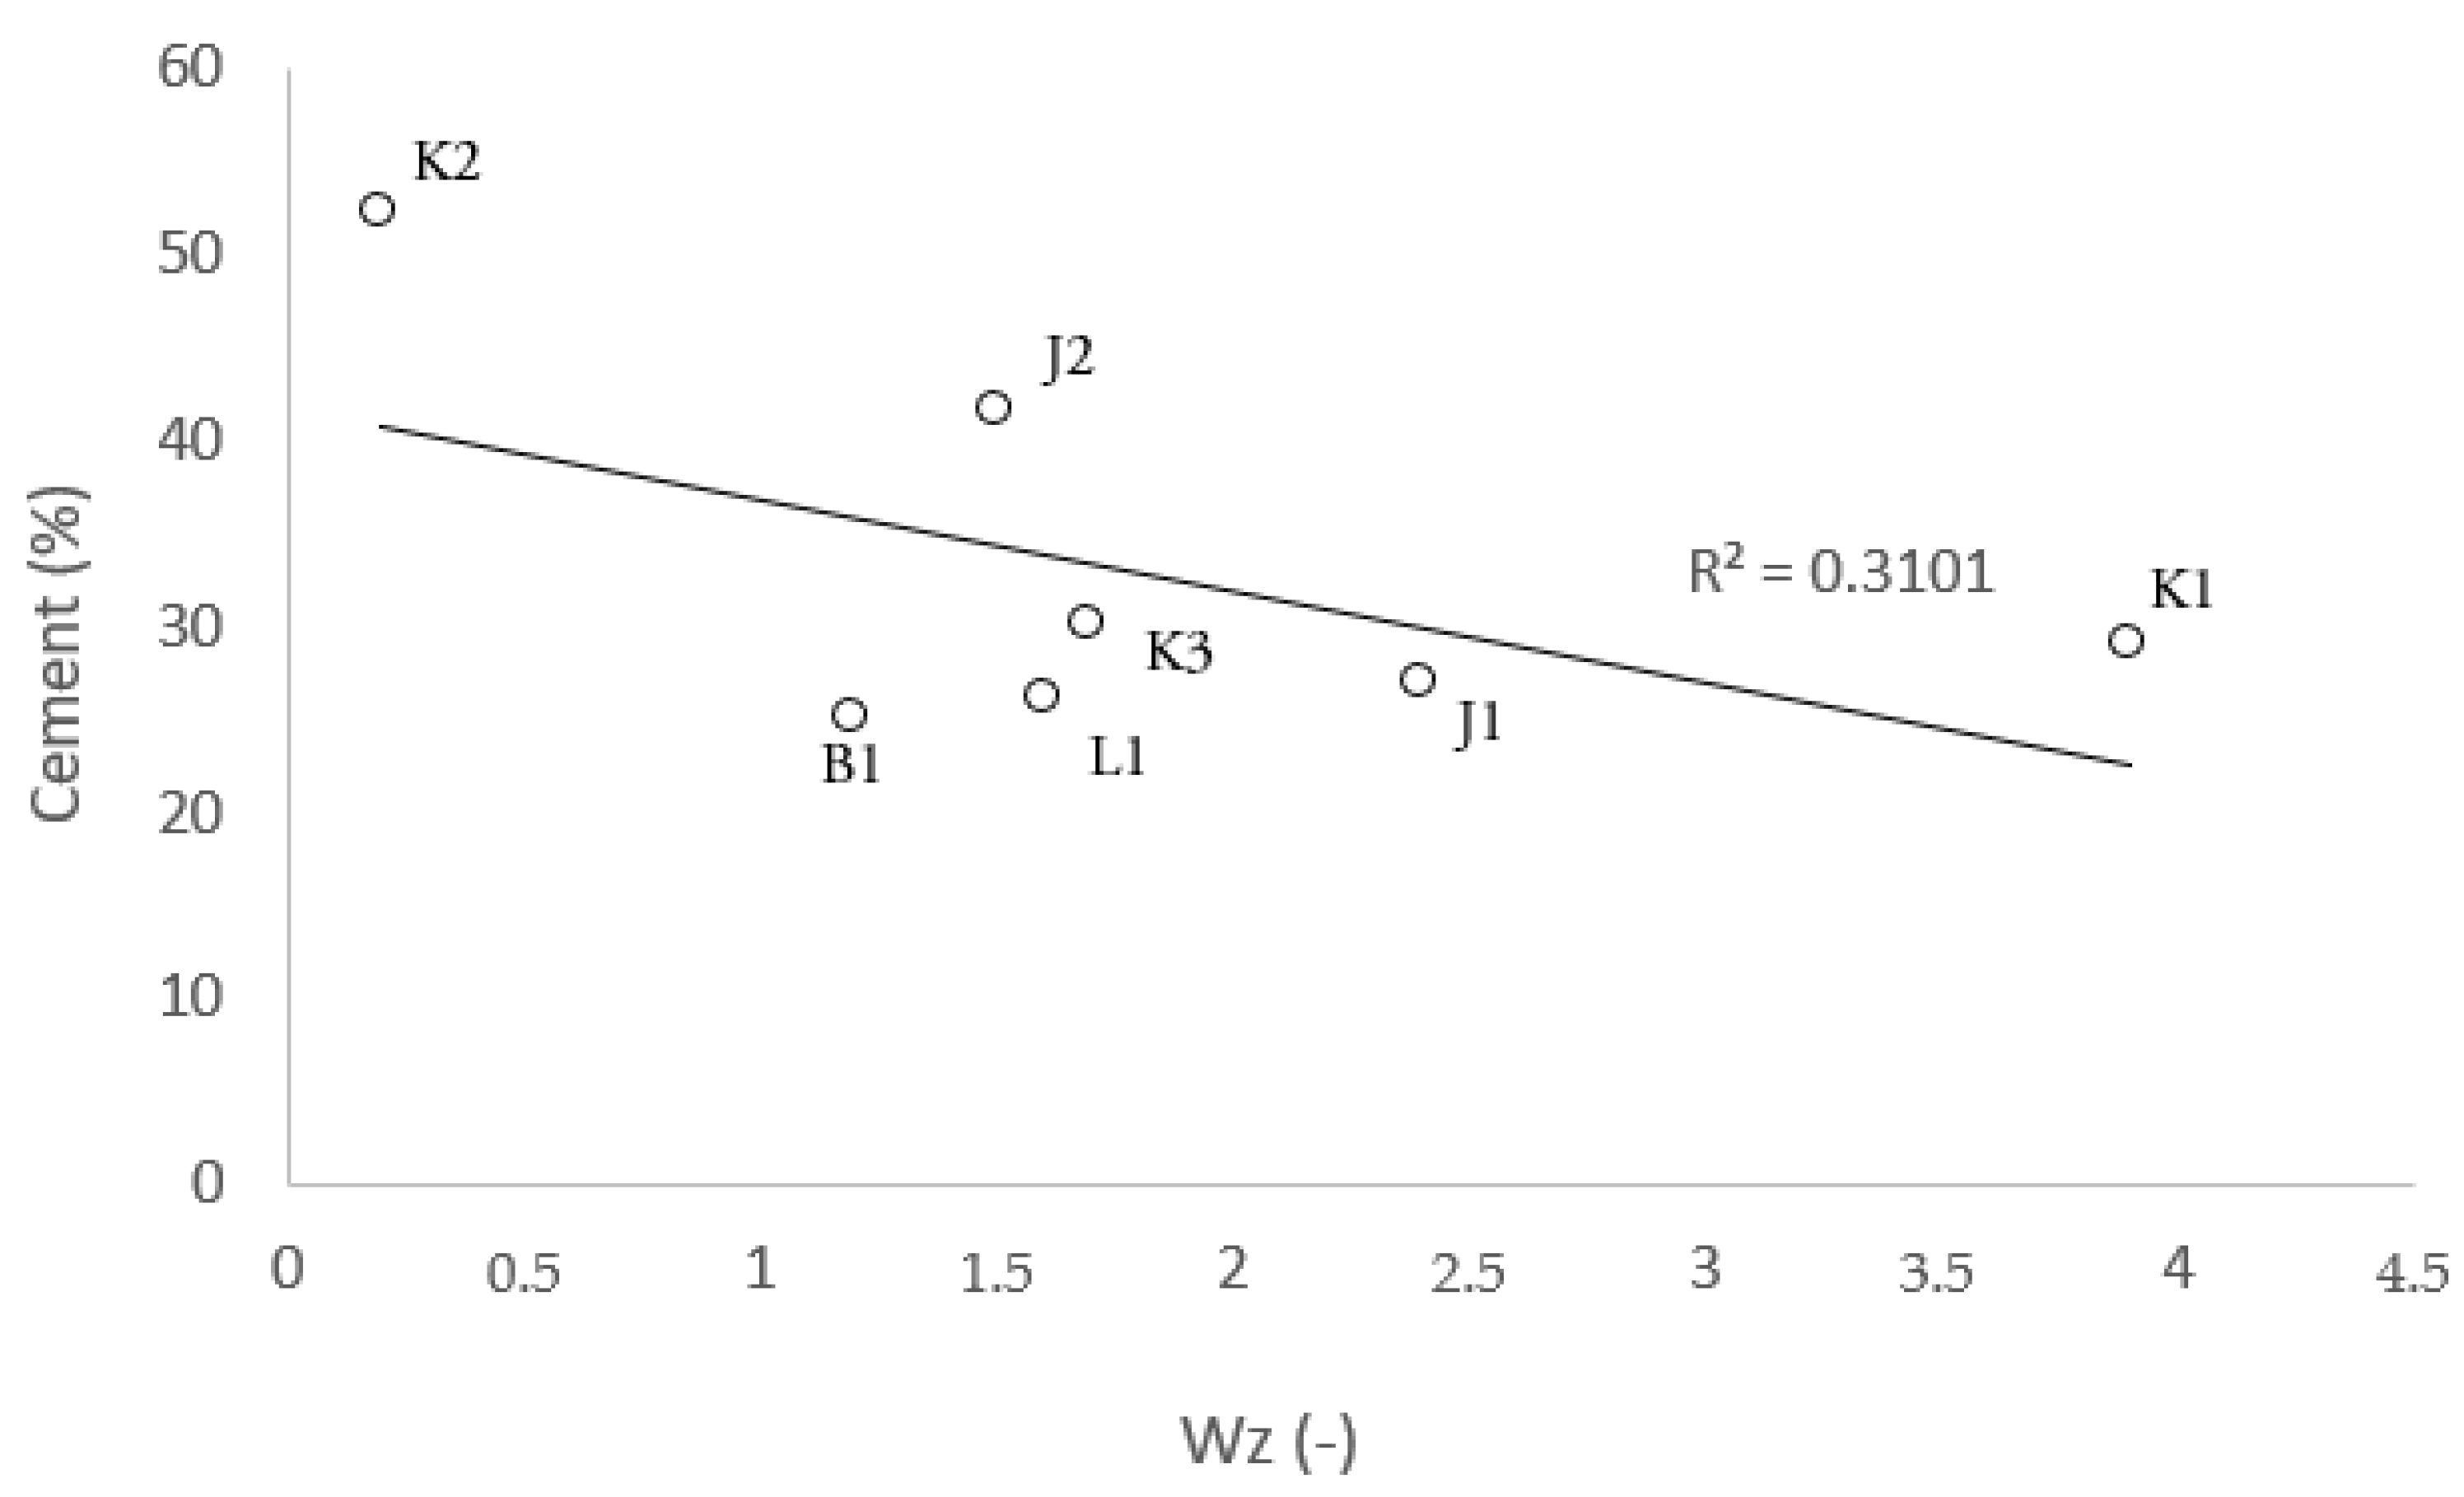
  • The abrasive properties of the sandstones were affected by their different grain structures. The sandstones were found to contain a relatively significant content of quartz of varying grains size from 0.1 to 1 mm, and they were also characterized by a high content of crumb material and a low binder content.
  • The insignificant abrasivity of one of the sandstone samples was directly related to its fine-grained rock structure. It was also found that this type of sandstone was characterized by a lower share of crumb material concerning the binder content, which directly impacted its low porosity and water absorption.
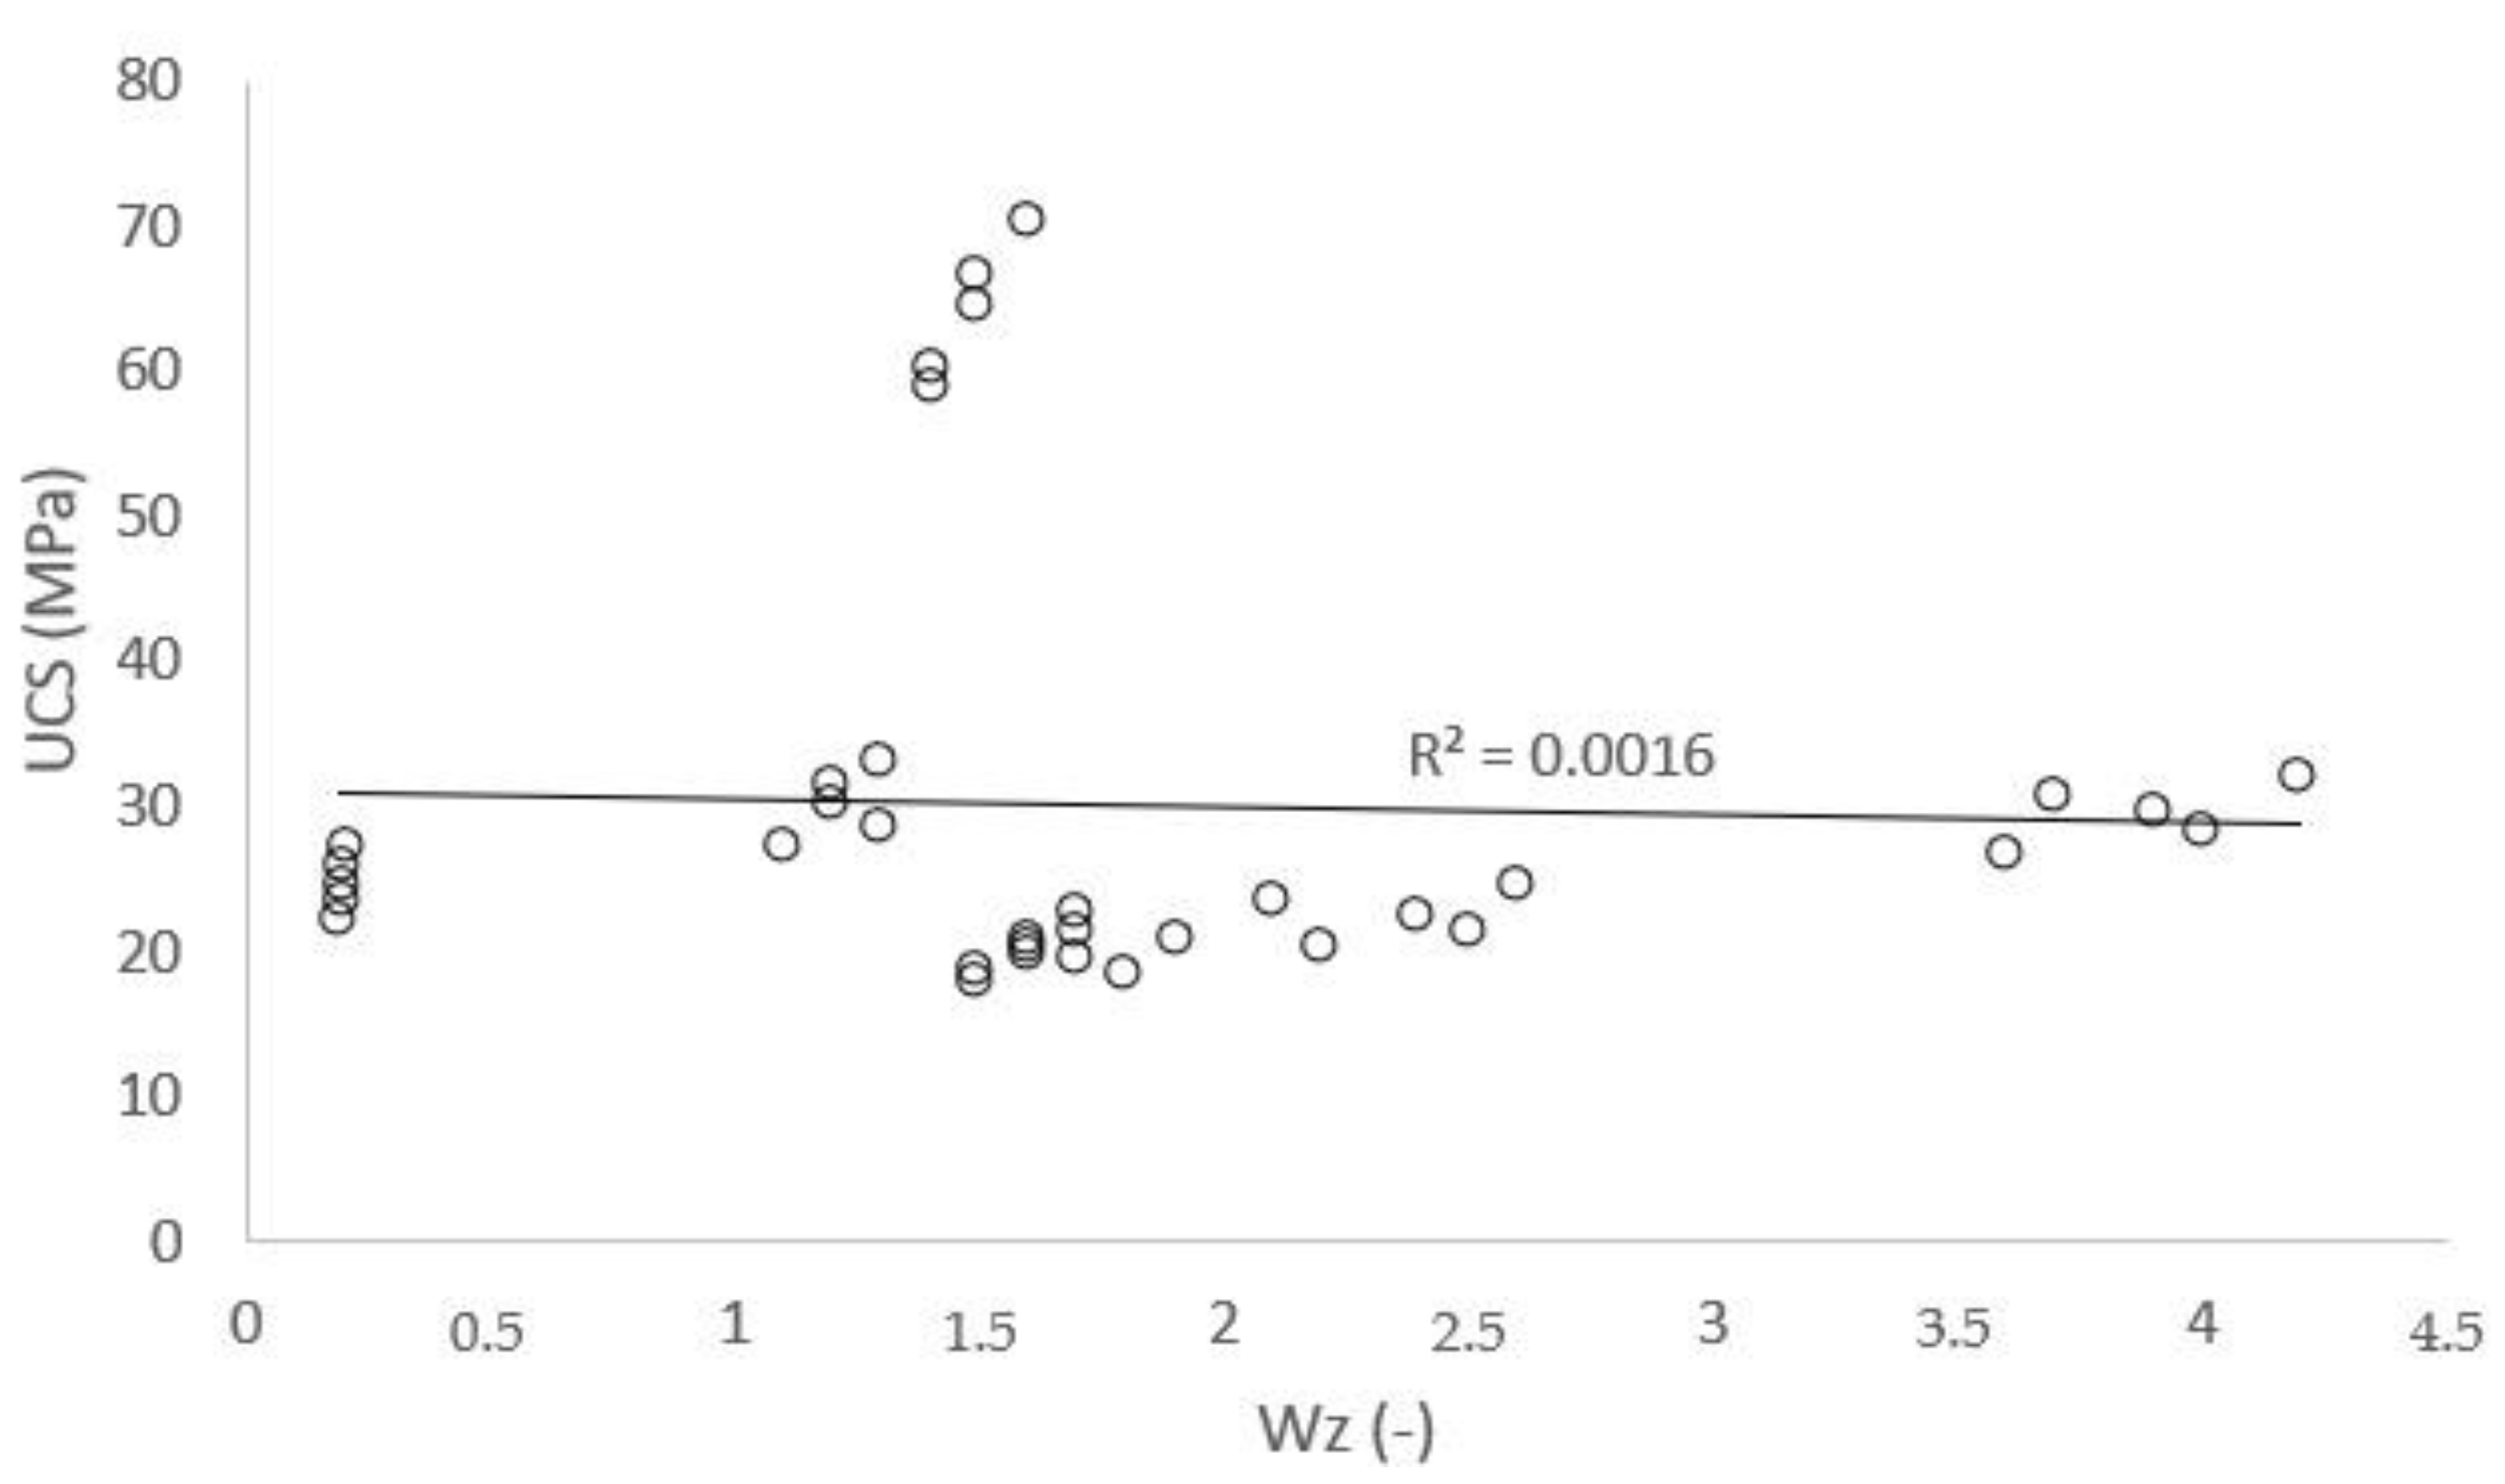
  • The rock workability was found to depend on the quartz percentage (more quartz grains lead to more difficulty in cutting), strength properties, and rock abrasivity (the higher the compressive strength and the value of the abrasivity index Wz, the more difficult it is to cut a rock).
  • The rock properties were found to significantly influence the selection of the cutting tool because these properties are the main causes of tool wear during mining. For harder rocks, better quality tools should be selected, with special focus on the proper protection of their working parts (e.g., wear-resistant coatings and hard facing).

Author Contributions

Conceptualization, I.J. and K.M.; methodology, I.J. and K.M.; software, I.J.; formal analysis, I.J. and K.M.; investigation, I.J. and K.M.; resources, K.M.; data curation, I.J. and K.M.; writing—original draft preparation, I.J. and K.M.; writing—review and editing, I.J. and K.M.; visualization, I.J. and K.M.; supervision, I.J.; project administration, K.M.; funding acquisition, I.J. and K.M. All authors have read and agreed to the published version of the manuscript.

Funding

Works financed by the Faculty of Mechanical Engineering and Robotics at the AGH University of Science and Technology and by the Faculty of Mining, Safety Engineering and Industrial Automation at the Silesian University of Technology.

Institutional Review Board Statement

Not applicable.

Informed Consent Statement

Not applicable.

Data Availability Statement

Data presented in the article are original and not inappropriately selected, manipulated, enhanced, or fabricated.

Conflicts of Interest

The authors declare no conflict of interest.

References

  1. Bartkowska, I. Program for the Hard Coal Mining Sector in Poland Ministry of Energy, Warsaw 2019, Poland. Available online: https://www.gov.pl/web/aktywa-panstwowe/program-dla-sektora-gornictwa-wegla-kamiennego-w-polsce (accessed on 15 February 2022).
  2. Kotwica, K. Atypical and innovative tool, holder and mining head designed for roadheaders used to tunnel and gallery drilling in hard rock. Tunn. Undergr. Space Technol. 2018, 82, 493–503. [Google Scholar] [CrossRef]
  3. Mucha, K. The new method for assessing rock abrasivity in terms of wear of conical picks. New Trends Prod. Eng. 2019, 2, 186–194. [Google Scholar] [CrossRef] [Green Version]
  4. Tiryaki, B.; Dikmen, A. Effects of Rock Properties on Specific Cutting Energy in Linear Cutting of Sandstones by Picks. Rock Mech. Rock Eng. 2005, 39, 89–120. [Google Scholar] [CrossRef]
  5. Cantisani, E.; Garzonio, C.; Ricci, M.; Vettori, S. Relationships between the petrographical, physical and mechanical properties of some Italian sandstones. Int. J. Rock Mech. Min. Sci. 2013, 60, 321–332. [Google Scholar] [CrossRef]
  6. Hobler, M. Badania Fizykomechanicznych Własności Skał; Państwowe Wydawnictwo Naukowe: Warszaw, Poland, 1977. [Google Scholar]
  7. Cobanoglu, I.; Celik, S.B.; Alkaya, D. Correlation between “Wide wheel abrasion (capon)” and “Bohme abrasion” test results for some carbonate rocks. Sci. Res. Essays 2010, 5, 3398–3404. [Google Scholar]
  8. Hydzik-Wiśniewska, J.; Bednarek, Ł. Statistical analysis of mechanical properties on the example of aggregates of Carpathian sandstones. Stud. Geotech. Mech. 2020, 42, 366–375. [Google Scholar] [CrossRef]
  9. Plinninger, R.J.; Restner, U. Abrasivity testing, Quo Vadis?—A commented overview of abrasivity testing methods. Geomech. Tunn. 2008, 1, 61–70. [Google Scholar] [CrossRef]
  10. Plinninger, R.; Käsling, H.; Thuro, K.; Spaun, G. Testing conditions and geomechanical properties influencing the CERCHAR abrasiveness index (CAI) value. Int. J. Rock Mech. Min. Sci. 2003, 40, 259–263. [Google Scholar] [CrossRef]
  11. Torrijo, F.J.; Garzón-Roca, J.; Company, J.; Cobos, G. Estimation of Cerchar abrasivity index of andesitic rocks in Ecuador from chemical compounds and petrographical properties using regression analyses. Bull. Eng. Geol. Environ. 2018, 78, 2331–2344. [Google Scholar] [CrossRef]
  12. Mucha, K. Ściernośćskał w Aspekcie Prognozowania Zużycia Noży Kombajnowych (Rock Abrasivity in Terms of Forecasting the Abrasive Wear of Cutting Picks). Ph. D. Thesis, AGH University of Science and Technology, Kraków, Poland, 2019. [Google Scholar]
  13. Käsling, H.; Thuro, K. Determining Abrasivity of Rock in the Laboratory. Engineering Geology. Technische Universität München, Germany 2010, 1973–1980. Available online: https://www.researchgate.net/profile/Kurosch-Thuro/publication/265206827_Determining_rock_abrasivity_in_the_laboratory/links/559f8bf408ae424c1e6a6dd9/Determining-rock-abrasivity-in-the-laboratory.pdf (accessed on 12 February 2022).
  14. Karaca, Z.; Yılmaz, N.G.; Goktan, R.M. Considerations on the European Standard EN 14157 Test Methods: Abrasion Resistance of Natural Stones Used for Flooring in Buildings. Rock Mech. Rock Eng. 2011, 45, 103–111. [Google Scholar] [CrossRef]
  15. Bukowska, M. The rockbursts in the Upper Silesian Coal Basin in Poland. J. Min. Sci. 2012, 48, 445–456. [Google Scholar] [CrossRef]
  16. Cabała, J.; Ćmiel, S.R.; Idziak, A.F. Environmental impact of mining activity in the Upper Silesian Coal Basin. Geol. Belg. 2004, 7, 225–230. [Google Scholar]
  17. He, M.; Zhang, Z.; Zhu, J.; Li, N. Correlation Between the Constant mi of Hoek–Brown Criterion and Porosity of Intact Rock. Rock Mech. Rock Eng. 2021, 55, 923–936. [Google Scholar] [CrossRef]
  18. Mucha, K.; Krauze, K. Planning experiment for laboratory tests on rock abrasivity. Min. Inform. Autom. Electr. Eng. 2018, 3, 535. [Google Scholar] [CrossRef]
  19. Karaman, K.; Cihangir, F.; Ercikdi, B.; Kesimal, A.; Demirel, S. Utilization of the Brazilian test for estimating the uniaxial compressive strength and shear strength parameters. J. South. Afr. Inst. Min. Met. 2015, 115, 185–192. [Google Scholar] [CrossRef]
  20. Gong, F.; Zhang, L.; Wang, S. Loading Rate Effect of Rock Material with the Direct Tensile and Three Brazilian Disc Tests. Adv. Civ. Eng. 2019, 2019, 1–8. [Google Scholar] [CrossRef] [Green Version]
  21. Jonczy, I.; Borówka, B. Wykształcenie litologiczne warstw orzeskich na południowym skrzydle siodła głównego GZW. PrzeglądGórniczy 2015, 71, 52–55. [Google Scholar]
  22. Jonczy, I.; Borówka, B. Characteristics of Near-Surface Part of the Orzesze Beds in the Region of the Main Saddle in View of Weathering Processes. Gospod. Surowcami Miner. 2016, 32, 111–124. [Google Scholar] [CrossRef] [Green Version]
  23. Lee, M.; Parsons, I. Diffusion-controlled and replacement microtextures in alkali feldspars from two pegmatites: Perth, Ontario and Keystone, South Dakota. Miner. Mag. 2015, 79, 1711–1735. [Google Scholar] [CrossRef] [Green Version]
  24. Garzanti, E. Petrographic classification of sand and sandstone. Earth Sci. Rev. 2018, 192, 545–563. [Google Scholar] [CrossRef]
  25. Geological Digressions. Available online: https://www.geological-digressions.com/classification-of-sandstones (accessed on 12 February 2022).
  26. West, G. A relation between abrasiveness and quartz content for some Coal Measures sediments. Geotech. Geol. Eng. 1986, 4, 73–78. [Google Scholar] [CrossRef]
  27. Yaralı, O.; Yaşar, E.; Bacak, G.; Ranjith, P. A study of rock abrasivity and tool wear in Coal Measures Rocks. Int. J. Coal Geol. 2008, 74, 53–66. [Google Scholar] [CrossRef]
  28. Nazir, R.; Momeni, E.; Armaghani, A.J.; Amin, M. Correlation between unconfined compressive strength and indirect tensile strength of limestone rock samples. EJGE 2013, 18, 1737–1746. [Google Scholar]
  29. Ribeiro, P.C.P.D.S.; Oliveira, M.M.; Nelson, P.P. Correlation Between Uniaxial Compressive Strength and Brazilian Tensile Strength Using Different Rock Types. In Proceedings of the ISRM VII Brazilian Symposium on Rock Mechanics-SBMR 2016, Belo Horizonte, Minas Gerais, Brazil, 19 October 2016. [Google Scholar] [CrossRef]
  30. Ukaszewski, P. Development of fracture processes in Silesian Carboniferous sandstones. Geol. Q. 2003, 47, 29–38. [Google Scholar]
  31. Karman, K.; Kesimal, A. Evaluation of the influence of porosity on the engineering properties of rocks form the Eastern Black Sea Region: NE Turkey. Arab. J. Geosci. 2015, 8, 557–564. [Google Scholar] [CrossRef]
  32. Abu Bakar, M.; Majeed, Y.; Rostami, J. Influence of moisture content on the LCPC test results and its implications on tool wear in mechanized tunneling. Tunn. Undergr. Space Technol. 2018, 81, 165–175. [Google Scholar] [CrossRef]
  33. Bołoz, Ł. Directions for increasing conical picks’ durability. New Trends Prod. Eng. 2019, 2, 277–286. [Google Scholar] [CrossRef] [Green Version]
  34. Krauze, K.; Bołoz, Ł.; Wydro, T.; Mucha, K. Durability testing of tangential-rotary picks made of different materials. Min. Inform. Autom. Electr. Eng. 2017, 1, 529. [Google Scholar] [CrossRef]
  35. Krzysztof, K.; Piotr, M. Methods of Mechanical Mining of Compact-Rock—A Comparison of Efficiency and Energy Consumption. Energies 2019, 12, 3562. [Google Scholar] [CrossRef] [Green Version]
Figure 1. Examples of conical picks’ wear.
Energies 15 02692 g001
Figure 2. Schematic map of the location of the Upper Silesian Coal Basin with marked sampling sites.
Energies 15 02692 g002
Figure 3. Petrographic and mineralogical analyses: (a) OPTA-TECH LAB-40 HAL polarizing diagnostic microscope; (b) thin sections.
Energies 15 02692 g003
Figure 4. Examples of rock samples for physical and mechanical property tests.
Energies 15 02692 g004
Figure 5. View of selected sandstone samples during the abrasivity test.
Energies 15 02692 g005
Figure 6. Examples of tested Carboniferous sandstones.
Energies 15 02692 g006
Figure 7. Wavy quenching of light on quartz grains (Qz), surrounded by clay binder: crossed polars—100× magnification.
Energies 15 02692 g007
Figure 8. Muscovite (Ms) and quartz grains (Qz): (a) one polar and (b) crossed polars—100× magnification.
Energies 15 02692 g008
Figure 9. Biotite (Bt) and quartz (Qz) surrounded by clay binder and microcrystalline quartz (Qz*): (a) one polar; (b) crossed polars—100× magnification.
Energies 15 02692 g009
Figure 10. Micropertites on feldspar grains (Fsp), surrounded by quartz (Qz), muscovite (Ms), and carbonate binder (Cb): crossed polars—100× magnification.
Energies 15 02692 g010
Figure 11. Grains of plagioclase (Pl) and quartz (Qz) surrounded by clay binder: crossed polars—100× magnification.
Energies 15 02692 g011
Figure 12. Zirconium (Zrn): crossed polars—100× magnification.
Energies 15 02692 g012
Figure 13. Tourmaline (Tur): crossed polars, 100× magnification.
Energies 15 02692 g013
Figure 14. Quartz grains (Qz) surrounded by clay binder: crossed polars—100× magnification.
Energies 15 02692 g014
Figure 15. Crumbs of carbonaceous matter: one polar—100× magnification.
Energies 15 02692 g015
Figure 16. Classification of tested sandstones according toFolk triangle [24,25].
Energies 15 02692 g016
Figure 17. Classification of tested sandstones according to the Dott–Pettijohn triangle [24,25].
Energies 15 02692 g017
Figure 18. Relationship between effective porosity and water absorption coefficient.
Energies 15 02692 g018
Figure 19. Relationship between porosity and bulk density.
Energies 15 02692 g019
Figure 20. Relationship between USC and BTS.
Energies 15 02692 g020
Figure 21. Graph illustrating the lack of relationship between USC and abrasivity index Wz.
Energies 15 02692 g021
Figure 22. Relationship between quartz content and abrasivity index Wz of tested sandstones.
Energies 15 02692 g022
Figure 23. Relationship between cement content and abrasivity index Wz of tested sandstones.
Energies 15 02692 g023
Table 1. Planimetric analysis of sandstones.
MineralContent of Minerals [%]
No of Sample
K1K2K3J1J2B1L1
Framework grainsQuartz61.545.761.360.046.456.356.6
Feldspars2.01.04.53.53.42.15.2
Muscovite6.7-2.64.43.04.24.1
Biotite--1.35.15.79.48.1
Lithic fragments-----3.0-
Heavy minerals0.71.0-----
CementMicrocrystalline quartz5.22.97.715.36.99.38.1
Clay minerals14.23.811.66.56.66.315.6
Carbonates6.745.69.72.228.04.22.3
Iron compounds--1.33.0---
Carbonaceous matter3.00----5.2-
Σ100.0100.0100.0100.0100.0100.0100.0
Table 2. Participation of framework grains and cement in sandstones.
ComponentContent [%]
No of Sample
K1K2K3J1J2B1L1
Framework grains70.947.769.77358.57574
Cement29.152.330.32741.52526
Σ100.0100.0100.0100.0100.0100.0100.0
Table 3. Bulk density, effective porosity, and water absorption coefficient of the tested sandstones.
PropertyNo of Sample
K1K2K3J1J2B1L1
γs [g/cm3]2.34 ± 0.012.69 ± 0.042.31 ± 0.012.25 ± 0.002.62 ± 0.032.28 ± 0.012.28 ± 0.01
Pw [%]5.5 ± 0.61.5 ± 0.14.8 ± 0.56.8 ± 0.72.3 ± 0.210.1 ± 1.08.2 ± 0.9
Ns [%]2.12 ± 0.480.58 ± 0.051.85 ± 0.202.62 ± 0.610.88 ± 0.073.88 ± 0.903.16 ± 0.72
Table 4. Uniaxial compression strength, tensile strength, and abrasivity index of the tested sandstones.
PropertyNo of Sample
K1K2K3J1J2B1L1
UCS [MPa]29.4 ± 2.724.7 ± 2.519.4 ± 1.622.4 ± 2.264.6 ± 5.830.1 ± 2.820.8 ± 2.0
BTS [MPa]3.32 ± 0.043.18 ± 0.032.81 ± 0.023.11 ± 0.036.10 ± 0.73.58 ± 0.042.92 ± 0.02
Wz [-]3.9 ± 0.30.2 ± 0.01.7 ± 0.22.4 ± 0.21.5 ± 0.11.2 ± 0.11.6 ± 0.1
Publisher’s Note: MDPI stays neutral with regard to jurisdictional claims in published maps and institutional affiliations.

