
Evaluation of the Effects of Yielding Rockbolts on Controlling Self-Initiated Strainbursts: A Numerical Study


Abstract
:1. Introduction
2. Validation of UDEC in Modeling Self-Initiated Strainbursts
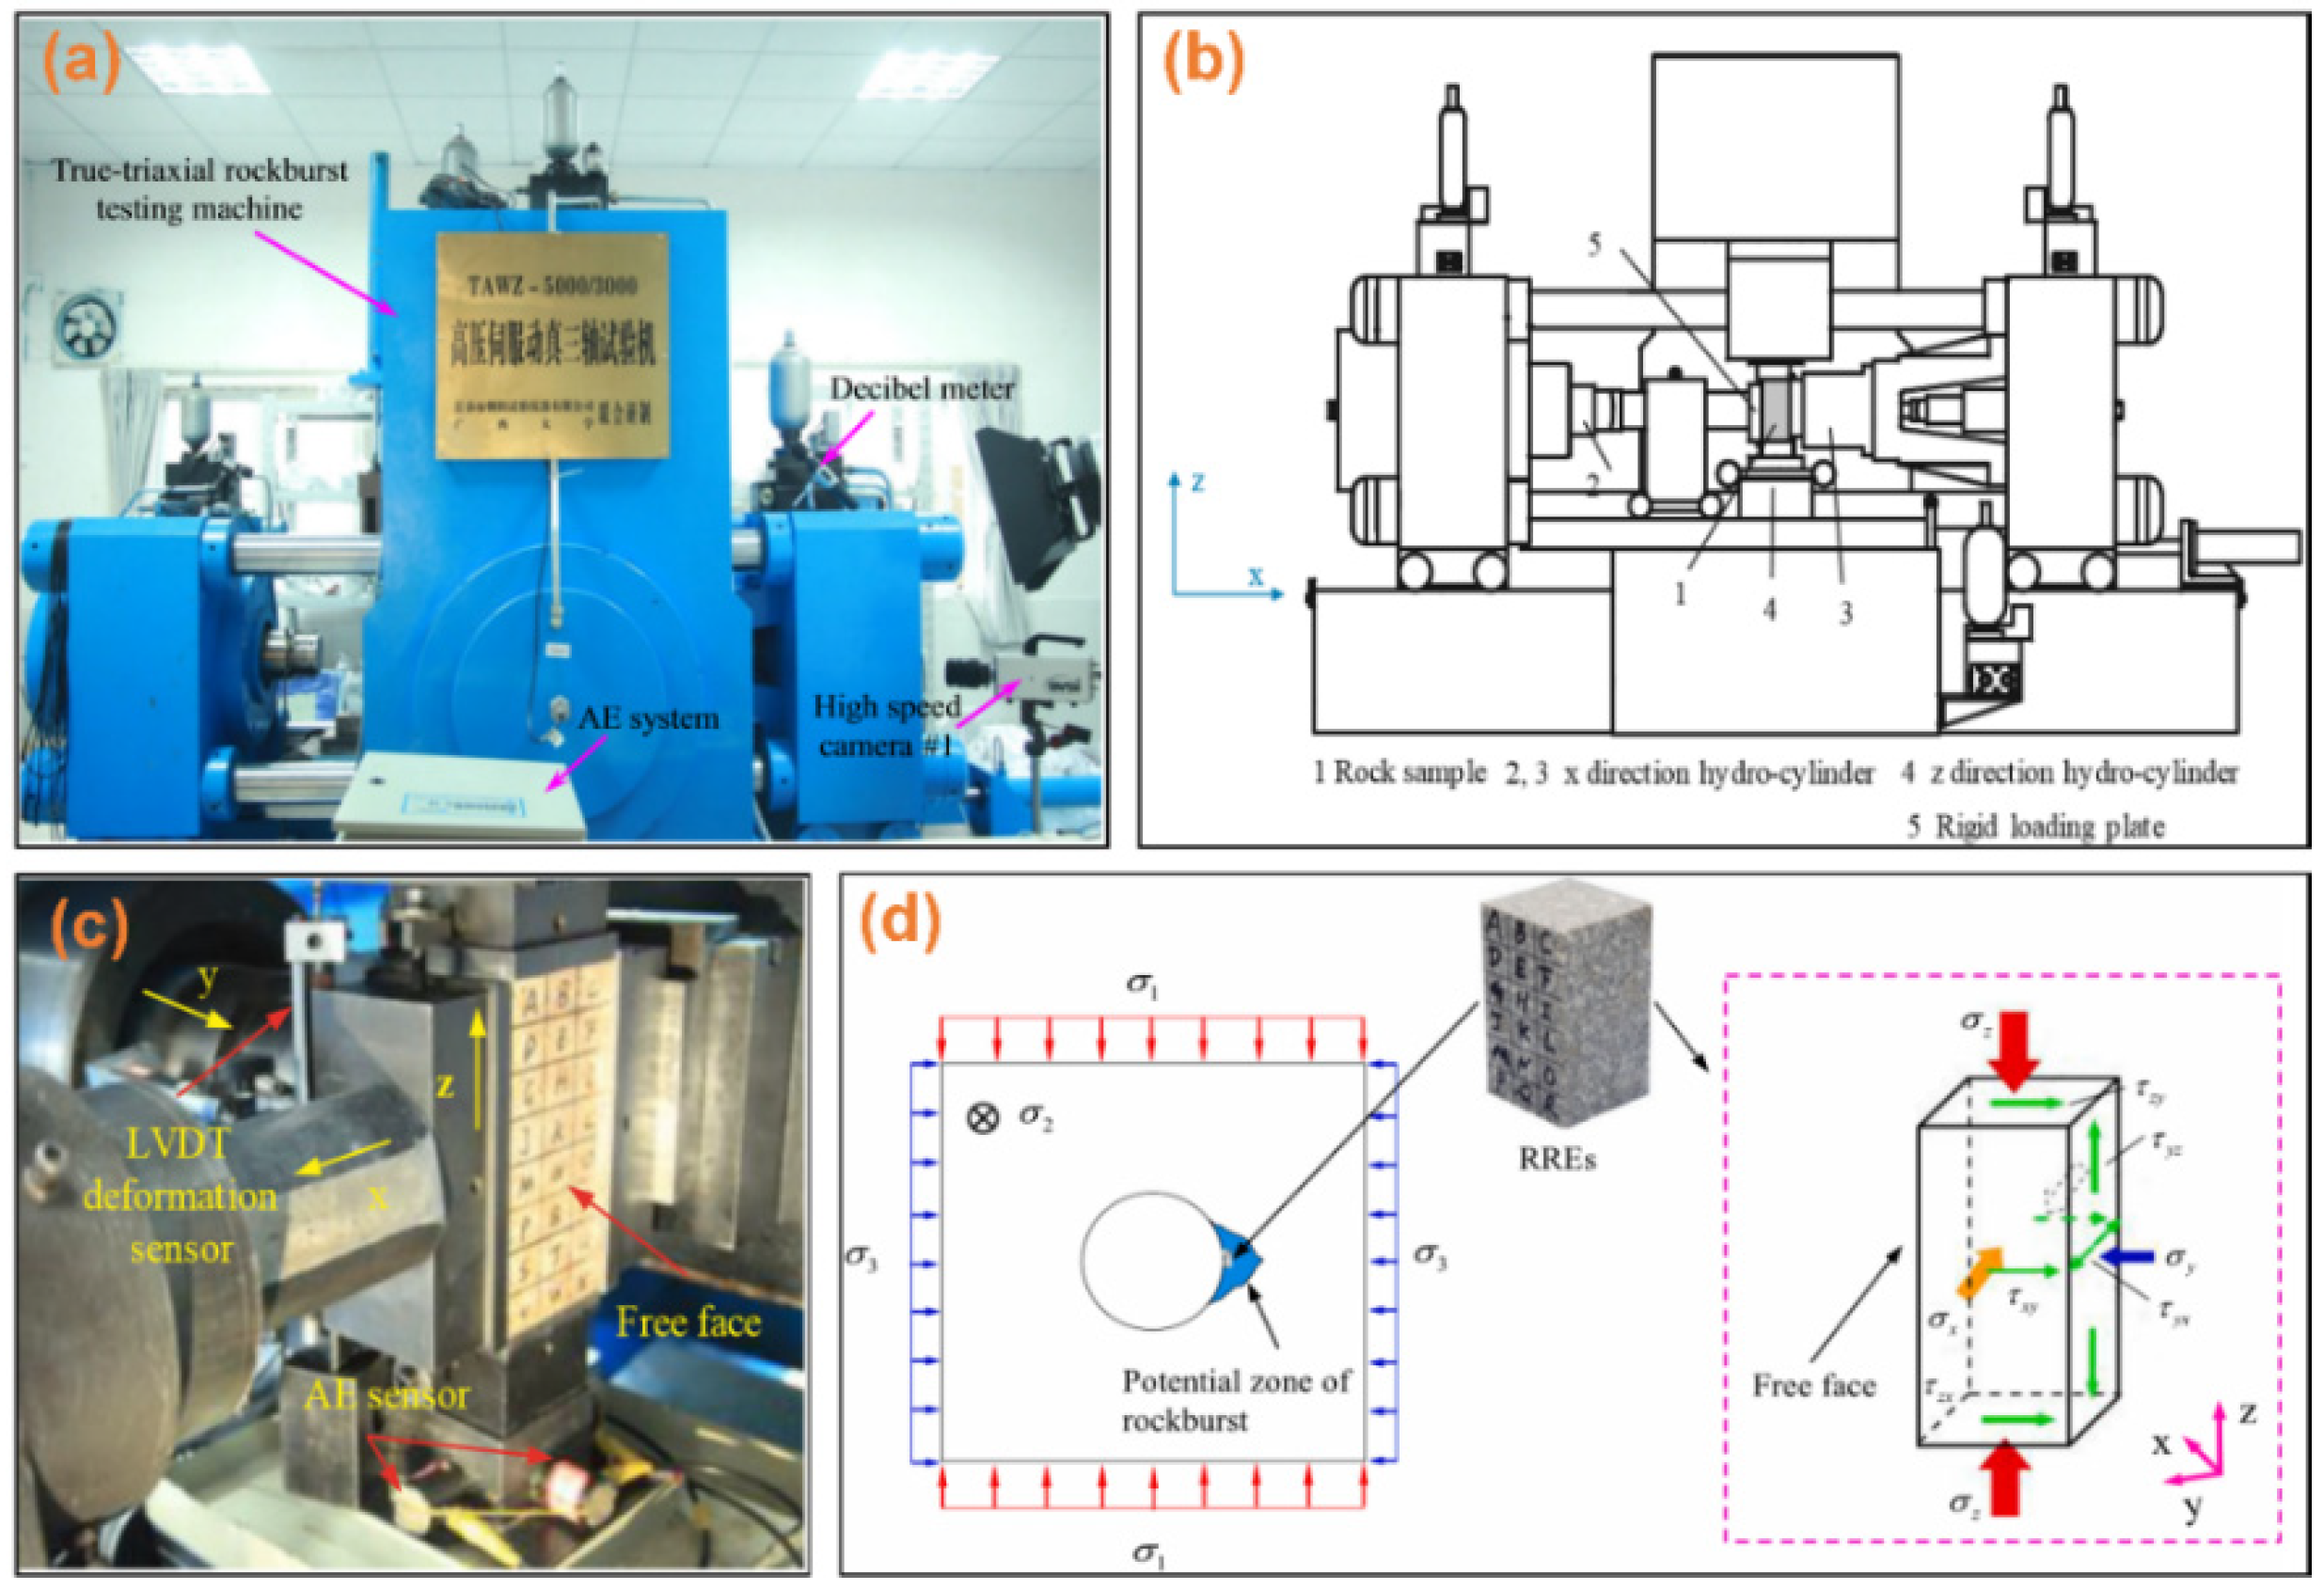
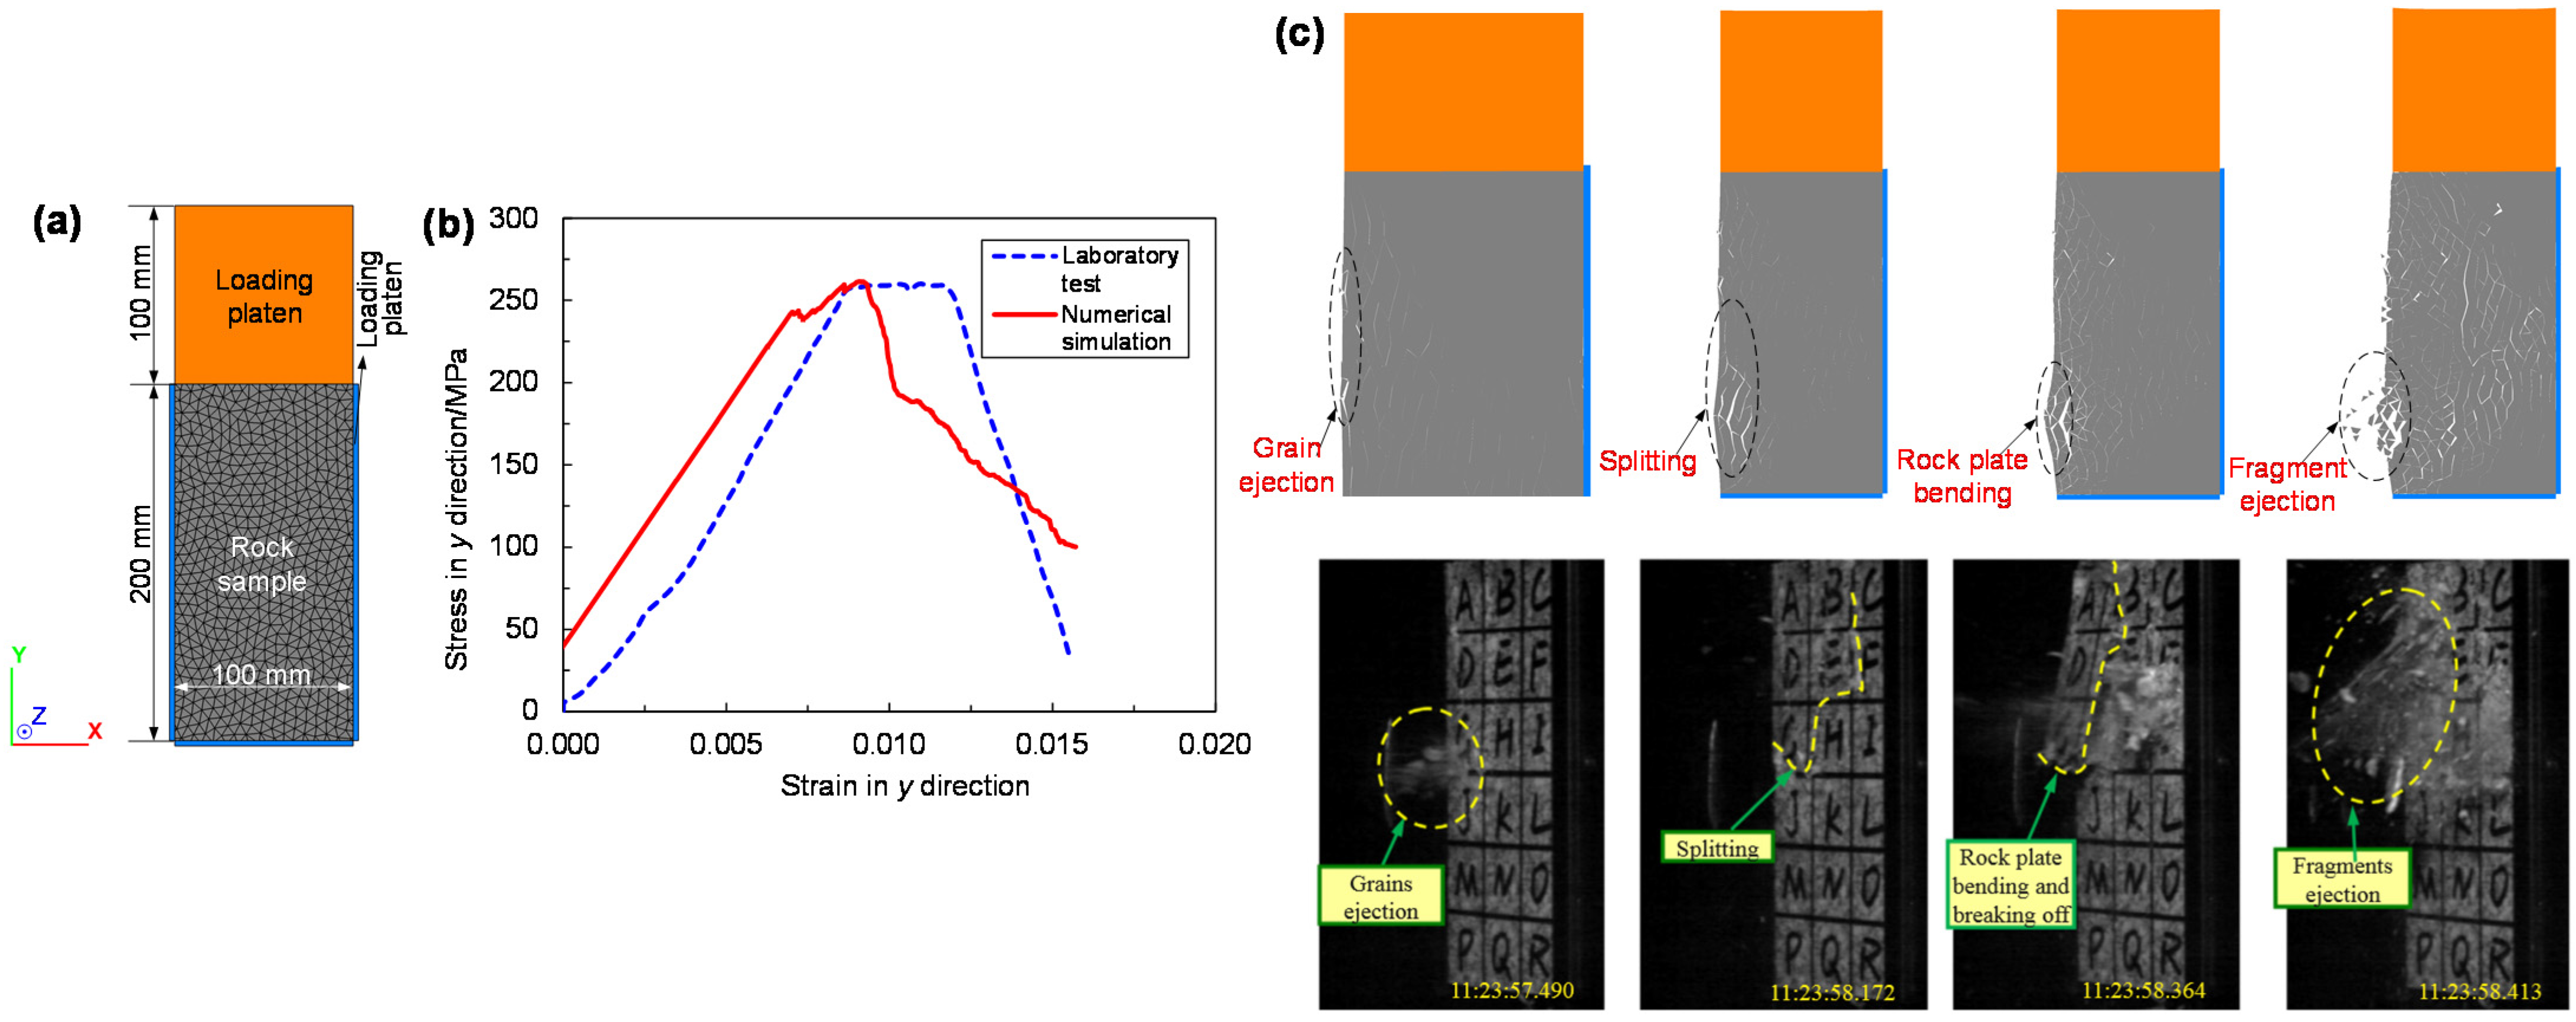
2.1. Brief Introduction of the True Triaxial Experiments of Self-Initiated Strainbursts
2.2. Validation of UDEC Simulation
3. Numerical Modeling
3.1. Model Setup
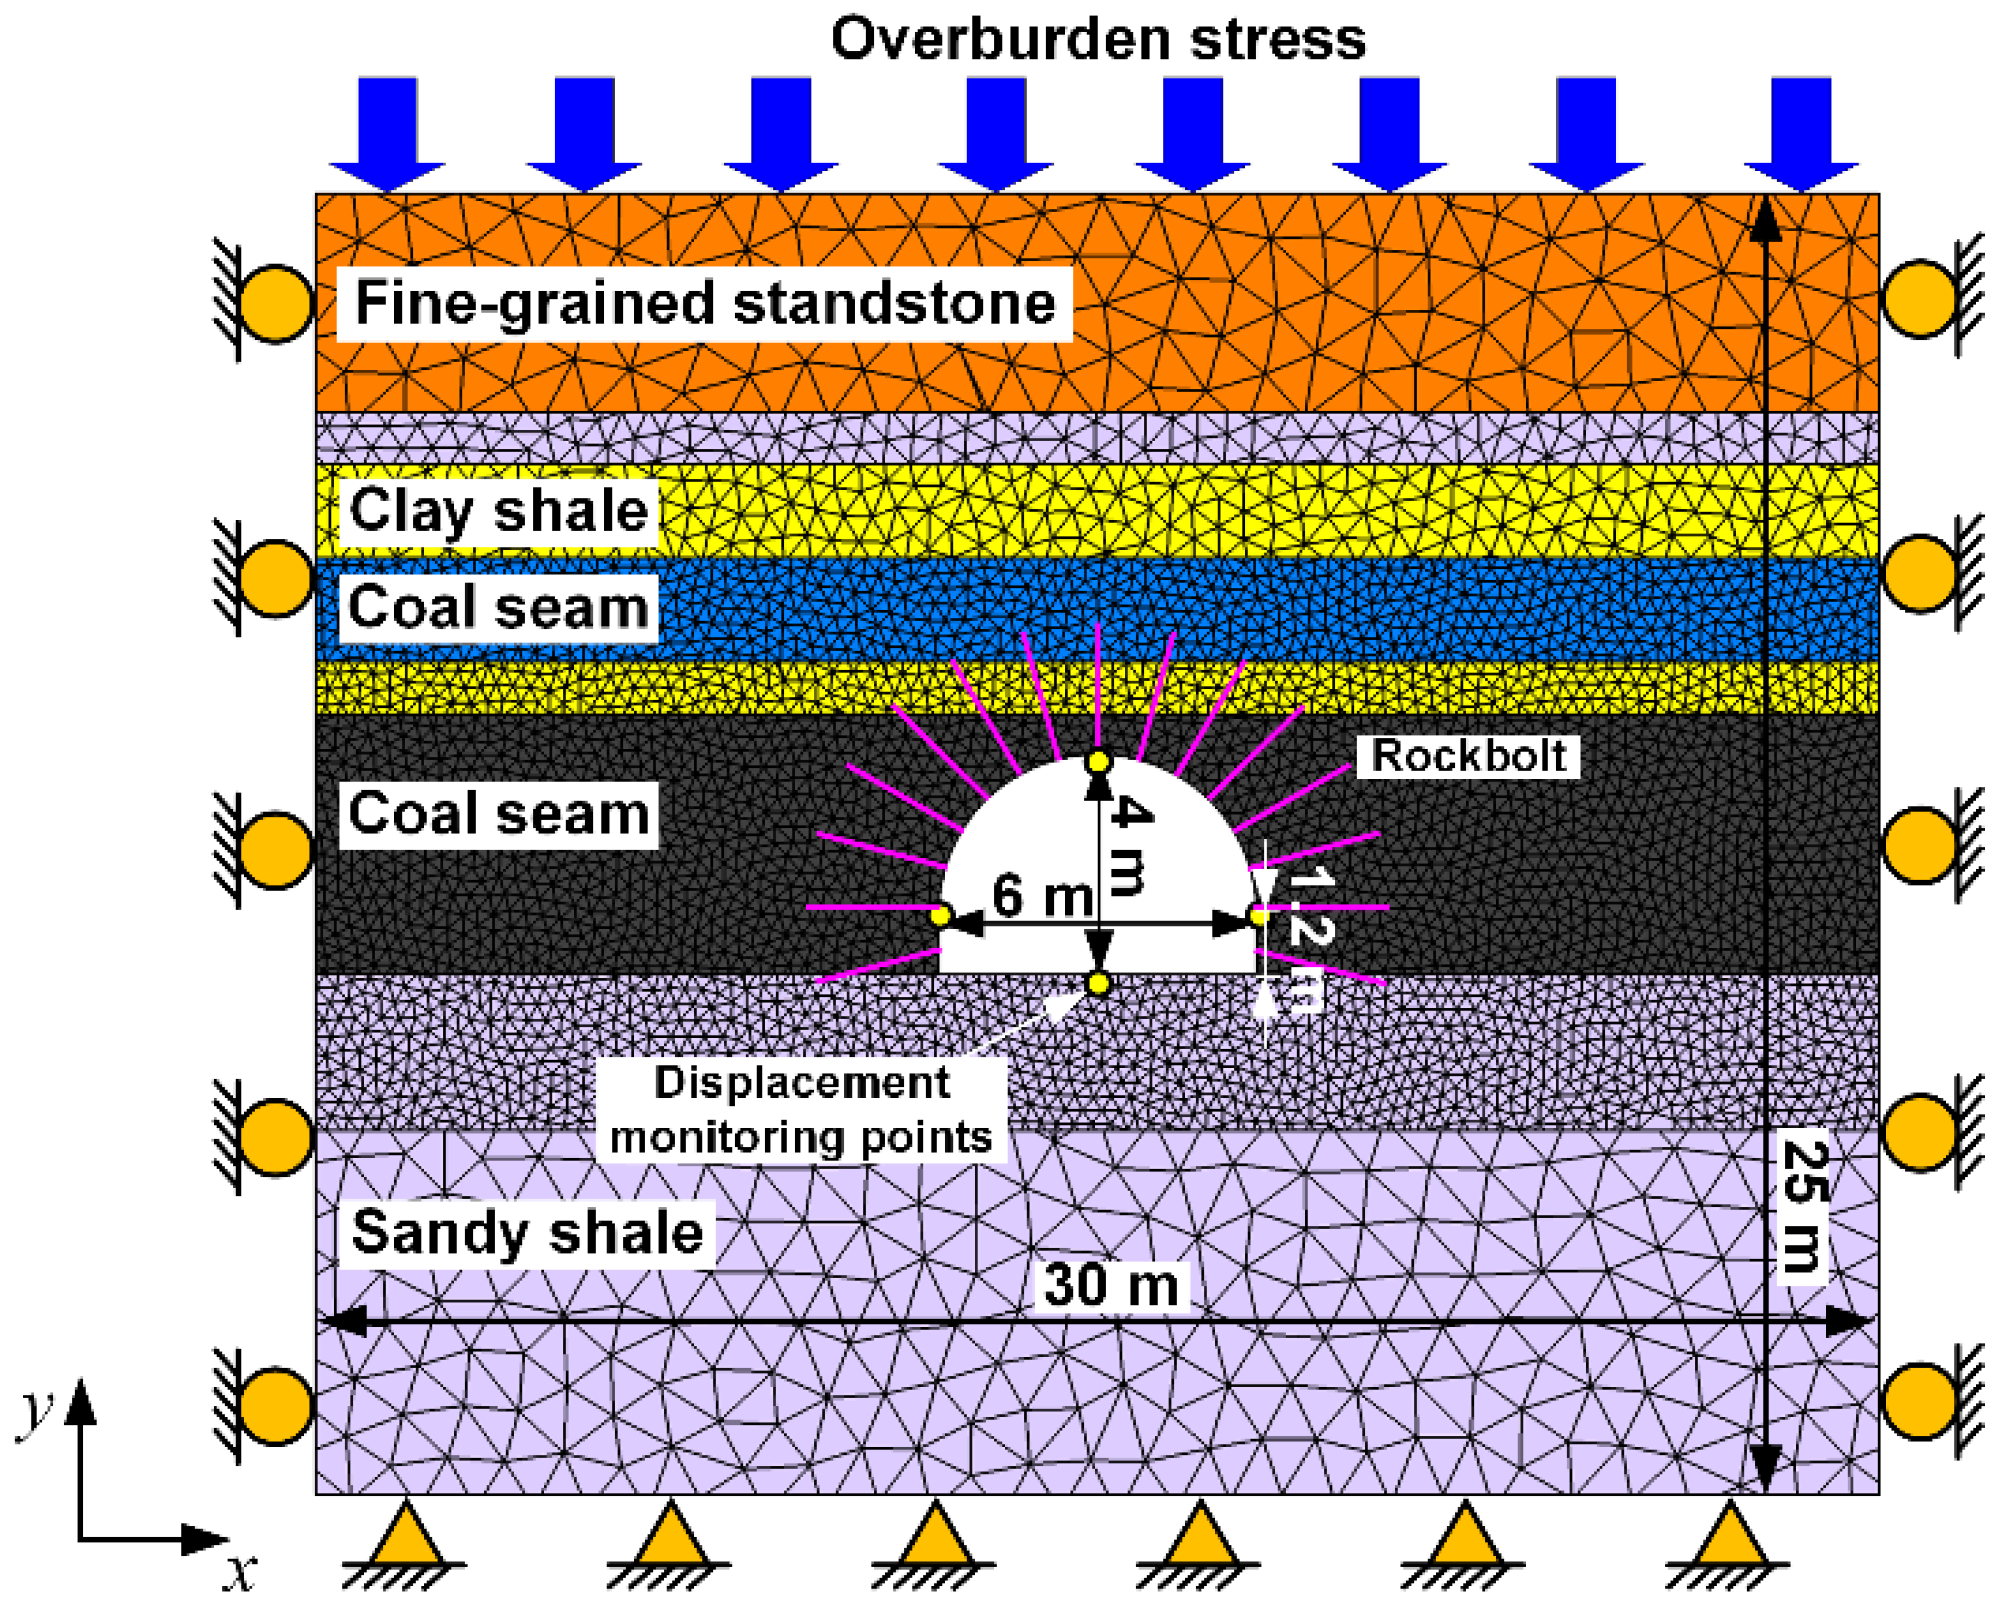
3.1.1. Model Dimensions and Boundary Conditions
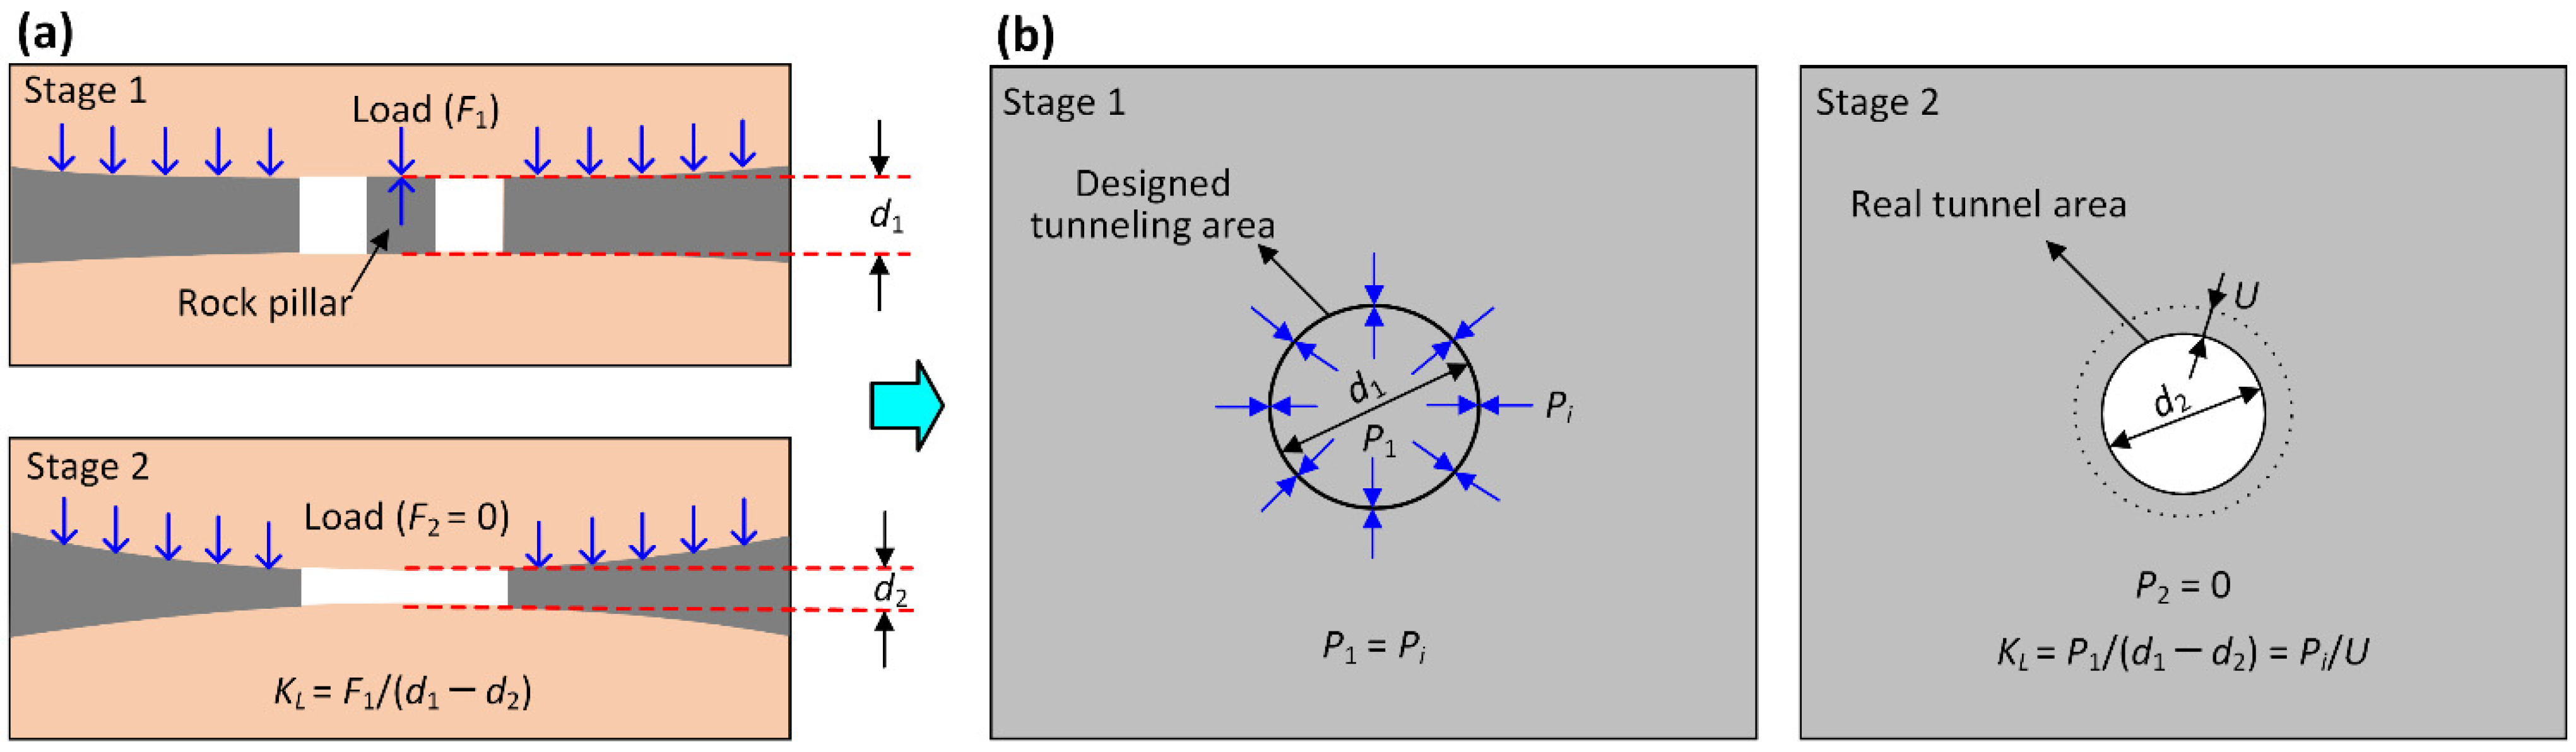
3.1.2. Modeling Large-Scale Strainbursts Based on the Stiffness Theory
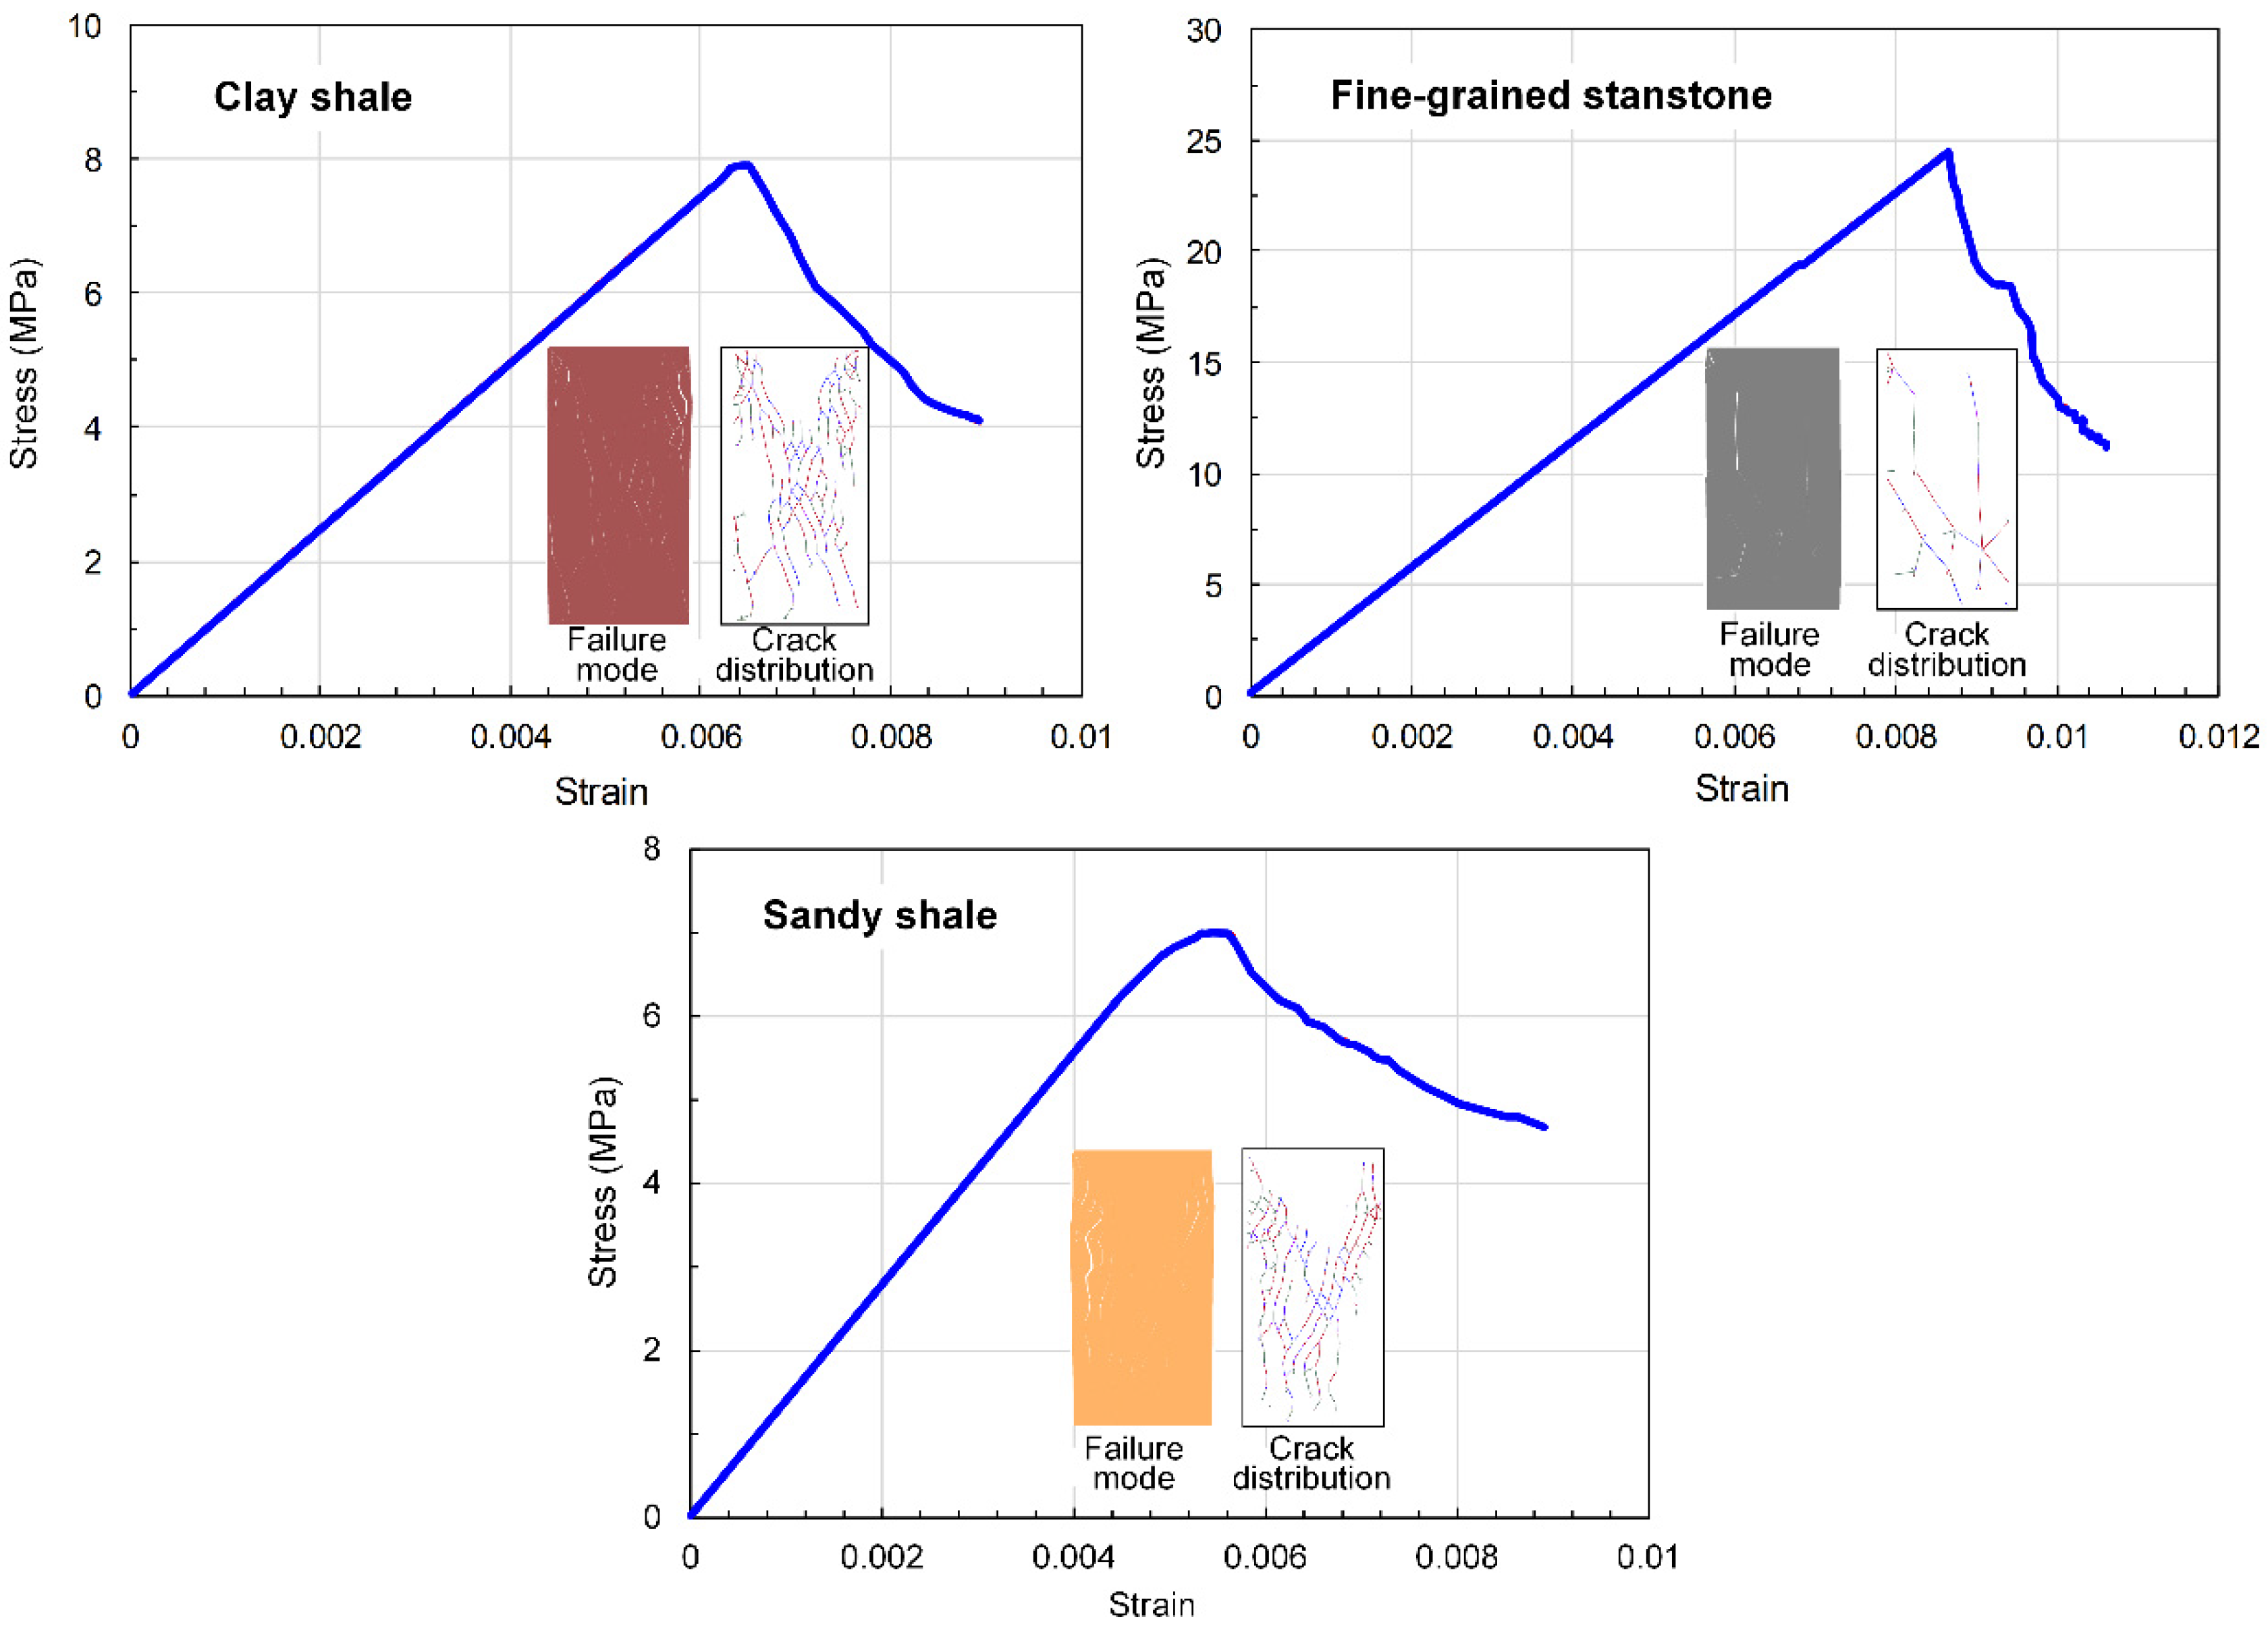
3.1.3. Rock Mass Properties and Constitutive Model
3.2. Properties of Rockbolts
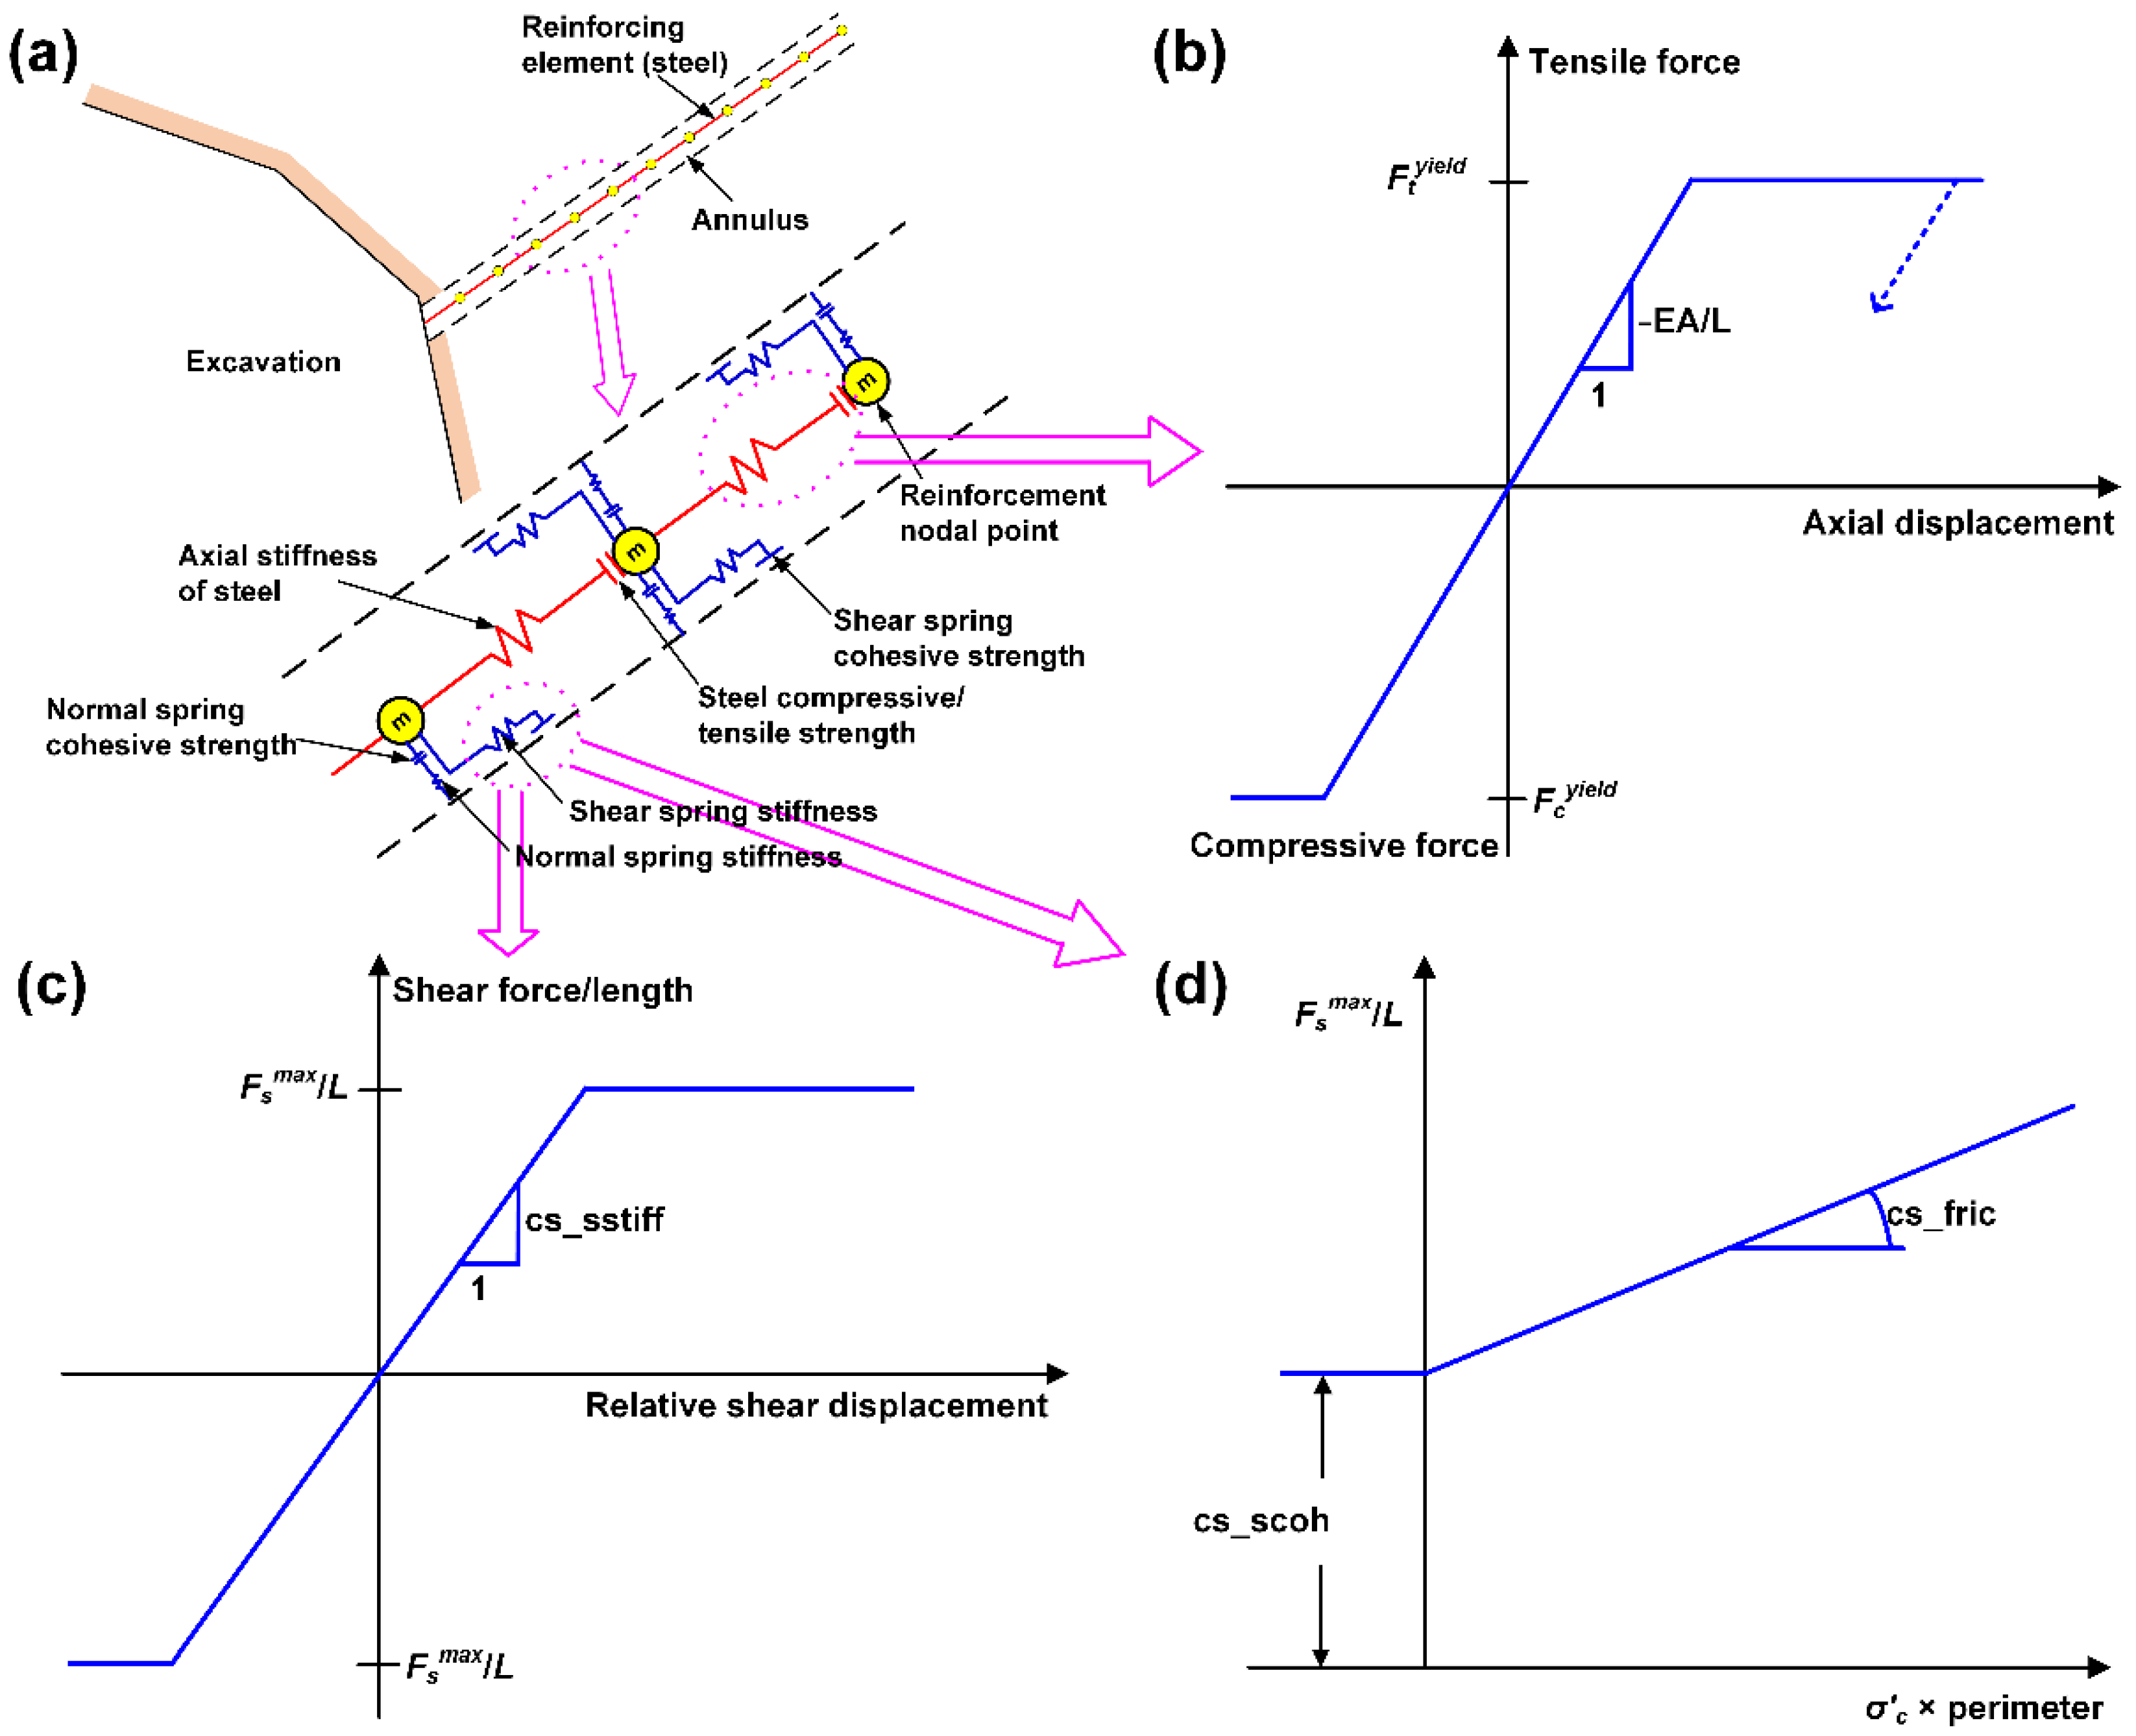
3.2.1. Introduction of the “Rockbolt” Element
3.2.2. Calibration of Rockbolt Properties
3.3. Simulation Procedures and Schemes
4. Analysis of Simulation Results
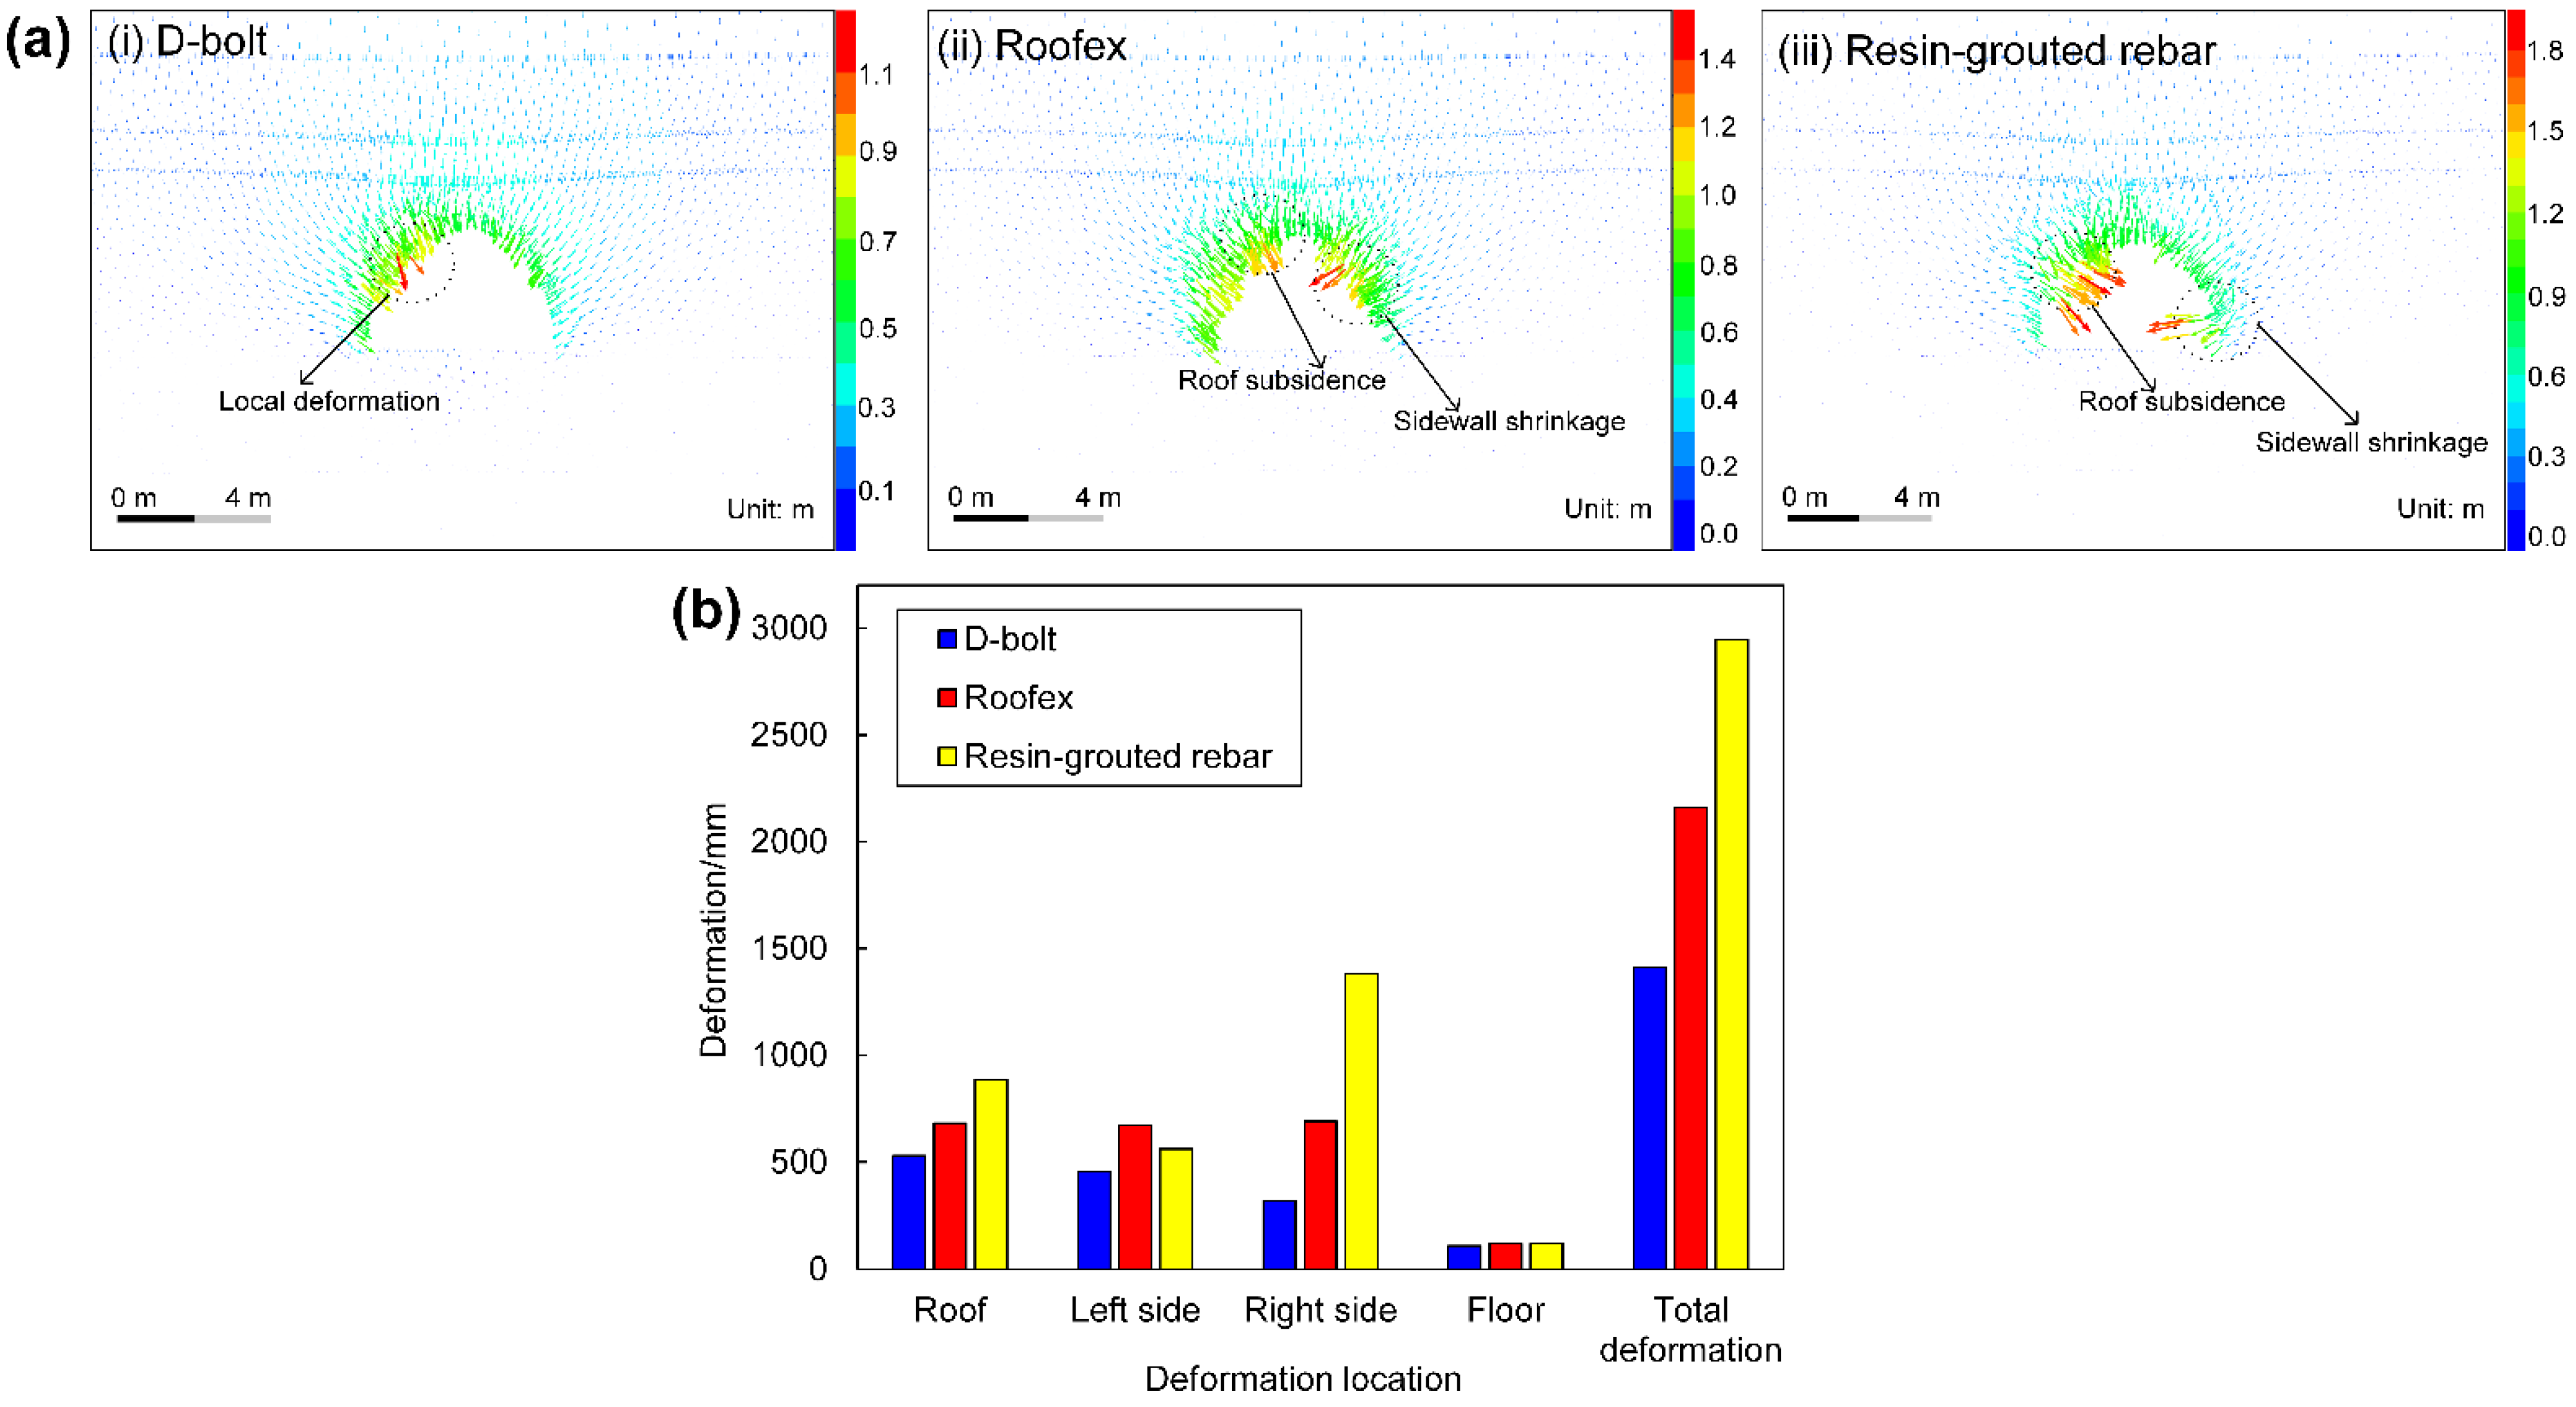
4.1. Displacement and Velocity Analysis
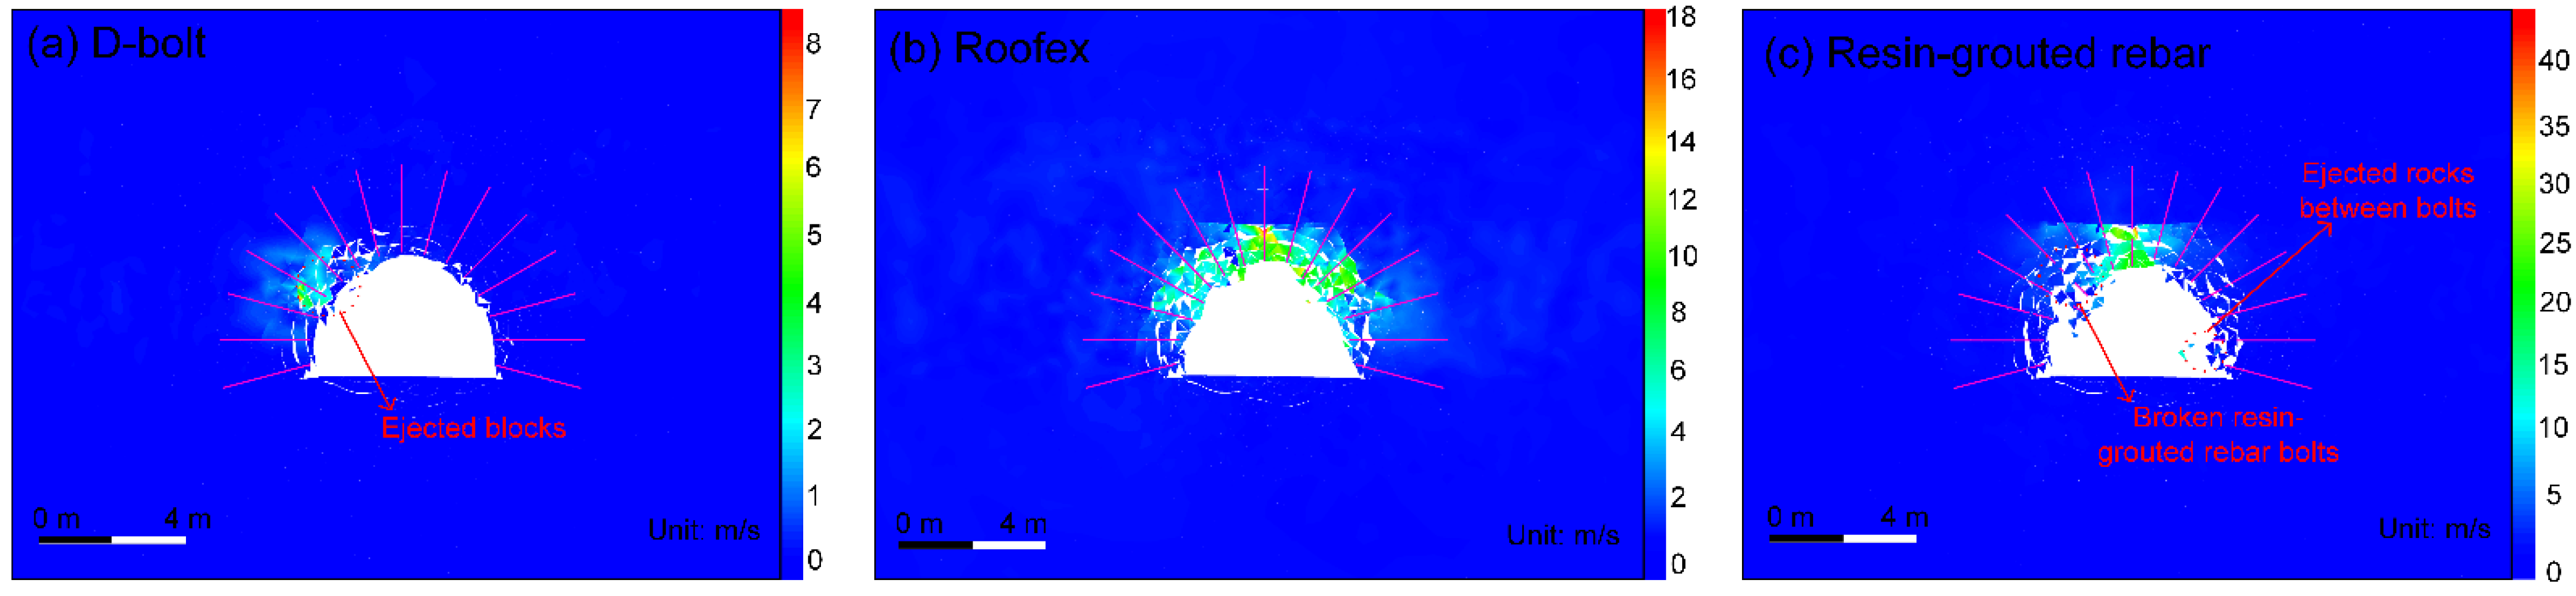
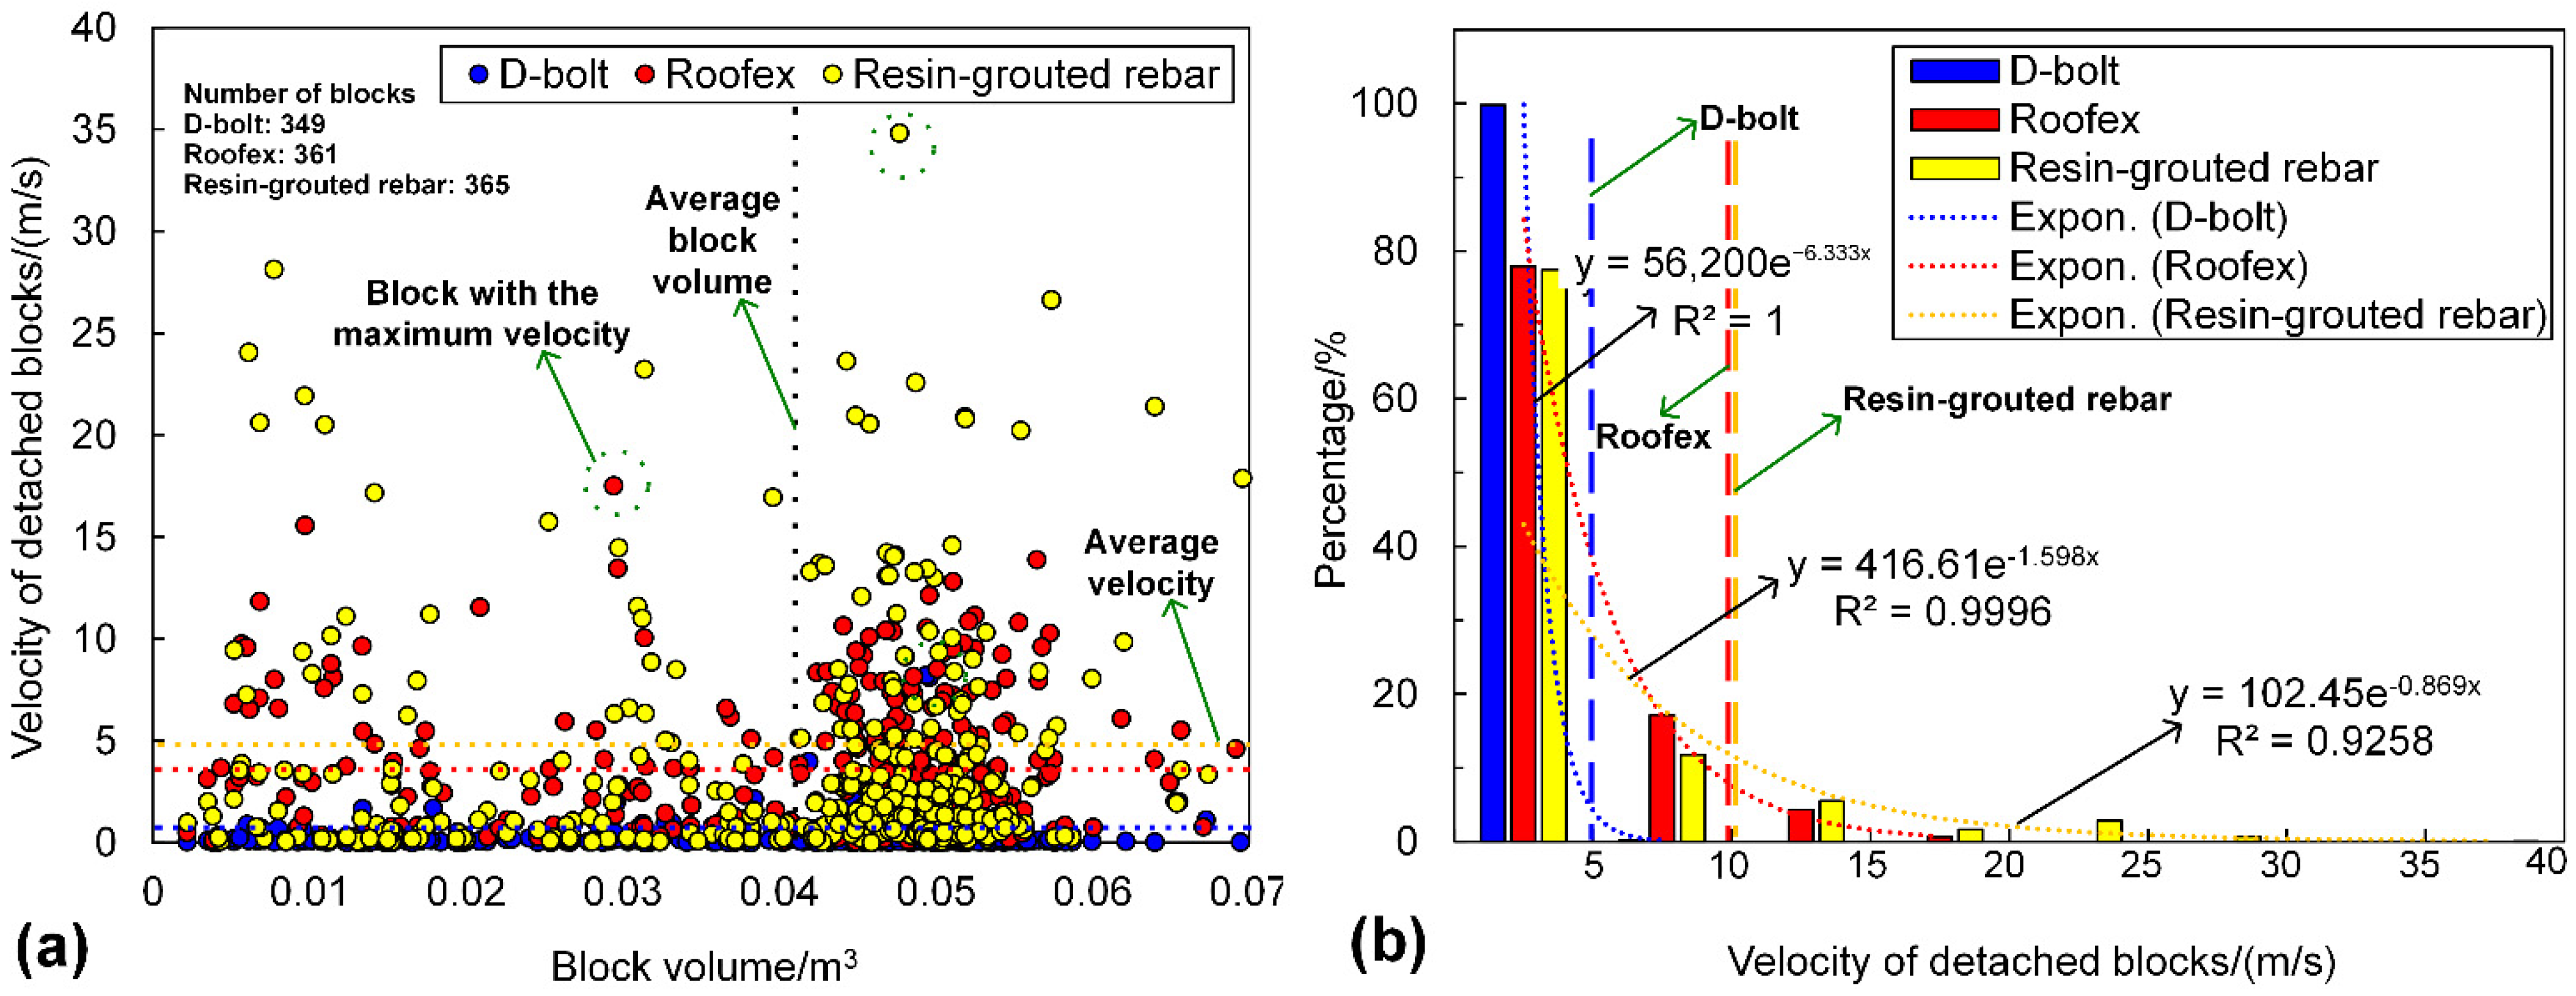
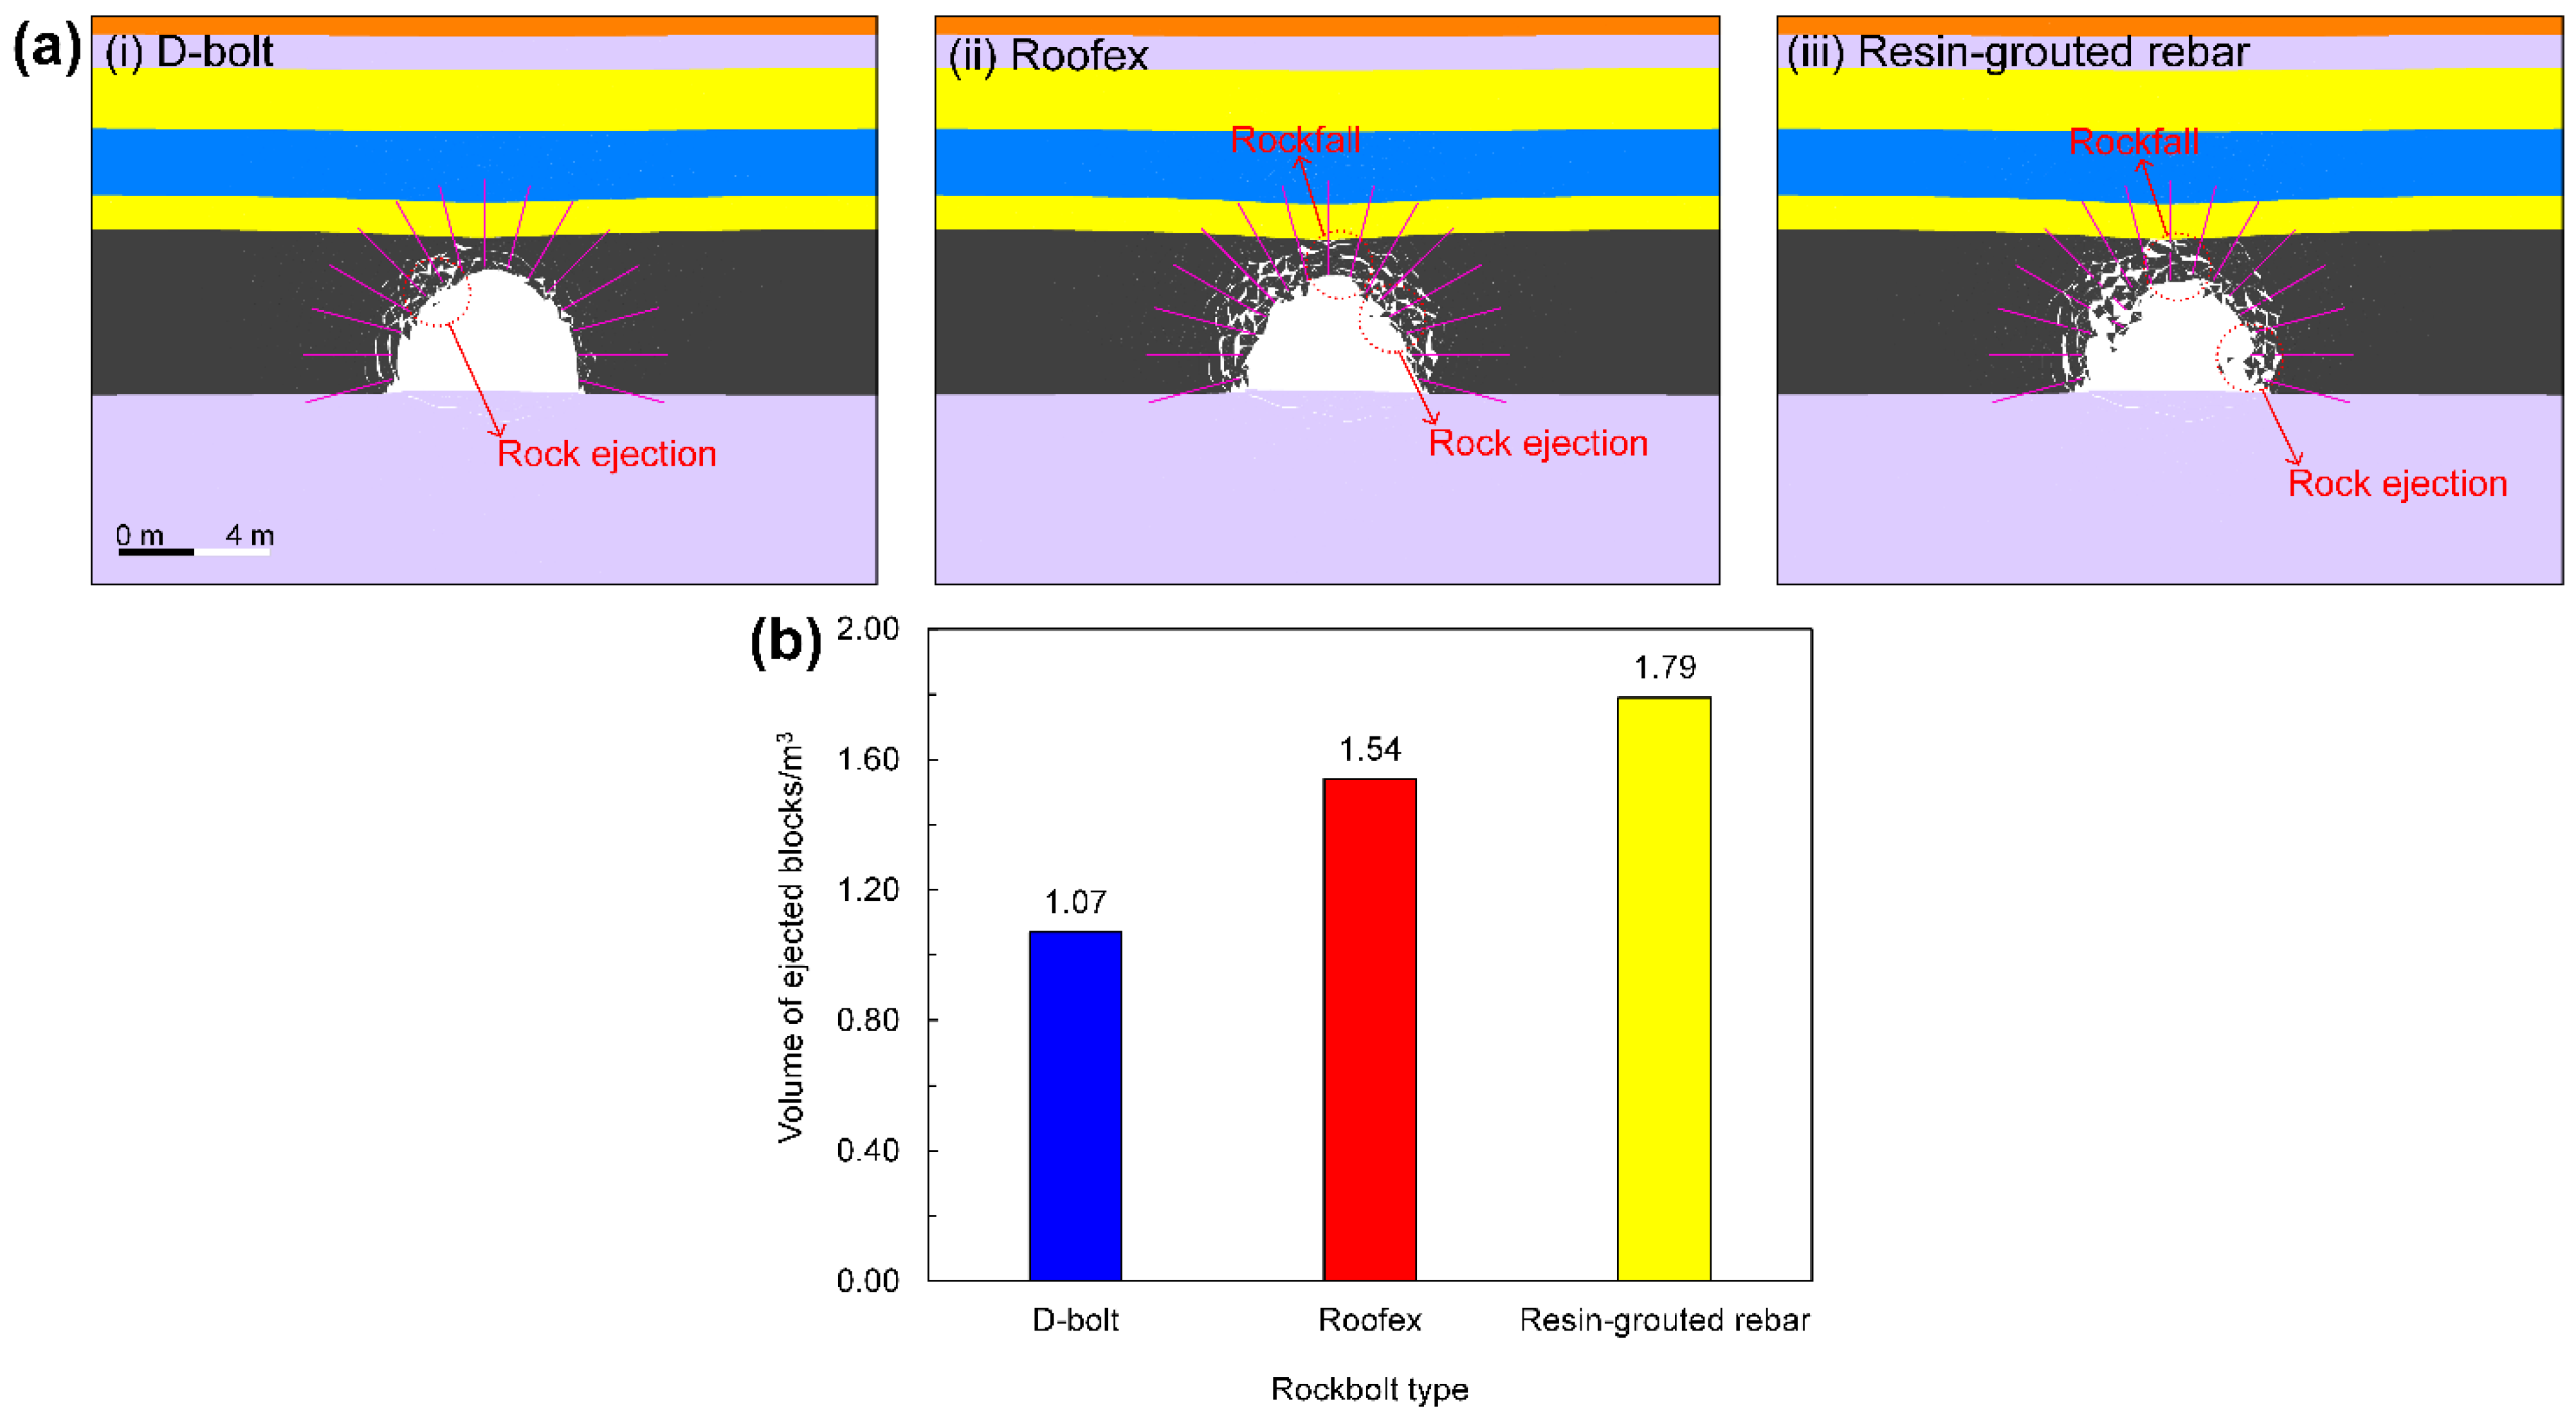
4.2. Rockburst Damage Analysis
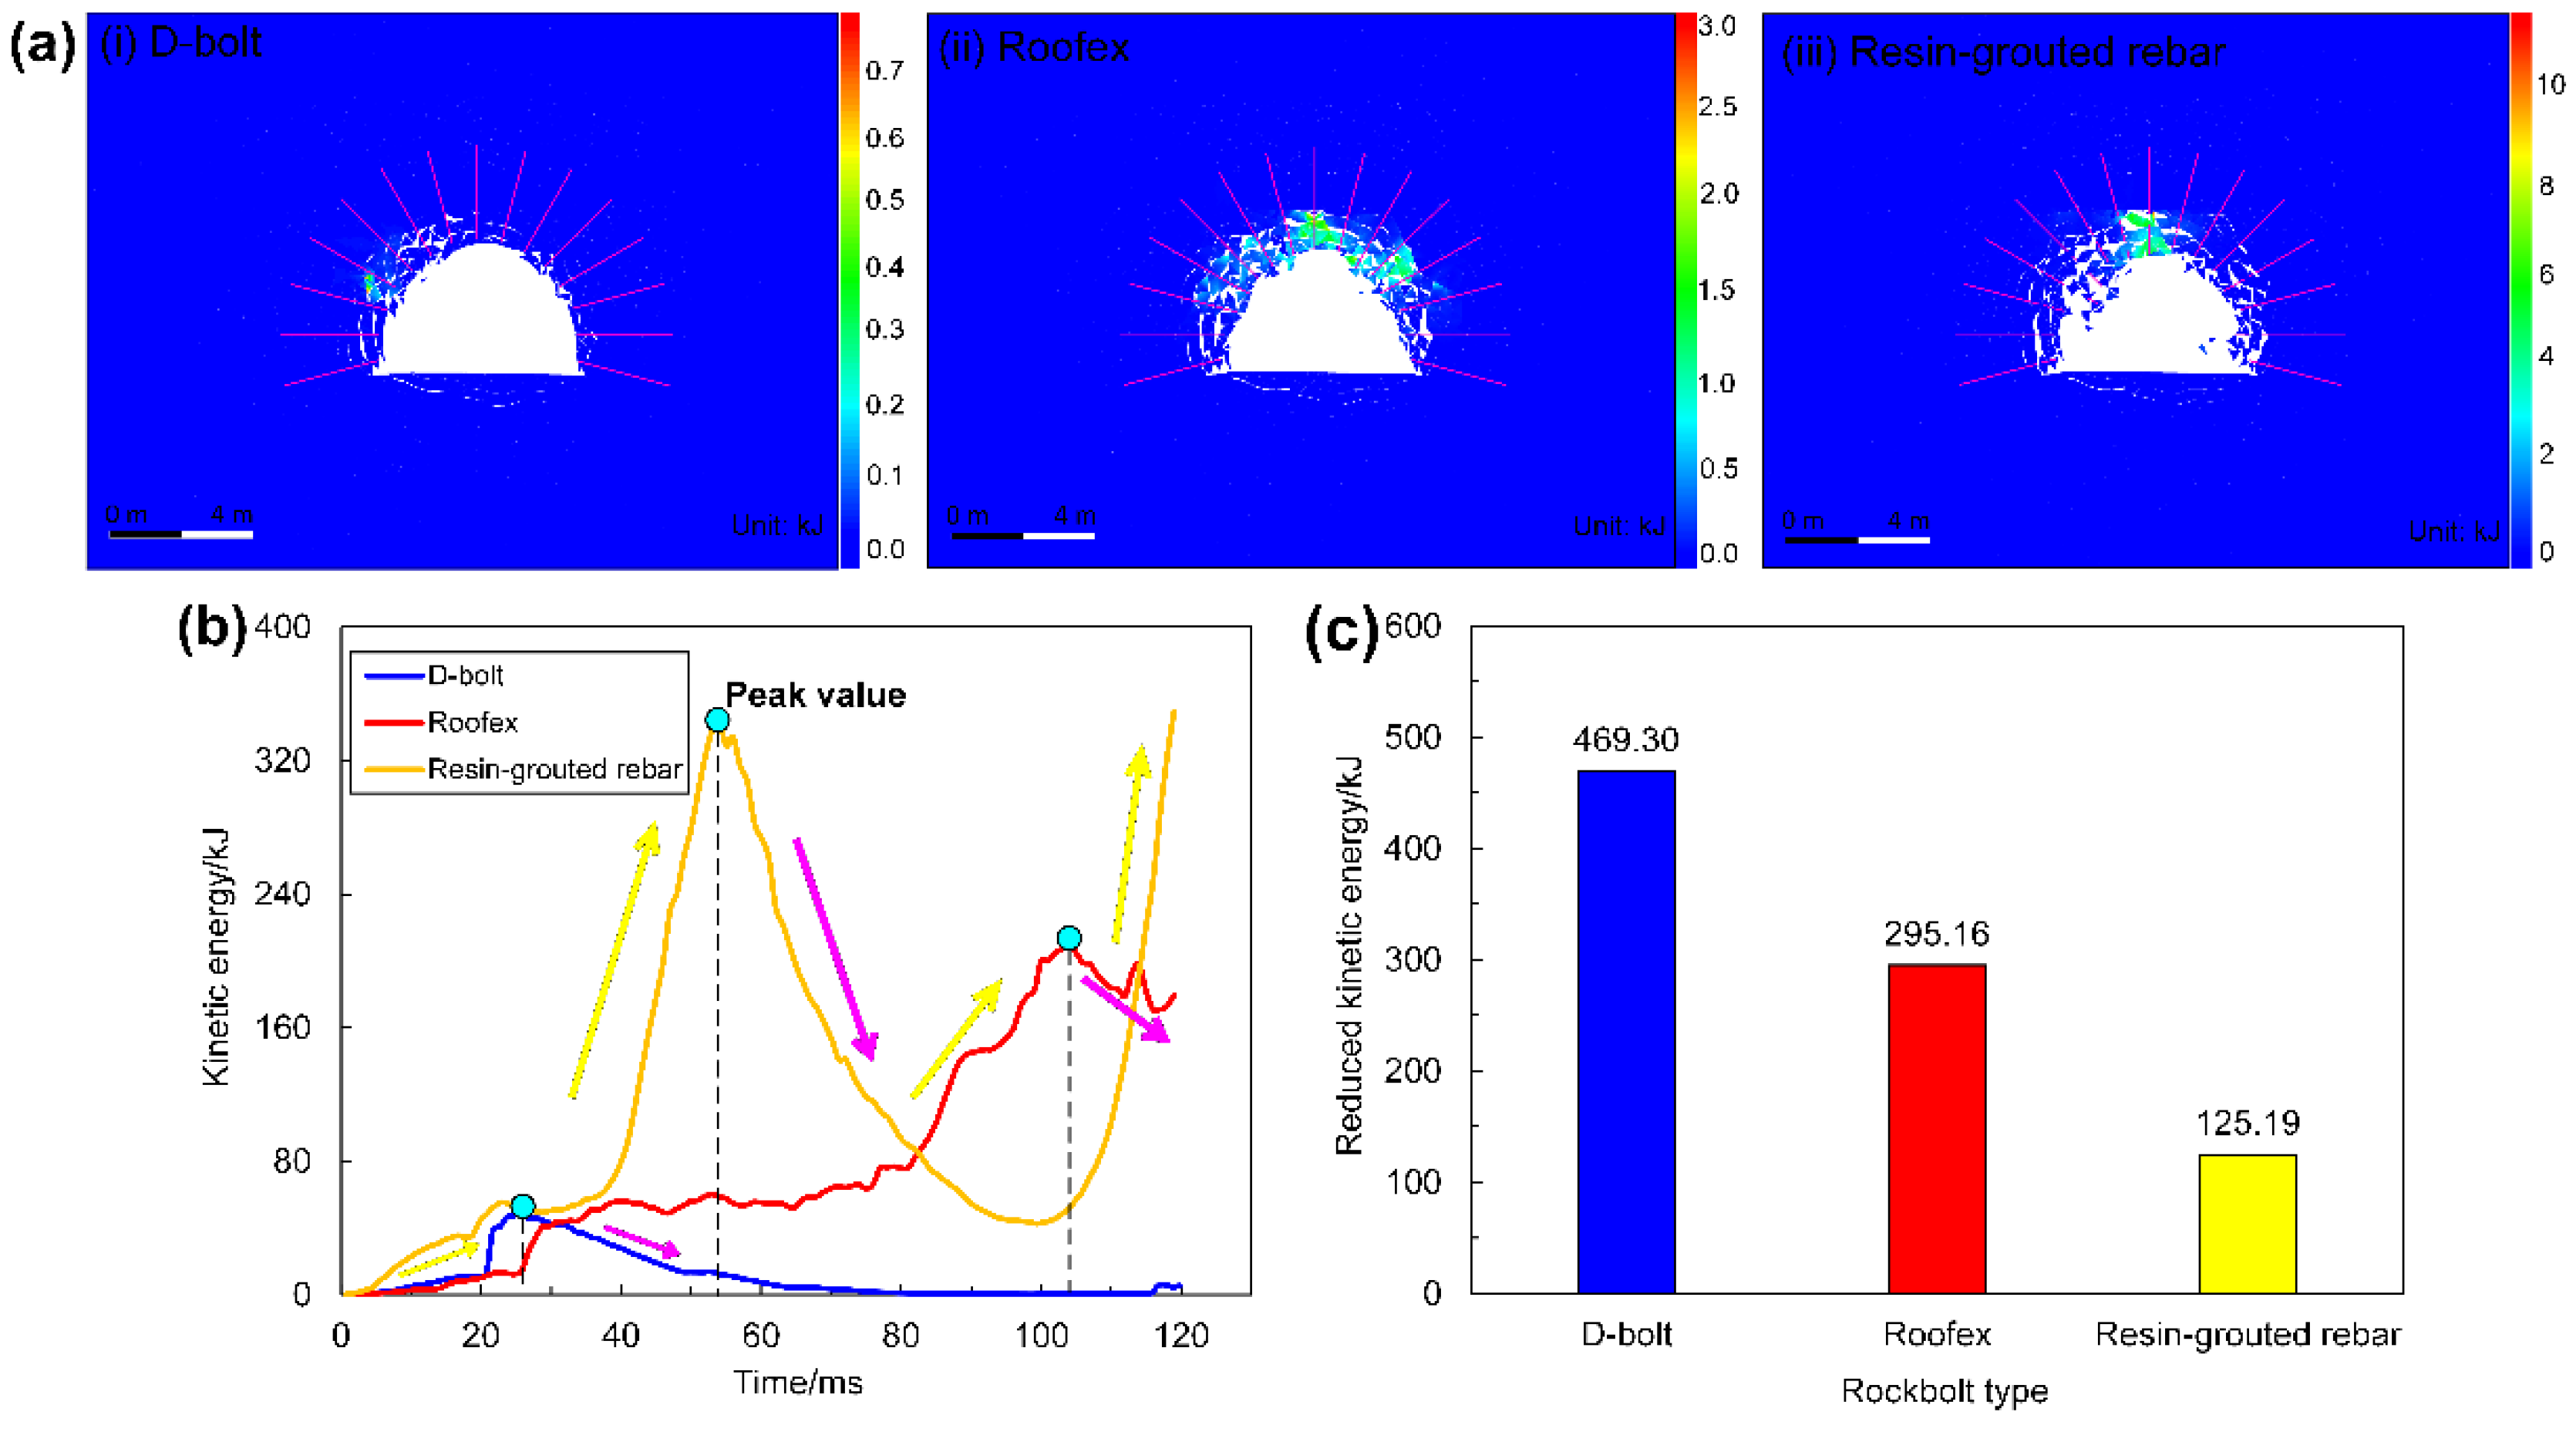
4.3. Energy Evolution Analysis
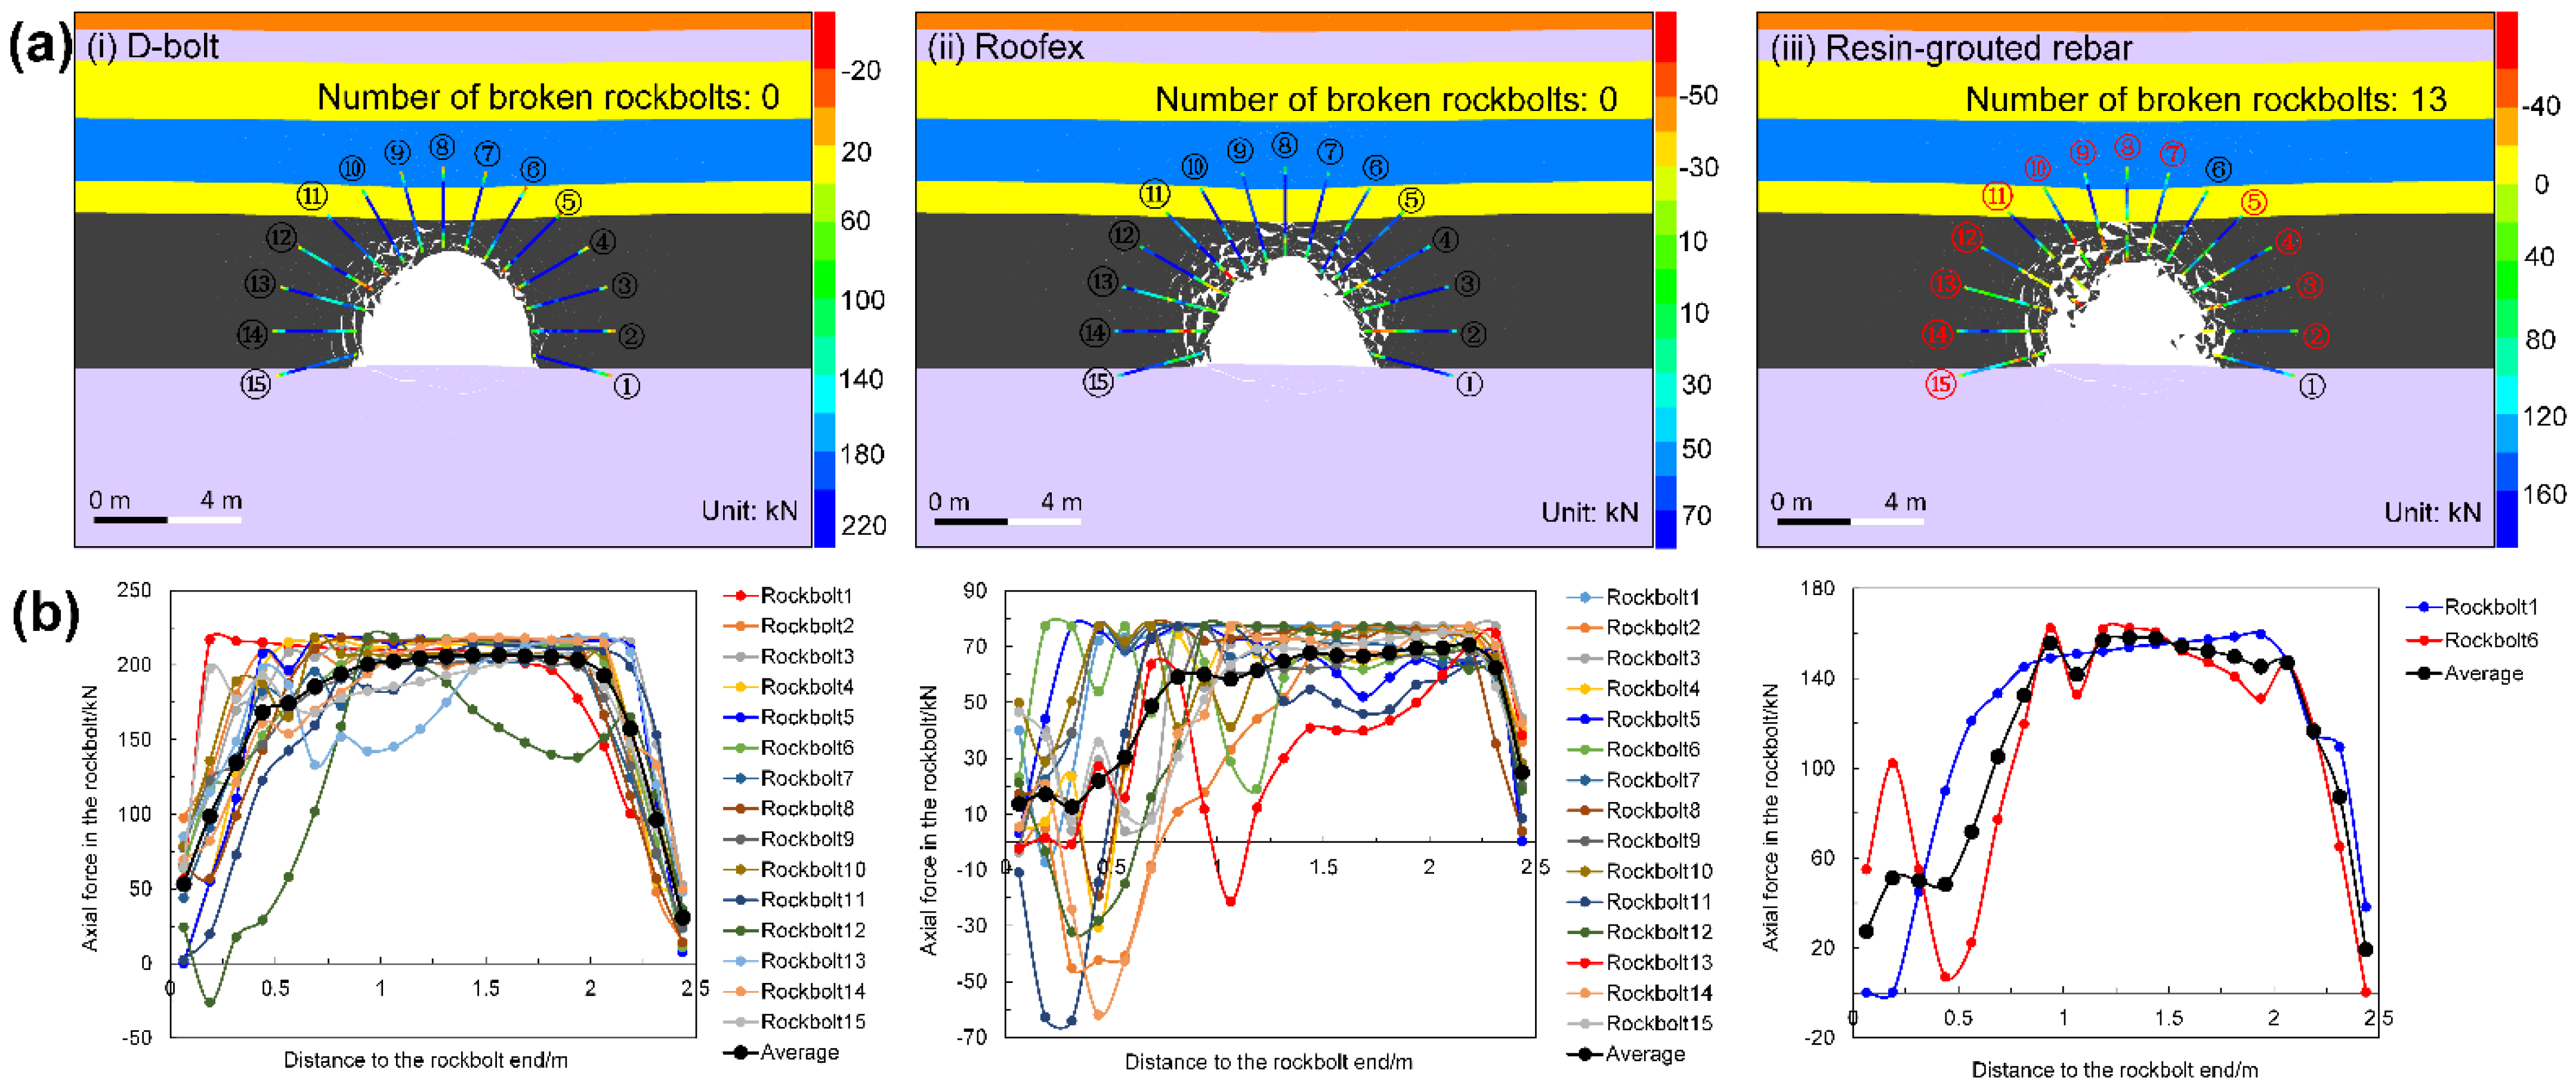
4.4. Rockbolt Force Analysis
5. Discussion
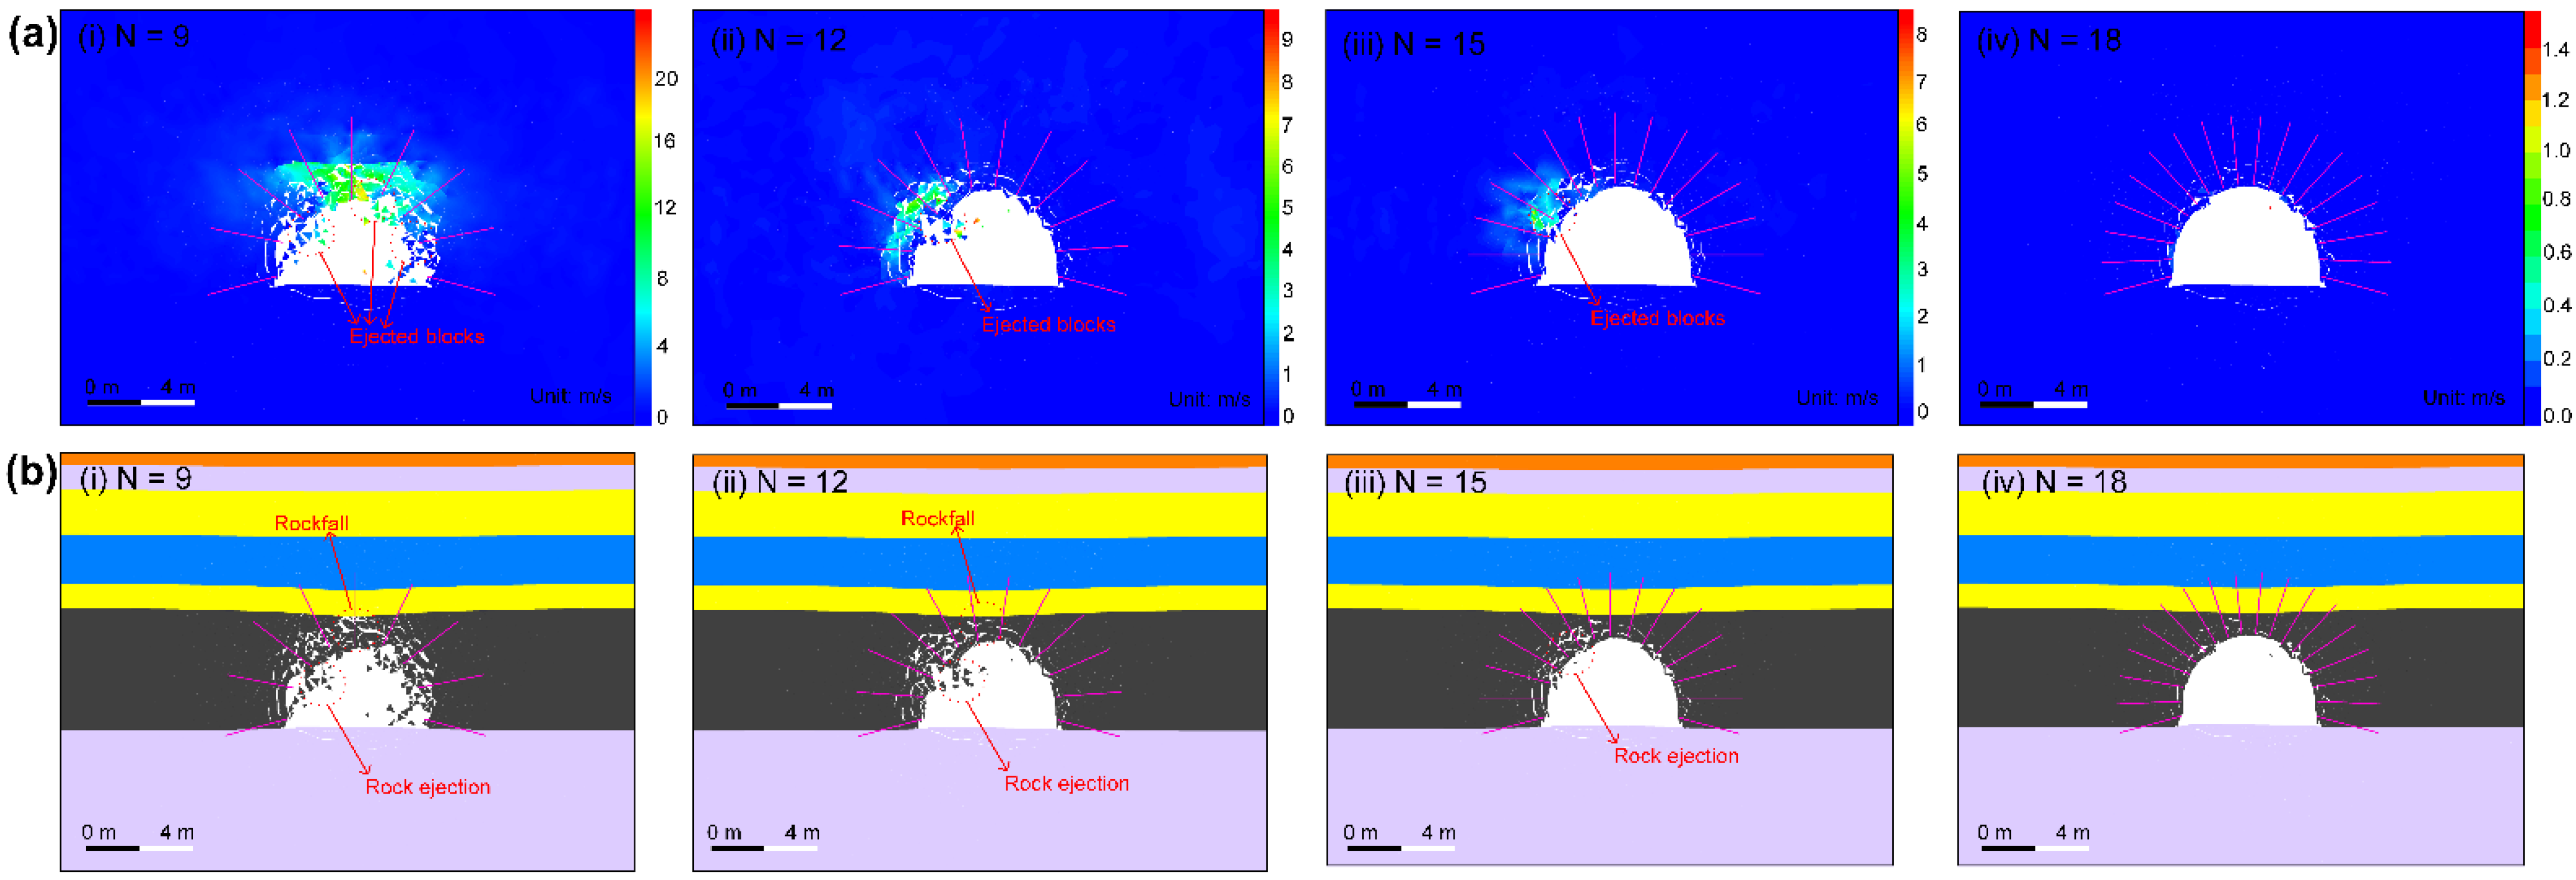
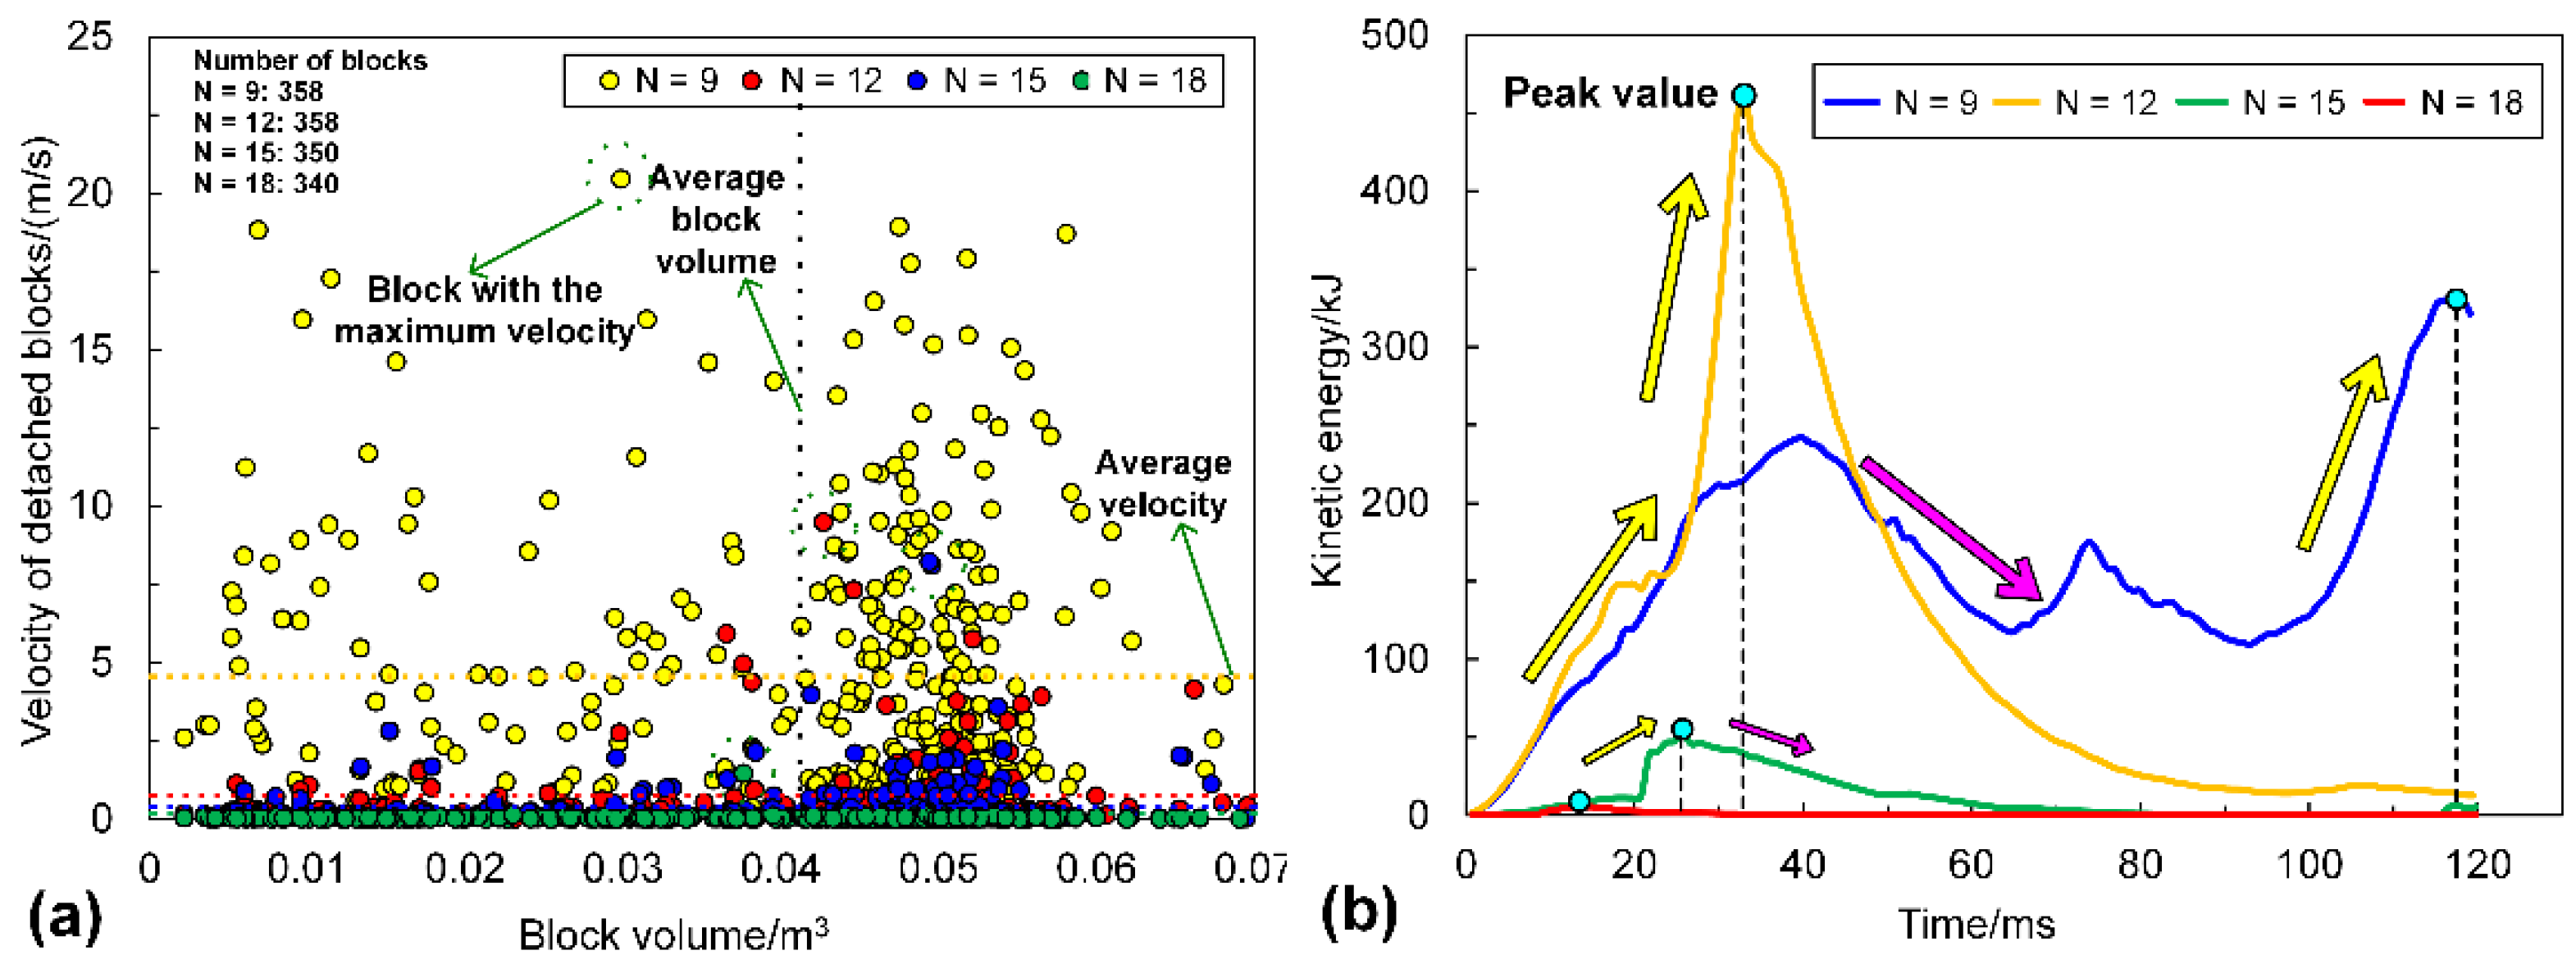
5.1. Influence of the Bolt Number
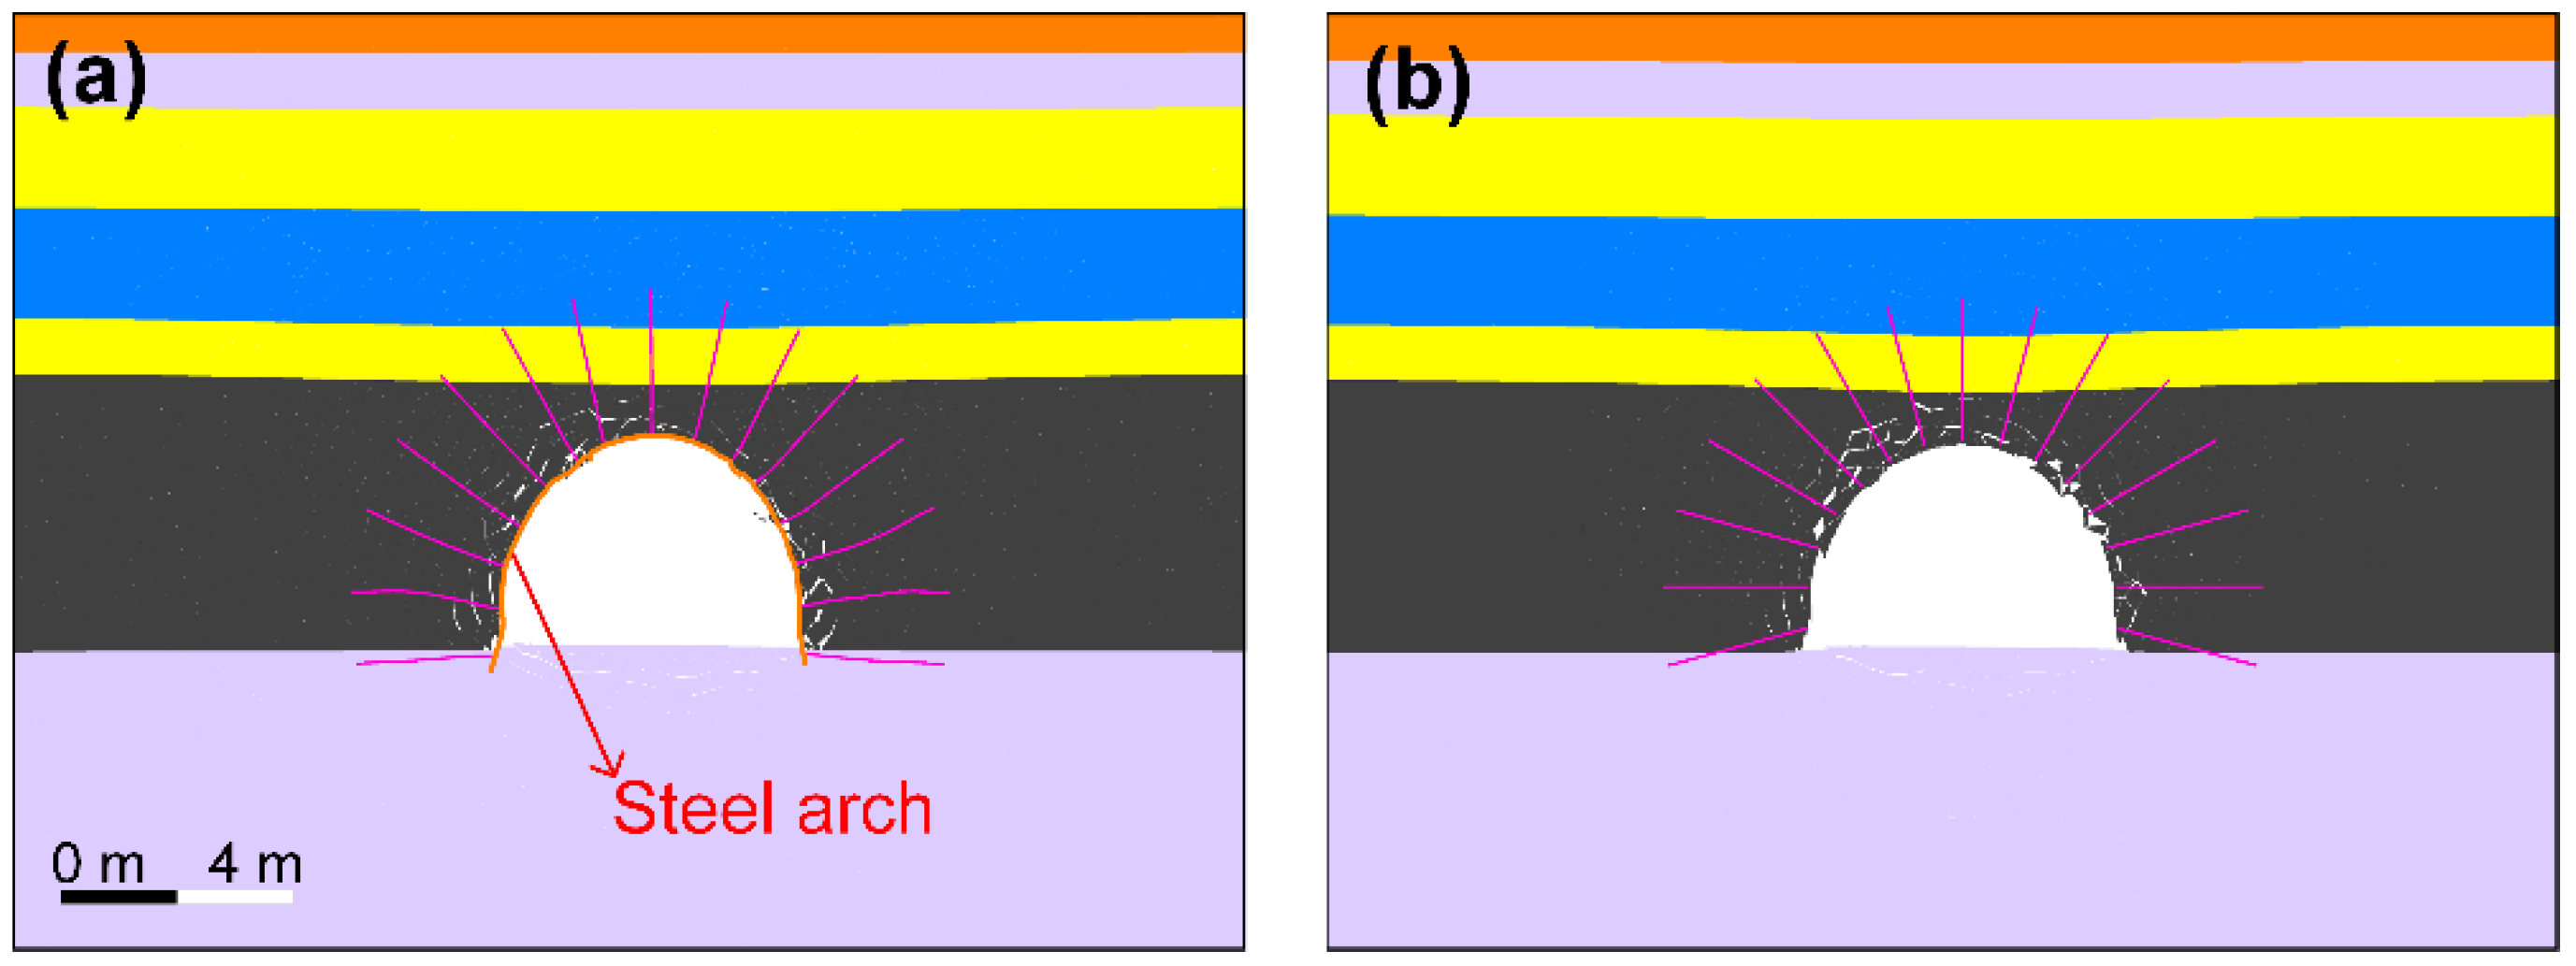
5.2. Influence of the Surface Retaining Element
5.3. Highlights and Limitations
- The accuracy of simulation results can be improved if the dynamic mechanical properties of rock masses and joints and related constitutive relationships are known and used.
- There is no energy dissipation when two contact faces are separated. Further studies (e.g., setting residual values of contacts or selecting more representative constitutive models) need to be conducted to consider the influences of fracture energy on simulation results.
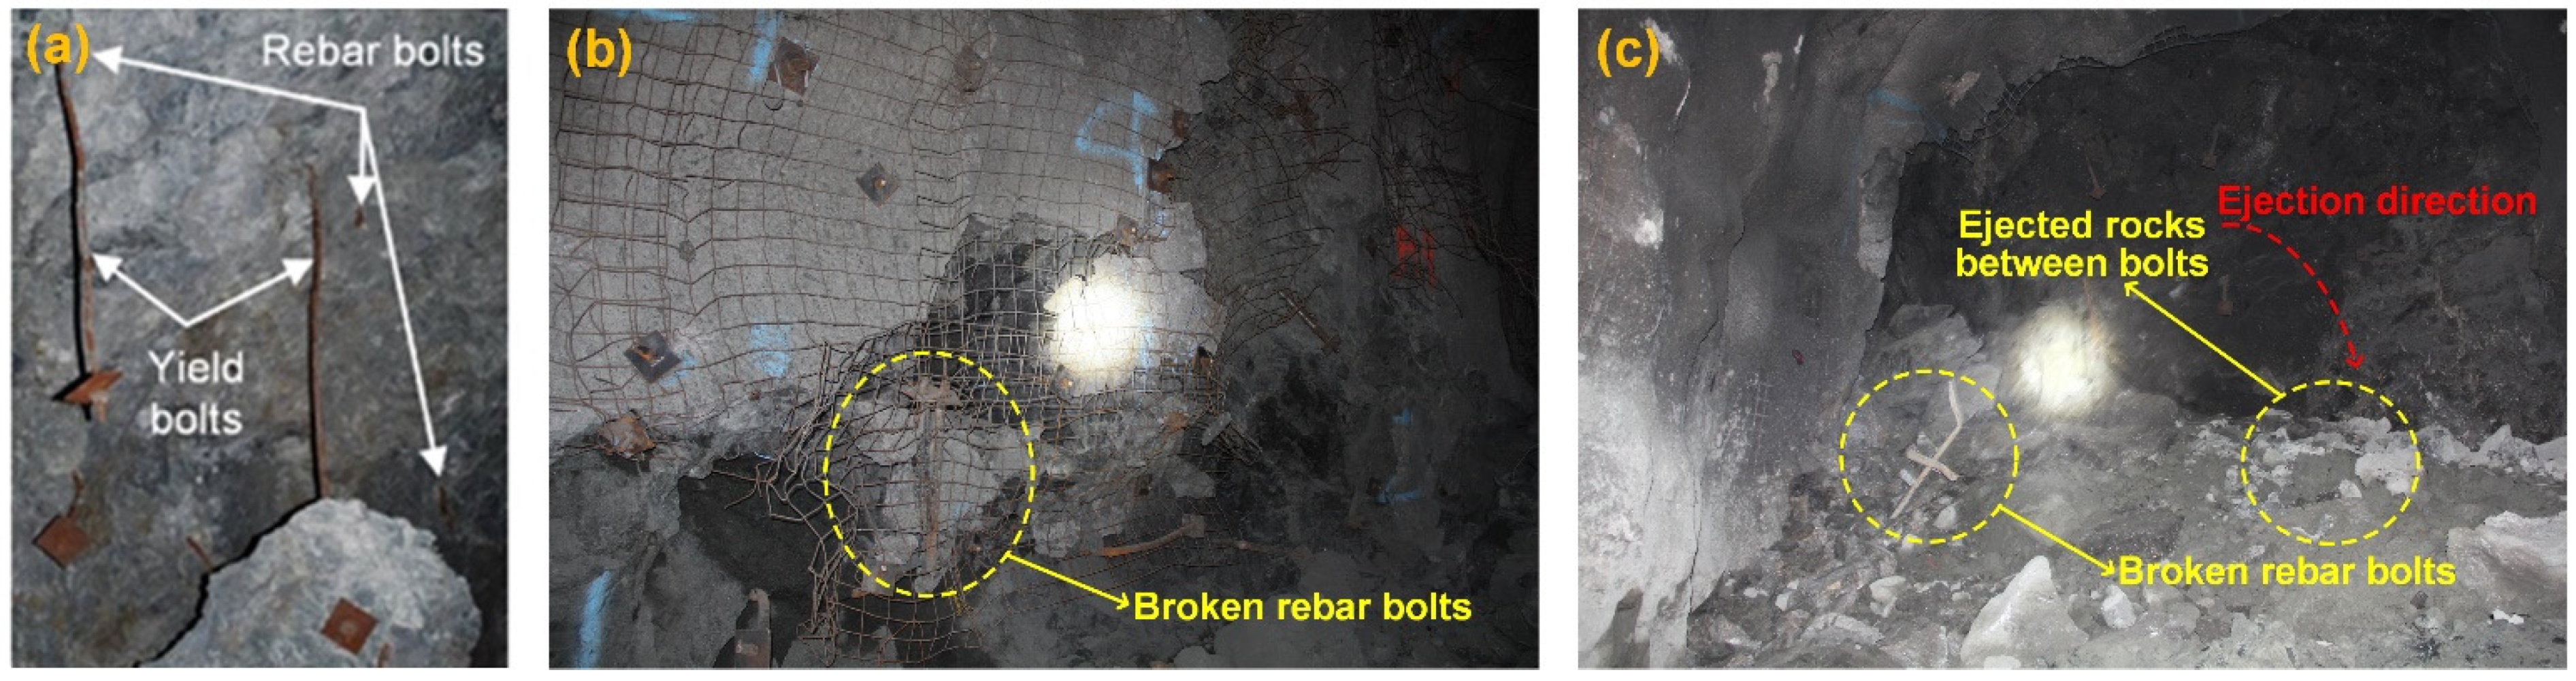
- The performance of yielding rockbolts during strainbursts has been initially confirmed by in situ observations and others’ experimental test and simulation results. However, the simulation results will be more accurate and reliable if field monitoring data (e.g., dynamic strength and elongation rate) of yielding rockbolts during strainbursts are available to calibrate simulation parameters.
- The sliding or extraction mechanism of Roofex should be simulated explicitly to better evaluate its performance during strainbursts. Setting reasonable parameters of the bolt-grout/rock interface will be a choice.
- The performance of yielding rockbolts was mainly evaluated from the “macro” views of the dynamic energy-absorption capacity and the control of the deformation and damage of rock masses. Other “micro” behavior of rockbolts, e.g., the shear force and failure of bolt-grout/rock interfaces, can be studied in future research.
6. Conclusions
- (1)
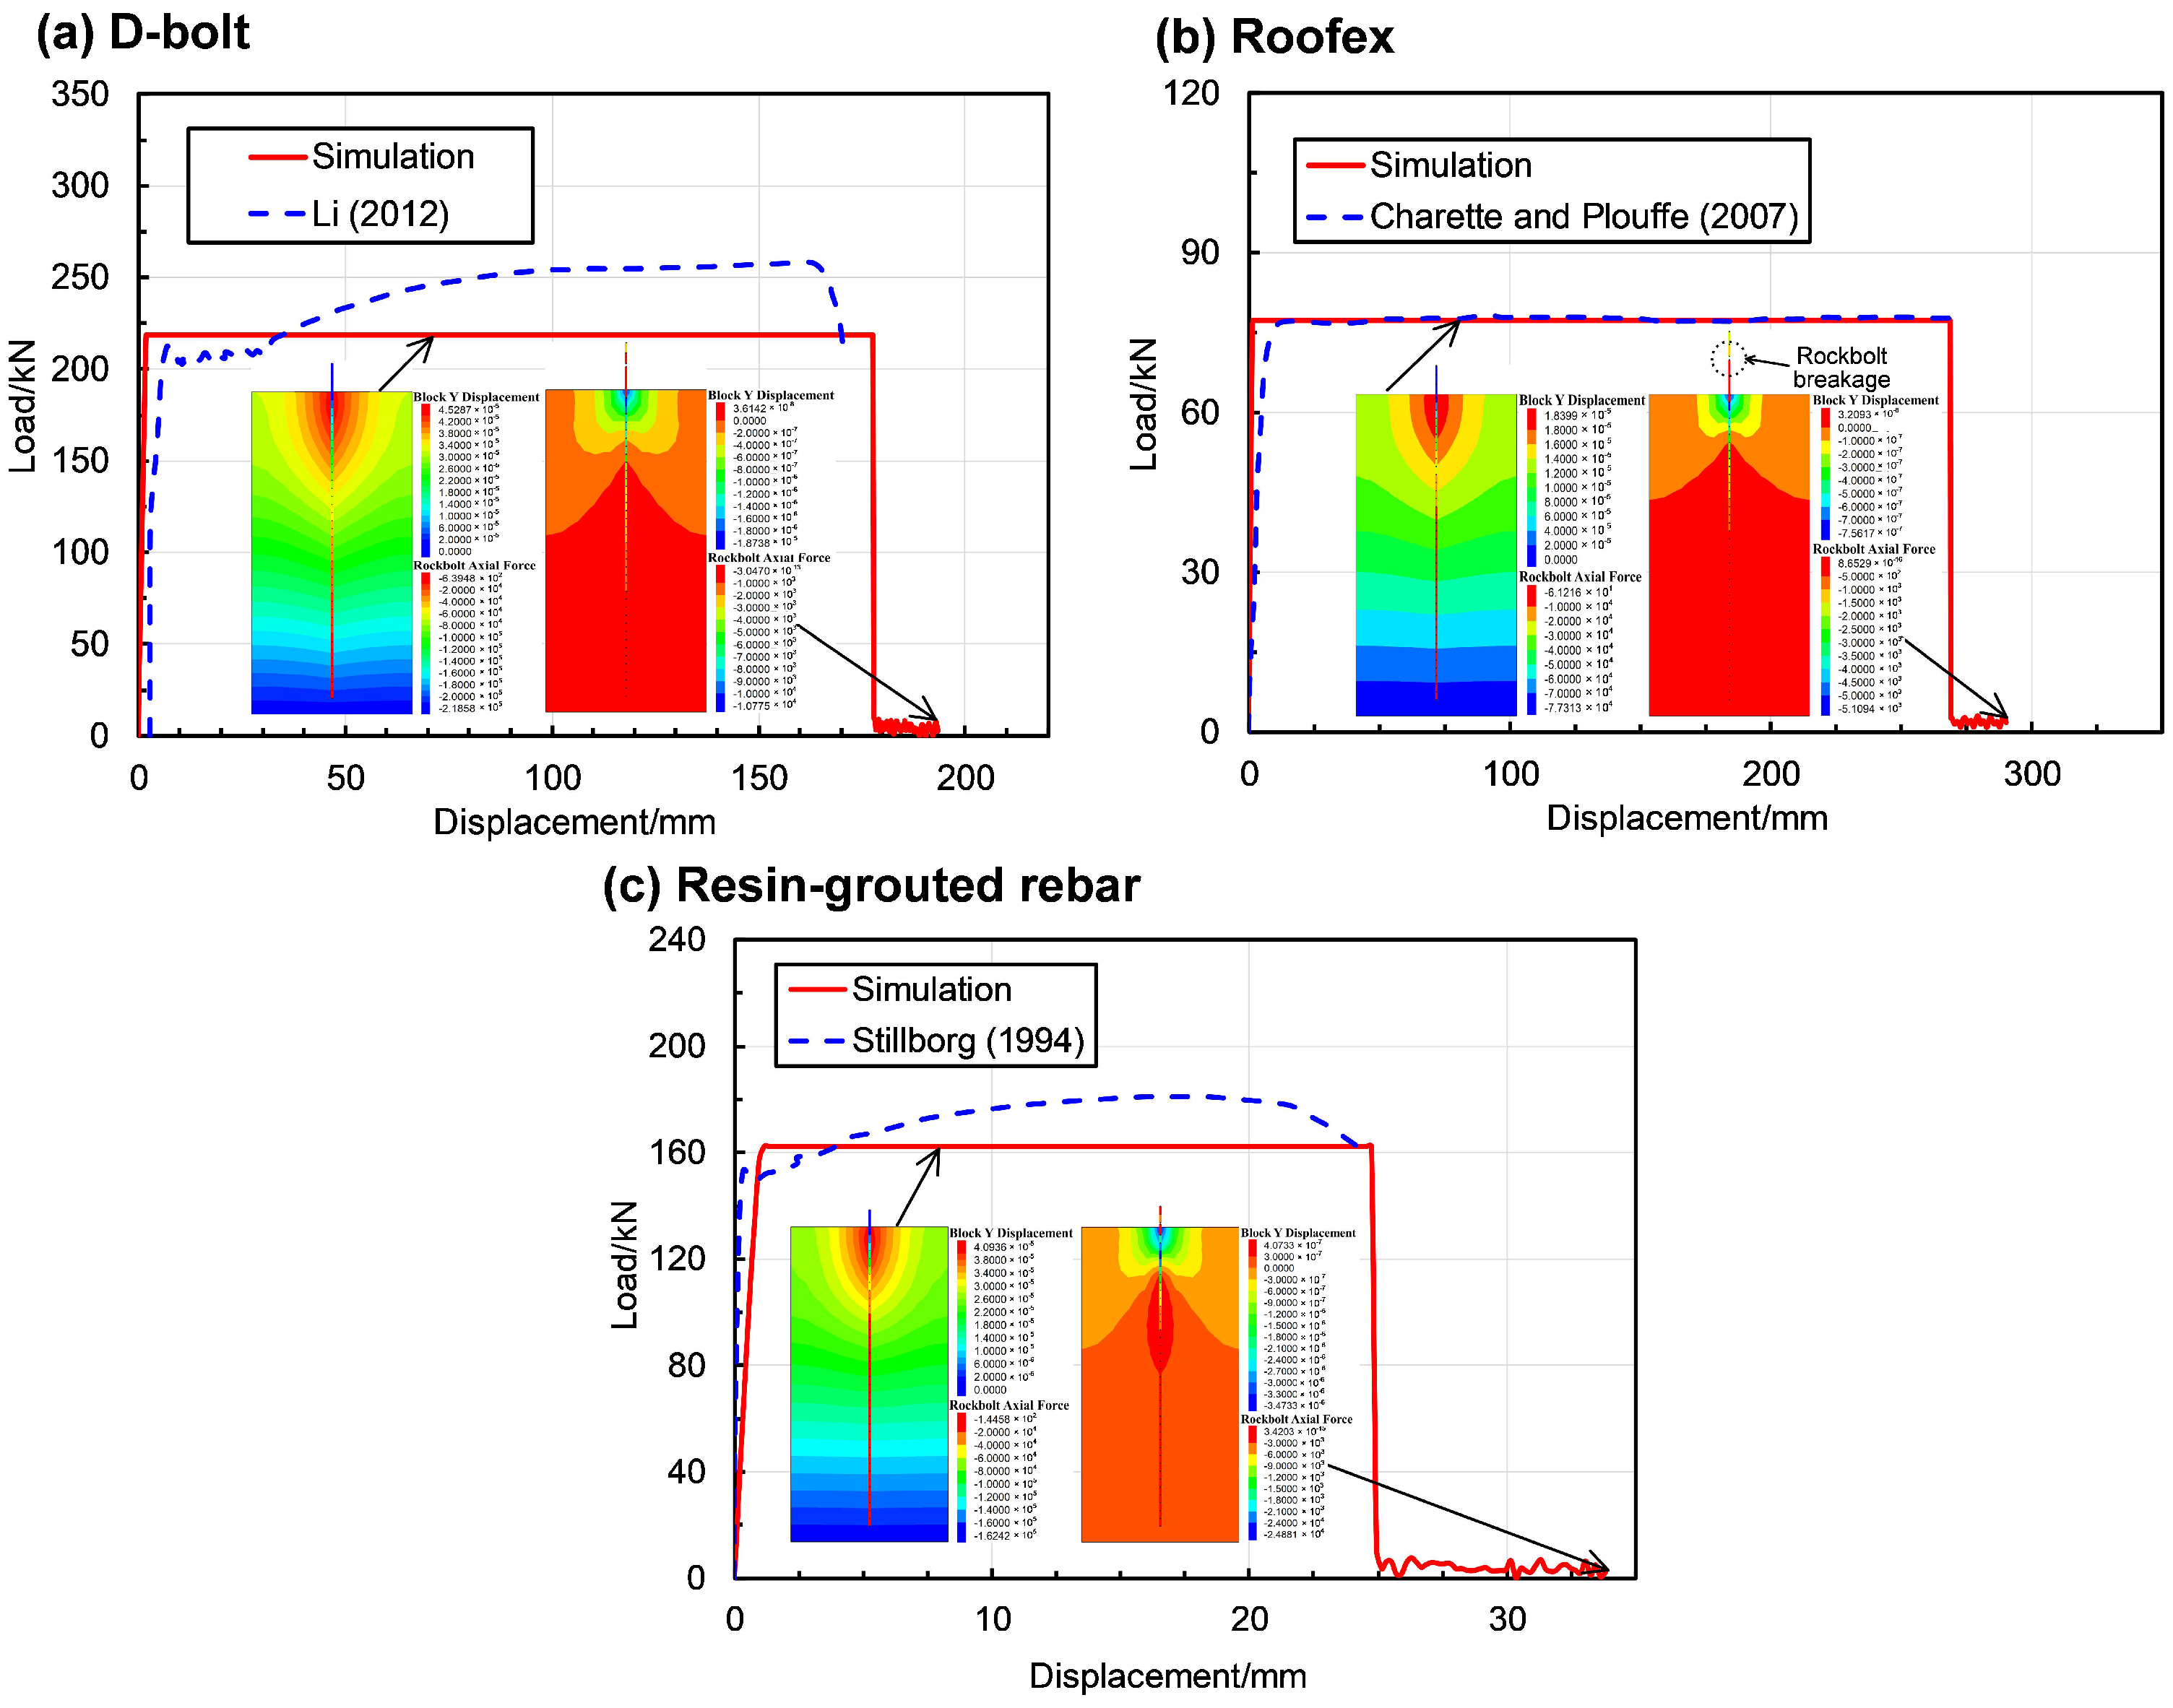
- The total deformations of the tunnel supported with Roofex and resin-grouted rebar are 1.53 and 2.09 times that of D-bolts (1411 mm). The average velocities of detached rock blocks in the tunnel supported with Roofex and resin-grouted rebar are 3.22 and 3.97 m/s, respectively, which are much higher than that of D-bolts (0.34 m/s). 13 resin-grouted rebar bolts are broken during the strainburst, while D-bolts and Roofex survive. This phenomenon agrees well with some in situ observations, verifying the reliability and rationality of the “rockbolt” element in modeling yielding rockbolts.
- (2)
- The volume of ejected rock blocks can be obtained by the developed FISH function in the numerical model. The volume of ejected rock blocks in the tunnel supported by D-bolts is 1.07 m3, which is the least compared with Roofex (1.54 m3) and resin-grouted rebar (1.79 m3).
- (3)
- The dynamic energy-absorption capacity of rockbolts can be evaluated by a proposed variable, reduced kinetic energy. Compared with Roofex (295.16 kJ) and resin-grouted rebar (125.19 kJ), the D-bolt can reduce the most kinetic energy (469.30 kJ).
- (4)
- The simulated axial force patterns of rockbolts agree with some published experimental test and numerical simulation results. The average peak values of axial forces for D-bolt, Roofex, and resin-grouted rebar are 214.87 kN, 76.99 kN, and 151.05 kN, respectively.
- (5)
- The bolt number significantly influences the control effects of yielding rockbolts on strainbursts. For example, 9 and 12 D-bolts cannot control the strainburst, while 15 and 18 D-bolts can make the tunnel stable. In addition, the detachment and ejection of rocks between rockbolts can be well restrained using surface retain elements, e.g., steel arch.
Author Contributions
Funding
Data Availability Statement
Acknowledgments
Conflicts of Interest
References
- Cai, M. Principles of rock support in burst-prone ground. Tunn. Undergr. Space Technol. 2013, 36, 46–56. [Google Scholar] [CrossRef]
- Zhang, C.; Feng, X.T.; Zhou, H.; Qiu, S.; Wu, W. Case Histories of Four Extremely Intense Rockbursts in Deep Tunnels. Rock Mech. Rock Eng. 2012, 45, 275–288. [Google Scholar] [CrossRef]
- Wang, J.; Apel, D.B.; Dyczko, A.; Walentek, A.; Prusek, S.; Xu, H.; Wei, C. Investigation of the Rockburst Mechanism of Driving Roadways in Close-Distance Coal Seam Mining Using Numerical Modeling Method. Min. Metall. Explor. 2021, 38, 1899–1921. [Google Scholar] [CrossRef]
- Kaiser, P.K.; McCreath, D.; Tannant, D. Canadian Rockburst Support Handbook; Geomechanics Research Center: Sudbury, ON, Canada, 1996. [Google Scholar]
- Kaiser, P.K.; Cai, M. Design of rock support system under rockburst condition. J. Rock Mech. Geotech. Eng. 2012, 4, 215–227. [Google Scholar] [CrossRef] [Green Version]
- Mutke, G.; Dubiński, J.; Lurka, A. New Criteria to Assess Seismic and Rock Burst Hazard in Coal Mines/Nowe Kryteria Dla Oceny Zagrożenia Sejsmicznego I Tąpaniami W Kopalniach Węgla Kamiennego. Arch. Min. Sci. 2015, 60, 743–760. [Google Scholar] [CrossRef] [Green Version]
- Diederichs, M.S. Early assessment of dynamic rupture hazard for rockburst risk management in deep tunnel projects. J. S. Afr. Inst. Min. Metall. 2018, 118, 193–204. [Google Scholar] [CrossRef] [Green Version]
- Ortlepp, W. The design of support for the containment of rockburst damage in tunnels: An engineering approach. In International Symposium on Rock Support; Balkema: Rotterdam, The Netherlands, 1992. [Google Scholar]
- Atlas Copco Construction Mining Technique. Roofex Rock Bolt. Available online: https://www.forconstructionpros.com/equipment/underground/vertical-drilling-equipment/product/10080325/atlas-copco-construction-mining-technique-usa-llc-roofex-rock-bolt (accessed on 22 May 2021).
- Charette, F.; Plouffe, M. Roofex®–Results of laboratory testing of a new concept of yieldable tendon. In Proceedings of the Fourth International Seminar on Deep and High Stress Mining, Perth, Australia, 7–9 November 2007. [Google Scholar]
- Varden, R.; Lachenicht, R.; Player, J.; Thompson, A.; Villaescusa, E. Development and implementation of the garford dynamic bolt at the kanowna belle mine. In Proceedings of the 10th Underground Operators Conference, Launceston, Australia, 14–16 April 2008. [Google Scholar]
- Li, C.C.; Doucet, C. Performance of D-Bolts Under Dynamic Loading. Rock Mech. Rock Eng. 2011, 45, 193–204. [Google Scholar] [CrossRef]
- Normet. Normet D-Bolt®—Dynamic Rock Bolt. Available online: https://www.normet.com/product/d-bolt/ (accessed on 22 May 2021).
- Wu, R.; Oldsen, J.; Campoli, A. Application of yield-lok bolt for bursting and convergence grounds in mines. In Proceedings of the 30th International Conference on Ground Control in Mining, Morgantown, WV, USA, 26 July 2011. [Google Scholar]
- He, M.; Xia, H.; Jia, X.; Gong, W.; Zhao, F.; Liang, K. Studies on classification, criteria and control of rockbursts. J. Rock Mech. Geotech. Eng. 2012, 4, 97–114. [Google Scholar] [CrossRef] [Green Version]
- Kang, H.; Lin, J.; Wu, Y. High pretensioned stress and intensive cable bolting technology set in full section and application in entry affected by dynamic pressure. J. China Coal Soc. 2009, 34, 1153–1159. [Google Scholar]
- Li, C.C. Performance of D-bolts Under Static Loading. Rock Mech. Rock Eng. 2011, 45, 183–192. [Google Scholar] [CrossRef]
- Wu, Y.; Gao, F.; Chen, J.; He, J. Experimental Study on the Performance of Rock Bolts in Coal Burst-Prone Mines. Rock Mech. Rock Eng. 2019, 52, 3959–3970. [Google Scholar] [CrossRef]
- Zhang, P.; Nordlund, E. Numerical investigation of dynamic response of a rockbolt under drop testing and simulated seismic loading conditions. In Proceedings of the Ninth International Symposium on Ground Support in Mining and Underground Construction, Perth, Australia, 23–25 October 2019. [Google Scholar]
- Cai, M.; Champaigne, D.; Kaiser, P.K. Development of a fully debonded cone bolt for rockburst support. In Proceedings of the Fifth International Seminar on Deep and High Stress Mining, Santiago, MN, USA, 6–8 October 2010. [Google Scholar]
- Li, C.C.; Stjern, G.; Myrvang, A. A review on the performance of conventional and energy-absorbing rockbolts. J. Rock Mech. Geotech. Eng. 2014, 6, 315–327. [Google Scholar] [CrossRef] [Green Version]
- Sharifzadeh, M.; Lou, J.; Crompton, B. Dynamic performance of energy-absorbing rockbolts based on laboratory test results. Part I: Evolution, deformation mechanisms, dynamic performance and classification. Tunn. Undergr. Space Technol. 2020, 105, 103510. [Google Scholar] [CrossRef]
- Bosman, K.; Cawood, M.; Berghorst, A. Relationship between energy per impulse and dynamic capacity of a rockbolt. In Proceedings of the Rock Dynamics–Experiments, Theories and Applications, Trondholm, Norway, 13 July 2018. [Google Scholar]
- Wang, J.; Apel, D.B.; Pu, Y.; Hall, R.; Wei, C.; Sepehri, M. Numerical modeling for rockbursts: A state-of-the-art review. J. Rock Mech. Geotech. Eng. 2021, 13, 457–478. [Google Scholar] [CrossRef]
- Ji, S.; Karlovšek, J. Calibration and uniqueness analysis of microparameters for DEM cohesive granular material. Int. J. Min. Sci. Technol. 2022, 32, 121–136. [Google Scholar] [CrossRef]
- Ji, S.; Karlovšek, J. Optimized differential evolution algorithm for solving DEM material calibration problem. Eng. Comput. 2022. [Google Scholar] [CrossRef]
- Wang, J.; Apel, D.B.; Dyczko, A.; Walentek, A.; Prusek, S.; Xu, H.; Wei, C. Analysis of the damage mechanism of strainbursts by a global-local modelling approach. J. Rock Mech. Geotech. Eng. 2022. [Google Scholar] [CrossRef]
- Manouchehrian, A. Numerical Modeling of Unstable Rock Failure. Ph.D. Thesis, Laurentian University, Sudbury, ON, Canada, 2016. [Google Scholar]
- Nie, W.; Zhao, Z.Y.; Ning, Y.J.; Guo, W. Numerical studies on rockbolts mechanism using 2D discontinuous deformation analysis. Tunn. Undergr. Space Technol. 2014, 41, 223–233. [Google Scholar] [CrossRef]
- Marambio, E.; Vallejos, J.; Burgos, L.; Gonzalez, C.; Castro, L.; Saure, J.; Urzua, J. Numerical modelling of dynamic testing for rock reinforcement used in underground excavations. In Proceedings of the Fourth International Symposium on Block and Sublevel Caving, Australian Centre for Geomechanics, Vancouver, BC, Canada, 15–17 October 2018. [Google Scholar]
- Yokota, Y.; Zhao, Z.; Nie, W.; Date, K.; Iwano, K.; Koizumi, Y.; Okada, Y. Development of a new deformation-controlled rockbolt: Numerical modelling and laboratory verification. In Proceedings of the Ninth International Symposium on Ground Support in Mining and Underground Construction, Australian Centre for Geomechanics, Sudbury, ON, Canada, 23–25 October 2019. [Google Scholar]
- Zhao, T.; Xing, M.; Guo, W.; Wang, C.; Wang, B. Anchoring effect and energy-absorbing support mechanism of large deformation bolt. J. Cent. South Univ. 2021, 28, 572–581. [Google Scholar] [CrossRef]
- Su, G.; Jiang, J.; Zhai, S.; Zhang, G. Influence of Tunnel Axis Stress on Strainburst: An Experimental Study. Rock Mech. Rock Eng. 2017, 50, 1551–1567. [Google Scholar] [CrossRef]
- Su, G.; Zhai, S.; Jiang, J.; Zhang, G.; Yan, L. Influence of Radial Stress Gradient on Strainbursts: An Experimental Study. Rock Mech. Rock Eng. 2017, 50, 2659–2676. [Google Scholar] [CrossRef]
- Hu, L.; Ma, K.; Liang, X.; Tang, C.; Wang, Z.; Yan, L. Experimental and numerical study on rockburst triggered by tangential weak cyclic dynamic disturbance under true triaxial conditions. Tunn. Undergr. Space Technol. 2018, 81, 602–618. [Google Scholar] [CrossRef]
- Hu, L.; Liang, X.; Liang, Z.; Li, Y.; Zhang, Z.; Tang, C.A. Influence of radial stress on strainbursts under true triaxial conditions: Insights from a distinct element modelling. Int. J. Rock Mech. Min. Sci. 2021, 138, 104577. [Google Scholar] [CrossRef]
- Hu, L.; Su, G.; Liang, X.; Li, Y.; Yan, L. A distinct element based two-stage-structural model for investigation of the development process and failure mechanism of strainburst. Comput. Geotech. 2020, 118, 103333. [Google Scholar] [CrossRef]
- Gao, F.; Stead, D.; Kang, H. Numerical Simulation of Squeezing Failure in a Coal Mine Roadway due to Mining-Induced Stresses. Rock Mech. Rock Eng. 2015, 48, 1635–1645. [Google Scholar] [CrossRef]
- Chen, M.; Yang, S.Q.; Zhang, Y.C.; Zang, C.W. Analysis of the failure mechanism and support technology for the Dongtan deep coal roadway. Geomech. Eng. 2016, 11, 401–420. [Google Scholar] [CrossRef]
- Yang, S.Q.; Chen, M.; Jing, H.W.; Chen, K.F.; Meng, B. A case study on large deformation failure mechanism of deep soft rock roadway in Xin’An coal mine, China. Eng. Geol. 2017, 217, 89–101. [Google Scholar] [CrossRef]
- Stavrou, A.; Vazaios, I.; Murphy, W.; Vlachopoulos, N. Refined approaches for estimating the strength of rock blocks. Geotech. Geol. Eng. 2019, 37, 5409–5439. [Google Scholar] [CrossRef] [Green Version]
- Xu, Y.H.; Cai, M. Influence of Loading System Stiffness on Post-peak Stress–Strain Curve of Stable Rock Failures. Rock Mech. Rock Eng. 2017, 50, 2255–2275. [Google Scholar] [CrossRef]
- Lysmer, J.; Kuhlemeyer, R.L. Finite dynamic model for infinite media. J. Eng. Mech. Div. 1969, 95, 859–877. [Google Scholar] [CrossRef]
- Itasca. Introductory Training Course UDEC7/3DEC7; Itasca Consulting Group, Inc.: Minneapolis, MN, USA, 2021. [Google Scholar]
- Dai, L.; Pan, Y.; Li, Z.; Wang, A.; Xiao, Y.; Liu, F.; Shi, T.; Zheng, W. Quantitative mechanism of roadway rockbursts in deep extra-thick coal seams: Theory and case histories. Tunn. Undergr. Space Technol. 2021, 111, 103861. [Google Scholar] [CrossRef]
- Cook, N.G. The failure of rock. Int. J. Rock Mech. Min. Sci. Geomech. Abstr. 1965, 2, 389–403. [Google Scholar] [CrossRef]
- Jaiswal, A.; Shrivastva, B.K. Stability analysis of the proposed hybrid method of partial extraction for underground coal mining. Int. J. Rock Mech. Min. Sci. 2012, 52, 103–111. [Google Scholar] [CrossRef]
- Farahmand, K.; Vazaios, I.; Diederichs, M.S.; Vlachopoulos, N. Investigating the scale-dependency of the geometrical and mechanical properties of a moderately jointed rock using a synthetic rock mass (SRM) approach. Comput. Geotech. 2018, 95, 162–179. [Google Scholar] [CrossRef]
- Bear, J. Dynamics of Fluids in Porous Media; Dover Publication: New York, NY, USA, 1972. [Google Scholar]
- Bieniawski, Z. The effect of specimen size on compressive strength of coal. Int. J. Rock Mech. Min. Sci. Geomech. Abstr. 1968, 5, 325–335. [Google Scholar] [CrossRef]
- Fairhurst, C.; Hudson, J.A. Draft ISRM suggested method for the complete stress-strain curve for intact rock in uniaxial compression. Int. J. Rock Mech. Min. Sci. 1999, 36, 279–289. [Google Scholar]
- Marinos, P.; Hoek, E. GSI: A geologically friendly tool for rock mass strength estimation. In Proceedings of the ISRM International Symposium, Melbourne, Australia, 19 November 2000. [Google Scholar]
- Małkowski, P.; Ostrowski, Ł.; Bachanek, P. Modelling the small throw fault effect on the stability of a mining roadway and its verification by in situ investigation. Energies 2017, 10, 2082. [Google Scholar]
- Małkowski, P.; Ostrowski, Ł. Convergence monitoring as a basis for numerical analysis of changes of rock-mass quality and Hoek-Brown failure criterion parameters due to longwall excavation. Arch. Min. Sci. 2019, 64, 93–118. [Google Scholar]
- Szott, W.; Słota-Valim, M.; Gołąbek, A.; Sowiżdżał, K.; Łętkowski, P. Numerical studies of improved methane drainage technologies by stimulating coal seams in multi-seam mining layouts. Int. J. Rock Mech. Min. Sci. 2018, 108, 157–168. [Google Scholar] [CrossRef]
- Hoek, E.; Carranza-Torres, C.; Corkum, B. Hoek-Brown failure criterion-2002 edition. In Proceedings of the NARMS-Tac, Toronto, ON, Canada, 10 July 2002. [Google Scholar]
- Hoek, E.; Diederichs, M. Empirical estimation of rock mass modulus. Int. J. Rock Mech. Min. Sci. 2006, 43, 203–215. [Google Scholar] [CrossRef]
- Gao, F.; Kaiser, P.K.; Stead, D.; Eberhardt, E.; Elmo, D. Strainburst phenomena and numerical simulation of self-initiated brittle rock failure. Int. J. Rock Mech. Min. Sci. 2019, 116, 52–63. [Google Scholar] [CrossRef]
- Diederichs, M.S. The 2003 Canadian Geotechnical Colloquium: Mechanistic interpretation and practical application of damage and spalling prediction criteria for deep tunnelling. Can. Geotech. J. 2007, 44, 1082–1116. [Google Scholar] [CrossRef]
- Bahrani, N.; Hadjigeorgiou, J. Explicit reinforcement models for fully-grouted rebar rock bolts. J. Rock Mech. Geotech. Eng. 2017, 9, 267–280. [Google Scholar] [CrossRef]
- Tomasone, P.; Bahrani, N.; Hadjigeorgiou, J. Practical considerations in the modelling of resin-grouted rockbolts. J. S. Afr. Inst. Min. Metall. 2020, 120, 385–392. [Google Scholar] [CrossRef] [PubMed]
- Itasca. UDEC, Version 7.0 Manual; Itasca Consulting Group, Inc.: Minneapolis, MN, USA, 2020. [Google Scholar]
- Skrzypkowski, K.; Korzeniowski, W.; Zagórski, K.; Zagórska, A. Modified Rock Bolt Support for Mining Method with Controlled Roof Bending. Energies 2020, 13, 1868. [Google Scholar] [CrossRef] [Green Version]
- Skrzypkowski, K. An Experimental Investigation into the Stress-Strain Characteristic under Static and Quasi-Static Loading for Partially Embedded Rock Bolts. Energies 2021, 14, 1483. [Google Scholar] [CrossRef]
- Stillborg, B. Professional Users Handbook for RockBolting; Trans Tech Publications: Clausthal, Germany, 1994. [Google Scholar]
- Zhu, D.; Wu, Y.; Liu, Z.; Dong, X.; Yu, J. Failure mechanism and safety control strategy for laminated roof of wide-span roadway. Eng. Fail. Anal. 2020, 111, 104489. [Google Scholar] [CrossRef]
- Li, C.C. Principles and methods of rock support for rockburst control. J. Rock Mech. Geotech. Eng. 2020, 13, 46–59. [Google Scholar] [CrossRef]
- Gao, F.; Kaiser, P.K.; Stead, D.; Eberhardt, E.; Elmo, D. Numerical simulation of strainbursts using a novel initiation method. Comput. Geotech. 2019, 106, 117–127. [Google Scholar] [CrossRef]
- Raffaldi, M.; Chambers, D.; Johnson, J. Numerical study of the relationship between seismic wave parameters and remotely triggered rockburst damage in hard rock tunnels. In Proceedings of the Eighth International Conference on Deep and High Stress Mining, Australian Centre for Geomechanics, Perth, Australia, 28–30 March 2017. [Google Scholar]
- Hyett, A.; Moosavi, M.; Bawden, W. Load distribution along fully grouted bolts, with emphasis on cable bolt reinforcement. Int. J. Numer. Anal. Methods Geomech. 1996, 20, 517–544. [Google Scholar] [CrossRef]
- Lisjak, A.; Young-Schultz, T.; Li, B.; He, L.; Tatone, B.S.A.; Mahabadi, O.K. A novel rockbolt formulation for a GPU-accelerated, finite-discrete element method code and its application to underground excavations. Int. J. Rock Mech. Min. Sci. 2020, 134, 104410. [Google Scholar] [CrossRef]
- Ma, S.; Nemcik, J.; Aziz, N. Simulation of fully grouted rockbolts in underground roadways using FLAC2D. Can. Geotech. J. 2014, 51, 911–920. [Google Scholar] [CrossRef]


| Items | Block Properties | Contact Properties | |||||||||
|---|---|---|---|---|---|---|---|---|---|---|---|
| ρ (kg/m3) | K (GPa) | G (GPa) | kn (GPa/m) | ks (GPa/m) | cj (MPa) | crj (MPa) | φj (°) | φrj (°) | σtj (MPa) | σtrj (MPa) | |
| Granodiorite | 2650 | 21.22 | 12.12 | 210,000 | 83,370 | 52 | 0 | 61.5 | 22 | 13 | 0 |
| Top platen | 7700 | 33.33 | 15.38 | - | |||||||
| Other platens | 7700 | 171.67 | 79.23 | - | |||||||
| Interface between platens and rock sample | - | 210,000 | 83,370 | 0 | 0 | 14.57 | 0 | 0 | 0 | ||
| Lithology | Constant | Intact Rock | Rock Mass | |||||||
|---|---|---|---|---|---|---|---|---|---|---|
| mi | mb | s | a | ρ (kg/m3) | σci (MPa) | Ei (GPa) | v | σcm (MPa) | Em (GPa) | |
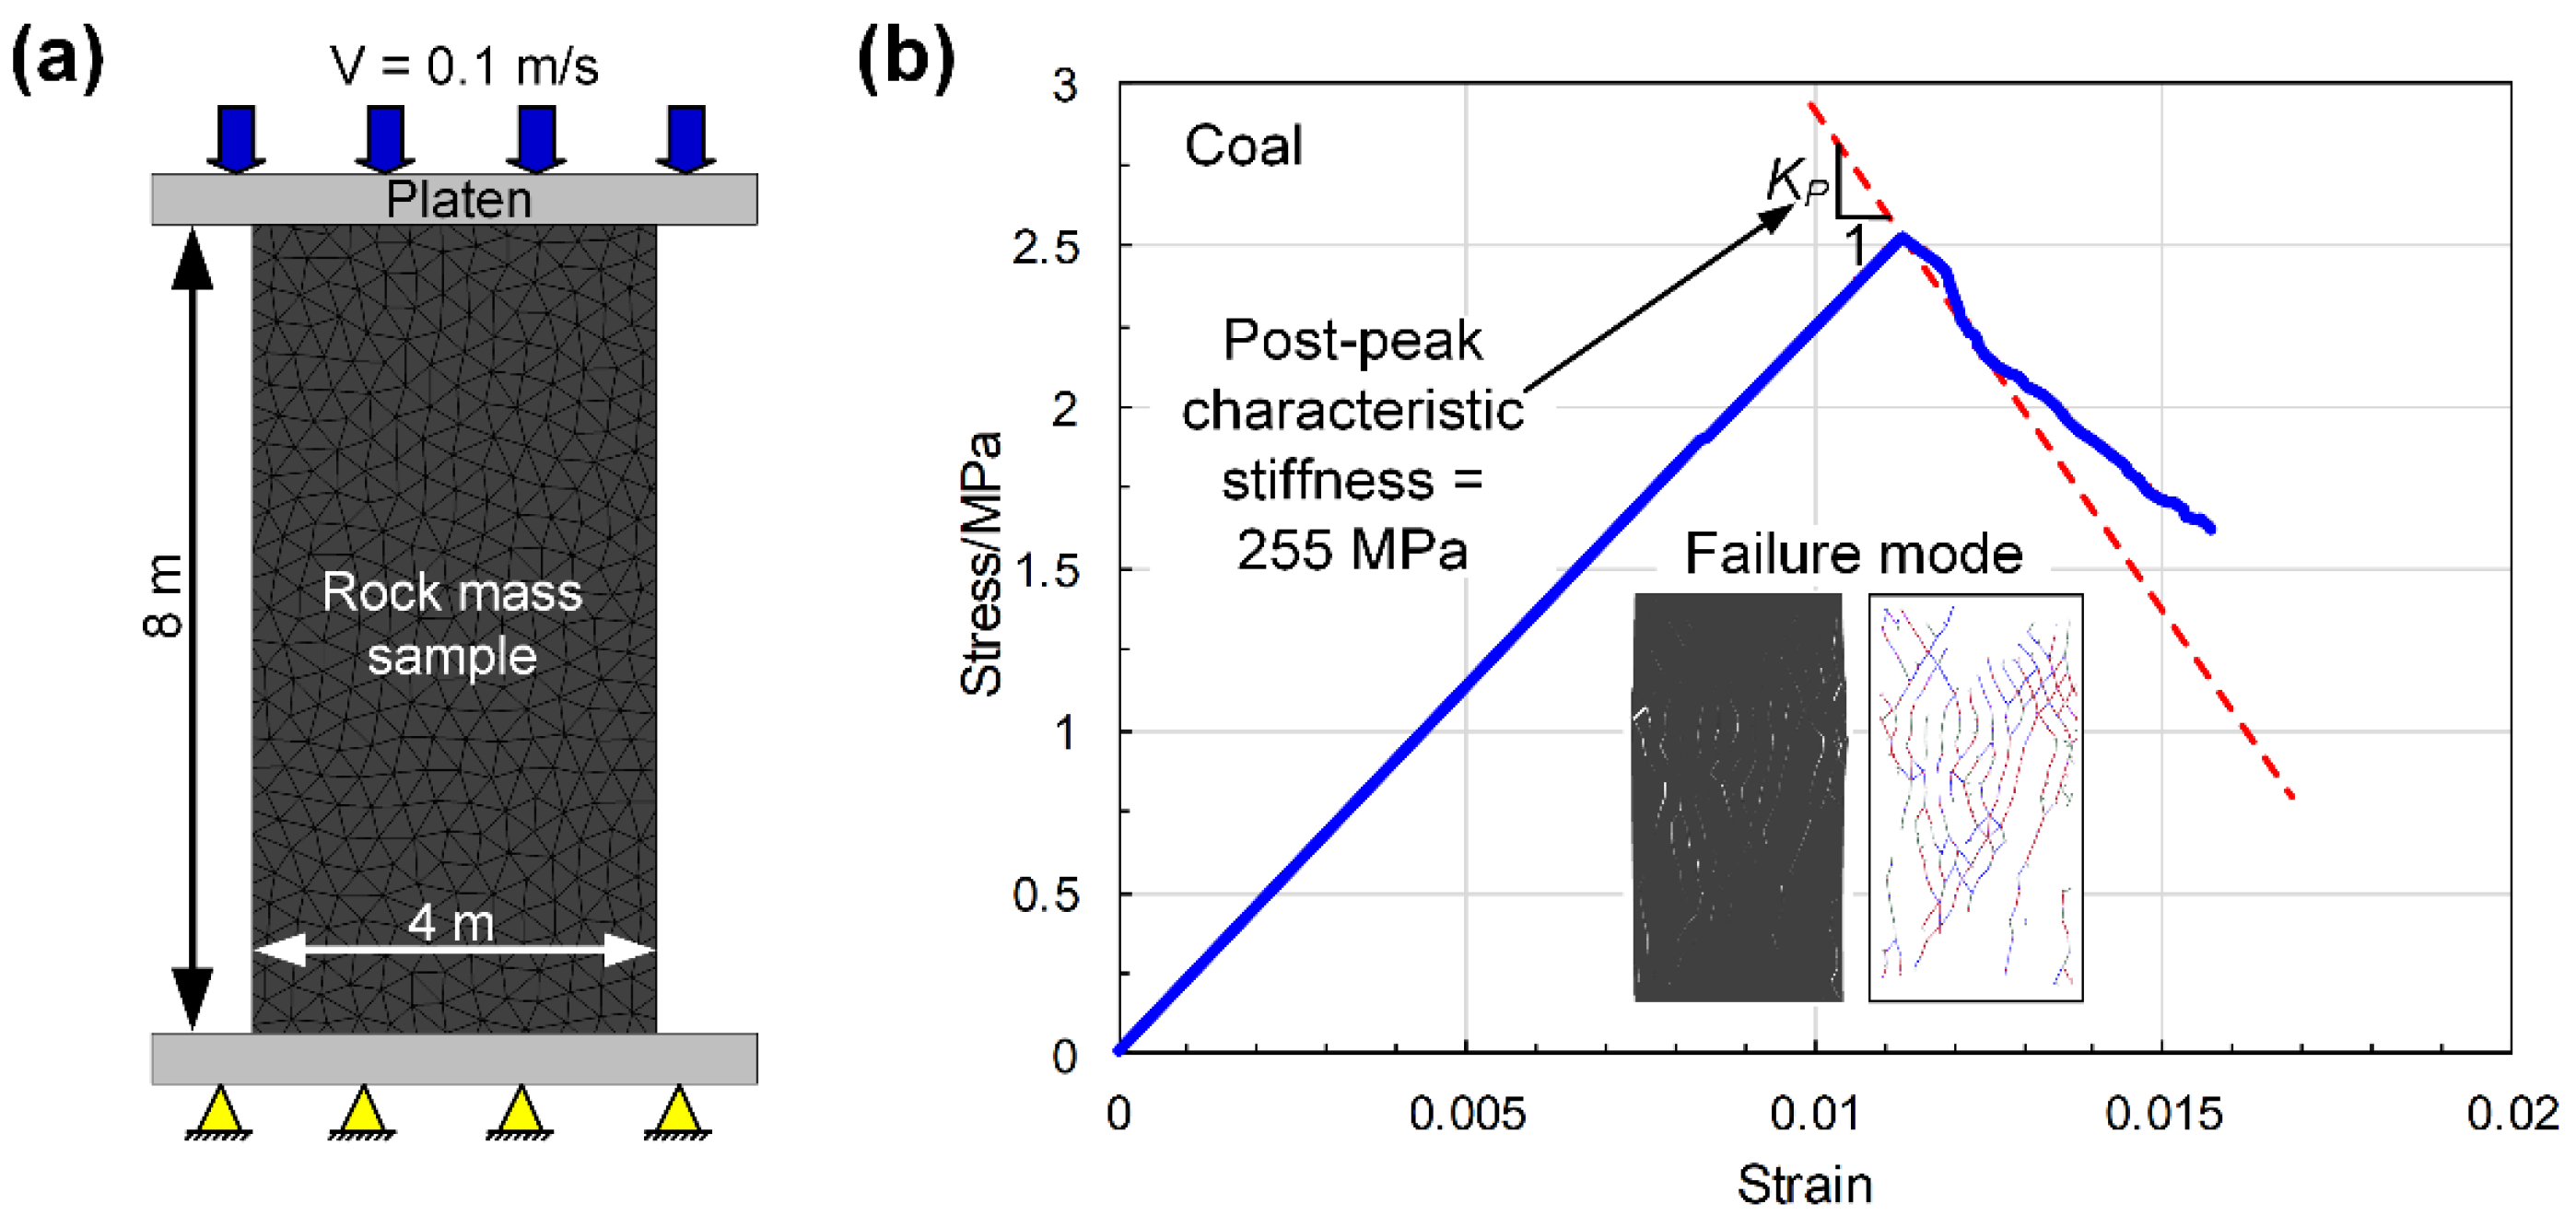
| Coal | 17 | 1.729 | 0.0008 | 0.5 | 1300 | 9.3 | 1.86 | 0.30 | 2.50 | 0.23 |
| Clay shale | 9 | 1.327 | 0.0022 | 0.5 | 2500 | 29.0 | 5.62 | 0.31 | 7.93 | 1.26 |
| Fine-grained sandstone | 17 | 2.851 | 0.0039 | 0.5 | 2580 | 90.0 | 9.52 | 0.26 | 24.53 | 2.92 |
| Sandy shale | 12 | 1.877 | 0.0031 | 0.5 | 2530 | 26.0 | 5.23 | 0.25 | 7.11 | 1.42 |
| Lithology | Block Properties | Contact Properties | ||||||||
|---|---|---|---|---|---|---|---|---|---|---|
| ρ (kg/m3) | K (GPa) | G (GPa) | kn (GPa/m) | ks (GPa/m) | cj (MPa) | crj (MPa) | φj (°) | σtj (MPa) | σtrj (MPa) | |
| Coal | 1300 | 0.16 | 0.09 | 18.7 | 7.5 | 0.99 | 0 | 33 | 0.25 | 0 |
| Clay shale | 2500 | 0.85 | 0.50 | 108.5 | 40.6 | 2.96 | 0 | 35 | 0.79 | 0 |
| Fine-grained sandstone | 2580 | 1.91 | 1.17 | 69.4 | 27.8 | 8.11 | 0 | 36 | 2.15 | 0 |
| Sandy shale | 2530 | 0.94 | 0.57 | 113.3 | 45.3 | 2.95 | 0 | 36 | 0.85 | 0 |
| Lithology | Em (GPa) | UCS (MPa) | ||||
|---|---|---|---|---|---|---|
| Target | Simulation | Error (%) | Target | Simulation | Error (%) | |
| Coal | 0.23 | 0.226 | 0.09 | 2.50 | 2.51 | 0.48 |
| Clay shale | 1.26 | 1.234 | −1.82 | 7.93 | 7.91 | −0.29 |
| Fine-grained sandstone | 2.92 | 2.852 | −2.48 | 24.53 | 24.52 | −0.05 |
| Sandy shale | 1.42 | 1.39 | −2.11 | 7.11 | 7.02 | −1.27 |
| Rockbolt Type | Cross-Sectional Area (m2) | Moment of Inertia (m4) | Perimeter of Borehole (m) | Density (kg/m3) | Elastic Modulus (GPa) | Tensile Yield Strength (kN) | Tension Failure Strain | Shear Coupling Spring Stiffness (GN/m/m) | Shear Coupling Spring Cohesion (kN/m) | Shear Coupling Spring Friction Angle (°) |
|---|---|---|---|---|---|---|---|---|---|---|
| Resin-grouted rebar | 3.14 × 10⁻⁴ | 7.85 × 10⁻⁹ | 0.08 | 7500 | 200 | 517 | 0.33 | 0.31 | 400 | 45 |
| D-bolt | 3.80 × 10⁻⁴ | 1.15 × 10⁻⁸ | 0.10 | 7500 | 200 | 575 | 1.36 | 0.29 | 438 | 45 |
| Roofex | 1.23 × 10⁻⁴ | 1.20 × 10⁻⁹ | 0.08 | 7500 | 200 | 630 | 1.66 | 0.21 | 353 | 45 |
| Rockbolt Type | Ultimate Load (kN) | Rupture Displacement (mm) | Static Energy-Absorption Capacity (kJ) | ||||||
|---|---|---|---|---|---|---|---|---|---|
| Laboratory Test | Simulation | Error/(%) | Laboratory Test | Simulation | Error/(%) | Laboratory Test | Simulation | Error/(%) | |
| Resin-grouted rebar | 162 | 162 | 0.0 | 24.1 | 24.9 | 3.3 | 4.15 | 3.96 | −4.6 |
| D-bolt | 212 | 219 | 3.3 | 170 | 178 | 4.7 | 40.23 | 38.65 | −3.9 |
| Roofex | 77.6 | 77.3 | −0.4 | 274 | 269 | −1.8 | 20.94 | 20.71 | −1.1 |
| Input Parameter | Cross-Sectional Area (m2) | Moment of Inertia (m4) | Density (kg/m3) | Poisson’s Ratio | Elastic Modulus (GPa) | Tensile Yield Strength (kN) | Shear Coupling Spring Stiffness (GN/m/m) | Normal Coupling Spring Stiffness (GN/m/m) |
|---|---|---|---|---|---|---|---|---|
| Beam | 4 × 10⁻³ | 8.38 × 10⁻⁶ | 7700 | 0.3 | 210 | 650 | 104 | 104 |
Publisher’s Note: MDPI stays neutral with regard to jurisdictional claims in published maps and institutional affiliations. |
© 2022 by the authors. Licensee MDPI, Basel, Switzerland. This article is an open access article distributed under the terms and conditions of the Creative Commons Attribution (CC BY) license (https://creativecommons.org/licenses/by/4.0/).
Share and Cite
Wang, J.; Apel, D.B.; Xu, H.; Wei, C.; Skrzypkowski, K. Evaluation of the Effects of Yielding Rockbolts on Controlling Self-Initiated Strainbursts: A Numerical Study. Energies 2022, 15, 2574. https://doi.org/10.3390/en15072574
Wang J, Apel DB, Xu H, Wei C, Skrzypkowski K. Evaluation of the Effects of Yielding Rockbolts on Controlling Self-Initiated Strainbursts: A Numerical Study. Energies. 2022; 15(7):2574. https://doi.org/10.3390/en15072574
Chicago/Turabian StyleWang, Jun, Derek B. Apel, Huawei Xu, Chong Wei, and Krzysztof Skrzypkowski. 2022. "Evaluation of the Effects of Yielding Rockbolts on Controlling Self-Initiated Strainbursts: A Numerical Study" Energies 15, no. 7: 2574. https://doi.org/10.3390/en15072574
APA StyleWang, J., Apel, D. B., Xu, H., Wei, C., & Skrzypkowski, K. (2022). Evaluation of the Effects of Yielding Rockbolts on Controlling Self-Initiated Strainbursts: A Numerical Study. Energies, 15(7), 2574. https://doi.org/10.3390/en15072574