1. Introduction
Europe (EU) is aiming to fully decarbonise its energy supply via a large electrification of the energy system, driven by a massive deployment of decentralised renewable technologies [
1]. Although electrification is a viable decarbonisation strategy for low-grade heat production and light-duty heat transport, its feasibility is much more challenging for other energy end uses. Moreover, this deployment of intermittent renewable energy supply leads to a substantial increase in variability at different timescales in power supply, and introduces new challenges to ensure stability, reliability, and adequacy of the power system. The local peaks generated can be addressed by a smart energy management including demand response, and by the further deployment of technologies to match fluctuations in electricity demand and supply [
2].
In this context, the coupling of energy sectors that are traditionally planned and operated independently is seen as an option to achieve a transition towards a net-zero greenhouse gas economy in a cost-effective way as it enables the exploitation of their interactions and synergies. The development of such integrated energy systems (or multi-energy systems, MES) is likely to lead to better technical, environmental, and economic performances compared to independent energy systems [
3]. Indeed, the renewable electricity can be converted in other energy carriers such as heat or cooling, hydrogen (H
2), synthetic natural gas (SNG) or other advanced e-fuels by means of converter devices that are causing the interactions between energy systems. These allow energy system operators to arbitrarily shift between the electrical, chemical, and thermal states of energy.
In its communication on energy system integration to power a climate-neutral economy [
4], the European Commission stresses that combined heat and power, the exchange of energy in smart district heating and cooling or energy communities, and the use of low-carbon fuels including H
2 are key concepts for energy system integration.
The long-term planning of MES plays an important role in the assessment of the impact of considering energy supply as an integrated whole on the flexibility of the power system as well as on the pollutants’ emissions reduction potential and costs.
Indeed, defining cases studies and evaluating the best combination of energy vectors and technologies to simultaneously meet the different end-use services can provide insightful information on the technoeconomic effectiveness of decarbonisation strategies and pathways.
In this light, the objective of this paper is to provide views on the potential of coupling the power and residential heat sectors for the Brussels-Capital Region (BCR). Consequently, a linear programming (LP) optimisation framework is developed and applied as a case study to supply the energy needs of Brussels under zero-CO2 emissions constraints. As a result, the equivalent annual cost of owning and operating of the integrated system as well as the levelised cost of energy (LCOE) of the energy supply are derived and discussed for four scenarios involving different levels of coupling.
2. Related Work
Mancarella [
3] provided an overview of MES concepts. Overviews of MES modelling approaches were respectively provided by Mancarella et al. [
5] and Kriechbaum et al. [
6]. Specifically, Bloess et al. [
7] identified state-of-the-art analytical model formulations for a flexible coupling of power and heat sectors using power-to-heat technologies, but with a lack of consideration of power-to-gas technologies. Gabrielli et al. [
8] presented a novel mixed-integer linear programming (MILP) methodology that allows the simulation of multi-energy systems with seasonal storage considering a 1-year time horizon with hourly resolution, considering power-to-gas, but only heat pumps were studied for the coupling of power and heat and biomass was not considered. Liu et al. [
9] proposed a long-term planning model for combined cooling, heating, and power systems considering energy storage and demand response, Dong et al. [
10] developed a MILP optimisation--planning model of integrated energy systems based on a coupled combined cooling heating and power system, considering the planning and operation of power lines and gas pipelines; but both did not consider H
2, SNG, or biomass as energy vectors. A generic MILP framework for the optimisation of long-term investment planning of integrated urban energy systems, including gas cogeneration, EHP, and power-to-gas conversion is proposed by van Beuzekom et al. [
11], without considering biomass and H
2 as additional energy vectors. The same observation applies to Martínez Ceseña et al. [
12], who investigated the potential of multi-energy districts by applying an integrated electricity–heat–gas system model. Finally, Berger et al. [
13] used modelling frameworks for the planning and operation of integrated energy systems to assess the role of power-to-gas, biomass and carbon-capture technologies in cross-sector decarbonisation strategies; however, the model does not explicitly consider the heat demand and, therefore, does not consider combined heat and power (CHP) and power-to-heat technologies.
In conclusion, there is still a need to explore, in a simple yet effective way, integrated systems configurations for decarbonisation strategies that simultaneously consider the coupling of heat, gas, and power systems with the use of electricity, NG, SNG, H2, and biomass as energy vectors. This study aims to achieve this coupling by means of 10 converting units: biomass, NG or SNG and H2 CHP units; biomass, NG or SNG, H2 boilers; electric boilers and EHP units as power-to-heat technologies; and water electrolysis and methanation (METH) as power-to-gas technologies. Additionally, the study is extended with the comparison of individual and district-level technologies usage to determine an optimal configuration of the integrated power and residential heat supply system.
3. Problem Statement and Formulation
In this section, the interactions between the five energy vectors of the integrated system will be described with help of a schematic view of the MES given in
Figure 1.
As a second part, the modelling framework is provided with the presentation of the mathematical model.
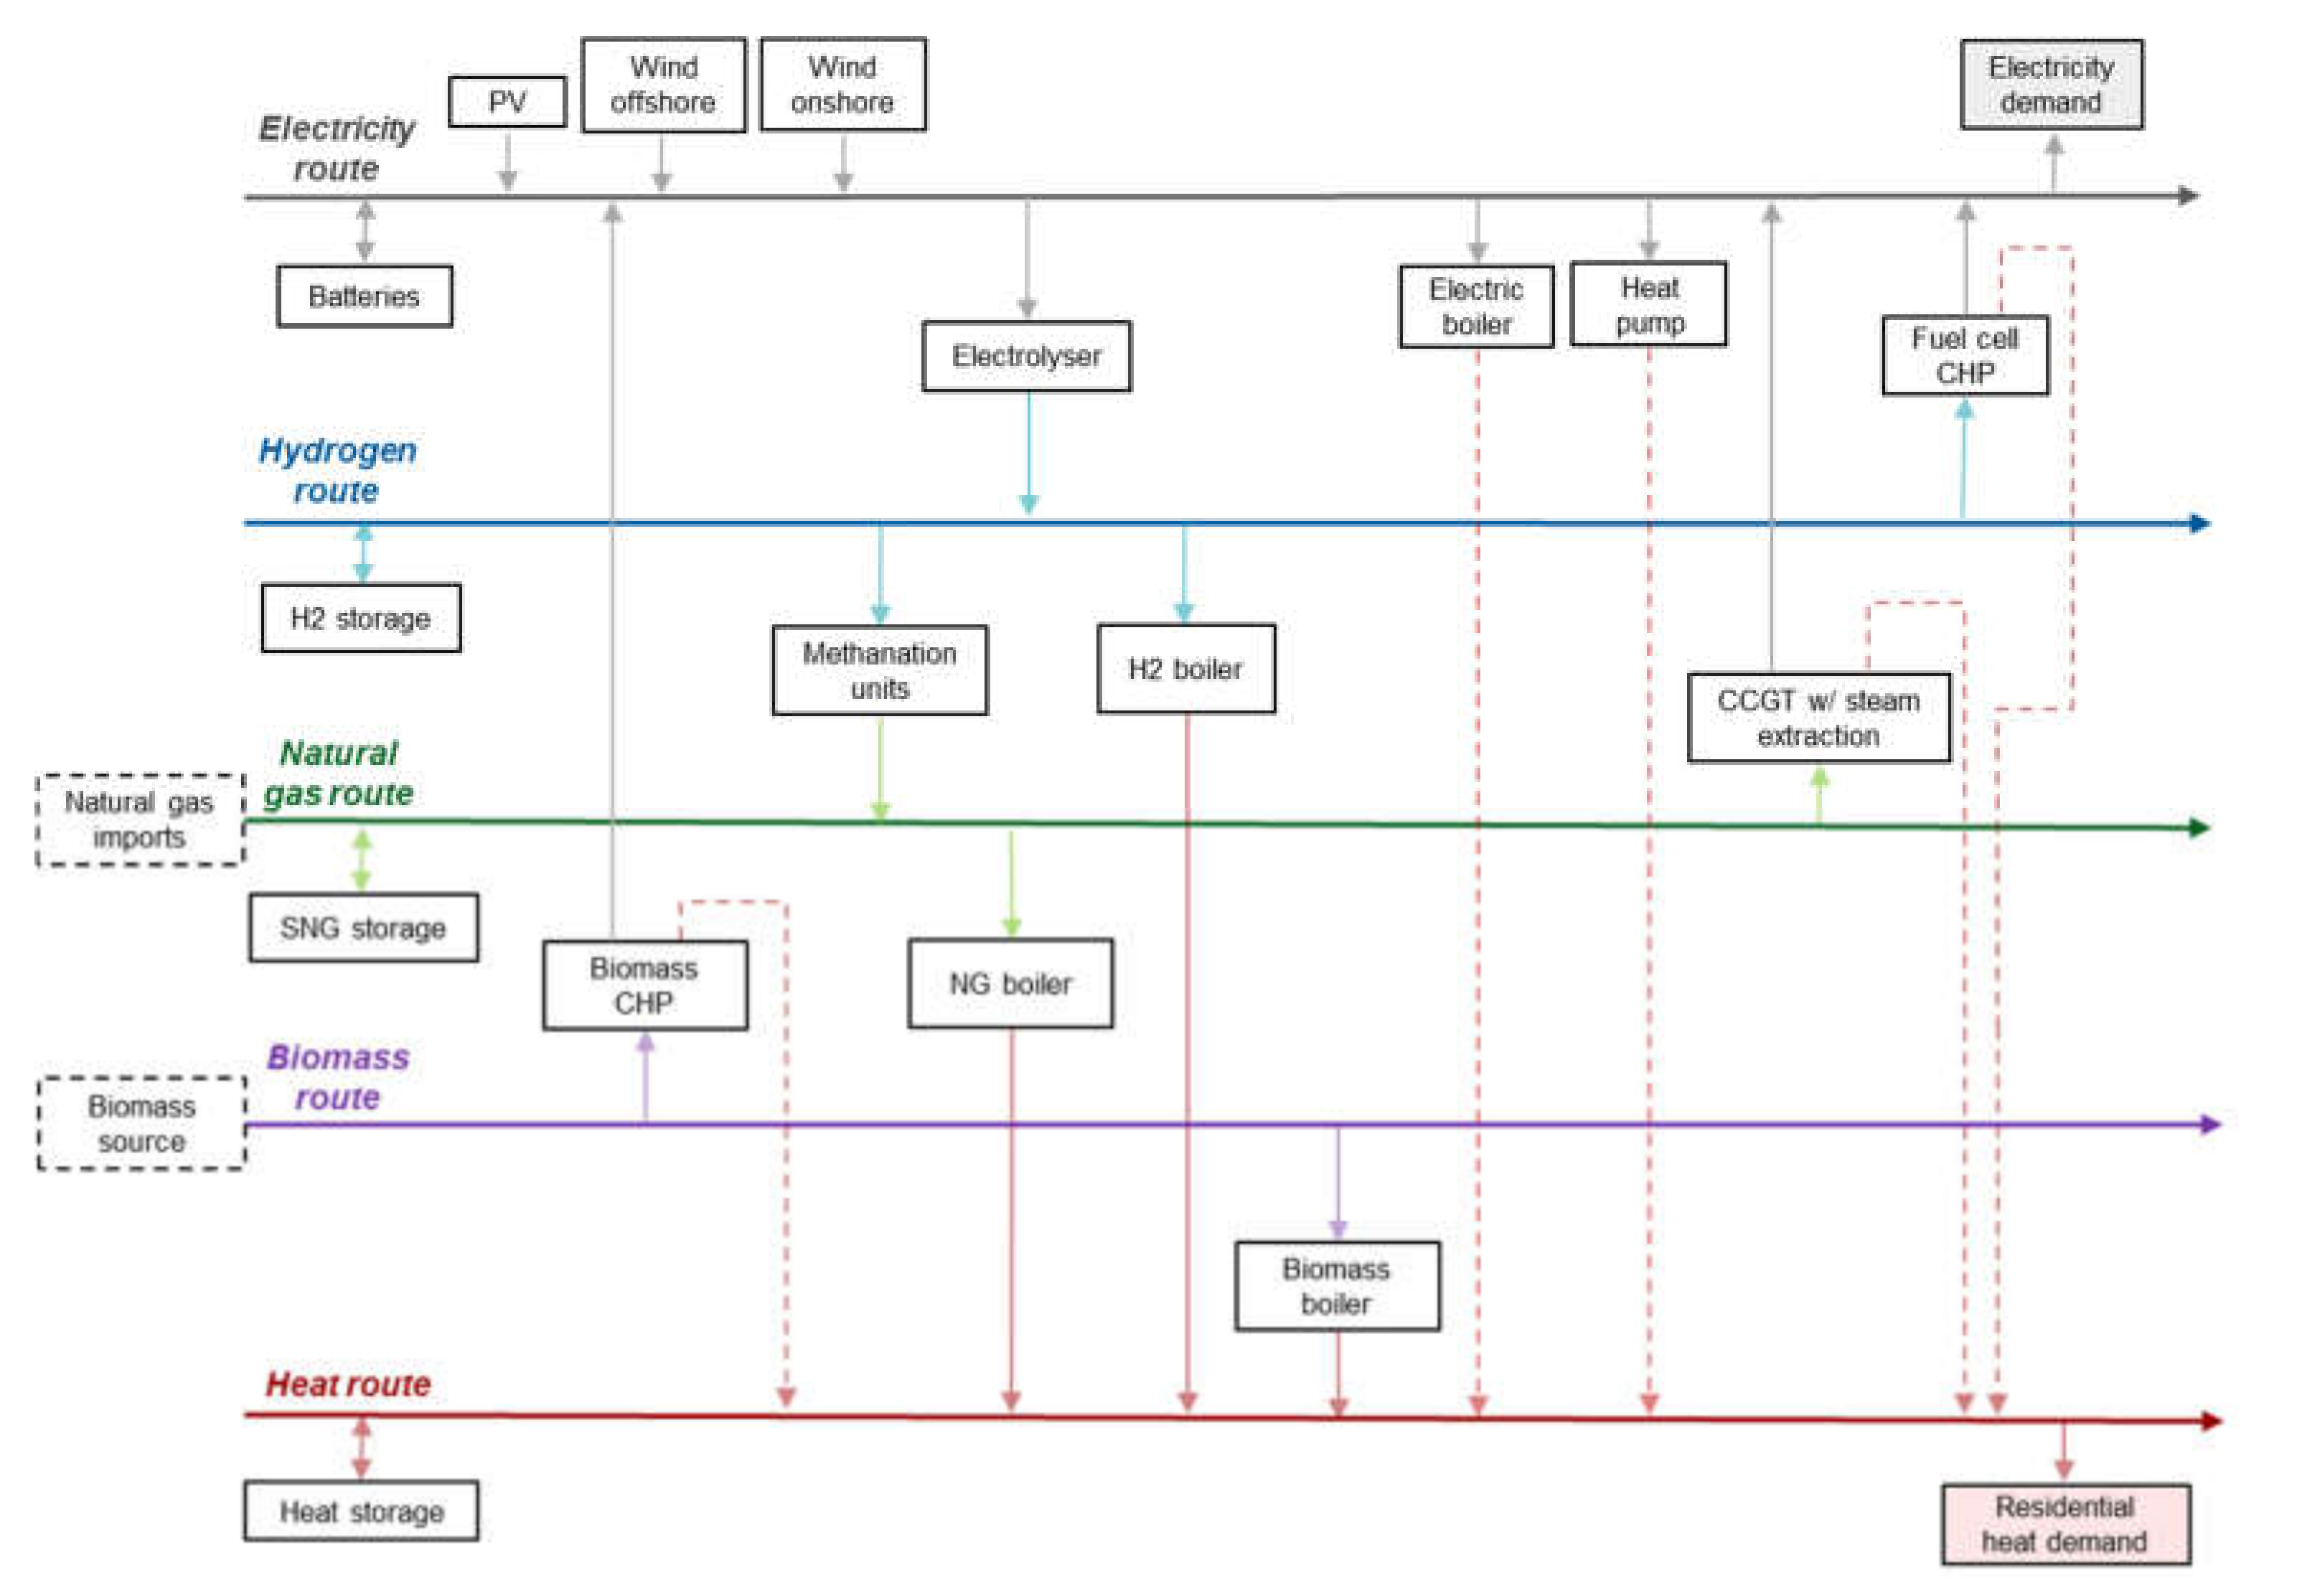
3.1. The Multi-energy System
The proposed integrated system implies the coupling of five energy carrier routes, among which only one is a fossil fuel: electricity, hydrogen, natural gas (CH4, NG), biomass, and heat.
The renewable energy infeed is coming from variable renewable energy sources (VRES) such as photovoltaics (PV), onshore wind (WON), and offshore wind (WOFF). The objective of the MES is to select and determine the optimal output of generating units to jointly meet the power and residential heat demands, while minimising the long-term investment and production costs of assets.
The coupling between these five energy routes is expected to drive the optimisation of energy management by means of converting technologies that allow to conveniently switch from one energy vector to another.
Along with storage assets for each energy vector except biomass, 10 converters are modelled: electrolysers (EL), H2 fuel cells (FC) CHP, EHP, METH, CCGT, biomass CHP, and residential boilers. Four types of boilers are considered: classic NG boilers, electric boilers, biomass boilers, and H2-ready boilers. CCGT and NG boilers can be either provided by NG or carbon-free SNG. The SNG is produced by combining H2 with CO2 following the Sabatier process in METH units. Note that NG and biomass are supposed fully available to be imported when needed. Finally, CO2 involved in the Sabatier process is also assumed to be fully available, for example coming from the carbon capture of industrial processes.
3.2. Modelling Assumptions
The mathematical problem is formulated as a single-node LP using the GAMS modelling framework and is solved by the state-of-the-art IBM CPLEX solver.
The choice of a single-node LP allows consideration of the fact that all the above-presented technologies are fleets (or clusters) of numerous units operating in cascade at (or near) nominal efficiency. Moreover, the operational dynamics of individual units considered in unit-commitment (UC) formulation are not considered in the single-node formulation, alleviating the complexity of the model to optimise the MES with a 1-year simulation time interval with a reasonable solving time. Such typical operational constraints are the starting times and costs, the ramping up and down rates, the minimum loads, the minimum down times, or the eventual must-run times. Part-load efficiencies and variable CO2 emission factors can also be considered.
Finally, with the target year of the BCR case study being 2050, it is expected that the considered technologies are sufficiently mature to be deployed with the projections of the techno-economic parameters presented in
Table 1 Moreover, it is assumed that district heating (DH) infrastructure is widely available as well as the EU H
2 backbone infrastructure to fully enable the distribution of heat and H
2 for buildings.
3.3. LP Model Formulation
The following mathematical model is mostly inspired by the optimisation-based framework to tackle long-term centralised planning problems of MES, assuming perfect foresight and competition proposed by the department of electrical engineering and computer science from the University of Liège [
13]. Note that when equations are adapted from other works, the associated references will be specifically indicated.
3.3.1. Sets
Four sets are introduced in the mathematical model: the simulation time interval I, containing the 8760 time steps; the set of energy carriers E = {elec, H2, CH4, biomass, heat}; the set of generating technologies G = {EL, FC, METH, CCGT, EHP, METH, boiler}; and the set of VRES technologies S = {PV, WON, WOFF}.
3.3.2. Converting Technologies
For each time step
i in the simulation interval I, the operation and constraints of converting technologies are described as follows:
where
and
are respectively the consumption of the carrier
e and the production of the carrier
e′, both expressed in MW. Equation (1) states that such technologies allow the switching from an energy vector into another considering the efficiency
to convert
c into
e′. In (2),
is the installed capacity of the technology generating
c′ that sets an upper value on its output.
Regarding EHP units,
is replaced by
COP(
i), the coefficient of performance (COP) of such systems, a variable parameter that highly depends on the temperature of the heat source and sink through the year [
7]. Although it is accepted to assume a constant, average value of the COP, several formulations are presented in [
7] to compute
as a function of these temperatures with different levels of complexity. Nevertheless, convenient time series representing the evolution of
over the year for Belgium from the
When2Heat dataset [
20] were used as inputs of the simulation tool.
Finally, when considering the METH unit, CO
2 is combined to H
2 to produce SNG following the Sabatier process. The CO
2 mass inflow (
) to combine with H
2 for the reaction to occur is computed from
as follow:
where
is the ratio of the stoichiometric coefficients of CO
2 and O
2,
and
are respectively the molar mass of CO
2 and CH
4 in the Sabatier reaction, and
is the higher heating value (HHV) of CH
4.
3.3.3. Cogeneration Technologies
For cogeneration technologies such as stationary CHP fuels cells and CCGT units with steam extraction (SE) turbines, additional equations are required for the heat co-produced. The introduction of the heat-to-power (HTP) ratio is therefore carried out to describe the quantity of heat obtained per unit of generated power.
This ratio is linked to the electrical and thermal efficiencies of the unit (resp.
and
in a generic fashion via the following relation:
where
g* is a cogeneration unit of the subset
G* comprising CCGT, FC and biomass CHP units. Consequently, knowing
and either one of the total heat or electricity conversion efficiency of the CHP plant, one can compute its power (
) and heat (
) outputs.
Starting with the formulation for the CHP units, the heat generated is formulated as in (4) with
and
being the electric and thermal efficiencies of the FC system:
When considering CCGT systems with SE turbines, the modelling is adapted from [
15] to allow the extraction of variable amounts of heat considering a power-loss factor (PLF) denoted
β. This coefficient determines the loss of electricity generation to produce heat. Note that compared to back-pressure (BP) turbines, SE turbines are convenient for DH since the output water temperature can be adjusted [
21].
Equation (6) is similar to (5) to compute the cogenerated heat power using , but one has to note that since it is an inequality, may be variable and even null. Equation (7) introduces the fact that a loss of electrical power occurs in the CCGT if the heat power is nonzero at time step i.
3.3.4. Direct CO2 Emissions
The CCGT and the NG boiler are units using a fossil fuel to produce energy, the direct CO
2 must then be accounted for as follows:
where
g** is a CO
2-emitting unit of the subset
G** involving the CCGT and the NG boiler. For both these units,
is the specific CO
2 emissions factor of CH
4 and is set to 0.202 tonnes of CO
2 per MWh of CH
4 consumed. Note that the specific emissions of a power plant are not equal to the specific emissions of the fuel used, but the latter is chosen in this analysis as assumption.
3.3.5. Energy Storage
For each energy carrier
, the set containing the four energy carriers, it is common to model the dynamics of its associated storage unit by updating its state of charge (SOC) for each time step, by considering self-discharge of the battery along with the charging and discharging efficiencies (resp.
and
) as follow
, eE:
Equation (9) shows that, to compute the current SOC of the technology s, the previous SOC is multiplied by a self-discharge coefficient , then the charging and discharging powers and are respectively added and subtracted considering their associated efficiencies.
Moreover, the installed energy capacity in (10) is setting a maximum value on the SOC of the storage technology s.
Note that, according to [
18,
22], it is acceptable to assume
=
= 0, meaning that energy losses due to leakage in the NG and H
2 storage units can be considered negligible.
When considering batteries as electricity storage, additional equations are required to model its dynamics because one must make the distinction between its power and energy components. Indeed, the installed power capacity of the battery
in (11) and (12) is used to constrain the power flowing in or out of the storage. Indeed, taking hydrogen storage as an illustrative example for the other storage technologies, the charging power is equal to the hydrogen power generated in the electrolyser, which is already constrained by
.
Equation (13) is deals with the interdependencies of the energy and power components of a battery using the coefficient . This coefficient is assumed to be equal to 4 in this study.
3.3.6. Carriers’ Physics
The MES model comprises the five following single-node energy balance equations (resp. for electricity, H
2, CH
4, biomass and heat) that must be respected for each time step, one equation for each energy carrier. The left-hand side of these equations corresponds to the production of energy carrier while the right-hand side focuses on their consumption.
In (14),
is the power generation of the VRES technology
(PV, WON and WOFF), extracted from input time series (see
Section 4.2.1). The terms
and
are introduced to allow eventual VRES curtailment or load shedding (LS), respectively.
3.3.7. Costs
The total cost of owning and operating an MES can be divided into two contributions, the total investment costs
and the total operating costs
.
are determined by (19) considering the unit capex of the technology
and its installed capacity. As stated in (20), the five contributions to
over the time interval
I are the total fixed and variable operating costs (resp. FOM and VOM) for all the technologies, the total fuel costs
, the CO
2 emission costs
, and the total cost of ENS.
are estimated by multiplying the total power generation from CH
4 during the simulation by a constant unit cost of NG denoted
set at 42.4
HHV imported [
23]. The same process is applied with power generation from biomass with a constant unit cost
set at 44.63
[
24].
is determined by multiplying the difference of the total CO
2 emissions and the total amount of CO
2 that was converted in the methanation unit by a carbon price per tonne CO
2 emitted in the atmosphere
. The value of
is equal to 126
, corresponding to the carbon tax projection for 2050 [
23].
is finally computed by the product of the total amount of curtailed electricity by the value of loss load
, set to 3000
. This large value aims to discourage load shedding [
13].
Note that, when considering a storage technology , replaces , and that is substituted by the sum of and .
Finally, the LCOE metric is computed in (21), adapted from the methodology for multi-energy systems presented in [
25].
where
is the total energy demand (electric and thermal) of the integrated system over the simulation time interval. Equation (21) represents the net present value (NPV) of the total costs over the economic lifetime
N divided by the NPV of the energy produced over
N.
3.3.8. Objective Function
An objective function represents any function that one wants to optimise over the time interval I. Regarding energy system simulations, the focus is to minimise the annual costs of owning and operating the MES, namely the sum of the total annualised CAPEX (
) and the total annual OPEX:
where
is determined using (22), considering a discount rate
D and an economic lifetime
N of the project [
26].
The term multiplying corresponds to the capital recovery factor.
5. Results and Conclusions
The results of the case study are presented in
Figure 3,
Table 2 and
Table 3.
Figure 3 and
Table 3 present the annual cost of owning and operating the MES for each scenario, while
Table 4 presents the installed capacities of the technologies per scenario.
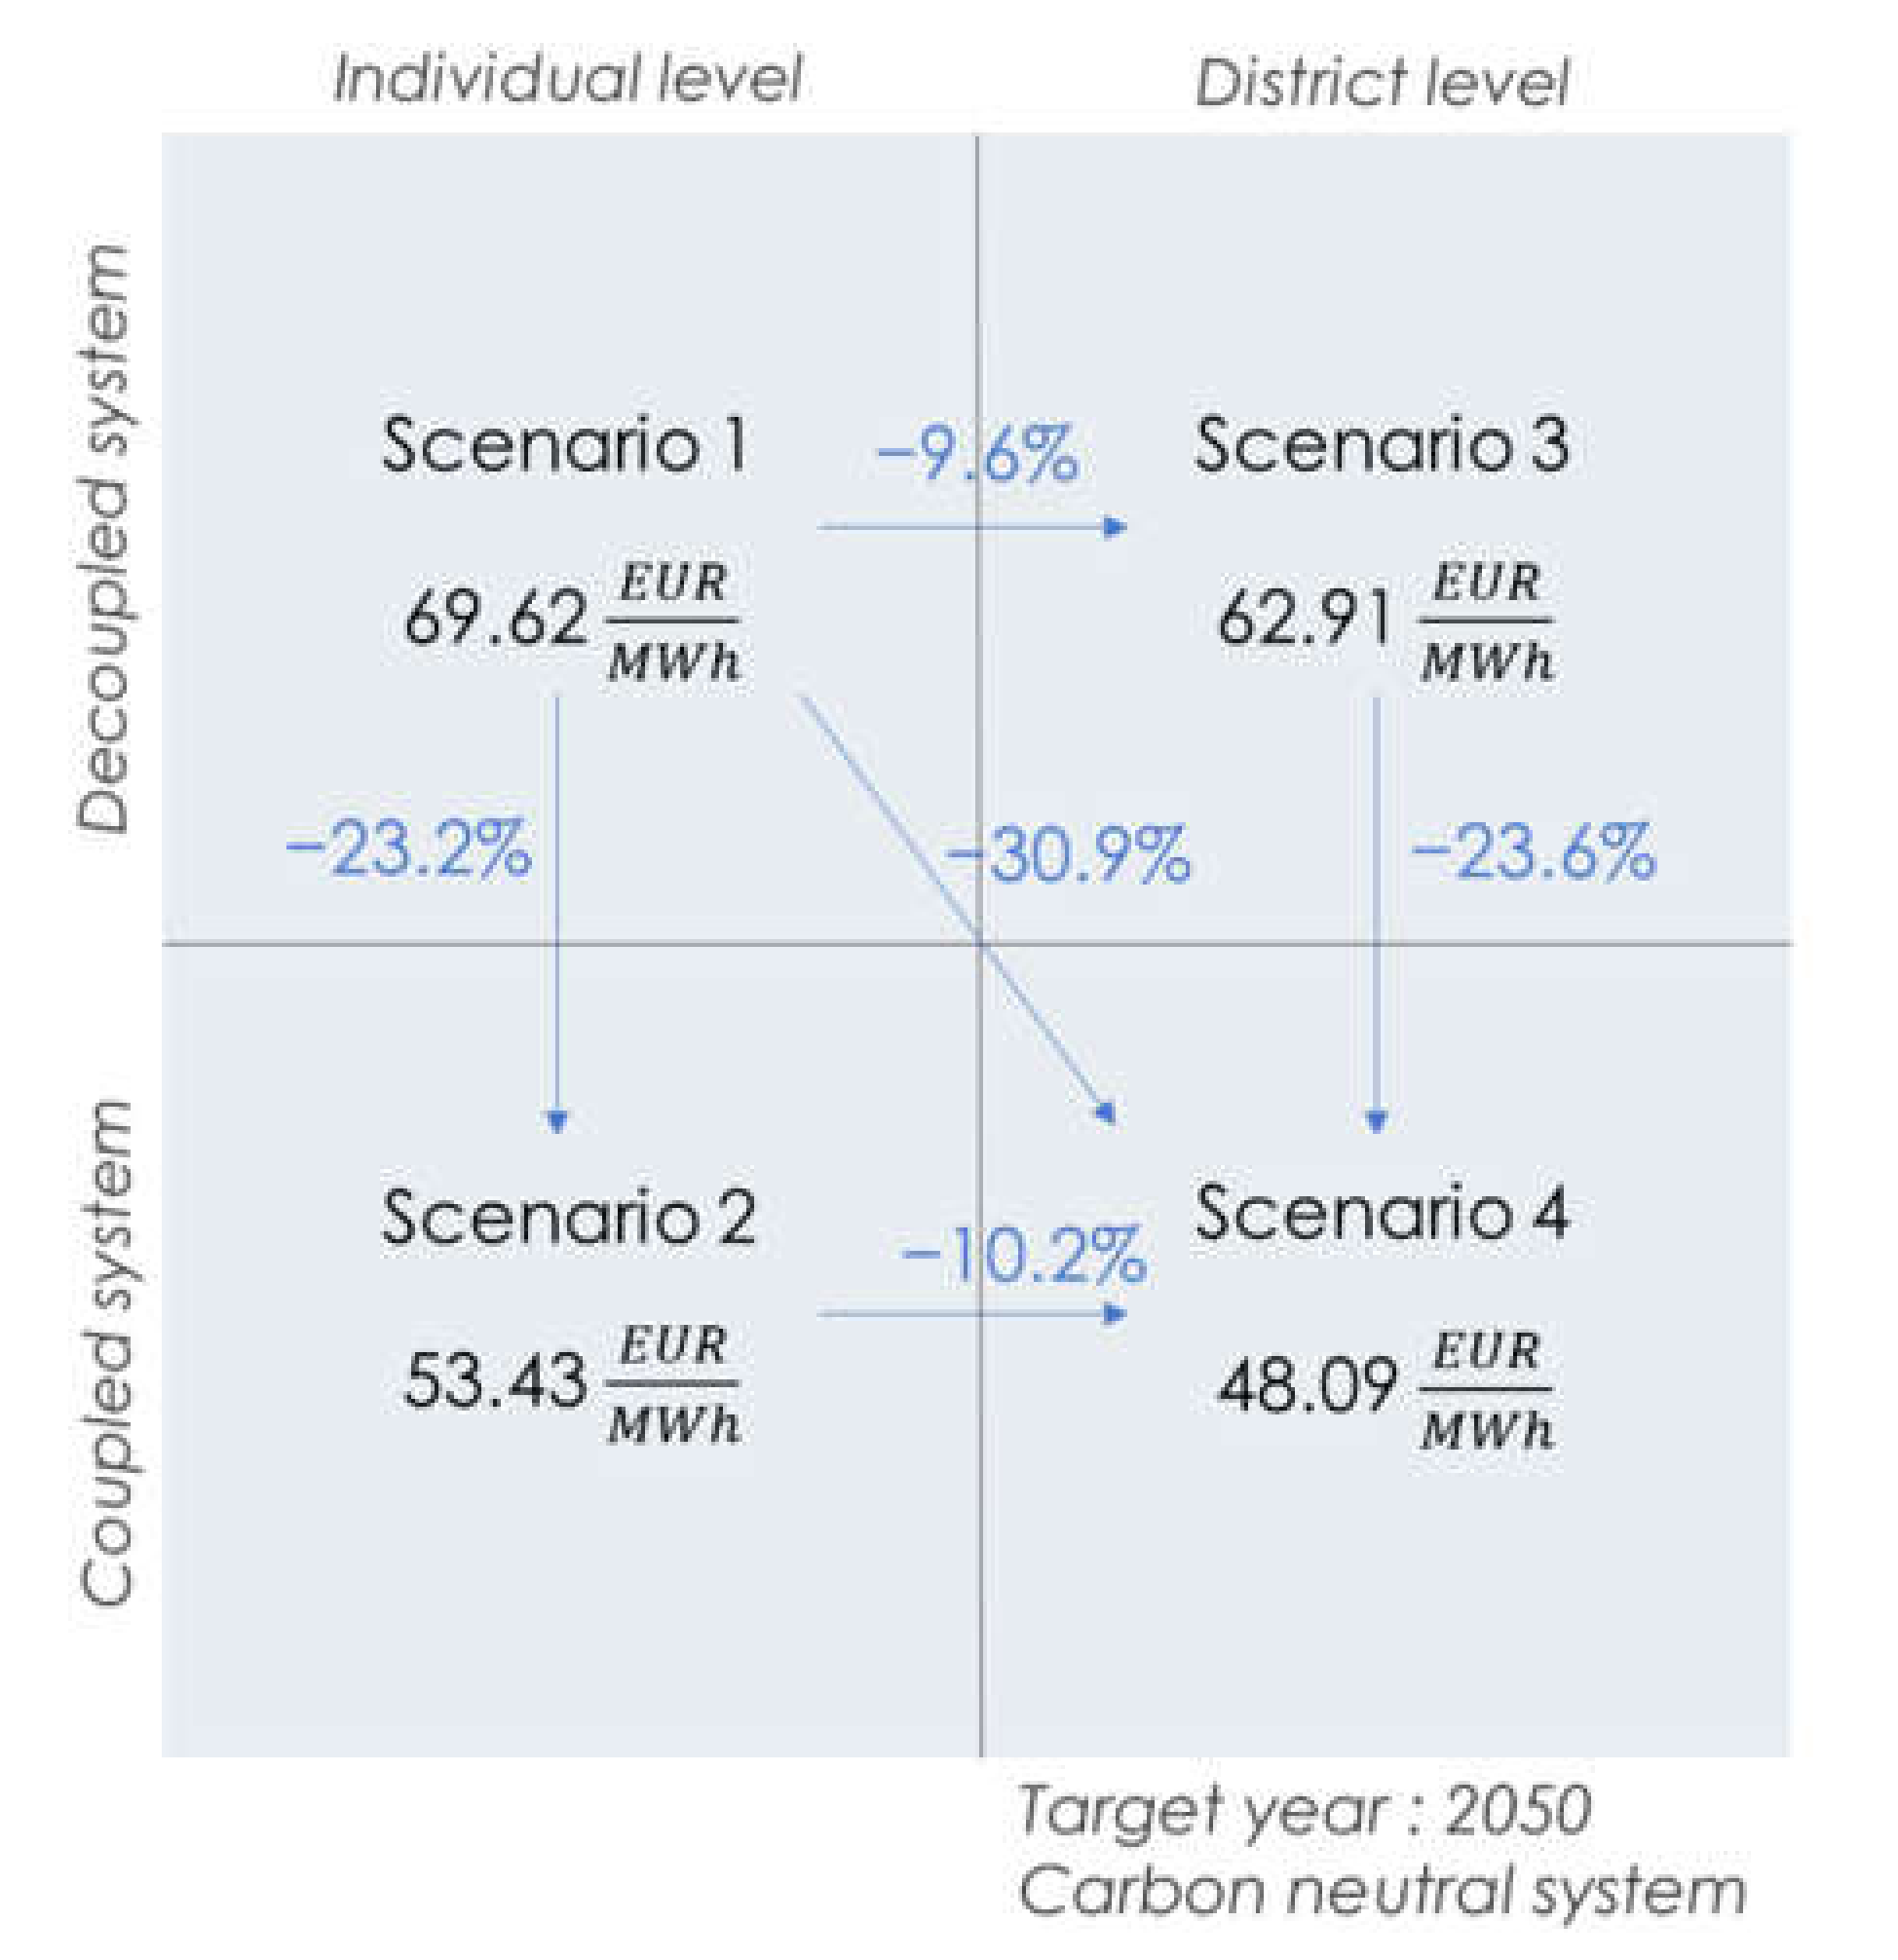
Under the assumptions of this work, one observes from
Table 3 and
Figure 3 that the total costs decrease when sector coupling is enabled. Indeed, when comparing scenarios 1 and 2 against 3 and 4, the total annual costs decrease by 23.2% and 23.6%, respectively. This holds true when comparing the LCOE of these scenarios. The use of district-level units for sector coupling also reduces the total costs as well, compared to the use of individual units. Indeed, one observes a cost reduction of 9.6% and 10.2%, respectively, when comparing scenarios 1 and 3 against 2 and 4. Enabling both coupling between power and residential heat sectors and the use of district-level technologies induces a cost reduction of 30.9% for the energy supply of Brussels in 2050, with an LCOE equal to 48.09
. However, one must account for the price and availability of hydrogen and heat distribution infrastructures.
The scenario achieving the lowest cost of energy supply is scenario 4, with an LCOE of 48.09 EUR/MWh. The associated model configuration is involving the use of biomass and SNG CHP units and electric boilers, all supplying heat via DH. In this scenario, H2 production via water electrolysis is directly converted into SNG, thereby excluding its use in FC CHP and boilers. No storage of H2 is considered by the optimiser, only seasonal storage of SNG. Finally, battery and heat storage are also selected to reduce the annual costs in the last scenario.
From
Table 3, one understands that amongst the technologies and energy vectors considered in this study, electricity storage, biomass and SNG would play a key role for a carbon neutral energy supply in cities, with an extensive use of batteries, biomass and NG CHP technologies in every scenario. It is also reported that, for each scenario, no NG was imported to the system, meaning that only SNG was used. On the other hand, EHP and FC technologies were never used in the four scenarios, suggesting that these are not competitive compared to the other technologies, even if considering the 2050 technoeconomic data projections. Note that, although not included in this work, the potential of other hydrogen CHP technologies such as H
2 turbines or H
2 internal combustion engine should be studied according to the authors.
Additionally, it is shown in scenario 1 that when no coupling and district-level technologies are considered, NG and H2 boilers are preferred compared to biomass and electric boilers. Moreover, while NG boilers are not considered in scenarios 2, 3 and 4, electric boilers are only chosen by the optimiser when district-level units are enabled, and H2 boilers are abandoned when both coupling and district-level technologies are enabled in scenario 4. This is certainly due to the very cheap cost of electric boilers technology for DH purposes.
A further analysis of the technology mixes per scenario in
Table 3 highlights that sector coupling with the deployment of district-level technologies has the potential to significantly reduce the VRES infeed required to supply cities. In fact, the installed capacities of PV and Wind onshore are reduced by 31.9% and 55.8%, respectively, when comparing scenario 1 with scenario 4. Note that offshore wind turbine technology is never selected by the optimiser, certainly due its larger cost compared to onshore wind technology and since the maximum installed capacities of PV and WON are not outreached. Furthermore, the use of H
2 and SNG is significantly reduced from scenario 1 to scenario 4 as well, suggesting that heat cogeneration and distribution of heat in DH systems with heat storage has the potential to reduce the need for e-fuels for residential heating supply in cities. Indeed, installed capacities of EL and METH units in the last scenario are roughly divided by 10 and 6, respectively, compared to the first scenario.
Focusing on biomass, one observes that the use of biomass CHP is maximised when heat is recovered for DH purposes, since biomass CHP capacity increase while biomass boilers are put aside and the installed capacities of H2 boilers and SNG CCGT decrease when allowing sector coupling (scenario 2 compared to scenario 1). Finally, the use of biomass seems promising for the carbon-free supply of cities because it is considered as a net zero CO2 emissions fuel, which gives a clear advantage compared to the expensive and less efficient production of e-fuels such has H2 and SNG.
It is important to note that the multi-energy system of this case study is proposed regardless of the potential future ambitions of the Brussels authorities regarding energy efficiency and local emissions of pollutants. Therefore, in 2050, EHP technologies might be preferred to resistive heaters to reduce the power-to-heat induced peak electricity use [
36]. In terms of urban air quality, some biomass combustion technologies might be prohibited on the BCR territory since solid biomass is not included in the medium-term strategy and will likely be subject to strong environmental requirements and air quality standards [
36].
To ensure a replicability for the BRC, the 4 scenarios of the case study are studied again, excluding the use of biomass technologies as well as electric boilers. Consequently, scenarios 5 to 8 are presented hereafter in
Figure 4 and
Table 4, following the same methodology than for scenarios 1 to 4.
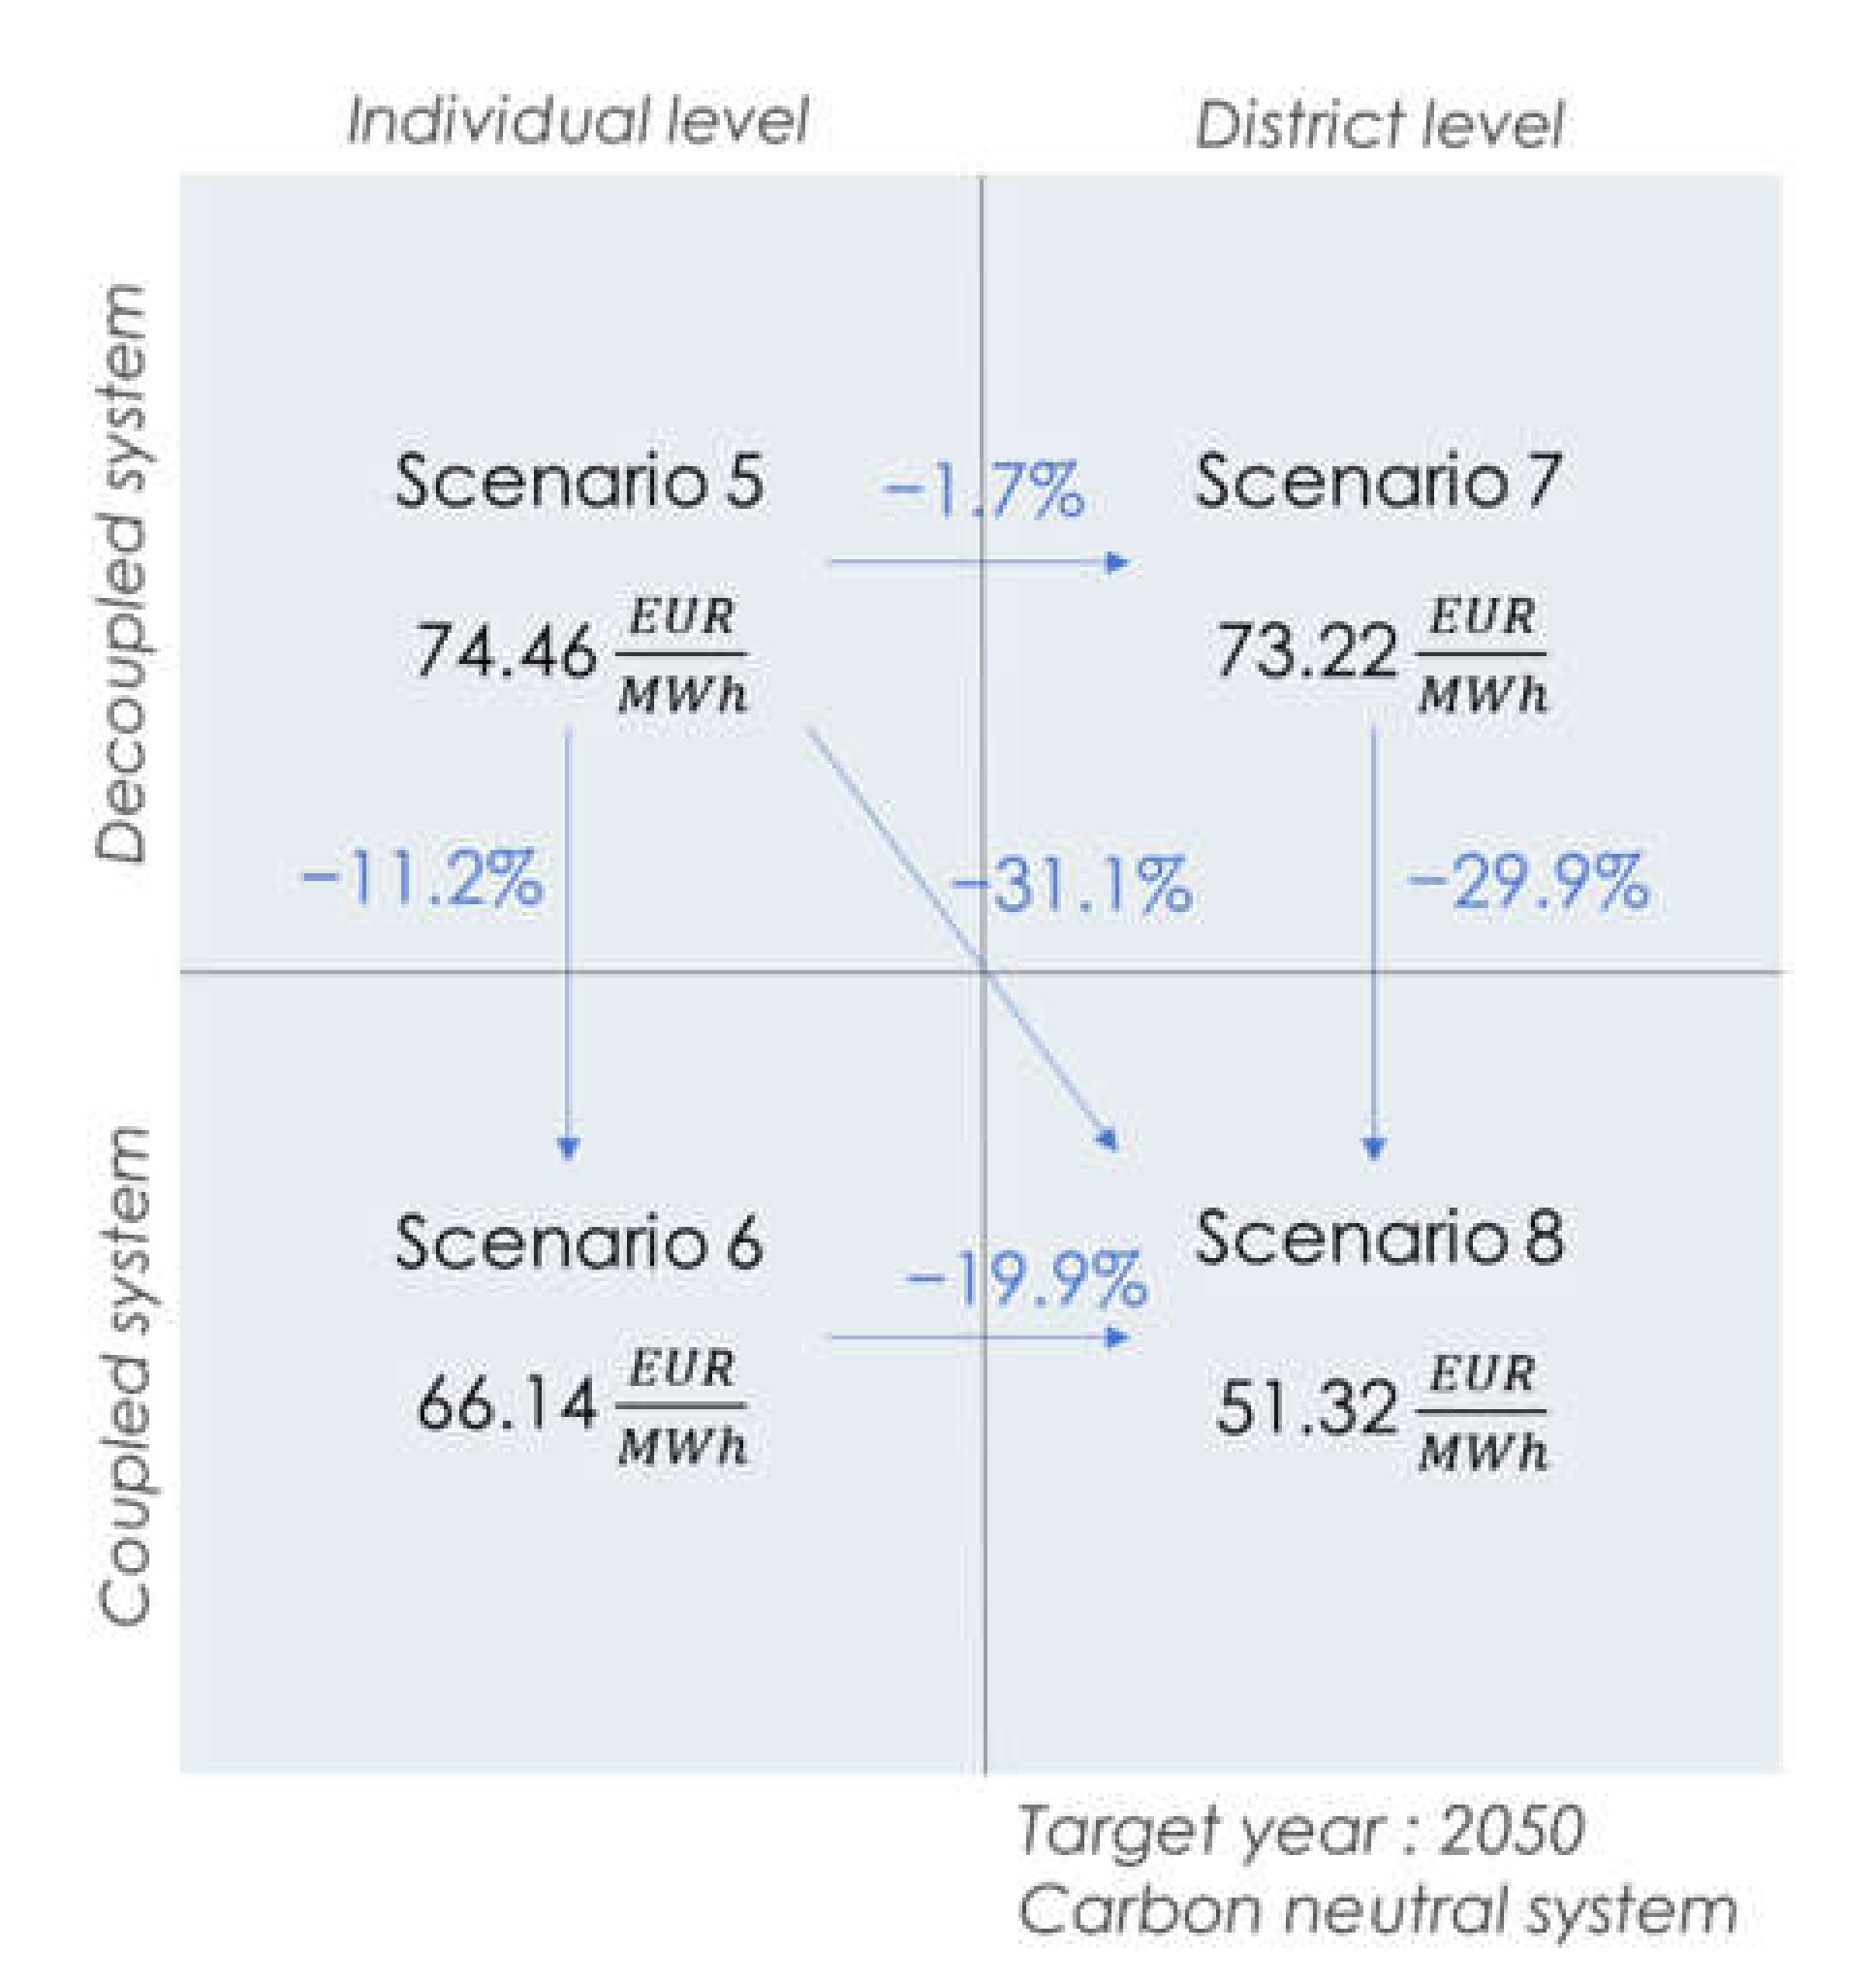
From
Figure 4, one observes that the best-case scenario is scenario 8, with a LCOE equal to 51.32
for the energy supply. In comparison with scenario 5, the best-case scenario of the case study including biomass and electric boilers, the annual costs increased by 6.3%. Consequently, if efficiency and strict air quality standards are prominent in the decarbonisation strategy, the total annual costs for the energy supply are expected to increase since more hydrogen is required to replace the use of solid biomass, inducing an increase in PV and EL capacities in scenarios 5 to 8. On the other hand, local emissions of pollutants for power and residential heat supply are avoided and the induced peak due to power-to-heat technologies is reduced by more than 30% (244.7 MW peak due to electric boilers in scenario 4 opposed to 165.5 MW peak due to EHP units in scenario 8).
Moreover, the conclusions regarding the cost reduction potential when applying sector coupling and considering district-level technologies are equivalent for both sets of scenarios, with a LCOE reduced by 31.1% for the energy supply in scenario 8 compared to scenario 5.
Focusing on the technology mixes presented in
Table 4, the required installed capacity of PV is reduced by 32.43% when coupling is enabled with DH (scenario 5 compared to scenario 8). In scenario 6, when power-to-heat interactions are enabled, massive investments in individual EHPs are observed (and in FC to a lesser extend), with the consequence to reduce the use of H
2 and SNG in residential boilers since one notes an important reduction in METH and NG boilers capacities in scenario 6 compared to scenario 5. Quite surprisingly, the capacities of NG and H
2 boilers is null in the last scenario, totally replaced by FC and CCGT in cogeneration mode along with EHP units. These technologies again alleviate the production and use of SNG, with installed capacities of METH units divided by 2.22 with regard to scenario 5. The capacity of EL technology is substantially reduced as well since les H
2 is required to produce SNG and heat. It is finally worth noting that storage of each energy vector is a key element to achieve a carbon neutral energy supply, with heat storage being particularly important in scenario 8 where heat is produced at district-level and distributed via DH.
6. Summary
This study was divided into two main parts, with the first part being the elaboration of the mathematical model to describe the interactions between five energy vectors (electricity, heat, methane, biomass and hydrogen) in a multi-energy system, with the objective to minimise the long-term investments in generation and storage assets for the power and residential heat supply in cities.
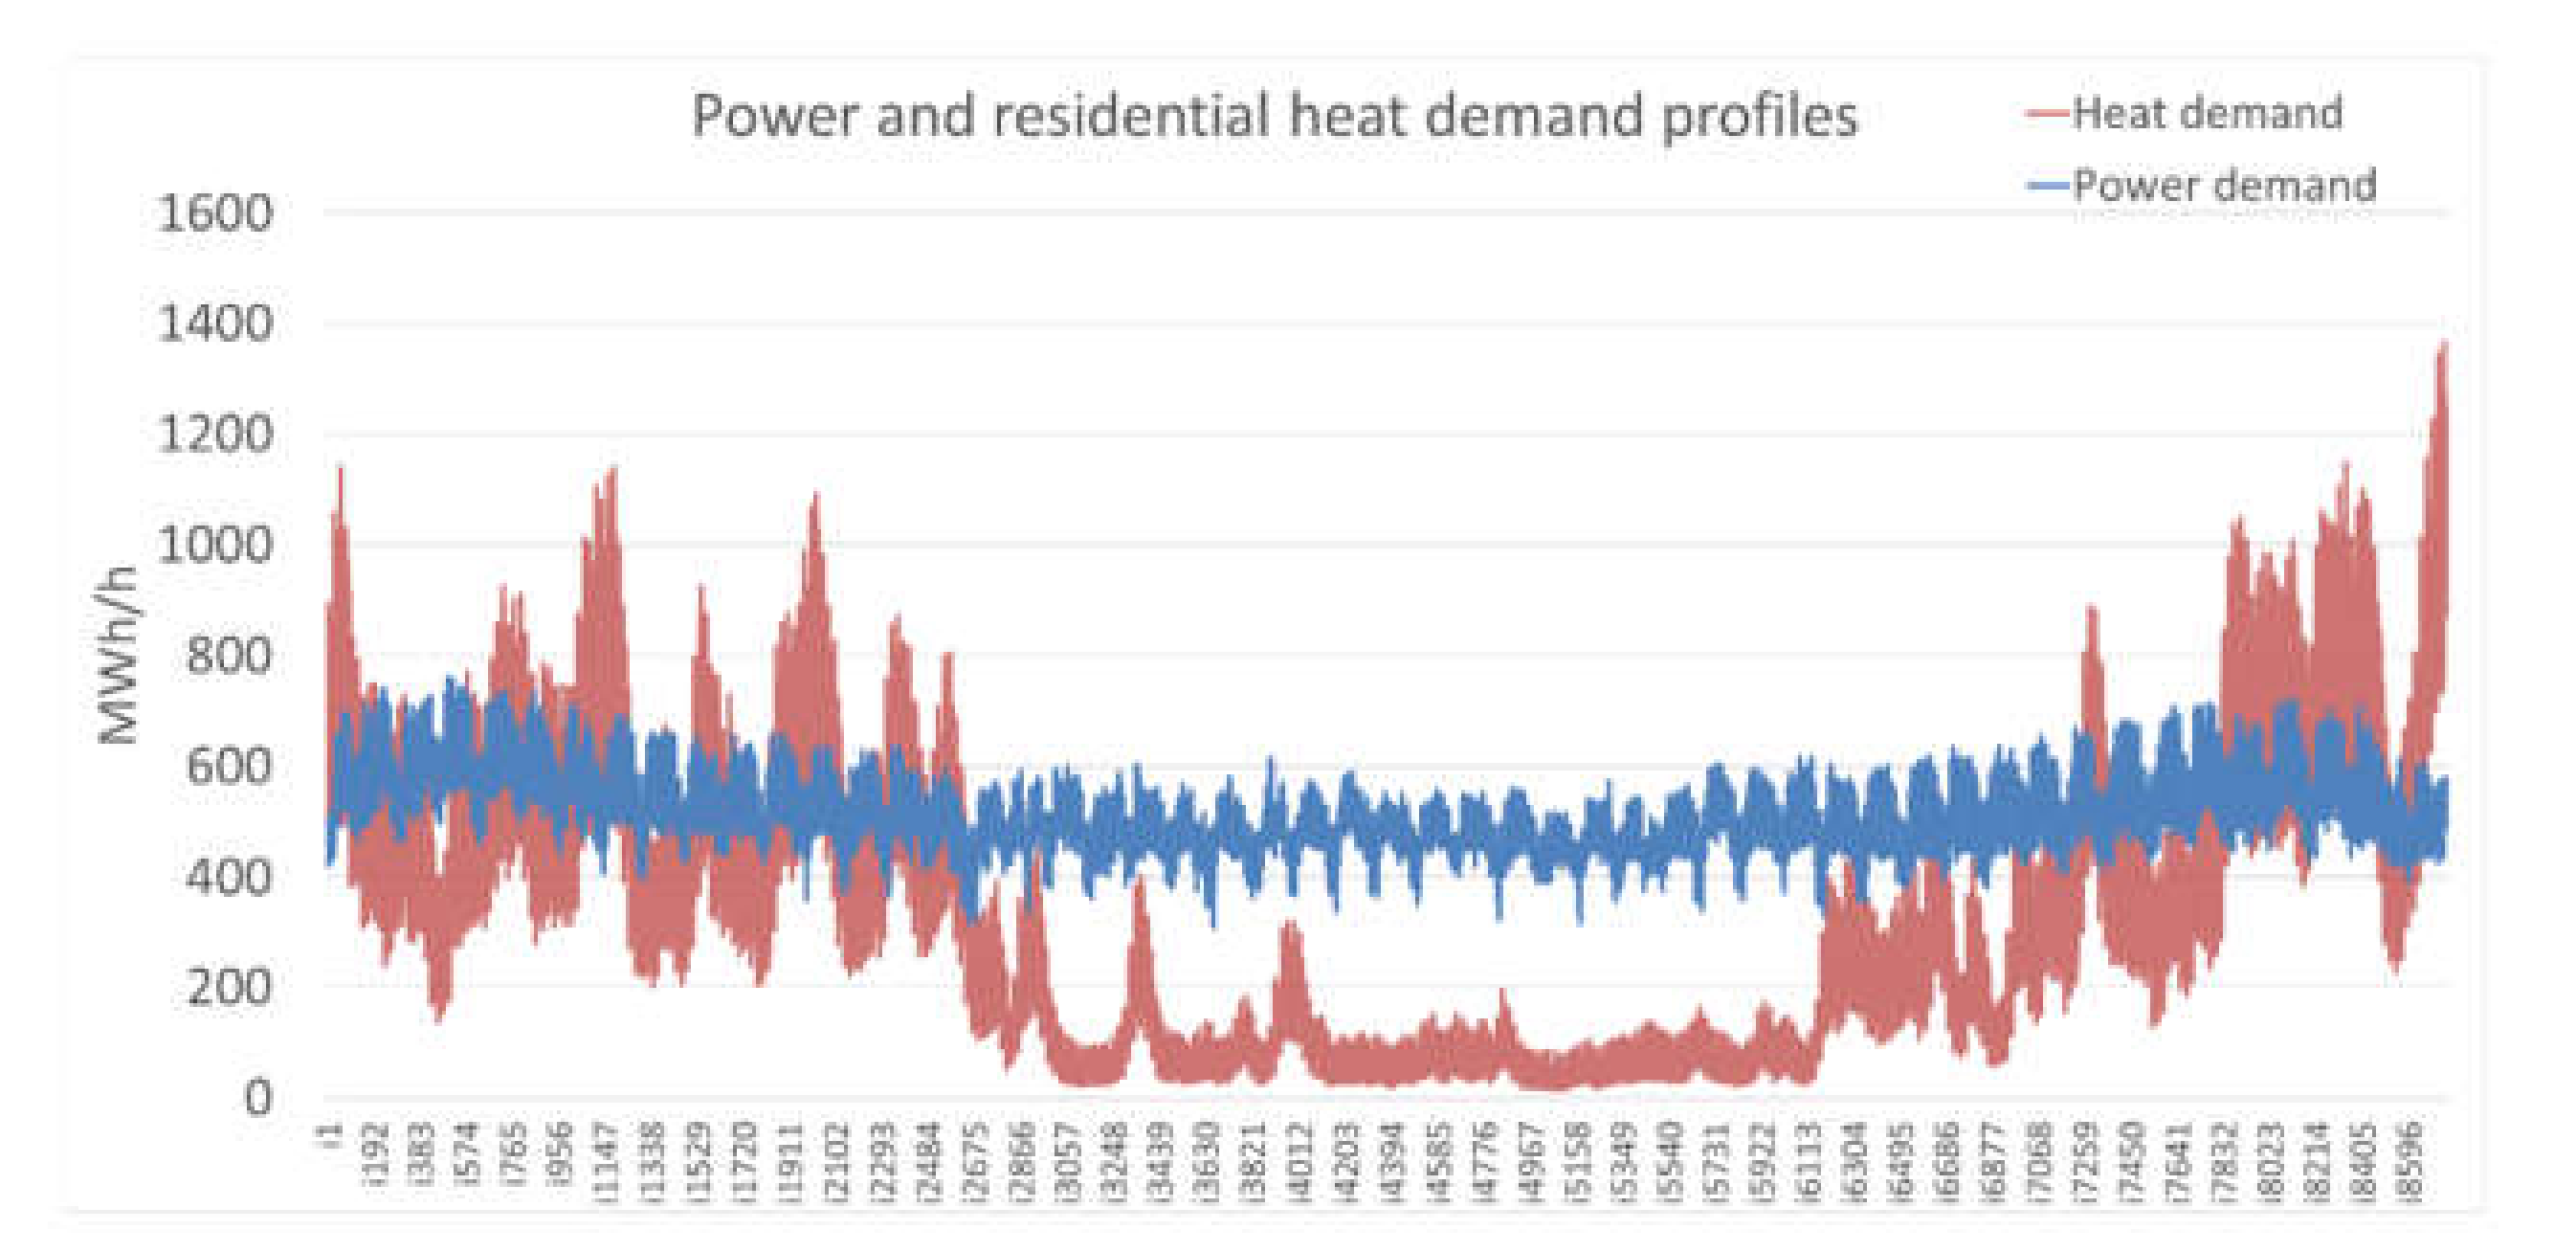
The second part consists of the application of the mathematical model to a case study for the carbon-neutral energy supply of the BCR in 2050, with a collection of the input data of the model and the definition of four scenarios to be compared to evaluate the impact of power and residential heat sector coupling in decarbonisation strategies. The data collection concerns the input time series representing the power and residential heat demands of Brussels, the Belgian normalised VRES production profiles (PV, wind onshore and wind offshore) along with the 2050 projections of the technoeconomic parameters of each technology and energy vector involved in the mathematical model. Other time series such as the annual coefficient of performance profiles of the selected electric heat pump technologies are included. Regarding the analysed scenarios of the case study, the first scenario is described as the one without any coupling between power and heat supply: power-to-heat technologies as well as cogeneration of power and heat are discarded. Moreover, individual scale technologies are considered, without distribution of heat in district heating. The second scenario enables the previously mentioned interaction between power and heat supply but the technologies are kept at an individual level. The third and fourth scenarios are similar to the first and second ones regarding the interaction between energy routes, but differ in the choices and size of the units to investigate the production of power and heat at a district level.
Finally, the resulting optimised economic performances (annualised cost and LCOE of energy supply) and technology mixes are presented and discussed for the four scenarios, giving insights on the potential for power and residential heat sector coupling in decarbonisation strategies. To ensure a replicability for the BRC, 4 additional scenarios are studied for an energy supply excluding the use of biomass technologies as well as electric boilers to fit the long-term efficiency and urban air quality objectives of the Brussels administration.


