Article

Investigation of Heat Transfer and Pressure Drop for R744 in a Horizontal Smooth Tube of R744/R404A Hybrid Cascade Refrigeration System—Part 1: Intermediate Temperature Region

Department of Refrigeration and Air-Conditioning Engineering, College of Engineering, Chonnam National University, 50, Daehak-ro, Yeosu 59626, Korea
Energies 2022, 15(6), 2285; https://doi.org/10.3390/en15062285
Submission received: 20 February 2022 / Revised: 12 March 2022 / Accepted: 15 March 2022 / Published: 21 March 2022
(This article belongs to the Special Issue Heat Transfer Characteristics and Two-Phase Flow Performance)

Abstract

:
In this study, the evaporation heat transfer characteristics of an intermediate temperature of R744 in a smooth horizontal tube, when operating as an indirect refrigeration system (IRS) among hybrid cascade refrigeration systems (HCRSs), are evaluated. Studies on the characteristics of intermediate-temperature evaporation heat transfer under the operating conditions of evaporators used in actual refrigeration systems, such as IRS, cascade refrigeration systems, and HCRS, used in supermarkets are lacking. Thus, this study provides basic data on the characteristics of evaporation heat transfer of R744 in the evaporators of refrigerators used in supermarkets. The tube employed to the evaporation experiment in this study was a horizontal smooth copper tube with a length of 8000 mm and an inner diameter of 11.46 mm. The experimental variables were measured over a wide range of mass flux of 200–500 kg/(m2·s), heat flux of 10–40 kW/m2, and saturation temperature of −40–0 °C. The main results are summarized as follows: (1) The application of Kandlikar’s correlation formula at an evaporation temperature of −20 °C in an IRS helps in a good prediction of the R744 evaporation heat transfer coefficient. (2) The pressure drop according to the heat and mass flux showed the same heat transfer coefficient trend, but the pressure drop at saturation temperature was different from the trend of heat transfer coefficient.

1. Introduction

As the damage they cause to the global environment has become known, chlorofluorocarbons(CFC)-based refrigerants have been largely abandoned worldwide, especially in developed countries. Similar to CFCs, hydrofluorocarbons(HFC)-based alternative refrigerants are greenhouse gases. In the near future, a switch to natural refrigerants seems inevitable.
To cooperate with the prevention of global warming, countries around the world are paying attention to natural refrigerants. The most effective refrigerant among them is carbon dioxide (CO2, hereinafter called R744). This motivates the development of new R744 technology.
R744 is environmentally friendly, non-toxic, non-flammable, and safe. It is cheap, has a higher heat transfer coefficient than other refrigerants, has a small suction-specific volume, and enables miniaturized refrigerator designs. Because the latent heat of evaporation is large, the circulating flow rate is small, facilitating the use of smaller piping, which has many economic advantages.
R744 refrigerants can be applied to indirect refrigeration systems (IRSs) and cascade refrigeration systems (CRSs), which are often used in supermarkets and other applications. Many studies have been conducted on IRSs and CRSs and on R744 for evaporators applied to such systems. For the basic design of an evaporator using environmentally friendly and energy-saving R744 for supermarket use, the following relevant research on the heat transfer characteristics of evaporation should be considered.
Bredesen et al. [1] performed experiments on the pressure drop and heat transfer of R744 in the temperature range of −25–−10.5 °C using an aluminum tube with a diameter of 7 mm. The experimental results at heat fluxes of 3–9 kW/m2 and mass fluxes of 200–400 kg/(m2·s) showed that htp decreased as the temperature decreased in the low vapor quality region.
Park and Hrnjak [2] conducted an experiment on the evaporation pressure drop and heat transfer at saturation temperatures of −30 °C and −15 °C, mass fluxes of 100–400 kg/(m2·s), and heat fluxes of 5–15 kW/m2.
Yun et al. [3] studied the boiling heat transfer of R744 in a smooth horizontal stainless steel tube with a length of 1400 mm, a thickness of 1 mm, and an inner diameter of 6 mm, at saturation temperatures of 5–10 °C, heat fluxes of 10–20 kW/m2, mass fluxes of 170–320 kg/(m2·s), and vapor qualities of 0.09–0.92. Jeong et al. [4] performed R744 evaporative pressure drop and heat transfer experiments in a stainless steel helical coil with an inner diameter of 4.55 mm, at saturation temperatures of 0–10 °C, mass fluxes of 150–450 kg/(m2·s), and heat fluxes of 10–30 kW/m2. Sawant et al. [5] performed experiments on R744 evaporative heat transfer in a smooth horizontal tube with an inner diameter of 8 mm in an experimental region at mass fluxes of 250–650 kg/(m2·s), heat fluxes of 24–58 kW/m2, saturation temperatures of 5–10 °C, and vapor qualities of 0.1–0.8.
Koyama et al. [6] investigated the boiling pressure drop and heat transfer in a horizontal and micro-fin tubes at mass fluxes of 362–650 kg/(m2·s), saturation temperatures of −5.5–14.3 °C, and vapor qualities of 0–1. Knudsen and Jensen [7] performed experiments on R744 boiling heat transfer in a Type 316 stainless steel tube at mass fluxes of 85–175 kg/(m2·s), heat fluxes of 8 and 13 kW/m2, saturation temperatures of −25–−10 °C, and vapor qualities of 0–0.9. Yoon et al. [8] researched the characteristics of evaporative pressure drop and heat transfer in a smooth horizontal Type 316 stainless steel tube at mass fluxes of 212–530 kg/(m2·s), heat fluxes of 12.3–18.9 kW/m2, saturation temperatures of −4–20 °C, and vapor qualities of 0–0.7.
Schael and Kind [9] conducted experiments on the flow pattern and heat transfer characteristics in a smooth horizontal nickel tube and horizontal micro-fin copper tube at mass fluxes of 75–500 kg/(m2·s), heat fluxes of 2.1–64.5 kW/m2, saturation temperatures of −10 and 5 °C, and vapor quality of 0.1–0.9. Wu et al. [10] performed experiments on the R744 evaporating heat transfer in a horizontal smooth copper tube at mass fluxes of 100–300 kg/(m2·s), heat fluxes of 2–18 kW/m2, saturation temperatures of 1–15 °C, and vapor qualities of 0.1–0.9. Hashimoto et al. [11] reported on the boiling heat transfer in a smooth horizontal copper tube at mass fluxes of 150–630 kg/(m2·s), heat fluxes of 10–40 kW/m2, and saturation temperatures of 0–10 °C.
Mastrullo et al. (2009) [12] evaluated the flow boiling heat transfer in a smooth horizontal Type 304 stainless steel tube at mass fluxes of 200–349 kg/(m2·s), saturation temperatures of −7.8–5.8 °C, heat fluxes of 10.0–20.6 kW/m2, and vapor qualities of 0.02–0.98. Mastrullo et al. (2010) [13] also compared the experimental data obtained by Mastrullo et al. (2009) [12] with the existing correlation formulas for evaporative pressure drop and heat transfer. Cheng and Xia [14] present a comprehensive review of boiling heat transfer and the two-phase flow characteristics and prediction methods of R744. They present a generalized kinetic model for two-phase pressure drop and boiling heat transfer of R744 and compare experimental data with data from other previous studies.
The coefficient of performance and exergy analysis of the R744 hybrid cascade refrigeration system (HCRS) which can use intermediate temperature (round about −25 °C) when operating as IRS and low temperature (−40 °C or less) when operating as CRS were performed. The characteristics of evaporative heat transfer during operation with CRS and IRS were studied. Among them, this study is about the heat transfer characteristics of R744 at intermediate temperatures when operating as IRS in R744 HCRS.
According to the previous studies, there are few examples of studies at about −25 °C. When the study is conducted at about −25 °C, the ranges of saturation temperature, heat and mass flux are very narrow. Therefore, it is necessary to conduct research in a wider range in this temperature range. Accordingly, in this study, the characteristics of various saturation temperatures, heat and mass fluxes at about −25 °C are investigated, and basic data for designing the R744 evaporator are provided.

2. Experimental Apparatus and Data Reduction

The HCRS discussed in this study operates in the R404A basic refrigeration cycle on the high-temperature side and circulates the R744 refrigerant as a secondary fluid on the low-temperature side by using a pump or the R744 basic refrigeration cycle. In this HCRS, operating with an IRS using R744, evaporative heat transfer occurs at an intermediate temperature (−25–0 °C). When the HCRS is operating with the R744/R404A CRS, evaporation heat transfer occurs at a lower temperature (−50–−30 °C). The aim of this research is to provide basic data for the optimal design of an R744-based evaporator for IRSs by theoretically identifying and analyzing the R744 evaporation pressure drop and heat transfer coefficient characteristics in the intermediate-temperature region.

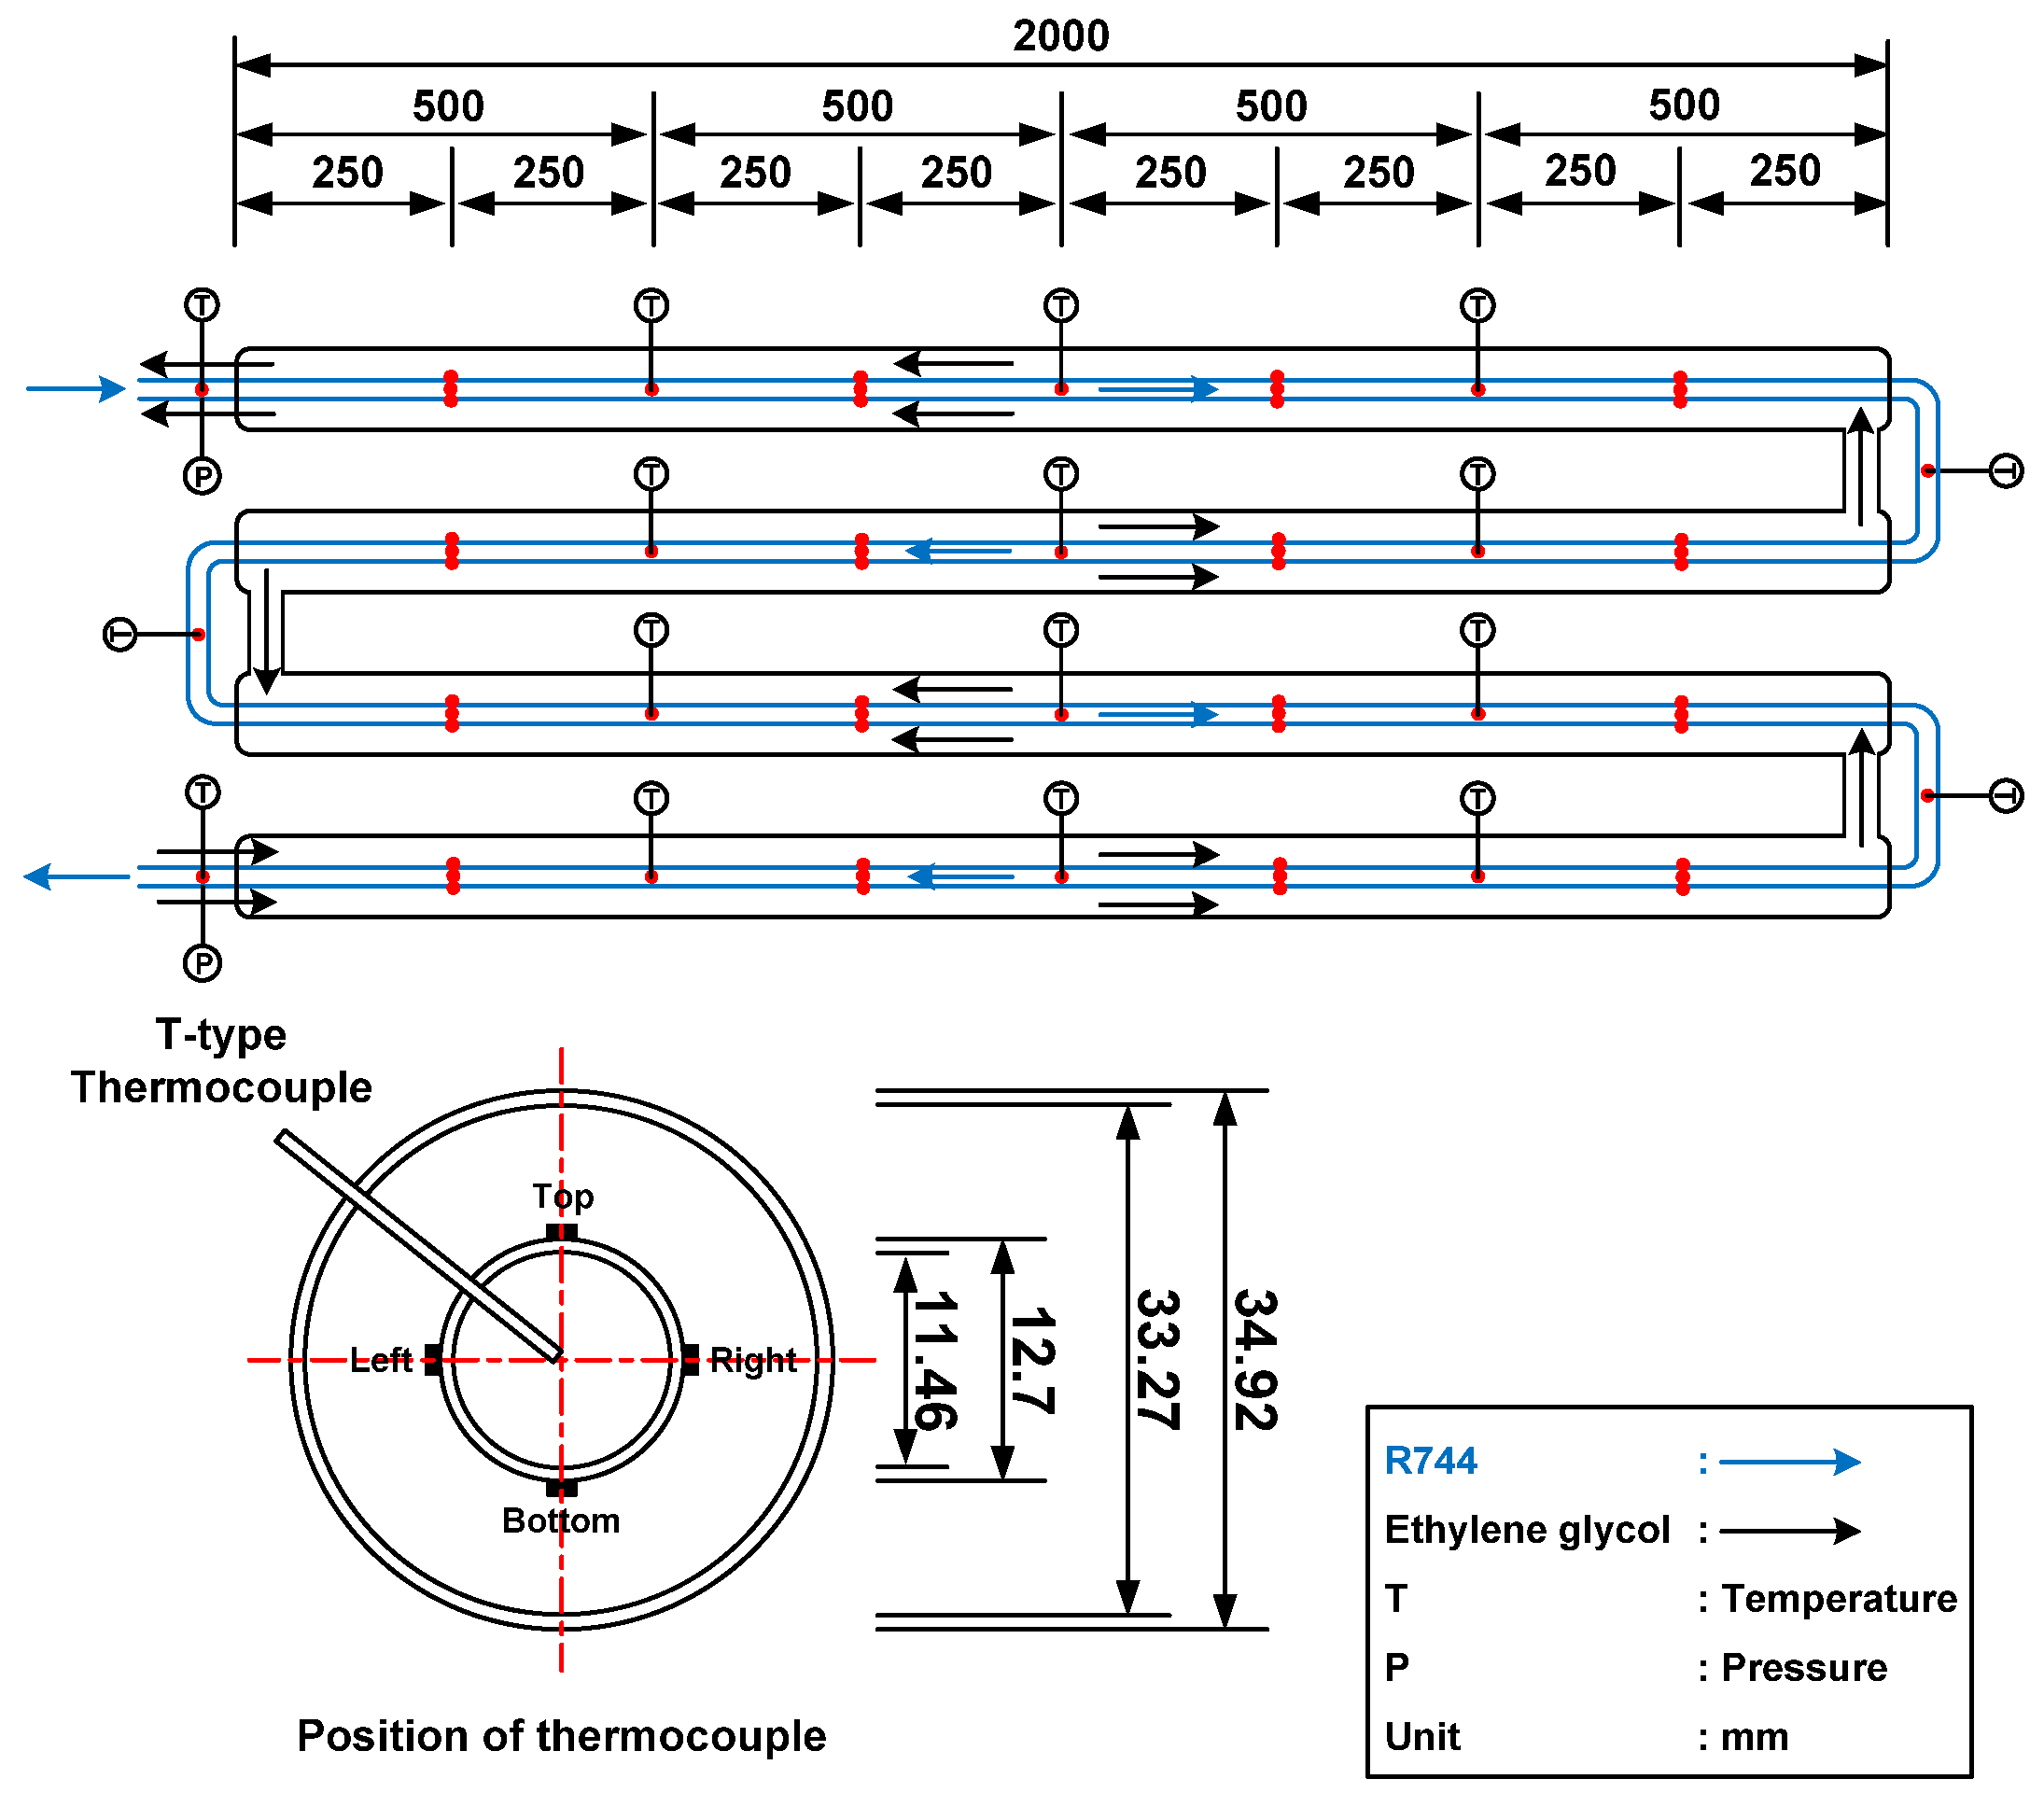
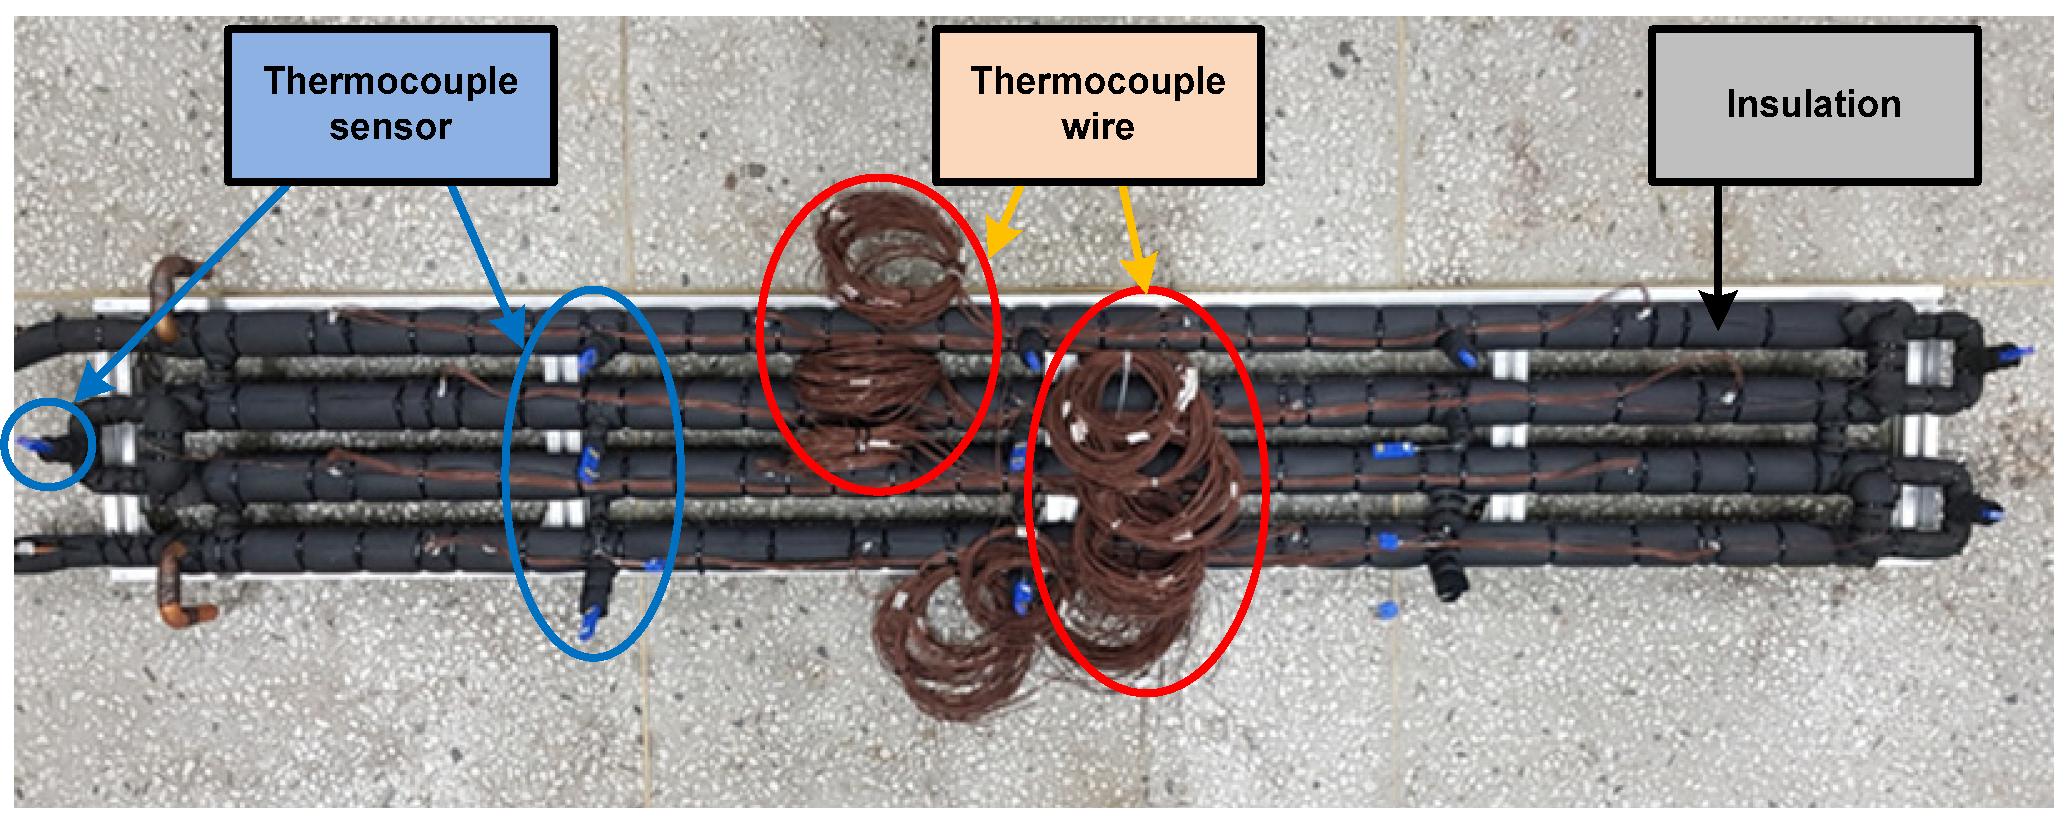
2.1. Experimental Apparatus and Method

Figure 1 shows the apparatus used to investigate the R744 evaporation pressure drop and heat transfer coefficient in the intermediate-temperature range when operating with the IRS. The experiment was conducted with an IRS employed with a magnetic gear pump at an evaporation temperature above −30 °C, which is the intermediate-temperature region to be tested. The experimental device was designed for a medium temperature (−25–0 °C) and consisted of an evaporator, a condenser, a receiver, a mass flow meter, and a gear pump. After heat exchange with the R404A refrigerant in the cascade heat exchanger, the R744 refrigerant was cooled and introduced into the receiver as a liquid. The refrigerant liquid exiting the receiver passed through the mass flow meter, flowed into the evaporator using the R744 refrigerant pump, exchanged heat with a heat source (water), became steam, entered the cascade heat exchanger (here, the role of the condenser), and circulated. Then, the heat-source water flowing into the evaporator passed through the water flow meter was maintained at a constant temperature by the thermostat, exchanged heat in the counterflow, and then circulated by the pump. Heat exchange with ambient air was prevented by insulating the evaporator and each measurement point.
Figure 2 shows a detailed schematic diagram of the evaporator used in the experiment, and Figure 3 presents an actual photograph of the evaporator. The R744 evaporator is a double-tube counterflow heat exchanger in which the refrigerant flows through the inner tube and the secondary fluid flows through the outer tube. The evaporator is manufactured using a copper tube. The specifications of the evaporator are as shown in Table 1. The internal and external diameters of the inner tube are 11.46 mm and 12.7 mm, respectively, and the internal and external diameters of the outer tube are 33.27 mm and 34.92 mm, respectively. The length is 8000 mm. To prevent leakage and ensure safety in the high-pressure R744 cycle, the inner tube is processed using a single tube to minimize connections such as welding or high-pressure fittings. The secondary fluid flows in the annular section, in the opposite direction to the refrigerant.
Figure 2 shows the direction of the fluid in the heat exchanger and the point at which the temperatures of the refrigerant and secondary fluid are measured. The temperature of the secondary fluid and refrigerant in the evaporator was measured using a T-type thermocouple. The pressure was measured by installing absolute pressure gauges at the inlet and outlet of the evaporator. The mass flow rate of the refrigerant was measured using a mass flow meter based on the Coriolis effect, and the mass flow rate of the secondary fluid was measured using a turbine-type water flow meter. Cooling water and brine (ethylene glycol; EG) were used as the secondary fluids.
The evaporation heat transfer of R744 refrigerants is closely related to the flow mode. The changes in the mass flux, heat flux, and saturation temperature affecting flow patterns have a significant influence on the evaporation heat transfer characteristics of the refrigerant. Therefore, in this study, saturation temperature, the heat and mass flux were varied. The experimental ranges are listed in Table 2. The range of parameters was selected based on the operating range when the HCRS operates as the IRS.

2.2. Data Reduction

In this study, REFPROP 8.0, a physical-property-calculation program’ made by the National Institute of Standards and Technology, was used to calculate the physical properties of R744.

2.2.1. R744 Evaporation Heat Transfer

To analyze the evaporation heat transfer characteristics, the amount of heat ( Q b ) supplied to the outer wall of the test section and the amount of heat ( Q E ) obtained by R744 flowing inside the tube must be determined by using the following formulas.
Q b = m ˙ b × c p , b × T in , b T out , b dT
Q E = m ˙ R 744 × ( i out , E , R 744 i in , E , R 744 )
Here, Q b and Q E are the heat exchange amounts [kW] due to the heat-source water (brine) of the R744 evaporator and due to the specific enthalpy difference of R744, respectively. m ˙ b is the mass flow rate [kg/s] of the heat source water on the evaporator side. T in , b and T out , b represent the inlet and outlet temperatures [K] of the heat source water, respectively, and c p , b represents the specific heat [kJ/(kg·K)] of the heat source water. In addition, i in , E , R 744 and i out , E , R 744 represent the specific enthalpy of the refrigerant vapor and liquid [kJ/kg] at the inlet and outlet of the R744 evaporator, respectively.
The heat flux (q [kW/m2]) supplied to the outer wall of the evaporator was calculated by using Equation (3).
q = Q π d i Δ z
Here, Q is either the heat transfer amount ( Q b ) calculated by using Equation (1) or the heat transfer amount ( Q E ) calculated by applying Equation (2), d i is the inner diameter of the tube, and ∆z is the length of the subsection of the test section.
The heat transfer coefficient is given by Equation (4).
h loc , E , R 744 = q T wi T E
Here, q is the heat flux, and T E is the inside-wall temperature obtained using the one-dimensional heat conductive equation for the cylinder, where heat is generated at the measured refrigerant temperature ( T wi ) . This can be obtained by applying Equation (5).
T wi = q ˙ r 0 2 4 k [ 1 ( r i r 0 ) 2 ] +   q ˙ r 0 2 2 k ln ( r i r 0 ) + T wo
Here, q ˙ (kW/m3) is the amount of heat generated per unit volume, and k is the thermal conductivity of the tube.
The average wall temperature at each point where the thermocouple was attached was used as an average of the temperatures measured at the left, right, top, and bottom of the tube, as shown in Equation (6).
T wo = T top + T left + T right + T bottom 4
The saturation temperature of the refrigerant ( T SAT ) was obtained from the measured pressure and differential pressure using REFPROP 8.0 to calculate the saturation temperature of the corresponding pressure. The saturation temperature at each point was assumed to change linearly in the longitudinal direction of the tube.
Because the vapor quality of the refrigerant ( x ) can be determined by applying Equation (7), the outlet vapor quality of the evaporator subsection ( x out , loc ) is given by Equation (8).
x = Δ i loc i fg
x out , loc = x in π d i m ˙ R 744 × i fg z in z out q   dz
Here, Δ i loc is the refrigerant enthalpy difference at the inlet and outlet of the subsection, i fg is the latent heat of the refrigerant, d i is the inner diameter of the tube, m ˙ R 744 is the R744 refrigerant flow rate, and z in and z out represent the inlet and outlet of the subsection, respectively. As q is the heat flux in the evaporator, π d i z in z out q   dz is the accumulated heat quantity of the subsection from the inlet of the heat exchanger. The average heat transfer coefficient of the evaporator ( h avg , E , R 744 ) can be calculated by using Equation (9) by combining the aforementioned equations.
h avg , E , R 744 = 1 x out x in x in x out h loc , E , R 744   dx = i = 1 n h loc , E , R 744 n
Here, x in and x out are the vapor quality at the inlet and outlet of the evaporator, respectively, h loc , E , R 744 is the local heat transfer coefficient of the subsection, and n is the number of subsections.

2.2.2. R744 Evaporation Pressure Drop

Equation (10) is the sum of three items: pressure drop owing to momentum ( Δ P mom ), pressure drop owing to friction ( Δ P frict ), and pressure drop owing to gravity ( Δ P static ) [15].
Δ P tot = Δ P mom + Δ P frict + Δ P static
Here, Δ P static is zero because the pressure drop of the two-phase flow through the horizontal tube ignores the gravitational component, and Equation (10) is simplified as Equation (11).
Δ P tot = Δ P mom + Δ P frict
Pressure drop correlation formulas can be analyzed by assuming homogeneous and separate flows. The homogeneous flow model presumes that the gas and liquid velocities are the same at thermodynamical equilibrium. In most cases, this assumption is difficult to apply to the flow model, but there is good agreement in predicting the ideal pressure drop. Therefore, the homogeneous flow model treats the gas and liquid phase flows as a single phase, and the momentum pressure drop can be expressed by Equation (12) using the appropriate average physical properties [15].
Δ P mom = G 2 { [ ( 1 x ) 2 ρ l ( 1 ε ) + x 2 ρ v ε ] out [ ( 1 x ) 2 ρ l ( 1 ε ) + x 2 ρ v ε ] in }
Here, G is the total mass flow rate of the liquid and gas, and x is the vapor quality. In this study, the Rouhani-Axelsson drift flux model [16] was used for the horizontal tube, and it can accurately predict the void fraction ( ε ). The reason is that the Rouhani-Axelsson porosity model considers the effects of concentration distribution and relative velocity and includes important effects of mass flow rate, viscosity, and surface tension.
ε = x ρ v [ ( 1 + 0.12 ( 1 x ) ) ( x ρ v + 1 x ρ l ) + 1.18 ( 1 x ) [ g σ ( ρ l ρ v ) ] 0.25 G 2 ρ l 0.5 ] 1

2.3. Uncertainties

Because the experimental results used for engineering analysis or design cannot be considered completely accurate, the uncertainty of the experimental results were predicted in this study. Table 3 summarizes the results with reference to the equations suggested by Kline and McClintock [17] and Moffat [18].

3. Experimental Results

For an HCRS operating in the IRS mode, in which R744 is circulated by using a liquid pump, an experiment was conducted to examine the evaporation heat transfer in the R744 evaporator under the cycle’s operating conditions.

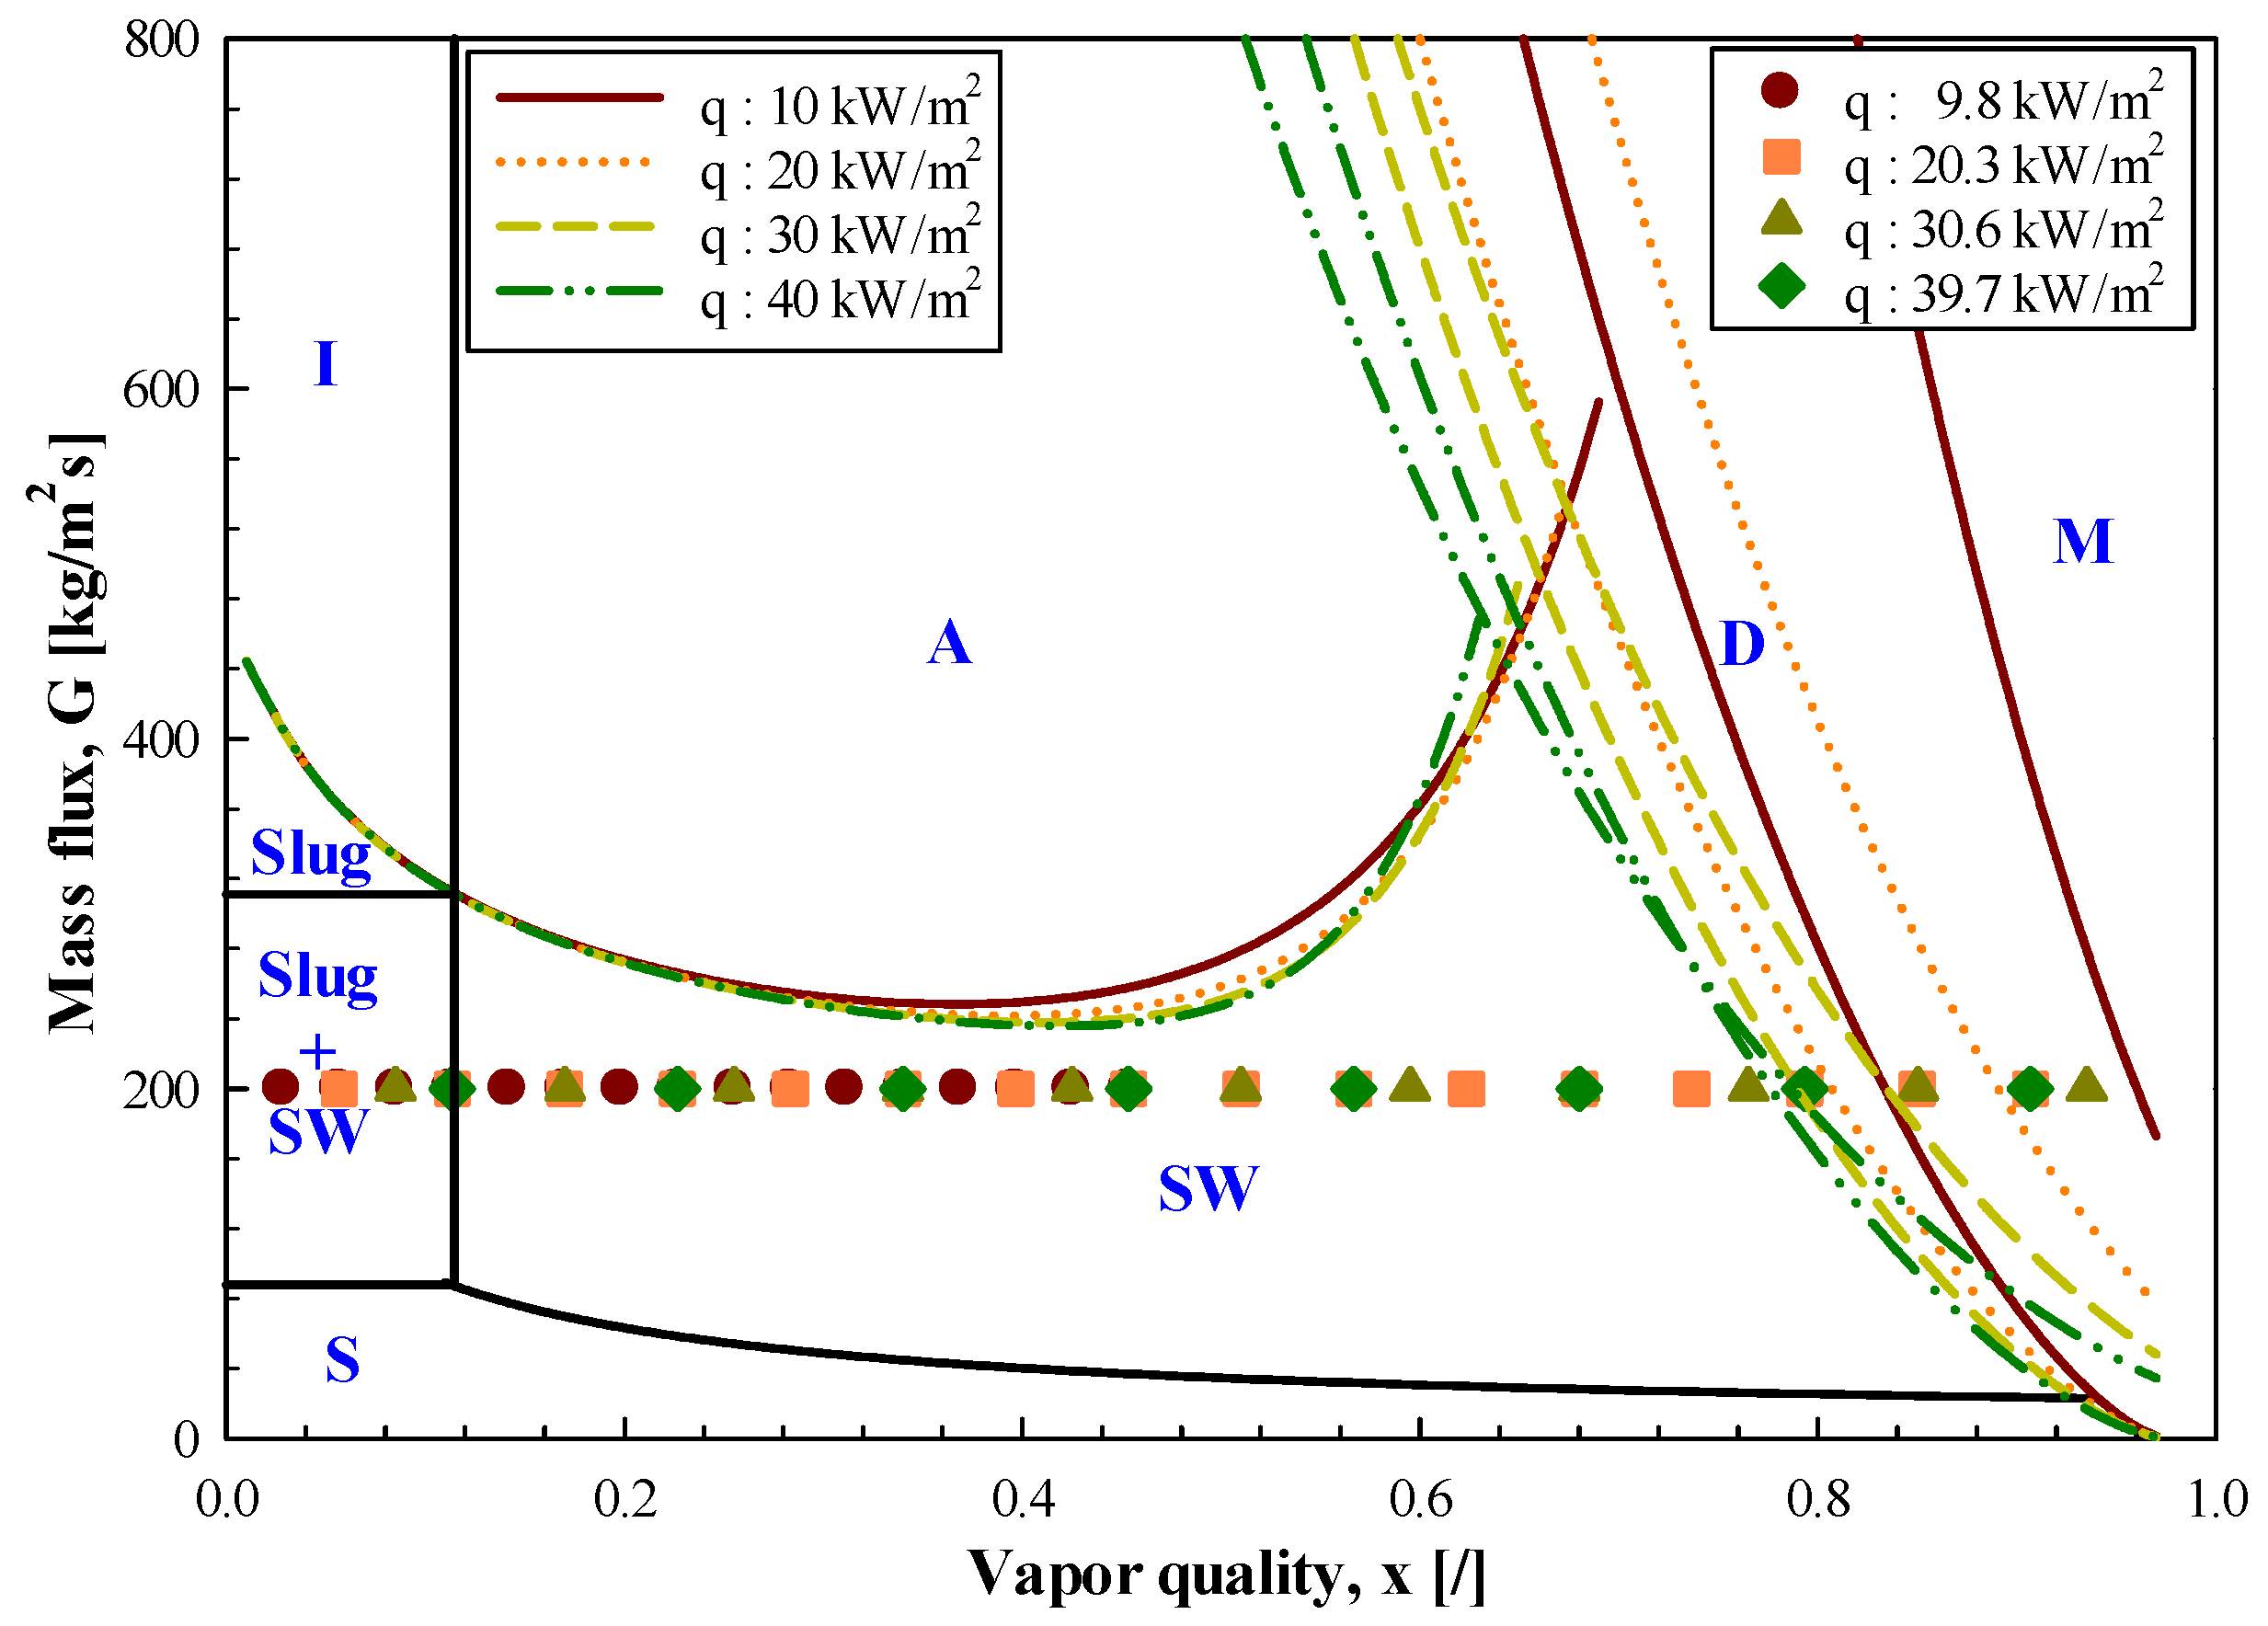
3.1. Flow Pattern Map of R744

Figure 4, Figure 5 and Figure 6 show a flow pattern map for R744 under the given conditions. They are illustrated with reference to the studies conducted by Cheng et al. (2006) [19], Cheng et al. (2008a) [15], and Cheng et al. (2008b) [20], which describe the flow pattern map for R744.

3.1.1. Influence of the Mass Flux

Figure 4 shows a flow pattern map when the mass flux increases from 200 to 500 kg/(m2·s). For a mass flux of 200 kg/(m2·s), the stratified wave flow and slug flow are mixed; the transition to an annular flow does not occur due to the insufficient refrigerant flow rate. The dry-out point is formed at low vapor quality as the mass flux increases. This is because the shear stress between the liquid film and the gas phase increases as the mass flux increases, and the degree of droplet detachment increases. However, droplet detachment becomes active and the wall surface evaporates rapidly, forming dry-out points at low vapor quality.

3.1.2. Influence of the Saturation Temperature

Figure 5 is a flow pattern map according to the change in the saturation temperature. As can be seen from the figure, a considerable change occurs in the flow pattern map. This is because the physical properties of the refrigerant change considerably depending on the saturation temperature. As the saturation temperature increases, the annular flow section becomes longer, so that the dry-out point is formed in the high vapor quality range. The transition to the annular flow occurs from a vapor quality of 0.0818 to 0.1563, depending on the mass flux, and forced convective boiling occurs more actively than nucleate boiling.

3.1.3. Influence of the Heat Flux

Figure 6 shows a flow pattern map according to the change in the heat flux. When the heat flux increases, bubble generation is activated, and the section of the annular flow is reduced. At the same time, a dry-out point is formed in the low vapor quality.

3.2. Evaporation Heat Transfer of R744

Forced boiling in a horizontal tube is considerably affected by various factors, such as the mass and heat flux and velocity ratio, of the gas and liquid. Owing to these factors, the forced flow in the tube is largely evaporated by nucleate boiling due to the generation and separation of bubbles and convective boiling caused by the liquid film and vapor existing at the gas–liquid interface. Nucleate boiling, which is affected by the heat flux, has flow forms such as a bubble flow or a slug flow and occurs in a low vapor quality. Forced convective boiling, which is affected by the mass flux, has flow types such as annular flow and mist flow (or droplet flow) and occurs in high vapor quality. As the vapor quality in the boiling tube increases, nucleate boiling is gradually suppressed and the heat transfer coefficient temporarily decreases. When forced convective boiling becomes dominant, the heat transfer coefficient and vapor quality increase. Therefore, when the evaporation heat transfer characteristics are analyzed, the local evaporation heat transfer characteristics of R744 can be determined by examining the effects of the saturation temperature, vapor quality, mass, and heat flux.

3.2.1. Influence of the Mass Flux

Figure 7 shows the local evaporation heat transfer coefficient when the mass flux increases by intervals of approximately 100 kg/(m2·s), from 201.3 kg/(m2·s) to 499.2 kg/(m2·s), under constant conditions. As shown in the figure, the local evaporation heat transfer coefficient increases when the mass flux increases by intervals of approximately 100 kg/(m2·s), from 201.3 kg/(m2·s) to 499.2 kg/(m2·s). Before high vapor quality (x > 0.6851–0.8071), the heat transfer coefficient increases by 0.8–5.1% when the mass flux increases. The reason for this is that the shear stress between the liquid film and the gas flow increases when the mass flux increases, and the droplets are actively detached. As shown in Table 4, the Reynolds number increases as the mass flux increases, indicating that the effect of forced convective boiling is dominant. In addition, the heat transfer coefficient decreases at high vapor quality (x > 0.8071) when the mass flux is 201.3 kg/(m2·s), which is believed to be due to dry-out occurring in this region. These results are consistent with those of Han et al. [21] and Yun et al. [22].
When the mass flux increases, the heat transfer coefficient increases more clearly at the moderate vapor quality than at the low vapor quality range. The reason that the change in the heat transfer coefficient is smaller in the low vapor quality range is that nucleate boiling has a more dominant effect than forced convective boiling in this region [23,24,25,26,27]. The increase at the heat transfer coefficient is conspicuous at the moderate vapor quality range when the vapor quality and mass flux increase, and as the Reynolds number and gas velocity of the refrigerant flowing in the test section increase, the annular flow and forced convective evaporation become more active [28].
The flow pattern depicted in Figure 4 confirms that the flow corresponding to the low vapor quality range is an intermittent flow, and the section of forced convective boiling is the dominant flow in the tube. This is because it is difficult to form nucleate boiling when the mass flux increases, and forced convective boiling is considerably affected by the increase in the mass flux [29]. In this experiment, when the heat flux is high and the mass flux is 298.9, 399.3, or 499.2 kg/(m2·s), dry-out cannot be confirmed, because the heat transfer is completed before dry-out occurs. Therefore, how the timing of dry-out was affected by the increase in the mass flux could not be determined.

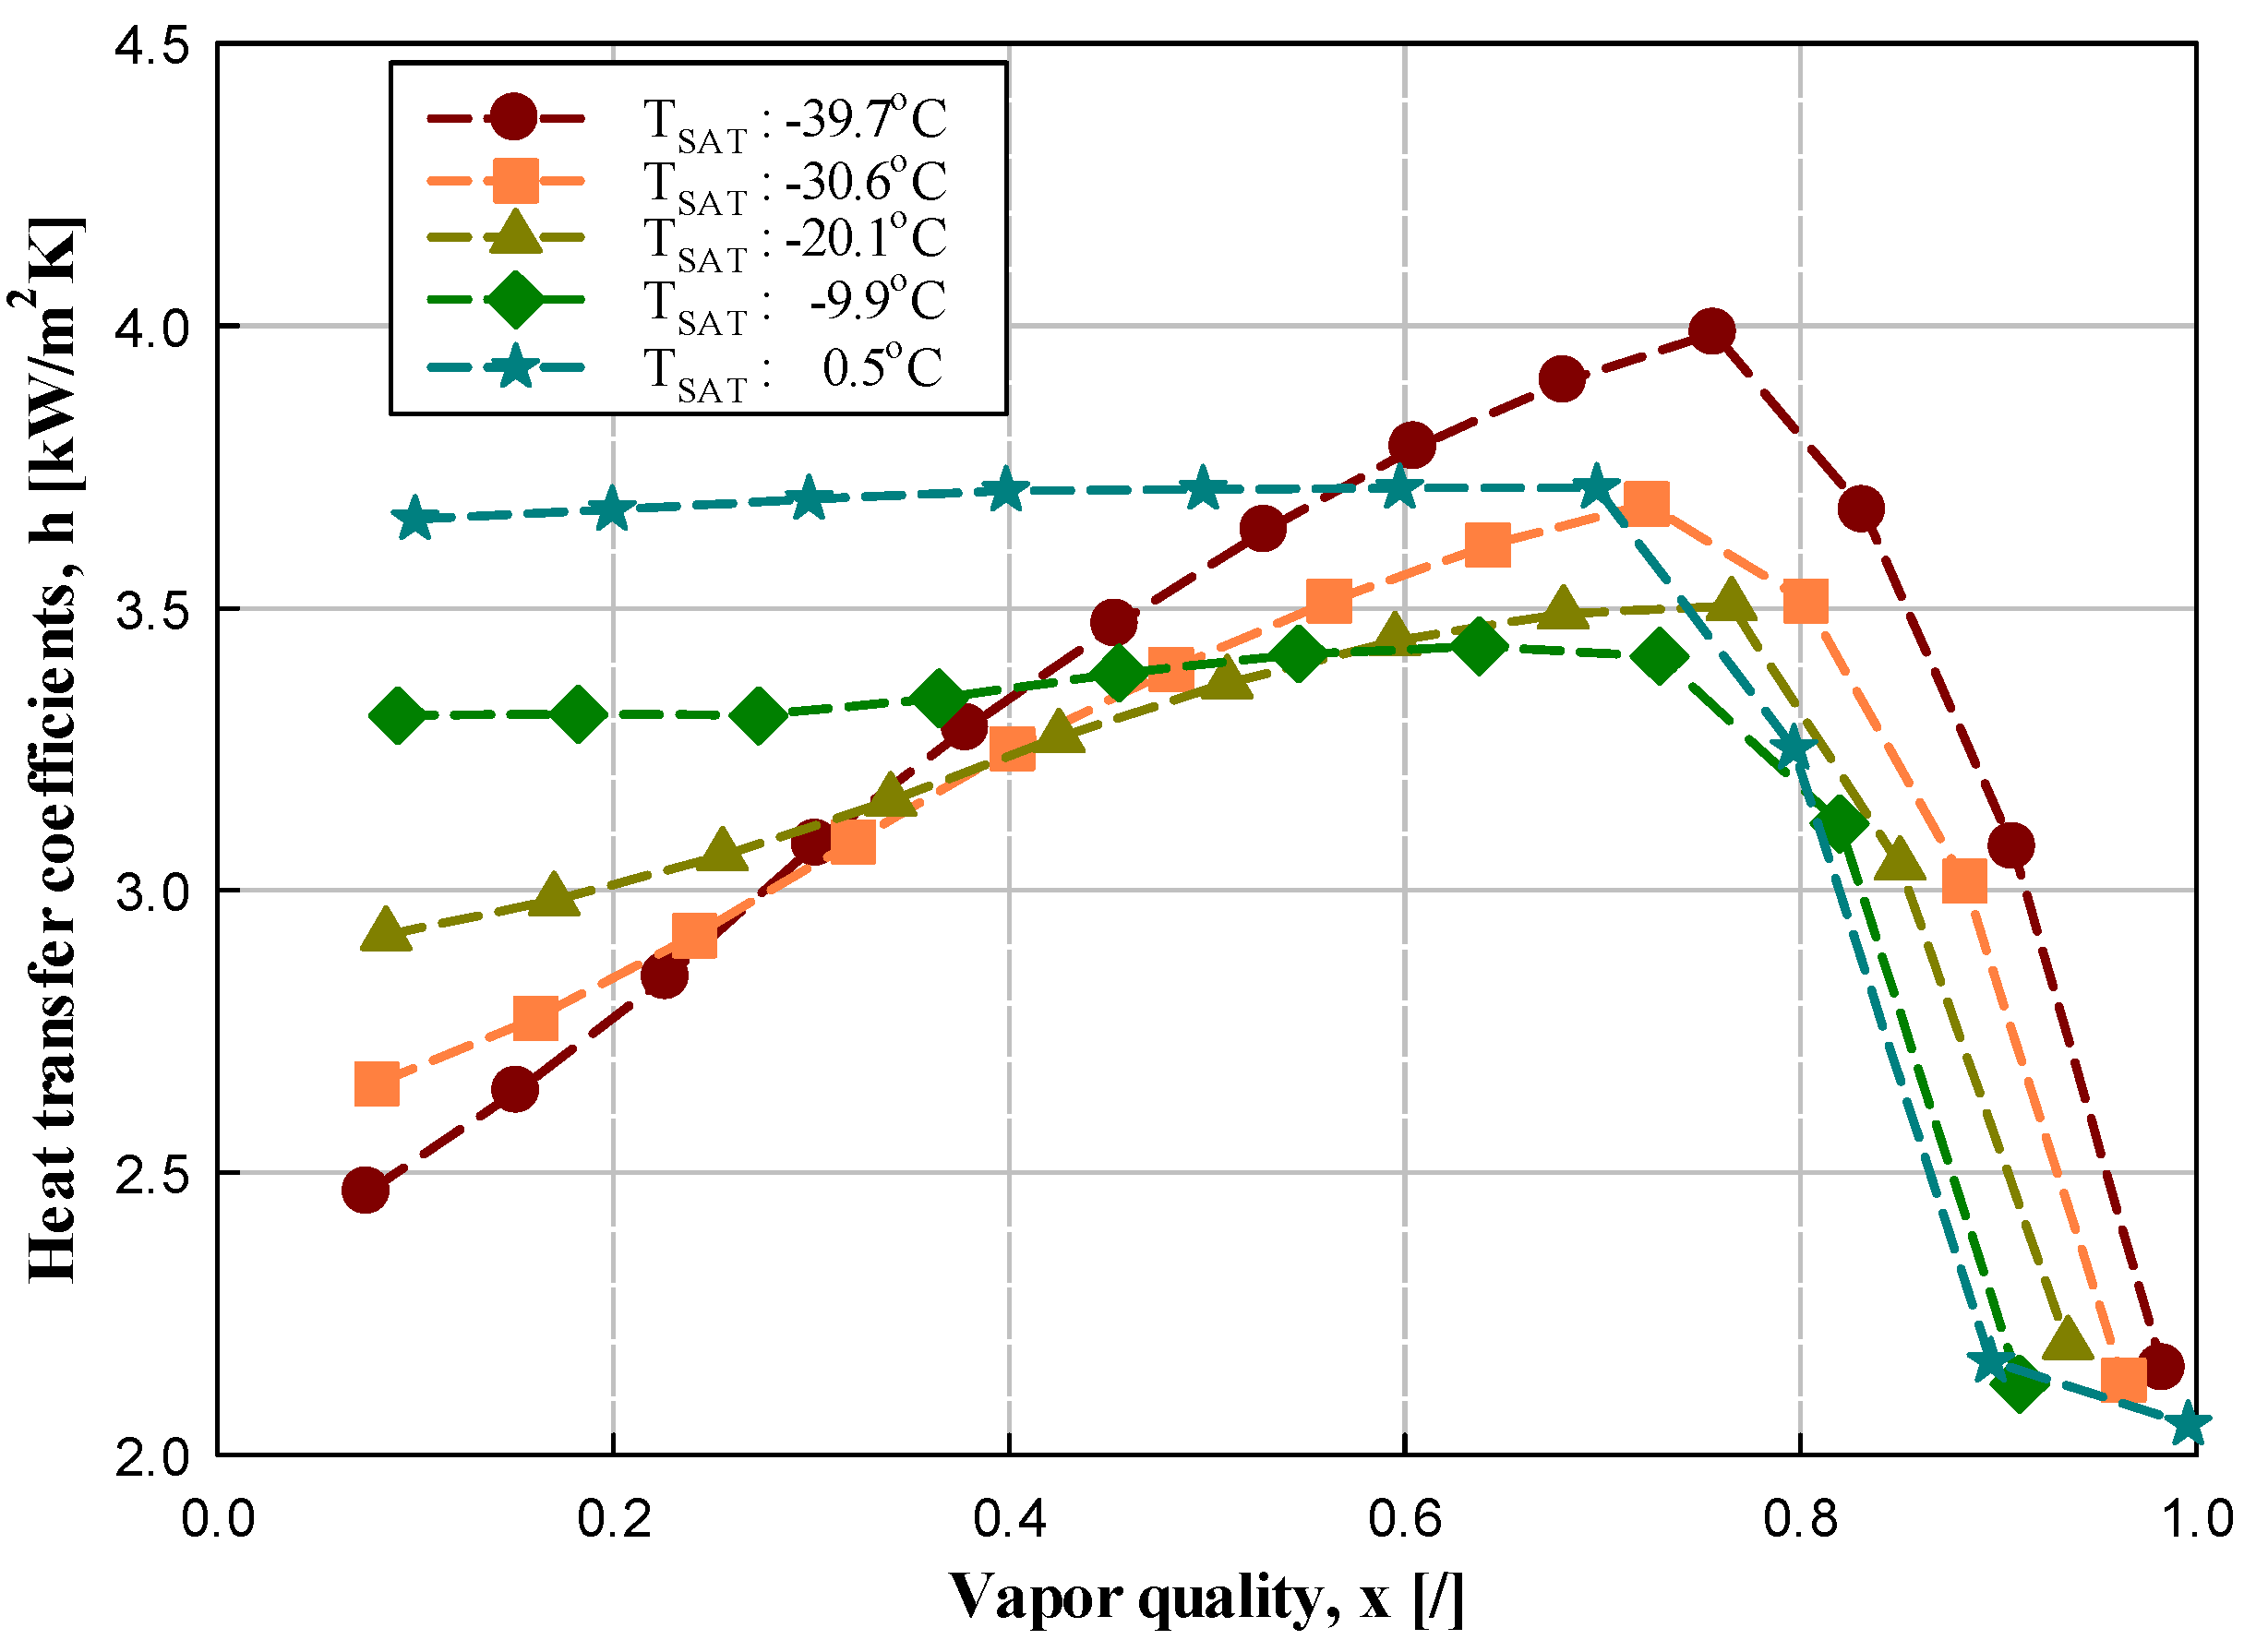
3.2.2. Influence of the Saturation Temperature

Figure 8 shows the local evaporation heat transfer coefficient when the saturation temperature of the refrigerant is increased by intervals of approximately 10 °C, from −40.4 to 0.5 °C, under constant conditions. As shown in the figure, as the saturation temperature of the refrigerant increases, the local evaporation heat transfer coefficient decreases according to the increase in the vapor quality. However, when the saturation temperature is 0.5 °C, limited change is caused by the increased vapor quality.
This is because as the saturation temperature increases, as shown in Table 5, the thermal conductivity of the refrigerant liquid phase decreases. This increases the thermal resistance of the refrigerant liquid film and consequently decreases the evaporation heat transfer coefficient of the refrigerant. Furthermore, when the saturation temperature increases, the density ratio ( ρ l / ρ v ) decreases; thus, the velocity ratio ( v v / v l ) between the gas and liquid phases decreases when the saturation temperature increases, decreasing the heat transfer coefficient [29,30]. The influence of the Prandtl number, Pr, is also a factor. When the saturation temperature increases, the thermal conductivity and Pr decrease. Thus, the heat transfer coefficient decreases.
Moreover, the higher the saturation temperature, the greater is the heat transfer coefficient in the low vapor quality region (x < 0.32). However, this trend reverses as the vapor quality increases. A local maximum value of the heat transfer coefficient curve is observed where the flow domain transitions from combined slug flow and stratified wave flow to pure stratified wave flow. The overall peak value of the heat transfer coefficient generally increases as the saturation temperature decreases. Since reducing the temperature increases the surface tension, the heat transfer coefficient increases until the dry-out begins.
The reason that the heat transfer coefficient increases when the high heat flux (q = 20 kW/m2) is applied and the saturation temperature is gradually increased, as shown in Table 6, is because the surface tension decreases and nucleate boiling increases as the saturation temperature increases. This was also confirmed by Yun et al. [27] and Choi et al. [31]. The surface tension decreases by 20.7–41.6% as the saturation temperature increases by intervals of approximately 10 °C, from −40.4 to 0.5 °C.
As the surface tension decreases, the critical radius of nucleate boiling decreases. The more nucleate boiling occurs in the tube wall, the more intensely it is activated. Nucleate boiling is usually dominant at low vapor quality.
However, in the moderate vapor quality region (0.32 < x < 0.7678–0.7937), the inversion of the heat transfer coefficient occurs. This is because nucleate boiling is suppressed and forced convective heat transfer is dominant owing to the high vapor flow rate at the low saturation temperature.
According to the values calculated by Cheng et al. (2006) [19], Cheng et al. (2008a) [15], Cheng et al. (2008b) [20], and Thome et al. [32], the onset of dry-out (vapor quality of 0.7678–0.7937 according to the evaporation temperature) occurs at a slightly lower dryness owing to a decreasing surface tension as the evaporation temperature increases by intervals of approximately 10 °C, from −40.4 to 0.5 °C. The heat transfer coefficient decreases at high vapor quality (x > 0.7896), which is believed to be due to dry-out occurring in this region, as in [22]. These results were confirmed to be similar to those of Wu et al. [33].

3.2.3. Influence of the Heat Flux

Figure 9 shows the local evaporation heat transfer coefficient as the heat flux of the refrigerant increases by intervals of approximately 10 kW/m2, from 9.8 to 39.7 kW/m2, under constant conditions. As depicted in the figure, the local evaporation heat transfer coefficient increases when the heat flux of the refrigerant increases. In the low vapor quality (x < 0.3) region, the heat transfer coefficient increases by 1.1–4.2% when the heat flux increases by the previously stated intervals, whereas at medium vapor quality (0.3 < x < 0.7762–0.8337), the heat transfer coefficient increases by 0.7–3.8%. This is because the specific volume ratio ( v v / v l ) of the gas phase to the liquid phase of R744 refrigerant at −20 °C is large (Table 6), and thus, the difference in the velocity between the liquid and gas phase also becomes large. Hence, a transition to an annular flow is easy in a thin liquid film, with relatively high surface tension that may be due to the nuclear generation becoming difficult [34].
When the heat flux increases, the heat transfer coefficient is further affected in the low vapor quality region than in the moderate vapor quality region. This is because at low vapor quality, nucleate boiling due to the influence of heat flux has a dominant influence on the heat transfer coefficient, but in the moderate vapor quality region, nucleate boiling is suppressed and forced convective boiling dominates [28,35]. As in other studies, the difference in the heat transfer coefficient is small even when the heat flux increases in the moderate vapor quality range [28,35]. Moreover, the heat transfer coefficient decreases in the high vapor quality region (x > 0.7762–0.8337), which is considered to be because dry-out occurs in this region, as in Yun et al. [22]. When the heat flux increases, as shown in Figure 6, dry-out occurs at lower vapor quality [26,31]. These results were confirmed to be the same as those of Wu et al. [33].

3.2.4. Comparison between Experimental Data and Existing Correlation Formulas

Proposing an appropriate correlation is very important to accurately forecast the heat transfer coefficient of R744 in the evaporator. There are many correlation formulas for forecasting the local heat transfer coefficient in a horizontal evaporator. The prediction equations proposed under conditions most similar to those in this experiment are by Chen [36], Gungor and Winterton [37], Kandlikar [38], Kenning-Cooper [39], and Yoon et al. [8]. In this study, the applicability of these correlation formulas was examined by comparing them with experimental data.
Table 7 presents the evaporation heat transfer correlations obtained by several researchers. Most of these analyzed the effect of the heat transfer coefficient due to nucleation and the forced convective heat transfer coefficient for the liquid film. The correlation formula of Chen [36], given in Equation (14), is the most representative and basic correlation formula for evaporative heat transfer.
There are qualitative and quantitative methods for comparing the heat transfer coefficient ( h e x p ) measured in the evaporator with the heat transfer coefficient ( h c a l ) forecasted by employing the correlation formula. Quantitatively, the average deviation (average deviation, σ a v g ) expressed by Equation (20) and the absolute mean deviation (absolute mean deviation, σ a b s ) expressed by Equation (21) are used. These are as follows.
σ avg = 1 N [ i = 1 N ( h cal , i h exp , i h exp , i ) ] × 100
σ abs = 1 N [ i = 1 N | h cal , i h exp , i h exp , i | ] × 100
Here, N is the number of measured data, h exp is the experimentally measured local heat transfer coefficient, and h cal is the local heat transfer coefficient calculated by employing the correlation formula.
Figure 10 presents a comparison of the experimental heat transfer coefficient of R744 in a tube with an inner diameter of 11.46 mm with those obtained by using other correlation formulas depending on the vapor quality for each given condition.
In the correlation formula of Kandlikar [38], Ffl value is substituted with 1. This is because Kandlikar [40] and Kandlikar and Balasubramanian [41] state that Ffl = 1 for all other refrigerants in stainless steel tube. Moreover, in this paper, the copper tube was used, but it was analyzed assuming stainless steel tube.
As in Figure 10a, the correlation formula of Kandlikar [38] yields the best prediction with an absolute mean deviation rate of 7.78%, and the correlation formula of Gungor-Winterton [37] has the highest deviation rate with an absolute mean deviation rate of 39.20%. In Figure 10b, the correlation formula of Chen [36] shows good agreement with an absolute mean deviation rate of 7.71%, and the correlation formula of Gungor-Winterton [37] shows the greatest difference with an absolute mean deviation rate of 51.31%. And, in Figure 10c, the correlation formula of Kenning-Cooper [39] yields the best prediction with an absolute mean deviation rate of 22.45%, and the correlation formula of Yoon et al. [8] has the highest deviation rate with an absolute mean deviation rate of 45.49%.
Table 8 shows the average deviation and absolute mean deviation yielded by the correlation formulas for all data prior to critical heat flux (CHF). As in Table 8, the correlation formula of Kandilikar [38] yields the best prediction with an absolute mean deviation rate of 10.24%, and the correlation formula of Gungor-Winterton [37] has the highest deviation rate with an absolute mean deviation rate of 40.01%.
Kandlikar [38]’s correlation formula suggests the suppression variable, S, and reflects the fact that when the forced convective effect increases, nucleate boiling is strongly suppressed owing to the decrease in the thickness of the thermal boundary layer. Therefore, it shows a low deviation rate in the experimental data while forced convective boiling is active.
The correlation formulas of Gungor-Winterton [37], Kenning-Cooper [39], and Yoon et al. [8] yield a large deviation rate. The correlation formula of Gungor-Winterton [37] introduces a suppression coefficient, indicating a decrease in nucleate boiling with an increasing vapor quality, and an improvement coefficient to consider the increase in the effect of convective boiling. Gungor and Winterton propose an equation to reduce the deviation from the experimental data while maintaining the basic form of the existing heat transfer coefficient equation. However, because a constant based on experimental data is introduced, it has the disadvantage of showing a high deviation rate when outside the application range.
The deviation rate was determined to be large because the heat transfer coefficient correlation formula of Kenning and Cooper [39] was not based on the correlation formula of Chen [36] and considered only the liquid single-phase.
Figure 11 displays a graph comparing the experimental and predicted values by using the existing correlation formulas. As can be seen from the figure, the correlation formula of Gungor-Winterton [37] is overestimated compared with the experimental value. The correlation formula of Yoon et al. [8] is similar to the experimental value, but the absolute mean deviation is somewhat high; thus, it is not appropriate.

3.3. Evaporation Pressure Drop of R744

In refrigeration and air-conditioning systems, the data on pressure drop are essential for designing an R744-based evaporator. Identifying the characteristics of the two-phase frictional pressure drop in the tube can be a source or valuable reference for predicting the pressure drop when designing an R744 evaporator. Therefore, many researchers have conducted studies on this subject, and several empirical formulas have been proposed.

3.3.1. Influence of the Mass Flux

Figure 12 shows the friction pressure drop based on the change in the mass flux. The friction pressure drop increases when the mass flux increases. When the mass flux increases by intervals of approximately 100 kg/(m2·s), from 201.3 to 499.2 kg/(m2·s), the average frictional pressure drop values increases by 18.2–38%, becoming 0.679, 1.095, 1.456, and 1.78 kPa/m. To explain this, Bredesen et al. [42] suggested that as the mass flux increases, the frictional shear stress on the wall surface increases.

3.3.2. Influence of the Saturation Temperature

Figure 13 shows the friction pressure drop when the saturation temperature of the refrigerant increases. Under constant heat and mass flux conditions, the friction pressure drop decreases when the saturation temperature increases. As the saturation temperature is increased by intervals of approximately 10 °C, from −40.4 to 0.5 °C, the average frictional pressure drop values are found to be 1.148, 0.842, 0.627, 0.476, and 0.364 kPa/m, decreasing by 23.5–26.7%. This is because when the saturation temperature of the refrigerant increases, the viscosity coefficient ratio ( μ l / μ v ) and density ratio ( ρ l / ρ v ) of R744 decrease, as shown in Table 9 and Table 10. The pressure drop according to the mass and heat flux showed the same trend with heat transfer coefficient, but the trend of pressure drop with respect to the saturation temperature was dissimilar to the heat transfer coefficient. That is, the heat transfer coefficient was larger in low vapor quality and smaller in high vapor quality as the saturation temperature increased. Therefore, there was a section where the heat transfer coefficient was reversed. On the other hand, in the pressure drop, the lower the saturation temperature, the greater the pressure drop as it changed from low vapor quality to high vapor quality without a special reversal section.
In addition, the viscosity coefficient and density of the liquid decrease when the saturation temperature increases, but the viscosity coefficient and density of the gas increase. This is because the flow velocity of the liquid phase decreases while the refrigerant evaporates, but the flow velocity of the gas phase increases, promoting turbulence and reducing the pressure drop, which further decreases as the saturation temperature increases. Accordingly, the acceleration pressure and frictional pressure of the refrigerant in the tube are reduced, and thus, the pressure drop is further reduced [28]. In addition, the pressure drop in the high vapor quality range (x > 0.7678–0.7937) where dry-out occurs indicates that the pressure drop decreases rapidly. This is because the pressure drop decreases due to dry-out. In addition, when the mass flux shown in Figure 12 is 201.3 kg/(m2·s), the same tendency is observed in the high vapor quality region (x > 0.8071), and the decrease is sharp because of the same reason.

3.3.3. Influence of the Heat Flux

Figure 14 shows the frictional pressure drop as the heat flux of the refrigerant is increased by intervals of approximately 10 kW/m2, from 9.8 to 39.7 kW/m2, under constant conditions. When the heat flux increases in the low vapor quality range (0 < x < 0.7762~0.8337), the heat flux has no significant effect on the frictional pressure drop of the two-phase fluid.
The pressure drop measured under the experimental conditions is the sum of the pressure drop owing to friction and that owing to momentum, as shown in Equation (11). As the pressure drop due to momentum in a short section is negligible, the pressure drop by experiment in this study represents only the frictional pressure drop.
Figure 14 also shows the frictional pressure drop when the heat flux of the fluid is increased by intervals of approximately 10 kW/m2, from 9.8 kW/m2 to 39.7 kW/m2, under certain conditions. When the heat flux increases in the low vapor quality range (0 < x < 0.7762–0.8337), it does not significantly affect the frictional pressure drop of the two-phase fluid.
In addition, all curves corresponding to heat fluxes of 9.8, 20.3, 30.6, and 39.7 kW/m2 have their maximum pressure drop point in the vapor quality range (x = 0.7762~0.8337) where dry-out begins to occur. The pressure drop increases with an increasing vapor quality in the low vapor quality range. This means that in the dry-out range (x = 0.7762–0.8337), the liquid enters the vapor core in the form of liquid droplets transferred by the gas flow, and this conversion from annular to mist flow through the dry-out is associated with a reduction in the frictional pressure drop [43]. These results were confirmed to be consistent with those obtained by Yun et al. [22] and Moreno Quiben and Thome [44].
As shown in Figure 14, when the heat flux increases, the frictional pressure drop also increases. This is because the bubble generation frequency increases and the internal flow changes to a turbulent flow when the heat flux increases, causing the increased frictional pressure drop. However, this effect is less than that of other variables, and it seems to have almost no effect on the pressure drop.

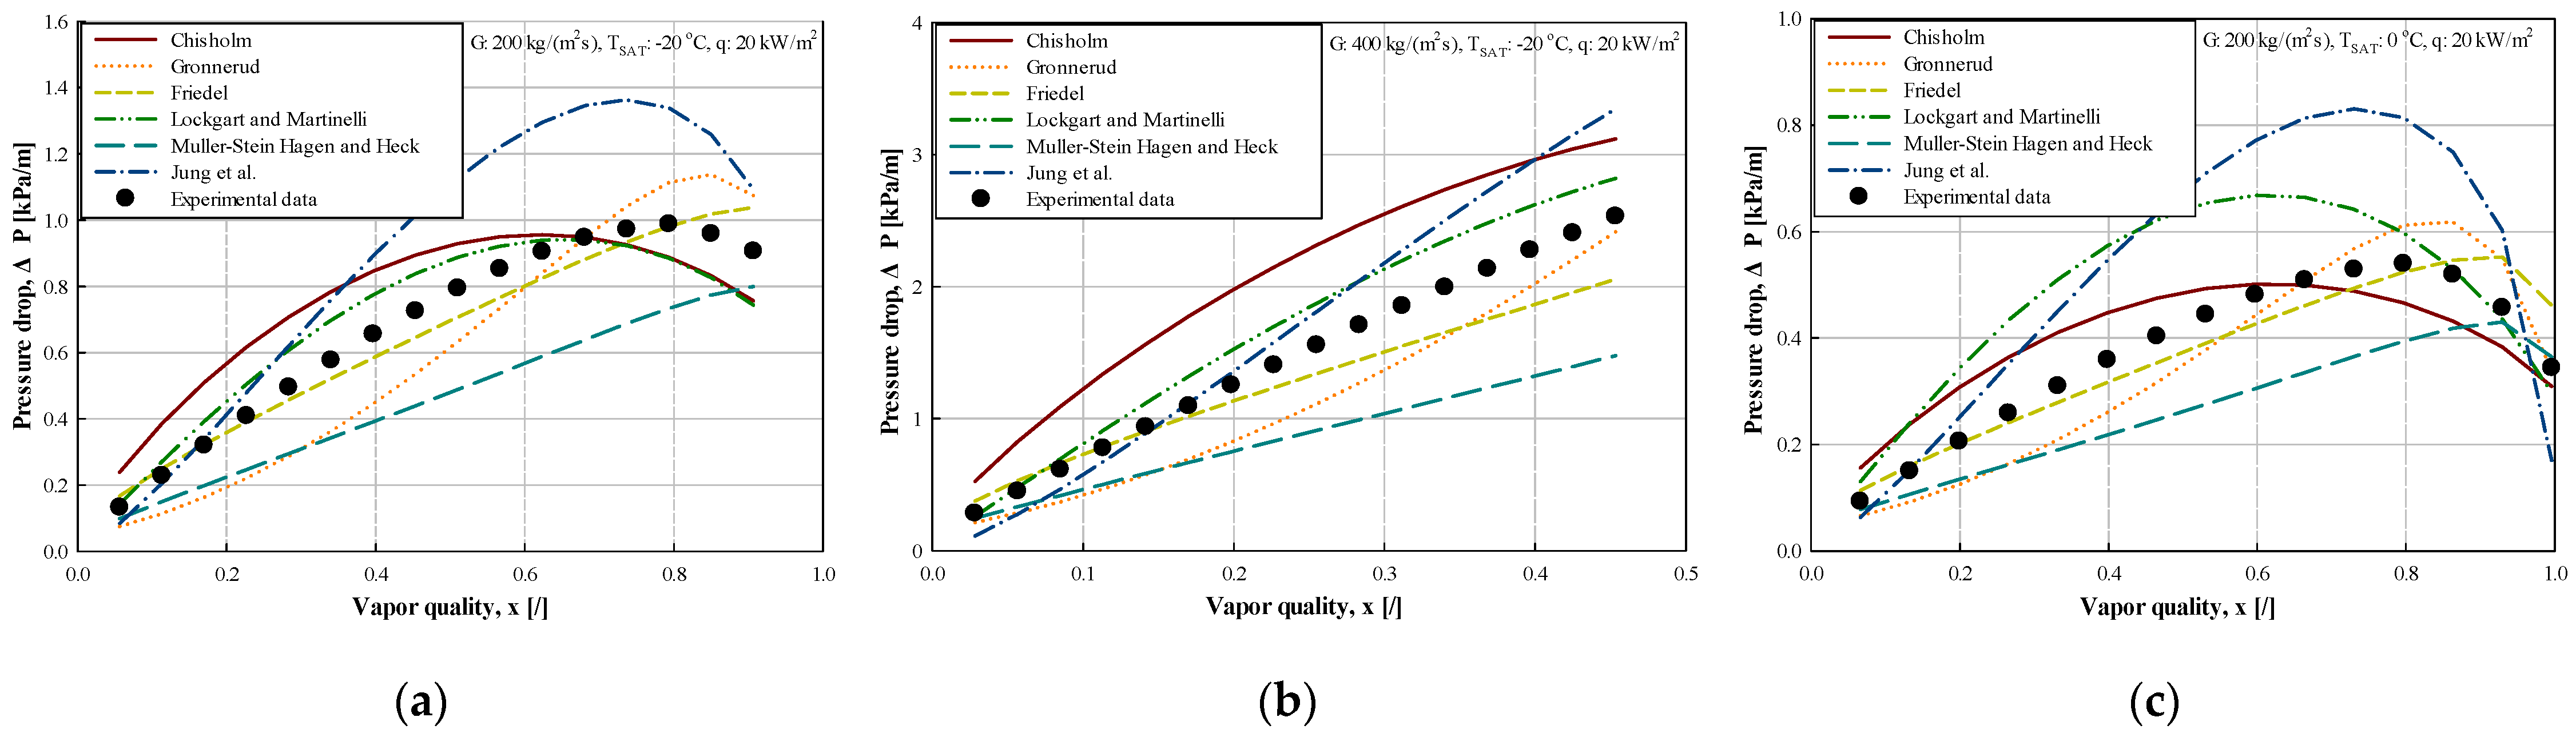
3.3.4. Comparison between Experimental Data and Existing Correlation Formulas

The basic model of the prediction equation for the frictional pressure drop, which accounts for most of the pressure drop in the horizontal tube, is largely divided into a homogeneous model, which supposes that the liquid and gas phases have the same velocity, and a separate model that separates the gas and liquid phases.
Pierre [45] conducted a study on the homogeneous model. For the separate model, correlations were provided by Martinelli-Nelson [46], Baroczy [47], Chisholm (1967) [48], Chisholm (1983) [49], Reddy et al. [50], Lockhart-Martinelli [51], and Jung et al. [52]. In general, a separate model is used when a phase change, such as evaporation and condensation, is involved. There are many correlation formulas for accurately predicting the frictional pressure drop of the refrigerant when designing an evaporator; however, the prediction formulas considered to be most useful in this experiment are those of Chisholm [48], Lockhart-Martinelli [51], Jung et al. [52], Grönnerud [53], Friedel [54], and Muller-Steinhagen and Heck [55]. These correlations and R744 evaporation pressure drop data were compared, and their applicability was considered. The frictional pressure drop correlations determined by the researchers are listed in Table 11.
The deviation was calculated using both qualitative and quantitative methods, as described in Section 3.2.4. Figure 15 presents a comparison of the total pressure drop of R744 measured by conducting the experiments in a tube with an inner diameter of 11.46 mm and the pressure drop calculated by using the correlation formulas of Chisholm [46], Lockhart-Martinelli [51], Jung et al. [52], Grönnerud [53], Friedel [54], and Muller-Steinhagen-Heck [55].
As in Figure 15a, the correlation formula of Friedel [54] yields the best prediction with an absolute mean deviation rate of 8.89%, and the correlation formula of Muller-Steinhagen-Heck [55] has the highest deviation rate with an absolute mean deviation rate of 32.96%. In Figure 15b, the correlation formula of Friedel [54] shows good agreement with an absolute mean deviation rate of 14.31%, and the correlation formula of Chisholm [48] shows the greatest difference with an absolute mean deviation rate of 52.49%. And, in Figure 15c, the correlation formula of Friedel [54] yields the best prediction with an absolute mean deviation rate of 11.65%, and the correlation formula of Jung et al. [52] has the highest deviation rate with an absolute mean deviation rate of 44.19%.
Table 12 shows the average deviation and absolute mean deviation yielded by the correlation formulas for all data. As indicated in Table 12, the values calculated by applying the correlation formulas of Chisholm [48], Friedel [54], and Jung et al. [52] are higher than the experimental data. Moreover, the correlation formulas of Grönnerud [53], Lockhart-Martinelli [51], and Muller-Steinhagen-Heck [55] obtain values lower than the experimental data. And Friedel’s correlation formulas yielded the most similar values to the experimental data, with an absolute mean deviation rate of 12.45% under all conditions, and Jung et al.’s correlation formulas showed the highest deviation rate with an absolute mean deviation rate of 47.20%.
Figure 16 shows a graph comparing the experimental values and correlation formulas for all conditions. As shown in the figure, the data calculated by applying the correlation formulas of Friedel [54] and Lockhart-Martinelli [51] agree best with the experimental data.

4. Conclusions

For an IRS circulating R744 with a liquid pump, an experiment was conducted on the evaporation heat transfer characteristics of R744 in the intermediate-temperature region at the operating conditions of the evaporator. The results are as follows.
  • As with other refrigerants, the R744 evaporator should be designed to increase the mass flux, saturation temperature, and heat flux as much as possible under the operating conditions.
  • If Kandlikar’s correlation formula is used at an evaporation temperature of −20 °C, the R744 evaporation heat transfer coefficient can be predicted well.
  • The heat transfer coefficient was larger in low vapor quality and smaller in high vapor quality as the saturation temperature increased. Therefore, there was a section where the heat transfer coefficient was reversed. On the other hand, in the pressure drop, the lower the saturation temperature, the greater the pressure drop as it changed from low vapor quality to high vapor quality without a special reversal section.
  • To lower the evaporation pressure drop of R744, the mass and heat flux should be lowered, and the saturation temperature should be increased, unlike the results of the evaporation heat transfer coefficient. When both the pressure drop and heat transfer coefficient are considered, the pressure drop increases when the heat flux increases, but the increase is insignificant. Therefore, if the heat flux is increased and the saturation temperature is increased, both the heat transfer coefficient and pressure drop are considered to be good.
  • To predict the evaporation pressure drop of R744, the experimental data of this study and the calculated value based on the existing correlation formula were compared. If Friedel’s correlation formula is used for a saturation temperature of −20 °C, which is the intermediate-temperature region of the IRS, the R744 evaporation pressure drop can be predicted well.

Funding

This research received no external funding.

Institutional Review Board Statement

Not applicable.

Informed Consent Statement

Not applicable.

Conflicts of Interest

The author declares no conflict of interest.

Nomenclature

SYMBOLS
c p Specific heat at constant pressurekJ/(kg · K)
dDiametermm
EEnhancement factor
FConstant in Shah’s correlation
fFriction factor
F f l Fluid-dependent parameter in Equations (16) and (17)
GMass velocitykg/(m2 · s)
gGravity accelerationm/s2
hHeat transfer coefficientkW/(m2 · K)
iEnthalpykJ/kg
i f g Latent heatkJ/kg
kThermal conductivitykW/(m · K)
LTube lengthmm
m ˙ Mass flow ratekg/s
nNumber of local tube
PPressurekPa
QHeat capacitykW
q Heat fluxkW/m2
q ˙ Volumetric heat generation kW/m3
rRadiusm
SSuppression factor
TTemperatureoC
v Specific volumem3/kg
x Quality
zLocal tube lengthm
( d P d z ) f Pressure drop due to friction
GREEK SYMBOLS
Δ Difference
ε void fraction
η Efficiency
ρ Densitykg/m3
μ Viscositykg/(m · s)
σ Surface tension, Standard deviation N/m%
Φ Two-phase multiplier
DIMENSIONLESS NUMBERS
B o Boiling number
C o Convection number
Re Reynolds number
Nu Nusselt number
Pr Prandtl number
Fr Froude number
SUBSCRIPTS
AbsAbsolute
AvgAverage
BBrine
BottomBottom
calCalculated cb
Convective boiling
CBDConvective boiling dominant
dry-outDry-out region
EEvaporation
expExperimental
fFrictional
iInner of the tube
IAIntermittent flow to annular flow transition
inInlet of the tube
lLiquid state, Flow of the liquid phase alone in the tube
loTotal flow having the liquid properties
leftLeft
locLocal
momMomentum
mistMist flow
nbNucleate boiling
NBDNucleate boiling dominant
oOuter of the tube
outoutlet of the tube
poolPool boiling
rightRight
R744Refrigerant R744
SATSaturation
staticAcceleration
stratStratified flow
topTop
totTotal
vVapor state
wWall
wavyWavy flow
X tt Martinelli parameter
SUPERSCRIPTS
MMechanical
TThermal

References

  1. Bredesen, A.M.; Aflekt, K.; Pettersen, J.; Hafner, A.; Neksà, P.; Skaugen, G. Studies on CO2 heat exchangers and heat transfer. In Proceedings of the IEA/IIR Workshop on CO2 Technologies in Refrigeration, Heat Pump, and Air-Conditioning Systems, Trondheim, Norway, 13–14 May 1997; pp. 329–358. [Google Scholar]
  2. Park, C.Y.; Hrnjak, P.S. Flow boiling heat transfer of CO2 at low temperatures in horizontal smooth tube. J. Heat Transf. 2005, 127, 1305–1312. [Google Scholar] [CrossRef]
  3. Yun, R.; Hwang, J.H.; Kim, Y.C.; Kim, M.S. Evaporation heat transfer characteristics of carbon dioxide in a horizontal smooth tube. In Proceedings of the IIR-Commission B1 Conference, Paderborn, Germany, 3–5 October 2001; pp. 517–523. [Google Scholar]
  4. Jeong, S.; Jeong, D.; Lee, J.J. Evaporating heat transfer and pressure drop inside helical coils with the refrigerant carbon dioxide. In Proceedings of the 21th International Congress of Refrigeration, Washington DC, USA, 17–22 August 2003; p. 260. [Google Scholar]
  5. Sawant, N.N.; Kim, M.S.; Payne, W.V.; Domanski, P.A.; Hwang, Y.W. A study of in-tube evaporation heat transfer of carbon dioxide. In Proceedings of the 21st IIR International Congress of Refrigeration, Washington, DC, USA, 17–22 August 2003; pp. 1–8. [Google Scholar]
  6. Koyama, S.; Lee, S.M.; Ito, D.; Kuwahara, K.; Ogawa, H. Experimental Study on Flow Boiling of Pure CO2 and CO2-Oil Mixtures inside Horizontal Smooth and Micro-fin Copper Tubes. In Proceedings of the IIR International Conference: Thermophysical Properties and Transfer Processes of Refrigerants, Vicenza, Italy, 30—31 August 2005; pp. 245–252. [Google Scholar]
  7. Knudsen, H.J.; Jensen, P.H. Heat transfer coefficient for boiling carbon dioxide. In Proceedings of the Workshop on CO2 Technologies in Refrigeration, Heat Pumps and Air Conditioning Systems, Trondheim, Norway, 13–14 May 1997; pp. 319–328. [Google Scholar]
  8. Yoon, S.H.; Cho, E.S.; Hwang, Y.W.; Kim, M.S.; Min, K.; Kim, Y.C. Characteristics of evaporative heat transfer and pressure drop of carbon dioxide and correlation development. Int. J. Refrig. 2004, 27, 111–119. [Google Scholar] [CrossRef]
  9. Schael, A.E.; Kind, M. Flow pattern and heat transfer characteristics during flow boiling of CO2 in a horizontal micro-fin tube and comparison with smooth tube data. Int. J. Refrig. 2005, 28, 1186–1195. [Google Scholar] [CrossRef]
  10. Wu, X.M.; Zhao, H.Y.; Wang, W.C.; Jing, L.; Zhang, L. Experimental study on evaporating heat transfer of CO2 in thin tube. J. Eng. Thermophys. 2005, 26, 823–825. [Google Scholar]
  11. Hashimoto, K.; Kiyotani, A.; Sasaki, N. Experimental study of influence of heat flux and mass velocity on carbon dioxide flow boiling heat transfer coefficient in horizontal smooth tube. In Proceedings of the 7th IIR Gustav Lorentzen Conference on Natural Working Fluids, Trondheim, Norway, 28–31 May 2006; pp. 1–8. [Google Scholar]
  12. Mastrullo, R.; Mauro, A.W.; Rosato, A.; Vanoli, G.P. Carbon dioxide local heat transfer coefficients during flow boiling in a horizontal circular smooth tube. Int. J. Heat Mass Transf. 2009, 52, 4184–4194. [Google Scholar] [CrossRef]
  13. Mastrullo, R.; Mauro, A.W.; Rosato, A.; Vanoli, G.P. Carbon dioxide heat transfer coefficients and pressure drops during flow boiling: Assessment of predictive methods. Int. J. Refrig. 2010, 33, 1068–1085. [Google Scholar] [CrossRef] [Green Version]
  14. Cheng, L.; Xia, G. Flow boiling heat transfer and two-phase flow of carbon dioxide: Fundamentals, mechanistic models and applications. In Proceedings of the 4th World Congress on Momentum, Heat and Mass Transfer (MHMT 19), Rome, Italy, 10–12 April 2019. [Google Scholar] [CrossRef]
  15. Cheng, L.; Ribatski, G.; Quiben, J.M.; Thome, J.R. New prediction methods for CO2 evaporation inside tubes: Part I-A two-phase flow pattern map and a flow pattern based phenomenological model for two-phase flow frictional pressure drops. Int. J. Heat Mass Transf. 2008, 51, 111–124. [Google Scholar] [CrossRef]
  16. Rouhani, Z.; Axelsson, E. Calculation of void volume fraction in the subcooled and quality boiling regions. Int. J. Heat Mass Transf. 1970, 13, 383–393. [Google Scholar] [CrossRef]
  17. Kline, S.J.; McClintock, F.A. Describing Uncertainties in Single Sample Experiments. Mech. Eng. 1953, 75, 3–8. [Google Scholar]
  18. Moffat, R. Describing the uncertainties in experimental results. Exp. Therm. Fluid Sci. 1988, 1, 3–17. [Google Scholar] [CrossRef] [Green Version]
  19. Cheng, L.; Ribatski, G.; Wojtan, L.; Thome, J.R. New flow boiling heat transfer model and flow pattern map for carbon dioxide evaporating inside horizontal tubes. Int. J. Heat Mass Transf. 2006, 49, 4082–4094. [Google Scholar] [CrossRef]
  20. Cheng, L.; Ribatski, G.; Thome, J.R. New prediction methods for CO2 evaporation inside tubes: Part II—An updated general flow boiling heat transfer model based on flow patterns. Int. J. Heat Mass Transf. 2008, 51, 125–135. [Google Scholar] [CrossRef]
  21. Han, J.U.; Kim, S.J.; Jung, D.S.; Kim, Y.I. Flow Boiling Heat Transfer Characteristics of R22 Alternative Refrigerants in a Horizontal Smooth Tube. Korean J. Air-Cond. Refrig. Eng. 2001, 13, 242–251. [Google Scholar]
  22. Yun, R.; Kim, Y.C.; Kim, M.S. Two-phase flow patterns of CO2 in a narrow rectangular channel. In Proceedings of the 21st IIR International Congress of Refrigeration, Washington, DC, USA, 17–22 August 2003; pp. 1–7. [Google Scholar]
  23. Kew, P.A.; Cornwell, K. Correlations for the prediction of boiling heat transfer in small-diameter channels. Appl. Therm. Eng. 1997, 17, 705–715. [Google Scholar] [CrossRef]
  24. Wambshanss, M.W.; France, D.M.; Jendrzejczyk, J.A.; Tran, T.N. Boiling heat transfer in a horizontal small-diameter tube. J. Heat Transf. 1993, 115, 963–975. [Google Scholar] [CrossRef]
  25. Choi, K.I.; Pamitran, A.S.; Oh, C.Y.; Oh, J.T. Boiling heat transfer of R22, R134a, and CO2 in horizontal smooth mini-channels. Int. J. Refrig. 2007, 20, 1336–1346. [Google Scholar] [CrossRef]
  26. Pettersen, J. Flow vaporization of CO2 in micro-channels tubes. Exp. Therm. Fluid Sci. 2004, 28, 111–121. [Google Scholar] [CrossRef] [Green Version]
  27. Yun, R.; Kim, Y.C.; Kim, M.S. Convective boiling heat transfer characteristics of CO2 in microchannels. Int. J. Heat Mass Transf. 2005, 48, 235–242. [Google Scholar] [CrossRef]
  28. Choi, K.I.; Oh, J.T. Boiling Heat Transfer Ammonia inside Horizontal Smooth Small Tube. Korean J. Air-Cond. Refrig. Eng. 2013, 25, 101–108. [Google Scholar] [CrossRef]
  29. Zhao, X.; Bansal, P. Experimental investigation on flow boiling heat transfer of CO2 at low temperatures. Heat Transf. Eng. 2009, 30, 2–11. [Google Scholar] [CrossRef]
  30. Park, C.Y.; Hrnjak, P.S. CO2 and R410A Flow boiling heat transfer and pressure drop at low temperatures in a horizontal smooth tube. Int. J. Refrig. 2007, 30, 166–178. [Google Scholar] [CrossRef]
  31. Choi, K.I.; Pamitran, A.S.; Oh, J.T. Two-phase flow heat transfer of CO2 vaporization in smooth horizontal minichannels. Int. J. Refrig. 2007, 30, 767–777. [Google Scholar] [CrossRef]
  32. Thome, J.; Wojtan, L.; Ursenbacher, T. Investigation of flow boiling in horizontal tubes: Part 1—A new adiabatic two-phase flow pattern map. Int. J. Heat Mass Transf. 2005, 48, 2955–2969. [Google Scholar] [CrossRef]
  33. Wu, J.; Koettig, T.; Franke, C.; Helmer, D.; Eisel, T.; Haug, F.; Bremer, J. Investigation of heat transfer and pressure drop of CO2 two-phase flow in a horizontal minichannel. Int. J. Heat Mass Transf. 2011, 54, 2154–2162. [Google Scholar] [CrossRef]
  34. Oh, H.K.; Jo, H.; Son, C.H.; Jeon, M.J.; Yi, W.B. Evaporation heat transfer characteristics of carbon dioxide at low temperature of −30 °C~−50 °C. In Proceedings of the SAREK Summer Annual Conference, Yongpyong, Korea, 26–28 June 2013; pp. 17–20. [Google Scholar]
  35. Lim, T.W.; Han, K.I. A Study on Heat Transfer Characteristics in Flow Boiling of Pour Refrigerants and Their Mixtures in Horizontal Tube. Korean J. Air-Cond. Refrig. Eng. 2003, 15, 144–151. [Google Scholar]
  36. Chen, J.C. Correlation for boiling heat transfer to saturated fluids in convective flow. Ind. Eng. Chem. Process. Des. Dev. 1966, 5, 322–329. [Google Scholar] [CrossRef] [Green Version]
  37. Gungor, K.E.; Winterton, R.H.S. A general correlation for flow boiling in tubes and annuli. Int. J. Heat Mass Transf. 1986, 29, 351–358. [Google Scholar] [CrossRef]
  38. Kandlikar, S.G. A general correlation for saturated two-phase flow boiling horizontal and vertical tubes. J. Heat Transf. 1990, 112, 219–228. [Google Scholar] [CrossRef] [Green Version]
  39. Kenning, D.B.R.; Cooper, M.G. Saturated flow boiling of water in vertical tubes. Int. J. Heat Mass Transf. 1989, 32, 445–458. [Google Scholar] [CrossRef]
  40. Kandlikar, S.G. A model for correlating flow boiling heat transfer in augmented tubes and compact. J. Heat Transf. 1991, 113, 966–972. [Google Scholar] [CrossRef] [Green Version]
  41. Kandlikar, S.G.; Balasubramanian, P. An Extension of the flow boiling correlation to transition, laminar, and deep laminar flows in minichannels and microchannels. Heat Transf. Eng. 2004, 25, 86–93. [Google Scholar] [CrossRef]
  42. Bredesen, A.M.; Hafner, A.; Pettersen, J.; Nekså, P.; Aflekt, K. Heat transfer and pressure drop for in-tube evaporation of CO2. In Proceedings of the International Conference on Heat Transfer Issues in Natural Refrigerants, IIF-IIR, College Park, MD, USA, 6–7 November 1997; pp. 1–15. [Google Scholar]
  43. Yun, R.; Kim, Y. Two-phase pressure drop of CO2 in mini-tubes and micro-channels. Microscale Thermophys. Eng. 2004, 8, 259–270. [Google Scholar] [CrossRef]
  44. Moreno Quiben, J.; Thome, J.R. Flow pattern based two-phase frictional pressure drop model for horizontal tubes, Part II: New phenomenological model. Int. J. Heat Fluid Flow 2007, 28, 1060–1072. [Google Scholar] [CrossRef]
  45. Pierre, B. Flow resistance with boiling refrigerants part I. ASHRAE J. 1964, 6, 58–65. [Google Scholar]
  46. Martinelli, R.C.; Nelson, D.B. Prediction of pressure drop forced circulation boiling of water. Trans. ASME 1948, 70, 695–702. [Google Scholar]
  47. Baroczy, C.J. A systematic correlation for two-phase pressure drop. Chem. Eng. Prog. Symp. Ser. 1966, 62, 232–249. [Google Scholar]
  48. Chisholm, D. The influence of mass velocity on friction pressure gradients during steam-water flow. Proc. Inst. Mech. Eng. Conf. Proc. 1967, 182, 35. [Google Scholar] [CrossRef]
  49. Chisholm, D. Two Phase Flow in Pipelines and Heat Exchangers; Longman: London, UK; New York, NY, USA, 1983. [Google Scholar]
  50. Reddy, D.G.; Fighetti, C.F.; Merilo, M. Evaluation of two phase pressure drop correlations for high pressure steam water systems. In Proceedings of the ASME-JSME Thermal Engineering Joint Conference Proceedings, Honolulu, HI, USA, 20–24 March 1983; pp. 251–259. [Google Scholar]
  51. Lockhart, R.W.; Martinelli, R.C. Proposed correlation of data for isothermal, two phase, two component flow in pipes. Chem. Eng. Prog. 1949, 45, 39–48. [Google Scholar]
  52. Jung, D.S.; McLinden, M.; Radermacher, R.; Didion, D. A study of flow boiling heat transfer with refrigerant mixtures. Int. J. Heat Mass Transf. 1989, 32, 1751–1764. [Google Scholar] [CrossRef]
  53. Grönnerud, R. Investigation of liquid hold-up, flow resistance and heat transfer in circulation type evaporators. Part 4: Two-phase flow resistance in boiling refrigerants. In Proceedings of the IIR Conference, Heat and Mass Transfer in Refrigeration Systems and in Air Conditioning, Freudenstadt, Germany, 19 September 1972; pp. 127–138. [Google Scholar]
  54. Friedel, L. Improved friction pressure drop correlation for horizontal and vertical two-phase pipe flow. In Proceedings of the European Two-Phase Flow Group Meeting, Ispra, Italy, 5–8 June 1979. Paper E2. [Google Scholar]
  55. Muller-Steinhagen, H.; Heck, K. A simple friction pressure drop correlation for two-phase flow in pipes. Chem. Eng. Process. 1986, 20, 297–308. [Google Scholar] [CrossRef]
Figure 1. Schematic diagram of experimental apparatus for an IRS using R744 as a secondary fluid.
Energies 15 02285 g001
Figure 2. Schematic diagram of the evaporator for the R744 evaporation heat transfer test.
Energies 15 02285 g002
Figure 3. Photograph of the experimental apparatus for the R744 evaporation heat transfer.
Energies 15 02285 g003
Figure 4. Flow pattern map for R744 according to various mass fluxes at constant saturation temperature (−20 °C) and heat flux (20 kW/m2).
Energies 15 02285 g004
Figure 5. Flow pattern map for R744 according to various saturation temperatures at constant mass flux (200 kg/(m2·s)) and heat flux (20 kW/m2).
Energies 15 02285 g005
Figure 6. Flow pattern map for R744 according to various heat fluxes at constant mass flux (200 kg/(m2·s)) and saturation temperature (−20 °C).
Energies 15 02285 g006
Figure 7. Variation in heat transfer coefficients according to various mass fluxes at constant saturation temperature and heat flux and (−20 °C and 20 kW/m2).
Energies 15 02285 g007
Figure 8. Variation in heat transfer coefficients according to various saturation temperatures at constant heat and mass fluxes (G: 200 kg/(m2·s) and q: 20 kW/m2).
Energies 15 02285 g008
Figure 9. Variation in heat transfer coefficients according to various saturation temperatures at constant mass and heat fluxes (G: 200 kg/(m2·s) and q: 20 kW/m2).
Energies 15 02285 g009
Figure 10. Comparison of the heat transfer coefficient calculated using existing correlation and experimental heat transfer coefficient according to the increase of vapor quality under each given condition (ac).
Energies 15 02285 g010
Figure 11. Comparison of the heat transfer coefficient calculated using existing correlations and the experimental heat transfer coefficient for all data.
Energies 15 02285 g011
Figure 12. Variation in experimental pressure drop according to various mass fluxes at constant saturation temperature and heat flux (−20 °C and 20 kW/m2).
Energies 15 02285 g012
Figure 13. Variation in experimental pressure drop according to different saturation temperatures at constant heat and mass fluxes (200 kg/(m2·s) and 20 kW/m2).
Energies 15 02285 g013
Figure 14. Variation of experimental pressure drop according to various heat fluxes at constant mass fluxes and saturation temperature (200 kg/(m2·s) and −20 °C).
Energies 15 02285 g014
Figure 15. Comparison of the pressure drop calculated using existing correlation and experimental pressure drop according to the increase of vapor quality under each given condition (ac).
Energies 15 02285 g015
Figure 16. Comparison between measured and calculated frictional pressure drops for all data.
Energies 15 02285 g016
Table 1. Specifications of R744 evaporator.
ItemsEvaporator
Inner tubeInternal diameter [mm]11.46
External diameter [mm]12.7
MaterialCopper
Outer tubeInternal diameter [mm]33.27
External diameter [mm]34.92
MaterialCopper
Evaporator length [mm]8000
Table 2. Experimental conditions for R744 evaporation heat transfer.
VariablesValue
RefrigerantR744
Test sectionHorizontal smooth tube
Inner diameter of tube [mm]11.46
Tube length [mm]8000
Mass flux [kg/(m2·s)]200, 300, 400, 500
Saturation temperature [°C]−40, −30, −20, −10, 0
Heat flux [kW/m2]10, 20, 30, 40
Quality0–1
Table 3. Parameters and estimated uncertainties.
ParametersUnitUncertainty
Thickness, length, and width[m]±0.005
Inner diameter[mm]±0.05
Temperature[°C ]±0.2
Pressure[kPa]±5.27
Δ P (Pressure drop)[kPa]±0.01
Mass flow rate of coolant[kg/h]±7.53
Mass flux of refrigerant[kg/(m2·s)]±1.5
Heat flux[kW/m2]±0.15045
Heat transfer coefficient[kW/(m2·°C)]±0.597
Table 4. Variation in Reynolds number with respect to different mass fluxes at constant saturation temperature (−20 °C) and heat flux (20 kW/m2).
G [kg/(m2·s)]Re [/]
20016,450
30024,676
40032,901
50041,126
Table 5. Variation in properties (thermal conductivity, density ratio, and Prandtl number) with respect to different saturation temperatures.
T S A T   [ ] k [kW/(m·K)] ρ l / ρ v   [ / ] Pr [/]
00.10879.4982.324
−100.121413.812.243
−200.133819.952.254
−300.1463292.327
−400.158942.742.453
Table 6. Variation in properties (specific volume ratio and surface tension) with respect to different saturation temperatures.
T S A T   [ ] v v / v l   [ / ] σ [N/m]
09.4980.004344
−1013.810.006151
−2019.950.008068
−30290.01008
−4042.740.01217
Table 7. Correlations for evaporation heat transfer determined by several researchers.
ResearcherCorrelation
Chen [36] h t p = S · h n b + F · h c b (14)
Gungor-Winterton [37] h t p = E · h l + S · h p o o l (15)
Kandlikar [38] h N B D = { ( 0.6683 C o 0.2 ) ( 25 F r l o ) 0.3 + ( 1058.0 B o 0.7 F f l ) } h l (16)
h C B D = { ( 1.1360 C o 0.9 ) ( 25 F r l o ) 0.3 + ( 667.2 B o 0.7 F f l ) } h l (17)
Kenning-Cooper [39] h t p = ( 1 + 1.8 X t t 0.87 ) h s p (18)
Yoon et al. [8] h t p = [ ( S · h n b ) 2 + ( E · h l ) 2 ] 1 / 2 (19)
Table 8. Comparison of deviation between the calculated and experimental heat transfer coefficient for all data prior to CHF.
CorrelationChen [36]Gungor-Winterton [37]Kandlikar [38]Kenning-
Cooper [39]
Yoon et al. [8]
Deviation
Average deviation (%)4.03−33.043.17−7.4033.25
Absolute mean deviation (%)15.1233.459.2924.8033.35
Table 9. Variation in properties (liquid viscosity, vapor viscosity, and viscosity ratio) with respect to different saturation temperatures.
T S A T   [ ° C ] μ l   [ kg · m / s 2 ] μ v   [ kg · m / s 2 ] μ l / μ v   [ / ]
00.000099390.000014796.722
−100.0001180.000013868.512
−200.00013930.0000131210.62
−300.00016420.0000124613.18
−400.00019380.0000118716.33
Table 10. Variation in properties (liquid density, vapor density, and density ratio) with respect to different saturation temperatures.
T S A T   [ ° C ] ρ l   [ kg / m 3 ] ρ v   [ kg / m 3 ] ρ l / ρ v   [ / ]
0927.497.659.498
−10982.971.1813.81
−20103251.719.95
−30107637.129
−40111726.1242.74
Table 11. Correlations for pressure drop obtained by several researchers.
ResearcherCorrelation
Chisholm [48] ( d P d z ) f Φ l o 2 · ( d P d z ) l o (22)
Lockhart-Martinelli [51] ( d P d z ) f = Φ l t t 2 · ( d P d z ) l (23)
( d P d z ) f = Φ v t t 2 · ( d P d z ) v (24)
Jung et al. [52] ( d P d z ) f = Φ l o 2 · ( d P d z ) l o (25)
Grönnerud [53] ( d P d z ) f = Φ g d 2 · ( d P d z ) l (26)
Friedel [54] ( d P d z ) f = ( d P d z ) l o · Φ l o 2 = f l o G r e 2 2 ρ l d i Φ l o 2 (27)
Muller-Steinhagen-Heck [55] ( d P d z ) f = G · ( 1 x ) 1 3 + B x 3 (28)
Table 12. Comparison of deviation between the calculated and experimental pressure drops for all data.
CorrelationChisholm [46]Gronnerud [51]Friedel [52]Lockhart and Martinrlli [49]Muller-Steinhagen and Heck [53]Jung et al. [50]
Deviation
Average deviation (%)−30.485.31−5.728.8025.22−28.36
Absolute mean deviation (%)39.8526.4412.4527.7625.2347.20
Publisher’s Note: MDPI stays neutral with regard to jurisdictional claims in published maps and institutional affiliations.

