Article

Experimental Investigation of Two-Phase Flow Boiling Heat Transfer Coefficient and Pressure Drop of R448A inside Multiport Mini-Channel Tube

1
Department of Refrigeration and Air-Conditioning, Graduate School, Chonnam National University, Yeosu 59626, Korea
2
Department of Refrigeration and Air-Conditioning, Chonnam National University, Yeosu 59626, Korea
*
Author to whom correspondence should be addressed.
Energies 2022, 15(12), 4331; https://doi.org/10.3390/en15124331
Submission received: 11 May 2022 / Revised: 8 June 2022 / Accepted: 9 June 2022 / Published: 13 June 2022
(This article belongs to the Special Issue Heat Transfer Characteristics and Two-Phase Flow Performance)

Abstract

:
Regulations and restrictions against high global warming potential (GWP) refrigerants have been introduced to encourage the adoption of environmentally friendly refrigerants and mitigate the environmental impact of the HVAC industry. R448A, a zeotropic blend with a GWP of 1390, has recently been proposed as a drop-in replacement for R404A and R410A in commercial systems. In this study, the heat transfer coefficient and pressure drop characteristics of R448A within a multiport mini-channel tube were experimentally investigated. The experimental ranges of the mass and heat fluxes were 100 to 500 kg/(m2s) and 3–15 kW/m2, respectively. Additionally, the range of quality from 0 to 1 was considered at two fixed saturated temperatures of 3 and 6 °C. The heat transfer coefficient increased with mass flux. Under low mass flux condition, the heat flux increased the heat transfer coefficient, but there was no noticeable effect of the saturated temperature on the heat transfer coefficient. At high mass flux, heat flux had no major effect on heat transfer, while a decrease in the saturated temperature was found to increase the heat transfer coefficient. Moreover, the pressure drop increased with an increase in the mass flux and vapor quality, whereas the heat flux did not affect the pressure drop. The heat transfer coefficient and pressure drop performance of R448A was compared with that of R410A inside the same tube. Finally, correlations for heat transfer coefficient and pressure drop were proposed for the prediction of heat transfer coefficient and pressure drop in practical applications.

1. Introduction

The refrigeration and heat pump industry requires continuous development and innovations to mitigate their impact on the environment. According to the EU Regulation No. 517/2014, stationary refrigeration equipments must limit the utilization of refrigerants with a global warming potential (GWP) higher than 2500 by the year 2020, and refrigerators and freezers should employ fluid with a GWP lower than 2500. The Environmental Protection Agency (EPA) in USA has restricted the use of 25 fluids with high GWP in domestic and commercial refrigerants. The commonly used R134a, R410A, and R407C will be deemed unacceptable in chiller systems from 2024. These policies have pressured the heating, ventilation, and air conditioning (HVAC) industry to utilize alternative low GWP refrigerants in in commercial and industrial systems. However, pure low-GWP hydrofluoro-olefin (HFO) refrigerants have a lower heat transfer coefficient in comparison with that of their predecessor. Therefore, HFO/HFC refrigerant mixtures are considered as a drop-in replacement as they combine the advantages of lower GWP while maintaining the heat transfer performance closer to that of the replaced refrigerant. R448A (also referred to as N-40) is a zeotropic blend of R32 (26%), R125 (26%), and R134a (21%), with HFO components R1234yf (20%) and 1234ze(E) (7%). It is a non-flammable refrigerant with a GWP of 1390 and has been proposed as a low-GWP interim alternative for R404A (GWP = 3922) and R410A (GWP = 2088) for commercial applications.
Babiloni et al. [1] experimentally evaluated the performance of R448A in a vapor compression system test bench and compared its performance with that of R404A. Although R448A had a lower cooling capacity than that of R404A, it had a lower power consumption. Hence, the coefficient of performance (COP) of R448A was higher than that of R404A. The discharge temperature of R448A was higher than that of R404A. However, it did not lead to a malfunction in the system. Babiloni et al. [1] recommended redesigning R448A systems to improve their performance. They considered R448A as an optimal alternative for intermediate temperature applications, such as food preservation, but possibly not for freezing applications. Additionally, they stated that the utilization of R448A refrigerants is beneficial in countries with warm climate. Sethi [2] experimentally investigated the performances of R455A and R448A in a commercially available R404A freezer. The compressor energy consumption of R448A was 9% lower, and R448A matched the capacity with 4–8% higher efficiency compared with that of R404A. They concluded that R448A is a suitable replacement for R404A in commercial refrigeration systems and for retrofitting. Qingqing [3] studied and compared the performance of non-inverter and inverter cold storage units operating on R404A and R448A refrigerants. R448A systems exhibited a slightly higher thermal performance compared with that of R404A systems, and the energy efficiency ratio of the R448A inverter unit was 14.4% higher than that of non-inverter A404A unit under identical conditions. They conducted a techno-economic analysis and concluded that the inverter unit was a better alternative than non-inverter unit in terms of energy consumption, and R448A was more environmentally friendly than R404A. In addition, Babiloni et al. [4] performed a comparative study on the energy performance of six low-GWP alternatives of R404A in vapor compression systems. They observed that the alternative refrigerants had a better energy efficiency compared with that of R404A, and R448A was the optimum alternative for applications wherein mildly flammable refrigerants cannot be used.
These studies demonstrate that R448A is a promising replacement candidate for R404A in commercial refrigeration systems. Although R448A is considered as a potential alternative, studies focusing on the performance of R448A inside the evaporator remain limited. Lillo [5] experimentally investigated the boiling heat transfer and pressure drop of R448A and compared these parameters with that of R404A inside a 6 mm tube. They observed that R404A had a higher heat transfer coefficient at low vapor quality. However, it had a lower convective effect than that of R448A, and the pressure drop of R448A was higher than that of R404A under the same operating conditions. Kedzierski [6] experimentally studied the convective boiling of three low GWP refrigerants (R448A, R449A and R452B) inside a horizontal microfin tube. R454B exhibited the highest heat transfer coefficient and the heat transfer coefficient of R449A was approximately 8% higher than that of R448A. Kim [7] experimentally investigated interim (R448A, R449A) and long-term (R455A, R454C) low-GWP replacements of R404A in a smooth tube with an inner diameter (ID) of 5.6 mm. They observed that the heat transfer coefficient of R404A higher than that of the alternative refrigerant at low mass flux and low vapor quality in high mass flux flow (nucleate boiling dominated), but the alternative refrigerant heat transfer coefficient exceeded R404A in high mass flux, high vapor quality flow (convective boiling dominated flow). A subsequent study conducted by Kim et al. [8] experimentally investigated the heat transfer of the same refrigerant, but for multiport mini-channel tube evaporator. Similarly, heat transfer coefficient of R404A was higher than that of alternative refrigerants and the heat transfer coefficient of the interim refrigerants (R448A and R449A) were higher than that of the long-term substitutes (R455A and R454C). The pressure drop of the replaced refrigerant was higher than that of R404A.
Alternatively, extensive experimental studies have been conducted on flow boiling heat transfer and pressure drop of low-GWP zeotropic mixture inside evaporator in conventional tubes and micro-tubes. Li et al. [9] experimentally investigated the boiling heat transfer and pressure drop of R32/R1234yf mixture with different compositions in a 2 mm diameter tube. They observed that the mass diffusion resistance had a significant effect on heat transfer and the Boiling number had a direct correlation with convective and nucleate boiling mechanisms. Berto et al. [10] measured the boiling heat transfer coefficients of R455A and R452B in 8 and 0.96 mm tubes. They discovered that R452B exhibited a higher heat transfer coefficient than that of R455A. The heat transfer coefficient of both blend increased with an increase in the heat and mass fluxes, and vapor quality in the 8 mm diameter channel. The heat transfer coefficient of R455A was less sensitive to mass velocity in the 0.96 mm diameter channel. In addition, the 0.96 mm tube had a higher heat transfer coefficient compared with that of the 8 mm channel. Jige et al. [11] studied the flow boiling of R1234yf/R32 zeotropic mixture at two different compositions inside the multiport mini-channel tube. They observed that the heat transfer coefficient was significantly affected by the mass flux, quality, mass fraction. However, the heat flux effect was minor. The deterioration of heat transfer due to mass transfer resistance was significant during nucleate boiling and thin film evaporation, and low in the annular flow regime.
A recent study conducted by Kim [8] investigated the heat transfer and pressure drop of R448A within a multiport mini-channel tube. However, the data for R448A was spare as the study investigated the simultaneous utilization of multiple refrigerants. The multiport mini-channel evaporator is compact and efficient with a good heat transfer rate. Therefore, the objective of this work was to present a detailed experimental analysis of the heat transfer and pressure drop characteristics of R448A inside a multiport mini-channel tube. The mass and heat fluxes were in the range of 100–500 kg/(m2s) and 3–15 kW/m2, respectively. The corresponding inlet saturated temperature was fixed at 6 °C and 3 °C. The effect of heat and mass fluxes, vapor quality, and saturated temperature on the heat transfer coefficient was analyzed. The heat transfer and pressure drop of R448A was compared with that of R410A to evaluate the potential of R448A to replace R410A. Finally, correlations were proposed for the practical prediction of heat transfer coefficient and pressure drop of R448A to aid engineers in designing an R448A charged multiports minichannel evaporator.

2. Experimental Method

2.1. Experimental Systems and Procedure

The heat transfer coefficient and pressure drop were investigated using the experimental systems presented in Figure 1.
The system comprised of primary refrigerant and auxiliary test section loops. Sensors from both loops were connected model MX100 Yokogawa data-logger linked to a computer for in- situ monitoring and recording of the experimental data. The refrigerant in liquid phase from the condenser was circulated by a magnetic micro-gear pump. The pump rotational frequency was independently adjusted by an inverter controller (Leeson Speedmaster motor controller). A Coriolis mass flow meter (Oval Engineering South Korea, with maximum measurement range of 80 kg/h and ±0.5% accuracy) was installed after the pump to measure the refrigerant mass flow rate. The refrigerant might be slightly heated by the pump. Therefore, a sub-cooler was installed to ensure that only liquid refrigerant could enter the preheater. The preheater was a 4 m-long tube section with two ends connected to a controllable DC power source (with maximum 1500 W heating power) that heated the liquid flow to the desired testing inlet quality before entering the test section. The two-phase refrigerant flow exiting the test section was finally condensed to liquid phase within the condenser. An out-of-loop chiller system provided the refrigeration effect for the chilled brine, which supplied the cooling for the condenser and sub-cooler. The chiller cooling capacity was controlled to set the required brine temperature. Air was purged using a vacuum pump before the charging of refrigerant to remove non-condensable gases, which might affect the system performance. The system was insulated using foam to prevent heat infiltration from the environment.
The test section is depicted in Figure 2.
A multiport mini-channel tube was used for the test section. The test tube was fixed in the middle of the acrylic cover. An annuli space was provided between the tubes to allow the passage of warm water to heat the tube. The flow direction of the refrigerant and the water jacket was counter current flow. The temperature of the water was controlled to obtain different heat flux conditions via a constant temperature bath. The water circulation was ensured by an inverter adjustable pump. A mass flow meter (same model used in the refrigerant loops) was installed to measure the water mass flow rate. Three resistance temperature detectors (RTDs) (calibrated to an accuracy of ±0.01 °C) were installed at the inlet, outlet of the water path for the calculation of heat flux, and at the inlet of the refrigerant. Twelve thermo-couples (K types) were embedded on the outer surface of the tube to calculate the heat transfer coefficient (at three different positions along the tube, four junctions in each position with two on top and two at the bottom as shown on the right of Figure 2). The thermocouple junctions were fixed on the tube surface using an aluminum tape. A layer of glue was applied on top of the junction for insulation, so as to avoid measurement bias from the direct exposition of the thermos–couple junctions to the water stream. All thermocouples were calibrated to an ±0.1 K accuracy. The inlet temperature and pressure were measured using an RTD sensor and absolute pressure transducer, respectively, to determine the quality of the inlet vapor quality. A differential pressure sensor was installed at the test section inlet and outlet to facilitate the measurement of pressure drop. Their accuracy and measurement range was ±2.5 kPa and 3.5 MPa respectively for absolute pressure transducer, and ±0.1 kPa and 100 kPa respectively for differential pressure transducer. The outlet temperature thermocouples (K type) were installed to compare between the measured and calculated outlet temperatures, to ensure the accuracy of heat balance, pressure drop, and saturated temperature calculation. A linearized simplified calculator of outlet temperature was included inside the data acquisition program to ensure that the heat balance can be monitored during the experiment. The deviation between the measured and calculated outlet temperatures fell mostly under the combined uncertainty of the measurement and calculation, which was approximately 0.15 °C.
The pump speed, preheater’s DC power supply, chilled brine temperature, heating water temperature, and pumping speed were simultaneously controlled to obtain the required testing condition before each experiment. The speed of the refrigerant pump was set to facilitate the testing mass flow rate before each measurement. Subsequently, the pressure of the system was controlled by adjusting the temperature of the out-of-loop supply chilled brine, while the inlet temperature was primarily controlled by adjusting the DC power supplied to the pre-heater. The heat flux was set by simultaneously controlling the water pump speed and temperature of the bath. The system maintained at a relatively stable condition before the measurement was conducted. The reported data point was the averaged value obtained by the 10 min testing sessions.
The geometrical configuration of the tube and the experimental conditions are listed in Table 1 and Table 2, respectively.
The thermo-physical properties of R448A and R410 used as a reference for performance comparison are listed in Table 3. The properties of R448A were taken at a vapor quality of 0.5.

2.2. Data Reduction

The data reduction was performed as follows in the following successive order. The average heat flux applied to the test section can be calculated as:
q = m w a t e r C p , w a t e r ( T w a t e r , i n T w a t e r , o u t ) A e x t
In contrast to a pure fluid, R448A is a zeotropic mixture with an appreciable temperature glide of approximately 5.6 °C. As saturated pressure changes with quality at the same saturated temperature, the temperature and absolute pressure at the inlet could be used to determine the quality and inlet enthalpy of the refrigerant.
i i n = f ( T i n , P i n )
x i n = f ( i i n , P i n )
The applied heat flux was assumed to be constant. Therefore, the enthalpy of the ith measurement point (with z1 = 0.05 m, z2 = 0.10 m and z1 = 0.15 m) could be calculated as
i i = i i n + q P t u b e m r e f z i
The pressure drop was assumed to be linear across the tube. Therefore, the pressure at the ith thermocouple junction was calculated as follows:
P i = P i n Δ P z i L
The saturated temperature of the ith measurement point was calculated through:
T s a t , i = f n ( P i , i i )
Assuming one-dimensional conductive heat transfer between the wall, the inner wall temperature could be calculated as follows. The outer wall temperature was taken as the averaged of the 4 measured temperatures.
T w , i n i = T w , o u t i +   q D k
Finally, the heat transfer coefficient was calculated as:
h i = A e x t A i n t q T w , i n i T s a t , i
The reported heat transfer coefficient was the average of the value obtained from the 3 measurement points.
The measured pressure drop comprised of three components, namely frictional, acceleration, and gravitational pressure drop. However, the gravitational term was omitted because the tube inclination was horizontal.
Δ P = Δ P f + Δ P a
The acceleration pressure drop was calculated using the separated flow model, as follows.
Δ p a = G 2 l ( ( x 2 α ρ v + ( 1 x ) 2 ( 1 α ) ρ l ) o u t   ( x 2 α ρ v + ( 1 x ) 2 ( 1 α ) ρ l ) i n )
The void fraction from the previous equation was calculated using the entropy generation minimized model proposed by Zivi [12]:
α = x x + ( 1 x ) ( ρ v ρ l ) 2 / 3
The frictional pressure gradient was calculated using the frictional pressure drop, as follows:
d P f d z =   Δ P f L = Δ P Δ P a L

2.3. Uncertainty Analysis

The uncertainty analysis was performed according to guidelines of ISO 1995. The uncertainty of a measurement consists of two types of uncertainty. Type B uncertainty is the uncertainty of the instrument and it is specified by the manufacturers as summarized in Table 4. Type A uncertainty is based on statistical analysis and considers the random error (fluctuation) that occur during experiment. The system was configured to remain stable to reduce type A uncertainty. Type A uncertainty was considered as the standard deviation of the mean of the measurement interval.
s 2 ( q ¯ ) =   s 2 ( q k ) n = 1 n ( n 1 ) 1 n ( q j q ¯ ) 2
For parameters that were not directly measured, their uncertainty had to be determined by the method of error propagation. The combine uncertainty of a parameter calculated using N different variables x i with the functional form of f ( x i ) can be calculated as follows:
u c 2 ( y ) = 1 N ( f x i ) 2 u 2 ( x i )
A few parameters do not have an explicit functional form but are derived from a black box function. Therefore, their combined uncertainty has to be estimated numerically using the central difference scheme as suggested by Moffat [13], as follows.
u c 2 ( y ) = i = 1 n ( f ( x i + u ( x i ) ) f ( x i u ( x i ) ) 2 u ( x i ) ) 2 u 2 ( x i )
The experimental uncertainty was case specific. The main source of uncertainty was the difference between the temperatures of the wall and the refrigerant. In the case of high mass flux condition, the heat transfer coefficient was high even at a low heat flux due to strong effect of convection. This decreased the aforementioned temperature difference and significantly increased the experimental uncertainty. For the rest, the average uncertainty of the heat transfer coefficient was 14.16%.

3. Results and Discussion

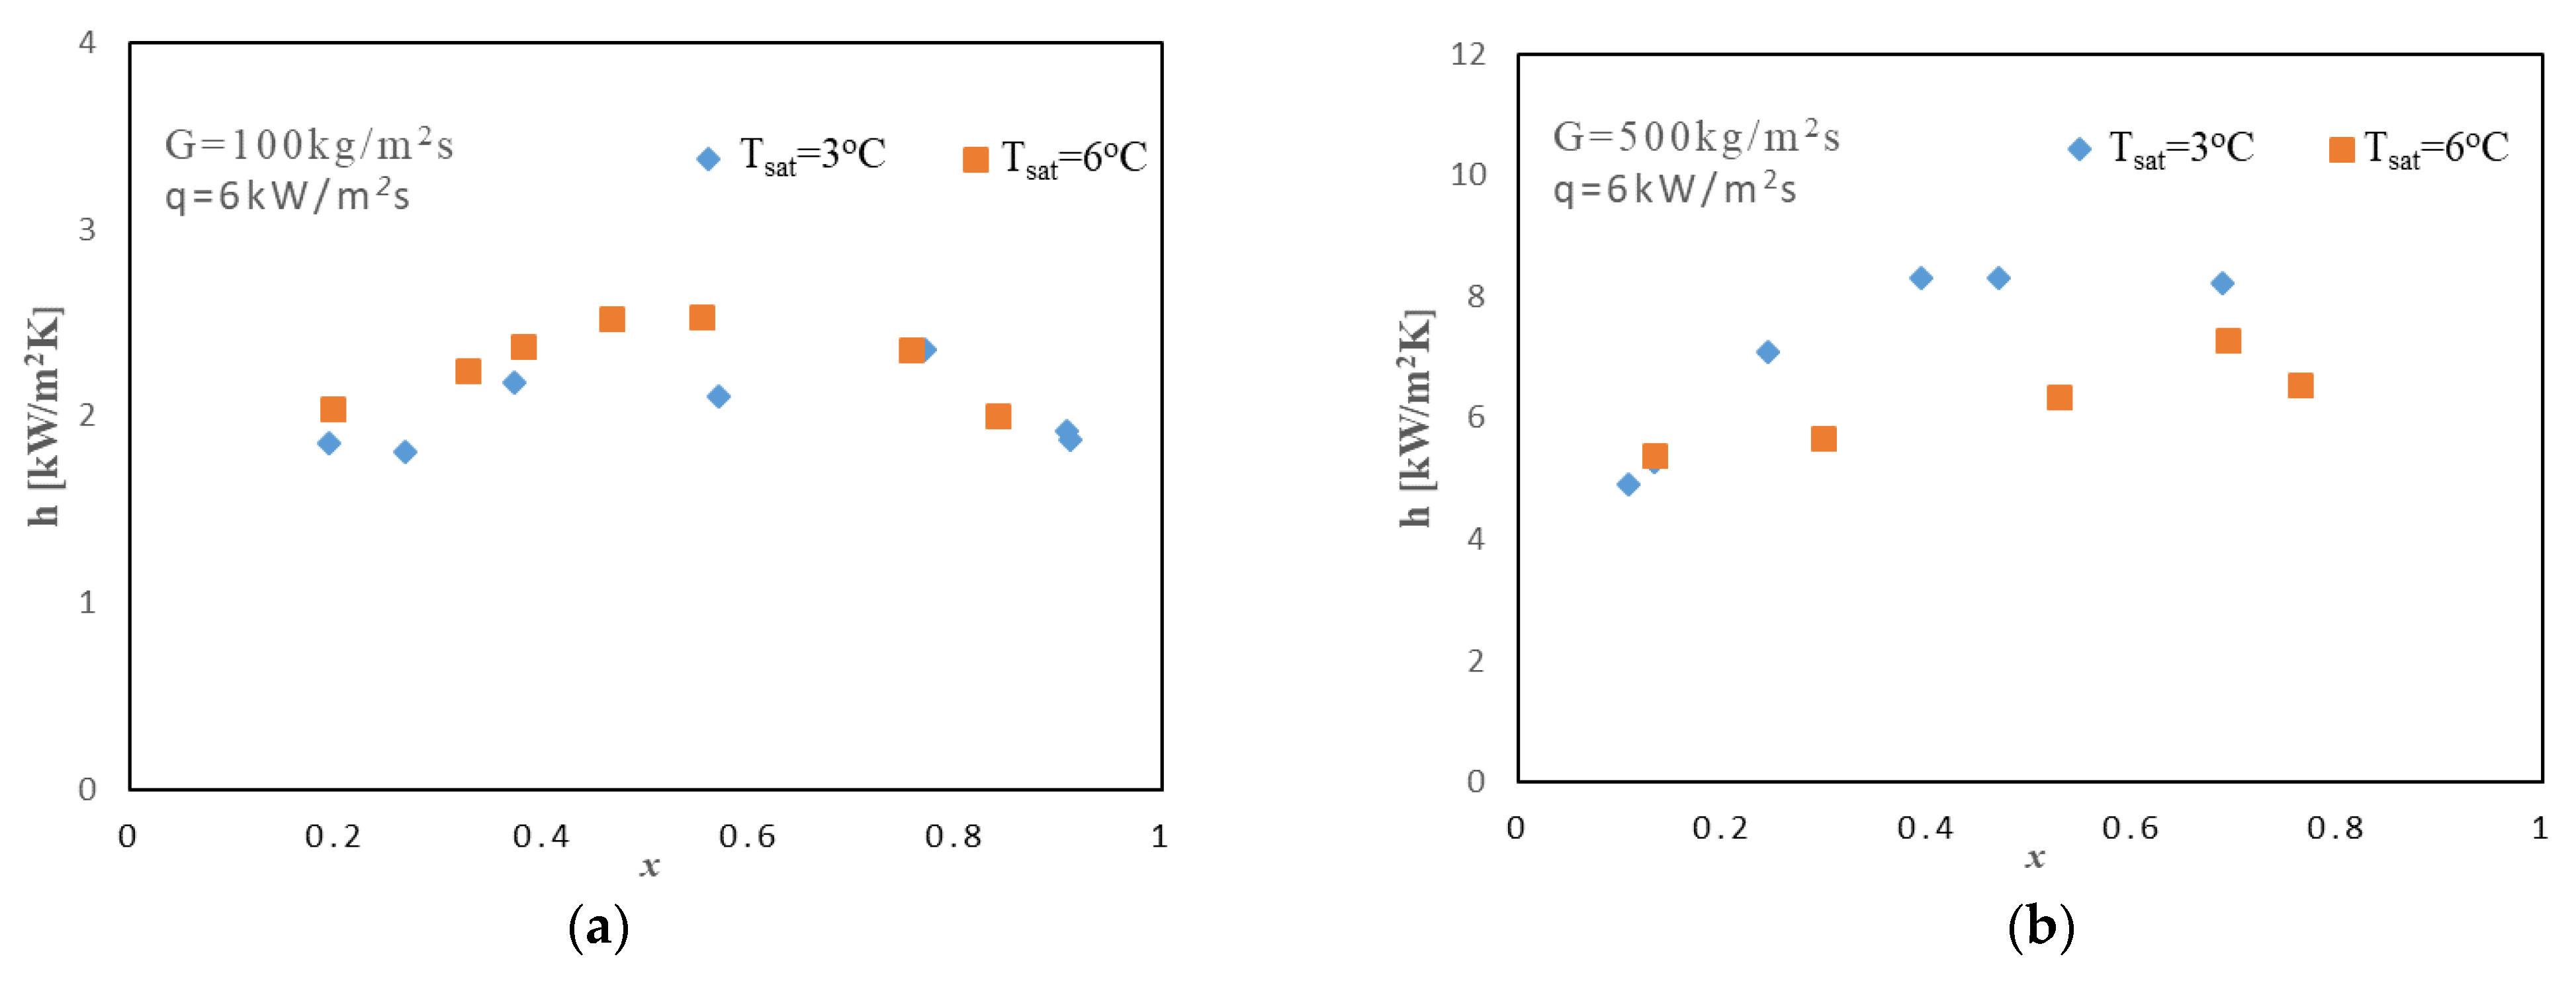
3.1. Heat Transfer Coefficient

In this section, the effect of mass flux, heat flux, vapor quality, and saturating temperature on the experimental heat transfer coefficient of R448A inside the mini-channel was analyzed. The heat transfer during flow boiling was divided into two mechanisms, nucleate boiling and convective boiling, which had varying degrees of importance depending upon the specific condition.
The effect of mass flux on heat transfer coefficient at two different saturated temperatures and a fixed heat flux of 6 kW/m2 is shown in Figure 3a,b.
Evidently, the heat transfer coefficient increased with an increase in the mass flux. At a saturated temperature of 6 °C, mass flux increased the starting value at low quality, whereas at a saturated temperature of 3 °C, mass flux increased both the aforementioned and enhanced the increase rate of heat transfer coefficient with quality. The two distinct mechanisms that caused this effect were interfacial shear stress and turbulent effective conductivity. As reported by the simulation of Toninelli et al. [14], the Reynolds number increased with an increase mass flux, causing an enhancement of the turbulent intensity, which enhanced the effective thermal conductivity. Additionally, an increase in the mass flux increased the relative velocity of the liquid/vapor, which can be expressed as follows:
Δ v l v = v v v l = G ( x ρ v α 1 x ρ l ( 1 α ) )
The mass flux had a minor effect on the void fraction (α) (as in Equation (11)). Therefore, the relative velocity (∆v) increased with an increase in G (compared with a reference, condensation OK). Moreover, according to Wojtan [15] and Ravelin and Thome [16], the semi-annular, annular/slug flow pattern transitional quality reduced with an increase in the mass flux, and annular flow became the predominant flow regime. Convective boiling was the predominant mechanism. Therefore, the high relative velocity enhanced the interfacial shear stress, which promoted thin film evaporation and increased the heat transfer coefficient with an increase in quality.
Figure 4a,b depict the effect of heat flux on the heat transfer coefficient at different heat flux conditions.
The heat flux had a significant effect on the heat transfer coefficient at 200 kg/(m2s) (Figure 4a). An increase in the heat flux increases the number of active nucleation sites and the rate of bubble growth (the Cooper correlation (20) for nucleate boiling contains an explicit heat flux term). In this case, the nucleate boiling mechanism was dominant over convective boiling. However, the enhancement subsided with a further increase in the heat flux. According to Li et al. [9], high heat flux at low mass flux condition (high Bo flow) generates vigorous bubbles, which results in a highly inhomogeneous concentration. Therefore, this restricted the increase in the heat transfer coefficient with an increase in the heat flux. At a higher mass flux (500 kg/(m2s)) (Figure 4b), the heat flux has an insignificant effect on the heat transfer coefficient as data points appeared clustered together. The nucleate boiling mechanism was strongly suppressed by the strong convection effect owing to the high mass flux. These findings are also consistent with previous experimental results by Azzolin [4] and Berto [17].
Figure 5a,b compared the heat transfer coefficient of R448A at a saturated temperature of 3 °C and 6 °C.
In the case of low mass flux condition, the effect of saturated temperature on heat transfer coefficient was minimal when the nucleate boiling mechanism was dominant. However, in the case of high mass flux condition, the effect of saturated temperature on the heat transfer coefficient was comparatively evident. The heat transfer coefficient at a saturated temperature of 3 °C was higher than that at 6 °C due to the larger rate heat transfer coefficient increase with vapor quality. The flow had higher liquid/vapor density ratio, and lower vapor density at lower saturated temperature. The lower vapor density increased the vapor phase velocity, while the change in the density ratio further increased the interphase relative velocity, which enhanced the liquid film evaporation mechanism. The effect of convective boiling had a dominant role under high mass flux condition because the flow was developed into annular flow regime, and the effect of density ratio and vapor density had a predominant effect on the heat transfer coefficient. The decrease of heat transfer coefficient with saturation temperature was also reported in Arcasi et al. [18]’s study of R454C blend, the reason behind their result also being attributed to the effect of vapor density change with pressure.
Figure 6 compared the heat transfer coefficient of R448A with that of R410A at low and high mass flux conditions. The R410A data were obtained from a study conducted by Chien et al. [19], which was performed using a similar tube geometry.
A comparison between R448A and R410A under low mass flux condition demonstrated that the heat transfer coefficient of R410A exceeded R448A by a considerable margin. This could be because the relatively volatile components in the mixture were the first to nucleate into bubbles during nucleation. Therefore, the vapor bubbles were rich in volatile components, whereas their concentration was lower in liquid. This formed a mass transfer barrier that the volatile components had to overcome for evaporation, which subdued the bubble growth rate and heat transfer coefficient. R448A is a zeotropic mixture with considerable temperature glide. Therefore, the mass transfer resistance during nucleate boiling was relatively severe compared with that of R410A, which is a near-zeotropic mixture with negligible temperature glide and smaller mass transfer resistance. In addition, the thermal conductivity of R410A in liquid phase was higher than that of R448A, which indicates that the thermal resistance of R410A liquid film was lower than that of R448A. The effect of mass transfer resistance was still present at the interface under high mass flux. However according to Li [9] and Zhang [20], the strong turbulence effect enhanced mixing and partly counteracted the effect of concentration inhomogeneity. Although R448A had a higher liquid/vapor density ratio, its heat transfer coefficient was in similar order of magnitude compared to that of R410A, which indicates that the mass transfer resistance had a significant effect on the heat transfer coefficient.

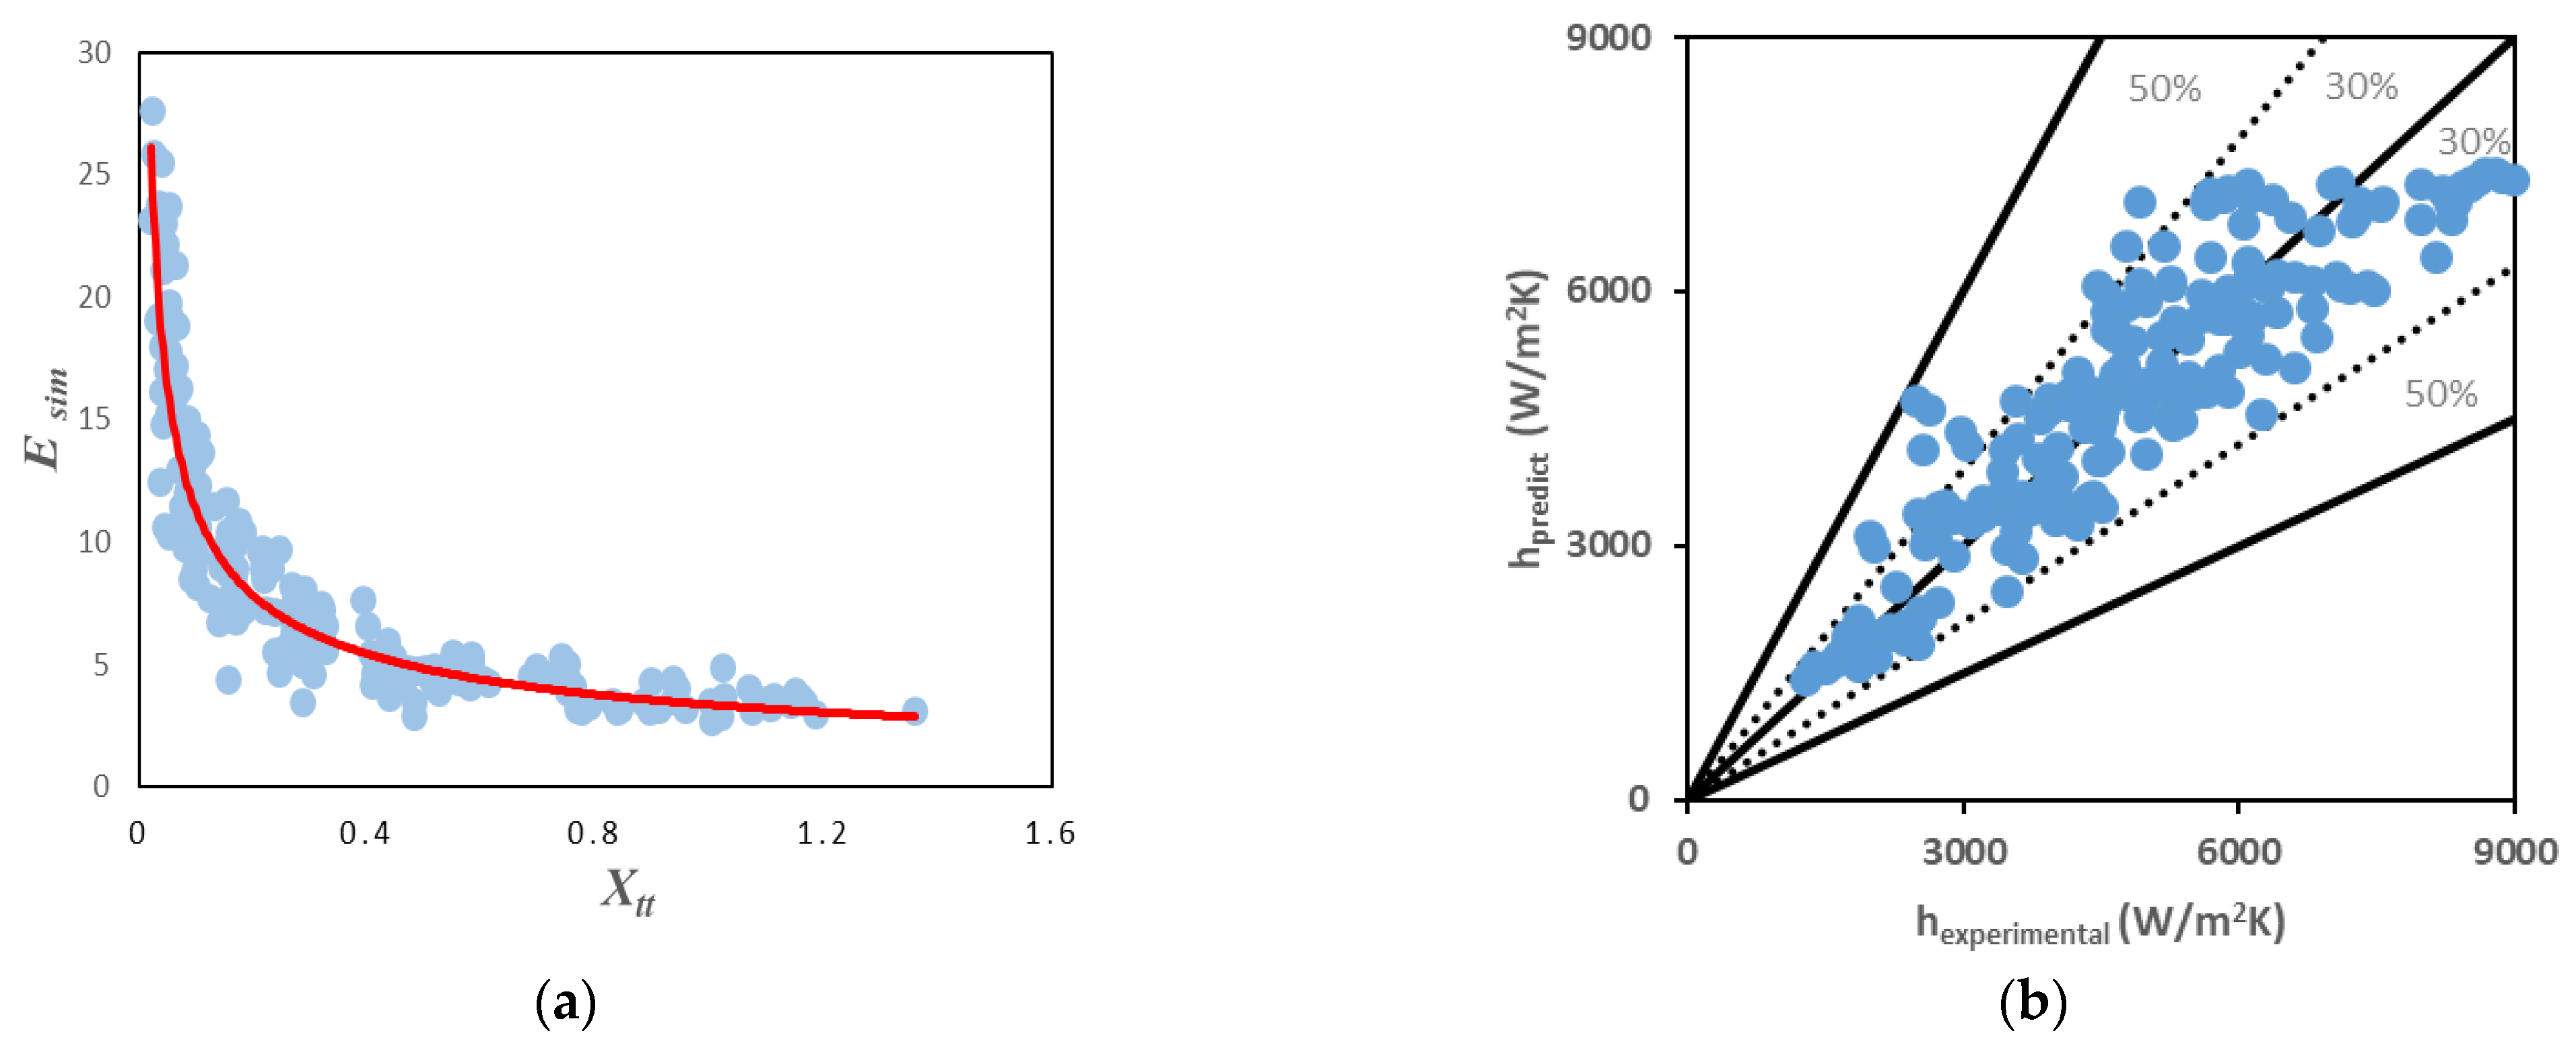
3.2. Heat Transfer Coefficient Correlation
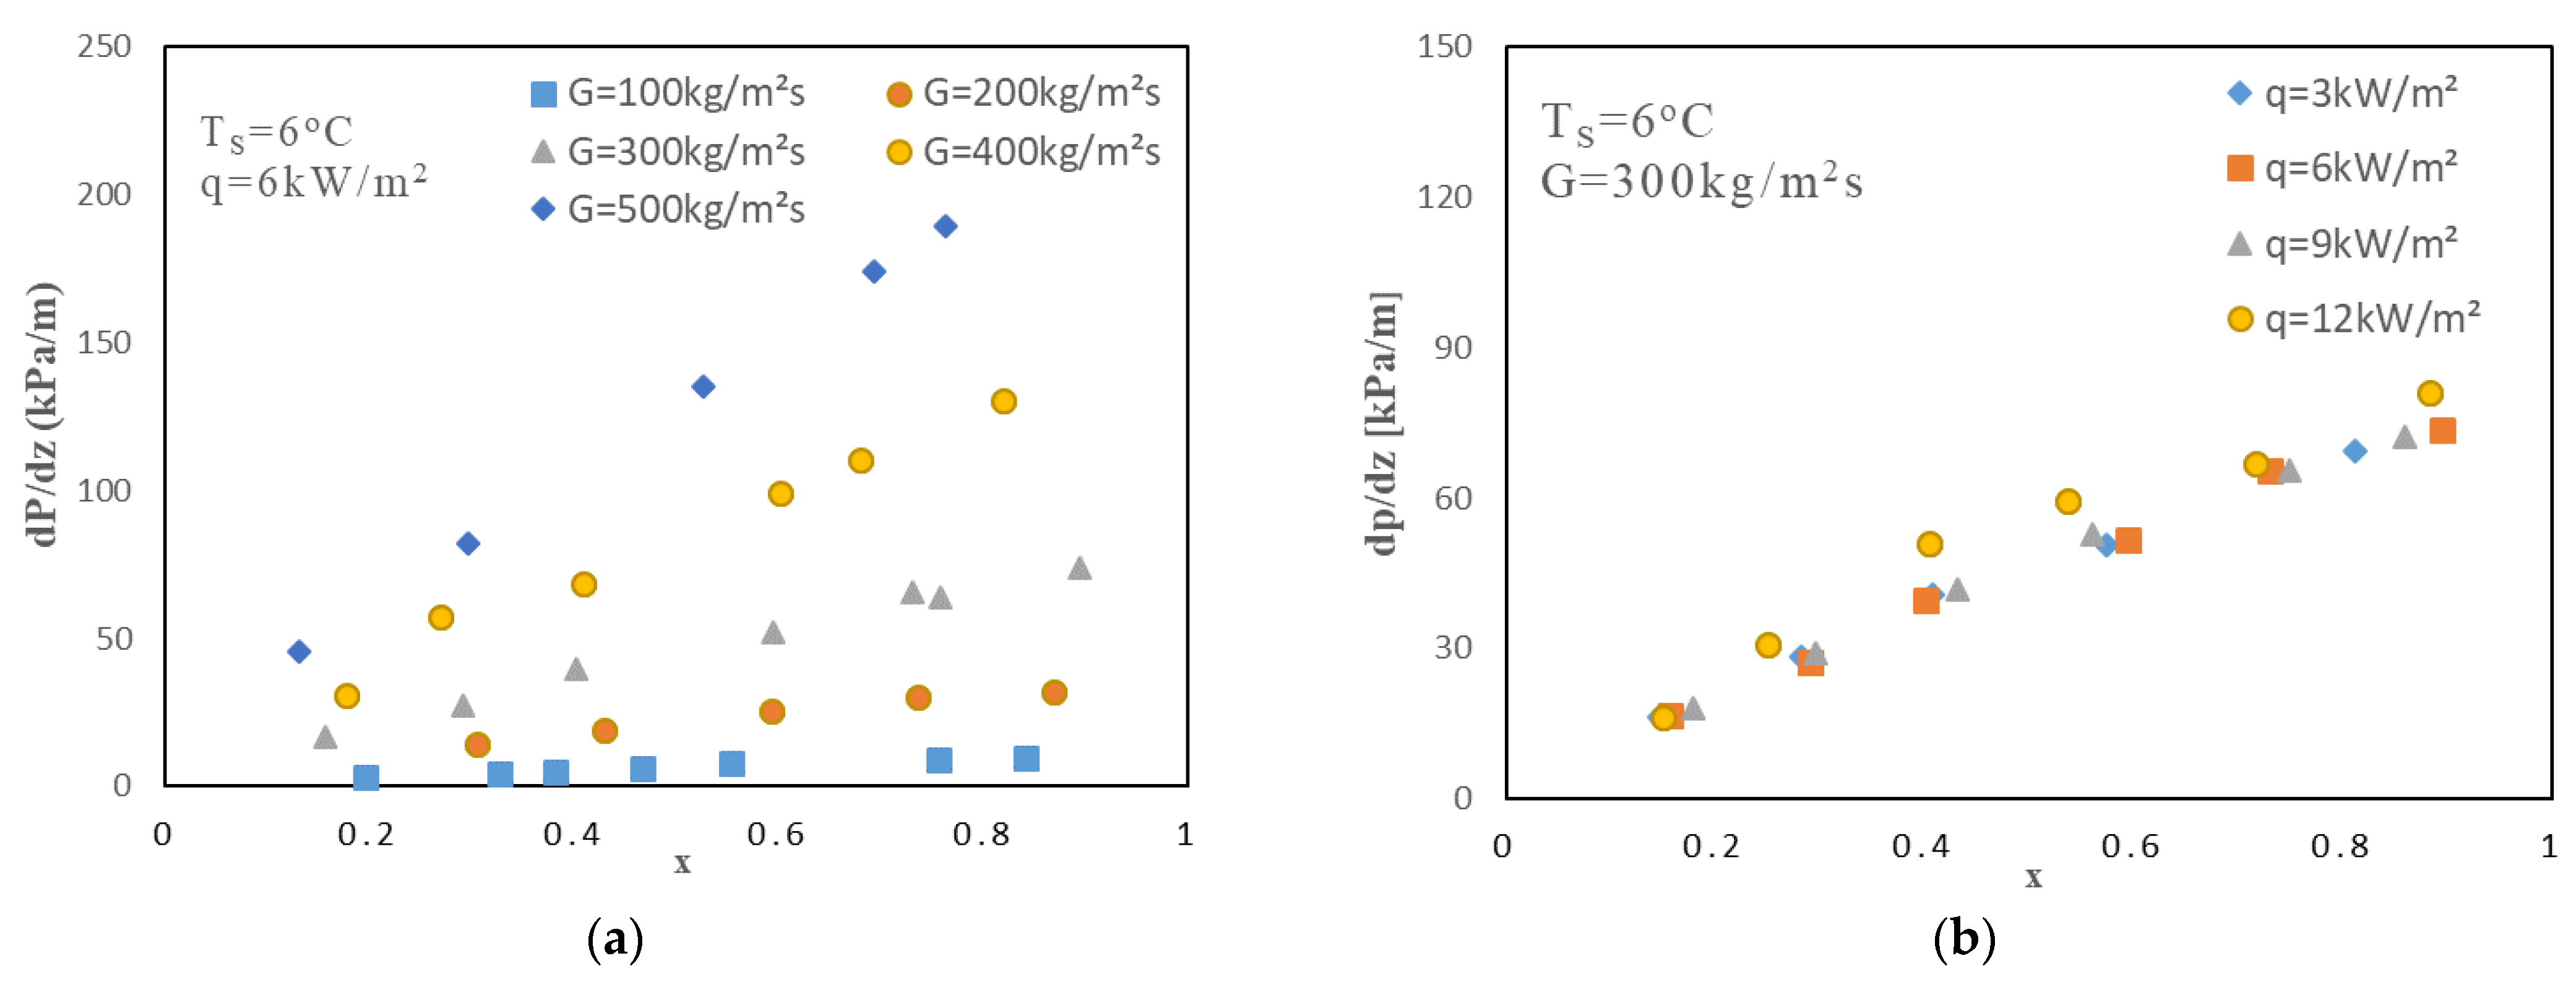
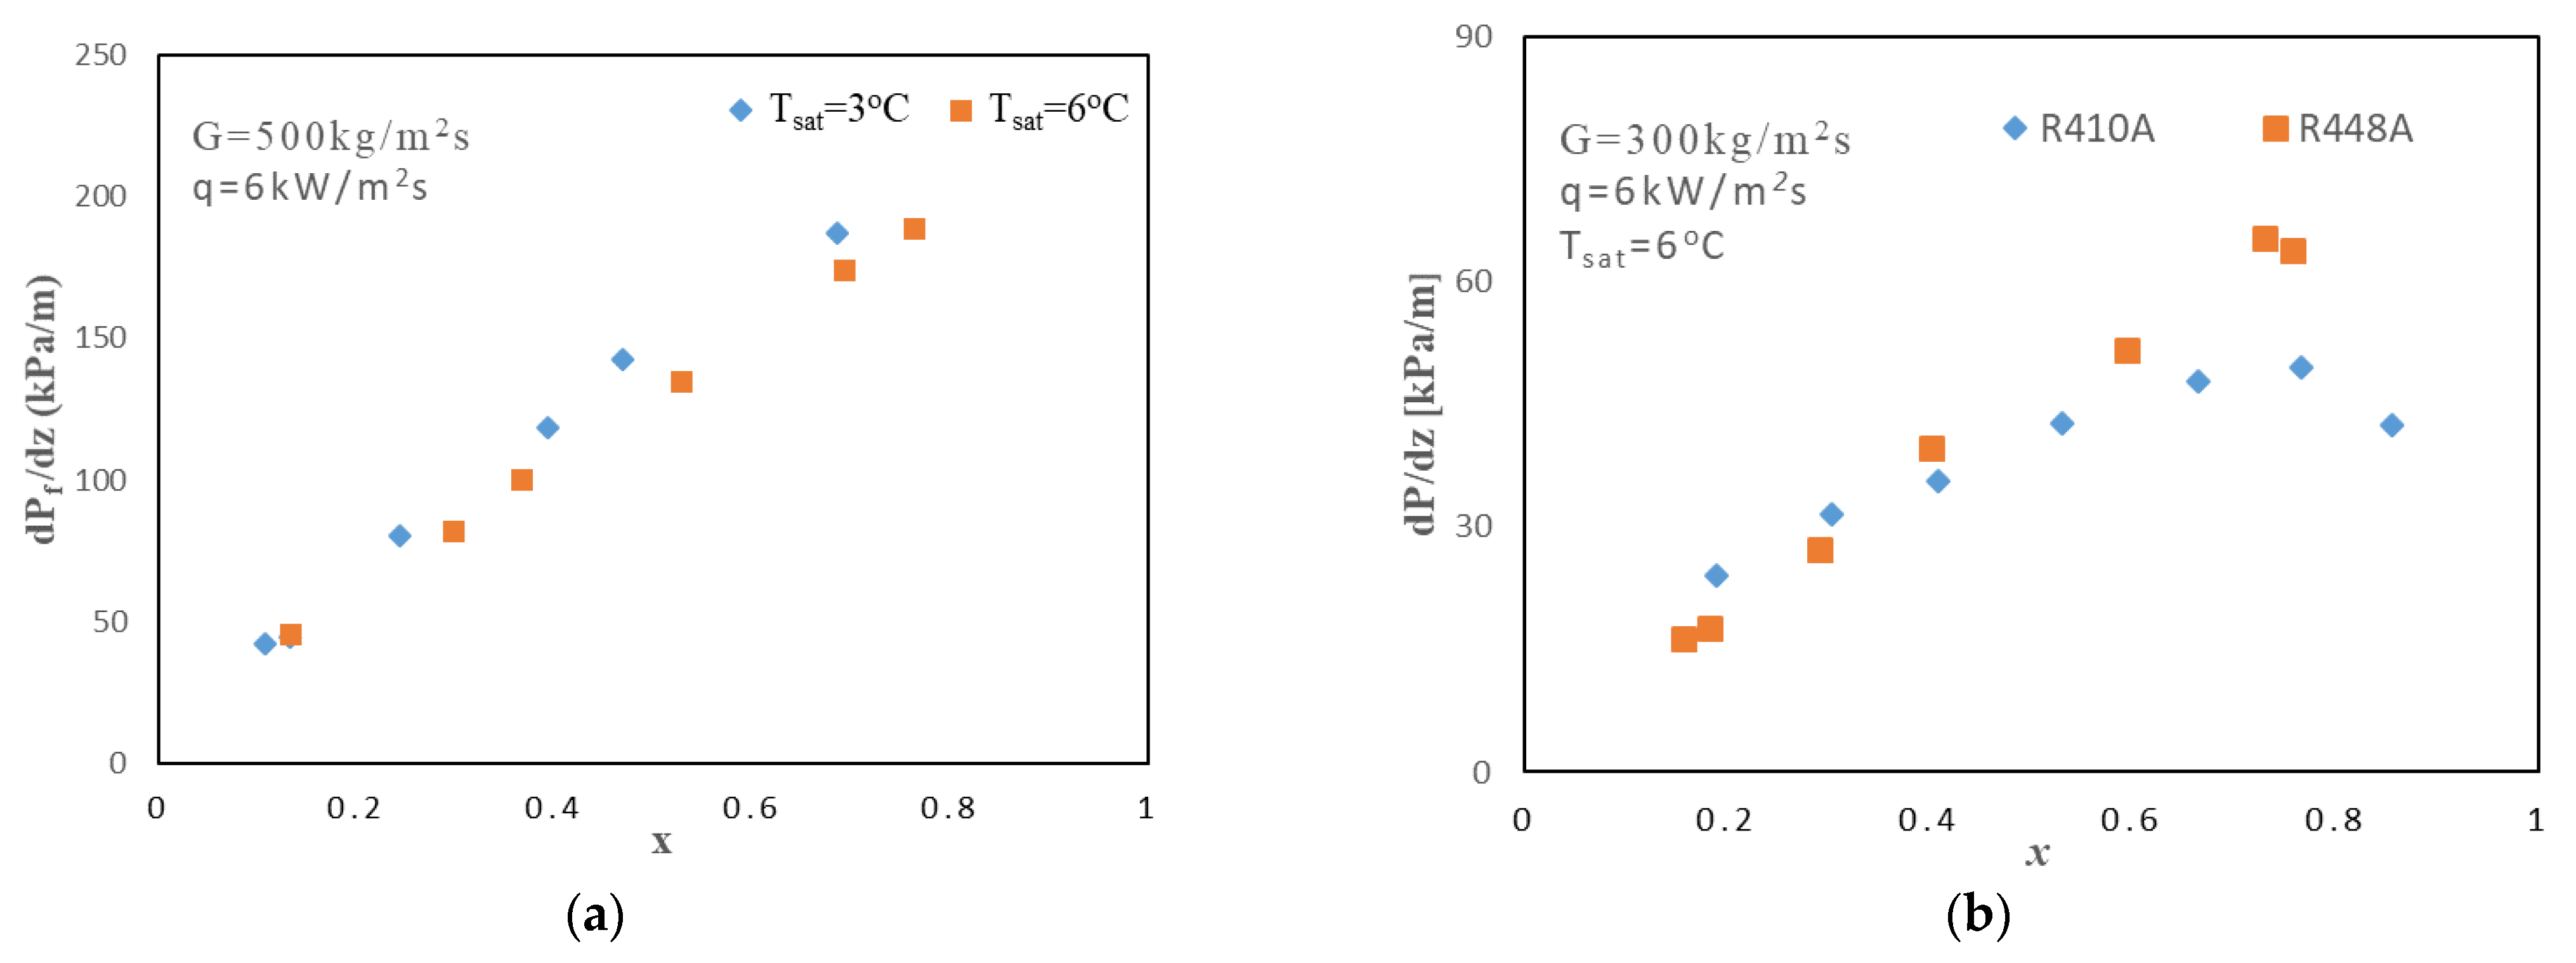
A heat transfer coefficient correlation was proposed in this study for the practical prediction of heat transfer coefficient.
In contrast to pure fluids, zeotropic mixture refrigerants such as R448A are prone to heat transfer degradation in both nucleate boiling and convective boiling (Zhang [20], Xu [21], and Shah [22]). During nucleate boiling, the more volatile components evaporate first, which resulted in vapor bubbles rich in the more volatile components, while the bulk liquid has a higher concentration of the less volatiles components. The high composition of more volatile components inside the bulk liquid increased the bubble point, and decreased the effective level of superheat, which suppressed the bubble nucleation. In addition, the more volatile components within the bulk liquid need to diffuse through the near interface region, accumulated by the more volatile components, to be able to evaporate. This mass transfer resistance further decreased the heat transfer during both nucleate and convective boiling. However, this effect is less present in the case of convective boiling. The higher the temperature glide, the more severe the mass transfer resistance effect on heat transfer.
It can be inferred from the previous characteristics that the correlations which were originally developed from single component flow boiling data become physically invalid when predicting the flow boiling heat transfer of zeotropic mixtures. Therefore, Shah [22] proposed a simple method of correcting classical heat transfer correlation to ensure its suitability for the prediction of multi-component flow boiling. Considering a classical and general type of flow boiling correlation using hybrid asymptotic/superposition model with the functional form of h m i x = [ ( S h n b ) n + ( E h c b ) n ] 1 / n   , Shah [22] applied two correction terms to account for the effect of mass transfer resistance.
h m i x = [ ( F T S S h p o o l ) n + ( 1 E h l + Y h v ) n ] 1 / n
The nucleate boiling was modified by adding the Thome–Shakir [23] analytical factor of mass transfer resistance during bubble nucleation, as follows:
F T S = ( 1 + h p o o l Δ T g l i d e q i n t [ 1 exp ( B q i n t ρ l Δ i l v β l ) ] ) 1
A modification of the Bell–Ghaly [24] analysis was considered to evaluate the convective boiling contribution to account for the effect of mass transfer resistance at the interface. The Bell–Ghaly model was originally proposed for flow condensation. However, this model is applicable to flow boiling because of the physical similarity of between convective boiling and condensation. Y is the ratio of the vapor sensible heat flow rate to the total flow rate and is calculated as:
Y x C p v T g l i d e Δ i l v
The remaining terms, heat transfer coefficient for pool boiling (hpool) and convective boiling (hl), were calculated by well-regarded correlations of Cooper [25] and Dittius-Boelter [26]:
h p o o l = 55 M 0.5 q i n t 0.67 P r e d u c e d 0.12 ( l o g 10 P r e d u c e d ) 0.55
h l = 0.023 R e l 0.8 P r l 0.4 k l d h
The heat transfer coefficient was compared with that obtained using three heat transfer models developed using single component data, but modified according to Shah [16]’s model: Liu-Winterton [27], Bertsh [28], and Steiner and Taborek [29]. The performance of these correlations was evaluated using mean absolute deviation (MAD) and mean sign deviation (MSD), which are expressed as follows.
MAD = 100 % i n | y e x p y c o r r | x e x p
MSD = 100 % i n y e x p y c o r r y e x p
The results are listed in Table 5. Evidently, the three models do not provide a satisfactory prediction. Therefore, a simple correlation was proposed using the method of Shah (Equation (17)).
A simplified analysis was performed by assuming the exponential (n) and nucleate boiling suppression factor (S in Equation (17)) as 1. The simplified enhancement factor can be calculated as:
E s i m = ( 1 h e x p F T S h p o o l Y h v ) 1 / h l
As is evident from Figure 7a, the simplified enhancement factor can be optimally correlated using the Lockhart–Martinelli parameter (Xtt) as the data points clustered near E s i m = a / X t t b line (red line). A strong dependence of the ratio of heat transfer coefficient on the liquid heat transfer coefficient against the Lockhart–Martinelli parameter (Xtt) was also reported by Li [10] and Berto [11].
The optimized value can be obtained by curvefitting the superposition coefficient (n) and enhancement factor coefficients (a and b) together with the experimental heat transfer coefficient data. The pool boiling and convective boiling heat transfer coefficient and other dimensionless numbers can be readily calculated from the experimental conditions. Finally, a simplified correlation was proposed.
E = 3.3461 / X t t 0.526
X t t = ( μ l μ v ) 0.1 ( ρ v ρ l ) 0.5   ( 1 x x ) 0.9
h m i x = [ ( F T S h n b ) 1.7 + ( 1 E h l + Y h v ) 1.7 ] 1 1.7
The remaining term is similar to that of the Shah model.
The correlation provided a satisfactory prediction with a mean absolute deviation of 13.7% and mean signed deviation of 2.4%. The present correlation is best recommended for the calculation of R448A flow boiling heat transfer coefficient working in conditions studied in the current work (summarized in Table 1 and Table 2).

3.3. Pressure Drop

The effect of mass flux and heat flux on the frictional pressure gradient of R448A inside multiport mini-channel tube is shown in Figure 8.
The pressure drop significantly increased with an increase in the mass flux and vapor quality, as shown in Figure 8a. Mass flux played a similar role toward pressure drop like heat transfer coefficient. The mass flux increased the initial pressure gradient (baseline) at low quality and the slope of pressure gradient increased with an increase in the quality. The similar result was also reported by Chien et al. [19] and Kaew-On et al. [30] in their experimental investigations of flow boiling within multi-ports mini-channel tube. An increase in the mass flux increased the Reynolds number, which enhanced the turbulent shear stress and increased the pressure gradient at low quality flow.
The transitional quality threshold toward annular flow regime decreased with an increase in the mass flux, which resulted in the annular flow as the dominant flow pattern. In addition, the relative liquid/vapor velocity increased with an increase in the mass flux, which led to the increase in the interfacial shear stress. The combined effect of turbulent shear stress and interfacial shear stress increased the pressure drop. However, as can be observed in Figure 8b, the heat flux had almost no noticeable effect on the pressure drop, because the heat flux does not have an explicit effect on the interfacial and turbulent shear stresses. Again, both Chien et al. [19] and Kaew-On et al. [30] reported the independency of frictional pressure drop with heat flux.
Figure 9a depicts the effect of saturated temperature on pressure drop, while Figure 9b compares the pressure drop between R410A and R448A data.
A slight decrease in the pressure drop was observed with an increase in the saturated temperature. However, this effect was insignificant. Usually, a decrease in the saturated temperature increases the density ratio, which increases the interfacial shear stress and pressure drop. However, the difference was negligible because the increase in the density ratio was minor as the temperature difference was only 3 K. Arcasi et al. [18] also reported an increase of the frictional pressure drop with an increase of saturation pressure. They also attributed the effect of density ratio to this observation.
Figure 8b depicts a comparison between the pressure drop of R410A and R448A. The pressure drop of R410A is approximately similar to that of R448A under low quality. However, the pressure drop of R448A began to exceed that of R410A with an increase in the vapor quality. The pressure drop was mainly driven by the effect of wall shear stress at low mass flux and the liquid phase frictional pressure gradient of R448A and R410A (calculated using the classical Blasius equation) had a similar magnitude (approximately 1.9–2 kPa/m at 300 kg/(m2s) and 4.7–4.8 kPa/m at 500 kg/(m2s)) for both refrigerants. This was observed because R410A had a slightly higher liquid velocity due to its lower liquid density, while R448A has a slightly higher liquid viscosity. However, the effect of interfacial shear stress became dominant with an increase in the mass flux. The frictional pressure gradient of R448A gradually exceeded R410A due to the higher liquid vapor density ratio of R448A, which produced stronger interfacial shear stress. It is speculated that a further increase in the vapor quality caused the transition of the flow of R410A from annular flow to mist flow. Therefore, the effect of interfacial shear was reduced due to the gradual disintegration of the liquid film. Conversely, R448A had a larger surface tension, which enabled the liquid film to remain intact. In addition, the mass transfer resistance of R448A as a zoetrope delayed the occurrence of partial dry-out, which allowed the interfacial shear stress to persist. Therefore, the friction pressure gradient of R448A continued increasing, whereas the friction pressure gradient of R410A’s flattened out with a slight decrease as approaching single-phase vapor state.

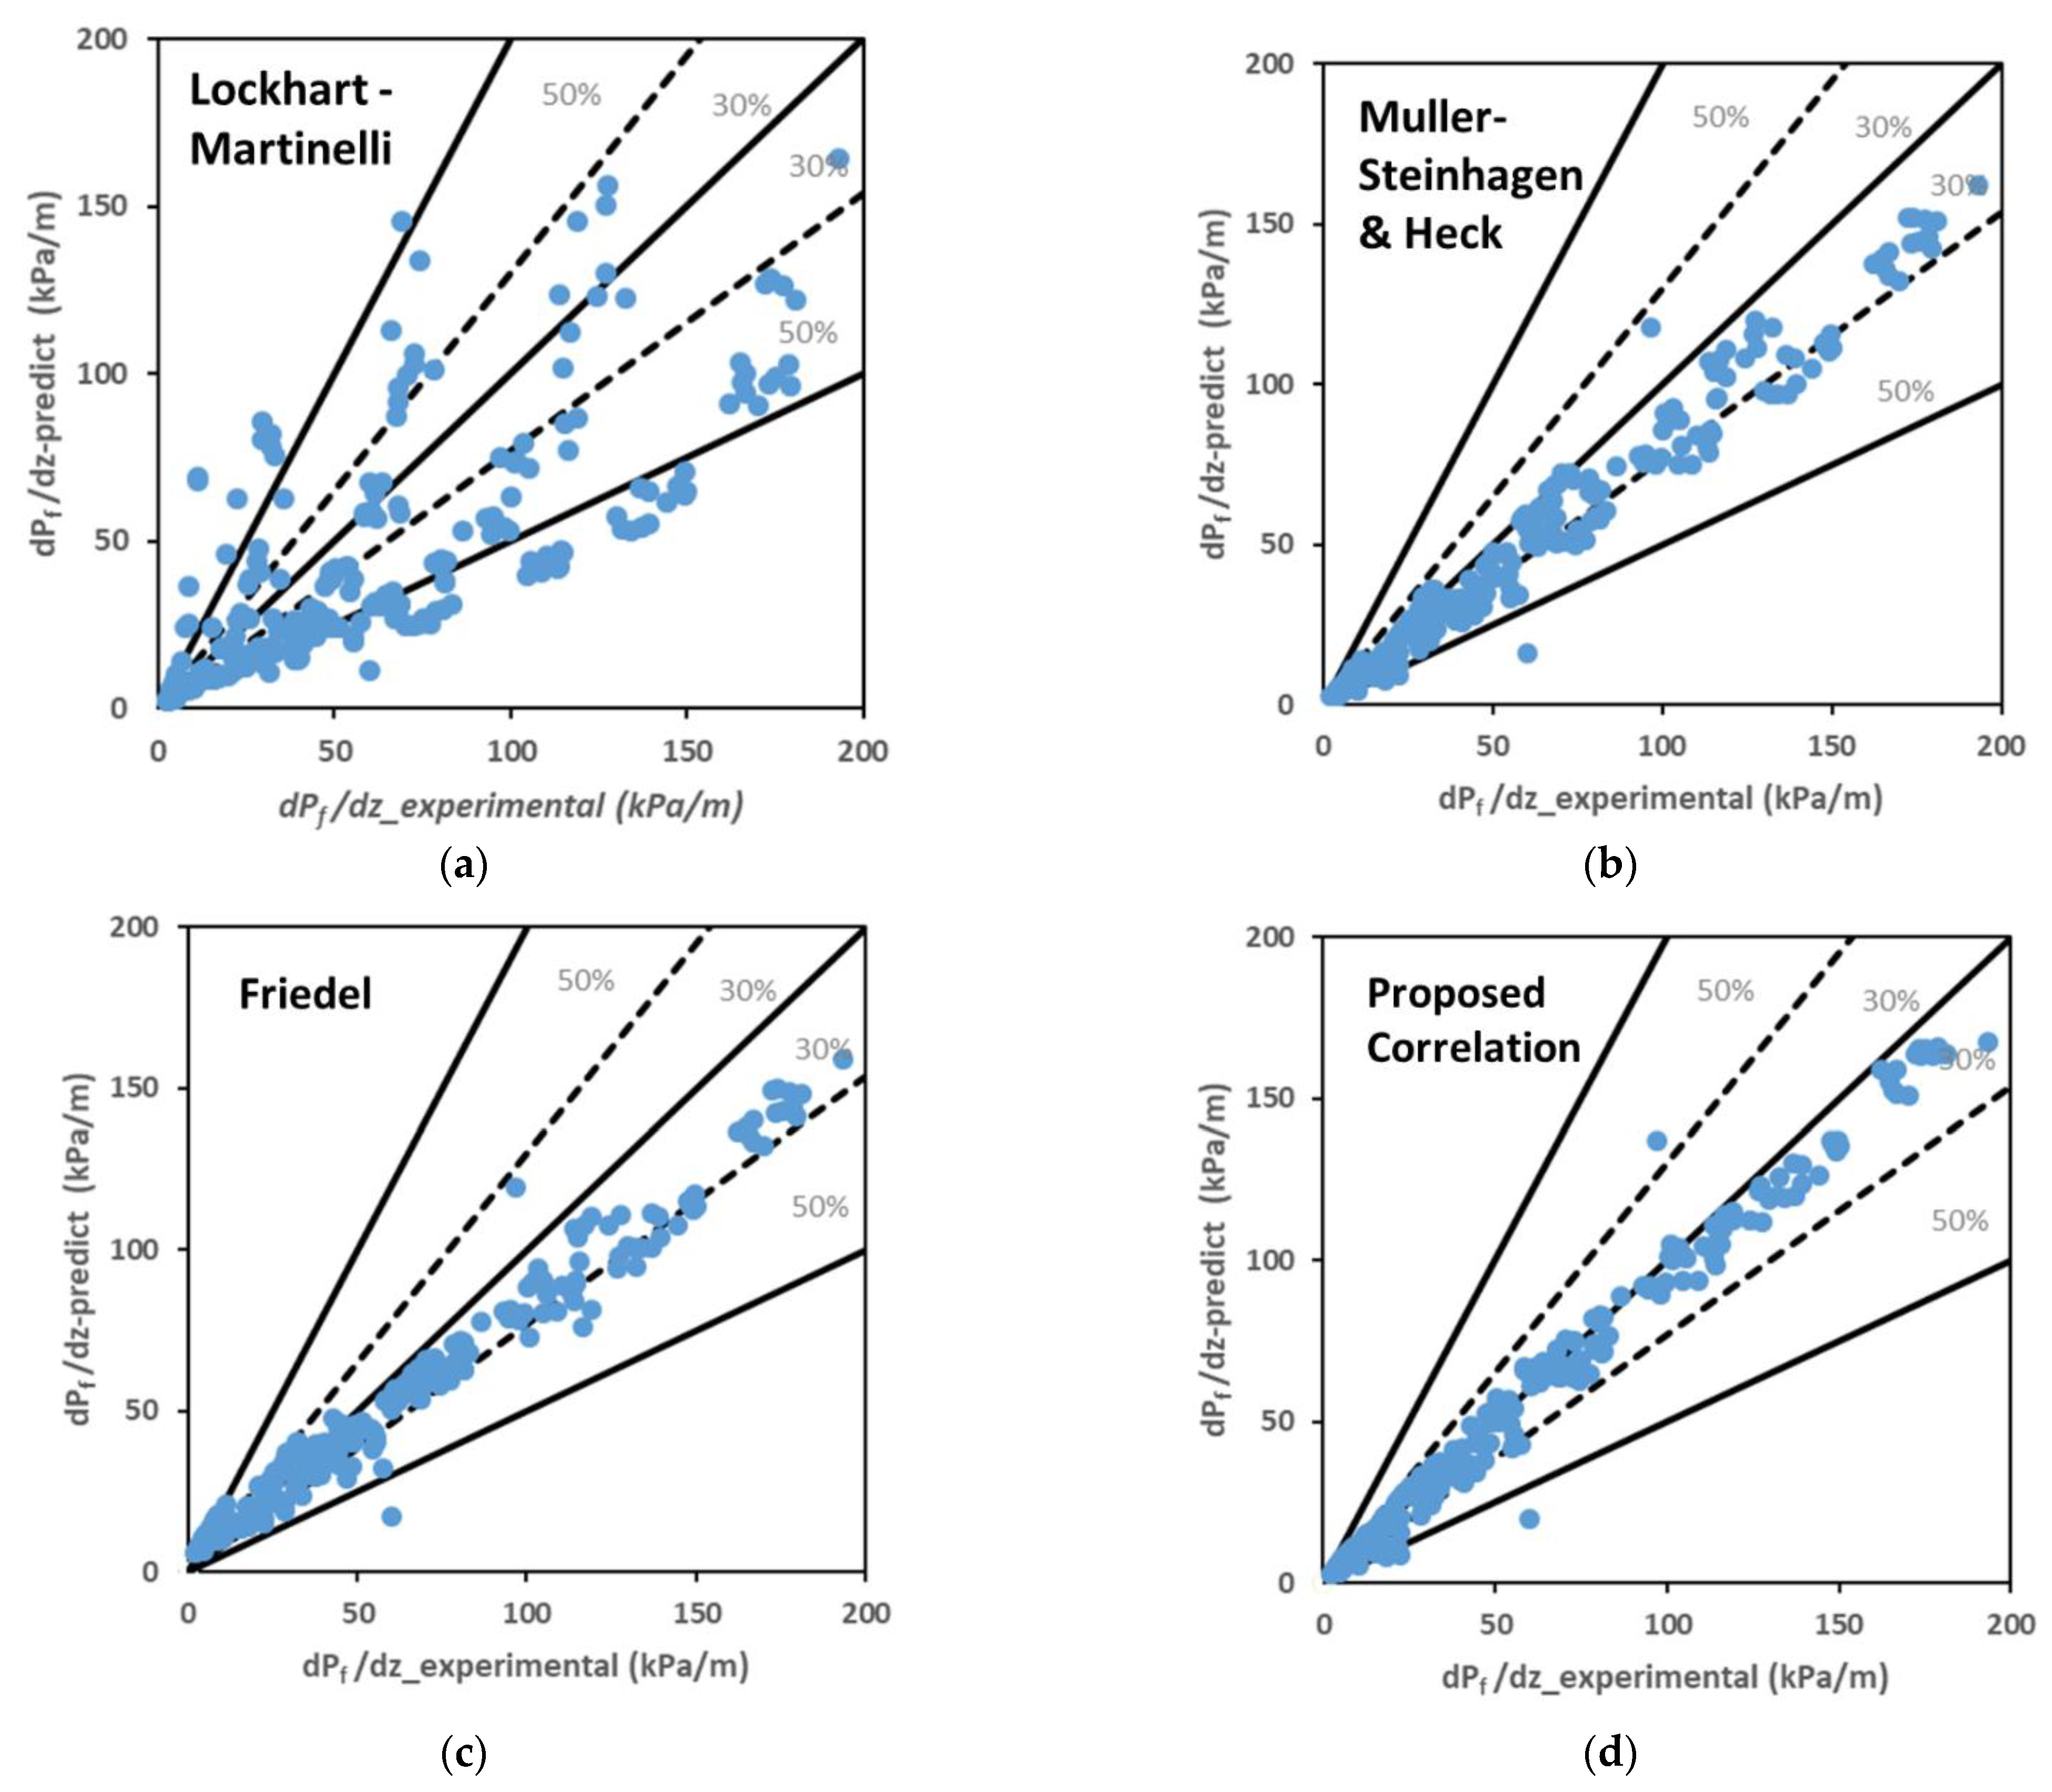
3.4. Pressure Drop Correlation

In contrast to the correlations for heat transfer coefficient, the pressure drop correlations originally developed for pure fluid are physically valid when applied for a mixture. In this study, three correlations provided by Lockhart–Martinelli [31], Muller–Steinhagen and Heck [32], and Friedel [33] were tested against the experimental data. The evaluation was performed using MAD and MSD similar to that of heat transfer coefficient as shown in Table 6. The performance of the Lockhart–Martinelli correlation was poor, whereas the Muller–Steinhagen and Heck and Friedel correlations were able to make decent predictions against the present experimental data. The results obtained using Muller–Steinhagen and Heck correlation were slightly more accurate than those obtained using the Friedel correlation. However, a Muller–Steinhagen and Heck correlation with a slightly modified empirical coefficient correlation was proposed to further improve the predictive capacity.
d p f d z = C ( 1 x ) 1 / 2 + B x 2
C = A + 2.5 ( B A ) x
A = ( d p d z ) l o , B = ( d p d z ) f o , ( d p d z ) i o = 2 f i o G 2 d h ρ i
f i o = { 0.0791 R e i o 0.25   f o r   R e i o > 2000 16 R e i o 1 f o r   R e i o < 2000
R e i o = G d h μ i w i t h   i = l   o r   v
Figure 10 show the performance of different pressure gradient correlation against the experimental data. As shown, the slightly modified Muller–Steinhagen and Heck correlations achieved the best predictive accuracy among the three correlations.

4. Conclusions

In this study, the heat transfer coefficient and pressure drop characteristics of R448A were experimentally studied and compared with those of R410A. The main conclusions can be summarized as follows:
-
The heat transfer coefficient generally increased with an increase in the mass flux, whereas the relationships between the heat transfer coefficient and vapor quality, and heat flux and saturated temperature were dependent on the specific mass flux condition. The heat transfer coefficient increased with an increase in the heat flux at lower mass flux. However, the effect of heat flux reduced under high mass flux conditions owing to the suppression of nucleate boiling. The heat transfer coefficient increased with an increase in the quality at a higher mass flux and lower saturated temperature. A decrease in the saturated temperature increased the heat transfer coefficient at high mass flux. However, it exhibited a weaker effect at low mass flux. Both the number of channels inside the multiport tubes and hydraulic diameter are important to the heat transfer coefficient of the tube. The multi-ports number, when small, increases with heat transfer coefficient at low heat flux, mass flux condition especially at high-quality regions. However, this effect is unimportant in high heat flux, mass flux condition.
-
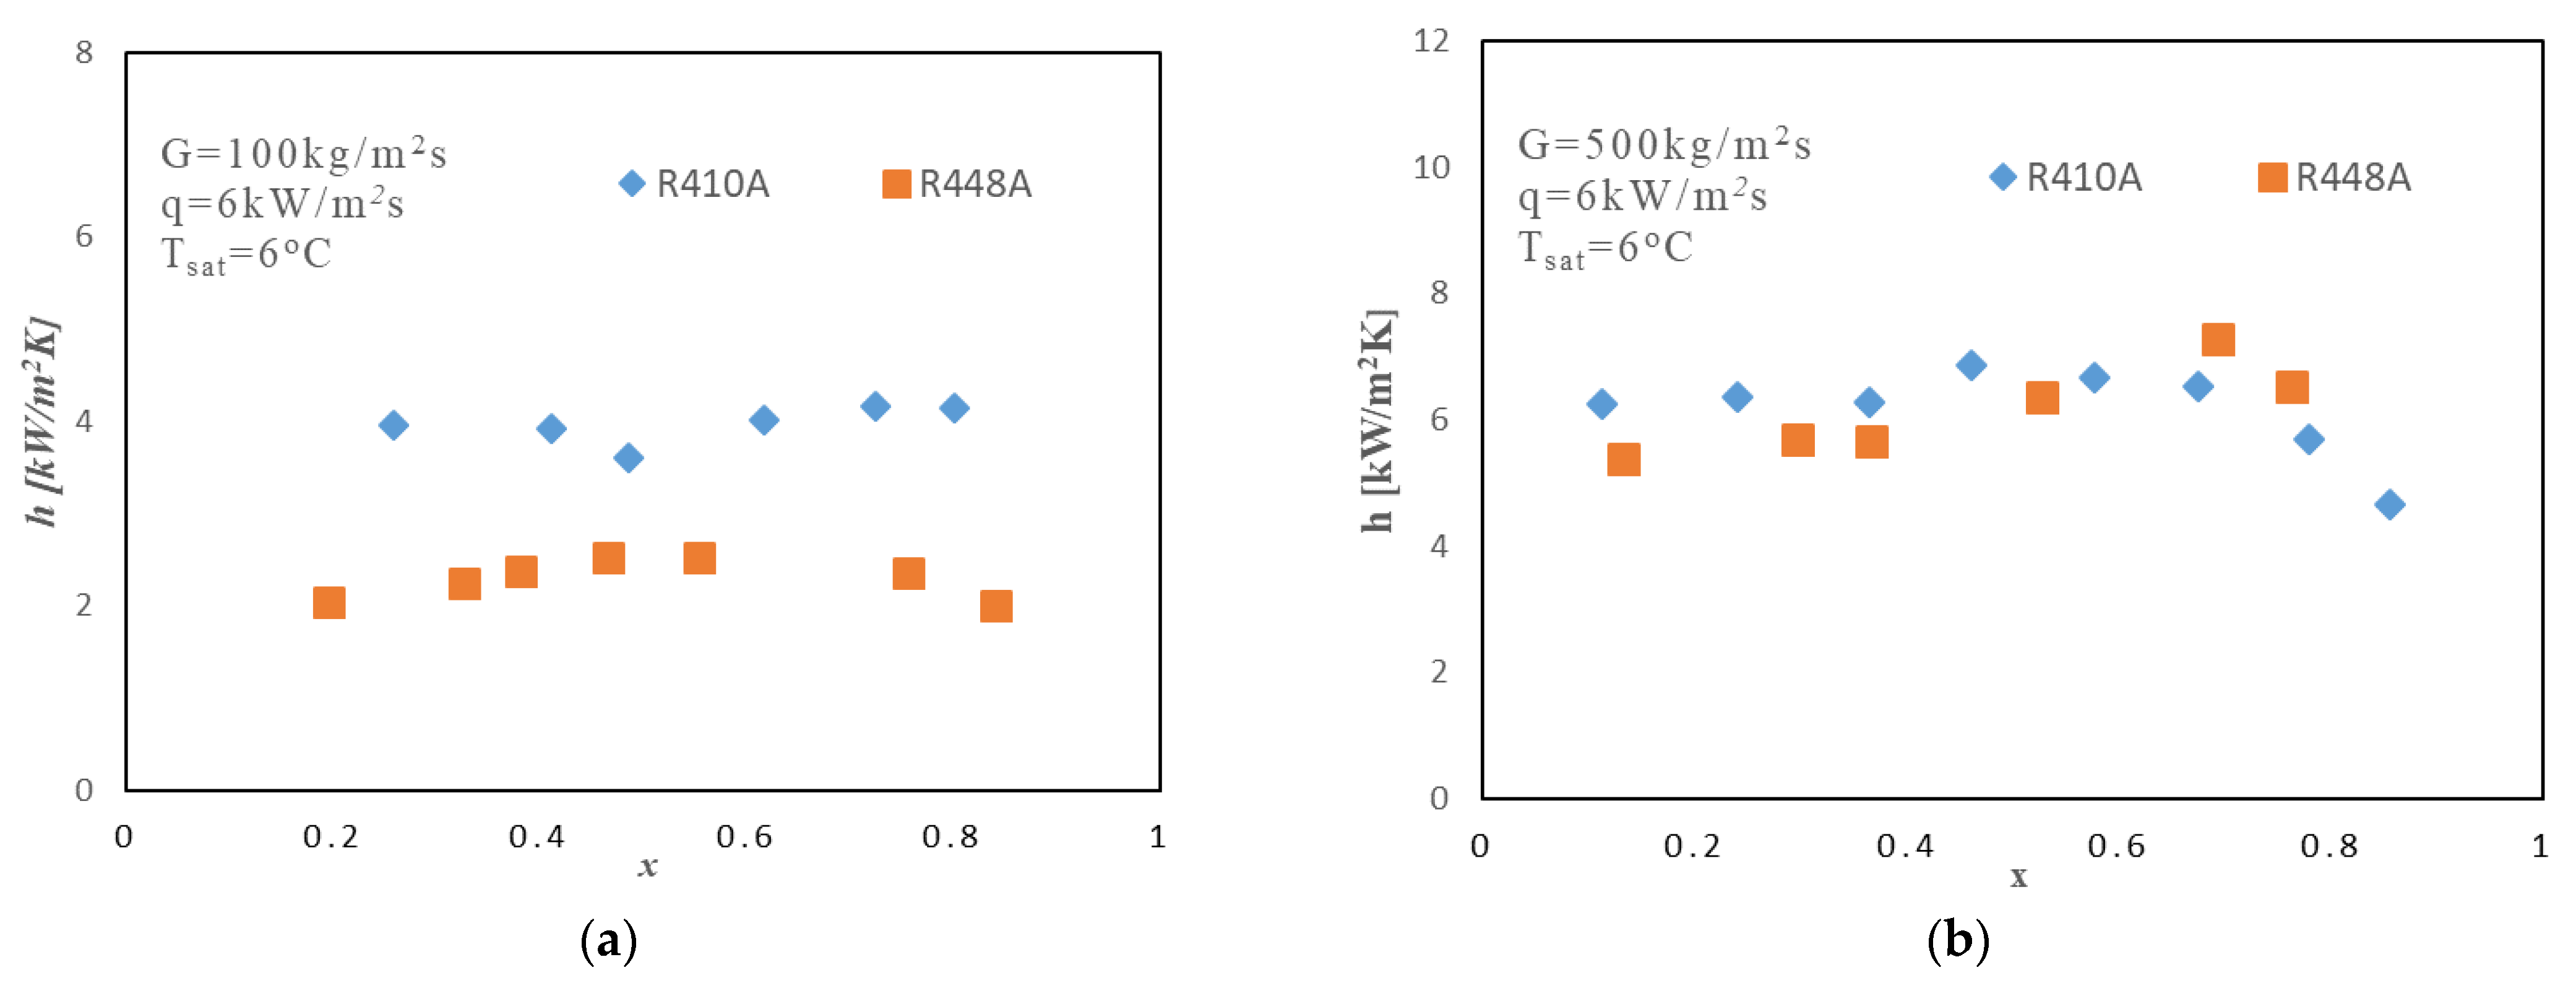
The heat transfer coefficient of R448A was significantly lower than that of R410A at low mass flux flow but of a similar order of magnitude at high mass flux flow.
-
The frictional pressure drop increased with an increase in the mass flux and vapor quality, whereas the heat flux remained unaffected by the pressure drop. Additionally, the increase in the pressure drop with a decrease in the saturated temperature was insignificant. The frictional pressure drop of R448A was in similar order of magnitude compared to that of R410A in lower quality region. However, it exceeded the pressure drop of R410A in the high-quality region.
-
The heat transfer coefficient and pressure drop correlations were proposed using experimental data of R448A in multiport mini-channel tube.

Author Contributions

Conceptualization, J.T.O.; formal analysis, H.N.H.; investigation, H.N.H. and N.A; resources, J.T.O.; data curation, H.N.H.; writing—original draft preparation, H.N.H.; writing—review and editing, H.N.H., N.A. and J.T.O.; visualization, H.N.H. and N.A.; supervision, J.T.O.; project administration, J.T.O.; funding acquisition, J.T.O. All authors have read and agreed to the published version of the manuscript.

Funding

This work supported by the National Research Foundation of Korea (NRF) grant funded by the Korea government (MSIT) (No. NRF-2020R1A2C1010902).

Institutional Review Board Statement

Not applicable.

Informed Consent Statement

Not applicable.

Data Availability Statement

Not applicable.

Acknowledgments

The author would like to thank Pham Quang Vu for technical advises during the study.

Conflicts of Interest

The authors declare no conflict of interest.

Nomenclature

AAream2
BScaling factor (assumed to be 1)
CpvVapor phase specific heatkJ/(kg·K)
dhHydraulic diameter m
EEnhancement factor
fFriction factor
FTSThome-Shakir factor
GMass fluxkg/(m2.s)
hHeat transfer coefficientkW/(m2K)
iEnthalpykJ/kg
ilvLatent heatkJ/kg
kThermal ConductivitykW/(m.K)
mMass flow ratekg/s
MMolar masskg/kmol
MAEMean Average Deviation(%)
MSDMean Signed Deviation(%)
nNumber of repeated measurement per session (599–600)
PPressurekPa
PrPrandtl number (cpµ/κ)
PrReduced pressure
PreducedReduced pressure(P/Pcrit)
ptubeTube perimeterm
qHeat fluxkW/m2
qMeasurement (in Section 2.3)
ReReynolds number (Gdh/µ)
sStandard deviation
SSuppression factor
TTemperature(C
uUncertainty
vVelocitym/s
xVapor quality
XttLockhart-Martinelli parameter
YBell-Ghaly term
yVariable (pressure gradient or heat transfer coefficient)
zDistance from the inletm
Greek
αVoid fraction
βLiquid mass transfer coefficient (=0.0003)m/s
Difference
μViscosityN.s/m
ρ Densitykg/m3
Subscripts
cbconvective boiling
io (i = l, v)Liquid only/Vapor only
corrpredicted by correlation
expExperimental
extExternal
glideGlide (temperature)
inInlet
intInternal
lLiquid
nbNucleate boiling
outOutlet
poolPool boiling
refRefrigerant
satSaturated
vVapor
waterWater

References

  1. Mota-Babiloni, A.; Navarro-Esbrí, J.; Peris, B.; Moles, F.; Verdú, G. Experimental evaluation of R448A as R404A lower-GWP alternative in refrigeration systems. Energy Convers. Manag. 2015, 105, 756–762. [Google Scholar] [CrossRef] [Green Version]
  2. Sethi, A.; Pottker, G.; Motta, S.Y. Experimental evaluation and field trial of low global warming potential R404A replacements for commercial refrigeration. Sci. Technol. Built Environ. 2016, 22, 1175–1184. [Google Scholar] [CrossRef]
  3. Deng, Q.; Zhang, Z.; Hu, X. Thermoeconomic and environmental analysis of an inverter cold storage unit charged R448A. Sustain. Energy Technol. Assess. 2021, 45, 101159. [Google Scholar] [CrossRef]
  4. Mota-Babiloni, A.; Navarro-Esbrí, J.; Barragán, Á.; Moles, F.; Peris, B. Theoretical comparison of low GWP alternatives for different refrigeration configurations taking R404A as baseline. Int. J. Refrig. 2014, 44, 81–90. [Google Scholar] [CrossRef]
  5. Lillo, G.; Mastrullo, R.; Mauro, A.; Pelella, F.; Viscito, L. Experimental thermal and hydraulic characterization of R448A and comparison with R404A during flow boiling. Appl. Therm. Eng. 2019, 161, 1141–1146. [Google Scholar] [CrossRef]
  6. Kedzierski, M.A.; Kang, D. Horizontal convective boiling of R448A, R449A, and R452B within a micro-fin tube. Sci. Technol. Built Environ. 2016, 22, 1090–1103. [Google Scholar] [CrossRef]
  7. Kim, C.-H.; Kim, N.-H. Evaporation heat transfer and pressure drop of the interim (R-448A, R-449A) and long term (R-455A, R-454C) low GWP R-404A alternative refrigerants in a smooth tube. Int. J. Heat Mass Transf. 2021, 181, 121903. [Google Scholar] [CrossRef]
  8. Kim, C.-H.; Kim, N.-H. Evaporation heat transfer and pressure drop of low GWP R-404A alternative refrigerants in a multiport tube. Int. J. Heat Mass Transf. 2022, 184, 122386. [Google Scholar] [CrossRef]
  9. Li, M.; Dang, C.; Hihara, E. Flow boiling heat transfer of HFO1234yf and R32 refrigerant mixtures in a smooth horizontal tube: Part I. Experimental investigation. Int. J. Heat Mass Transf. 2012, 55, 3437–3446. [Google Scholar] [CrossRef]
  10. Berto, A.; Azzolin, M.; Bortolin, S.; Guzzardi, C.; Del Col, D. Measurements and modelling of R455A and R452B flow boiling heat transfer inside channels. Int. J. Refrig. 2020, 120, 271–284. [Google Scholar] [CrossRef]
  11. Jige, D.; Kikuchi, S.; Mikajiri, N.; Inoue, N. Flow boiling heat transfer of zeotropic mixture R1234yf/R32 inside a horizontal multiport tube. Int. J. Refrig. 2020, 119, 390–400. [Google Scholar] [CrossRef]
  12. Zivi, S.M. Estimation of steady-state steam void-fraction by means of the principle of minimum entropy production. J. Heat Transfer. 1964, 86, 247–252. [Google Scholar] [CrossRef]
  13. Moffat, R.J. Describing the uncertainties in experimental results. Exp. Therm. Fluid Sci. 1988, 1, 3–17. [Google Scholar] [CrossRef] [Green Version]
  14. Toninelli, P.; Bortolin, S.; Azzolin, M.; Del Col, D. Visualization and Numerical Simulations of Condensing Flow in Small Diameter Channels. Heat Transf. Eng. 2019, 40, 802–817. [Google Scholar] [CrossRef]
  15. Wojtan, L.; Ursenbacher, T.; Thome, J.R. Investigation of flow boiling in horizontal tubes: Part I—A new diabatic two-phase flow pattern map. Int. J. Heat Mass Transf. 2005, 48, 2955–2969. [Google Scholar] [CrossRef]
  16. Revellin, R.; Thome, J.R. A new type of diabatic flow pattern map for boiling heat transfer in microchannels. J. Micromech. Microeng. 2007, 17, 788–796. [Google Scholar] [CrossRef]
  17. Azzolin, M.; Bortolin, S.; Del Col, D. Flow boiling heat transfer of a zeotropic binary mixture of new refrigerants inside a single microchannel. Int. J. Therm. Sci. 2016, 110, 83–95. [Google Scholar] [CrossRef]
  18. Arcasi, A.; Mauro, A.; Napoli, G.; Viscito, L. Heat transfer coefficient, pressure drop and dry-out vapor quality of R454C. Flow boiling experiments and assessment of methods. Int. J. Heat Mass Transf. 2022, 188, 122599. [Google Scholar] [CrossRef]
  19. Chien, N.B.; Choi, K.-I.; Oh, J.-T.; Cho, H. An experimental investigation of flow boiling heat transfer coefficient and pressure drop of R410A in various minichannel multiport tubes. Int. J. Heat Mass Transf. 2018, 127, 675–686. [Google Scholar] [CrossRef]
  20. Zhang, J.; Mondejar, M.E.; Haglind, F. General heat transfer correlations for flow boiling of zeotropic mixtures in horizontal plain tubes. Appl. Therm. Eng. 2019, 150, 824–839. [Google Scholar] [CrossRef]
  21. Xu, J.; Wang, Y.; Yang, R.; Liu, W.; Wu, H.; Ding, Y.; Li, Y. A review of boiling heat transfer characteristics in binary mixtures. Int. J. Heat Mass Transf. 2021, 164, 120570. [Google Scholar] [CrossRef]
  22. Shah, M.M. A method for predicting heat transfer during boiling of mixtures in plain tubes. Appl. Therm. Eng. 2015, 89, 812–821. [Google Scholar] [CrossRef]
  23. Thome, J.R.; Shakir, S. New correlation for nucleate pool boiling of aqueous mixtures. In Heat Transfer: Pittsburgh; AIChE Symposium Series; American Institute of Chemical Engineers: New York, NY, USA, 1987; Volume 83, pp. 46–51. [Google Scholar]
  24. Bell, K.; Ghaly, A.M. An approximate generalized design method for multi-component/partial condenser. AIChE Symp. Ser. 1973, 69, 72–79. [Google Scholar]
  25. Cooper, M.G. Heat flow rates in saturated nucleate pool boiling-A wide-ranging examination using reduced properties. In Advances in Heat Transfer; Hartnett, J.P., Irvine, T.F., Eds.; Elsevier: Amsterdam, The Netherlands, 1984; Volume 16, pp. 157–239. [Google Scholar]
  26. Dittus, F.W.; Boelter, L.M.K. Heat transfer in automobile radiators of the tubular type. Univ. Calif. Publ. Eng. 1930, 2, 443–461. [Google Scholar] [CrossRef]
  27. Liu, Z.; Winterton, R.H.S. A general correlateon for saturated and subcooled flow boiling in tubes and annuli, based on a nucleate pool boiling equation. Int. J. Heat Mass Transfer. 1991, 34, 2759–2766. [Google Scholar] [CrossRef]
  28. Bertsch, S.S.; Groll, E.A.; Garimella, S.V. A composite heat transfer correlation for saturated flow boiling in small channels. Int. J. Heat Mass Transf. 2009, 52, 2110–2118. [Google Scholar] [CrossRef] [Green Version]
  29. Steiner, D.; Taborek, J. Flow Boiling Heat Transfer in Vertical Tubes Correlated by an Asymptotic Model. Heat Transf. Eng. 1992, 13, 43–69. [Google Scholar] [CrossRef]
  30. Kaew-On, J.; Sakamatapan, K.; Wongwises, S. Flow boiling pressure drop of R134a in the counter flow multiport minichannel heat exchangers. Exp. Therm. Fluid Sci. 2012, 36, 107–117. [Google Scholar] [CrossRef]
  31. Lockhart, R.W.; Martinelli, R.C. Proposed correlation of data for isothermal two-phase, two-component flow in pipes. Chem. Eng. Proc. 1949, 45, 39–48. [Google Scholar]
  32. Müller-Steinhagen, H.; Heck, K. A simple friction pressure drop correlation for two-phase flow in pipes. Chem. Eng. Process. Process Intensif. 1986, 20, 297–308. [Google Scholar] [CrossRef]
  33. Friedel, L. Improved friction pressure drop correlation for horizontal and vertical two-phase pipe flow. In Proceedings of the European Two-Phase Flow Group Meeting, Ispra, Italy, June 1979. [Google Scholar]
Figure 1. Schematic diagram of the experimental system.
Energies 15 04331 g001
Figure 2. (a) Thermocouple attachment positions, (b) Test section layout.
Energies 15 04331 g002
Figure 3. Effect of mass flux on heat transfer coefficient at (a) Tsat = 3 °C and (b) Tsat = 6 °C.
Energies 15 04331 g003
Figure 4. Effect of heat flux on heat transfer coefficient at (a) G = 200 kg/(m2s) (b) G = 500 kg/(m2s).
Energies 15 04331 g004
Figure 5. Effect of saturated temperature on heat transfer coefficient at (a) low mass flux condition (b) high mass flux condition.
Energies 15 04331 g005
Figure 6. Comparison between the heat transfer coefficient of R448A and R410A under (a) low mass flux condition and (b) high mass flux conditions (b).
Energies 15 04331 g006
Figure 7. (a) Simplified enhancement factor Esim (Equation (24)) plotted against Lockhart–Martinelli parameter. (b) Performance of the proposed correlation.
Energies 15 04331 g007
Figure 8. Effect of (a) mass flux and (b) heat flux on pressure drop.
Energies 15 04331 g008
Figure 9. (a) Effect of saturated temperature on pressure drop and (b) pressure drop comparison between R410A and R448A.
Energies 15 04331 g009
Figure 10. (a) Performance of Lockhart–Martinelli, (b) Muller–Steinhagen and Heck, (c) Friedel, and (d) proposed modified Muller–Steinhagen and Heck correlations.
Energies 15 04331 g010
Table 1. Geometrical configuration of the tube.
H (mm)W (mm)dh (mm)β = W/HnD (mm)L (m)
1.420.70.9690.49390.340.2
Table 2. Experimental conditions.
RefrigerantVapor QualityHeat Flux
(kW/m2)
Mass Flux
(kg/(m2s))
Saturated Temperature (°C)
R448A0–13–15100–5003 and 6
Table 3. Thermo-physical properties of R448A and R410A.
RefrigerantLiquid Density
(kg/m2)
Vapor Density
(kg/m2)
Liquid Thermal Conductivity
(W/m.K)
Density RatioLiquid Viscosity
(µPa.s)
Vapor Viscosity
(µPa.s)
Surface
Tension
(mN/m)
R448A (3 °C)120325.60.094646.819211.59.7
R448A (6 °C)119128.30.092842.218511.69.32
R410A (6 °C)1145370.0993115411.78.31
Table 4. Measurement instrument uncertainty (type B).
ParameterUncertainty
Temperature (thermocouples)±0.1 K
Temperature (RTD)±0.01 K
Differential pressure±0.1 kPa
Absolute pressure±2.5 kPa
Mass flow rate (water and refrigerant)±0.5%
Table 5. Evaluation of heat transfer coefficient correlation.
CorrelationSteinerBertschLiu-WintertonProposed Correlation
MSD (%)−64.13−34.3−3813.7
MAD (%)64.1339.5−38.32.25
Table 6. Evaluation of heat transfer coefficient correlation.
CorrelationLockhart–MartinelliMuller–Steinhagen and HeckFriedelModified Muller–Steinhagen and Heck
MSD (%)51.119.324.411.6
MAD (%)−12.4−17.3−12.25
Publisher’s Note: MDPI stays neutral with regard to jurisdictional claims in published maps and institutional affiliations.

