Article

Optimal DC Microgrid Operation with Model Predictive Control-Based Voltage-Dependent Demand Response and Optimal Battery Dispatch

1
Department of Electrical and Computer Engineering, University of Michigan-Dearborn, Dearborn, MI 48128, USA
2
Lawrence Berkeley National Laboratory, Berkeley, CA 94720, USA
*
Author to whom correspondence should be addressed.
Energies 2022, 15(6), 2140; https://doi.org/10.3390/en15062140
Submission received: 20 February 2022 / Revised: 10 March 2022 / Accepted: 11 March 2022 / Published: 15 March 2022

Abstract

:
Recently, the integration of optimal battery dispatch and demand response has received much attention in improving DC microgrid operation under uncertainties in the grid-connect condition and distributed generations. However, the majority of prior studies on demand response considered the characteristics of global frequency variable instead of the local voltage for adjusting loads, which has led to obstacles in operating DC microgrids in the context of increasingly rising power electronic loads. Moreover, the consideration of voltage-dependent demand response and optimal battery dispatch has posed challenges for the traditional planning methods, such as stochastic programming, because of nonlinear constraints. Considering these facts, this paper proposes a model predictive control-based integrated voltage-based demand response and batteries’ optimal dispatch operation for minimizing the entire DC microgrid’s operating cost. In the proposed model predictive control approach, the binary decisions about voltage-dependent demand response and charging or discharging status of storage batteries are determined using a deep-Q network-based reinforcement learning method to handle uncertainties in various operating conditions (e.g., AC grid-connect faults and DC sources variations). It also helps to improve the DC microgrid operation efficiency in the two aspects: continuously avoiding load shedding or shifting and reducing the batteries’ charge and discharge cycles to prolong their service life. Finally, the proposed method is validated by comparing to the stochastic programming-based model predictive control method. Simulation results show that the proposed method obtains convergence with approximately 41.95% smaller operating cost than the stochastic optimization-based model predictive control method.

1. Introduction

Recently, DC microgrids (DCMs) have gained considerable attention due to their merits in promoting the development of distributed energy resources (DERs), for example, renewable generation (RG) units and storage batteries (SBs), to obtain economic and environmental effectiveness [1]. However, the increasing penetration of DERs has posed challenges in ensuring DCMs’ steady and efficient operations due to the intermittent nature of DERs [2]. Furthermore, the increasing intensity of extreme weather events, such as heat waves and large storms, has led to uncertain grid-connect conditions and affected DCMs’ resilience during islanding periods [3,4]. For example, Texas, USA, faced a historic winter storm in 2021, which made the power system impassable and left millions without access to electricity from hours to days [5]. These facts have promoted the advanced control and planning methods development in DCMs subject to uncertainties and disruptions.
DCM refers to power clusters in a distribution network that comprises DC loads, RG units, and SBs, which can operate in either grid-connected or island mode upon loss of the normal AC supply [6]. With the significantly increasing demand of DC loads (e.g., electric vehicles, computers, and lighting systems), DCM is preferred over AC microgrid (ACM) due to its benefits, for example, reducing conversion losses, since multiple AC/DC converters are avoided [7], and increasing energy efficiency, as no reactive power flow is used [8]. However, DCM also poses several challenges related to resilience and reliability due to its dependence on RG units, while the AC grid-connect condition is uncertain [9]. In such cases, SBs play a vital role in dealing with uncertainties caused by RG units and in providing power to loads during the islanding period. However, the continuous discharging and charging affect SBs’ efficiency and cycle life, reducing the DCM’s performance in resilience decisions [10].
Demand response (DR) refers to incentive or price-based consumer’s load shedding and shifting actions in adapting to changes in the grid’s operating conditions. The use of DR as the driving force for load reduction enhances the grid’s resilience in emergencies and prolongs the SB’s lifetime [11]. Refs. [12,13] applied DR as an effective method to reduce the sizing of SBs in modern smart grids. Accordingly, DR has resulted in the utility increase for consumers and the cost-based state-of-charge reduction of SBs for smart grids. However, these studies did not consider the characteristics of grid topology, which may affect the effectiveness of voltage-based DR, as shown in [14]. Therefore, there is a difference in the DR programs design for ACMs and DCMs. Specifically, frequency-based DR is used for ACM, while voltage is targeted for DR programs in DCM. This difference makes DR in DCM easier to carry out than in ACM because information of the whole system is not needed for implementing voltage-based DR in DCM. As primary works in this area, Refs. [15,16] took a significant step forward in incorporating the concept of voltage-based DR into the DCM operating optimization context.
Voltage-based DR could improve the resilience of DCM by reducing discharging and charging of the SBs to compensate for voltage shortages caused by fluctuations in solar panels [17]. In references [18,19], voltage-based DR was implemented by using power electronic loads as variable resistors to adjust system demands for enhancing critical load restoration after a crisis. In references [20,21], the integration of SBs and DR programs was applied to maintain the stability of DCMs during the islanding periods. However, their DR framework did not consider the supplied DC bus voltage for adjusting demand loads. However, many loads must be reduced or shifted as the voltage fluctuates, affecting their comfort levels. Voltage-based DR switches offloads only when the DC bus input voltage drops below the load’s rated voltage reference, which avoids excessive load reduction that affects comfort levels. Furthermore, it effectively overcomes a single point of failure from the risk of information congestion in the power system because a DCM could perform localized voltage-based DR.
Considering voltage-based DR to enhance the resilience of DCMs is a nonlinear optimization problem due to the presence of various uncertainties. Therefore, several approaches were proposed in the literature to handle this issue (see Table 1). Compared to traditional uncertain programming methods, such as stochastic model [22], optimization model [15,20], simulation model [16,17,21], and branch and bound model [18,19], the model predictive control (MPC) method shows outstanding performance for making a sequence decision with high degrees of uncertainty [23]. Further, the MPC effectively reduces the predicted errors by considering uncertainties in both the current and previous times [24]. Some recent research works [25,26,27,28] formulated the DCM optimization problem subject to resilience constraints in the MPC approach. Nevertheless, these models focused on optimizing the discharging and charging of the SBs, while the voltage-based DR is not considered.
Table 1 presents a summary of previously published papers on DCM-related studies. Based on a thorough review of these studies, the following research gaps were identified: (i) There are limited attempts to consider simultaneously the voltage-dependent DR and the optimal dispatching of SBs in DCM optimization-related studies. This integration is important to facilitate the widespread implementation of power electronic loads and transform electronic devices in modern grids. (ii) The modeling of the DCM with SBs and voltage-based DR may considerably increase the complexity of the optimization model due to the presence of nonlinear functions. Therefore, novel approaches, such as an MPC model and a deep learning solution, can be used to provide solutions more effectively and tractably. However, Table 1 shows a scarcity of studies that apply the deep-learning-based MPC approach in this field.
Considering these above facts, a deep-learning-based MPC strategy is developed in this paper to enhance the resilience of DCMs subject to uncertainties in grid-connect conditions and DERs. First, voltage-based DR is conducted to switch off low-priority loads based on the predicted input voltage results from the MPC model. After that, optimal economic dispatching from SBs is injected into the DCM to regulate voltage. This study distinguishes itself from previous studies in the following ways:
(i)
This paper proposes an integrated scheduling framework of voltage-based DR and SBs to enhance the DCM’s resilience based on the MPC method. The proposed framework considers voltage-based DR based on various operating conditions, such as variations of DC supply sources and grid AC faults, to avoid switching loads on and off continually to improve efficiency. Furthermore, it also reduces the charge and discharge cycles of the SBs, prolonging their service life.
(ii)
This paper applies the MPC approach to predict the input voltage of the DC bus based on the output current from the AC grid and DC supply sources. To train the behavior of the model in reacting to the DC bus voltage fluctuations under uncertain-ties in DERs and AC grid, a deep-Q network (DQN)-based reinforcement learning (RL) approach is proposed. The proposed algorithm is effective for making sequential decisions, an ability which the classical-model-based approaches (e.g., stochastic programing [26] and simulation approach [25,27]) do not possess.
The remainder of this paper is organized as follows. The problem definition and proposed control strategy are presented in Section 2. The proposed DQN-based MPC approach for the DCM scheduling is described in Section 3. Simulation results for a real case study are presented in Section 4. A conclusion is drawn in Section 5.

2. System Modeling

The considered DCM is a basic structure, as shown in Figure 1. It consists of the AC grid; the DC supply sources, including an SB system and DERs (solar panel and wind turbine); and the AC and DC consumption loads. In addition, the transform devices, such as converters and inverters, help to take the desired DC bus voltage levels from the AC/DC supply sources.
From Figure 1, the DC input voltage may be affected by three main problems: (1) intermittent power from DERs and SBs, (2) uncertainties in AC/DC loads, and (3) power exchange fluctuations between the AC gird and the DCM. Considering these uncertainties, the following sections present the optimization model integrating voltage-based DR and SB’s scheduling to enhance the DCM resilience during the islanding periods or periods of less generation supply.

2.1. Predicted Input Voltage of DC Bus

Equation (1) shows the DC bus voltage transient stage over time slot t ; it depends on the output current from the main grid IG(t), solar panel IS(t), and wind turbine IW(t); discharging I E d i s ( t ) and charging I E c h ( t ) of SBs; and the total required current to the loads I L ( t ) , where B d c is the DC bus capacitance [27,28]. It should be noted that the instantaneous DC bus voltage can be calculated by taking the integral of Equation (1) with the step time t of 15 min in this study. According to that, if the planning time is one day (24 h), t will obtain values from [0; 96], because there are 96 time slots t for one-day planning, with the duration of 15 min. The model formulation for these above components is presented in the following sections.
d U d c ( t ) = I G ( t ) + I S ( t ) + I W ( t ) + I E d i s ( t ) I E c h ( t ) I L ( t ) B d c d t

2.1.1. Output Current from the Main Grid IG(t)

The output current from the main grid has the relationship with the power provided by the main grid by bus i at time t, as shown in Equation (2), in which PG(t) is total power provided by the main grid at time t, and V G ( t ) denotes the output voltage of the main grid.
I G ( t ) = P G ( t ) V G ( t )
Extreme weather events make the grid-connect conditions of the DC microgrid at bus i uncertain. In addition, the main grid is an AC grid; thus, it connects with the DC microgrid by applying a bidirectional converter, resulting in power losses. Considering these facts, the value of PG(t) is uncertain following time t, which is formulated as
P G ( t ) = P G m a x δ G ( t ) η A C
where P G m a x denotes the maximum power provided by the main grid; δ G ( t ) follows a Gaussian distribution [29] to denote the uncertain grid-connect condition at time t. The main grid can deliver maximum power at δ G ( t ) = 1. Otherwise, the provided power from the AC main grid equals zero in an extreme event at δ G ( t ) = 0. Finally, η A C denotes the AC–DC converter efficiency.

2.1.2. Output Current from the Photovoltaics IP(t)

In Equation (4), the output current from the photovoltaics is a ratio between the power generated by the solar panels by bus i at time t PS(t). V S ( t ) is the output voltage of the solar panels system.
I S ( t ) = P S ( t ) V S ( t )
The output of the photovoltaics is characterized by the intermittent nature due to its dependence on the local weather conditions. Thus, PS(t) is an uncertainty parameter, as
P S ( t ) = P S m a x δ S ( t )
where P S m a x denotes the designed capacity of photovoltaics and δ S ( t ) is a continuous random variable in the range [0, 1] to denote the intermittent nature of the solar power at time t. Since photovoltaics are DC supply sources, there are thus no power losses in the DC microgrid.

2.1.3. Output Current from the Wind Power IW(t)

In Equation (6), the output current from the wind turbines is a ratio between the power generated by the wind turbines by bus i at time t PW(t) and its output voltage V W ( t ) .
I W ( t ) = P W ( t ) V W ( t )  
The wind power depends on the local weather conditions. In addition, it connects with the DC microgrid by using an AC–DC converter, leading to a transmission power loss as
P W ( t ) = P W m a x δ W ( t ) η A C
where P W m a x denotes the designed capacity of wind turbines, and δ W ( t ) is a continuous random variable in the range [0, 1] to denote the intermittent nature of the wind power at time t. η A C is the AC-DC converter efficiency.

2.1.4. Output and Input Current from the Battery I E d i s ( t ) and I E c h ( t )

A storage battery is a load DC bus when it charges power; otherwise, it is considered a supply DC bus. Thus, the discharging power is used to regulate the DC bus voltage, while the charging power affects the predicted input voltage of the DC bus. At time t, a battery charges power from supply sources, such as the main grid, photovoltaics, and wind power, which affects the amount of power provided to the DC microgrid. Thus, the appropriate discharging/charging scheduling of batteries contributes to the stability of DC bus voltage. The following equations formulate the effects of the charging and discharging current of the battery on the predicted input voltage of the DC bus.
I E d i s ( t ) = P E d i s ( t ) V E ( t )  
I E c h ( t ) = P E c h ( t ) V E ( t )
Equations (8) and (9) show the discharging and charging current of the battery, where P E d i s ( t ) and P E c h ( t ) denote the amount of discharging and charging power at time t, and V E ( t ) presents the output voltage of the battery. The following equations show the formulation of P E d i s ( t ) and P E c h ( t ) .
P E d i s ( t ) = η E d i s P d c r e g ( t ) P E c h ( t ) x E d i s ( t )  
P E c h ( t ) = P E c h ( t 1 ) η E c h η E d i s P E d i s ( t 1 )  
As shown in Equation (10), the discharging power depends on the amount of required power to regulate the DC bus voltage sags at time t ( P d c r e g ) and does not exceed the amount of charging power at time t ( P E c h ( t ) ). x E d i s ( t ) is a binary decision variable to denote the discharging status of the battery. From Equation (11), the charging power of the battery depends on the amount of charging and discharging power at previous time t − 1. η E d i s and η E c h are the charging and discharging efficiencies of the battery.
The state of charge (SOC) of the battery is determined in Equation (12). It depends on the SOC of the battery at the previous time and the capacity of the battery P E m a x .
S O C E ( t ) = S O C E ( t 1 ) + P E c h ( t ) P E m a x
To ensure the lifetime of each battery, the following operating conditions constraints are considered:
P E c h ( t ) P E m a x x E c h ( t )  
x E c h ( t ) + x E d i s ( t ) 1  

2.1.5. Total Current of the Loads IL(t)

A DC microgrid can accommodate both AC and DC loads. The sum of the supplied current from the DC bus to the AC and DC loads is expressed in Equation (15).
I L ( t ) = P L ( t ) V L ( t )  
where P L ( t ) and V L ( t ) are total power supplied and the required voltage for all loads in the DC bus.
In practice, loads are classified into critical loads and controllable loads. Critical loads are of high priority, must always be guaranteed to operate, and have no demand response applied to them, while controllable loads are of low priority and demand response is applied for resilience scheduling in an emergency. Thus, the value of P L ( t ) is calculated as
P L ( t ) = D L c r i ( t ) + [ 1 δ L ( t ) ] D L c o n ( t ) η D C
where D L c r i ( t ) and D L c o n ( t ) are total critical and controllable load magnitude, respectively.   η D C is the DC–DC/AC inverter efficiency. δ L ( t ) [ 0 ,   1 ] is a continuous random variable as in [24] to denote the percentage of controllable load reduction. At a certain time, t = k; if no demand response is used, δ L ( k ) = 0. In addition, the controllable load reduction quantity does not exceed a certain limitation affecting the comfort levels of loads. This constraint can be expressed as
D L m i n ( t ) δ L ( t ) D L c o n ( t ) D L m a x ( t )  
where D L m i n ( t ) and D L m a x ( t ) are the minimum and maximum controllable load reduction quantity at time t, respectively.

2.2. Objective Function

The objective function minimizes the total DC microgrid operating cost. It consists of the cost of each component in the DCM and the penalty cost for the controllable load reduction in demand response and the deviations of the DC bus voltage, which can be expressed as
C t o t a l ( t ) = t = τ τ + T C G ( t ) + C S ( t ) + C V ( t ) + C E ( t ) + C L ( t ) + C d c ( t )
where C G ( t ) denotes the costs related to exchange power of the DC microgrid with the main grid. It is a positive value when the DC microgrid purchases power from the main grid; otherwise, it will obtain a negative value. C S ( t ) , C V ( t ) , and C E ( t ) are the costs regarding solar, wind, and battery power, respectively. Finally, C L ( t ) and C d c ( t ) are the penalty costs caused by load shedding and voltage deviations. Those cost components in Equation (19) are expressed in the following equations:
C G ( t ) = P G ( t ) o ( t ) x G ( t )  
C S ( t ) = N S P S ( t ) o S
C V ( t ) = N V P W ( t ) o V  
C E ( t ) = ( P E d i s ( t ) + P E c h ( t ) ) o E
C L ( t ) = δ L ( t ) D L c o n ( t ) o L
C d c ( t ) = o d c ( U d c ( t ) U d c d e ( t ) )
In Equation (19), o ( t ) denotes time-of-use electricity price from the AC main grid, and x G ( t ) is a binary variable to denote DC microgrid status. The DC microgrid connects with the AC main grid when x G ( t ) = 1; otherwise x G ( t ) = 0. Equations (20) and (21) show the operating and maintenance cost of the solar system and wind turbine, respectively. They are in direct proportion to their generated power during period t, calculated according to the designed capacity and the intermittent nature of renewable energy sources, as shown in Equations (5) and (7). N S and N V denote the sizing of solar arrays and wind turbines; o S and o V are the operating and maintenance coefficients of solar arrays and wind turbines. Equation (22) calculates the degradation cost of the SB system, which depends on the charging and discharging power quantity in each time slot t [30], in which o E is the degradation cost coefficient. The penalty cost related to the load-shedding quantity in a voltage-based DR program is shown in Equation (23), in which o L is the penalty factor. Finally, Equation (24) shows the penalty cost by realizing the difference between the predicted DC bus voltage U d c ( t ) and the desired voltage U d c d e ( t ) , in which o d c is penalty factor regarding the DC bus voltage deviations. This term is applied to find the optimal control action that drives the predicted voltage as close to the desired value as possible.

2.3. Control Constraints

2.3.1. Power Balance Constraint

At any time of DC microgrid operation, the overall power flow must satisfy the principle of power conservation, as follows:
P G ( t ) + P S ( t ) + P W ( t ) + P E d i s ( t ) = P L ( t ) + P E c h ( t )  
where P G ( t ) is the power purchased from the AC main grid; P S ( t ) and P W ( t ) are the output power of the photovoltaics and wind turbine, respectively; P E d i s ( t ) is the discharging power of the storage battery; P L ( t ) is the load power demand at time t; and P E c h ( t ) is the charging power of the storage battery.

2.3.2. Power Flow in DC Microgrid

For the DC buses, the concept of droop control in converters can be used to regulate the voltage deviations [31,32]:
U d c ( t ) = U d c l i m ( t ) R d c I d c ( t )
where U d c ( t ) is the input voltage of the DC bus at time t, which depends on the nominal voltage U d c l i m ( t ) , the virtual resistance   R d c , and the output current of the DC bus at time t  I d c ( t ) .
According to Kirchhoff’s current law, the output current of a DC bus can be written generally as
I d c ( i ) = j = 1 j i n Y d c ( i j ) ( V d c ( i ) V d c ( j ) )
where I d c ( i ) is the output current in the DC bus i, Y d c ( i j ) is the admittance between bus i and bus j, and V d c ( i ) and V d c ( j ) are the voltage magnitude in bus i and j, respectively.

2.3.3. Voltage-Based Demand Response

In the proposed control strategy, the voltage-based DR and discharging power from storage batteries are applied for enhancing the DC microgrid resiliency by load shedding and power injecting. At time t, the predicted voltage of a DC bus U d c ( t ) is smaller than its nominal voltage U d c l i m ( t ) , and voltage-based DR is triggered by a binary control variable x L ( t ) = 1; otherwise x L ( t ) = 0. After that, the desired voltage of a DC bus at time t  U d c d e ( t ) is calculated based on the amount of voltage reduction caused by load shedding from the voltage-based DR. Based on the desired voltage at time t after load shedding, the required discharging power from storage batteries to regulate the DC bus voltage is defined. The above control strategy is expressed in the following equations:
P d c r e g ( t ) = U d c d e ( t ) I d c ( t )  
U d c d e ( t ) = U d c l i m ( t ) δ L ( t ) D L c o n ( t ) η D C I d c ( t ) x L ( t )
x L ( t ) = { 1   U d c ( t ) < U d c l i m ( t ) 0 U d c ( t ) U d c l i m ( t )
Equation (28) shows the required discharging power from storage batteries P d c r e g ( t ) to regulate the DC bus voltage based on the desired voltage U d c d e ( t ) and the current I d c ( t ) . U d c d e ( t ) is shown in Equation (29), which is defined by realizing the difference between the nominal voltage U d c l i m ( t ) and the reduced voltage after load shedding, where D L c o n ( t ) is total controllable load magnitude, η D C is the DC–DC/AC inverter efficiency, δ L ( t ) is a continuous random variable in range [0; 1] to denote the percentage of load reduction, and x L ( t ) is a binary control variable for the voltage-based DR. The trigger condition for x L ( t ) is shown in Equation (30).

3. System Methodology

In this section, first, the DC bus voltage control framework is proposed, integrating voltage-based DR and optimal SBs dispatching. An RL-based MPC approach is then introduced to solve the proposed mathematical model and control framework.

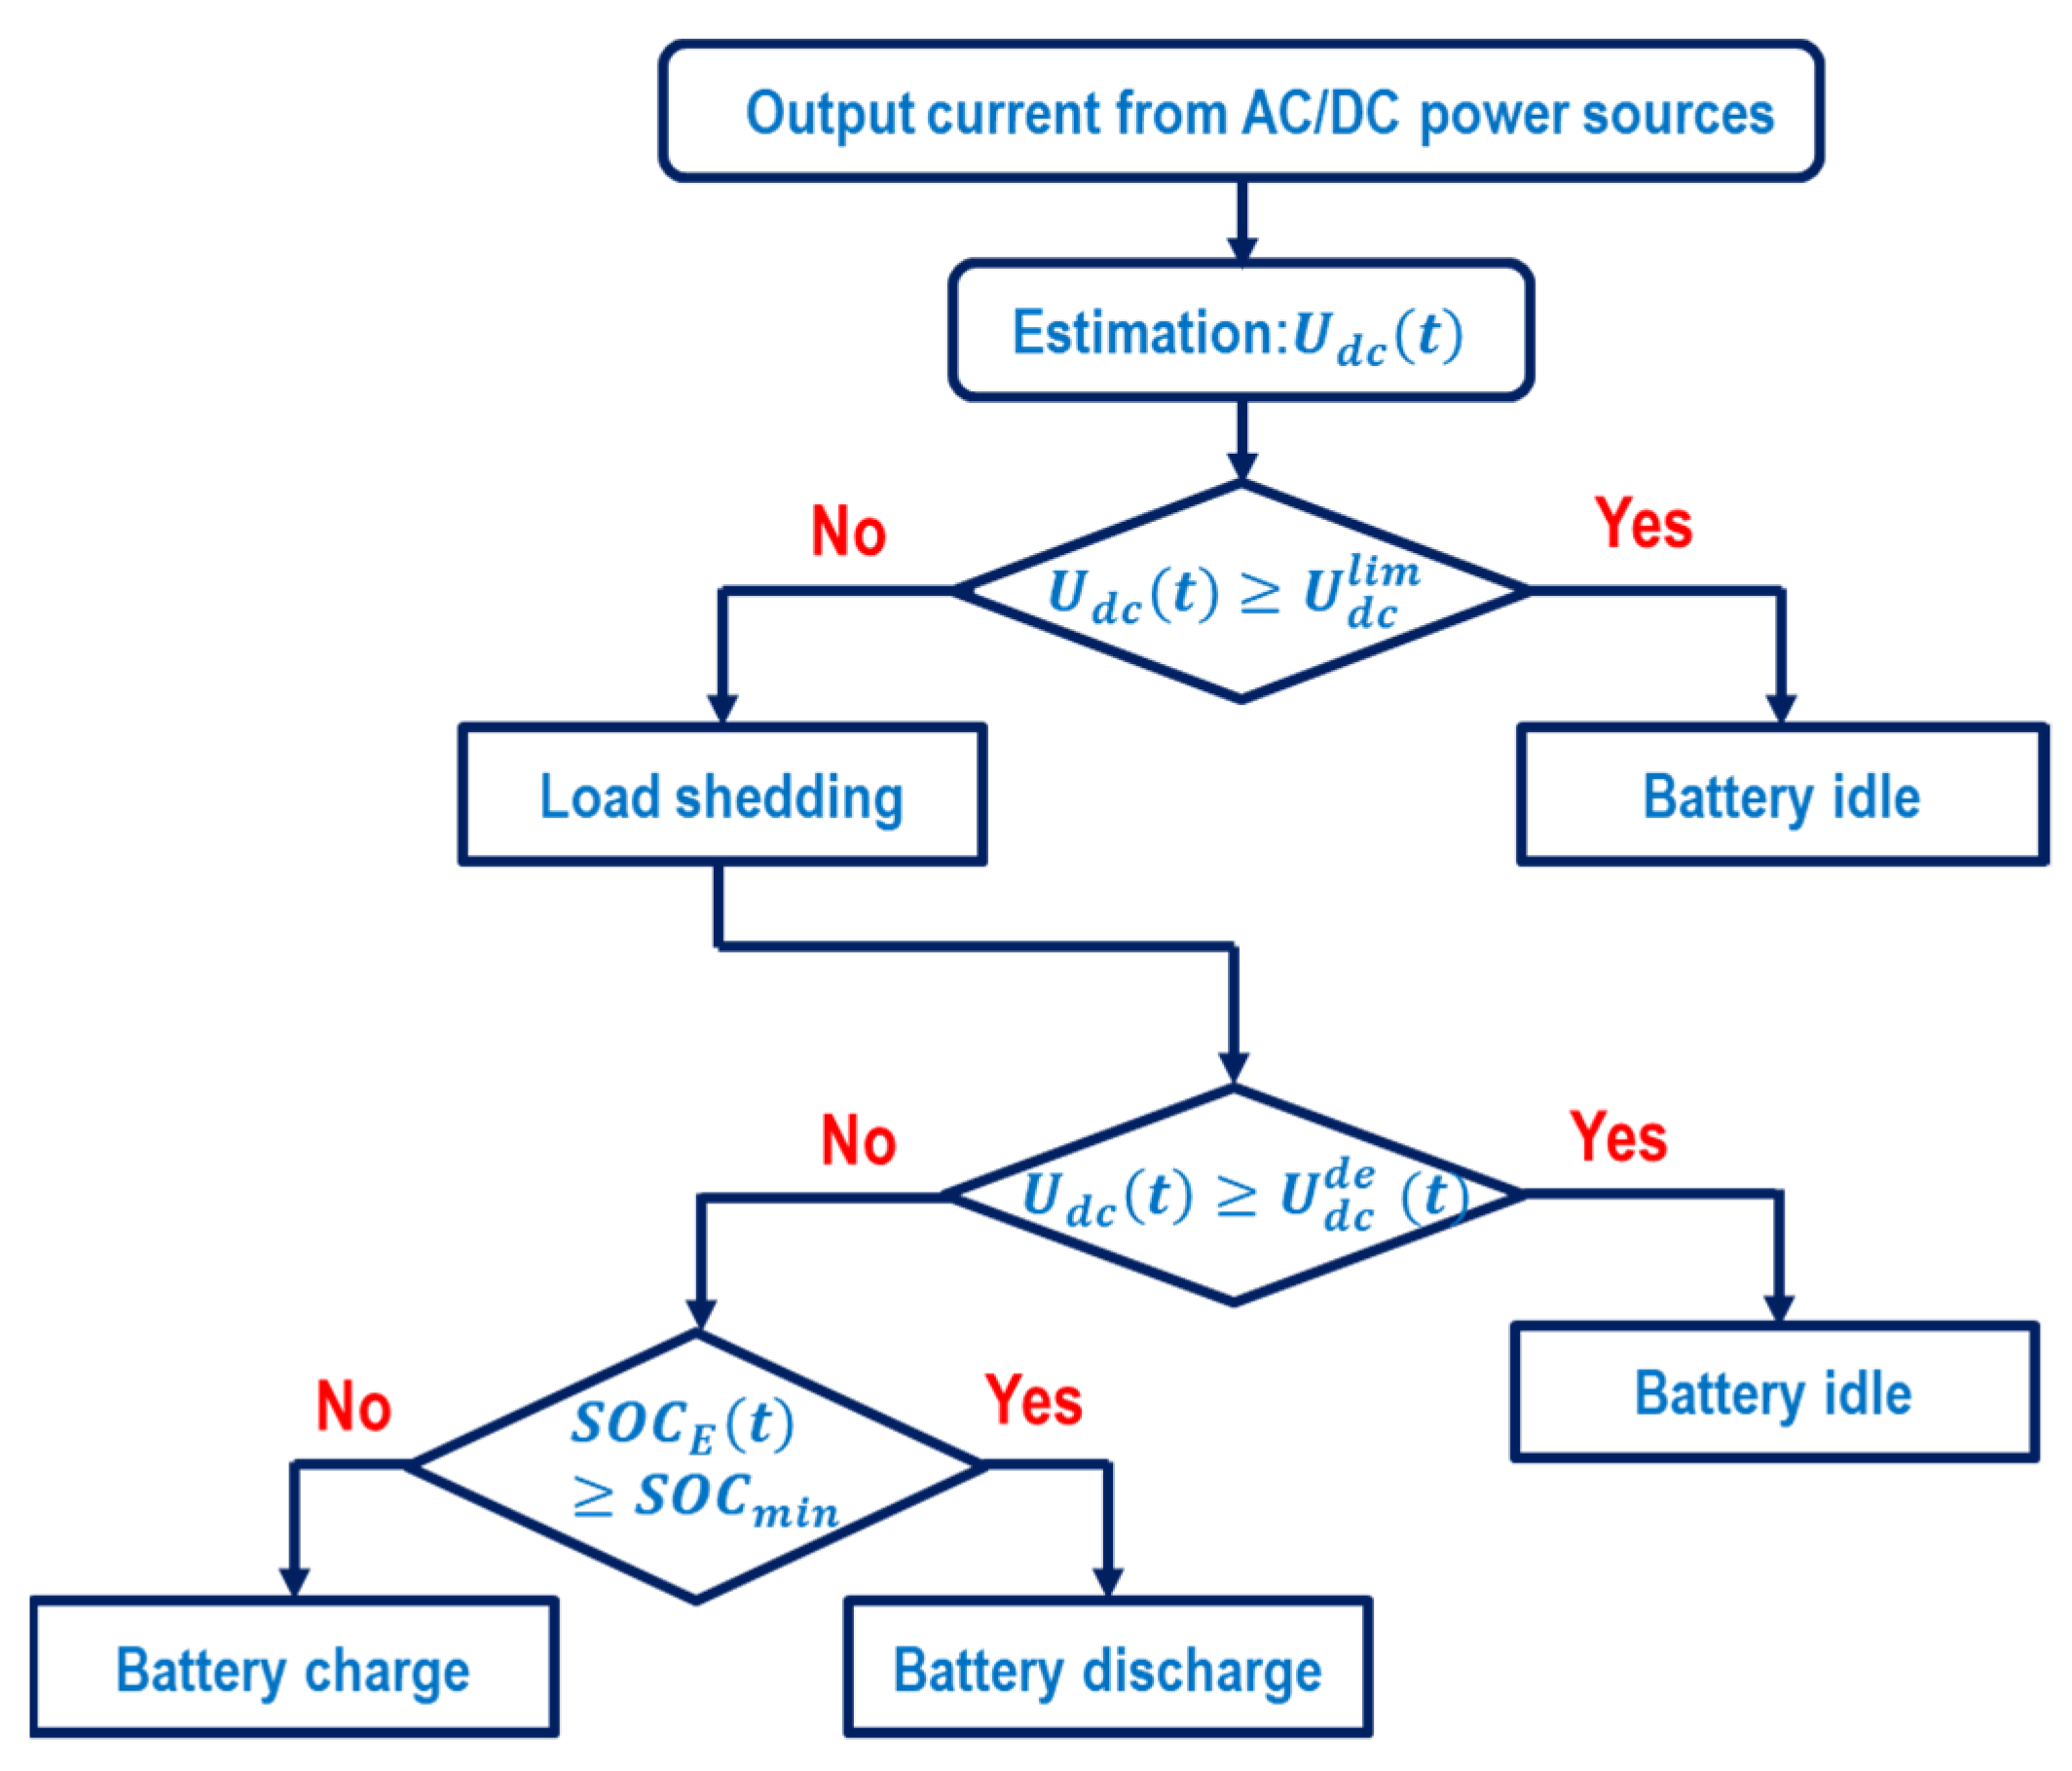
3.1. Proposed Control Strategy

Since the power generation from DERs follows different changing weather conditions, the stored energy in the batteries will fluctuate over time. Thus, the DR implementation based on the SOC of SBs, as shown in [20,21], not only affects the SBs efficiency because of increasing charging/discharging cycles but also decreases the DCM performance. Figure 2 shows a two-level coordination control strategy based on voltage-based DR and optimal dispatching of SB to overcome this issue.
From Figure 2, the proposed control strategy is carried out in the following steps:
Step 1: Based on the output current from the AC grid and DC supply sources (e.g., photovoltaic arrays, wind generations, and SBs), the DC bus input voltage U d c ( t ) is estimated based on Equation (1). Equations (2)–(17) are used in this step to take into account the relevant uncertainties.
Step 2: At time slot t, the DC bus input voltage U d c ( t ) is checked against its nominal voltage reference U d c l i m ( t ) to consider for carrying out a voltage-based DR program. Equation (30) is applied in this step to make a control action related to voltage-based DR.
Step 3: When U d c ( t ) < U d c l i m ( t ) , the voltage-based DR is triggered. The DC bus desired voltage at time t  U d c d e ( t ) is then calculated according to Equation (29) based on the amount of voltage reduction caused by load shedding. Otherwise, when U d c ( t ) U d c l i m ( t ) , no action is performed, and the SB will operate in idle mode. The process returns to step 1 for the next time interval t + 1.
Step 4: In the case in which voltage-based DR is performed, the second control level is applied to recheck the DC bus input voltage U d c ( t ) with its desired voltage U d c d e ( t ) after performing load shedding.
Step 5: When U d c ( t ) < U d c d e ( t ) , the SB will discharge the reserve power to regulate the DC bus voltage with the state-of-charge condition S O C E ( t ) at time t greater than the minimum state-of-charge level S O C m i n . In that case, the optimal battery dispatching is determined according to Equation (28). Otherwise, the SB will move to the charge status. In case of U d c ( t ) U d c d e ( t ) , the SB will operate in idle mode.
The next section introduces a DQN-based MPC approach, considering all relevant uncertainties in the output current from the AC grid and the DC supply sources.

3.2. Reinforcement Learning-Based Model Predictive Control

Since the integrated voltage-based DR and optimal dispatching of SB planning problem (Equations (18)–(30)) is a non-convex and nonlinear problem, a DQN-based MPC model is proposed to solve it efficiently. The proposed approach takes advantage of the optimal control process based on receding finite horizon prediction of the MPC method [33] and the sequence decision-making process of the RL algorithm [34].
In the energy sector, the combination of the MPC and DQN methods has been applied to respond effectively to disturbances in power generation of DERs [35,36,37] and uncertain behavior in DR programs [38,39]. Nevertheless, there is a scarcity of studies applying the DQN-based MPC approach to DCMs with integrated voltage-based DR and optimal dispatching of SB for enhancing resilience. In this study, the MPC is used as a reward estimator, while the RL effectively adjusts uncertain parameters in the MPC optimization problem. Thus, the proposed approach has advantages in two aspects:
(i)
It can accommodate forecasting errors by considering the uncertainties based on both real-time observation and short-term prediction. Further, the relationship between the predicted result in the previous period and the uncertainty of the current period is also considered, optimizing forecasting errors.
(ii)
It can achieve better control effectiveness even on a nonlinear system with a large number of uncertainties. The input–output linearization procedure with a DQN is suitable for some practical problems since it does not require the exact knowledge and information of the nonlinear process.
The proposed MPC model in this paper can be solved as a Markov decision-making process, where the DCM operator is defined as an agent to execute the optimal control actions in the uncertain environment of DC supply sources and load profiles. A reward is achieved when the agent performs an optimal action to change the environment state. The interaction between agent, the environment, and reward is described as follows: Let s t S ( t ) = { I G ( t ) ,   I S ( t ) ,   I W ( t ) ,   I L ( t ) , S o C E ( t ) ,   U d c d e ( t ) } be a set of states in the uncertain environment of DC supply sources and AC/DC loads, including the output current from the main grid, solar panel, wind turbine, the state of charge of battery, the required current of load, and the DC bus desired voltage; and a t A ( t ) = {   x E c h ( t ) ; x E d i s ( t ) ; x G ( t ) ; x L ( t ) } be a set of binary actions. All states s t S ( t ) are uncertain and are predicted based on a set of historical data through the training and testing process with DQN. At time slot t , the DCM operator executes an optimal control action a t to change the system state from s t to s t , and a reward   r t R t = { Equation   ( 18 ) } is obtained immediately. Since the optimal control action a t involves uncertainties in the prediction functions (Equations (1)–(17)), the obtained value of   r t at each time slot t is random. The DQN method can be applied to adjust uncertain parameters by accommodating the forecasting errors in the MPC model. An optimal action a t is selected based on the trade-off between the reward of the current time   r t and the incremental value Q ( s t , a t ) of the Q-value function. The update rule of the Q-value function is shown in Equation (31):
Q ( s t , a t ) Q ( s t , a t ) + ϕ [ r t + ς max Q ( s t + 1 , a t + 1 )   Q ( s t , a t ) ]
in which ϕ and ς [ 0 ,   1 ] denote the learning rate and discount factor, respectively. The discount factor coefficient indicates the importance of the current reward and the future reward. The integration of the DQN into the MPC optimization problem is summarized in Algorithm 1.
Algorithm 1: DQN-based MPC approach
1:Require:
Set of states:
  s t S ( t ) = { I G ( t ) ; I S ( t ) ; I W ( t ) ; S o C E ( t ) ; I L ( t ) , U d c d e ( t ) }
2:Set of actions:
  a t A ( t ) = { x E c h ( t ) ; x E d i s ( t ) ; x G ( t ) ; x L ( t ) }
3:Reward function r (st, at) in Equation (19)
4:Initialize Qo (s, a) for all s, a
5:Repeat for each episode (i.e., day) e to E do
6: Initialize the state st
7: Initialize discount factor ς and learning rate ϕ
8:  For time slot (i.e., 15 min) t = τ to T + τ do
9:  Select the action at for the current state st by using ϵ -greedy policy
10:  Received reward rt (st, at) as Equation (19)
11:  Observe the next state st+1
12:  Update the Q-value Q (st, at) as Equation (31)
13:  End for, when st+1 is terminal
14:Until | Q e + 1 Q e | ω is satisfied

4. Simulation Results

4.1. Simulation Setting

The simulated DCM diagram structure is shown in Figure 3. As seen, it consists of four photovoltaic systems at buses 1, 13, 16, and 19, two wind turbine systems at buses 5 and 28, and two SB systems installed at buses 8 and 25. The intermittent nature of wind δ W ( t ) and solar power δ S ( t ) are estimated based on the historical data about wind speed in [32] and solar irradiance in [29], respectively, whereas the uncertain AC grid-connected condition δ G ( t ) follows a Gaussian distribution based on [40]. The maximum charging (discharging) energy should be over 90% (should not be below 10%) of the nominal capacity to prolong the SB’s lifetime. The discharging and charging efficiencies are 0.98, and the initial SOC of the SB is set to be 50%.
All loads are classified into two types: (1) linear loads with constant resistance at buses 2, 3, 4, 6, 7, 11, 12, 15, 18, 20, 21, 23, 27, 29, and 30; (2) nonlinear loads at buses 9, 10, 14, 15, 17, 22, 24, and 26. They are connected to the common DC bus by converters for DC loads (e.g., buses 2, 6, 7, 9, 11, 13, 14, 15, 17, 20, 21, 22, 24, 26, and 29) and inverters for AC ones (e.g., buses 3, 4, 10, 18, 23, 27, and 30), and their voltage variation is assumed to have little impact on the loads’ power consumption. The converter and inverter efficiencies are 0.95. Regarding DR, the load shedding data in [36] are used to estimate the permitted load reduction quantity at each time t. The penalty cost for the voltage-based DR violations o L is 0.0045 USD/p.u and the penalty cost for the voltage deviations o d c is 0.046 USD/p.u. The time-of-use price from the AC grid o ( t ) is obtained in [40]. The other system parameters are shown in Table 2, according to [32].
All remaining parameters of the algorithm, including the ϵ-greed, learning rate, and discount factor, are set to be 0.95, 0.05, and 0.95, respectively, according to [30]. The simulation tests are run by the Gurobi 9.1.2 optimization solver in the Python 3.8.8 environment on a dual-core 3.0 GHz computer with 8.0 GB of RAM. The following sections illustrate the simulation results to validate the proposed model’s performance.
Figure 4 and Figure 5 illustrate the total DCM’s operating cost and the total voltage deviation of all load buses under the proposed DQN-based MPC approach. The MPC model is trained by 1000 random scenarios involving solar power, wind power, and AC grid-connect condition uncertainties. In Figure 4, a convergence in the total DCM operating cost can be found after nearly 9.5 h of running the training process. The smoothed DCM operating cost decreases as the simulation scenario and time increase.
For enhancing MCG resilience, the total voltage deviation for all load buses in uncertain scenarios is a performance index to evaluate the resilience effectiveness of the proposed model [3]. Figure 5 illustrates the total voltage deviation for all load buses in 24 h planning with 96 time slots in which each time step is 15 min. In Figure 5, the voltage deviations are effectively optimized by the proposed approach. Specifically, the desired DC bus voltage U d c d e ( t ) drops to 0.98 p.u from 4th time slot to 7th, 0.96 p.u from 28th time slot to 33rd, 0.95 p.u from 58th time slot to 63rd, and 0.97 p.u from 81st time slot to 86th by load shedding caused by the voltage-based DR’s response to the changes in the DC input voltage caused by the fluctuations in the output current of DC supply sources and the uncertain AC grid-connect condition. Then, the optimal SB dispatch is accurately allocated with the amount of dropped voltage to recover the resilience of DCM during the interruption periods. However, a very small voltage deviation still exists in the second period of the voltage-based DR process because of the shortage of discharging power from the SB when it directly changes to the idle state to discharge state for voltage compensation.

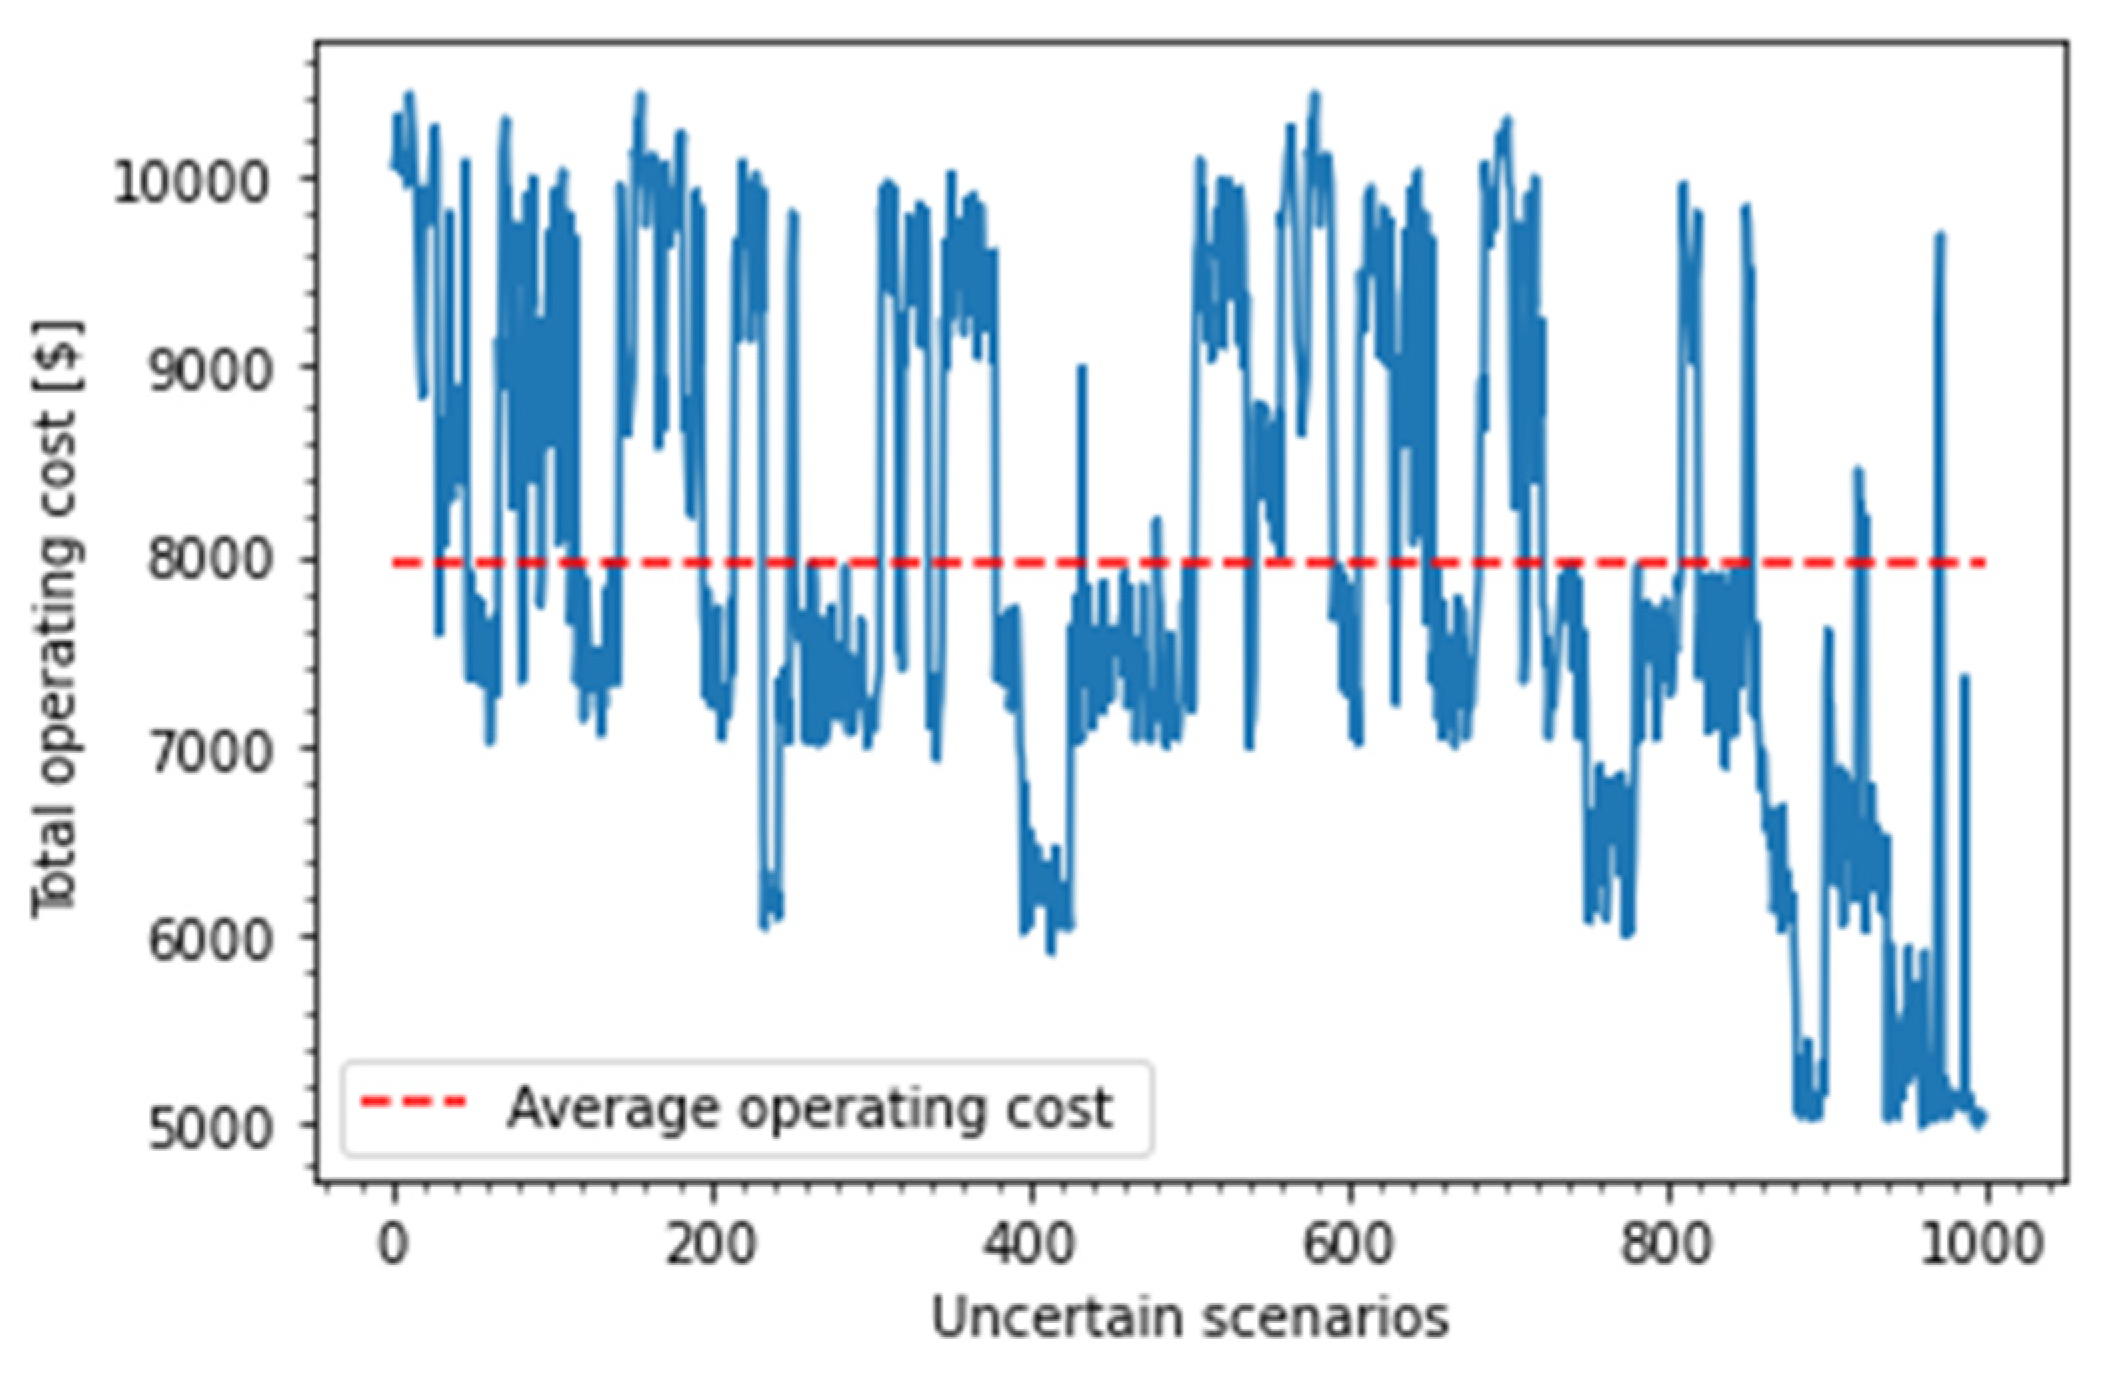
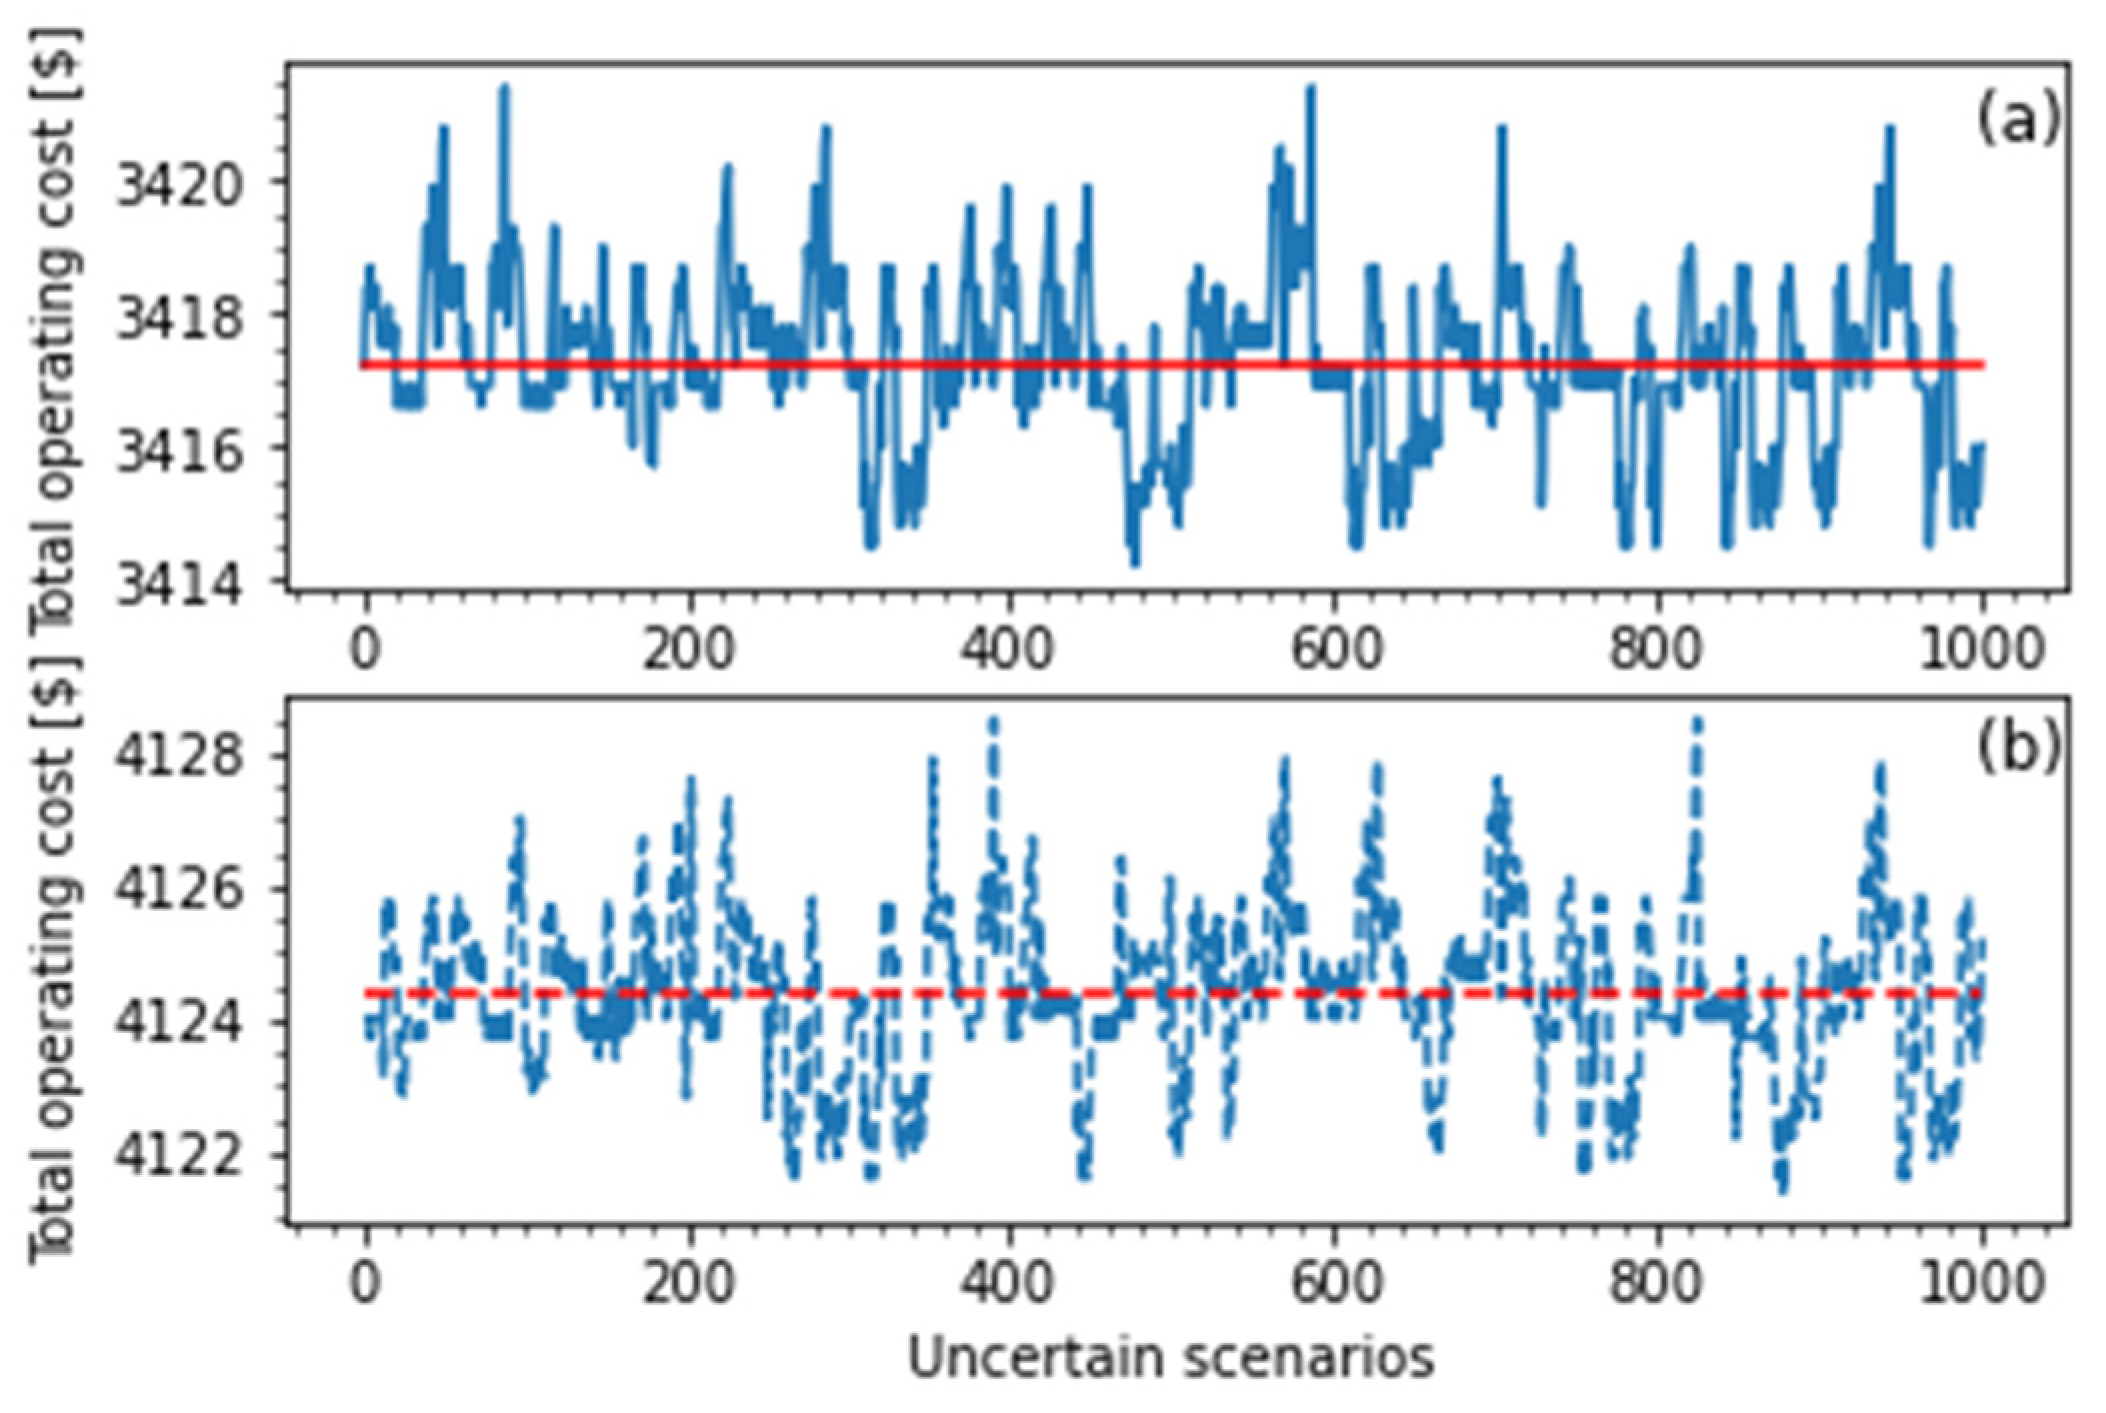
4.2. Benchmark with Stochastic Model-Based MPC

This section verifies the proposed model performance by benchmarking with the stochastic programing (SP)-based MPC approach in [26]. In the benchmarked approach, 1000 random scenarios are generated by combining the three uncertainties: intermittent nature of wind and solar power and the uncertain AC grid-connect condition with the probability of each scenario assumed to be 1/1000. Figure 6 and Figure 7 show the total DCM operating cost and the total voltage deviation of all load buses with the SB-based MPC approach.
Compared to the results in Figure 4, the DCM operating cost with the SB-based MPC approach does not converge with more than 24 h of running the model, and the average operating cost is 41.95% higher. Thus, as can be observed from Figure 4 and Figure 6, the proposed DQN-based MPC outperforms SP-based MPC approach in the following aspects: (i) the proposed DQN-based MPC is capable of learning the optimal action in the previously trained episodes in response to uncertain conditions, a capability that the SP-based MPC does not possess; (ii) with the same uncertain environment and cost function; the DQN-based MPC results in smaller and smoother cost values than those of the SP-based MPC; (iii) the average operating cost converges to a stable value around USD 4644.31 (red line in Figure 4) for the DQN-based MPC method, whereas the SP-based MPC does not achieve convergence, with an higher average operating cost of approximately USD 7949.22 (red line in Figure 6), which shows the effectiveness of the DQN-based MPC in improving the total DCM operating cost around 41.95% under a highly uncertain environment.
As one of the causes of instability in the DCM operation, the SP-based MPC approach has resulted in large deviations in the DC bus voltage, as shown in Figure 7. From Figure 7, the voltage-based DR is carried out at many different periods during 24 h planning, which increases the penalty cost involving load shedding. Further, the optimal SB dispatch from the SP-based MPC method is insufficient to recover the DC bus voltage deviations, which is explained by the poor ability to capture the uncertainties in the AC/DC supply sources that affect the charging and discharging efficiency of the SB system. In other words, the SP-based MPC is not effective for catching uncertainties involving the DC bus input voltage prediction. Therefore, the action of restoring the voltage (injecting an optimal SB dispatch) is typically delayed from 10 to 15 min compared with the optimal actions in Figure 5. Finally, to evaluate the resilience effectiveness in both approaches, this paper assumes that an extreme event, such as a hurricane, occurs at the 58th time slot, and it makes the DCM operate in the island model for one hour and fifteen mins (from 58th time slot to 63rd). As can be seen from Figure 5 and Figure 7, the desired DC bus voltage U d c d e ( t ) drops to 0.95 p.u during that period in both approaches. However, the DQN-based MPC (Figure 5) depicts an outstanding performance in improving the MPC resilience by restoring the voltage deviations caused by the uncertain AC grid-connect condition than the SP-based MPC approach (Figure 7).

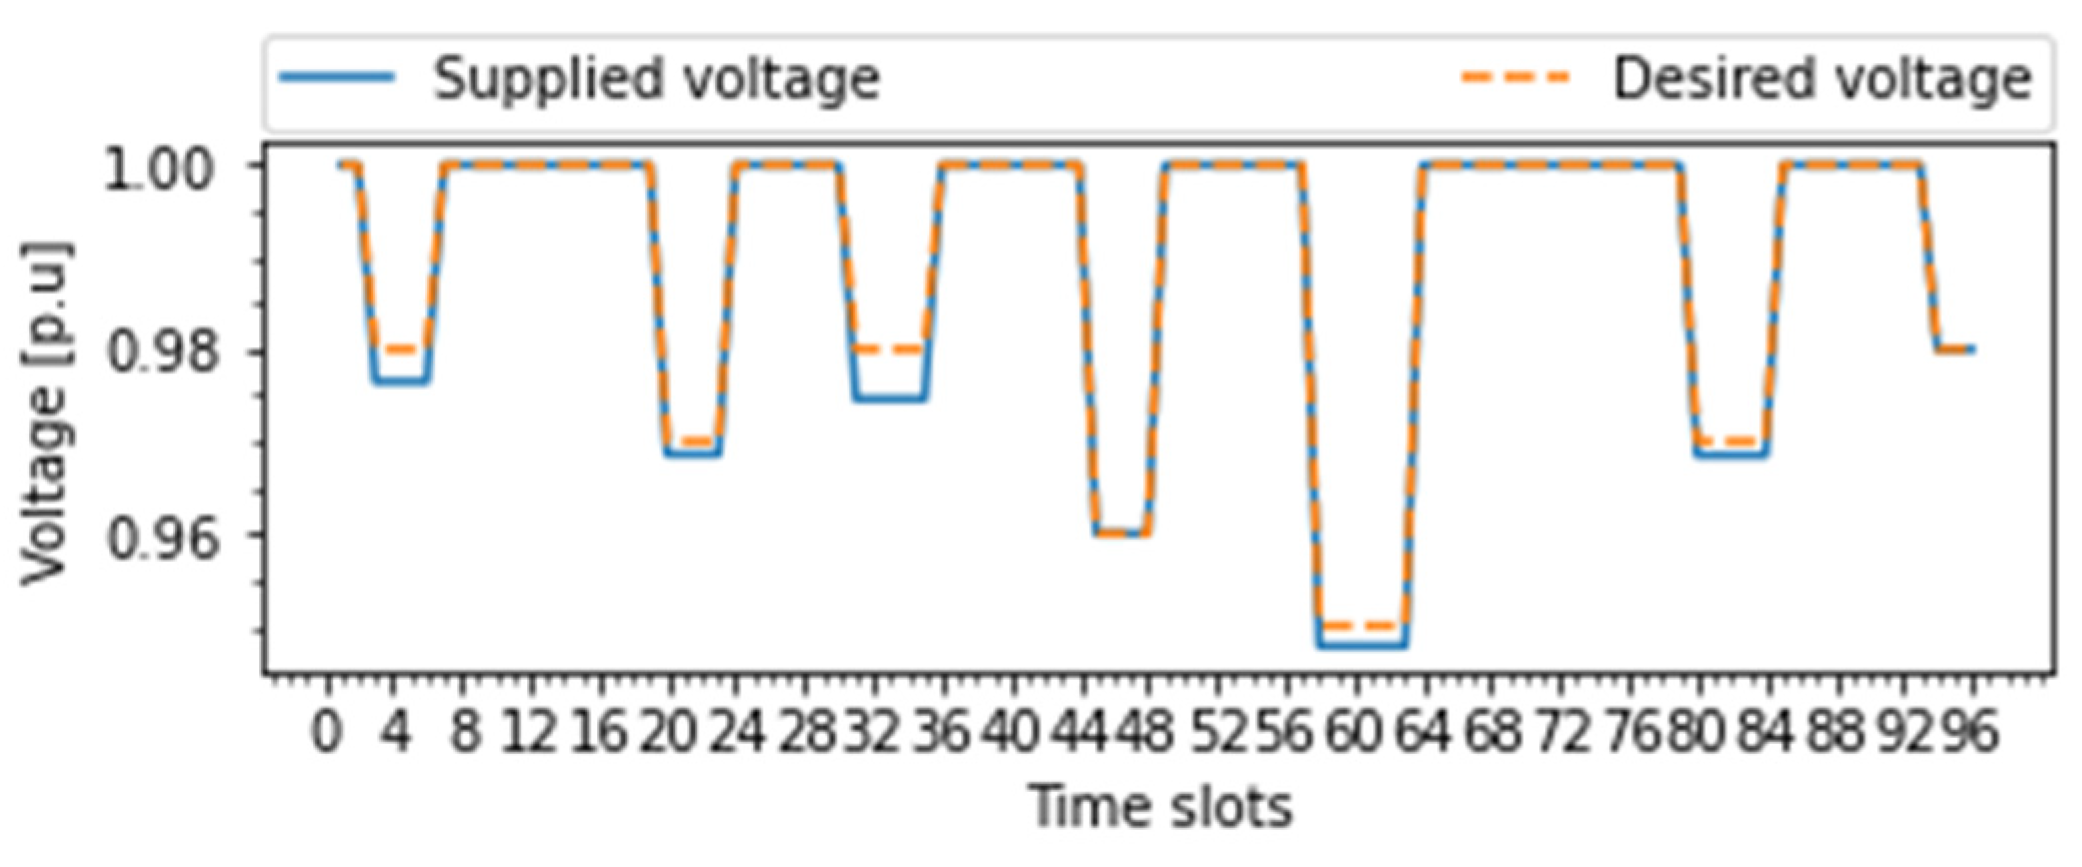
4.3. Effects of Voltage-Based DR

This section investigates the effect of voltage-based DR on the total DCM operating cost and the SB charging/discharging effectiveness. The simulation results with and without voltage-based DR are illustrated in Figure 8 and Figure 9 for comparison.
Figure 8a shows the DCM operating cost with voltage-based DR, while the one without voltage-based DR is shown in Figure 8b. From Figure 9, the voltage-based DR significantly helps improve the DCM total operating cost because of decreasing costs regarding the degradation of the SB system and the penalty of DC bus voltage violations. Although there is a slight increase in the penalty cost caused by load shedding in the voltage-based DR program, the DCM average operating cost with voltage-based DR (USD 3417.25 in the red line in Figure 8a) is still 17.14% smaller than that without voltage-based DR (USD 4124.36 with the red line in Figure 8b). Regarding prolonging the SB effectiveness, Figure 9 illustrates the frequency of SB charging and discharging in both cases below.
From Figure 9, the SB’s optimal dispatch and discharging frequency with voltage-based DR are significantly improved compared to those without voltage-based DR. Compared to Figure 9a, the SB discharges maximum capacity to compensate the voltage fluctuations at every single time discharging in Figure 9b, which affects the SB’s effectiveness and lifetime. Further, the charging and discharging diagram in Figure 9 accurately reflects the proposed voltage control framework. This means that the SB discharges reserve power only to compensate the voltage when the DC bus input voltage does not still satisfy the desired voltage after performing voltage-based DR, which improves the SB’s effectiveness.
Clearly, from Figure 8 and Figure 9, the proposed voltage control framework based on the integration of voltage-based DR and optimal SB dispatch is verified by improving the total operating cost and the SB’s effectiveness simultaneously.

4.4. Load Interruption Analysis

Finally, the proposed DQN-based MPC performance is also investigated with different connect-load conditions. Assuming that load at buses 2, 9, 17, and 27 disconnects from the DC bus during 8 a.m.–10 a.m., Figure 10 shows the voltage regulation result proposed in two cases: (a) all loads connect with the DC bus and (b) some loads disconnect from the DC bus.
Figure 10a shows a very small voltage violation in the DC bus because of the shortage of reserve power from the SB to satisfy all loads at the same time. However, Figure 10b presents a better voltage regulation performance with the presence of uncertain connect-load conditions. From Figure 10b, the DC bus voltage rises to 1.05 p.u before attaining steady voltage during the load step change when load switches out from 32nd time slot to 42nd). This is because there is a consumption surplus to inject into the SB. In this way, the voltage-based DR and the SB operate to compensate for the power deficiency during the rest of the periods. As a result, when load at buses 2, 9, 17, and 27 connects again to the DC bus at the 43rd time slot, no voltage variation appears.

5. Conclusions

This paper proposes an MPC-based voltage control strategy for minimizing the total DCM operating cost while enhancing the resilience when subject to uncertain operating conditions. It also develops a two-level coordination control framework by optimally integrating voltage-based DR and SB dispatch to achieve the above goals. Finally, the proposed model is solved using a DQN-based RL approach to handle uncertainties in the AC/DC supply sources, which strongly affect the predicted input voltage of the DC bus.
The proposed model and algorithm are simulated through a typical DCM structure in commercial buildings, where there is a significant increase in DC loads. By comparing simulation results to the SB-based MPC method, the performance of the proposed DQN-based MPC method is validated by achieving smaller and smoother converging operating costs. In addition, the voltage-based DR is capable of improving the operating cost by around 41.95% while enhancing the resilience with the least voltage deviation.
The proposed mathematical model ignores the effects of control parameters in power-electronic devices (e.g., droop resistance and rated voltage of converters and inverters) on the loads’ power consumption. Thus, to increase the practicality of the proposed model, it can be reinforced by considering the more detailed effects of power-electronic devices on the regulation of the DC bus input voltage. Further, the RL-based approach is effective for making sequential decisions but is also suffering from computation cost. Thus, it is important to improve the proposed approach for the real-time problems with economical solutions.

Author Contributions

Conceptualization, V.-V.T. and W.S.; methodology, V.-V.T.; software, V.-V.T.; validation, V.-V.T. and W.S.; formal analysis, V.-V.T.; investigation, W.S.; resources, V.-V.T.; data curation, V.-V.T.; writing—original draft preparation, V.-V.T.; writing—review and editing, W.S. and B.W.; visualization, V.-V.T.; supervision, W.S. and B.W. All authors have read and agreed to the published version of the manuscript.

Funding

This research received no external funding.

Institutional Review Board Statement

Not applicable.

Informed Consent Statement

Not applicable.

Data Availability Statement

Not applicable.

Conflicts of Interest

The authors declare no conflict of interest.

Nomenclature

A.Indices and Sets
G index   of   main   grid
S index   of   solar   panel
W index   of   wind   turbine
E index   of   battery   storage
L index   of   load
d c index   of   DC   bus
t index   of   time
B.Parameters
B d c capacitance of DC bus [F]
C G ( t ) power purchase cost from main grid [$]
C S ( t ) maintenance cost of solar panel [$]
C V ( t ) maintenance cost of wind turbine [$]
C E ( t ) degradation cost of storage battery [$]
C L ( t ) penalty cost of load shedding [$]
C d c ( t ) penalty cost of voltage deviation [$]
D L c r i ( t ) critical load magnitude [kW]
D L c o n ( t ) controllable load magnitude [kW]
N S sizing of solar panel [m2]
N V sizing of wind turbine [m2]
P G m a x maximum power of main grid [kW]
P S m a x maximum capacity of solar panel [kW/m2]
P W m a x maximum capacity of wind turbine [kW/m2]
P E m a x maximum capacity of storage battery [kW]
o S cost coefficient of solar panel [$]
o V cost coefficient of wind turbine [$]
o E cost coefficient of storage battery [$]
o L penalty factor for voltage demand response [$]
o d c penalty factor for voltage deviation [$]
o ( t ) time-of-use price from main grid [$]
I d c ( t ) output current of DC bus at time t [A]
U d c l i m ( t ) nominal voltage of DC bus at time t [V]
R d c virtual resistance of DC bus [Ω]
Y d c ( i j ) admittance between bus i and j [number]
V G ( t ) output voltage of main grid [V]
V S ( t ) output voltage of solar panel [V]
V W ( t ) output voltage of wind turbine [V]
V L ( t ) input voltage for load [V]
V E ( t ) output voltage of storage battery [V]
V d c ( i ) voltage magnitude in bus i [V]
V d c ( j ) voltage magnitude in bus j [V]
δ G ( t ) uncertain grid-connect condition [%]
δ S ( t ) uncertainty in solar panel at time t [%]
δ W ( t ) uncertainty in wind turbine at time t [%]
δ L ( t ) percentage of controllable load reduction [%]
D L m i n ( t ) maximum of load reduction at time t [%]
D L m a x ( t ) minimum of load reduction at time t [%]
η A C AC-DC converter efficiency [%]
η D C DC-DC/AC inverter efficiency [%]
η E d i s discharging efficiency of storage battery [%]
η E c h charging efficiency of storage battery [%]
C.State variables
P G ( t ) power provided by main grid at time t [kW]
P S ( t ) power generated by solar panel at time t [kW]
P W ( t ) power generated by wind turbine at time t [kW]
P E d i s ( t ) discharging power quantity at time t [kW]
P E c h ( t ) charging power quantity at time t [kW]
P L ( t ) total power supplied for load at time t [kW]
P d c r e g ( t ) required power to regulate DC voltage [kW]
U d c ( t ) input voltage of a DC bus [V]
U d c d e ( t ) desired voltage of a DC bus at time t [V]
I G ( t ) output current from main grid [A]
I S ( t ) output current from solar panel [A]
I W ( t ) output current from wind turbine [A]
I L ( t ) input current of load [A]
I E d i s ( t ) discharging current of storage battery [A]
I E c h ( t ) charging current of storage battery [A]
I d c ( i ) output current in a DC bus i [A]
S O C E ( t ) state of charge (SOC) of storage battery [%]
D.Action variables
x E d i s ( t ) binary discharging decision of battery at time t
x E c h ( t ) binary charging decision of battery at time t
x L ( t ) binary on/off decision voltage demand response
x G ( t ) binary on/off decision with main grid

References

  1. Ma, W.-J.; Wang, J.; Lu, X.; Gupta, V. Optimal Operation Mode Selection for a DC Microgrid. IEEE Trans. Smart Grid 2016, 7, 2624–2632. [Google Scholar] [CrossRef]
  2. Meng, L.; Shafiee, Q.; Trecate, G.F.; Karimi, H.; Fulwani, D.; Lu, X.; Guerrero, J.M. Review on Control of DC Microgrids and Multiple Microgrid Clusters. IEEE J. Emerg. Sel. Top. Power Electron. 2017, 5, 928–948. [Google Scholar]
  3. Kavousi-Fard, A.; Wang, M.; Su, W. Stochastic resilient posthurricane power system recovery based on mobile emergency resources and reconfigura-ble networked microgrids. IEEE Access 2018, 6, 311–326. [Google Scholar] [CrossRef]
  4. Panteli, M.; Mancarella, P. Influence of extreme weather and climate change on the resilience of power systems: Impacts and possible mitigation strate-gies. Electr. Power Syst. Res. 2015, 127, 259–270. [Google Scholar] [CrossRef]
  5. Douglas, E. Texas Largely Relies on Natural Gas for Power. It Wasn’t Ready for the Extreme Cold. Available online: https://www.texastribune.org/2021/02/16/natural-gas-power-storm/ (accessed on 26 February 2021).
  6. Patterson, B.T. DC, come home: DC microgrids and the birth of the ‘Enernet’. IEEE Power Energy Mag. 2012, 10, 60–69. [Google Scholar] [CrossRef]
  7. Mueller, J.A.; Kimball, J.W. Modeling and Analysis of DC Microgrids as Stochastic Hybrid Systems. IEEE Trans. Power Electron. 2021, 36, 9623–9636. [Google Scholar] [CrossRef]
  8. Lu, X.; Guerrero, J.; Sun, K.; Vasquez, J.C. An Improved Droop Control Method for DC Microgrids Based on Low Bandwidth Communication with DC Bus Voltage Restoration and Enhanced Current Sharing Accuracy. IEEE Trans. Power Electron. 2013, 29, 1800–1812. [Google Scholar] [CrossRef] [Green Version]
  9. Li, P.; Han, P.; He, S.; Wang, X. Double-uncertainty optimal operation of hybrid AC/DC microgrids with high proportion of intermittent energy sources. J. Mod. Power Syst. Clean Energy 2017, 5, 838–849. [Google Scholar] [CrossRef] [Green Version]
  10. Tomeszewska, A.; Chu, Z.; Feng, X.; O’Kane, S.; Liu, X.; Chen, J.; Ji, C.; Endler, E.; Li, R.; Liu, L.; et al. Lithium-ion battery fast charging: A review. eTransportation 2019, 1, 100011. [Google Scholar] [CrossRef]
  11. Basic, H.; Dragicevic, T.; Pandzic, H.; Blaabjerg, F. DC microgrids with energy storage systems and demand response for providing support to frequency regulation of electrical power systems. In Proceedings of the 2017 19th European Conference on Power Electronics and Applications (EPE’17 ECCE Europe), Warsaw, Poland, 11–14 September 2017; pp. 1–10. [Google Scholar]
  12. Eltamaly, A.M.; Alotaibi, M.A.; Alolah, A.I.; Ahmed, M.A. A novel demand response strategy for sizing of hybrid energy system with smart grid concepts. IEEE Access 2021, 9, 20277–20294. [Google Scholar] [CrossRef]
  13. Eltamaly, A.M.; Alotaibi, M.A. Novel Fuzzy-Swarm Optimization for Sizing of Hybrid Energy Systems Applying Smart Grid Concepts. IEEE Access 2021, 9, 93629–93650. [Google Scholar] [CrossRef]
  14. Medina, J.; Muller, N.; Roytelman, I. Demand Response and Distribution Grid Operations: Opportunities and Challenges. IEEE Trans. Smart Grid 2010, 1, 193–198. [Google Scholar] [CrossRef]
  15. Rad, H.M.; Davoudi, A. Towards building an optimal demand response framework for DC distribution networks. IEEE Trans. Smart Grid 2014, 5, 2626–2634. [Google Scholar]
  16. Mackay, L.; Kolios, P.; Ramirez-Elizondo, L.; Bauer, P. Voltage dependent demand response with dynamic hysteresis thresholds in DC microgrids. In Proceedings of the 2015 IEEE Eindhoven PowerTech, Eindhoven, The Netherlands, 29 June–2 July 2015; pp. 1–6. [Google Scholar] [CrossRef]
  17. Chauhan, R.K.; Phurailatpam, C.; Rajpurohit, B.S.; Gonzalez-Longatt, F.M.; Singh, S.N. Demand-Side Management System for Autonomous DC Microgrid for Building. Technol. Econ. Smart Grids Sustain. Energy 2017, 2, 4. [Google Scholar] [CrossRef]
  18. Zou, S.; Ma, Z.; Zhu, G.; Liu, X. Demand Side Management in Direct Current Distribution Networks: Convergence and Optimality. In Proceedings of the 2018 IEEE International Symposium on Circuits and Systems (ISCAS), Florence, Italy, 27–30 May 2018; pp. 1–5. [Google Scholar] [CrossRef]
  19. Zou, S.; Ma, Z.; Liu, S. Load control problems in direct current distribution networks: Optimality, equilibrium of games. IEEE Trans. Control. Syst. Technol. 2020, 28, 347–360. [Google Scholar] [CrossRef]
  20. Zia, M.F.; Elbouchikhi, E.; Benbouzid, M. Optimal operational planning of scalable DC microgrid with demand response, islanding, and battery degrada-tion cost considerations. Appl. Energy 2019, 237, 695–707. [Google Scholar] [CrossRef]
  21. Che, L.; Shahidehpour, M. DC Microgrids: Economic Operation and Enhancement of Resilience by Hierarchical Control. IEEE Trans. Smart Grid 2014, 5, 2517–2526. [Google Scholar] [CrossRef]
  22. Zhao, T.; Pan, X.; Yao, S.; Ju, C.; Li, L. Strategic bidding of hybrid ac/dc microgrid embedded energy hubs: A two-stage chance constrained stochastic pro-gramming approach. IEEE Trans. Sustain. Energy 2000, 11, 116–125. [Google Scholar] [CrossRef]
  23. Hu, J.; Shan, Y.; Guerrero, J.M.; Ioinovici, A.; Chan, K.W.; Rodriguez, J. Model predictive control of microgrids—An overview. Renew. Sustain. Ble Energy Rev. 2021, 136, 110422. [Google Scholar] [CrossRef]
  24. Batiyah, S.; Sharma, R.; Abdelwahed, S.; Zohrabi, N. An MPC-based power management of standalone DC microgrid with energy storage. Int. J. Electr. Power Energy Syst. 2020, 120, 105949. [Google Scholar] [CrossRef]
  25. Hu, J.; Xu, Y.; Cheng, K.W.; Guerrero, J.M. A model predictive control strategy of PV-battery microgrid under variable power generations and load condi-tions. Appl. Energy 2018, 221, 195–203. [Google Scholar] [CrossRef]
  26. Su, W.; Yu, S.S.; Li, H.; Iu, H.H.-C.; Fernando, T. An MPC-Based Dual-Solver Optimization Method for DC Microgrids with Simultaneous Consideration of Operation Cost and Power Loss. IEEE Trans. Power Syst. 2020, 36, 936–947. [Google Scholar] [CrossRef]
  27. Ni, F.; Zheng, Z.; Xie, Q.; Xiao, X.; Zong, Y.; Huang, C. Enhancing resilience of DC microgrids with model predictive control based hybrid energy storage system. Int. J. Electr. Power Energy Syst. 2021, 128, 106738. [Google Scholar] [CrossRef]
  28. Wang, S.; Lu, L.; Han, X.; Ouyang, M.; Feng, X. Virtual-battery based droop control and energy storage system size optimization of a DC microgrid for electric vehicle fast charging station. Appl. Energy 2019, 259, 114146. [Google Scholar] [CrossRef]
  29. Wang, P.; Wang, W.; Meng, N.; Xu, D. Multi-objective energy management system for DC microgrids based on the maximum membership degree princi-ple. J. Mod. Power Syst. Clean Energy 2018, 6, 668–678. [Google Scholar] [CrossRef] [Green Version]
  30. Liang, Z.; Huang, C.; Su, W.; Duan, N.; Donde, V.; Wang, B.; Zhao, X. Safe Reinforcement Learning-Based Resilient Proactive Scheduling for a Commercial Building Considering Correlated Demand Response. IEEE Open Access J. Power Energy 2021, 8, 85–96. [Google Scholar] [CrossRef]
  31. Guerrero, J.M.; Vasquez, J.C.; Matas, J.; de Vicuna, L.G.; Castilla, M. Hierarchical Control of Droop-Controlled AC and DC Microgrids—A General Approach Toward Standardization. IEEE Trans. Ind. Electron. 2011, 58, 158–172. [Google Scholar] [CrossRef]
  32. Li, C.; De Bosio, F.; Chen, F.; Chaudhary, S.K.; Vasquez, J.C.; Guerrero, J. Economic Dispatch for Operating Cost Minimization Under Real-Time Pricing in Droop-Controlled DC Microgrid. IEEE J. Emerg. Sel. Top. Power Electron. 2016, 5, 587–595. [Google Scholar] [CrossRef] [Green Version]
  33. Xie, H.; Xu, X.; Li, Y.; Hong, W.; Shi, J. Model Predictive Control Guided Reinforcement Learning Control Scheme. In Proceedings of the 2020 International Joint Conference on Neural Networks (IJCNN), Glasgow, UK, 19–24 July 2020; pp. 1–8. [Google Scholar] [CrossRef]
  34. Zhang, Z.; Zhang, D.; Qiu, R.C. Deep reinforcement learning for power system applications: An overview. CSEE J. Power Energy Syst. 2020, 6, 213–225. [Google Scholar]
  35. Sabzevari, S.; Heydari, R.; Mohiti, M.; Savaghebi, M.; Rodriguez, J. Model-Free Neural Network-Based Predictive Control for Robust Operation of Power Converters. Energies 2021, 14, 2325. [Google Scholar] [CrossRef]
  36. Chen, J.; Chen, Y.; Tong, L.; Peng, L.; Kang, Y. A Backpropagation Neural Network-Based Explicit Model Predictive Control for DC–DC Converters with High Switching Frequency. IEEE J. Emerg. Sel. Top. Power Electron. 2020, 8, 2124–2142. [Google Scholar] [CrossRef]
  37. Chen, Z.; Hu, H.; Wu, Y.; Zhang, Y.; Li, G.; Liu, Y. Stochastic model predictive control for energy management of power split plug-in hybrid electric vehi-cles based on reinforcement learning. Energy 2020, 211, 118931. [Google Scholar] [CrossRef]
  38. Lu, R.; Hong, S.H. Incentive-based demand response for smart grid with reinforcement learning and deep neural network. Appl. Energy 2019, 236, 937–949. [Google Scholar] [CrossRef]
  39. Smarra, F.; Jain, A.; de Rubeis, T.; Ambrosini, D.; D’Innocenzo, A.; Mangharam, R. Data-driven model predictive control using random forests for building energy optimization and climate control. Appl. Energy 2018, 226, 1252–1272. [Google Scholar] [CrossRef] [Green Version]
  40. Bedard, J. Development Strategy Document for Solar and Geothermal Energy and Energy Storage at White Sands Missile Range; National Renewable Energy Laboratory, The U.S Department Energy: Golden, CO, USA, 2014.
Figure 1. Typical structure of a DC microgrid.
Energies 15 02140 g001
Figure 2. Proposed control strategy based on voltage-based DR and SBs.
Energies 15 02140 g002
Figure 3. Diagram of an example 30-bus DC microgrid (Bxx denotes for the order of bus in the considered DC microgrid).
Energies 15 02140 g003
Figure 4. DCM’s operating cost under the DQN-based MPC approach.
Energies 15 02140 g004
Figure 5. Voltage deviations with DQN-based MPC approach.
Energies 15 02140 g005
Figure 6. DCM’s operating cost with SP-based MPC approach.
Energies 15 02140 g006
Figure 7. Voltage deviations with stochastic-based MPC approach.
Energies 15 02140 g007
Figure 8. Effect of voltage-based DR on DCM’s operating cost: (a) with voltage-based DB; (b) without voltage-based DR.
Energies 15 02140 g008
Figure 9. Effect of voltage-based DR on SB’s charge/discharge power: (a) with voltage-based DB; (b) without voltage-based DR.
Energies 15 02140 g009
Figure 10. Voltage regulation with different load conditions: (a) normal condition; (b) uncertain condition.
Energies 15 02140 g010
Table 1. Review of some relevant studies about DC microgrid optimization problems.
Algorithm TypeModel TypeRef.Voltage-Based DRBattery
Dispatch
Model-basedOptimization[15,18,19]
[20]
[22]
Simulation[16,17,21,28]
MPC[25,26,27]
Data-basedMPCThis study
Table 2. 30-bus DCM-related parameters.
ParameterUnitValueParameterUnitValue
P W m a x MW 2.0 D L c r i ( t ) MW ~ U ( 2.5 ,   5.0 )
P S m a x MW 4.0 D L c o n ( t ) MW ~ U ( 1.5 , 3.0 )
P G m a x MW 10.0 U d c l i m ( t ) V 110
P E m a x MW 0.5 I d c ( t ) A 10
B d c mF 50 D L m i n ( t ) % 2.0
R d c Ω 0.5 D L m a x ( t ) % 5.0
Publisher’s Note: MDPI stays neutral with regard to jurisdictional claims in published maps and institutional affiliations.

