Article

Charging Electric Vehicles from Photovoltaic Systems—Statistical Analyses of the Small Photovoltaic Farm Operation

1
Department of Transportation and Informatics, University of Economics and Innovation in Lublin, 20-209 Lublin, Poland
2
Department of Power Engineering and Transportation, Faculty of Production Engineering, University of Life Sciences in Lublin, 20-612 Lublin, Poland
3
Department of Transport and Logistics, Institute of Technology and Business in České Budejovice, Faculty of Technology, Okružní 517/10, 370 01 České Budejovice, Czech Republic
4
Department of Automation, Faculty of Mechanical Engineering, Lublin University of Technology, 20-618 Lublin, Poland
5
Department of Sustainable Transport and Powertrains, Faculty of Mechanical Engineering, Lublin University of Technology, 20-618 Lublin, Poland
*
Authors to whom correspondence should be addressed.
Energies 2022, 15(6), 2137; https://doi.org/10.3390/en15062137
Submission received: 5 January 2022 / Revised: 15 February 2022 / Accepted: 11 March 2022 / Published: 15 March 2022

Abstract

:
Zero-emission transport is a very important topic that is increasingly taken up by many institutions and research centers around the world. However, the zero-emissivity of the vehicle is quite a complex issue, which should be understood as not only the lack of emissions during the operation of the vehicle, but also the provision of clean energy to the vehicle. In this approach, charging the battery of an electric vehicle from renewable sources—a photovoltaic (PV) farm—and its operation can be considered as a totally zero-emission form of transport. The article presents a PV system containing two micro-installations with a capacity of up to 40 kWp each to supply electricity to two parts of the Lublin Science and Technology Park (LSTP) building. Thanks to the innovative monitoring system, it was possible to analyze the consumption and production as well as the effective use of electricity. Statistical analyses of consumption (charging the electric vehicle battery) and electricity production by the PV installation were carried out. It was found that charging an electric vehicle could be a good way to use the surplus energy production from the farm and thus a faster repayment on investment in the PV farm installation.

1. Introduction and Literature Review

The automotive industry is currently experiencing enormous changes caused by various factors, which are dominated by economic, technical, energy, and social factors. Among the latest factors, the most significant ones are consumer changes and the epidemic threat caused by the SARS-CoV-2 virus. The global influence of the virus disrupted the current order in many areas of human life, affecting economic systems and many of its sectors, including the transport sector and air pollution [1,2]. Disrupted logistics chains have become the basis for the problems of the entire automotive industry related to production downtime and shortages of selected vehicle components. Despite these recent problems, the automotive industry has experienced tremendous development in the last two decades. It is visible, inter alia, in the improvement of the design of internal combustion engines (ICE) [3,4,5,6,7,8], the existing power supply systems for spark ignition engines [9,10,11,12] and diesel engines [13,14,15,16,17], the production and development of alternative fuels [18,19,20,21,22], and the development of innovative vehicle drives such as hybrid systems [23,24,25,26] or battery electric vehicles (BEV) [27,28,29]. Moreover, very advanced works are underway on the method of changing driving, i.e., development works on fully autonomous vehicles [30,31,32,33,34].
In the case of passenger cars powered by an ICE, there is a clear departure from diesel engines in favor of small, supercharged spark-ignition engines. According to the report from 2021 [35] of the European Automobile Manufacturers Association, the share of passenger cars with diesel engines dropped to 42.3% in 2019. On the other hand, there is also a constant interest in researching alternative fuels to power internal combustion engines [36,37,38,39,40,41]. Among the research on fuels, the large share of gaseous fuels should be emphasized, from LPG popular in many countries [42,43,44], to natural gas [45,46,47], CNG [48,49,50], LNG [51,52,53,54], or others [55,56,57,58,59]. PEM fuel cells are another widely studied alternative energy storage solution [60,61]. Over the last decade, a significant increase in the interest of manufacturers in hybrid drive systems has been noticed. This is also reflected in a large amount of research work in this area, such as [23,62]. Equally great interest is visible in the case of BEV, which proves the ongoing revolution in transport for electro mobility. More and more countries are interested in electro mobility, which can be seen in government strategies for transport in cities and incentives to purchase electric vehicles (EV) for companies, fleets, and individual drivers. Therefore, public transport vehicle managers buy electric and hybrid vehicles. Hybrid systems minimize the use of ICE and limit their negative impact on the environment, integrating them with electric motors [63]. The issue of the operation of electric vehicles is now a very important topic raised by many researchers [64,65,66,67,68]; they concern road tests [28,69,70], issues of charging the batteries of these vehicles [64,71,72,73], and the disposal of lithium-ion batteries from electric vehicles [74]. Changing the powertrain of vehicles causes big changes also for the energy sector, which was noted in the following scientific publications [75,76]. The development of electric drives is also important for the development of self-propelled vehicles that are fully autonomous. This type of vehicle, however, constitutes a separate, quite extensive part of the transport sector and multi-faceted scientific research in this area [30,31,32,77,78].
The energy intensity of transport is a topical topic all over the world [79]. Highlighting technologies that ensure a clean environment is very much required for modern cities, where the significant development of transport causes an increase in pollution and other serious environmental problems [24]. Global warming and air pollution are largely caused by the emission of pollutants and greenhouse gases [80]. They are emitted from many anthropological sources, primarily industrial and transport activities [81,82]. The objective adopted by the European Union to reduce greenhouse gas emissions by 55% by 2030 and achieve full climate neutrality by 2050 means that the market for alternative energy sources must be developed dynamically [83]. For these reasons, solutions are sought to combine low-emission or zero-emission energy sources with means of transport. Electric cars, charged with electricity generated by photovoltaic systems, are becoming completely zero-emission vehicles.
Photovoltaic systems could be also categorized depending on the amount of electricity generated. In this regard, Polish law distinguishes micro-installations with a capacity of up to 40 kWp [84]. Micro-installations are sufficient to cover the energy demand of individual households or smaller buildings of public institutions. The surplus of generated energy from such installations is transferred to the power grid based on a prosumer agreement. The degree of use of the produced electricity for one’s own needs depends on the size of the PV installation and the individual demand of a given building for this energy [85]. An alternative to powering the power grid from the excess of produced electricity is the accumulation of this energy in stationary or traction batteries used to power vehicles. Unfortunately, the storage of electricity in stationary batteries has some specific technical limitations.
Scientists from universities and research and development centers of large global corporations are concentrating their resources in various research areas. One of them is the efficient design of photovoltaic plants [86]. It includes the theoretical and experimental study of photovoltaic systems assembly in various environmental conditions [87]. During the design of individual components of the photovoltaic system, as well as the design of the installation itself, environmental aspects related to their potential for subsequent recycling should be considered [88].
Thanks to the progress in the field of energy inverters and developments in materials engineering, it is possible to improve PV systems based on the latest engineering materials. Currently, the most commonly used materials for the construction of PV panels are composite materials presented, e.g., in [89], metal nanofibers [90], polymeric materials for photon management [91], and the increasingly popular perovskites [92]. Modern engineering materials make it possible to increase the efficiency of PV systems, reduce their price, and increase resistance to unfavorable weather conditions [93]. In the works [93,94,95], the authors pointed out that impacts caused by unfavorable weather conditions, such as hail, may damage the PV panels, which in turn reduces the efficiency of the entire PV system. For these reasons, it is so relevant to study and understand the operating conditions of the system in order to effectively counteract the existing problems.
Scientists are still working on mathematical methods for assessing the electrical characteristics of photovoltaic panels [79]. Effective control of a photovoltaic installation in terms of production and consumption of generated electricity requires precise measurements. Measurements of these parameters are relevant from the viewpoint of managing the generated electricity and its use to charge batteries [96]. The values of the measured parameters are processed, and the obtained results are used to optimize the operation of the entire system. Of course, the developed control algorithms should be thoroughly checked and tested in real conditions [97]. Modern photovoltaic inverters and energy management systems are more and more advanced; they can have innovative functions related to, for example, detecting the amount of dirt on the panels and generating messages about the need to clean them [98]. The same is true for short-circuits in the installation, which are automatically detected and precisely located [99]. Thanks to the more and more frequently used individual optimizers, it is possible to monitor the operating parameters of each panel [100,101]. With the help of intelligent measuring systems, the exact values of the electricity generated in the PV system are obtained and it is possible to monitor the energy consumption of the building or other energy-receiving facility.
The production of electricity by photovoltaic systems is characterized by a high variability of the produced energy depending on weather conditions. Additionally, the amount of electricity consumed by the building is highly variable in different periods (e.g., working days vs. weekend days or summer vs. winter). Both the amount of energy produced by the PV system and used by the building ought to be constantly monitored. Performing an accurate energy balance can be used in energy management for optimal use.
The aim of the research is to use an innovative system for measuring the parameters of a photovoltaic micro-installation (energy produced by PV and consumed energy) to manage the flow of electricity in the system including: PV installation, Lublin Science and Technology Park (LSTP) building, and carport. On the other hand, the purpose of managing the electricity produced by a PV micro-installation is to use it to the maximum for its own needs, which will allow for the fastest repayment on investment in the construction of a PV installation in the tested facility. Due to the unfavorable changes in the Polish law concerning electricity prosumers, which come into force on 1 April 2022, it is important to use the produced energy from PV installations for one’s own needs even more. This study presents the possibilities of using PV installations in the LSTP building. The work of the installation with energy production supplied to the power grid, as well as the use of the generated energy for the building’s own needs and charging BEV with the use of a carport charger was analyzed. The results of the analysis are valuable for the development of regional installations of this type in public buildings. Moreover, it may constitute “good practice” for buildings with similar energy demand of facilities around the world. Additionally, it may enhance the development of electro mobility in the near future by using RES to charge vehicle batteries.
The article presents the energy infrastructure located in the LSTP and it is described in detail in Section 2. Section 3 presents the results of the research throughout the year (12 full months) and their analysis. Particularly in Section 3.1, the emphasis is placed on measuring the energy produced by two photovoltaic micro-installations with a capacity of 40 kWp each. The production of electricity by photovoltaic systems and the demand for electricity in selected months and selected days of the week are analyzed. That expert knowledge can be used in the future in algorithms that manage energy in a building. Section 3.2 depicts a statistical analysis of the energy produced by different PV systems. Section 4 contains the final conclusions resulting from the conducted tests and analysis performed.

2. Materials and Methods

The research used a terrestrial photovoltaic installation located in front of the building of the LSTP. For the construction of this, the LSTP system received funding from the Lublin Agency for Enterprise Support. This installation consists of 2 micro-installations with a peak power of up to 40 kWp each, using polycrystalline PV panels, and was commissioned at the end of 2018. The system described above is shown in Figure 1.
Both micro-installations have been connected to two zones of the building and supply different types of electrical devices in the building. The first micro-installation supplies Sector 4 of the building, where most of the electricity is consumed to supply the server room. The second micro-installation is responsible for powering Sector 5, where most of the electricity is consumed by room lighting and air conditioning, as well as the office equipment and low-energy laboratory and research equipment.
At the LSTP, the infrastructure for producing energy from renewable sources has been constantly expanded since 2015. The first investment of this type was the photovoltaic carport with a capacity of 3 kWp, built in May 2016. It was built to charge a Renault Twizy electric vehicle with PV energy. When the electric vehicle was not charged with energy from the carport, it transferred the generated energy to Sector 4 of the LSTP. The presented carport was used not only to present innovative technologies to employees and guests at the LSTP, but it was also used for scientific research. Positive experiences related to the use of the carport to charge an electric vehicle and supply energy to the LSTP building prompted the authorities to make further investments in renewable energy sources. At the end of 2018, a photovoltaic farm with a total power of 80 kWp was commissioned. The photovoltaic farm was divided into two separate micro-installations with a capacity of up to 40 kWp, supplying two LSTP sectors which resulted from the law in force in Poland at that time. Since the launch of the photovoltaic farm, the amount of energy produced has been constantly monitored by the monitoring system. The acquired measurement data has been stored in the cloud and processed for economic and scientific purposes.
Figure 2 shows the overall diagram of the electrical connections of the PV system to the LSTP building.
The analysis of data from the operation of a PV farm covers the period from 1 May 2019 to 30 April 2020. The statistical analysis of the collected data was performed with the use of the Statistica 13.3 software. An analysis of the correlation of individual variables (energy fed into the grid, energy taken from the grid, and energy produced from the photovoltaic panels and energy produced by the carport) was performed.

3. Results and Discussion

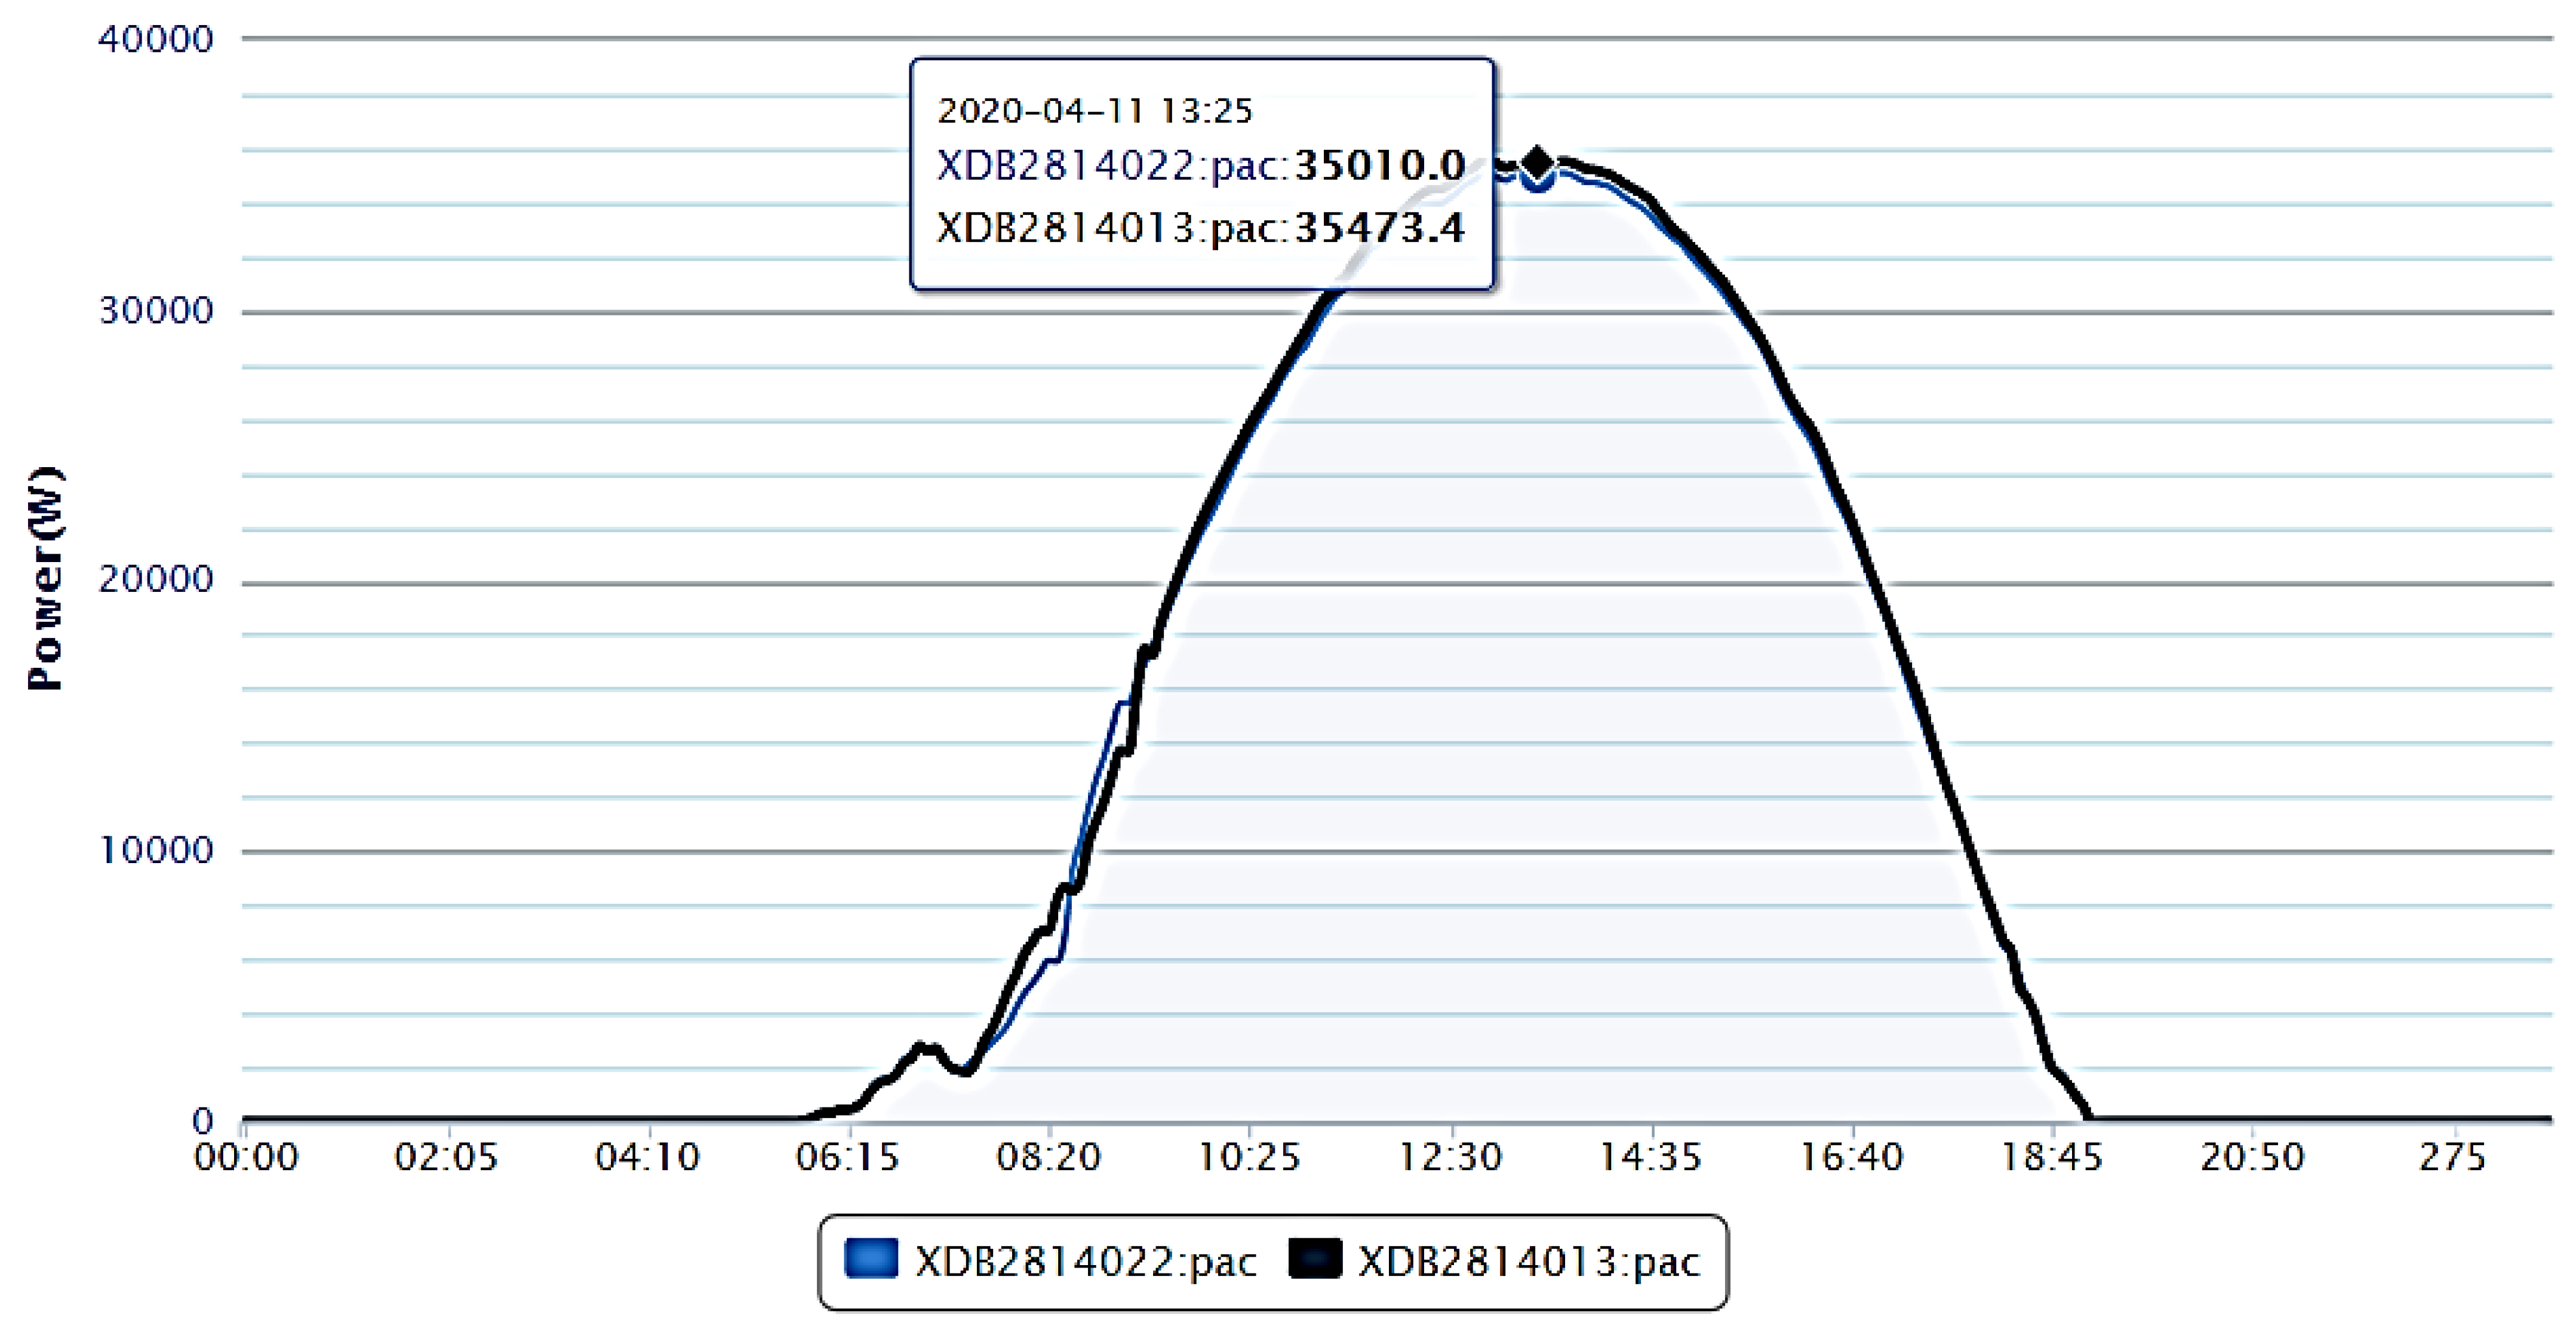
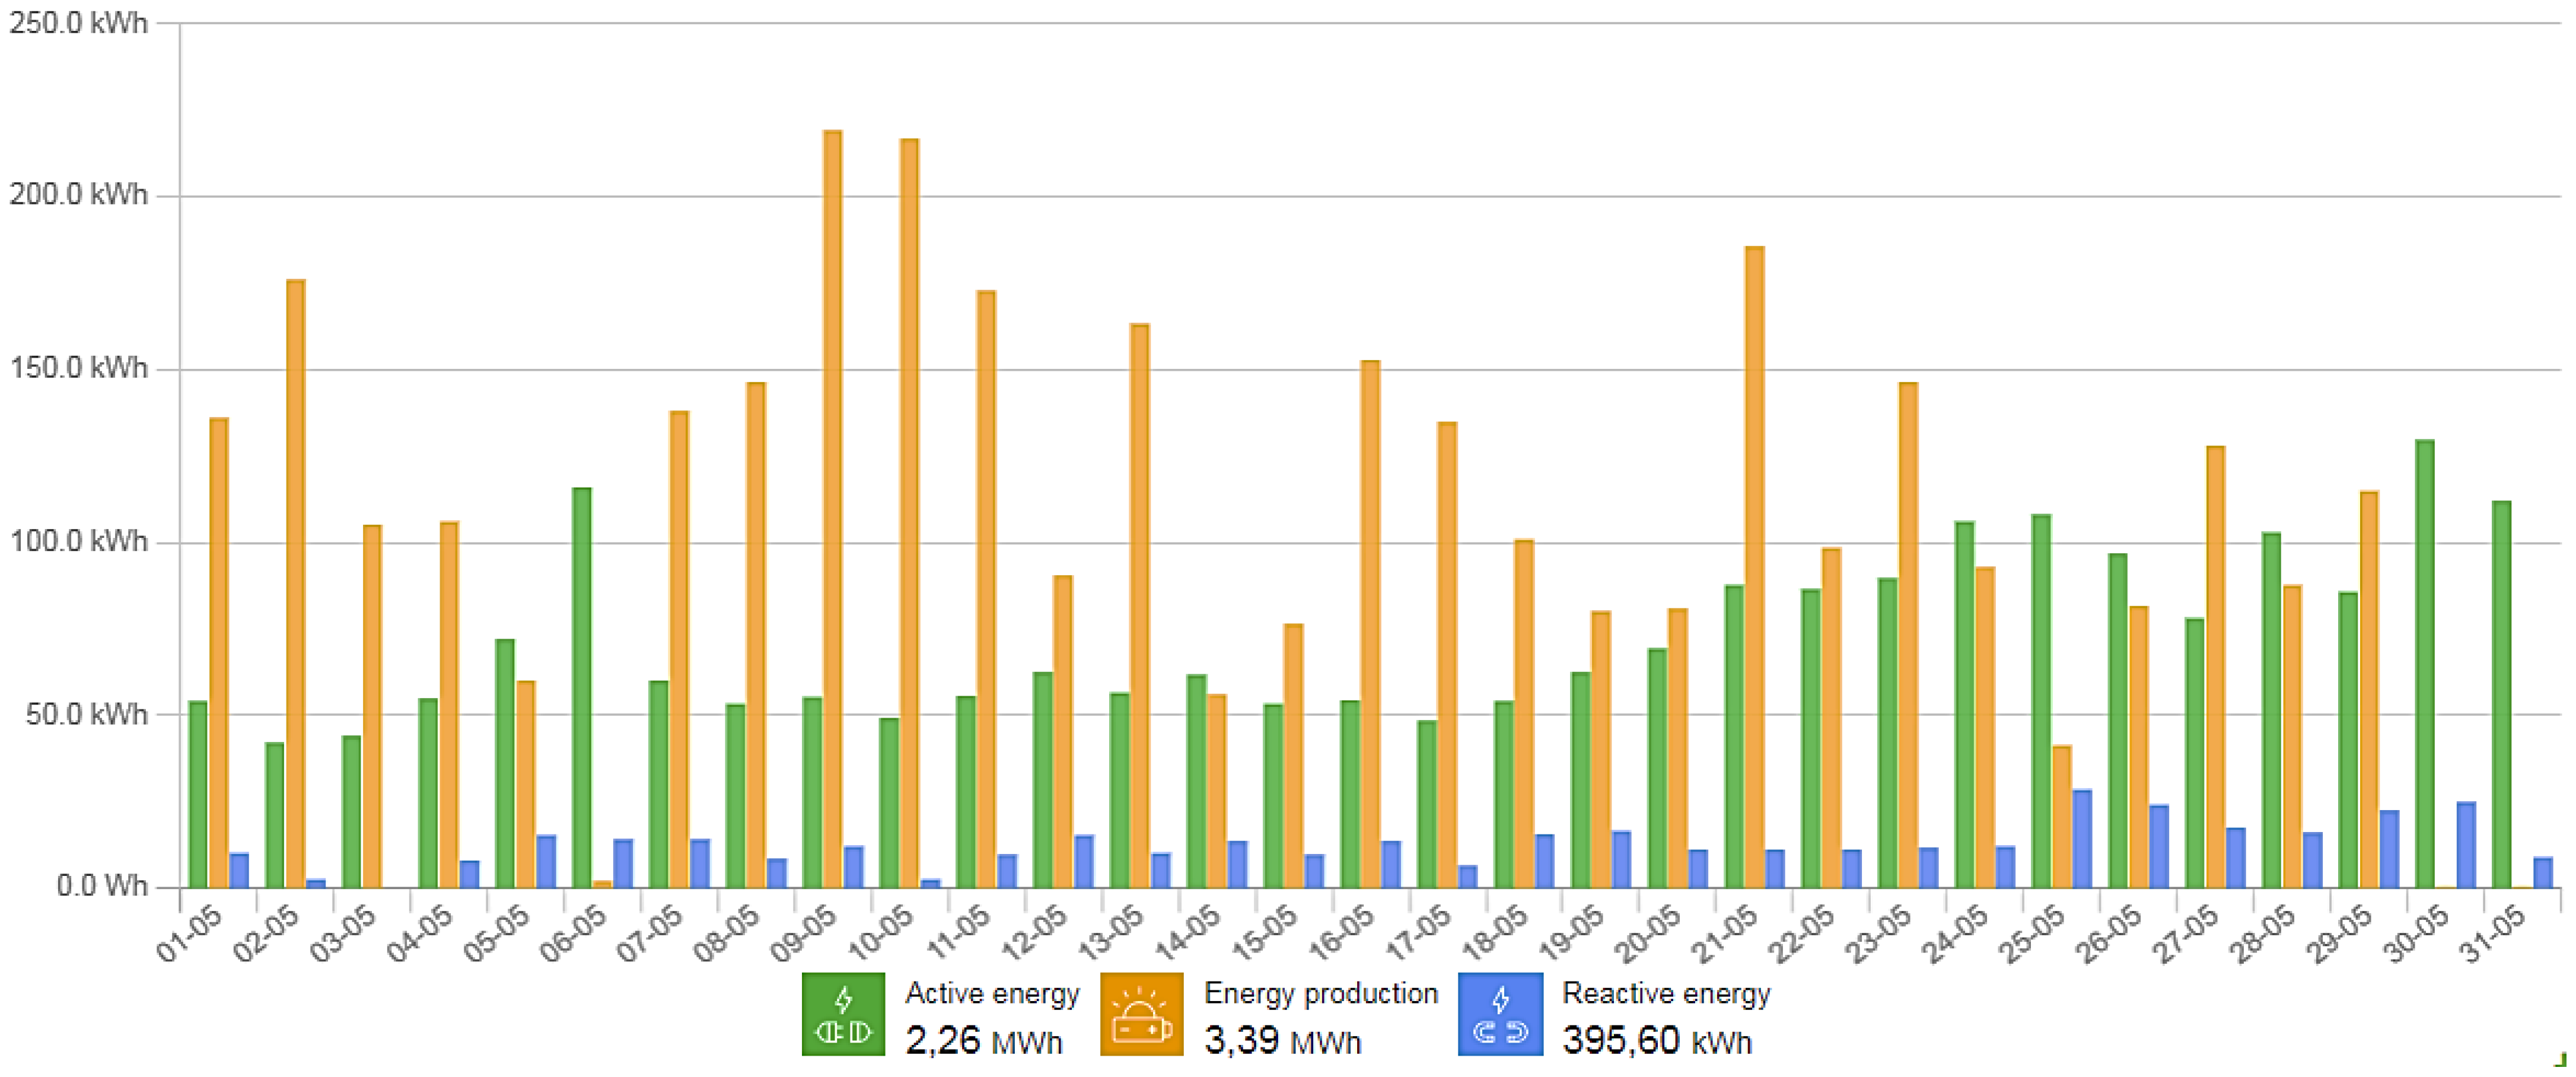
3.1. Energy Generated by PV

Currently, most of the photovoltaic inverters are equipped with the function of measuring the instantaneous power and the amount of generated energy. The measured parameters can be sent via wire or wirelessly to the server of the inverter manufacturer. In order to gain access to the data stored on the server, an account [103] must be created and configured. The amount of data obtained depends on the type of inverter. This can be a regular measurement of the system power (in kW) or single strings, as well as individual panels, and the quantity of electricity produced (in kWh), which ordinarily takes place in a time interval of 15 or 20 min. The inverter manufacturer stipulates in the inverter manual that the displayed values may differ from the actual values of the measured parameters and cannot be used for billing purposes with the transmission company. The parameters recorded by the inverter are required for the operational control and control of the current to be fed into the power grid. It should be added that the inverter does not have a calibrated meter.
An example of continuous power generated by two micro-installations of 2 × 40 kWp is shown in Figure 3. Observing this graph, you can see a very smooth growth in the generated power depending on the height of the sun above the horizon. The presented data relate to a completely cloudless day (11 April 2020), which means that there are no large fluctuations in the power generated by the PV system. The maximum power of 70,701 kW was obtained then, which is 88.37% of the peak power of the system with a power of 80 kWp, measured in appropriately defined conditions.
Figure 4 shows an example of the energy generated by two micro-installations of 2 × 40 kWp per month (April 2020).
By analyzing both micro-installations, it can be concluded that they obtain very similar instantaneous power generated, and thus very suchlike quantity of energy produced. Therefore, the data obtained from the system can be considered separately for each micro-installation or jointly, as shown in Figure 5. Using the Export button (visible in the upper left corner in Figure 5), you can export measurement data from the system at any time.

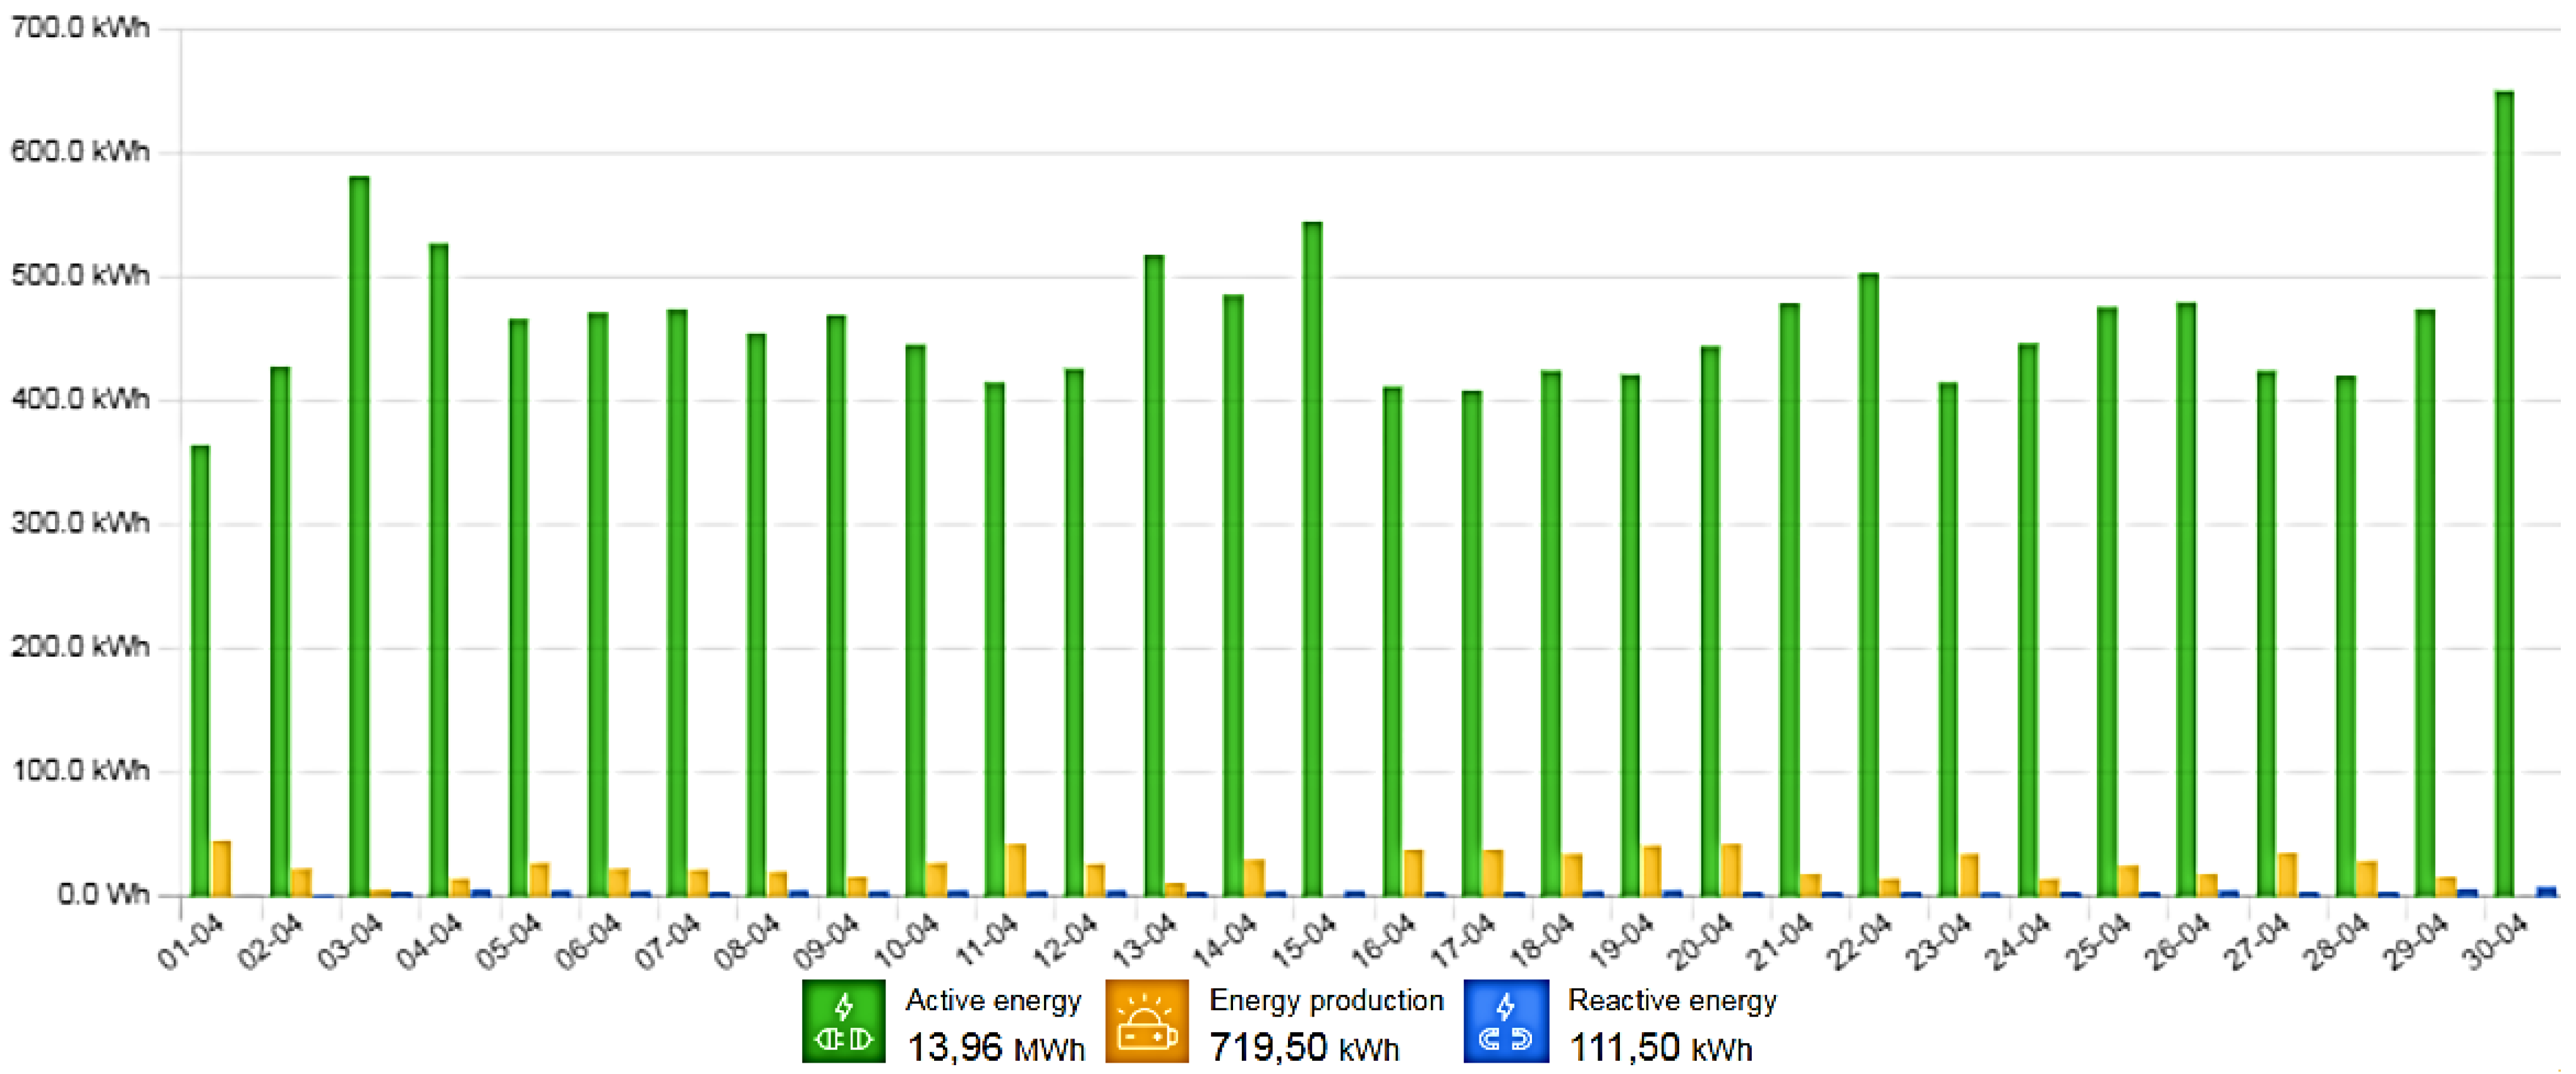
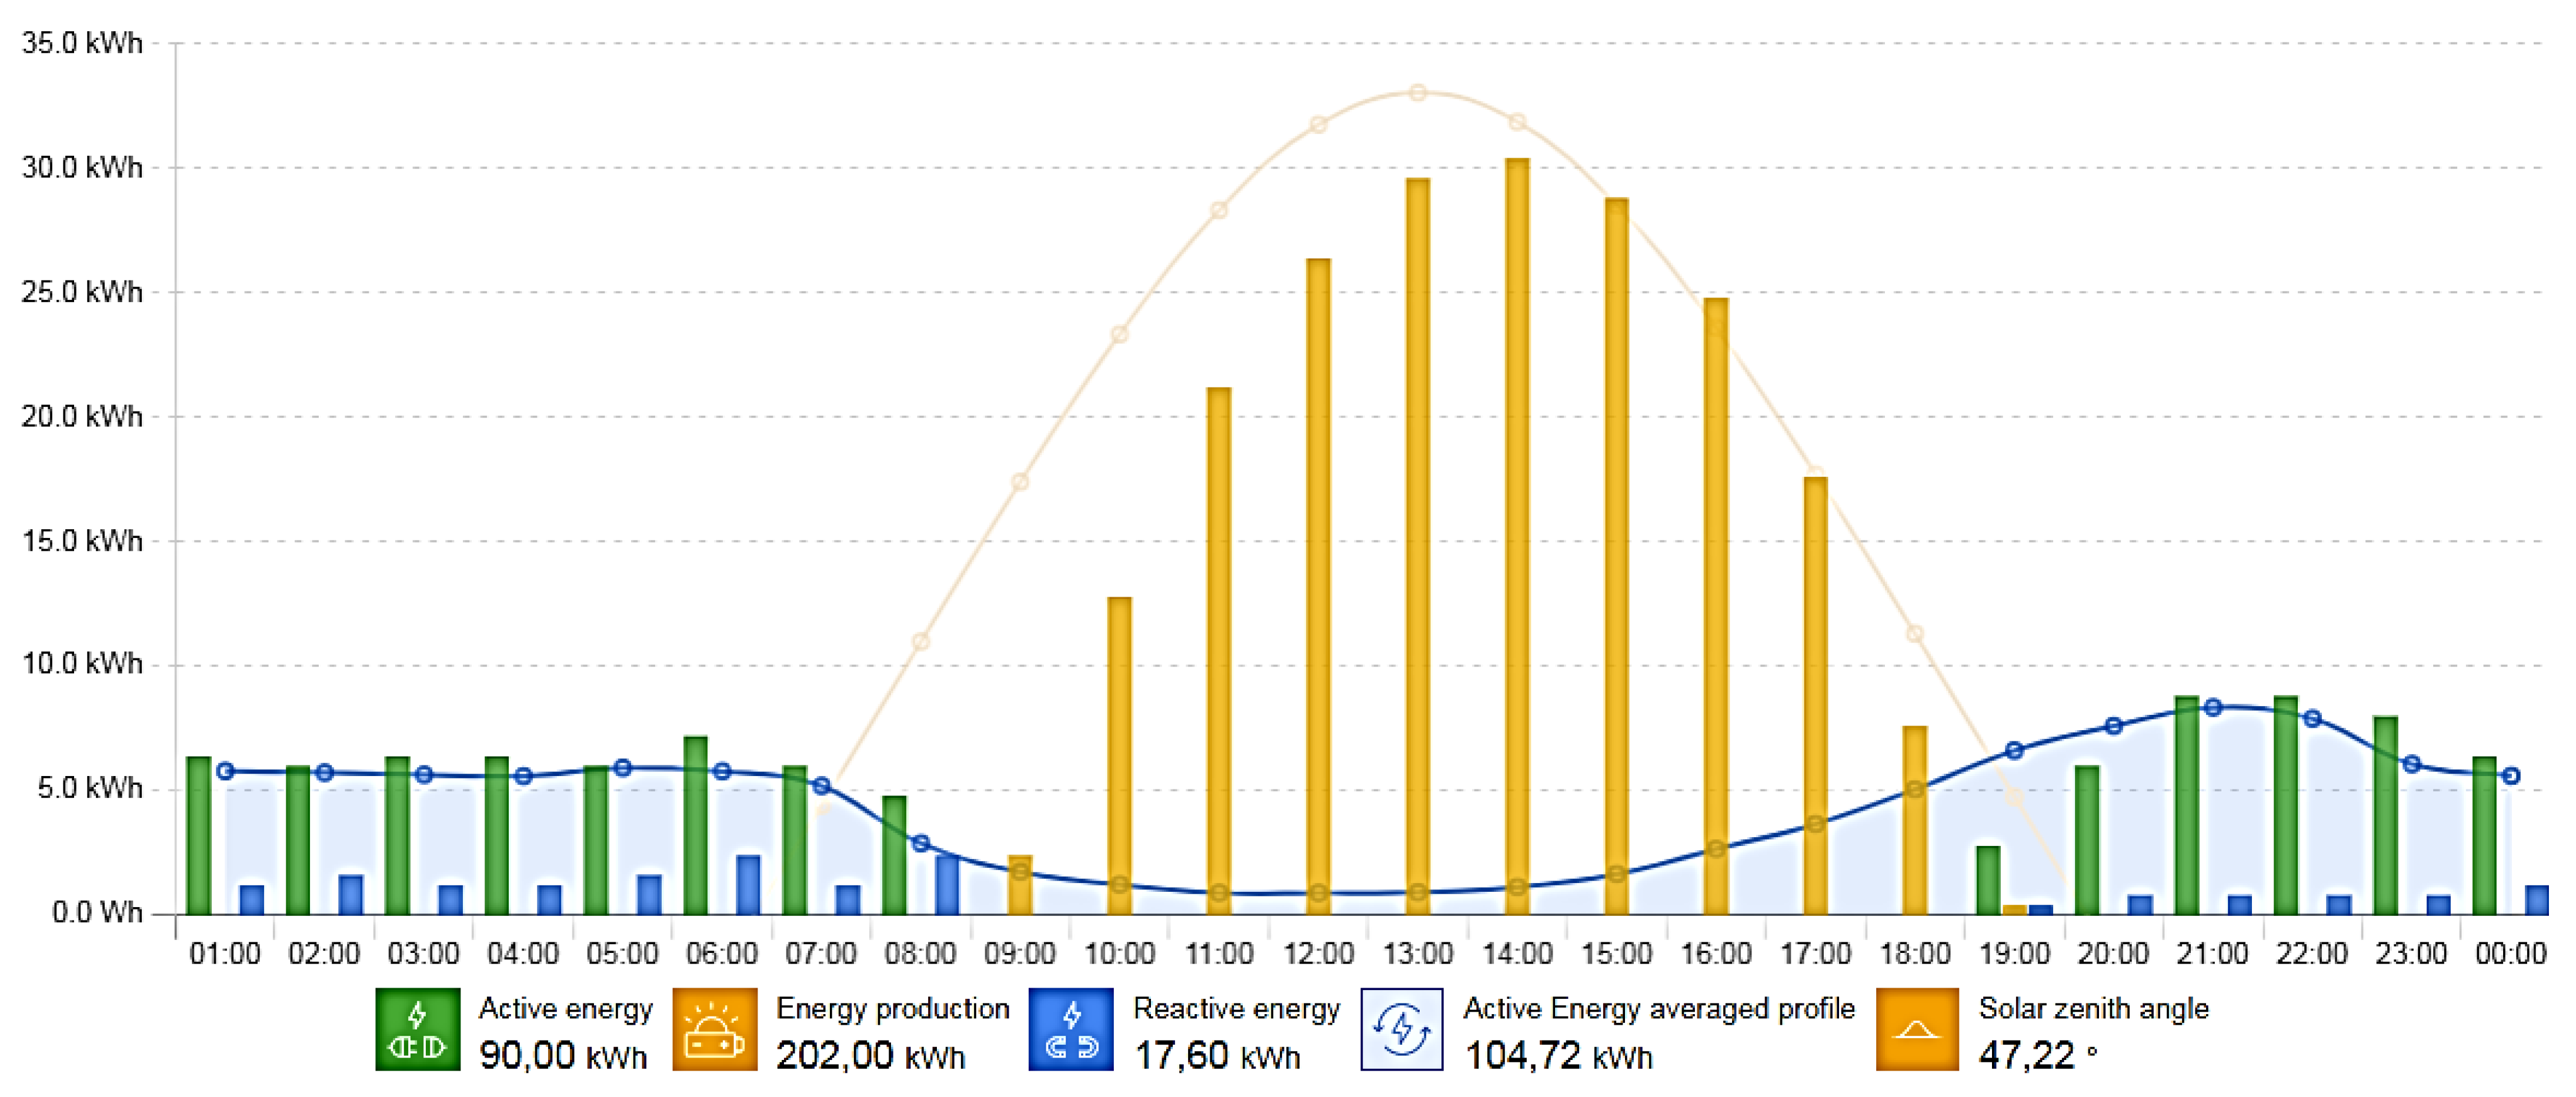
3.2. Electricity Demand of the LSTP Building

A bidirectional electricity meter was used to determine the quantity of energy taken from the power grid and the surplus from micro-installations supplied to it. An innovative measurement system was used for the automatic acquisition of data from electricity meters installed in Sectors 4 and 5 in the LSTP (Figure 6). This system was used to monitor the energy flow and analyze the consumption and production of electricity and its effective use in the facility [85,104]. The system consists of the following elements:
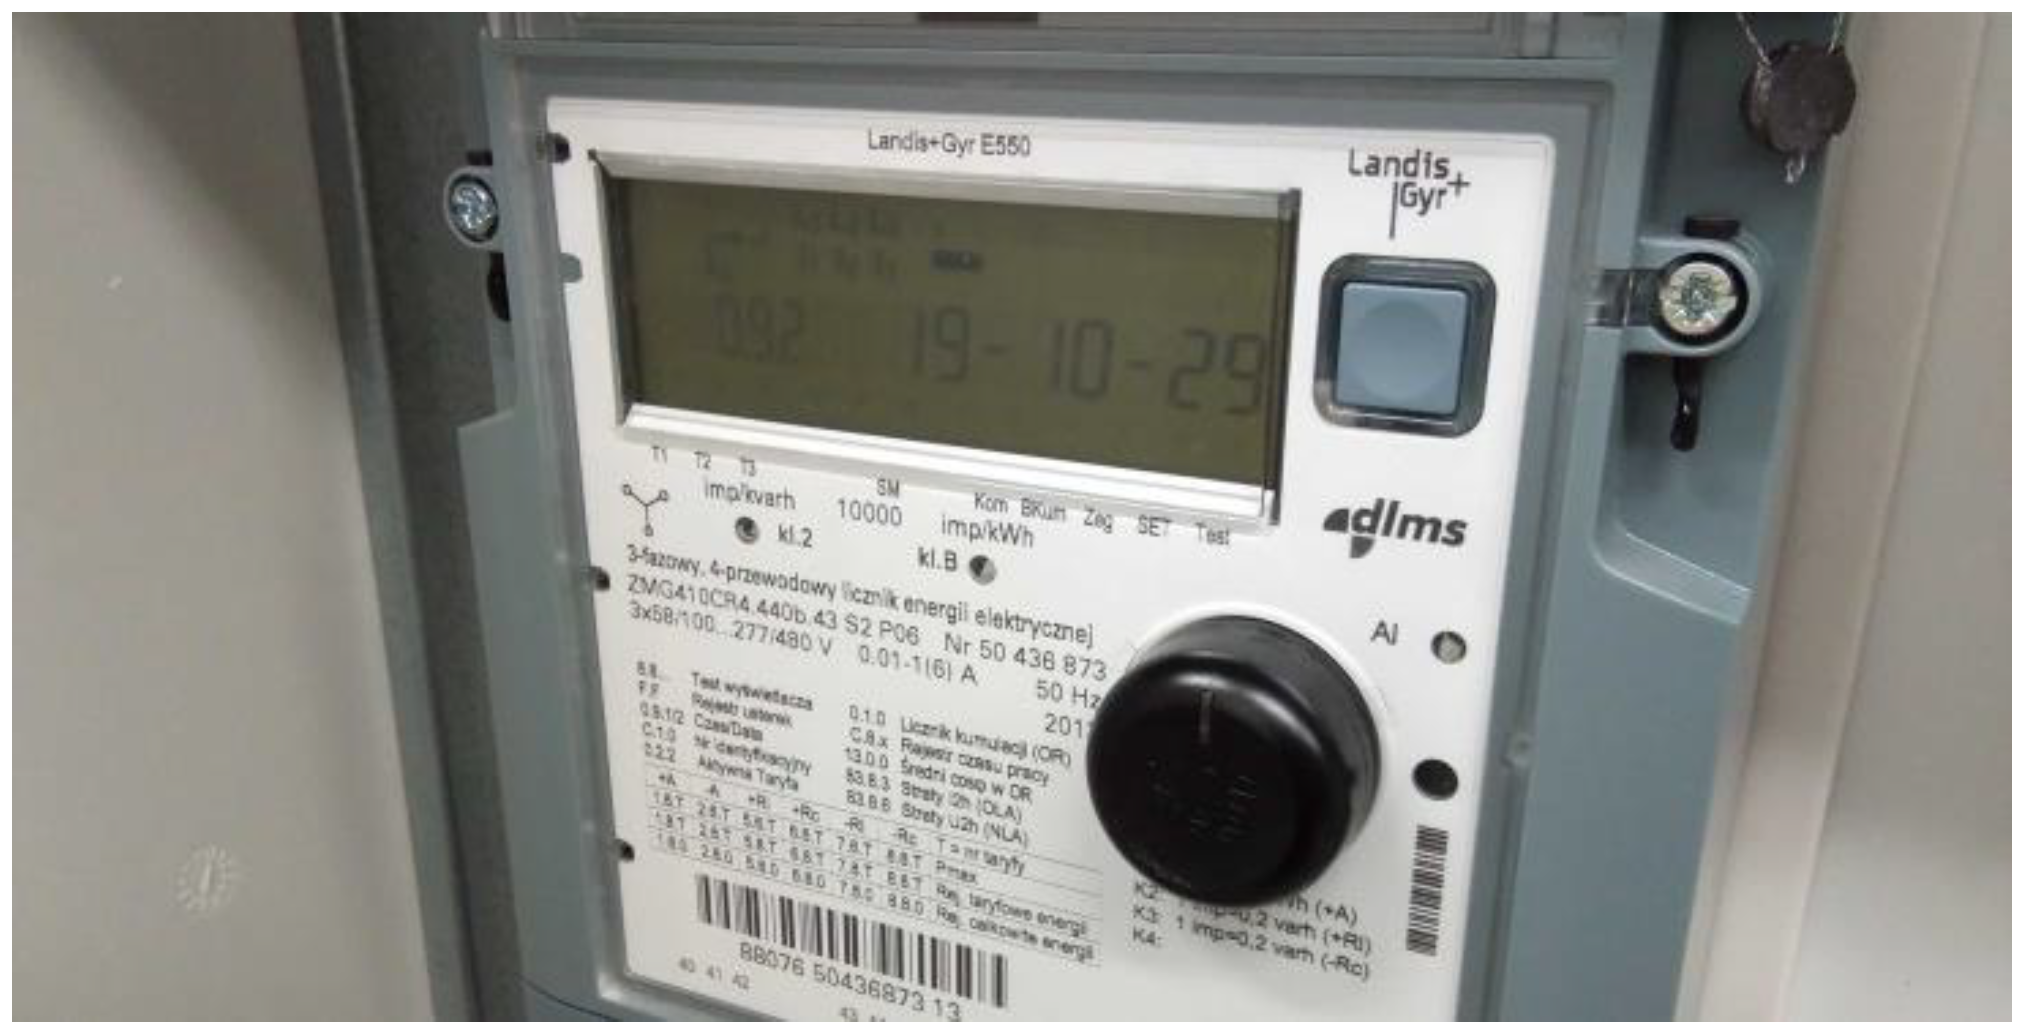
  • The hardware in a form of a small, battery-powered device for reading data from an energy counter.
  • The application in a form of an Android smartphone application to synchronize data from the device (via Bluetooth Low Energy) as well as online gateway.
  • The cloud is an internet platform on which data from the measurement system is available (data export, profiles, reports, charts, and API access, etc.) and exported for offline analysis [85].
The main advantage of this measuring system is its versatility (used in single- and three-phase meters in power networks), simplicity, and quick and easy assembly. The system is dedicated for individual customers (used in private homes) and small enterprises that want to optimize electricity costs. It is mounted on the optical port of the energy counter and acquires measurement data through the IEC 62056-21 protocol, which allows it to work with various models of energy counters (Apator, Landis + Gyr, Iskra, Positron, and others). Recently, the SML (Smart Meter Language) protocol was implemented, which is used in Germany. Work is underway to add the DLMS (Device Language Message Specification) protocol. The measurement accuracy is ensured by an electric energy counter at the level of Class B 1.0 and 2.0, in the case of the measurement of active and reactive energy, respectively.
The measuring system is available in two versions. The Home version takes active used energy data and permits users to track its costs. The Business version also provides reactive energy data and makes it possible for users to adjust the ordered power. If we have installed a bidirectional energy counter for the photovoltaic system, the user additionally receives information regarding the energy supplied to the power grid.
The team is currently working on the second generation of the measurement system named IoT, which operates based on LoRA, LTE-M, and NB-IoT communication. The team uses the technological support of the Nordic Semiconductor. The project was awarded a grant from the Polish National Center for Research and Development, under which work is underway on intelligent algorithms and additional tools for energy management.
Two devices of the Business metering system for Sectors 4 and 5 in the LSTP, cooperating with bidirectional electricity meters, were purchased and installed. The measuring device in the form of a beacon uses Bluetooth transmission to send the obtained measurement data from the energy counter to the cloud. The collected data in the cloud can be read on a PC as well as on a mobile device [95]. The obtained data show that in April 2020 the LSTP photovoltaic installation produced 12.58 MWh of electricity (see Figure 7), while the production from both micro-installations was very close to the ratio of 50:50 (as shown in Figure 5).
Analyzing the data from Sector 4, it can be inferred that practically all electricity produced by one micro-installation was used for the LSTP building’s own needs. Out of the almost 14.6 MWh of energy produced, only 476 kWh were transferred to the power grid. This shows a good balance between the building’s energy demand and energy produced from PV micro-installations for one’s own needs, which gives a chance for a quick return on investment in the PV installation.
On the other hand, when analyzing the data for Sector 5 of the LSTP, a completely different tendency can be noticed (see Figure 8) than in Sector 4. There are significantly lower values of daily energy consumption in Sector 5 of the LSTP building and a much larger surplus of generated electricity sent to the power grid. In this sector, the PV installation operates largely under a prosumer agreement, which is less - beneficial for the investor.
Analyzing the data for Sector 5 in the LSTP building, it was shown that the surplus of energy produced from the PV installations ranged from a few to 30 kW (see energy production in Figure 8). This tendency continued practically during all days of the spring months of the year. The data presented in Figure 9 shows that large amounts of energy are fed into the grid daily from micro-installations connected to Sector 5 of the LSTP. An electricity distributor buys surplus energy from the company at very low prices. This affects the increase in time of the return of the money invested in the photovoltaic farm. Therefore, the LSTP authorities decided to use the surplus energy produced for their own needs, i.e., for partners and tenants in the LSTP.
In order to use the surplus energy for one’s own needs, the LSTP purchased an electric vehicle with a dedicated 22kW three-phase charger, as shown in Figure 10. This allowed for the surplus electricity produced to be used in Sector 5 from a PV micro-installation.
The amount of energy produced by the PV system and transferred to the power grid allows the traction batteries in several electric vehicles to be fully charged. The Renault Zoe shown in Figure 10 has a battery with an energy capacity of 40 kWh. This means that it is possible to fully charge it up to five times with the energy produced on 9 and 10 May 2020 (see Figure 12). It is relevant to mention that the vehicle can travel 300 km on a full battery. LPNT authorities have decided that it is better to use the energy produced to charge BEV than to resell it at low prices. The marketing effect related to supporting electro mobility by the LSTP will be more beneficial for the institution. In addition, it will be possible to continue further research on the use of energy produced from PV systems to power electric vehicles.

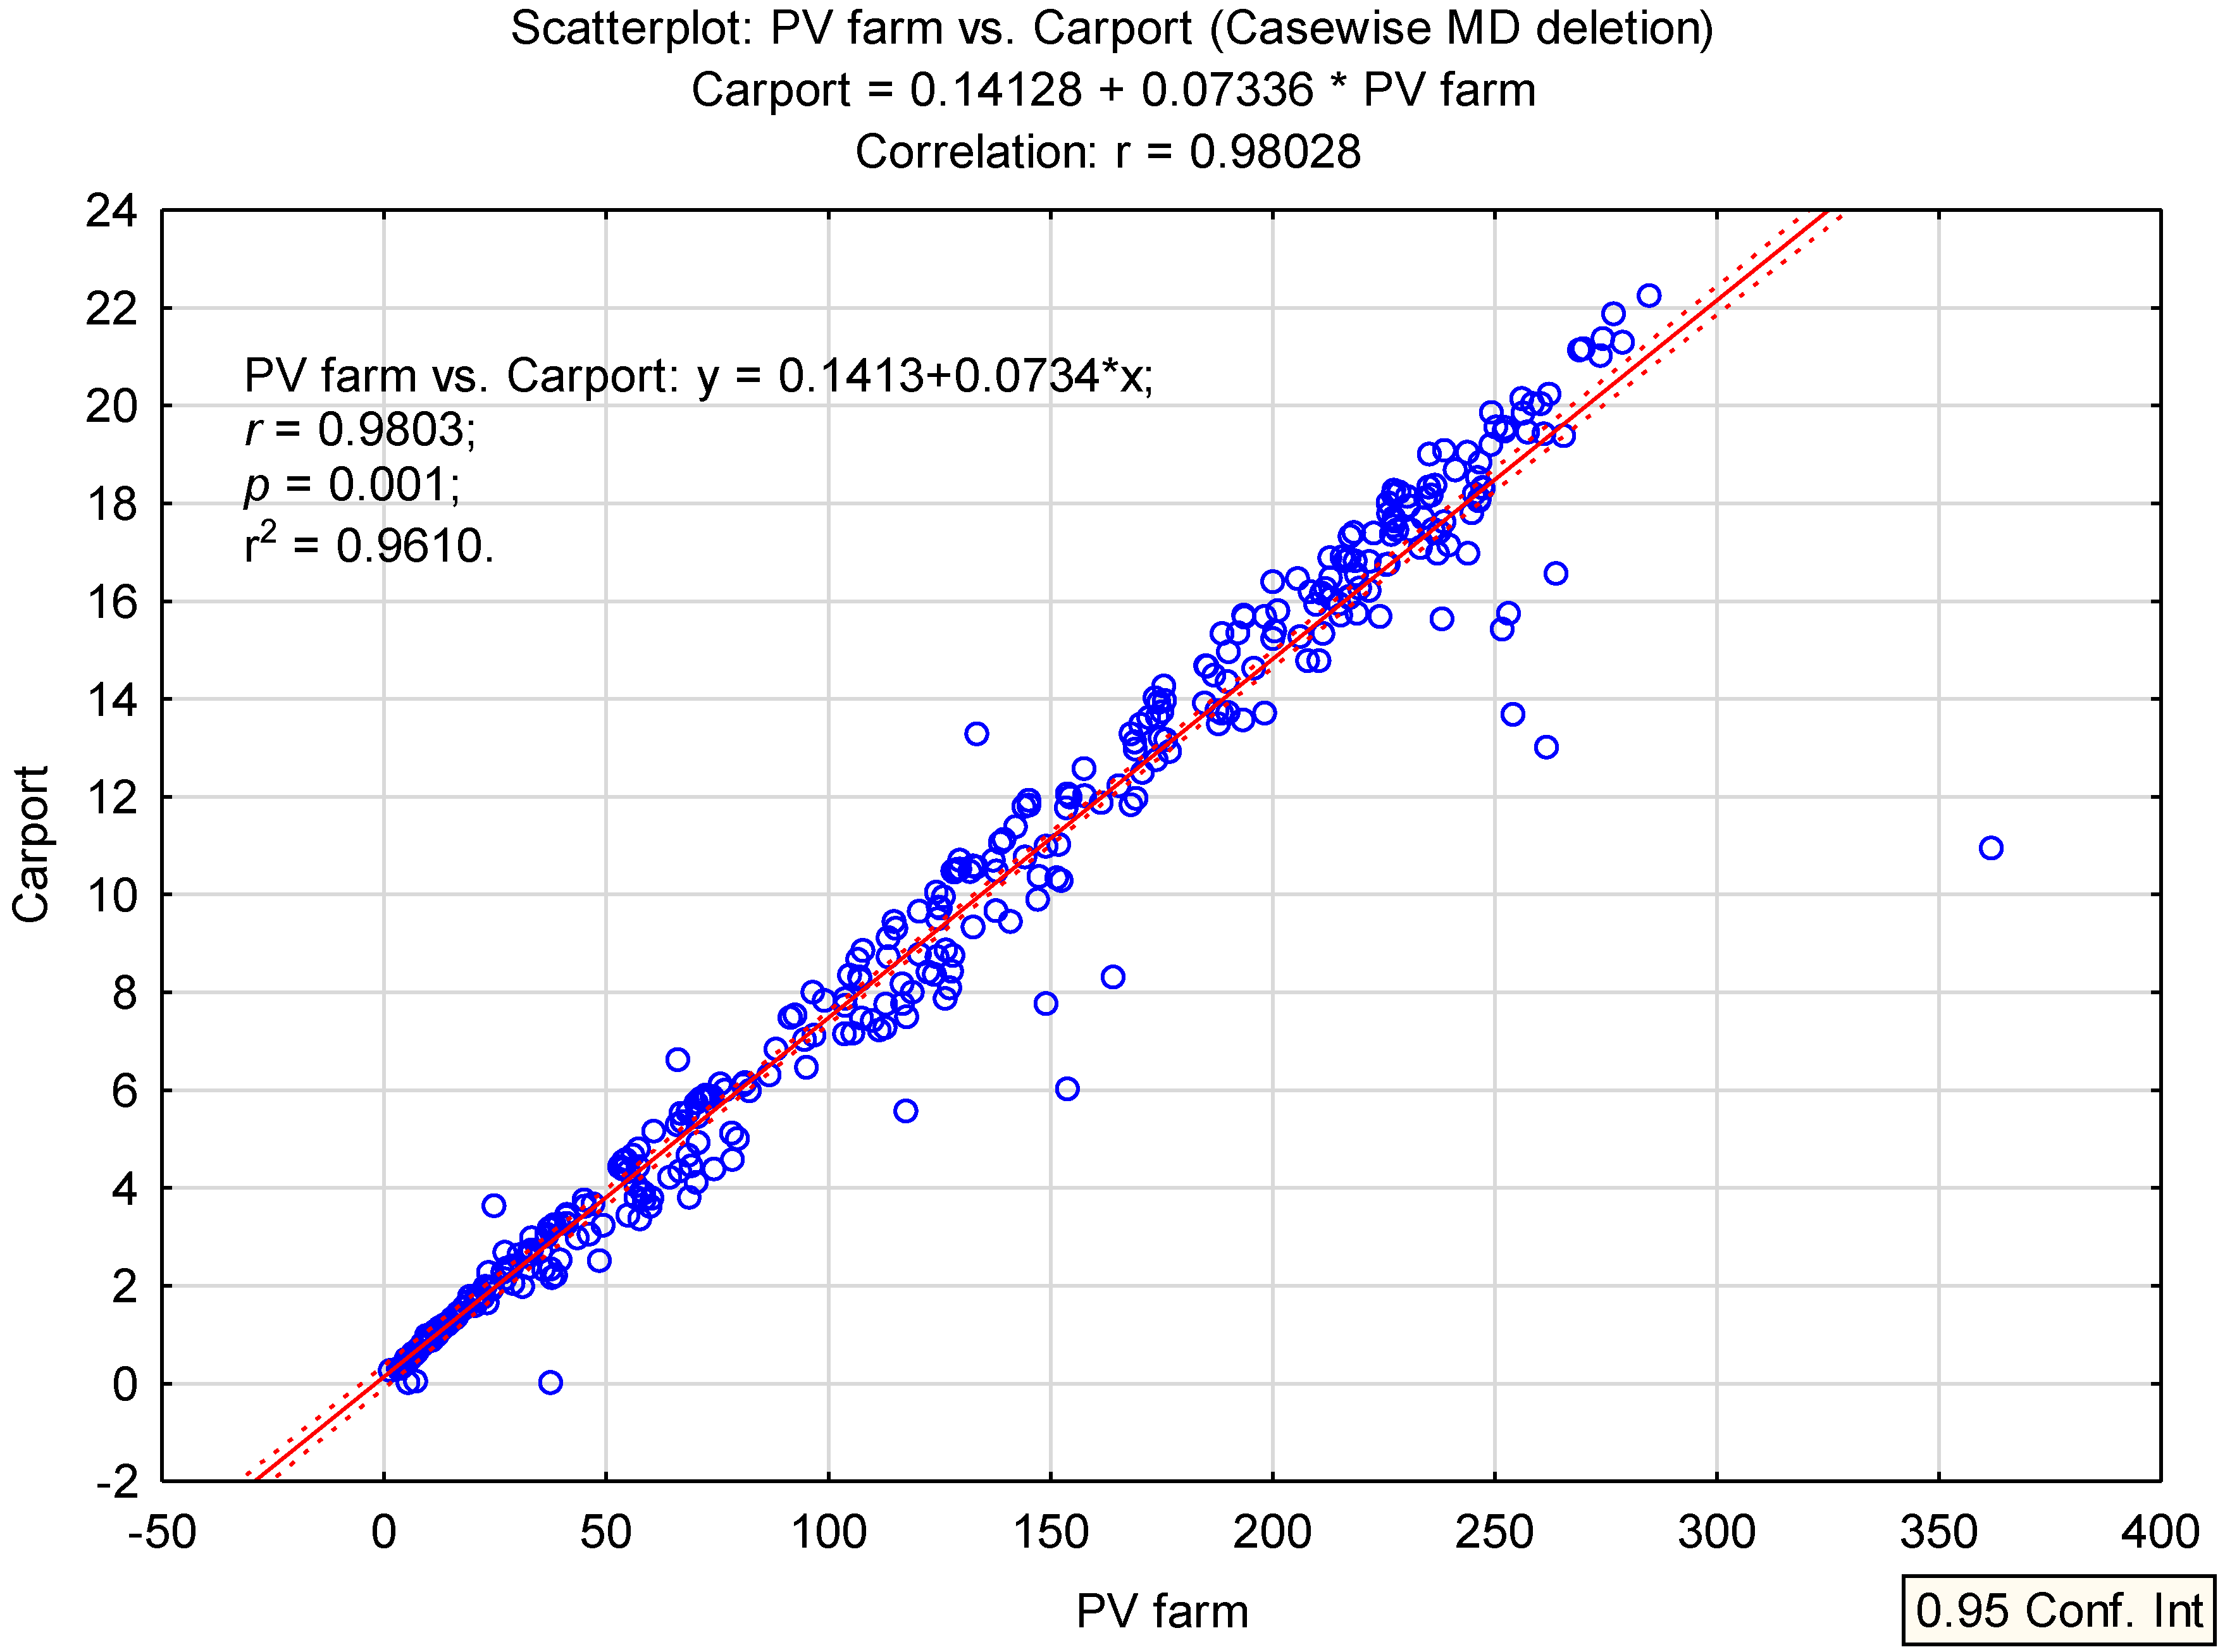
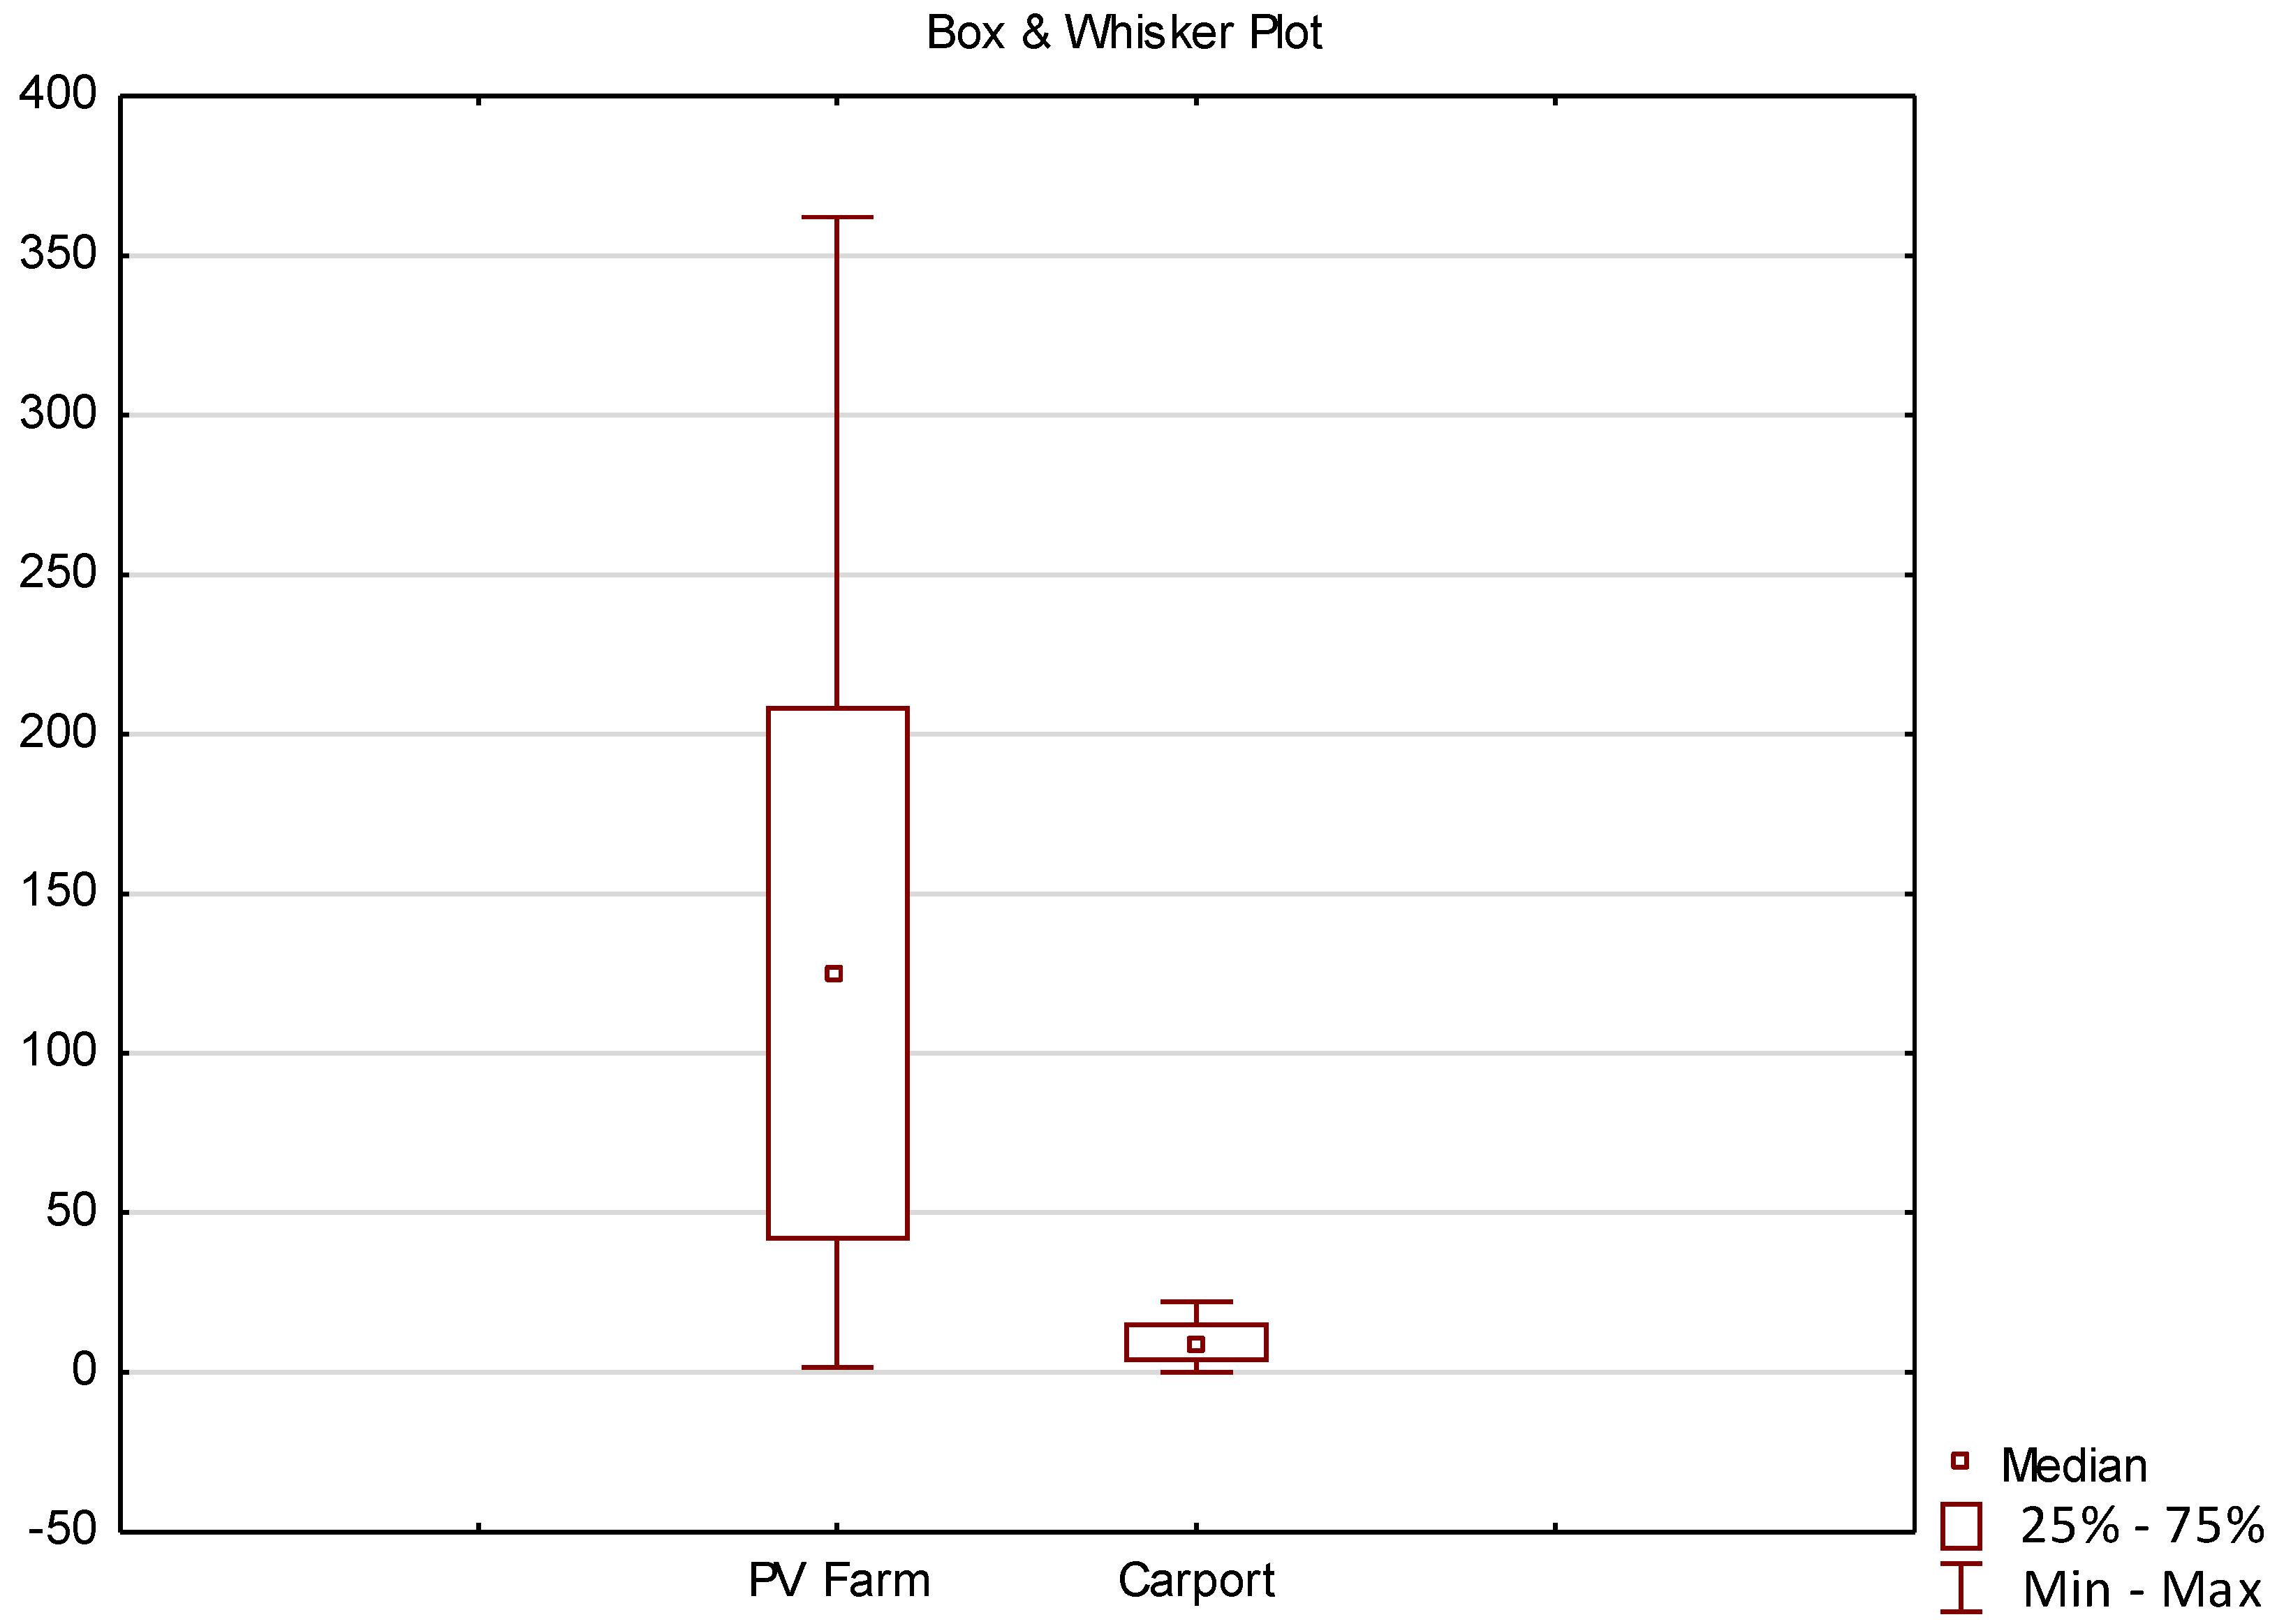
3.3. Statistical Analysis

In order to verify the collected data, a statistical analysis was performed with the use of the Statistica 13.3 SW. For this purpose, an analysis of the correlation of individual variables (energy fed into the grid, energy taken from the grid, and energy produced from the photovoltaic panels and by the carport) was carried out. The correlation between the variables X and Y is a measure of the strength of the linear relationship between these variables. The analysis of the correlation relationship between the examined features was started with the calculation of the correlation between the individual variables and the preparation of a chart. Charts that graphically represent the relationship between variables are called scatterplots. As the analyses interpret, the strongest correlation was noticed between the data on energy production by the photovoltaic panels and the carport.
Table 1 presents a summary of the statistical values of the individual variables.
Table 1 presents information on, inter alia, the largest dependencies, whether the correlation is statistically significant, and with what level of significance. The statistical test shows that the null hypothesis H0—Pearson’s linear correlation coefficient is 0, while the alternative hypothesis H1 ≠ 0, i.e., p < 0.05, means that the value of the correlation coefficient is statistically significantly different from 0, i.e., the relationship is significant, and the correlation coefficient is not statistically significant.
As the data presented in Table 1 shows that there is a strong correlation between the quantity of energy generated by the carport and the PV Farm, only the variables relating to these two relationships were included in the further analysis, as shown in Figure 11.
As we can see, there is a highly significant correlation between the production of energy by the PV farm and the carport (p = 0.001). As already mentioned, the value of the correlation coefficient is 0.98028. Moreover, as the coefficient of determination shows, the variability of one feature (e.g., energy production by the photovoltaic panels) up to 96% is explained by the variability of the other (i.e., energy production by the carport). This situation is shown in the scatterplot (Figure 11). As the analysis shows, the correlation between these variables is r = 0.98028, which means that there is a strong positive Pearson correlation between the amount of energy produced by the carport and the PV farm. Moreover, there is a statistical relationship between both variables, p = 0.001.
Figure 12 shows a simple regression graph of the carport’s electricity production and photovoltaic panels’ electricity production. The chart shows the 95% confidence interval of the regression line (the area marked by the dashed lines).
Detailed results of the statistical analysis of the correlation of the PV Farm and carport variables are presented in Table 2.
The individual fields of the results sheet contain arithmetic means of selected variables (9.34 for energy production by the carport and 12.537 for energy production from the photovoltaic panels) and the standard deviation values (6.4119 for energy production by the carport and 85.6888 for energy production from the photovoltaic panels). The Pearson correlation coefficient was 0.980335, and the determination coefficient (r2 square of the correlation coefficient) was as high as 0.961057. It is a descriptive measure of the accuracy of fitting regression to empirical data. It assumes values in the range < 0, 1> or in percentage < 0, 100%> and informs, according to the record, how much of the total variability in Y observed in the sample was explained (determined) by regression in relation to X. The greater r2, the better the relationship, and we can have more confidence in a possible regression line. The value of the t-statistic examining the significance of the correlation coefficient is 94.6489, the value of the test probability is p = 0.001, the size of the group is 365 cases, the intercept of linear regression Y with respect to X is 3.0, the coefficient of linear regression of the variable Y with respect to the variable X is 3.1012, and the intercept linear regression of X with respect to Y is 0.1, while the coefficient of linear regression of variable X with respect to Y is 0.0734.
The data presented in Table 2 make it possible to calculate the regression function of the variable Y against X and the regression function of the variable X against Y, describing the analytical form of the relationship between the variables.
To better present the obtained results, in relation to the above analysis, Figure 13 presents basic descriptive statistics (location measures) including the median, quartiles, and minimum and maximum for two variables—PV Farm and Carport—as well as energy taken from the grid and energy supplied to the grid.
As the data analysis shows, there are statistically significant differences in the amount of energy taken from the grid and the amount of energy supplied to the grid, and the amount produced by photovoltaic panels from the farm and carport. The values of the dependence of energy production in the PV farm and the carport are presented in more detail in Figure 13.
As resulted from the data analysis, statistically significant differences in the amount of energy produced by the PV Farm and carport (p < 0.05) in the dimension occur (at p = 0.001, for N = 365 processed cases). Therefore, it can be concluded that the energy from one’s own farm is a significant supplement to the energy demand of the powered sectors of the LSTP building, and the carport installation enables the charging of electric vehicles.
Based on the data obtained from the monitoring system of the photovoltaic system installed in the LSTP, it can be concluded that the PV farm is an important element of covering the energy demand of the tested facility and the additional investment in the carport ensures the use of daily surplus energy to charge the BEV. Such use of the photovoltaic system enables the reduction of the cost of charging BEV [25,27,28,63,66,71] and, as it was noted, in the works [2,24,29,67,69,70,72,76,82], limits emissions from means of transport, which is a very important direction of changes in the transport sector, especially in urban zones.
The direction of further research, due to the growing number of electric vehicles used by the employees of the tested facility, is to develop a method for predicting the demand for electricity reserved for charging these vehicles. Such research will certainly allow for a wider application of carports along with the development of electro mobility in urbanized areas.

4. Conclusions

The paper presents a PV system containing two micro-installations with a capacity of up to 40 kWp each to supply electricity to two zones of the building of the LSTP. An online platform was used to monitor the performance and diagnose the operating characteristics of the PV system. Thanks to this, information on the generated power and the quantity of electricity generated by the PV system was obtained. Using this innovative monitoring system, it was possible to analyze the consumption, generation, and effective use of electricity. The surplus of generated energy in a given facility was measured and it was proposed to use it to charge a BEV. As can be seen, BEV charging is one way to increase the efficiency of the use solar energy generated from the PV system.
As shown in the paper, investing in a photovoltaic installation brings benefits in the form of providing energy for one’s own needs. In addition, it has been proposed to use the surplus energy to charge the electric vehicle, which not only ensures a faster repayment on investment in the installation, but also guarantees the use of a very ecological and economical form of transport. The operation of an electric vehicle charged with energy from renewable sources makes this form of transport virtually zero-emission.
The objective of our research was to conduct detailed statistical analyses of consumption (charging the electric vehicle battery) and electricity production by the photovoltaic farm; nevertheless, as far as further research in a discussed subject is concerned, an in-depth financial analysis of the proposed approaches should also be carried out.

Author Contributions

Conceptualization, A.M. (Arkadiusz Małek), A.D. and J.C.; methodology, A.M. (Arkadiusz Małek), A.M. (Andrzej Marciniak), A.D. and J.C.; validation, O.S., J.C. and I.R.; formal analysis, A.M. (Andrzej Marciniak), A.D., J.C. and I.R.; investigation, A.M. (Arkadiusz Małek); resources, A.M. (Arkadiusz Małek), and J.C.; data curation, A.M. (Arkadiusz Małek); writing—original draft preparation, A.M. (Arkadiusz Małek), A.D., O.S., J.C. and I.R.; writing—review and editing, A.M. (Arkadiusz Małek), A.D., O.S. and J.C.; visualization, O.S. and A.M. (Andrzej Marciniak); project administration, O.S. and J.C.; supervision, O.S. All authors have read and agreed to the published version of the manuscript.

Funding

This research received no external funding.

Data Availability Statement

Not applicable.

Acknowledgments

This work was created as a result of the scientific internship of the authors of Agnieszka Dudziak, and Jacek Caban, carried out at the Department of Transport and Logistics of the Institute of Technology and Business in České Budějovice in the period from 6 January to 7 February 2020.

Conflicts of Interest

The authors declare no conflict of interest.

References

  1. Vichova, K.; Veselik, P.; Heinzova, R.; Dvoracek, R. Road transport and its impact on air pollution during the COVID-19 pandemic. Sustainability 2021, 13, 11803. [Google Scholar] [CrossRef]
  2. Mikulski, M.; Droździel, P.; Tarkowski, S. Reduction of transport-related air pollution. A case study based on the impact of the COVID-19 pandemic on the level of NOx emissions in the city of Krakow. Open Eng. 2021, 11, 790–796. [Google Scholar] [CrossRef]
  3. Hunicz, J.; Tmar, A.; Krzaczek, P. Effects of mixture stratification on combustion and emissions of boosted controlled auto-ignition engines. Energies 2017, 10, 2172. [Google Scholar] [CrossRef] [Green Version]
  4. Kukuča, P.; Barta, D.; Labuda, R.; Gechev, T. Engine with unconventional crank mechanism FIK1. MATEC Web Conf. 2018, 244, 03004. [Google Scholar] [CrossRef] [Green Version]
  5. Labisz, K. Reflectivity of anodised Al-Si alloy surface of belt pulleys used in combustion engines. Sci. J. Sil. Univ. Technol. Ser. Transp. 2021, 112, 125–133. [Google Scholar] [CrossRef]
  6. Longwic, R.; Nieoczym, A.; Kordos, P. Evaluation of the combustion process in a spark-ignition engine based on the unrepeatability of the maximum pressure. IOP Conf. Ser. Mater. Sci. Eng. 2018, 421, 1–9. [Google Scholar] [CrossRef]
  7. Szpica, D. Coefficient of engine flexibility as a basis for the assessment of vehicle tractive performance. Chin. J. Mech. Eng. 2019, 32, 39. [Google Scholar] [CrossRef] [Green Version]
  8. Available online: https://www.scania.com/pl/pl/home/campaigns/super.html (accessed on 5 December 2021).
  9. Figlus, T.; Liščák, Š. Assessment of the vibroactivity level of SI engines in stationary and non-stationary operating conditions. J. Vibroeng. 2014, 16, 1349–1359. [Google Scholar]
  10. Mieczkowski, G.; Szpica, D.; Borawski, A.; Diliunas, S.; Pilkaite, T.; Lesis, V. Application of smart materials in the actuation system of a gas injector. Materials 2021, 14, 6984. [Google Scholar] [CrossRef]
  11. Osipowicz, T.; Abramek, K.F.; Matuszak, Z.; Jaskiewicz, M.; Ludwinek, K.A.; Lagowski, P. The concept of annular channels application on the spraying nozzle needle of modern fuel injector in the aspect of combustion process improvement. In Proceedings of the 11th International Science and Technical Conference Automotive Safety, Automotive Safety 2018, Casta-Papiernicka, Slovakia, 18–20 April 2018. Code 136991. [Google Scholar]
  12. Pukalskas, S.; Kriaučiūnas, D.; Rimkus, A.; Przybyła, G.; Droździel, P.; Barta, D. Effect of hydrogen addition on the energetic and ecologic parameters of an SI engine fueled by biogas. Appl. Sci. 2021, 11, 742. [Google Scholar] [CrossRef]
  13. Aulin, D.; Klymenko, O.; Falendysh, A.; Kletska, O.; Dizo, J. Improvement of diesel injector nozzle test techniques. IOP Conf. Ser. Mater. Sci. Eng. 2020, 985, 012031. [Google Scholar] [CrossRef]
  14. Eliasz, J.; Osipowicz, T.; Abramek, K.F.; Matuszak, Z.; Mozga, L. Fuel pretreatment systems in modern ci engines. Catalysts 2020, 10, 696. [Google Scholar] [CrossRef]
  15. Droździel, P. The influence of the vehicle work organization conditions on the engine start-up parameters. Eksploat. Niezawodn.-Maint. Reliab. 2008, 37, 72–74. [Google Scholar]
  16. Kamiński, M.; Budzyński, P.; Hunicz, J.; Józwik, J. Evaluation of changes in fuel delivery rate by electromagnetic injectors in a common rail system during simulated operation. Eksploat. Niezawodn.-Maint. Reliab. 2021, 23, 352. [Google Scholar] [CrossRef]
  17. Punov, P.; Gechev, T.; Mihalkov, S.; Podevin, P.; Barta, D. Experimental study of multiple pilot injection strategy in an automotive direct injection diesel engine. MATEC Web Conf. 2018, 234, 03007. [Google Scholar] [CrossRef]
  18. Kriaučiūnas, D.; Pukalskas, S.; Rimkus, A.; Barta, D. Analysis of the influence of CO2 concentration on a spark ignition engine fueled with biogas. Appl. Sci. 2021, 11, 6379. [Google Scholar] [CrossRef]
  19. Nazimek, D.; Słowik, T.; Zając, G.; Krzaczek, P.; Kuranc, A.; Szyszlak-Bargłowicz, J.; Piekarski, W.; Marczuk, A. Studies on physicochemical properties of catalyst precursors for the preparation DME from ethanol. Przem. Chem. 2015, 94, 1772–1777. [Google Scholar]
  20. Orynycz, O.; Świć, A. The Effects of material’s transport on various steps of production system on energetic efficiency of biodiesel production. Sustainability 2018, 10, 2736. [Google Scholar] [CrossRef] [Green Version]
  21. Szmigielski, M.; Zarajczyk, J.; Węgrzyn, A.; Leszczyński, N.; Kowalczuk, J.; Andrejko, D.; Krzysiak, Z.; Samociuk, W.; Zarajczyk, K. Testing the technological line for the production of alternative fuels. Przem. Chem. 2018, 97, 1079–1082. [Google Scholar]
  22. Wasiak, A.; Orynycz, O. Energy efficiency of a biofuel production system. Manag. Prod. Eng. Rev. 2017, 8, 60–68. [Google Scholar] [CrossRef]
  23. Abramek, K.F.; Prajwowski, K.; Mozga, Ł. Selected issues related to diagnostic testing of hybrid vehicles. IOP Conf. Ser. Mater. Sci. Eng. 2018, 421, 032001. [Google Scholar] [CrossRef]
  24. Barta, D.; Mruzek, M.; Kendra, M.; Kordos, P.; Krzywonos, L. Using of non-conventional fuels in hybrid vehicle drives. Adv. Sci. Technol. Res. J. 2016, 32, 240–247. [Google Scholar] [CrossRef] [Green Version]
  25. Diżo, J.; Blatnický, M.; Semenov, S.; Mikhailov, E.; Kostrzewski, M.; Drozdziel, P.; Štastniak, P. Electric and plug-in hybrid vehicles and their infrastructure in a particular European region. Transp. Res. Procedia 2021, 55, 629–636. [Google Scholar] [CrossRef]
  26. Figlus, T.; Czachor, T. Preliminary studies of the effect of travelling speed and propulsion type on the sound level in the passenger compartment of a vehicle with a hybrid propulsion system. In Proceedings of the 11th International Science and Technical Conference Automotive Safety, Automotive Safety 2018, Casta-Papiernicka, Slovakia, 18–20 April 2018; Code 136991. pp. 1–5. [Google Scholar] [CrossRef]
  27. Geca, M.; Wendeker, M.; Grabowski, L. A City Bus Electrification Supported by the Photovoltaic Power Modules; SAE: Warrendale, PA, USA, 2014; No. 2014-01-2898. [Google Scholar] [CrossRef]
  28. König, A.; Nicoletti, L.; Schröder, D.; Wolff, S.; Waclaw, A.; Lienkamp, M. An overview of parameter and cost for battery electric vehicles. World Electr. Veh. J. 2021, 12, 21. [Google Scholar] [CrossRef]
  29. Marczak, H.; Droździel, P. Analysis of pollutants emission into the air at the stage of an electric vehicle operation. J. Ecol. Eng. 2021, 22, 182–188. [Google Scholar] [CrossRef]
  30. Bartuska, L.; Labudzki, R. Research of basic issues of autonomous mobility. LOGI 2019-Horizons of Autonomous Mobility in Europe. Transp. Res. Procedia 2020, 44, 356–360. [Google Scholar] [CrossRef]
  31. Moravcik, L. Typové schválenie autonómnych (samojazdiacich) vozidiel, Type approval of autonomous (self-driving) vehicles. Perner’s Contacts 2020, 15, 2. [Google Scholar]
  32. Nieoczym, A.; Tarkowski, S. The modeling of the assembly line with a technological Automated Guided Vehicle (AGV). Logforum 2011, 7, 35–42. [Google Scholar]
  33. Podkowski, K.A.; Okruch, Ł. Fatigue tests and numerical analyses of the PAWO autonomous electric vehicle. Arch. Automot. Eng. Arch. Motoryz. 2021, 93, 39–58. [Google Scholar]
  34. Siqueira Silva, D.; Csiszár, C.; Földes, D. Autonomous vehicles and urban space management. Sci. J. Sil. Univ. Technol. Ser. Transp. 2021, 110, 169–181. [Google Scholar] [CrossRef]
  35. Vehicles in Use Europe. January 2021. ACEA Report. Available online: https://www.acea.auto/files/report-vehicles-in-use-europe-january-2021-1.pdf) (accessed on 19 August 2021).
  36. Eliasz, J.; Osipowicz, T.; Abramek, K.F.; Mozga, L. Model issues regarding modification of fuel injector components to improve the injection parameters of a modern compression ignition engine powered by biofuel. Appl. Sci. 2019, 9, 5479. [Google Scholar] [CrossRef] [Green Version]
  37. Sabapathy, S.P.; Ammasi, A.M.; Khalife, E.; Kaveh, M.; Szymanek, M.; Kuruvakkattu Reghu, G.; Sabapathy, P. Comprehensive assessment from optimum biodiesel yield to combustion characteristics of light duty diesel engine fueled with palm kernel oil biodiesel and fuel additives. Materials 2021, 14, 4274. [Google Scholar] [CrossRef]
  38. Hunicz, J.; Matijosius, J.; Rimkus, A.; Kilikevicius, A.; Kordos, P.; Mikulski, M. Efficient hydrotreated vegetable oil combustion under partially premixed conditions with heavy exhaust gas recirculation. Fuel 2020, 268, 117350. [Google Scholar] [CrossRef]
  39. Kubica, G.; Flekiewicz, M.; Marzec, P. Selected aspects of the use of gaseous fuels blends to improve efficiency and emission of SI engine. Transp. Probl. 2019, 14, 95–103. [Google Scholar] [CrossRef] [Green Version]
  40. Lebedevas, S.; Pukalskas, S.; Dauksys, V. Mathematical modelling of indicative process parameters of dual-fuel engines with conventional fuel injection system. Transport 2020, 35, 57–167. [Google Scholar] [CrossRef] [Green Version]
  41. Wierzbicki, S.; Śmieja, M. Use of biogas to power diesel engines with common rail fuel systems. In Proceedings of the 17th International Conference Diagnostics of Machines and Vehicles, Bydgoszcz, Poland, 25–26 September 2018. [Google Scholar]
  42. Fabiś, P.; Flekiewicz, M. Optimalisation of the SI engine timing advance fueled by LPG. Sci. J. Sil. Univ. Technol. Ser. Transp. 2021, 111, 33–141. [Google Scholar] [CrossRef]
  43. Jakliński, P.; Czarnigowski, J.; Wendeker, M. The Effect of Injection Start Angle of Vaporized LPG on SI Engine Operation Parameters; SAE: Warrendale, PA, USA, 2007. [Google Scholar] [CrossRef]
  44. Szpica, D. Investigating fuel dosage non-repeatability of low-pressure gas-phase injectors. Flow Meas. Instrum. 2018, 59, 147–156. [Google Scholar] [CrossRef]
  45. Ding, S.L.; Song, E.Z.; Litak, G.; Yang, L.P.; Wang, Y.Y.; Ma, X.Z. Analysis of chaos in the combustion process of premixed natural gas engine. Appl. Therm. Eng. 2017, 121, 768–778. [Google Scholar] [CrossRef]
  46. Ding, S.L.; Song, E.Z.; Yang, L.P.; Litak, G.; Ma, X.Z. Investigation on nonlinear dynamic characteristics of combustion instability in the lean-burn premixed natural gas engine. Chaos Solit. Fractals 2016, 93, 99–110. [Google Scholar] [CrossRef]
  47. Melaika, M.; Pukalskas, S.; Rimkus, A.; Korsakas, V. Influence of Natural Gas and hydrogen fuel mixtures for the spark ignition engine parameters at various engine speeds. In Proceedings of the 21st International Scientific Conference on Transport Means, Juodkrante, Lithuania, 20–22 September 2017; pp. 60–64. [Google Scholar]
  48. Bialy, M.; Wendeker, M.; Magryta, P.; Czyz, Z.; Sochaczewski, R. CFD Model of the Mixture Formation Process of the CNG Direct Injection Engine; SAE: Warrendale, PA, USA, 2014. [Google Scholar] [CrossRef]
  49. Flekiewicz, B.; Flekiewicz, M.; Kubica, G. Identification of Optimal CNG-Hydrogen Enrichment Ratio in the Small SI Engines; SAE: Warrendale, PA, USA, 2012; pp. 135–146. [Google Scholar]
  50. Khan, M.I.; Yasmin, T.; Shakoor, A. Technical overview of compressed natural gas (CNG) as a transportation fuel. Renew. Sust. Energ. Rev. 2015, 51, 785–797. [Google Scholar] [CrossRef]
  51. Arteconi, A.; Brandoni, C.; Evangelista, D.; Polonara, F. Life-cycle greenhouse gas analysis of LNG as a heavy vehicle fuel in Europe. Appl. Energy 2010, 87, 2005–2013. [Google Scholar] [CrossRef]
  52. Jurkovic, M.; Kalina, T.; Skrucany, T.; Gorzelanczyk, P.; L’uptak, V. Environmental impacts of introducing LNG as alternative fuel for urban buses—Case study in Slovakia. Promet-Traffic Transp. 2020, 32, 837–847. [Google Scholar] [CrossRef]
  53. Langshaw, L.; Ainalis, D.; Acha, S.; Shah, N.; Stettler, M.E. Environmental and economic analysis of liquefied natural gas (LNG) for heavy goods vehicles in the UK: A Well-to-Wheel and total cost of ownership evaluation. Energy Policy 2020, 137, 111161. [Google Scholar] [CrossRef]
  54. Song, H.; Ou, X.; Yuan, J.; Yu, M.; Wang, C. Energy consumption and greenhouse gas emissions of diesel/LNG heavy-duty vehicle fleets in China based on a bottom-up model analysis. Energy 2017, 140, 966–978. [Google Scholar] [CrossRef]
  55. Hunicz, J.; Mikulski, M.; Shukla, P.C.; Gęca, M.S. Partially premixed combustion of hydrotreated vegetable oil in a diesel engine: Sensitivity to boost and exhaust gas recirculation. Fuel 2022, 307, 121910. [Google Scholar] [CrossRef]
  56. Labaj, J.; Barta, D. Unsteady flow simulation and combustion of ethanol in diesel engines. Komunikacie 2006, 8, 27–37. [Google Scholar] [CrossRef]
  57. Zdziennicka, A.; Szymczyk, K.; Jańczuk, B.; Longwic, R.; Sander, P. Surface, volumetric, and wetting properties of oleic, linoleic, and linolenic acids with regards to application of canola oil in diesel engines. Appl. Sci. 2019, 9, 3445. [Google Scholar] [CrossRef] [Green Version]
  58. Szpica, D.; Czaban, J. Investigating of the combustion process in a diesel engine fueled with conventional and alternative fuels. In Proceedings of the 23rd International Scientific Conference. Transport Means 2019, Palanga, Lithuania, 2–4 October 2019. [Google Scholar]
  59. Zajac, G.; Wegrzyn, A. Analysis of work parameters changes of diesel engine powered with diesel fuel and faee blends. Eksploat. Niezawodn.-Maint. Reliab. 2008, 38, 17–24. [Google Scholar]
  60. Wendeker, M.; Malek, A.; Czarnigowski, J.; Taccani, R.; Boulet, P.; Breaban, F. Adaptive Airflow Control of the PEM Fuel Cell System; SAE: Warrendale, PA, USA, 2007; p. 90246. [Google Scholar]
  61. Chen, R.; Qin, Y.; Du, Q.; Peng, J. Effects of Clamping Force on the Operating Behavior of PEM Fuel Cell; SAE: Warrendale, PA, USA, 2018; No. 018-01-1718. [Google Scholar] [CrossRef]
  62. Milojević, S.; Skrucany, T.; Milošević, H.; Stanojević, D.; Pantić, M.; Stojanović, B. Alternative drive systems and environmentally friendly public passengers transport. Appl. Eng. Lett. 2018, 3, 5–113. [Google Scholar] [CrossRef]
  63. Jorgensen, K. Technologies for electric, hybrid and hydrogen vehicles: Electricity from renewable energy sources in transport. Util. Policy 2008, 16, 72–79. [Google Scholar] [CrossRef]
  64. Azadfar, E.; Sreeram, V.; Harries, D. The investigation of the major factors influencing plug-in electric vehicle driving patterns and charging behaviour. Renew. Sustain. Energy Rev. 2015, 42, 1065–1076. [Google Scholar] [CrossRef]
  65. Bahamonde-Birke, F.J.; Hanappi, T. The potential of electromobility in Austria: Evidence from hybrid choice models under the presence of unreported information. Transp. Res. Part A Policy Pract. 2016, 83, 30–41. [Google Scholar] [CrossRef]
  66. Lewicki, W. The case study of the impact of the costs of operational repairs of cars on the development of electromobility in Poland. Arch. Automot. Eng. Arch. Motoryz. 2017, 78, 107–116. [Google Scholar]
  67. Lis, A.; Szymanowski, R. Greening Polish transportation? Untangling the nexus between electric mobility and a carbon-based regime. Energy Res. Soc. Sci. 2022, 83, 102336. [Google Scholar] [CrossRef]
  68. Wangsness, P.B.; Proost, S.; Rødseth, L.K. Optimal policies for electromobility: Joint assessment of transport and electricity distribution costs in Norway. Util. Policy 2021, 72, 101247. [Google Scholar] [CrossRef]
  69. Hurtova, I.; Sejkorova, M.; Verner, J.; Sarkan, B. Comparison of electricity and fossil fuel consumption in trolleybuses and buses. Eng. Rural Dev. 2018, 17, 2079–2084. [Google Scholar]
  70. Settey, T.; Gnap, J.; Synák, F.; Skrúcaný, T.; Dočkalik, M. Research into the impacts of driving cycles and load weight on the operation of a light commercial electric vehicle. Sustainability 2021, 13, 3872. [Google Scholar] [CrossRef]
  71. Daina, N.; Sivakumar, A.; Polak, J.W. Electric vehicle charging choices: Modelling and implications for smart charging services. Transport. Res. C Emerg. Technol. 2017, 81, 36–56. [Google Scholar] [CrossRef]
  72. Fang, Y.; Asche, F.; Novan, K. The costs of charging plug-in electric vehicles (PEVs): Within day variation in emissions and electricity prices. Energy Econ. 2018, 69, 196–203. [Google Scholar] [CrossRef]
  73. Li, G.; Luo, T.; Song, Y. Spatial equity analysis of urban public services for electric vehicle charging—Implications of Chinese cities. Sustain. Cities Soc. 2022, 76, 103519. [Google Scholar] [CrossRef]
  74. Shafique, M.; Rafiq, M.; Azam, A.; Luo, X. Material flow analysis for end-of-life lithium-ion batteries from battery electric vehicles in the USA and China. Resour. Conserv. Recycl. 2022, 178, 106061. [Google Scholar] [CrossRef]
  75. Haidar, A.M.A.; Muttaqi, K.M.; Sutanto, D. Technical challenges for electric power industries due to grid-integrated electric vehicles in low voltage distributions: A review. Energy Convers. Manag. 2014, 86, 689–700. [Google Scholar] [CrossRef]
  76. Mikusova, M.; Torok, A.; Brida, P. Technological and economical context of renewable and non-renewable energy in electric mobility in Slovakia and Hungary. In Computational Collective Intelligence, Proceedings of the 10th International Conference on Computational Collective Intelligence-Special Session on Intelligent Sustainable Smart Cities, Bristol, UK, 5–7 September 2018; Springer: Berlin/Heidelberg, Germany, 2018; pp. 429–436. [Google Scholar] [CrossRef]
  77. Stączek, P.; Pizoń, J.; Danilczuk, W.; Gola, A. A digital twin approach for the improvement of an autonomous mobile robots (AMR’s) operating environment—A case study. Sensors 2021, 21, 7830. [Google Scholar] [CrossRef]
  78. Varecha, D.; Kohár, R.; Lukáč, M. Theoretical study of heat conduction in the multi-disc brake integrated into the drive wheel AGV during braking. Bull. Pol. Acad. Sci. Tech. Sci. 2021, 69, e136718. [Google Scholar]
  79. Aoun, N.; Bailek, N. Evaluation of mathematical methods to characterize the electrical parameters of photovoltaic modules. Energy Convers. Manag. 2019, 193, 25–38. [Google Scholar] [CrossRef]
  80. Skrúcaný, T.; Kendra, M.; Čechovič, T.; Majerník, F.; Pečman, J. Assessing the energy intensity and greenhouse gas emissions of the traffic services in a selected region. LOGI-Sci. J. Transp. Logist. 2021, 12, 25–35. [Google Scholar] [CrossRef]
  81. Lebkowski, A. Studies of energy consumption by a city bus powered by a hybrid energy storage system in variable road conditions. Energies 2019, 12, 951. [Google Scholar] [CrossRef] [Green Version]
  82. Tucki, K.; Orynycz, O.; Mitoraj-Wojtanek, M. Perspectives for mitigation of CO2 emission due to development of electromobility in several countries. Energies 2020, 13, 4127. [Google Scholar] [CrossRef]
  83. Tucki, K.; Orynycz, O. Bioenergy and Biofuels. Sustainability 2021, 13, 9972. [Google Scholar] [CrossRef]
  84. Frydrychowicz-Jastrzębska, G.; Janczak, P. Instalacje fotowoltaiczne małej mocy, Poznan University of Technology Academic journals. Electr. Eng. 2015, 81, 145–151. [Google Scholar]
  85. Bień, A.; Janicki, A. Simple and efficient profiling of electricity consumer. Wiadomości Elektrotechniczne 2019, 3, 42–45. [Google Scholar] [CrossRef]
  86. Hernández-Callejo, L.; Gallardo-Saavedra, S.; Alonso-Gómez, V. A review of photovoltaic systems: Design, operation and maintenance. Photovolt. Energy 2019, 188, 426–440. [Google Scholar] [CrossRef]
  87. Al-Sayyab, A.K.S.; Al Tmari, Z.Y.; Taher, M.K. Theoretical and experimental investigation of photovoltaic cell performance, with optimum tilted angle: Basra city case study. Case Stud. Therm. Eng. 2019, 14, 100421. [Google Scholar] [CrossRef]
  88. Azeumo, M.F.; Germana, C.; Ippolito, N.M. Photovoltaic module recycling, a physical and a chemical recovery process. Photovolt. Energy Mater. Photovolt. Cells 2019, 193, 314–319. [Google Scholar] [CrossRef]
  89. Imbuluzqueta, G.; Yurrita, N.; Aizpurua, J.; Cano, F.J.; Zubillaga, O. Composite material with enhanced ultraviolet performance stability for photovoltaic modules. Photovolt. Energy Mater. Photovolt. Cells 2019, 200, 109947. [Google Scholar] [CrossRef]
  90. Liu, J.; Jia, D.; Gardner, J.M.; Johansson, E.M.J.; Zhang, X. Metal nanowire networks: Recent advances and challenges for new generation photovoltaics. Mater. Today Energy 2019, 13, 152–185. [Google Scholar] [CrossRef]
  91. Tatsi, E.; Griffini, G. Polymeric materials for photon management in photovoltaics. Photovolt. Energy Mater. Photovolt. Cells 2019, 196, 43–56. [Google Scholar] [CrossRef]
  92. Liu, G.; Kong, L.; Yang, W.; Mao, H. Pressure engineering of photovoltaic perovskites. Mater. Today 2019, 27, 91–106. [Google Scholar] [CrossRef]
  93. Makarskas, V.; Jurevičius, M.; Zakis, J.; Kilikevičius, A.; Borodinas, S.; Matijošius, J.; Kilikevičienė, K. Investigation of the influence of hail mechanical impact parameters on photovoltaic modules. Eng. Fail. Anal. 2021, 124, 105309. [Google Scholar] [CrossRef]
  94. Katayama, N.; Osawa, S.; Matsumoto, S.; Nakano, T.; Sugiyama, M. Degradation and fault diagnosis of photovoltaic cells using impedance spectroscopy. Photovolt. Energy Mater. Photovolt. Cells 2019, 194, 130–136. [Google Scholar] [CrossRef]
  95. Azizi, A.; Logerais, P.O.; Omeiri, A. Impact of the aging of a photovoltaic module on the performance of a grid-connected system. Photovolt. Energy 2018, 174, 445–454. [Google Scholar] [CrossRef]
  96. Al Essa, M.J.M. Home energy management of thermostatically controlled loads and photovoltaic-battery systems. Energy 2019, 176, 742–752. [Google Scholar] [CrossRef]
  97. Yin, E.; Li, Q.; Xuan, Y. Experimental optimization of operating conditions for concentrating photovoltaic-thermoelectric hybrid system. J. Power Sources 2019, 422, 25–32. [Google Scholar] [CrossRef]
  98. Lay-Ekuakille, A.; Ciaccioli, A.; Griffo, G. Effects of dust on photovoltaic measurements: A comparative study. Measurement 2018, 113, 181–188. [Google Scholar] [CrossRef]
  99. Bliss, M.; Betts, T.; Gottschalg, R. Interlaboratory comparison of short-circuit current versus irradiance linearity measurements of photovoltaic devices. Photovolt. Energy 2019, 182, 256–263. [Google Scholar] [CrossRef] [Green Version]
  100. Dubard, J.; Filtz, J.-R.; Cassagne, V.; Legrain, P. Photovoltaic module performance measurements traceability: Uncertainties survey. Measurement 2014, 51, 451–456. [Google Scholar] [CrossRef]
  101. Gao, Q.; Zhang, Y.; Yu, Y.; Liu, Z. A direct current-voltage measurement method for smart photovoltaic modules with submodule level power optimizers. Photovolt. Energy 2018, 167, 52–60. [Google Scholar] [CrossRef]
  102. Available online: http://lpnt.pl/ (accessed on 13 March 2022).
  103. Available online: http://server.growatt.com/login.do (accessed on 13 March 2022).
  104. Available online: https://onemeter.com/pl/ (accessed on 13 March 2022).
Figure 1. Photovoltaic micro-installation at the LSTP [102].
Energies 15 02137 g001
Figure 2. The general diagram of the PV system electrical connections to the LSTP building.
Energies 15 02137 g002
Figure 3. Total power generated by two micro-installations of 2 × 40 kWp on 11 April 2020.
Energies 15 02137 g003
Figure 4. Total power generated by two micro-installations of 2 × 40 kWp per month (April 2020).
Energies 15 02137 g004
Figure 5. Power generated by two micro-installations of 2 × 40 kWp on 11 April 2020.
Energies 15 02137 g005
Figure 6. Appearance of the measuring device.
Energies 15 02137 g006
Figure 7. Energy flow in Sector 4 of the LSTP in April 2020, energy consumed (active energy), and energy fed into the grid (energy production).
Energies 15 02137 g007
Figure 8. Energy flow in Sector 5 of the LSTP in 11 April 2020, energy consumed (active energy), and energy fed into the grid (energy production) and load demand pattern (blue line).
Energies 15 02137 g008
Figure 9. Energy flow in Sector 4 of the LSTP in May 2020, energy consumed (active energy), and energy fed into the grid (energy production).
Energies 15 02137 g009
Figure 10. Electric vehicle charger installed for Sector 5 in the LSTP.
Energies 15 02137 g010
Figure 11. Scatterplot for the energy production of the carport and the photovoltaic farm in Sector 4 of the LSTP.
Energies 15 02137 g011
Figure 12. D box plots of analysis parameters of the photovoltaic system.
Energies 15 02137 g012
Figure 13. D box plots of the PV farm vs. the carport.
Energies 15 02137 g013
Table 1. A summary of the statistical values of the individual variables.
VariableMeansStd. Dev.Energy Taken from the GridEnergy Supplied to the GridPV FarmCarport
Energy Taken from the Grid485.301.034.5051.000.000−0.624684−0.674884−0.680663
Energy Supplied to the Grid10.38137.556−0.6246841.000.0000.7448970.743157
PV farm125.37856.888−0.6748840.7448971.000.0000.980335
Carport9.3464.119−0.6806630.7431570.9803351.000.000
Table 2. Accurate results of the statistical analysis of the correlation of the PV Farm and carport variables.
VariableMeanStd. Dev.r (X, Y)r2tpNConstant Dep: YSlope Dep: YConstant Dep: XSlope Dep: Y
Carport9.346.4119
PV farm12.53785.68880.9803350.96105794.64890.0013653.03.10120.10.0734
Publisher’s Note: MDPI stays neutral with regard to jurisdictional claims in published maps and institutional affiliations.

