Article

Early Warning Weather Hazard System for Power System Control

by
Amalija Božiček
*,
Bojan Franc
and
Božidar Filipović-Grčić
Department of Energy and Power Systems, Faculty of Electrical Engineering and Computing, University of Zagreb, 10000 Zagreb, Croatia
*
Author to whom correspondence should be addressed.
Energies 2022, 15(6), 2085; https://doi.org/10.3390/en15062085
Submission received: 31 January 2022 / Revised: 7 March 2022 / Accepted: 8 March 2022 / Published: 12 March 2022
(This article belongs to the Special Issue Risk Management in the Energy Sector)

Abstract

:
Power systems and their primary components, mostly the transmission and distribution of overhead lines, substations, and other power facilities, are distributed in space and are exposed to various atmospheric and meteorological conditions. These conditions carry a certain level of risk for reliable electrical power delivery. Various atmospheric hazards endanger the operation of power systems, where the most significant are thunderstorms, wildfire events, and floods which can cause various ranges of disturbances, faults, and damages to the power grid, or even negatively affect the quality of life. By utilizing a weather monitoring and early warning system, it is possible to ensure a faster reaction against different weather-caused fault detections and elimination, to ensure a faster and more adequate preparation for fighting extreme weather events, while maintaining overhead line protection and fault elimination. Moreso, it is possible to bypass overhead lines that have the highest risk of unfavorable meteorological events and hazards, and reroute the energy, thus providing electricity to endangered areas in times of need while minimizing blackouts, and consequently, improving the quality of human life. This paper will present an analysis of the various risks of atmospheric phenomena, in the meteorological and climate context, and discuss various power system components, the power system control, operations, planning, and power quality. A concept with the main functionalities and data sources needed for the establishment of an early warning weather hazard system will be proposed. The proposed solution can be used as a utility function in power system control to mitigate risks to the power system due to atmospheric influences and ongoing climate change.

1. Introduction

Earth is surrounded by an air envelope known as the atmosphere. Almost all the weather phenomena that influence power systems are developed in the atmosphere, e.g., storms, or the atmosphere affects them, e.g., solar radiation. Weather phenomena can appear in different timescales. Synoptic scale phenomena are usually described as short-term phenomena. The characteristics of synoptic scale phenomena include time resolutions from a few seconds (e.g., dust-devil) to one or at most, a few days (e.g., baric systems), and a space resolution in the range of 0 to 1000 km [1]. Climatological phenomena (e.g., rising sea level) are characterized as long-term phenomena. Although the climate of the area of interest is defined by observing thirty-year averages, climate change influence can be observed monthly, seasonally, yearly, etc. [2,3]. In this article, meteorological phenomena repeated seasonally, e.g., the monsoon, will be observed as short-term phenomena.
The power system is a network that consists of generation, distribution, and transmission systems [4]. As the atmosphere and the weather phenomena are all around planet Earth, it can be said that the power system is almost everywhere on Earth, and it is significantly affected by weather phenomena. The impact of the weather can be direct, by damaging infrastructure, or indirect by creating shocks (frictions) to the energy supply-demand balance [5] Economic and social consequences of the power system interruptions can be enormous. The security of energy supplies requires sufficient electricity to be ensured in order to cover energy demands and its reliable transmission from generation to consumption centers [6].
In the age of strong climate change, influenced by an increasing number and intensity of severe weather phenomena and their hazards [7], it is necessary to understand the weather’s influence on the power system and to find a way to protect it. At the beginning of the research of the weather influence on the power system in Croatia, authors faced the problem of characterizing weather hazards (e.g., is it slow or fast, is it a sudden-onset or a slow-onset) and what consequences can each weather phenomenon on the power system cause? Another problem was what meteorological parameters should be observed in researching each weather phenomenon influencing the power system. The third problem that the authors faced was the lack of literature that summarizes the meteorological aspect of fire events in Croatia together with their influence on the power system.
The purpose of this article is to observe the influence of the weather on the power system and suggest methods for weather hazard protection with an emphasis on fire events. The process of establishing an early warning weather hazard system includes three steps: The first one is knowing what the hazards and early warnings are. The second one is the identification of weather hazards through main meteorological parameters and their combination in short-term and long-term timescales. The third step is to find ways to establish early warning and weather hazard protection. The structure of the article follows the process of establishing an early warning system. Section 2, Section 3 and Section 4 summarize the existing knowledge about weather risk management. In Section 5, an early warning weather system for power system control is suggested, and the base model for calculating a transmission network fire risk index is adapted to Croatian climate, orography, transmission network configuration, etc. In Section 5, there are also examples of weather risk assessment and prevention, which are given by scientists worldwide.

2. Weather Hazard Definition

Weather hazards that are a risk to power systems are diverse weather phenomena that can cause various kinds of damage in various timescales to different power system segments (Figure 1). Hazards can be associated with two different types of weather events:
  • The ongoing and rapid/sudden-onset weather hazards are more or less a fast developed event in which consequences can be seen immediately. Meteorological events connected to this type of hazard are fast, severe weather phenomena (e.g., storms, hail, lightning, tornadoes, hurricanes, etc.) and other slower hazardous meteorological conditions (fire weather conditions, heat and cold waves, freezing rain, fog, icing, etc.). On the supply side, consequences can be seen with the likes of broken line poles, destroyed substations or power plants, higher losses, etc., which can cause outages, and consequently, other societal costs [8,9].
  • Slow-onset or ‘creeping’ weather hazards are gradual, long-term accumulative environmental changes that may cause serious consequences over time. The climatological event connected with this type of hazard is global warming, which can cause rising sea levels, drought, and consequently, the spread of poor vegetation areas, as well as water level reductions in rivers and lakes, etc. Long-term exposure to various slow-onset weather hazards can cause slow power system infrastructure deterioration [8,9]. A detailed description and influence on the power system are given in Section 3.
Figure 1. Meteorological phenomena impact on the energy sector (source: [10]). El Nino is the name for the ENSO phase (EL Nino–Southern Oscillation, ENSO).
Energies 15 02085 g001
The power system’s vulnerability to weather hazards is defined as the function of exposure, its sensitivity, and the capacity to cope with or to adapt to different weather events [6]. With regard to vulnerability, power system reliability is characterized as the capability to:
  • Establish regular system operations;
  • To minimize the number of power systems incidents and bypass a major incident;
  • To minimize the unwanted consequences of major incidents [6].
An increase in power system vulnerability and reliability decreases outage losses and costs. Outage losses and costs minimization are possible through early preparation, reaction, and hazard prevention in everyday operations and in long-term planning.

3. Weather Hazard Identification

Knowing the geographical location and position as well as the time of the year makes it possible to create a rough estimate of climatological conditions at a particular location using basic knowledge of climatology. Climatological conditions describe an average weather situation in the area of interest. The necessary period of observation for climate determination and observing climate change is 30 years [11]. On the other hand, a synoptic situation describes a temporal weather situation. This section will describe the most important meteorological parameters, their combination, and their influence on the power system in various timescales. Each weather phenomenon is a combination of several meteorological parameters. Because of that, it is very challenging to observe the influence of a single parameter. In this section, it will be done for the purpose of creating an overall picture of what needs to be considered when establishing an early warning weather hazard system.

3.1. Ongoing and Rapid/Sudden-Onset Hazards

3.1.1. Hazards According to Single Parameter

Air pressure is a crucial meteorological parameter in weather analysis and forecasting because air pressure gradients influence air movement (wind). The wind blows from a high air pressure area to an area of low air pressure. The mean air pressure at sea level is 1013.25 hPa [12]. Low air pressure systems are cyclones and valleys and are usually characterized by rainy and stormy weather [13]. High air pressure systems are anticyclones and ridges usually characterized by sunny and calm weather [14]. To understand air pressure influence better, it is important to observe baric systems’ behavior in a wider area, at least 100 km wide, and through time, at least during half a day (see Section 1, synoptic scale). The consequences of fast-changing air pressure and/or significant air pressure gradients can be a strong wind which can cause enormous damage to the power system infrastructure.
In weather forecasting, meteorologists use several types of air temperature. The best known is dry air temperature, known as air temperature. Changes in air temperature can increase or decrease the demand for electrical energy. Several studies have found that overall requirements for energy supply depend on air temperature in a U-shaped form. There are relatively high requirements for energy supply at low and high temperatures because of the need for heating or cooling. At moderate temperatures, the requirements for energy supply tend to be lower because there is no need for heating or cooling. On the supply side, increases in air temperature can reduce photovoltaic (PV) electrical generation [15]. Rising winter temperatures cause snow melting and rising water levels in rivers and lakes. On the other hand, water levels decrease during the long, warm, and dry summertime. Changes in the water level and temperature may influence energy production. Examples are hydro energy production [16] and cooling nuclear and thermal stations [17]. In the context of dynamic line rating (DLR), air temperature increase leads to line sag increase and tension decrease [18]. In cold weather, the line’s thermal capacity is higher, more electricity may flow through the line, and losses decrease [19].
The dew-point temperature is the temperature at the parcel of air that needs to be cooled to achieve a relative humidity of 100%. At the same time, the pressure of the air should be constant [20]. The air moisture and the precipitation type depend on the dew-point amount and the difference between the dew-point and dry air temperature. When the difference rises, moisture decreases [21].
The soil temperature at different depths can significantly influence the power system. One of the examples is ground resistance [22]. Because of low albedo, the most powerful influence is in urban areas covered by asphalt and in the areas covered by stones [6].
Air pressure and air temperature gradients influence wind speed and direction. Appropriate wind characteristics are crucial for successful wind power generation. Very low wind speed leads to a much lesser power production. On the other hand, too high wind speeds can overstress turbine components. At the same time, strong cold wind leads to decreasing air temperature and rising energy demand in the wintertime [15]. A strong enough wind and absence of rain leads to the creation of a layer of pollution deposits (e.g., industrial and agricultural pollutants, marine salt, etc.) much further from the place of pollutant origins [23]. High wind speed can positively influence DLR because of the line cooling effect and decreasing losses [19]. On the other hand, the mechanical stresses of overhead lines depend on wind speed, ice load, and temperature. Transmission line damage caused by strong or extreme wind speeds frequently happens. In Australia, Japan, Canada, the United States, Brazil, Argentina, and South Africa, more than 80% of the transmission network’s line damage in these countries is a consequence of strong or extreme winds. The average wind speed at a height of 10 m is greater than Beaufort number 6, corresponding to 10.8 m/s. [24].
Relative humidity (RH) measures how much water vapor there is in a water–air mixture compared to the maximum amount possible [25]. It influences cloudiness and affects atmospheric transmissivity, and consequently, solar energy production [15]. With rising air humidity, losses in transmission lines rise as well. Corona losses on overhead transmission lines increase with operating voltage and particularly during foggy weather [26].
Precipitation characteristics depend on air temperature and relative humidity at least. Precipitation can be liquid or solid. It can fall from the cloud (e.g., rain and snow) [27] or can be produced by the deposition of water vapor from the surrounding air (e.g., dew and frost) [28]. Precipitation cleans the air from the aerosol, leading to higher solar power plant efficiency and minor pollution problems on the power transmission infrastructure. Expect this cleaning effect: precipitation leads to the cooling of overhead lines and decreasing power losses. On the other hand, a high amount of rime or frost may devastate overhead infrastructure. An appropriate amount of precipitation leads to a proper water level in rivers and lakes. Frequent and (or) heavy rain may lead to (flash) floods and landslides. A lack of precipitation leads to drought and favorable conditions for forest fires.
Solar irradiation is closely related to air temperature and cloudiness. A higher solar irradiance usually leads to higher air temperatures and lower cloudiness or a thinner cloud layer. Solar irradiation significantly influences solar power production, DLR, and power demand.

3.1.2. Hazards According to Combination of Parameters

The best known combined weather hazards to society are drought, storms, and floods, which are consequences of air mass movement or baric systems and fronts. Regular atmospheric circulation over an area of interest may be influenced by other periodical atmospheric oscillations, such as the El Nino–Southern Oscillation (ENSO). ENSO has two opposite periods, El Nino, and La Nina. The episodes of El Nino and El Nino usually occur every five to seven years. The duration of episodes is usually nine to twelve months. El Nino is characterized by increasing rainfall. La Nina has the opposite effect [29]. In Eastern and Central Europe, a positive correlation between rainfall and the Nino 3.4 index was found during winter and spring, and a negative one in autumn. In the Mediterranean region and in Western Europe, the correlation was negative in spring and positive in autumn [30]. The Nino 3.4 index is one of several indexes for the determination of ENSO activities [31].
An increase in precipitation may lead to an enormous rise in water levels in rivers and (flash) floods and landslides. Additionally, the intensification of cyclonical activity means increasing stormy weather events. Heavy storms, floods, and landslides can devastate the power system infrastructure. On the other hand, prolonged dry and warm weather may lead to heatwaves and drought that create favorable conditions for the spread of forest fires and lack of water in rivers. The consequences of a lack of water in lakes and rivers and its warming are described in the previous section. The influence of temperature increase on the power system was also described there.

3.2. Slow-Onset Hazards

One of the most extensive and most critical slow-onset hazards is climate change. There is a natural tendency to change climate, and in the last decades, there was a strong human influence by CO2 emissions. According to the latest Intergovernmental Panel on Climate Change (IPCC) report, increasing air temperature is inevitable [7]. The question is, how much will it increase, and with what consequences? Except for widely known consequences, such as ice melting and rises in sea levels, climate change may lead to changes in cyclone activity and its track changes. Continued global warming leads to an increase in the frequency and intensity of heavy one-day precipitation. This means that severe daily storms will increase in intensity and frequency. At the same time, the increase in frequency and intensity of drought events is possible as well. According to some scenarios, it is very likely that rainfall variability related to the ENSO oscillation will be amplified by the second half of the 21st century [7]. Observing the overall situation, climate change will lead to changes in the frequency and intensity of all meteorological parameters. At one location, the changes will be more favorable for power plant exploitation, while at another location, they will lead to enormous floods and damage. The expectation is that photovoltaic output will increase in Greece [32] and that the intensity of Mediterranean hurricanes (Medicanes) will increase as well [33]. The general influence of global warming on the power system is explained in the scheme depicted in Figure 2 [34]. In future research, an overall projection of the influence of climate change on each power system segment, from infrastructure through to supply and demand to the market, should be done.

4. Hazard Prevention

It is crucial to establish an early warning system for successful hazard prevention. According to the International Strategy for Disaster Reduction (ISDR) framework by the United Nations (UN), 2006, an early warning is the ‘provision of timely and effective information, through identified institutions, that allows individuals exposed to hazard to take action or reduce their risk and prepare for effective response’ [9]. The previous section has shown that weather hazards to the energy sector can be short and long-term. Consequently, to support decision-making, an appropriate weather hazard prevention system is necessary for everyday operations and planning [35]. The most important segments of efficient early warning systems are:
  • Disaster risk knowledge. The knowledge should be based on the systematic collection of data and disaster risk assessments;
  • Detection, monitoring, analysis, and forecasting of the hazards and possible consequences;
  • Communication and dissemination of accurate and actionable warnings;
  • Preparedness to respond to the received alarms at all levels [36].

4.1. Data

High-quality data are the basis for weather hazard prevention. Weather risk analysis is based on climatological data which can be provided at the national level, usually by national meteorological and hydrological services, and at the international level, by different authorities, such as the World Meteorological Organization (WMO), Copernicus Services, and the European Center for Medium-Range Weather Forecasts (ECMWF), etc. Climatological databases contain measurements, reanalysis, and other information (e.g., information about forest fires and floods). The measurements are appropriately provided, controlled, and reliable for use. The reanalysis combines historical observations with models to generate a relevant and consistent time series of multiple climate variables [37].
In day-to-day operations, using meteorological data is more challenging because it should be routinely available for successful hazard prevention. Today, various measurement methods are available, e.g., surface meteorological measurements conducted by automatic meteorological stations or traditional analog instruments, such as radar and satellite measurements, and atmospheric soundings. They should provide real-time or near-real-time measurements. Short-term weather forecasts should be provided at least twice a day, preferably every six hours. Measurements and forecasts need to be reliable, quality controlled, and authoritative [38].
Decision-makers in long-term planning should use climate predictions and projections provided by relevant authorities, such as national meteorological and hydrological services, WMO, ECMWF, etc. Climate predictions describe the future evolution of the climate system for time horizons of several weeks, months, and years. The time horizon of climate projection is decades and centuries. Both prediction and projection are based on the past and current state of the atmosphere [3].
The same numerical weather prediction (NWP), climate prediction, and projection model can produce different quality forecasts for different locations. Due to the different reliabilities arising from location to location, it is necessary to develop micro-locations or regions-of-interest models. Different meteorological instruments can also have different system reliabilities. It could be said that all types of data come with various uncertainties. Before using them, decision-makers and other users should be informed about data quality and their reliability. Another essential issue in monitoring weather situations is to monitor the situation in a wider area—not only in micro-locations—because of the cascading effects that can lead to enormous unfavorable consequences. An example of an unfavorable cascading effect is the blackout that started in Switzerland and affected Italy (2003). About 56 million people were left without electricity [6]. Different weather and other hazards can lead to meteorological infrastructure damage. Ensuring a backup system for meteorological data collection may prevent the lack of information in key situations for weather hazard prevention.

4.2. Disaster Risk Assessment

The effects that meteorology has on the energy system can be presented through:
  • Crisis management;
  • Day-to-day operations;
  • Planning of production facilities;
  • Facility construction and maintenance.
For successful crisis management, it is necessary to improve knowledge about severe weather events, such as heavy precipitation and strong winds, which can cause floods, heat waves, cold waves, etc., and their influence on the power system. Severe weather can cause various kinds of damage to the power system infrastructure and cause variations in the power demand. Establishing successful crisis management makes it possible to protect power systems from unwanted costs.
Day-to-day operations imply daily electricity supply and demand, which is directly affected by the weather. With the increase of power plants fueled by renewables, weather influence on energy production also increases. A lack of energy generated from renewables leads to a higher demand for energy from fossil fuels or variations in the energy market.
The planning of production facilities implies there is access to information about the production and consumption balance (e.g., where an appropriate wind speed and satisfying solar irradiation leads to higher electricity production from renewables) and safety (e.g., a lack of water for cooling nuclear stations leads to ensuring appropriate water reserves and other ways of cooling). The planning of production facilities requires middle-term (seasonal) information about the weather, which climate prediction models provide. Using climate prediction model products requires utilizing the probability of the prediction (forecast) realization.
Planning, maintenance, and facility construction, among other things, rely on climate knowledge. It is necessary to know the historical situation and observe climate projections and predictions as well as their probabilities. Climate variations and changes will require a reconsideration of the ‘business as usual approach’ because the known resistance and resilience of facilities needs to be redefined according to weather parameters and events which could be expected in the future [8].
In creating risk assessment models, except weather influence, it is at least necessary to observe information about critical objects (e.g., power plants, hospitals, settlements, etc.), orography, power system conditions at each segment, etc.

4.3. Communication

Communication is a crucial element in hazard prevention and in the process of developing the safety culture mindset. According to James Reason, segments of the safety culture are:
  • Informed Culture—knowledge about human, organizational, environmental, and technical factors.
  • Reporting Culture—an organizational atmosphere in which people are prepared to report their successful and unsuccessful (errors and near-misses) moves. Except for action reporting, it is necessary to report the actual situation on the ground objectively.
  • Learning Culture—an organization must acquire the willingness and competence to reach the right conclusions from the information provided by its safety information system. Moreso, it is important to have a will to implement major reforms.
  • Flexible Culture—a culture in which an organization is able to reconfigure itself very fast when it faces urgent situations. Urgent situations lead to high-tempo operations that often require shifting from the conventional hierarchical model to a flatter mode.
  • Just Culture—an organizational atmosphere of trust. People are encouraged to provide essential safety-related information. However, it should be clear where the line is between acceptable and unacceptable behavior. For a better understanding, the Just Culture Process requires promptly developed procedures and instructions that personnel must follow. The process is shown in Figure 3 [6].
It is vital to develop the safety culture mindset in the entire society, not only within specific hazard prevention teams. Timely customer reporting (e.g., waterspout or tornado) from the ground may help avoid other unwanted consequences.

5. Early Warning Weather Hazard System Scheme

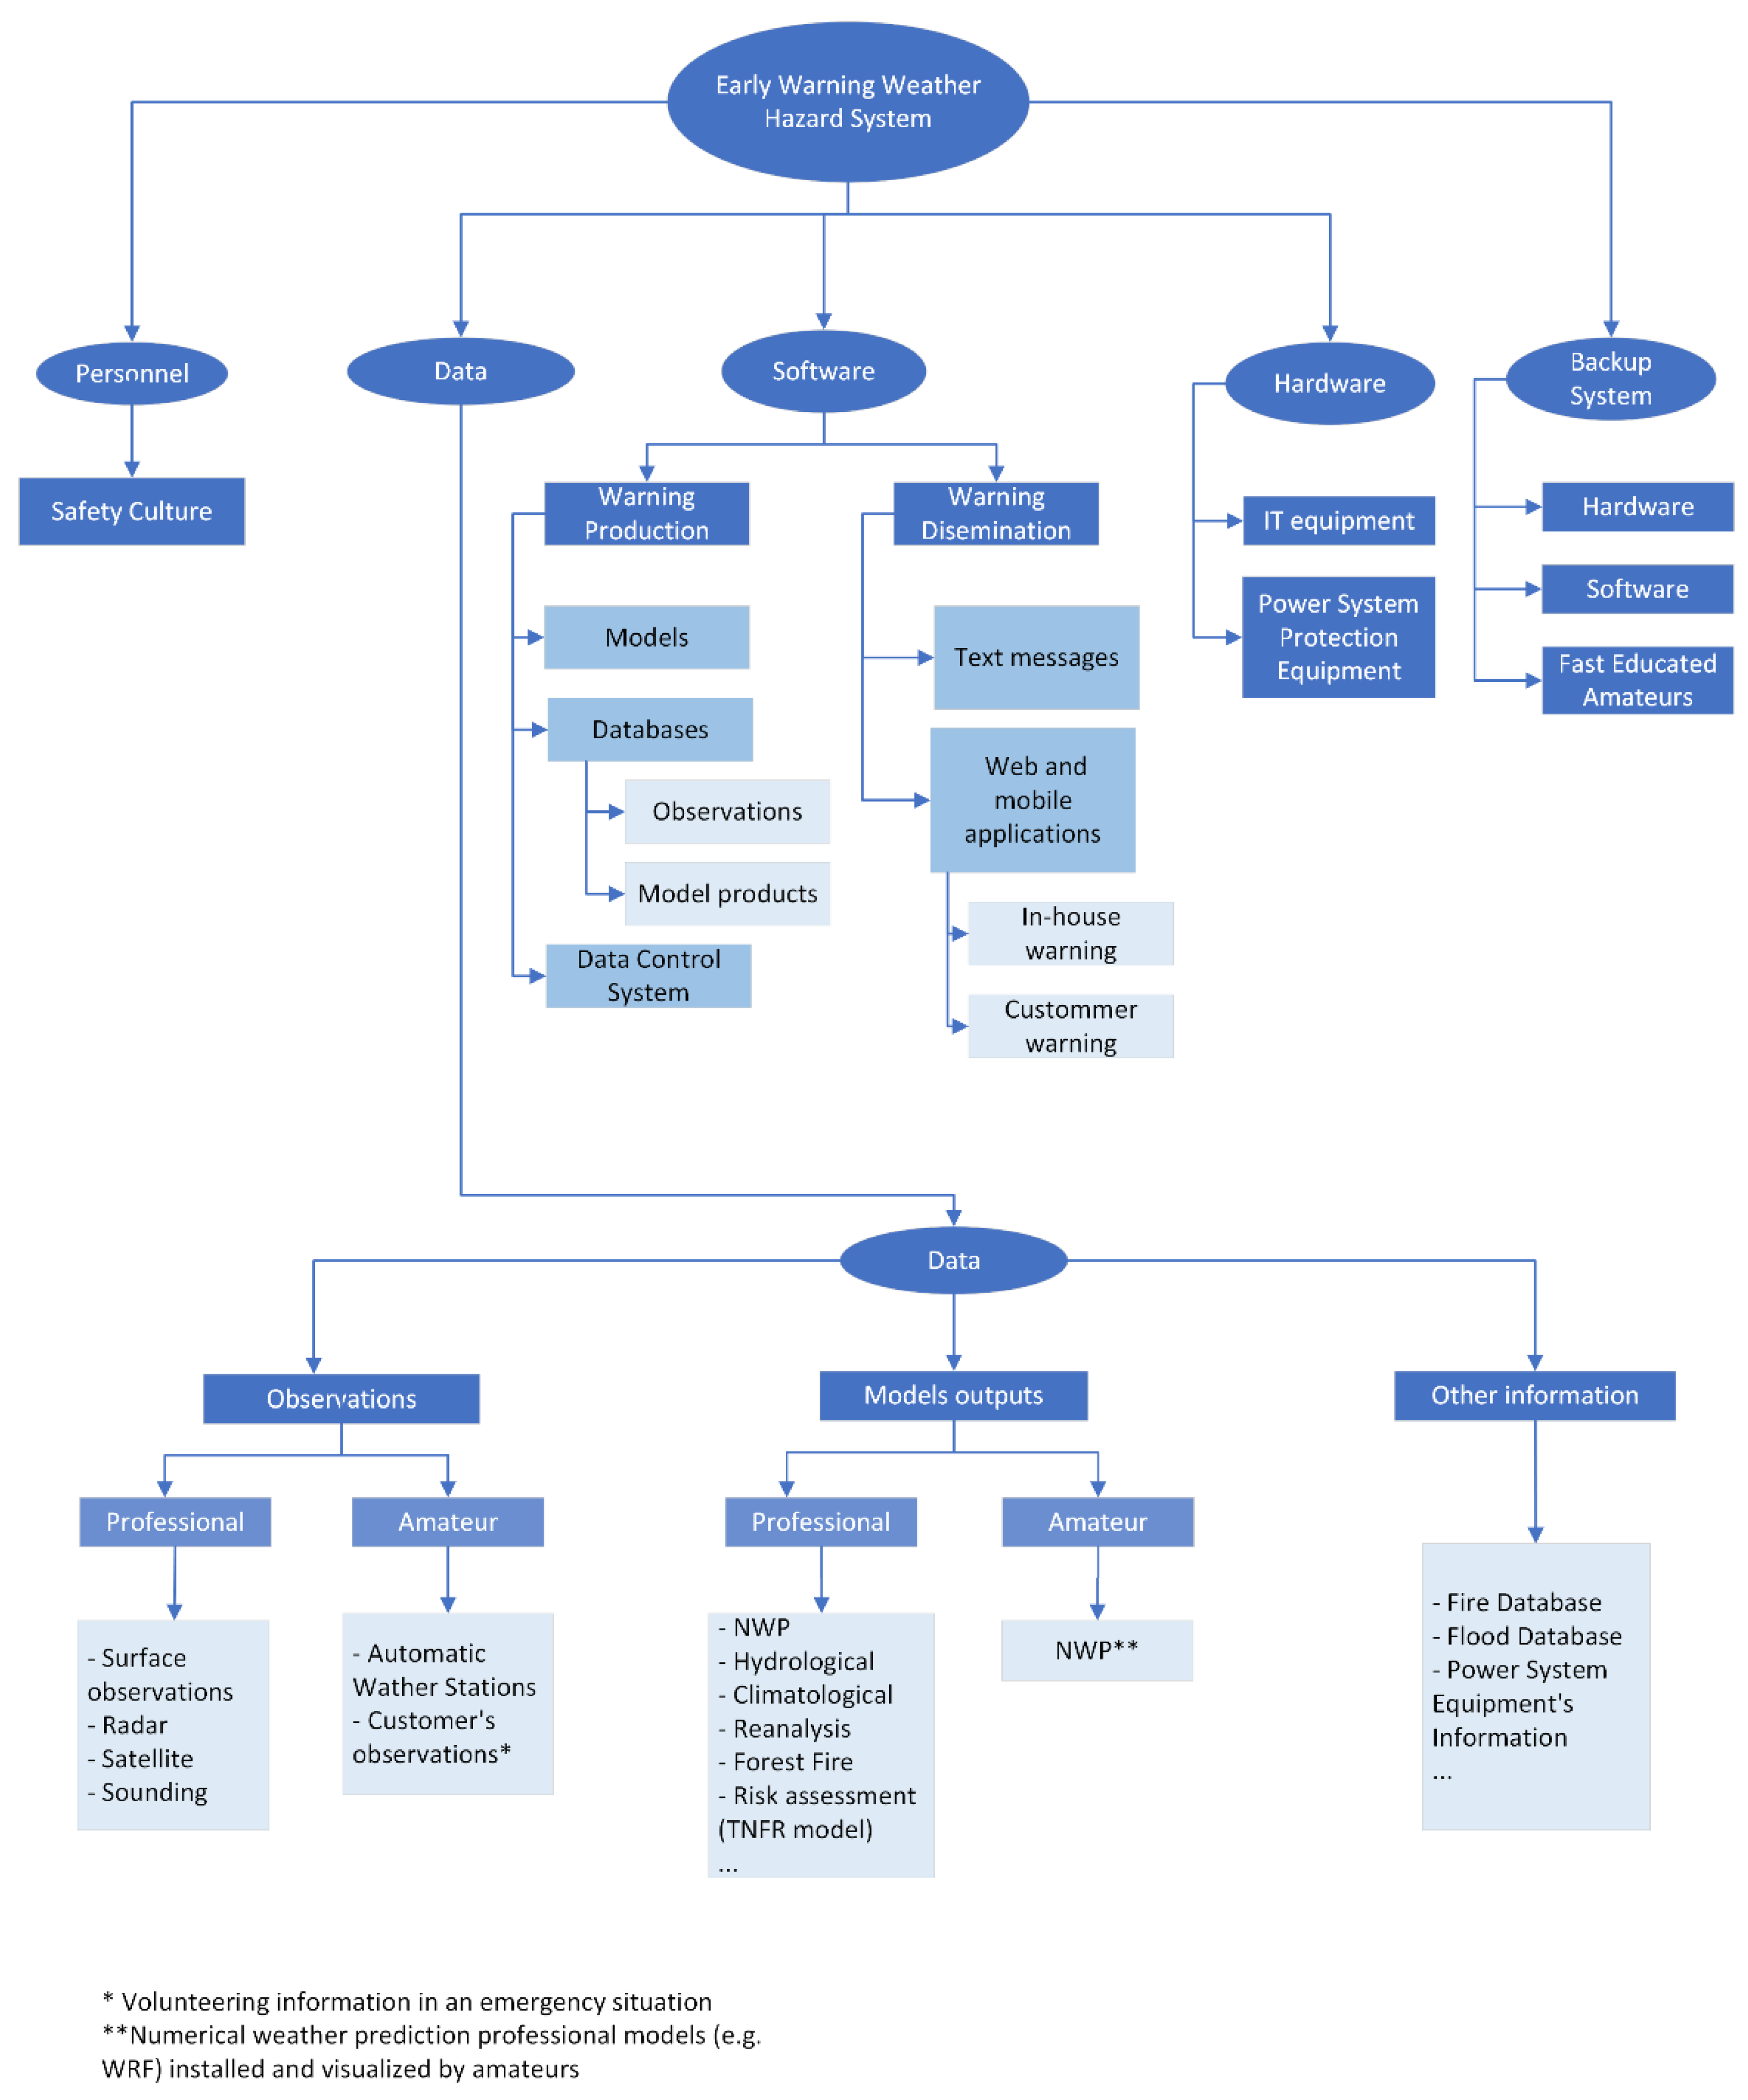
The overall early warning weather hazard system contains weather forecast and risk prediction for all possible weather hazards for the area of interest (e.g., heat and cold waves, different types of storms, floods, forest fires, strong winds, etc.). The scheme of the early warning hazard system is presented in Figure 4, and the example of calculating the risk index is proposed in Section 5.1. The proposed risk index is based on weather and power system information. It is adjusted to predict possible fire influence on the power system with an emphasis on the transmission network. The main segments of the proposed early warning system are personnel, data, software, hardware, and the backup system.
Personnel are the key element of every warning system because they are the ones who will react to unfavorable conditions and try to prevent unwanted consequences. It is necessary to develop a safety culture mindset (Section 4.3) within the team and spread it throughout society.
There is no warning system without timely, relevant, and accurate data. Data are necessary to research the weather influence in the past and recognize possible weather hazards in the present and the future. Measurements and/or observations ensure checkups of the real or near-real weather situation. Observations can be meteorological (e.g., type of cloud observation) and others (e.g., fire and flood events observation). Model products ensure the forecast or checkup of a future situation. A combination of measurements, observation, and model products enables a hazard assessment. Data can be provided by professionals, amateurs, and laypeople. It is crucial to establish excellent cooperation with amateurs and laypeople and encourage them to send information to the early warning system database. In sudden and fast severe weather events (e.g., such as a waterspout), there is a possibility that information provided by customers will be the only available data. More data information is provided in Section 4.1.
The suggestion is to have two software segments: warning production and warning dissemination (Figure 5). Warning production consists of models (NWP and climatological models, fire prediction models, etc.), databases with measurements and models products, and a data control system. The control system is essential because of possible errors and different data reliability, as described in Section 4.1. Warning dissemination can be provided via text messages or through web and mobile applications specially adapted for in-house use (for professionals, e.g., dispatch center employees) and for other customers. The application for customers should have a function for sending information about the state on the ground to the warning base. The other option to gather customers’ information is by collecting data they provide via social networks and other communication platforms. In the USA, during the tornado activity in May 2013, it was shown that information can be successfully collected by using Twitter (#) hashtags [39].
The text messages should be short and clear. The application should be user-friendly and easy to read. The suggestion is to use usual meteorological, energy-related, and other symbols and make a gradation in the weather hazard risk. The basic gradation has four steps: normal (transparent), moderate (yellow), severe (orange), extreme (red). Normal means that there is no particular awareness of the weather required, thus, no warnings. Moderate means that the weather is potentially dangerous. The meaning of severe is that the weather is potentially dangerous. An extreme alarm warns about very dangerous weather [40].
The simplest way to calculate the hazard risk index is by multiplying the weather hazard frequency and severity regarding the damage caused [41]. A more comprehensive way is to include the information about the impact of the hazard (e.g., economic, and social) and an occurrence probability instead of frequency. The multiplication of hazard probability, system vulnerability, and hazard impact results in the hazard risk index [42].
The hardware segment consists of all the necessary IT equipment and power system protection equipment (e.g., from dispatch center employees’ working equipment to the equipment required to ensure a safe working environment in the area of damage).
It is necessary to have at least one backup system with all the segments described above. The backup system’s quality, safety, and maintenance should be at the same level as the primary warning system(s). In disastrous and pretty fast weather events (e.g., deep cyclones with strong wind), an adequate and timely reaction is vital for ensuring power system and social safety. Consequently, it is unacceptable to be left without information from an early warning weather hazard system.
The proposed warning system’s application is possible in the dispatch center. If the customers require so, the warning system can be adapted to the power system segment of interest (e.g., only for wind power plants). The system is applicable to preventing both short-term and long-term weather hazards.

5.1. Transmission Network Fire Risk Index Calculation

This section will present the risk index calculation based on potential forest fire dangers. The transmission network fire risk (TNFR) model has three segments—meteorological, power system, and customer segment. The meteorological segment includes information about fire events such as the Initial Spread Index (ISI), Buildup Index (BUI) and Fire Weather Index (FWI), fire distance from objects of interest, and weather parameters (amount of precipitation, wind speed, and direction). The power system segment includes transmission lines, power plants, and substations. The customer segment includes the number of customers and their social significance. Each TNFR model sub-segment is graded according to the meteorological influence on the fire event and the influence of the fire event on the power system and the society vulnerability (Table 1, Table 2, Table 3, Table 4, Table 5, Table 6, Table 7, Table 8, Table 9, Table 10 and Table 11). The gradation is based on theoretical knowledge about weather, forest fires, and power systems and is adapted to Croatian climate [43], orography, and other conditions. Using gradation in other countries and regions requires consideration of local climatology and orography, at least.
A widely used method for weather-influenced forest fire risk prediction is the Canadian Forest Fire Weather Index (FWI). The method is based on noon air temperature, wind speed, relative humidity, and rainfall in the open, and is measured once a day at noon. Although the method is initially based on noon measurements, with additional caution or assumptions, it could be used for the FWI calculation for each part of the day or the FWI forecast calculation’s forecasted meteorological parameters. The method explains three specific problems connected with forest fires—the probability of ignition in certain weather conditions (BUI), the rate of spread after catching fire (ISI), and how difficult is it to control a spreading fire (FWI). Indices BUI, ISI, and FWI describe fire behavior and can be referred to as fire behavior indices. The BUI is expressed as:
B U I = 0.8 × D M C × D C P + 0.4 × D C ,  
when D M C 0.4 D C , or:
B U I = D M C [ 1 0.8 × D C P + 0.4 × D C ] × [ 0.92 + ( 0.0114 × D M C ) 1.7 ] ,  
when D M C > 0.4 × D C . DMC is the duff moisture code and DC is the drought code. DMC and DC are the factors of fuel moisture code [43]. The significance of each BUI value range in the risk index calculation is given in Table 1. The ISI is:
I S I = 0.208 × f ( W ) × f ( F )   ,
where f(W) is a function of wind and f(F) is a function of moisture [44]. The significance of each ISI value range in the risk index calculation is given in Table 2. The FWI is:
FWI = 0.1 × I S I × f ( D ) ,
where f(D) is an exponential function that contains BUI. The significance of each ISI value range in the risk index calculation is given in Table 3. Detailed information about FWI and its calculation can be found in references [44,45,46].
Table 1. Buildup Index (BUI) categories [47].
Category <24.2[24.2, 40.7>[40.7, 73.3>[73.3, 178.1>>= 178.1
Level   ( L B U I )12345
Table 2. Initial Spread Index (ISI) categories [47].
Category <3.2[3.2, 5.0>[5.0, 7.5>[7.5, 13.4>>= 13.4.1
Level   ( L I S I )12345
Table 3. Fire Weather Index (FWI) categories [47].
Category <5.2[5.2, 11.2>[11.2, 21.3>[21.3, 38.0>[38.0, 50.0>>= 50.0
Level   ( L I S I )123456
The TNFR index calculation can be done for each location with installed meteorological stations as well as for other locations of interest by using some of the interpolation methods. It is also possible to calculate the TNFR index for all areas of interest. The TNFR index is calculated by multiplying the hazard and vulnerability of the system and society.
The equation for the general fire danger index R F is:
R F = L B U I + L I S I + L F W I ,
where L B U I , L I S I , and L F W I are fire risk level indices (Table 1, Table 2 and Table 3). The wind risk index R W is:
R W = 3 × ( L D + L S ) ,
where L D , and L S , are level indices for mean wind speed and direction at 10 m over the ground (Table 4 and Table 5). The same indices are used in the wind gust categorization but multiplied by two because wind gust influence can be very hazardous. In Equation (5), the multiplication factor is three because of the summation of wind gust influence and influence of mean wind speed and direction at 10 m over the ground.
Table 4. Wind speed categories.
Category (m/s)<3[3, 6>[6, 10>[10.1, 15>[15.1, 20>[20.1, 30>>= 30
Level   ( L S )1234567
Table 5. Wind direction categories.
Category (°)<45[46, 90>[91, 135>[136, 180>[181, 225>[225, 270>[271, 315>[316, 359>
Level   ( L D )87643215
The precipitation risk index ( R P ) is equal to precipitation level ( L P ) for each location:
R P = L P .  
Precipitation levels are categorized only by the precipitation amount in one-hour intervals or by precipitation intensity (Table 6). This classification is chosen because of the importance of having a fire event under control in the shortest possible time interval. Although the FWI already includes wind and precipitation parameters, those parameters are taken into account again because of their importance in other firefighting segments (e.g., Canadair flight).
Table 6. Precipitation categories.
Category (mm/h)<1[1, 5>[5, 10>>= 10
Level   L P 4321
The overall meteorological risk index for one power system element ( R M E T _ O E ) and all areas of interest ( R M E T _ A E ) is given by the summation of fire, wind, and precipitation risk indices:
R M E T _ O E = R F + R W + R P ,  
R M E T _ A E = R F + R W + R P .  
The line voltage risk index ( R L V ) is:
R L V = i = 1 n L L V i ,
where L L V is the risk level for each power line (Table 7), and n is the number of lines in the area of interest. Except by voltage base, power lines are categorized by character (single or double).
Table 7. Line voltage categories (s—single overhead line, d—double overhead line).
Category (kV)110 s110 d220 s220 d400 s400 d
Level   ( L L V )123456
Power plants and substations are stored in the same category. The power plants and substations’ risk index can be observed by each element separately:
R P P S _ O E = L P P S ,
or as a summation of all elements in the area of interest:
R P P S _ A E = i = 1 n R P P S _ O E i ,
where L P P S is the risk level for each element (Table 8). Because of power plants’ significance to society, economy, etc., the suggestion is to observe the power plants and substations risk index as part of the TNFR index and separately as an individual risk index.
Table 8. Power plants and substations categories (PP—power plant).
CategoryWind PPSolar PPSubstationHydro PPThermal PPNuclear PP
Level   ( L P P S )123456
The weather distance level (e.g., fire distance level, L d i s t , Table 9) describes the distance between each weather hazard event (e.g., thunderstorm, forest fire, etc.) and the power system element. Each weather event requires a separate distance parameter determination. The suggestion is to observe the distance level for each power system element separately and for all power system elements in the area of interest together. The distance risk index for each power system element is the product of the power plant or substation risk index and distance level:
R d i s t _ O E = R P P S _ O E × L d i s t .
The distance risk index of all elements at the area of interest is:
R d i s t _ A E = i = 1 n R d i s t _ O E i ,
where R d i s t _ O E i describes the distance risk index to each power system element.
Table 9. Fire event distance categories.
Category (m/s)<10[10, 30>[30, 70>[70, 150>[150, 300>>= 300
Level   ( L d i s t )123456
The comprehensive power system risk index is given by the summation of line voltage and power plants and substations indices:
R P S _ O E = R L V + R P P S _ A E .
The human risk index ( R H ) presents human exposure to a hazard event. It is calculated by summarizing the risk index based on the risk levels according to the number of customers ( L C N , Table 10):
R C N = L C N ,
and the risk index based on customers’ significance ( L C S , Table 11):
R C S = L C S ,
R H = L C N + L C S .
Table 10. Customers’ number categories.
Category< 100,000[100,000, 500,000>[500,000, 1,000,000>>= 1,000,000
Level   ( L C N )1234
Table 11. Customer social significance categories.
CategoryGas Station etc.FactoriesFire SourcesWater StationsMilitary/Police AreaHospitals
Level   ( L C S )123456
By combining the meteorological, power system, and human risk index according to the basic method for the calculation of risk index:
R = H × V ,
where H is hazard and V is vulnerability [48], it is possible to calculate the transmission network fire risk index (TNFR):
T N F R = R M E T _ A E × ( R P S O E + R H ) .
In the TNFR index, meteorological parameters are observed as hazards that influence vulnerable elements of the power system and society.

5.2. Different Hazard Assessment or Prevention Examples

The Weather Impact Model (WIM), capable of real-time and day-ahead operations, was created by scientists from Texas and Philadelphia in 2018. The calculation of the weather hazard risk index was done by multiplying hazard probability, system vulnerability, and hazard impact. Outages are classified into three categories: vegetation outages (significant vegetation growth and consequently tree limb movement under severe event conditions), lightning outages, and other outages. The observed parameters are air temperature, dew-point temperature, relative humidity, wind speed and direction, precipitation, wind gusts, and lightning current [42].
Combining numerical weather forecasts and temporal synoptic situations (surface, satellite, and radar measurements) makes it possible to make successful subjective severe weather (convective storms) predictions. NWP models are getting better every day and can be used for objective alerting purposes [49]. Except when using NWP models only, storms or lightning can be predicted by using machine learning techniques as well [50].
Flood protection requires at least meteorological and hydrological interaction and cooperation between neighboring countries. An example of multinational collaboration is developing and using a hydrological model for predicting the water level in the river Sava, i.e., the Sava Super Model [51,52]. Another option in flood protection is to combine usual weather forecasting data and information about water fluctuations provided by wireless sensors. The sensors are fixed on riverbanks and provide continuous water state information [53].
Drought is imperceptible at first sight but can be very dangerous for power production and provide favorable fire conditions (see Section 3). Drought forecasting using the Markov chain model and Palmer Drought Severity Index (PDSI) was analyzed and presented by scientists from Nanjing University in 2009. Primary segments of PDSI computing are hydrological, climate, moisture anomaly, the drought severity calculation, and the concept of climatically appropriate for the existing condition (CAFEC) values. In the Markov process, if the present conditions are given, the future and the past conditions are independent of each other, and the drought classification is described through nine drought classes [54].
Fire ignition may vary from one fire event to another. A small, harmless fire, at first, can lead to enormous burned areas and damage under favorable meteorological conditions (e.g., low humidity and high wind speed) for fire ignition. A method for the estimation of the wildfire ignition risk associated with power lines (e.g., sparking), together with an optimization model that indicates lines for undergrounding, was provided by scientists from the University of Wisconsin–Madison in 2021. They modeled wildfire risk as a combination of the probability of wildfire potential and an electrical fault occurrence. The probability of wildfire potential was observed as a combination of weather and vegetation conditions [55]. The other method, from the same university, calculates the wildfire risk through the multiplication of probability of fire ignition and the impact of the fire event when it developed. Using this method and taking into account the risk of a wildfire caused by electric components and the short-term mitigation of wildfire risks, an optimization model was created to minimize a wildfire risk occurring due to electric power system components. At the same time, preserving electricity supplies to as many customers as possible is at the highest level [56].
Climate change monitoring is suggested through reports of authority institutions (e.g., WMO, ECMWF, etc.). Another option is to observe the data from relevant databases, such as the Copernicus Climate Data Store, and interpret them carefully or consult climate and energy professionals. This database contains various climatological datasets tailored even to the individual sector [57].

6. Conclusions

Energy supply is essential for global sustainability. The weather strongly influences the energy system. A favorable weather situation can help energy production, but some weather situations can lead to enormous damage. The same weather situation may be favorable and unfavorable. It is essential to recognize weather events and their possible influence in order to protect the power system. In the literature [5,6,8,9,10,15,23,26], there is a detailed general instruction for weather hazard prevention, and suggested solutions for the prevention of specific weather hazards [32,35,36,38,39,41,44,45,46,48,49,50,51,52,53,54,55,56]. In this article, the authors showed the scheme for establishing an early warning weather hazard system for overall power system control and proposed the risk index calculation as an example. The risk index contains the risk levels. In everyday use, it is necessary to adapt risk levels to a specific area of interest. The risk levels in the article are adapted to Croatian conditions. Developing an early warning weather hazard system for power system control, and especially for creating a base for the TNFR index calculation, for the first time, brought together meteorology and energy in fighting the consequences that fire events cause in Croatia. The TNFR index, as it is presented in this article, is the base for future research, and its value is yet to be determined empirically based on historical data and its application in everyday situations.
Except for extensive research into fire events’ influence over the power system, in future research, it will be necessary to include research on the accumulation of marine salt on overhead lines and its influence on the corona effect, and on the corona effect’s consequences. Moreso, insulators’ aging is strongly influenced by weather conditions (e.g., moisture, heat, light, atmospheric pressure, etc.). Finding the most realistic climate description for each micro-location will allow for more favorable weather simulations for laboratory research on insulator materials [58]. In a further broadening of horizons, it is possible to observe space weather influence and the changes in electromagnetic fields that lead to the induction of low-frequency currents, and consequently, to blackouts [59].
The presented early warning system is specific and is easily adapted to different kinds of use. It is possible to use the system to minimize unwanted consequences of both long-term and short-term weather hazards. Moreover, the system can be adapted for use in each power system segment. Although it is not necessary to react to each weather event, it is crucial to respond to the events that may lead to unfavorable consequences. The process of early recognition of unfavorable circumstances requires interdisciplinary knowledge in the weather and power system areas.
It is imperative to establish excellent cooperation between energy and meteorology experts and/or establish a new interdisciplinary science to improve weather risk management in the energy industry [17] and, at the same time, consider safety culture principles.

Author Contributions

B.F. created the idea of the article and supervised the article creation; A.B. conducted the research and wrote the article; The funding acquisition was done by B.F.-G. All authors have read and agreed to the published version of the manuscript.

Funding

This research was funded by the European Regional Development Fund (European Union), grant number KK.01.2.1.02.0117, with the project title “Advanced power system management in conditions of uncertainty arising from climate changes”.

Institutional Review Board Statement

Not applicable.

Informed Consent Statement

Not applicable.

Data Availability Statement

Not applicable.

Conflicts of Interest

The authors declare no conflict of interest. The funders had no role in the design of the study; in the collection, analyses, or interpretation of data; in the writing of the manuscript, or in the decision to publish the results.

References

  1. Kurz, M. Synoptic Meteorology; DWD: Offenbach am Main, Germany, 1998. [Google Scholar]
  2. WMO Working Group. WMO Guidelines on the Calculation of Climate Normals; WMO: Geneva, Switzerland, 2017. [Google Scholar]
  3. Fruh, B.; Brauch, J.; Brienen, S.; Buchholz, S.; Frohlich, K.; Hoff, A.; Imbery, F.; Kreienkamp, F.; Lenhardt, J.; Leps, A.; et al. Climate Predictions and Climate Projections; DWD: Offenbach/Main, Germany, 2021. [Google Scholar]
  4. Qazi, S. Standalone Photovoltaic (PV) Systems for Disaster Relief and Remote Areas; Elsevier: Amsterdam, The Netherlands, 2016. [Google Scholar]
  5. Wieczorek-Kosmala, M. Weather Risk Management in Energy Sector: The Polish Case. Energies 2020, 13, 945. [Google Scholar] [CrossRef] [Green Version]
  6. Garcia-Aristizuabal, A.; Wenzel, F.; Tomik, L.; Keršnik, M.; Botbaev, K.; De Meyer, I.; Konig, M.; Reichl, J.; Schmidthaler, M.; Mumovic, M.; et al. Protecting Electricity Networks from Natural Hazards; OSCE: Vienna, Austria, 2016. [Google Scholar]
  7. Masson-Delmotte, V.; Zahai, P.; Pirani, A.; Connors, S.L.; Pean, C.; Berger, S.; Caud, N.; Chen, Y.; Goldfarb, L.; Gomis, M.I.; et al. (Eds.) Working Group I to the Sixth Assessment Report of the Intergovernmental Panel on Climate Change Summary for Policymakers in Climate Change 2021: The Physical Science Basis; IPCC: Geneva, Switzerland, 2021. [Google Scholar]
  8. Nahon, C. Foreword 2. In Weather Matters for Energy; Troccoli, A., Dubus, L., Haupt, S.E., Eds.; Springer: New York, NY, USA, 2014. [Google Scholar]
  9. United Nations Environment Programme (UNEP). Division of Early Warning and Assessment (DEWA), Early Warning System: A State of the Art Analysis and Future Directions; United Nations Environment Programme (UNEP): Nairobi, Kenya, 2012. [Google Scholar]
  10. Dubus, L.; Muralidharan, S.; Troccoli, A. What Does the Energy Industry Require from Meteorology? In Weather & Climate Services for the Energy Industry; Troccoli, A., Ed.; Palgrave Macmillan: Norwich, UK, 2018. [Google Scholar]
  11. World Meteorological Organization. FAQs—Climate. Available online: https://public.wmo.int/en/about-us/frequently-asked-questions/climate (accessed on 11 January 2022).
  12. WMO. WMO Working Group International Meteorological Tables; Letestu, S., Ed.; WMO: Geneva, Switzerland, 1966. [Google Scholar]
  13. Lim, E.-P.; Simmonds, I. Southern Hemisphere Winter Extratropical Cyclone Characteristics and Vertical Organization Observed with the ERA-40 Data in 1979–2001. J. Clim. 2007, 20, 2675–2690. [Google Scholar] [CrossRef]
  14. Colucci, S.J. Synoptic Meteorology, Anticyclones; Elsevier: New York, NY, USA, 2015. [Google Scholar]
  15. Schaeffer, R.; Syklo, A.S.; De Lucena, A.P.F.; Borba, B.S.M.C.; Nogueira, L.P.P.; Fleming, F.P.; Troccoli, A.; Harrison, M.; Boulahya, M.S. Energy sector vulnerability to climate change: A review. Energy 2012, 38, 1. [Google Scholar] [CrossRef]
  16. Wagner, T.; Themessl, M.; Schuppel, A.; Gobiet, A.; Stigler, H.; Birk, S. Impacts of climate change on stream flow and hydro power generation in the Alpine region. Environ. Earth Sci. 2017, 76, 4. [Google Scholar] [CrossRef] [Green Version]
  17. Ronalds, B.F.; Wonhans, A.; Troccoli, A. A New Era for Energy and Meteorology. In Weather Matters for Energy; Troccoli, A., Dubus, L., Haupt, S.E., Eds.; Springer: New York, NY, USA, 2014. [Google Scholar]
  18. Stephen, R.; Seppa, T.; Douglass, D.; Lancaster, M.; Biedenbac, G.; Watt, G.; Lilien, J.L.; Pestana, R.; Ferrieres, P.; Schmale, M. Guide for Application of Direct Real-Time Monitoring Systems; Cigre: Paris, France, 2012. [Google Scholar]
  19. Anisie, A.; Boshell, F.; Mehrotra, S. Dynamic Line Rating Innovation Landscape Brief; International Renewable Energy Agency: Abu Dhabi, United Arab Emirates, 2020. [Google Scholar]
  20. Monteith, J.L.; Unsworth, M.H. Principles of Environmental Physics; Elsevier: Amsterdam, The Netherlands, 2014. [Google Scholar]
  21. VAISALA Working Group. Accuracy Matters in Radiosonde Measurements; VAISALA: Vantaa, Finland, 2016. [Google Scholar]
  22. Ahmadi, H.; Armstrong, M. Transmission Line Impedance Calculation Using Detailed Line Geometry and HEM Soil Resistivity Measurements. In IEEE Canadian Conference on Electrical and Computer Engineering (CCECE); IEEE: Vancouver, BC, Canada, 2016. [Google Scholar]
  23. Pirovano, G.; Faggian, P.; Bonelli, P.; Lacavalla, M.; Marcacci, P.; Ronzio, D. Combining Meteorological and Electrical Engineering Expertise to Solve Energy Management Problems. In Weather Matters for Energy; Troccoli, A., Dubus, L., Haupt, S.E.., Eds.; Springer: New York, NY, USA, 2014. [Google Scholar]
  24. Aboshosha, H.; Elawady, A.; El Ansary, A.; El Damatty, A. Review on dynamic and quasi-static buffeting response of transmission lines under synoptic and non-synoptic winds. Eng. Struct. 2016, 112, 23–46. [Google Scholar] [CrossRef]
  25. Callahan, C.W.; Elansari, A.M.; Fenton, D.L. Psychrometrics. In Postharvest Technology of Perishable Horticultural Commodities; Yahia, E.M., Ed.; Elsevier: Amsterdam, The Netherlands, 2019; pp. 271–310. [Google Scholar]
  26. Zhelezko, Y.S.; Kostyushko, V.A.; Krylov, S.V.; Nikiforov, E.P.; Savchenko, O.V.; Timashova, L.V.; Solomonik, E.A. Power losses in electrical networks depending on weather conditions. Hydrotech. Constr. 2005, 39, 51–56. [Google Scholar] [CrossRef]
  27. WMO. International Cloud Atlas, Rain. Available online: https://cloudatlas.wmo.int/en/rain.html (accessed on 21 January 2022).
  28. WMO. International Cloud Atlas, Dew. Available online: https://cloudatlas.wmo.int/en/dew.html (accessed on 21 January 2022).
  29. NOAA National Ocean Service, National Oceanic and Atmospheric Administration U.S. Department of Commerce. What are El Niño and La Niña? Available online: https://oceanservice.noaa.gov/facts/ninonina.html (accessed on 21 January 2022).
  30. Mariotti, A.; Zeng, N.; Iau, K.-M. Euro-Mediterranean rainfall and ENSO-a seasonality varying relationship. Geophys. Res. Lett. 2002, 29, 59-1–59-4. [Google Scholar] [CrossRef] [Green Version]
  31. Hanley, D.E.; Bourassa, M.A.; O’Brien, J.J.; Smith, S.R.; Spade, E.R. A Quantitative Evaluation of ENSO Indices. J. Clim. 2003, 1249–1258. [Google Scholar] [CrossRef]
  32. Panagea, I.S.; Tsanis, I.K.; Koutroulis, A.G.; Grillakis, M.G. Climate Change Impact on Photovoltaic Energy Output: The Case of Greece. Adv. Meteorol. 2014, 2014, 264506. [Google Scholar] [CrossRef]
  33. Romera, R.; Gaertner, M.Á.; Sanchez, E.; Domínguez, M.; González-Alemán, J.J.; Miglietta, M.M. Climate change projections of medicanes with a large multi-model ensemble of regional climate models. Glob. Planet. Chang. 2017, 151, 134–143. [Google Scholar] [CrossRef]
  34. World Meteorological Organization. Climate Service for the Energy Sector: A New GFCS Priority Area. Available online: https://public.wmo.int/en/resources/bulletin/climate-services-energy-sector-new-priority-area-gfcs (accessed on 30 January 2022).
  35. Love, G.; Plummer, N.; Muirhead, I.; Grant, I.; Rakich, C. Meteorology and the Energy Sector. In Weather Matters for Energy; Troccoli, A., Dubus, L., Haupt, S.E., Eds.; Springer: New York, NY, USA, 2014. [Google Scholar]
  36. Partners of the International Network for the Multi-hazard Early Warning System. Multi-Hazard Early Warning Systems: A Checklist, Outcome of the first Multi-hazard Early Warning Conference. In Multi-hazard Early Warning Conference; WMO: Cancun, Mexico, 2017. [Google Scholar]
  37. Copernicus. Climate Reanalysis. Available online: https://climate.copernicus.eu/climate-reanalysis (accessed on 11 January 2022).
  38. World Meteorological Organization. Meteorology and the Energy Sector—A WMO Perspective. Available online: https://public.wmo.int/en/bulletin/meteorology-and-energy-sector-wmo-perspective (accessed on 11 January 2022).
  39. Chatfield, A.T.; Brajawidagda, U. Crowdsourcing Hazardous Weather Reports from Citizens via Twittersphere under the Short Warning Lead Times of EF5 Intensity Tornado Conditions. In Proceedings of the 47th Hawaii International Conference on System Science, Waikoloa, HI, USA, 6–9 January 2014. [Google Scholar]
  40. EUMETNET. Meteoalarm. Available online: https://meteoalarm.org/en/page/_legend (accessed on 11 January 2022).
  41. Kim, K.; Kang, H.; Kim, Y. Risk Assessment for Natural Gas Hydrate Carriers: A Hazard Identification (HAZID) Study. Energies 2015, 8, 3142–3164. [Google Scholar] [CrossRef] [Green Version]
  42. Kezumovic, M.; Obradovic, Z.; Dokic, T.; Roychoudhury, S. Systematic Framework for Integration of Weather Data into Prediction Models for the Electric Grid Outage and Asset Management Applications. In Proceedings of the 51st Hawaii International Conference on System Sciences, Hilton Waikoloa Village, HI, USA, 3–6 January 2018. [Google Scholar]
  43. Zaninović, K.; Gajić-Čapka, M.; Perčec Tadić, M.; Vučetić, M.; Milković, J.; Bajić, A.; Cindrić, K.; Cvitan, L.; Katušin, Z.; Kaučić, D. Climate Atlas of Croatia 1961–1990., 1971–2000; Meteorological and Hydrological Service of Croatia: Zagreb, Croatia, 2008. [Google Scholar]
  44. Van Wagner, C.E.; Pickett, T.L. Equations and FORTRAN program for the Canadian Forest Fire Weather Index System; Canadian Forest Service: Ottawa, ON, Canada, 1985. [Google Scholar]
  45. Lawson, B.D.; Armitage, O.B. Weather Guide for the Canadian Forest Fire Danger Rating System; Natural Resources Canada: Ottawa, ON, Canada, 2008. [Google Scholar]
  46. Turner, J.A.; Lawson, B.D. Weather in the Canadian Forest Fire Danger Rating System. A User Guide to National Standards and Practices; Environment Canada: Ottawa, ON, Canada, 1978. [Google Scholar]
  47. User Guide to EFFIS Applications. 17 January 2022. Available online: https://effis-gwis-cms.s3-eu-west-1.amazonaws.com/apps/effis.viewer/userguide.pdf (accessed on 18 February 2022).
  48. Olson, R.S.; Ganapati, N.E.; Gawronski, V.T.; Olson, R.A.; Salna, E.; Sarmiento, J.P. From Disaster Risk Reduction to Policy Studies: Bridging Research Communities; ASCE: Reston, VA, USA, 2020. [Google Scholar]
  49. Mills, G.A.; Colquhoun, J.R. Objective Prediction of Severe Thunderstorm Environments: Preliminary Results Linking a Decision Tree with an Operational Regional NWP Model. Weather. Forecast. 1998, 13, 1078–1092. [Google Scholar] [CrossRef]
  50. Mostajabi, A. Nowcasting lightning occurrence from commonly available meteorological parameters using machine learning techniques. Clim. Atmos. Sci. 2019, 2, 41. [Google Scholar] [CrossRef]
  51. Jovanović, L. Strategy and measures for reducing of flood risk in Balkan countries. Fundam. Appl. Res. Pract. Lead. Sci. Sch. 2019, 33, 11–14. [Google Scholar] [CrossRef]
  52. Sava Super Model 2—Sava SM2. Croatian Meteorological and Hydrological Service. Available online: https://meteo.hr/infrastruktura.php?section=prognosticki_modeli&param=sava_sm (accessed on 11 January 2022).
  53. Subashini, M.J.; Sudarmani, R.; Gobika, S.; Varshini, R. Development of Smart Flood Monitoring and Early Warning System using Weather Forecasting Data and Wireless Sensor Networks-A Review. In Proceedings of the Third International Conference on Intelligent Communication Technologies and Virtual Mobile Networks, Tirunelveli, India, 4–6 February 2021. [Google Scholar]
  54. Liu, X.; Ren, L.; Yuan, F.; Yang, B. Meteorological Drought Forecasting Using Markov Chain Model. In Proceedings of the International Conference on Environmental Science and Information Application Technology, Wuhan, China, 4–5 July 2009. [Google Scholar]
  55. Taylor, S.; Roald, L.A. A Framework for Risk Assessment and Optimal Line Upgrade Selection to Mitigate Wildfire Risk. arXiv 2021, arXiv:2110.07348v2 [eess.SY]. [Google Scholar]
  56. Rhodes, N.; Ntaimo, L.; Roald, L. Balancing Wildfire Risk and Power Outages Through Optimized Power Shut-Offs. IEEE Trans. Power Syst. 2021, 36, 3118–3128. [Google Scholar] [CrossRef]
  57. Copernicus. Search Results. Available online: https://cds.climate.copernicus.eu/cdsapp#!/search?text=&type=dataset (accessed on 11 January 2022).
  58. Amin, M.; Salman, M. Aging of Polymeric Insulators (an overview). Rev. Adv. Mater. Sci. 2006, 13, 93–116. [Google Scholar]
  59. Oyedokun, D.T.O.; Cilliers, P.J. Chapter 16—Geomagnetically Induced Currents: A Threat to Modern Power Systems. In Classical and Recent Aspects of Power System Optimization; Zoba, A.F., Abdel Aleem, S.H.E., Abdelaziz, A.Y., Eds.; Academic Press: Cambridge, MA, USA, 2018; pp. 421–462. [Google Scholar]
Figure 2. Global warming influence on the energy sector (source: [34]).
Energies 15 02085 g002
Figure 3. The Just Culture process (source: [6]).
Energies 15 02085 g003
Figure 4. Early warning weather hazard system scheme.
Energies 15 02085 g004
Figure 5. Weather hazard detection process, an example for a fire event.
Energies 15 02085 g005
Publisher’s Note: MDPI stays neutral with regard to jurisdictional claims in published maps and institutional affiliations.

