Article

Framework for Mapping and Optimizing the Solar Rooftop Potential of Buildings in Urban Systems

1
Department of Civil & Environmental Engineering, University of Alberta, Edmonton, AB T6G 1H9, Canada
2
Department of Electrical & Computer Engineering, University of Alberta, Edmonton, AB T6G 1H9, Canada
3
National Research Council Canada, Ottawa, ON K1V 1J8, Canada
4
Energy Management & Sustainable Operations, University of Alberta, Edmonton, AB T6G 1H9, Canada
*
Author to whom correspondence should be addressed.
Energies 2022, 15(5), 1738; https://doi.org/10.3390/en15051738
Submission received: 14 December 2021 / Revised: 3 February 2022 / Accepted: 11 February 2022 / Published: 25 February 2022
(This article belongs to the Section G: Energy and Buildings)

Abstract

:
The accurate prediction of the solar energy that can be generated using the rooftops of buildings is an essential tool for many researchers, decision makers, and investors for creating sustainable cities and societies. This study is focused on the development of an automated method to extract the useable areas of rooftops and optimize the solar PV panel layout based on the given electricity loading of a building. In this context, the authors of this article developed two crucial methods. First, a special pixel-based rooftop recognition methodology was developed to analyze detailed and complex rooftop types while avoiding the challenges associated with the nature of the particular building rooftops. Second, a multi-objective enveloped min–max optimization algorithm was developed to maximize solar energy generation and minimize energy cost in terms of payback based on the marginal price signals. This optimization algorithm facilitates the optimal integration of three controlled variables—tilt angle, azimuth angle, and inter-row spacing—under a non-linear optimization space. The performance of proposed algorithms is demonstrated using three campus buildings at the University of Alberta, Edmonton, Alberta, Canada as case studies. It is shown that the proposed algorithms can be used to optimize PV panel distribution while effectively maintaining system constraints.

1. Introduction

Considering the energy and environmental crisis in recent years, many countries around the world are racing to use different approaches to energy issues (including the replacement of fossil fuels with renewable sources of energy) to save energy and reduce energy consumption, control supply and demand, and reduce their carbon footprints. As buildings are one of the leading energy consumers, solar photovoltaics (PV) are considered a key technology for climate change mitigation and clean energy generation that offer sustainable energy and emission savings. For example, from 30% to 40% of the total energy consumed in North America is dedicated to buildings, and the building sector can contribute more than 30% of the total carbon dioxide emissions each year [1].
Building energy consumption is affected by many factors and characteristics of the building envelope, including the layout of the building rooftops, the scale of the building, and the regional climate [2]. A building’s rooftop layout is considered one of the most critical factors and an integral part of the building because its design determines the response of the building to external factors such as solar irradiance intensity and weather change [3]. Furthermore, in this study, the rooftop characteristics were the main factor considered for the proposed optimized solar PV layout design methodology.
In this context, all potential locations where a solar PV system could be placed (e.g., rooftops and walls) in urban and rural areas should be analyzed in order to optimally utilize renewable energy. This includes the detection of residential, commercial, and office rooftops for the optimum installation of solar PV systems. To this end, the authors of this study propose a multi-objective optimization problem to extract the rooftop information required for optimizing solar PV installations. The main critical objective is to optimize the PV system layout configuration by using the identified rooftop areas and the building energy cost by maximizing the PV energy generation in order to minimize purchasing from the grid, eventually reducing carbon dioxide emissions.
Numerous works have been conducted to find the optimal tilt and azimuth angle in different parts of the world. For instance, Yang and Lu [4] provided a practical mathematical method for obtaining the optimal tilt angle based on monthly, seasonal, and annual radiation data for a grid-connected system in Hong Kong and stand-alone, building-integrated photovoltaic systems. In another study, Siraki and Pillay [5] used a simple model to calculate the optimal tilt angle based on a modified sky model that considered latitude, weather conditions, and the effect of surrounding obstacles. Rowlands et al. [6] obtained the optimal tilt and azimuth angle for solar panels to maximize revenue in Ontario, Canada. In the surveyed cities (Toronto and Ottawa), the tilt angle was slightly less than latitude; and the azimuth angle, depending on the cost regime, was approximate to the south (between 4 degrees southwest and 6 degrees southeast). Kaddoura et al. [7] also obtained the optimal tilt angle for different cities in Saudi Arabia. They suggested that the tilt angle can be changed six times a year. Their results also showed that the monthly and seasonal changes in the optimal angle increased the produced energy by 6.37% and 7.74%, respectively. However, the four abovementioned studies did not consider the effect of the mutual shading of the panels for PV energy assessment. In addition, these studies did not consider the building load demand in their analyses.
The optimization of a PV configuration depends on many other factors such as the overall system size, the generation capacity of each module, the inter-row spacing between adjacent rows, the amount of shading on the modules due to the consecutive modules, and the roof features of the building [8]. Zhong and Tong [9] examined how the panels should be aligned side by side on rooftops to find the optimal spatial arrangement. They studied different alignment types (e.g., vertical alignment, horizontal alignment, and without alignment scenario), and their results showed that no alignment was the best arrangement. The main limitations of their work were that the panels’ tilt angle was considered to be zero and the edges of the panels were assumed to be parallel to the roofs’ edges. Perez-Gallardo et al. [10] maximized the amount of energy generation by a solar PV system using a genetic algorithm. The optimization was performed on a flat surface without elevation and with a specific rectangular shape. In addition, based on the techno-economic and environmental criteria, they studied and ranked five different solar module technologies such as the monocrystalline silicon, multi-crystalline silicon, amorphous silicon, copper indium selenide, and cadmium telluride.
Determining the optimal design of solar panel distribution while satisfying multiple objectives is becoming a more widely studied topic considering a large number of parameters and involved strategies. Recent studies have presented several approaches to determine the solar irradiance and optimize the PV configuration of building rooftops. Awad and Gül [11] obtained the optimized layout and system size by applying a generalized reduced gradient nonlinear optimization algorithm that considered the significant seasonal variations during the daylight hours and in the sun’s path. Alghamdi and Abdulsalam [12] optimized the power generation of PV panels installed on building roofs. They additionally developed and simulated a dynamic solar radiation model to assess the hourly electricity generation, and a cost–benefit analysis was conducted for different scenarios of PV system capacities. Liu et al. [13] developed energy-load matching optimization to achieve net-zero energy buildings using PV systems in seven cities in China. This algorithm considered both rooftops and facades. Teofilo et al. [14] implemented large-scale rooftop PV systems at airports for energy planning and policymaking in Australia. Additionally, the authors investigated the potential of electricity production of rooftop solar PV at 21 federal airports in Australia. Their methodology framework included the low-cost data collection of 3D rooftops using user-friendly solar radiation modeling in GIS. Behura et al. [15] presented an optimization algorithm to install a PV system on the rooftop of a building on the Vellore Institute of Technology campus (Vellore, India). This design was evaluated over an entire year using the PVsyst v6.70 software. Additionally, weather datasets of ambient temperature and radiation were considered.
Litjens et al. [16] combined consumption patterns based on Dutch historical data from 48 residential and 42 commercial buildings and day-ahead Dutch and German electricity prices to find the optimal orientation of panels for various optimization objectives, such as self-consumption. They analyzed 10,761 different directions, and the results showed that self-consumption for residential buildings was maximized when the tilt angle was 26 degrees and the azimuth angle was 212 degrees. On the other hand, they found that the maximum self-consumption for commercial buildings occurred when the tilt angle was 17 degrees and the azimuth angle was 188 degrees. Christiaanse et al. [17] performed two-level techno-economic optimization to design rooftop PV systems in British Colombia, Canada. In their work, they considered the energy consumption of the building, the area of the roof, the basic mutual shading analysis of adjacent panels, and the electricity rate of the grid. A case study on prototype buildings using EnergyPlus showed that current costs must be reduced by 50%, such as 1.25 CAD per installed watt, for solar system projects to be economically viable. Another study by Awan et al. [18] showed the optimal distance between the panel arrays for two PV installations on the roof and the ground to maximize the energy yield and minimize the levelized cost of energy in Majmaah, Saudi Arabia. They also considered cooling load reduction due to panel shading on the roof in the cost analysis. The results showed that the PV system installed on the rooftop performed up to 23.7% better than the ground installation in terms of the levelized cost of energy. Korsavi et al. [19] carried out energy and economic evaluations of installing PV panels on rooftops in hot and dry regions in Iran. They examined various economic parameters, including payback period, net present value, return of investment, and levelized cost of energy. Their results showed that due to the subsidies that contribute to reducing the electricity price in Iran, the payback period is between 46.9 and 50.5 years. Additionally, they pointed out that if one considers the actual cost of electricity without the subsidies, the return on investment could be 11.6 years.
Tiwari et al. [20] evaluated solar potential on rooftops, including flat and sloped roofs in an urban area, using Airborne LiDAR and orthophoto, but they did not consider the solar reflections and PV modules’ shading effect. Awad et al. [8] used a PSO algorithm for multi-objective optimization to maximize the energy produced by a PV system while considering the shading from the PV modules. Additionally, the cost in the form of energy yield for a commercial building was considered. The main downside of this method is that the load demand is not considered during the optimization of PV modules.
In practice, rooftops may include irregular shapes and objects/obstacles that may interfere with the solar PV installation. Additionally, multiple connected parts and segments may make automated roof identification very hard to achieve. These concerns suggest critical limitations of the mentioned literature. In addition, previous studies implemented either simple optimization problems to make the system models more viable for PV installations or lacked a sophisticated shadow assessment, thus limiting the applicability of the methods. These limitations motivated the authors of this paper to develop a comprehensive design methodology to optimize solar PV installations on building rooftops while considering various critical parameters. The main contributions of the proposed approach are as follows:
  • Developing an advanced image processing method to consider unusual shapes of building roofs, roofs with obstacles, and roofs with different heights.
  • Using the search space optimization method to deal with the non-linear problem with sensitive constraints, such as the number and location of PV panels and irregular roof dimensions, in addition to the main control variables: tilt and azimuth angles.
  • Considering two types of shading impact: the mutual shading of the adjacent panels and the shading of surrounding objects such as higher roofs, parapets, trees, chimneys, large external HVAC systems, and neighbor buildings.
Accordingly, the present work is a more powerful and realistic reference than previous studies for the determination of the optimal arrangement of photovoltaic panels on roofs regardless of their shape, regarding economic features.
The developed algorithm was applied to three buildings located on the North Campus of the University of Alberta: the Administrative Building (ADMIN), Cameron Library Building (CAM), and Earth and Environmental Sciences Building (EAS). The general procedure of the current study is shown in Figure 1.

2. Materials and Methods

2.1. Building Models

This study was focused on extracting the necessary information about roofs using 3D building models and image processing. The 3D models available in Google Maps can aid the extraction of useful information about building rooftops [21]. However, Google Maps does not support spatial analysis of its 3D models. To overcome this issue, several procedural steps are required to analyze the model of a building rooftop, as detailed in [22]. First, the RenderDoc graphics debugging tool is used to capture an instantaneous snapshot of a building’s 3D model while the computer’s graphics processing unit is rendering it [23]. Second, the Blender software [24] is used to convert the RenderDoc 3D model format into the STL format with the help of an add-on called Map Models Importer [25]. Finally, the 3D model is projected into a 2D heightmap to analyze each rooftop’s height. Details of the heightmap analysis are elaborated upon in Section 2.2.
However, Google’s 3D models are not scaled to real-world units. This issue can be resolved using a conversion factor to convert each model’s arbitrarily-scaled units into real-world units. This pixels-to-meters conversion factor comes from the physical distance spanned (vertically) by a Google Maps window, indicated in the URL bar. For example, if a Google Maps window is 850 pixels tall on a device and the URL shows that the window spans 172 m, then the pixels-to-meters conversion factor is simply 172 m/850 pix. Since Google Maps offers fairly accurate and up-to-date models for building rooftops in residential and industrial areas, the proposed algorithm can be applied to most buildings in most cities without the use of building blueprints.
However, a closer inspection of each model in Google Maps may reveal some issues with resolution, mainly when the model includes irregular objects such as real-world obstacles and erroneous triangular holes on rooftops. Our proposed algorithm also mitigates these issues, as further detailed below. In a grayscale image, these holes are identified by dark pixels surrounded by lighter pixels. This algorithm uses the procedure in the morphological reconstruction [26]. It is worth noting that although the rooftop identification part of the proposed algorithm is based on a Google Maps 3D mesh model, rooftops that are not available using Google’s 3D models can be analyzed with the proposed algorithm after the rooftop is scanned using other technologies such as drones equipped with cameras and/or LiDAR.

2.2. Rooftop Recognition Using Computer Vision

This section explains how roofs of buildings are identified, classified, and then simplified to polygons. The discussed procedure is carried out in MATLAB.

2.2.1. Roof Identification

The rooftops of a building can be identified through several procedural steps developed by particular pixel-based algorithms. A valid rooftop is defined as a region in a heightmap separated from the rest of the map by a sharp discontinuity in height, which we define as an edge. All rooftops must be at least 3.5 m above the ground and have enough area for at least one standard size PV panel. The goal of the roof identification algorithm is to split the heightmap of a building into different isolated sections that each represent a rooftop. Each section should have its own height range and slope, and the binary representation of each section is referred to as its blob [27].
A percentile analysis is applied to the heightmap of each blob to check for multiple distinct flat regions, and then separate them accordingly in case the previously mentioned edge detection failed. If the percentile analysis indicates at least two individual flat regions within the selected blob, the detected regions are separated to generate two individual roofs or more. Flat regions in a blob are detected by the i f l a t function defined as:
i f l a t = { 1 ,     ( v i v i 1 2.5 < 0.17 25 ) | ( v i + 1 v i 2.5 < 0.17 25 ) 0 ,     o t h e r w i s e ,
where v is a 1D array of the blob’s height percentile values in order of increasing percent rank [28], in steps of 2.5%. The i f l a t function is essentially an indicator of height ranges where the blob is considered flat, defined as the height percentile increasing by less than 0.17/25 (m/%).
However, at this stage in the rooftop segmentation process, some rooftop blobs may comprise multiple distinct slanted rooftops with little to no difference in heights where the roofs meet (as is the case with gable roofs, hip roofs, etc.). Thus, the precise segmentation of these rooftops into their component blobs requires additional steps. For instance, the rooftop of the Cameron Library building (CAM) is an excellent example of a wavy rooftop composed of multiple slanted rooftops, which should thus be separated into multiple individual blobs. Further details on how to deal with and address this issue with such rooftops are demonstrated in Section 2.2.2.
The current algorithm can detect large obstacles such as chillers; heating, ventilation and air conditioning (HVAC) external units; and solar collectors. In the proposed detection and classification algorithm, if the difference between a rooftop and obstacles is at least one meter, the obstacle can be detected. Otherwise, it may not be detectable. Therefore, for example, solar collectors with a slight tilt angle may not be recognizable.

2.2.2. Roof Classification

After the rooftop identification procedure, a rooftop classification step is applied to classify these roofs into one of three different types: (1) flat, a rooftop with roughly constant height, with or without parapets; (2) slanted, a rooftop that is not flat but has an approximately constant slope; and (3) irregular, i.e., any rooftop or object that does not fall into the previous two categories, such as curved rooftops, large trees, and rooftops with nearby treetops that are hard to identify in the heightmap. All detected irregular objects are removed from consideration because they may affect the useful area for the PV panel installation.
Similarly to the percentile analysis mentioned in the previous sub-section, a roof is categorized as flat if at least 50% of its height percentile values have a height change of less than 0.17/25 (m/%) and at least 10% of its height percentile values have a height change of less than 0.05/25 (m/%),
If the roof is not flat, then a comparison between the blob’s heightmap and a virtual fitting plane is applied to determine whether the blob is slanted or not. The fitting plane is defined as:
z f i t = z h i g h + d z d x ( x x h i g h ) + d z d y ( y y h i g h )
where x h i g h , y h i g h , and z h i g h are the coordinates of the investigated blob’s highest point. If the standard deviation of the residuals between the blob’s heights and the fitting plane is smaller than 0.095 m, then the rooftop is classified as slanted. Otherwise, it is classified as irregular.
At this stage in the algorithm, rooftops classified as “irregular” may simply be composed of flat and slanted rooftops connected together, as is the case with (for example) gabled, hip, and butterfly rooftops. Therefore, an enhanced separation method is applied on each irregular rooftop to split it into smaller pieces.
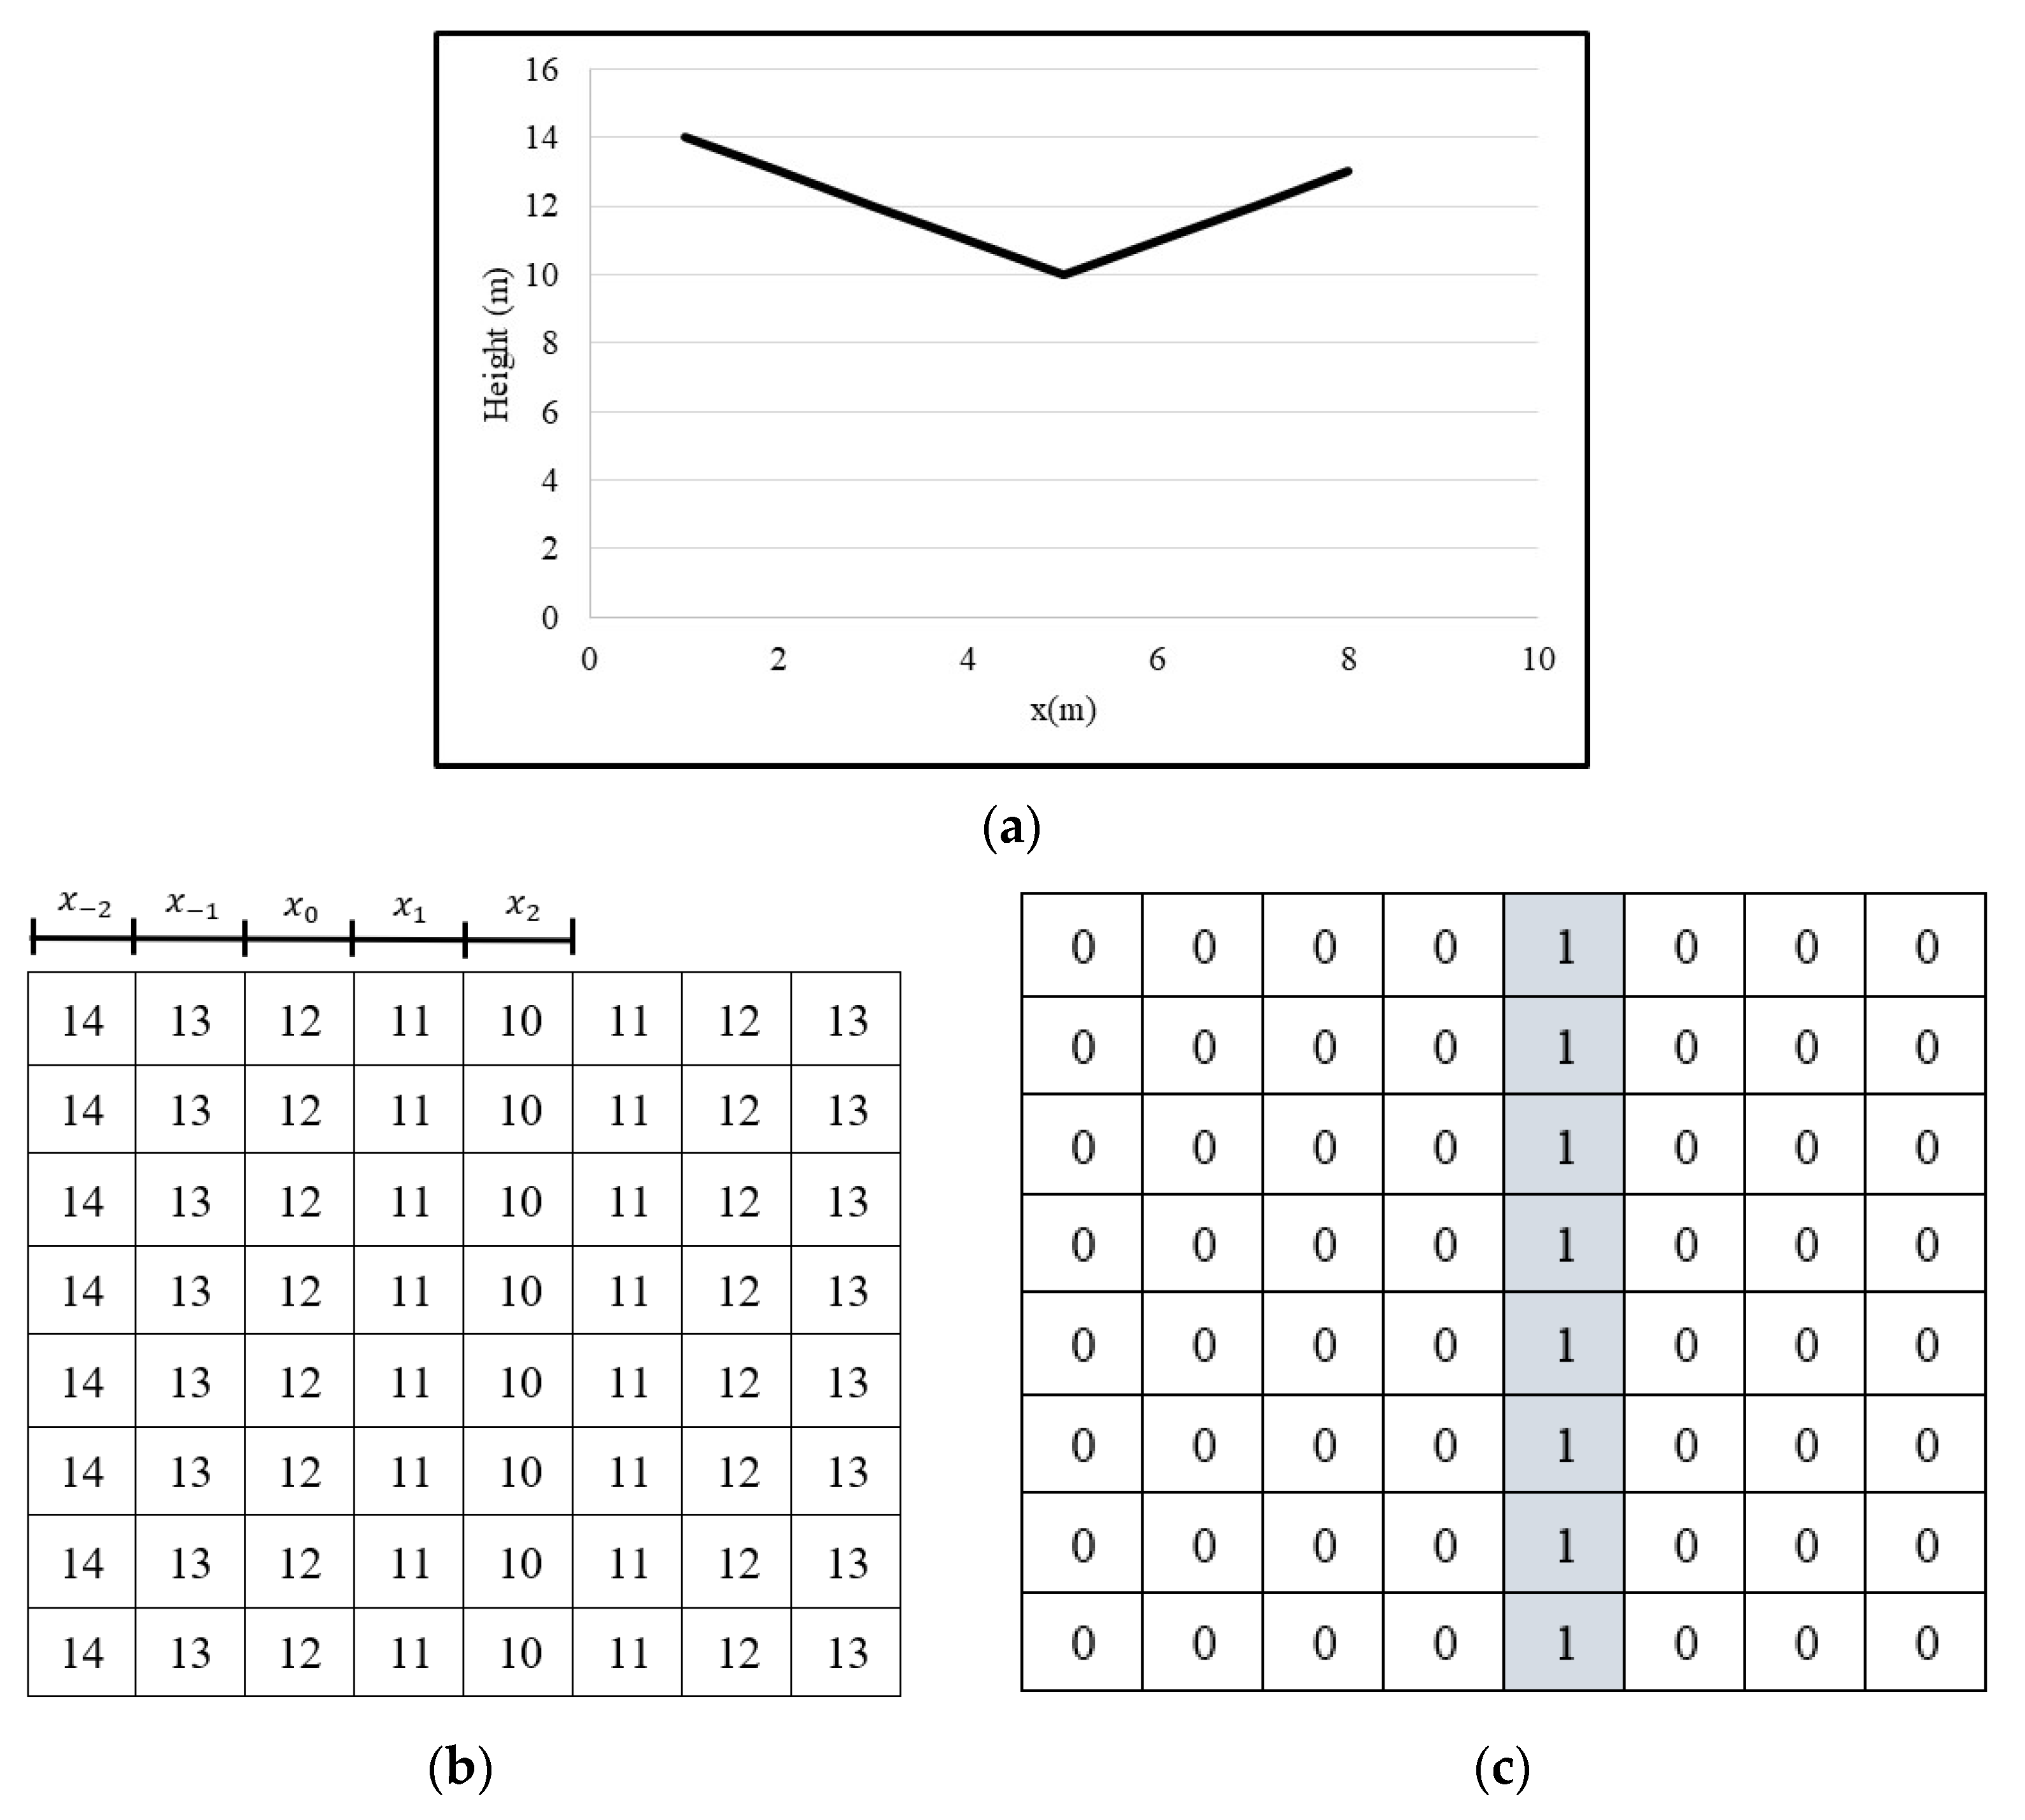
The proposed multi-slant detection methodology based on morphological erosion theory [29,30,31] can locate ridges by finding local maxima and minima running over all the directions of the blob. A ridge is a virtual line that links two slanted surfaces. If ridges are validated, they split a blob into multiple distinctly sloped blobs. For example, Figure 2 shows a butterfly roof that defines a low ridge in a blob heightmap. First, a linear morphological structuring element is considered to find the local minima running over different directions (see Figure 2b, in which each illustrated height pixel is in units of meters). Then, the mid-part of the structuring element (denoted x 0 in Figure 2b) is dragged around each pixel in the heightmap. At each pixel, the height values overlapped by the structuring element are isolated and compared. If this mid-part of the structuring element is paired with the corresponding pixel with the smallest height in the isolated pixels, a value of “1” is assigned to that pixel in a binary map. The exact process is iterated over multiple orientations for the linear structuring element, and the final result looks like Figure 2c. Therefore, if a consecutive number of “1”s crosses the binary map, then an irregular classified roof can be split along this line into two individual slanted roofs.

2.2.3. Polygon Approximation

This approach can be considered the final step of the rooftop analysis that simplifies rooftop shapes into more predictable areas to accommodate the subsequent solar panel optimization in the next section. Upon generating several simplified polygon shapes of each rooftop using a pseudo-deterministic algorithm, each pixel of the original rooftop is assigned a score so that “1.0” precisely corresponds to a roof’s edges, and the score of this map gradually decreases as pixels are located farther from the edge on both sides. On the other hand, straight lines are drawn in each approximate polygon map from each corner to the next, ideally tracing the approximate outline of the rooftop blob. Thus, the pixels that correspond to the polygon edge are filled with “1”. This approach generates approximate polygons for all roofs and can be tested using the confidence score equation below:
c o n f i d e n c e = i = 1 p i x e l s   i n   m a p p o l y g o n   m a p   s c o r e ( i ) × r o o f   m a p   s c o r e ( i )   t o t a l   n u m b e r   o f   e n t r i e s   o f   1   i n   t h e   r o o f   m a p
The confidence score equation indicates how closely the outline of the final tolerated polygon can match the outline of the selected roof edges. The confidence score ranges from 0 (meaning there is no overlap between the two outlines) to 1 (indicating identical outlines). Thus, the approximation result with the highest confidence score is expected to represent the selected rooftop best.

2.3. Solar Radiation Model

Several radiation variables have to be first analyzed to investigate a solar radiation model of PV energy performance. In this study, the ADMIN, CAM, and EAS buildings of the University of Alberta were selected for our optimization algorithm. These buildings are located in Edmonton, Alberta, with geographical coordinates of 53.5461 ° N, 113.4938 ° W.
The clear-sky radiation (W/m2) reaching the surface of the solar module ( G c s ) is composed of three parts: beam radiation ( G b e a m ), diffuse ( G d i f f ), and reflection from the ground ( G r e f l ), as represented in Equation (4) [32]:
G   c s = G b e a m + G d i f f + G r e f l  
Each component on the right-hand side of Equation (4) can be calculated separately. However, the clear-sky global horizontal radiation G G H has to be calculated first with Equation (5), which is the basis for calculating beam and reflection radiation [33,34]:
G G H = 0.7 × G o n × c o s ( θ z ) ,
where G o n and θ z are the extraterrestrial radiation on a horizontal plane and zenith angle, respectively, and can be found in the work of Duffie and Beckman [32]. Using G G H , the beam radiation, G beam , can be obtained as:
G b e a m = G G H × c o s   θ   c o s   θ z    
The ratio used in Equation (6) is a geometric coefficient representing the proportion of irradiance on the inclined surface to the horizontal surface [32]. θ is the incidence angle of beam irradiance and is defined as follows:
θ = cos 1 ( sin δ sin ϕ cos β sin δ cos ϕ sin β cos γ + cos δ cos ϕ cos β cos ω + cos δ sin ϕ sin β cos γ cos ω + cos δ sin β sin γ sin ω ) ,
where δ , ϕ , γ , ω , and β are the declination angle, the latitude of the location, surface azimuth angle, hour angle, and surface tilt angle, respectively. Note that all angles are in degrees. The declination and hour angle can be obtained with the method of Duffie and Beckman [32]. The other radiation component is the diffuse irradiance, which can be represented as [11,35]:
G d i f f = [ 14.29 + 21.04 ( π 2 θ z × π 180 ) ] ( 1 + c o s   β   2 )  
where the expression inside the brackets represents the diffuse radiation on the horizontal surface. The proportion inside the second pair of parentheses is the surface-to-sky view factor, which designates the ratio of the diffuse irradiance of the sloped surface to the horizontal surface. The reflected irradiance is determined by Equation (9) as [32]:
G r e f l = ρ g × G G H ( 1 c o s   β   2 )  
where ρ g stands for the surrounding reflectance and the ratio in the parenthesis represents the surface-to-ground view factor. Finally, to calculate the output power of the modules G ( W / m 2 ), the value of G c s must be multiplied by clear-sky index ( k t ) as follows:
G = k t × G c s .
Equation (10) shows the effect of the sky cloudiness on the amount of solar energy at the module location.
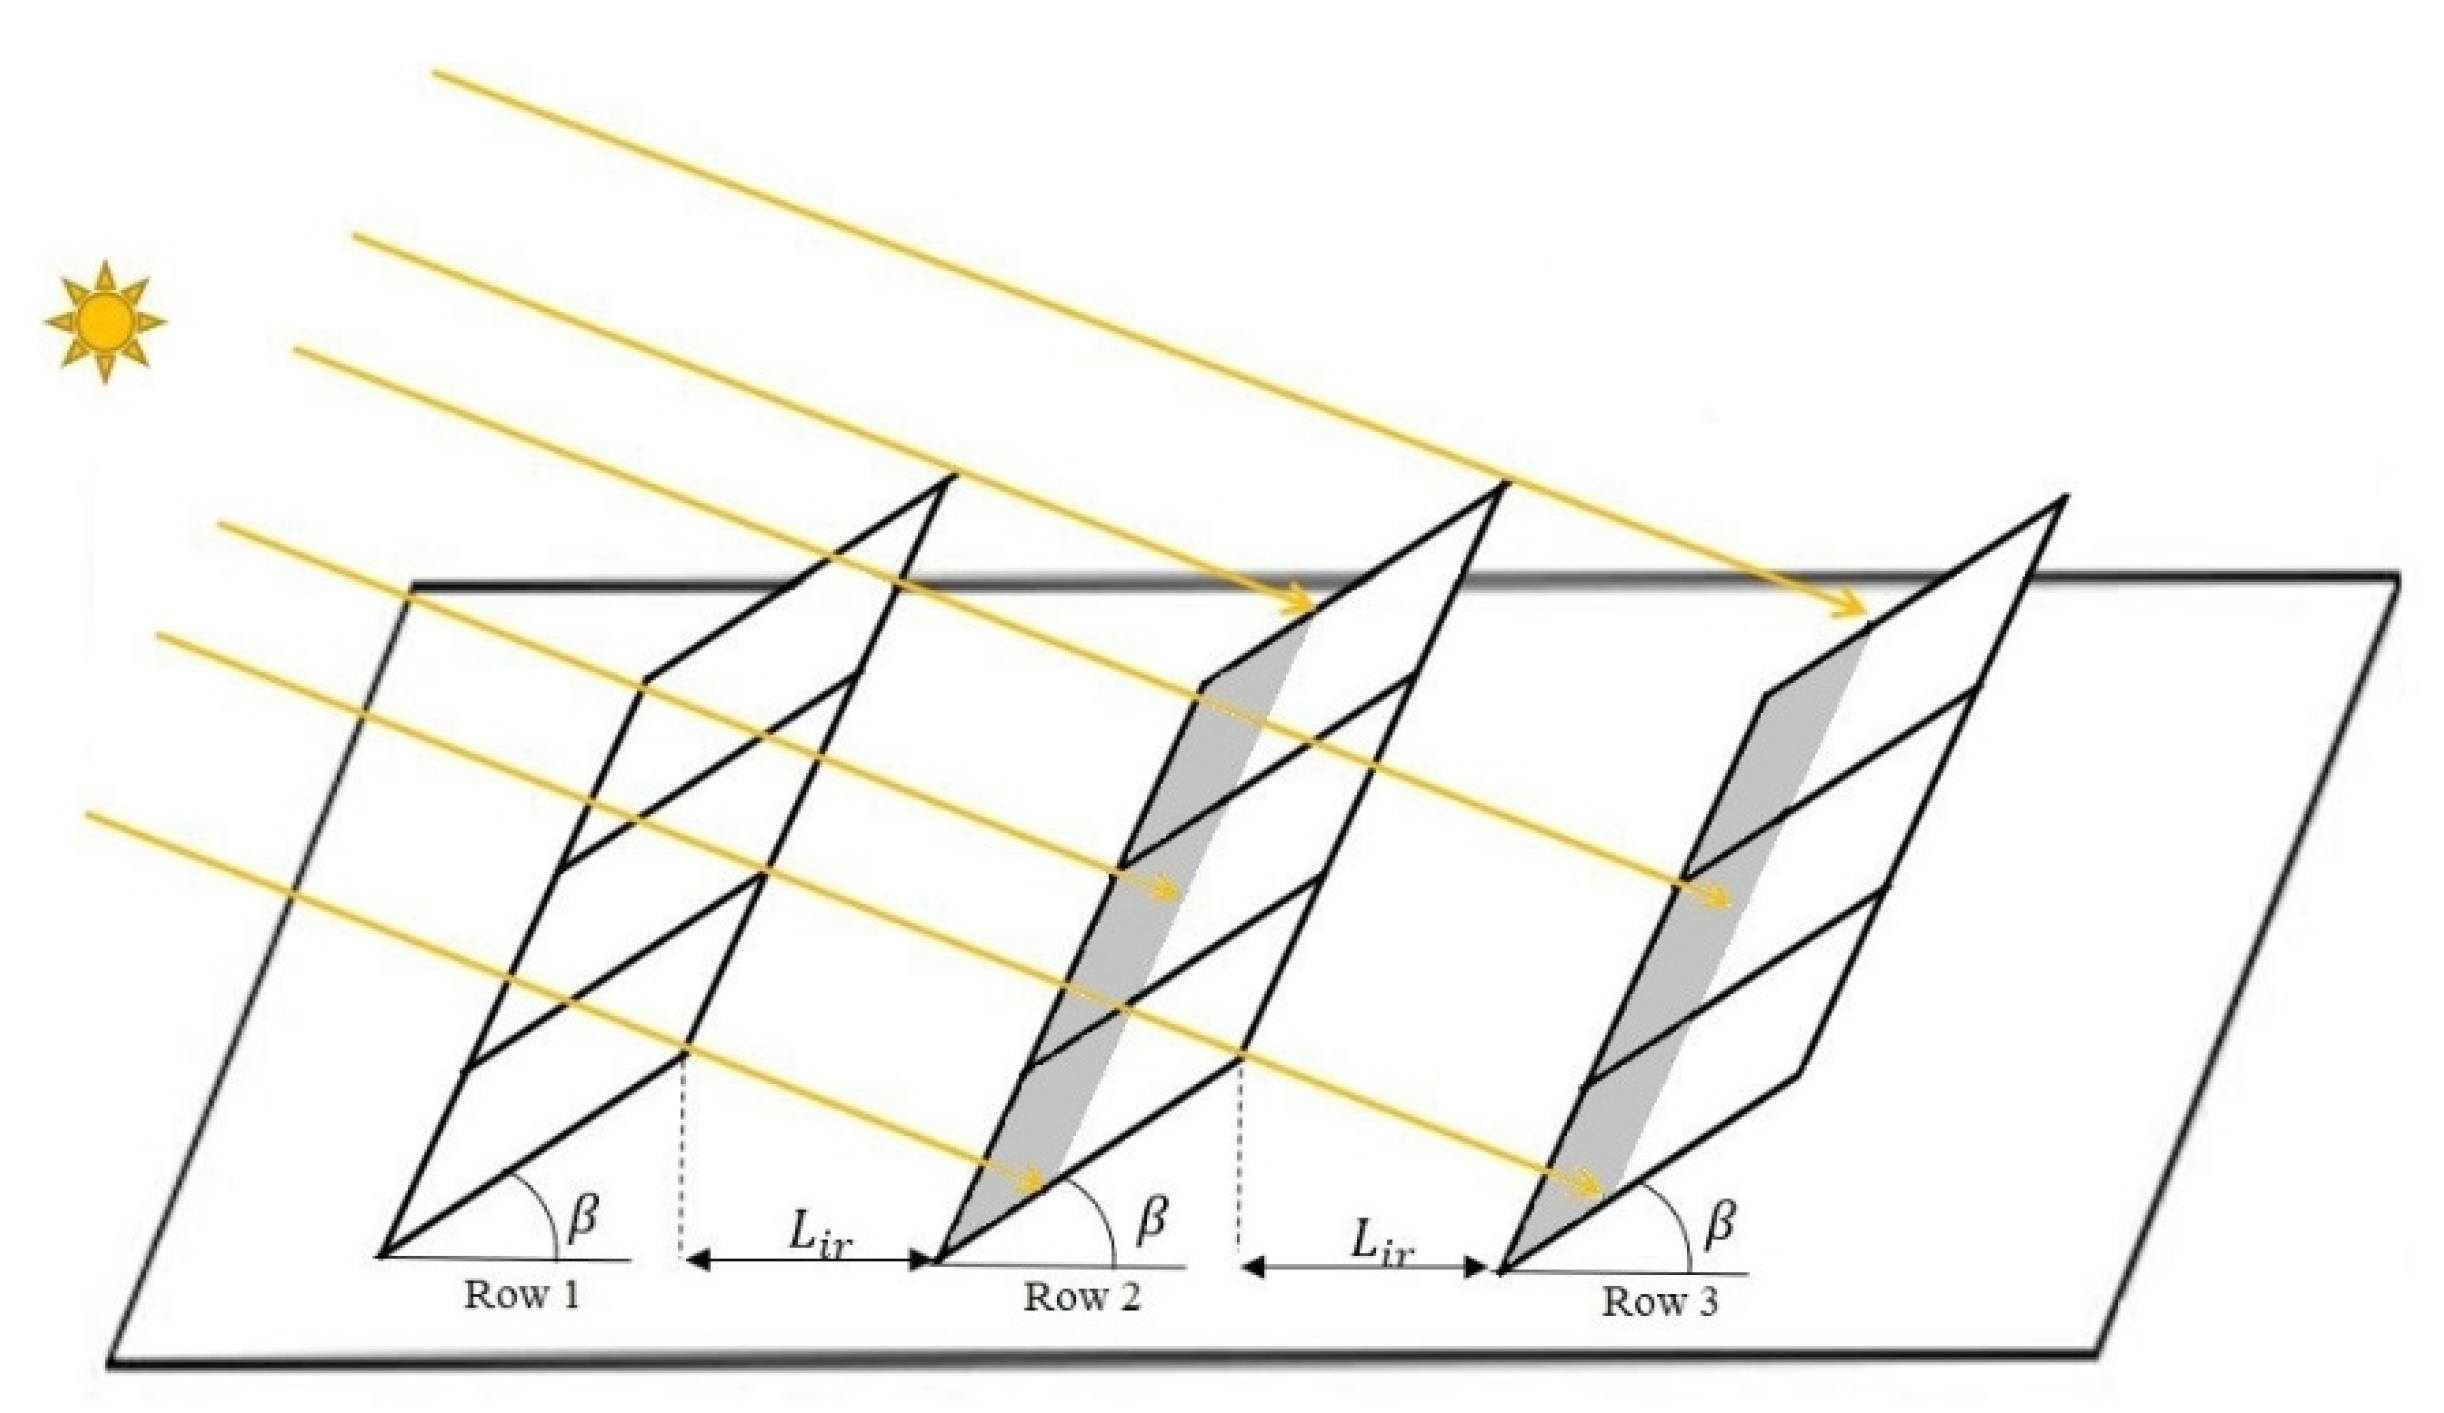
The next crucial factor is the shading effect, which directly impacts the generated power of the PV system. Two shading types can be conceivable on PV modules: (1) the mutual shading of adjacent modules (as shown in Figure 3) and (2) shading due to surrounding obstacles such as buildings, roofs, trees, and chimneys. More details about the general computation of the shading are presented in Appendix A.
To consider the effect of the first type of shading, it should be noted that the amount of shading on PV modules can be controlled by many variables such as the module inclination, the module orientation, and the distance between the rows of PV modules. Needless to say, the location of the sun in the sky also affects the shading on the PV module rows. In the present work, the shadow cast on the panels at the adjacent rows was calculated based on the Bany and Appelbaum analysis. The calculation of the shadow length on the next PV row was formulated using the sun’s azimuth and altitude angles, PV panels’ tilt and azimuth angles, and the inter-row spacing between PV arrays. Detailed information on this particular shadow calculation can be found in [36]. In the present study, PV modules were considered in the landscape orientation to diminish the shading effect.
To examine the second type of shading, the shading by surrounding obstacles, we had to determine how a roof area was shaded using a shading map. Shading induced by the same building was analyzed, e.g., the effect of the higher-level roofs on lower-level ones. In addition, with the assistance of the shading map, the shadow cast on the target building (ADMIN, CAM, or EAS) by surrounding buildings and trees was also considered. Based on the sun’s location in the sky and the heights of all objects, a brightness score (br) is determined for each pixel in the heightmap in our model. The value of each pixel can vary between zero and one, zero indicating a fully shaded pixel and one indicating a fully bright pixel. The br values are calculated on a specific day of the month as a representative of that month during the panels’ operating hours. In br calculations, PV operating hours are considered for the shading impact duration. Moreover, from one to two hours after sunrise and before sunset are also considered as a tolerance.
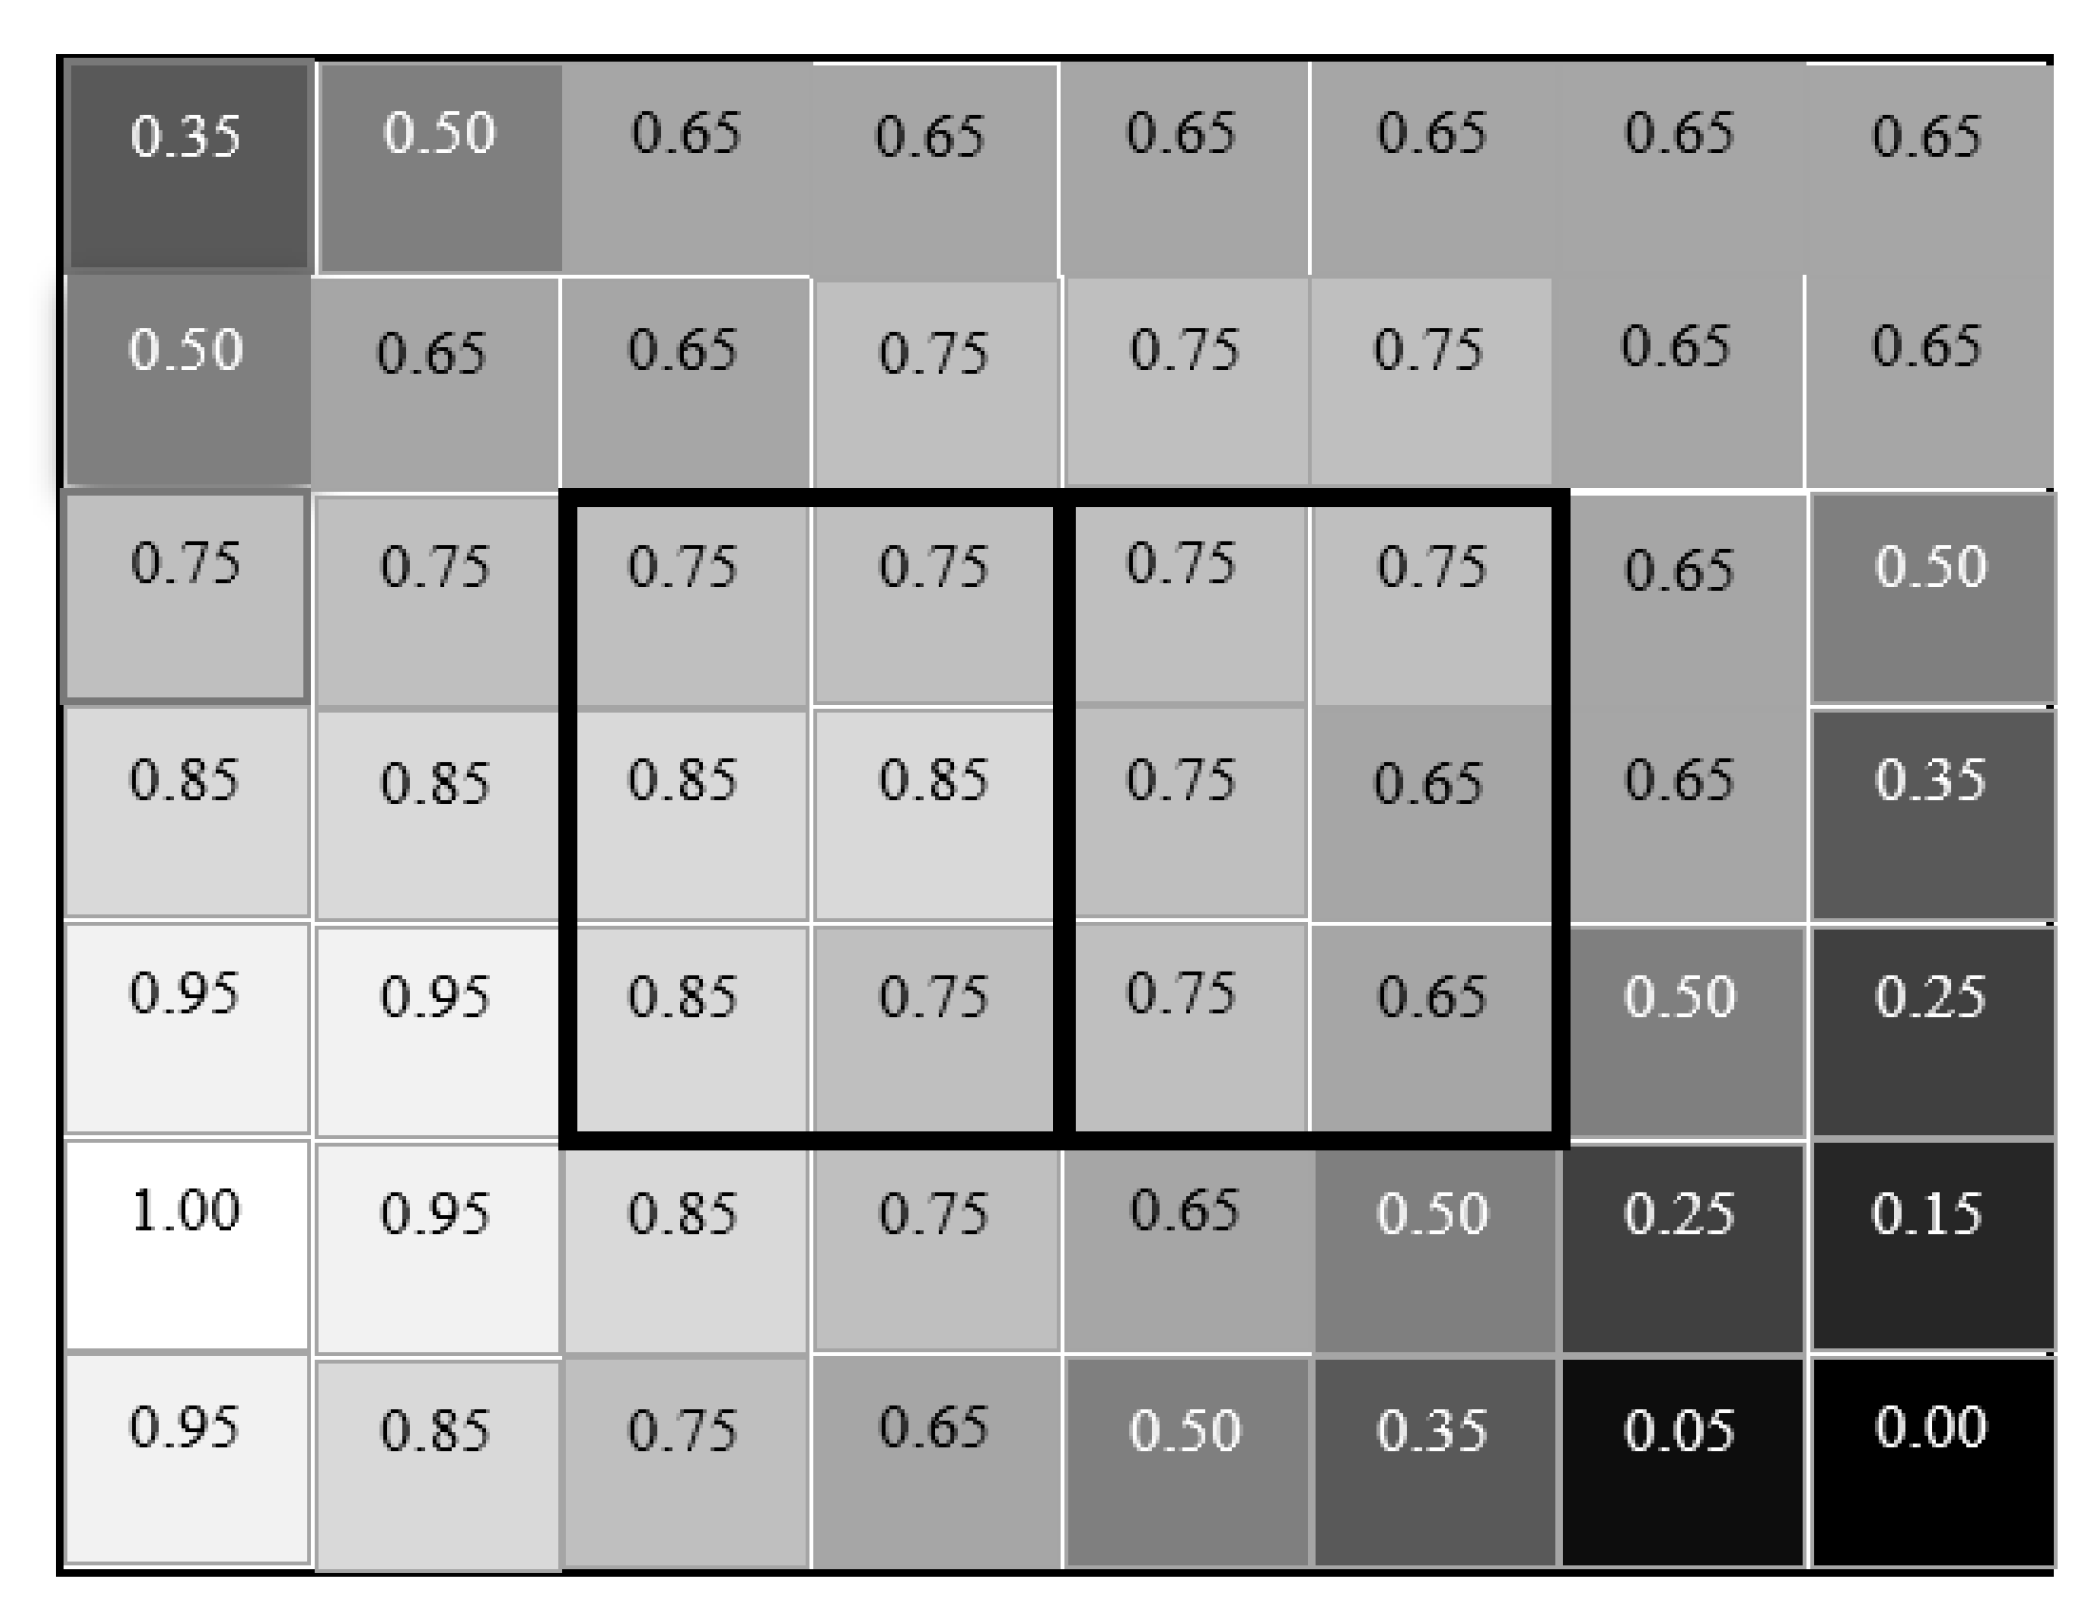
The annual average of br is determined and used for the panels’ generation calculations when considering the shading impact of surrounding objects. For example, Figure 4 shows the schematic of two panels in a shading map that uses the br approach. The average values of the br pixels ( b r s c o r e , a v g ) of the left and right panels are 0.80 and 0.72, respectively. Hence, the b r s c o r e , a v g values of these panels depict the maximum amount of PV output generation as 80% and 72% of their annual output, respectively.
The b r s c o r e , a v g can be considered a scaling factor used in Equation (11) to extract the panels’ effective output generation when considering the surrounding obstacles’ shading effect. In the proposed method, it is assumed that if the b r s c o r e , a v g for a PV module is below 0.6, that panel is removed from the system due to energy generation deficiency over the year.
Considering both shading effects mentioned above, the final formulation of the PV energy generation G P V   s y s t e m (kWh) can be obtained as:
G P V   s y s t e m = b r s c o r e , a v g × h = 1 o p e r a t i n g   h o u r s ( G ( h ) × t × L m × w m × n u m u n s h a d e d × η / 1000 + G ( h ) × t × L m × w m × n u m s h a d e d × L m L s L m × η / 1000 )  
where η is the efficiency of the PV module. Additionally, n u m u n s h a d e d and n u m s h a d e d represent the number of PV panels that are unshaded and partially shaded due to the PV panel mutual shading, respectively; L m and w m are the length and width of the modules, respectively; and L s is the length of the shadow on the adjacent row.

2.4. Multi-Objective Optimization of PV System

A multi-objective optimization model was developed in this paper to maximize the energy production through the optimal PV system arrangement on an identified rooftop and to minimize the PV system’s payback period. A payback period is the required time that the future revenue inflow meets the project’s initial cost. As a result, the smaller the payback period, the more economically viable a project will be. Various studies have used the payback method to evaluate the economic viability of photovoltaic projects [37,38,39].
In this optimization problem, many constraints need to be considered when determining the PV mounting space of a building rooftop. The roof size, roof shape, and distance between the PV arrays directly limit the PV mounting space, consequently limiting the generated output power. Moreover, the inter-row spacing is also essential to mitigate the shading effect to maintain the best energy productivity of the PV systems. Based on the mentioned constraints, it can be concluded that increasing the number of installed PV panels may not necessarily mean more power generation due to dimensional limitations.
In addition, the energy balance constraint within a system is necessary to maintain a minimum difference between the load demand and PV-generated power. If the PV-generated power is excessively less than the demand, more electric energy has to be purchased from the grid, which substantially decreases the associated benefits. In contrast, the significant surplus power of PV systems may lead to grid security limit violations such as the overvoltage problem. However, in our study, the PV-generated power was always equal to or less than the specified hourly load demand.
The proposed multi-objective optimization equation with enveloped min–max optimization operators maximizing the solar energy generation and minimizing cost in terms of the payback period can be formulated as follows:
M i n g p a y b a c k [ M a x   G P V   s y s t e m ( β , γ , L i r ) ] n u m ,     G i m p ,
subject to
0 ° β 85 ° , 90 ° γ 90 ° ,   1   m L i r 4.5   m   ;   if   a   roof   is   flat L i r = 0   ; if   a   roof   is   slanted
The optimization equation is based on multiple control variables, including the tilt angle ( β ) and azimuth angle ( γ ) of panels and the distance between the arrays ( L i r ). We assumed that the panels’ tilt angle could be vertically adjusted from parallel to the roofs ( 0 ° ) to nearly perpendicular to roofs ( 85 ° ) and the azimuth angle could be horizontally adjusted from ( 90 ° ) east to ( 90 ° ) west. A two-year tolerance was considered an acceptable return on investment to keep the system’s solar electricity generation at a nearly maximum level.
In order to find the payback period, we needed to specify the initial investment, annual benefit, and annual cost. The initial cost of the photovoltaic system (IC), which depends on the amount of the installed power, could be determined as:
I C = C w × n u m × P
where C w is the installation cost per watt ( $ / W ), num is the number of installed panels, and P is the nominal power of each panel. The installation cost was considered to be $2.80 per watt based on the information provided by the Energy Management and Sustainable Operations (EMSO) at the University of Alberta. The hourly benefit ( B h ) was formulated as follows:
B h = { ( G h D h ) × E s e l l , h + D h × E p u r c h a s e , h ,     G h > D h               G h × E p u r c h a s e , h               ,     G h D h
subject to
V P C C < V m a x
where G h and D h are the hourly energy generation and demand of the building, respectively, and E s e l l , h and E p u r c h a s e , h are the hourly selling price of PV surplus energy and energy purchase price from the grid, respectively. To ensure no overvoltage issue occurs during the energy selling period, voltage constrained is added to the equation. V P C C is the voltage at the point of common coupling (PCC) or where the electric terminals of the PV panels are connected to the grid. V m a x is the maximum overvoltage threshold, which is 1.05 times the nominal voltage [40]. Equation (15) is decomposed into two components based on the amount of solar energy generation. In a particular hour, when the PV power generation is greater than the building demand, the hourly benefit integrates two terms: first, zero net billing (ZNB), when the power generation fully covers the demand; and second, surplus power that can be sold to the grid if it is attainable and an additional benefit is added to the equation. On the other hand, if the power generation is less than the demand, only the possible generated power can be utilized in the hourly benefit from the PV system that participates in energy-purchase saving. Summing up all the hourly benefits results in the total annual benefit ( B a n n u a l ) of the proposed optimization method. Thebault et al. [41] used a similar way to calculate the benefit. It should be noted that the operational and maintenance costs were not considered in this study.
The equivalent present value (EPV) of uniform series of yearly benefits is represented as follows [42]:
E P V = B a n n u a l [ ( 1 + i ) n 1 i ( 1 + i ) n ]
where i is the discount or interest rate that justifies the time value of the revenue and n is the number of years. The authors of this study obtained the discount rate based on the Government of Alberta interest rate benchmark [43], which was 2.2% in the year 2020. The payback period could be determined using the following final representation:
I C E P V = I C B a n n u a l [ ( 1 + i ) n 1 i ( 1 + i ) n ] = 0
Due to the nonlinear nature of the objective function, the search space method is used to find the optimum solution. The optimal answer is obtained from the discrete domain in such a way that β and γ are discretized by 5 degrees and L i r is discretized by 0.5 m. The discretization method has also been used by other researchers such as Litjens et al. [16].
The panels are installed on flat roofs and sloped roofs oriented between the EAST, SOUTH, AND WEST. Additionally, on slanted roofs, panels are installed parallel to the roofs. Thus, the slope of PV modules is equal to the roof’s pitch and their azimuth angle is similar to the orientation of the building.

2.5. Data Collection

To accurately calculate the radiation intensity at the PV module level, it is necessary to consider environmental parameters such as ambient temperature and the cloudiness of the sky. In the present study, minutely values of k t for the year 2016 were obtained from the work of Awad and Gül [11]. Since the solar radiation model in the current study was considered hourly, the hourly average of minute data was used.
In the present work, a poly-crystalline module datasheet of a commercially available module was used to calculate the photovoltaic system’s output energy. The module’s nominal maximum power and efficiency were 400 W and 18.1%, respectively, and the size of the panels was 2108 × 1048 mm [44].
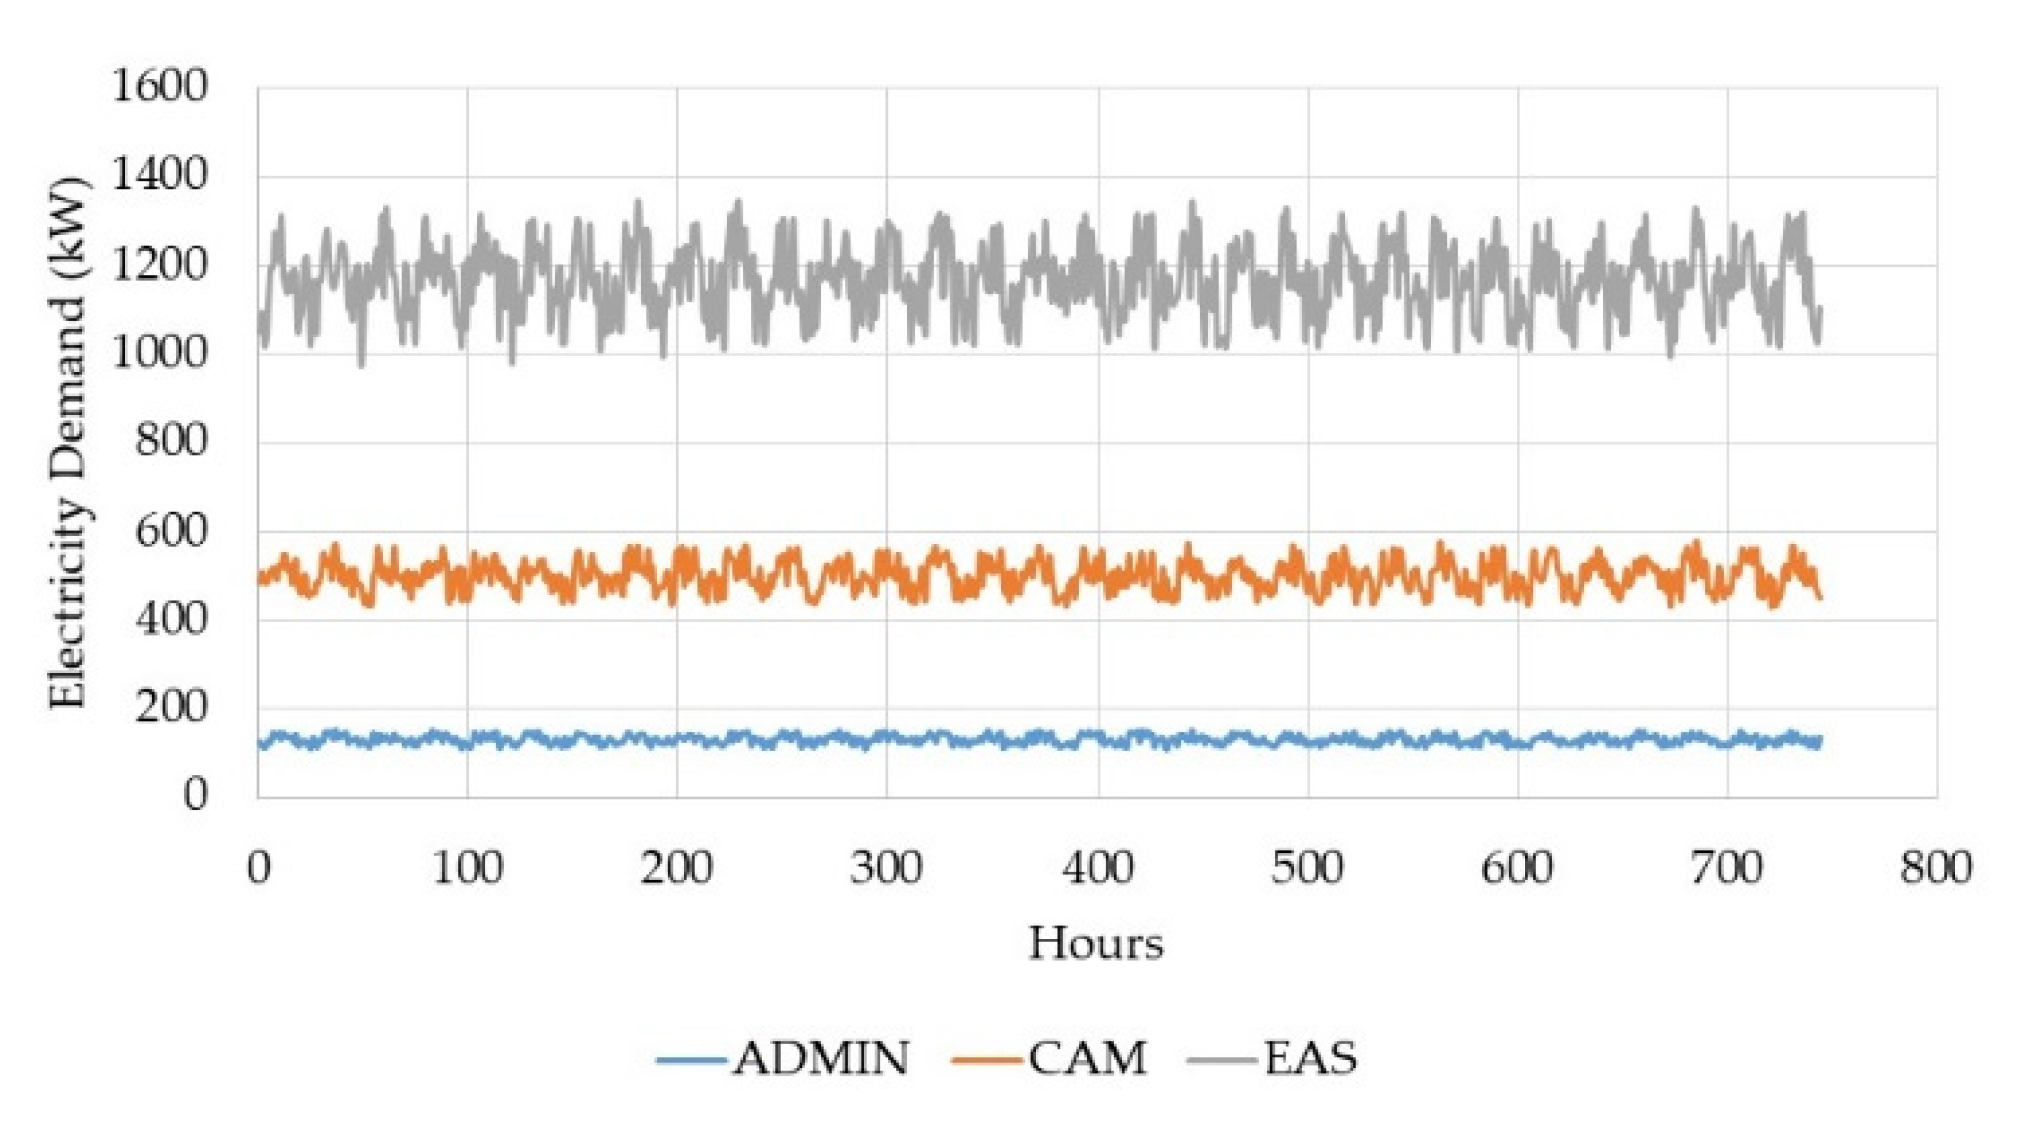
A general profile of hourly and monthly consumption was obtained from the EMSO at the University of Alberta. The monthly consumption of each building was prepared as input data for the Monte Carlo simulation (MCS) method. MCS has outstanding advantages in evaluating the probability distributions of renewable energy resources incorporated into the grid system, uncertainty in solar irradiance, and load evaluations. This has made it even easier for system operators to make decisions regarding generation dispatch and demand forecasting and management since MCS can accommodate various complex operational conditions and realize the random parameters to obtain expected probability distributions of variables of interest. However, this method is ineffective for bulk power system evaluation due to memory size limitations [45]. Example load profiles for the three studied buildings during March 2019 are shown in Figure 5.
When dealing with building energy consumption data, we needed to consider the cost of purchasing electric energy to calculate the cost of supplying electric energy imported from the grid. Based on the information provided by the EMSO of the University of Alberta, the purchasing price of electricity was assumed to be equal for all hours of the year to the average one, which was $0.1015/kWh.

3. Results

As mentioned earlier, three buildings from the University of Alberta—the ADMIN, CAM, and EAS buildings—were used in this study to examine the multi-objective optimization leveraged by the pixel-based image processing method. Moreover, in this section, we present a set of optimal solutions based on the inter-row spacing of PV panels. The maximum PV generation and minimum overall payback period are also discussed.

3.1. Roof Recognition

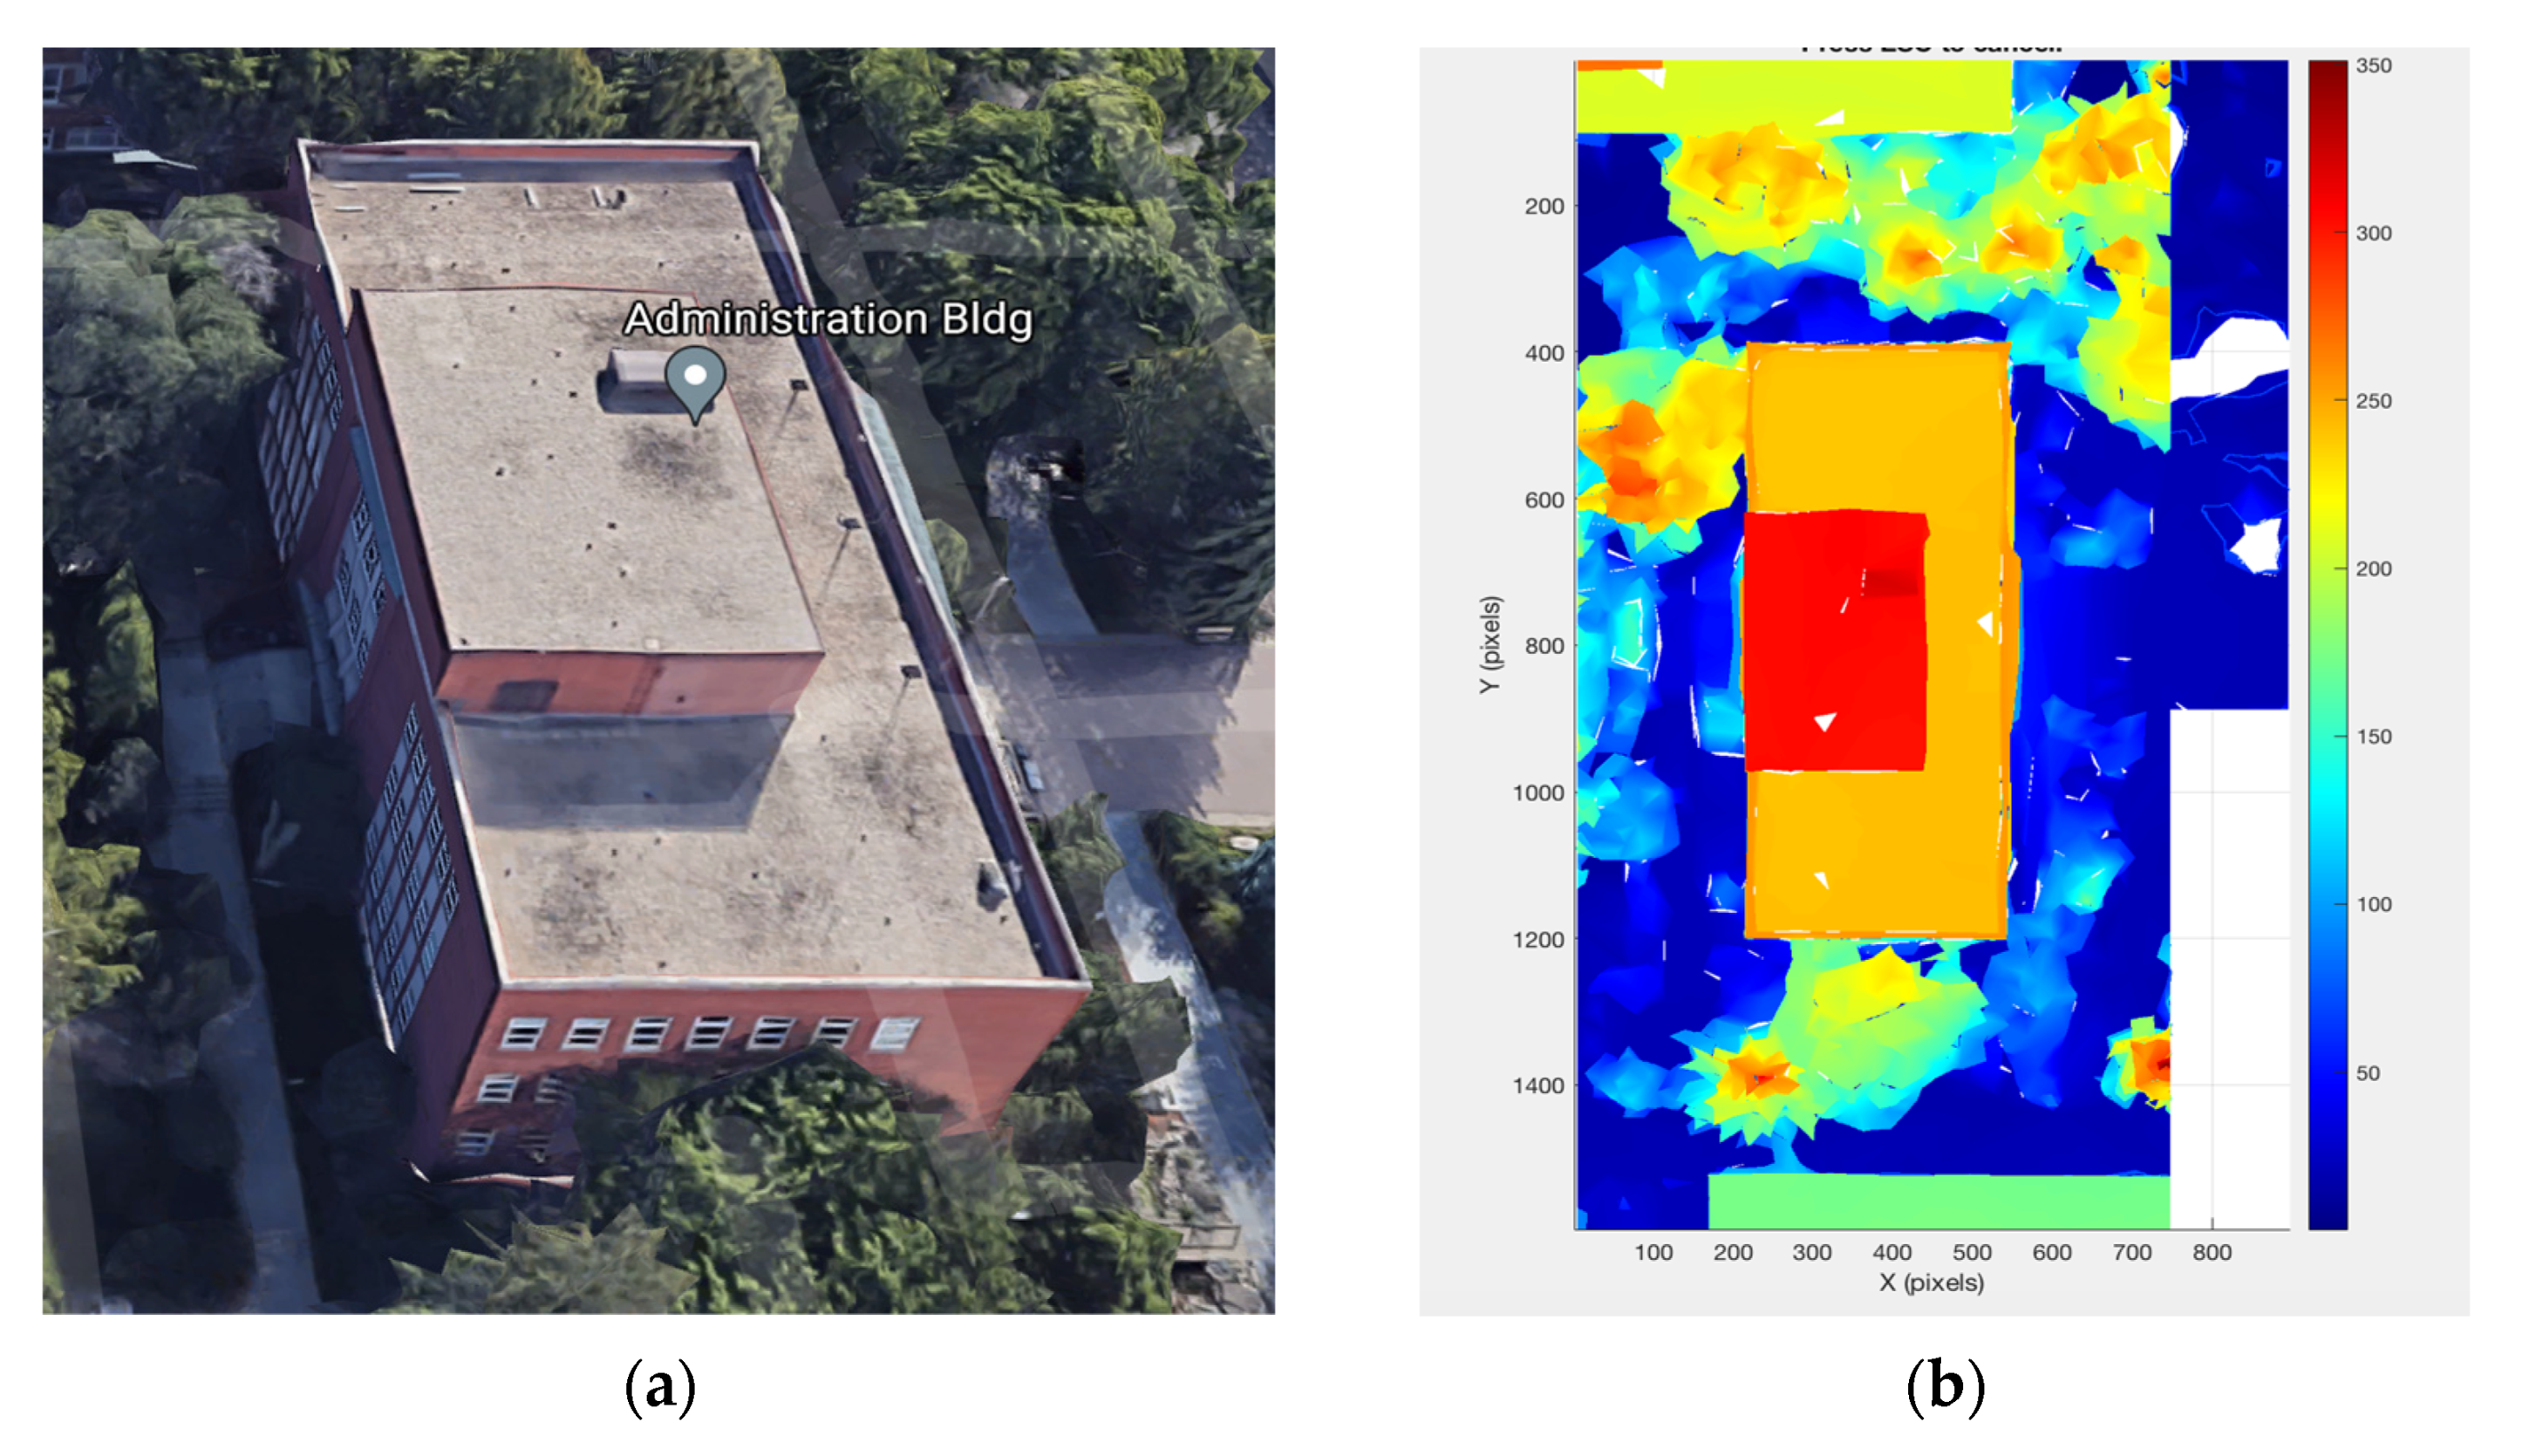
Figure 6a shows the texture information of the ADMIN building, and its corresponding heightmap is shown in Figure 6b.
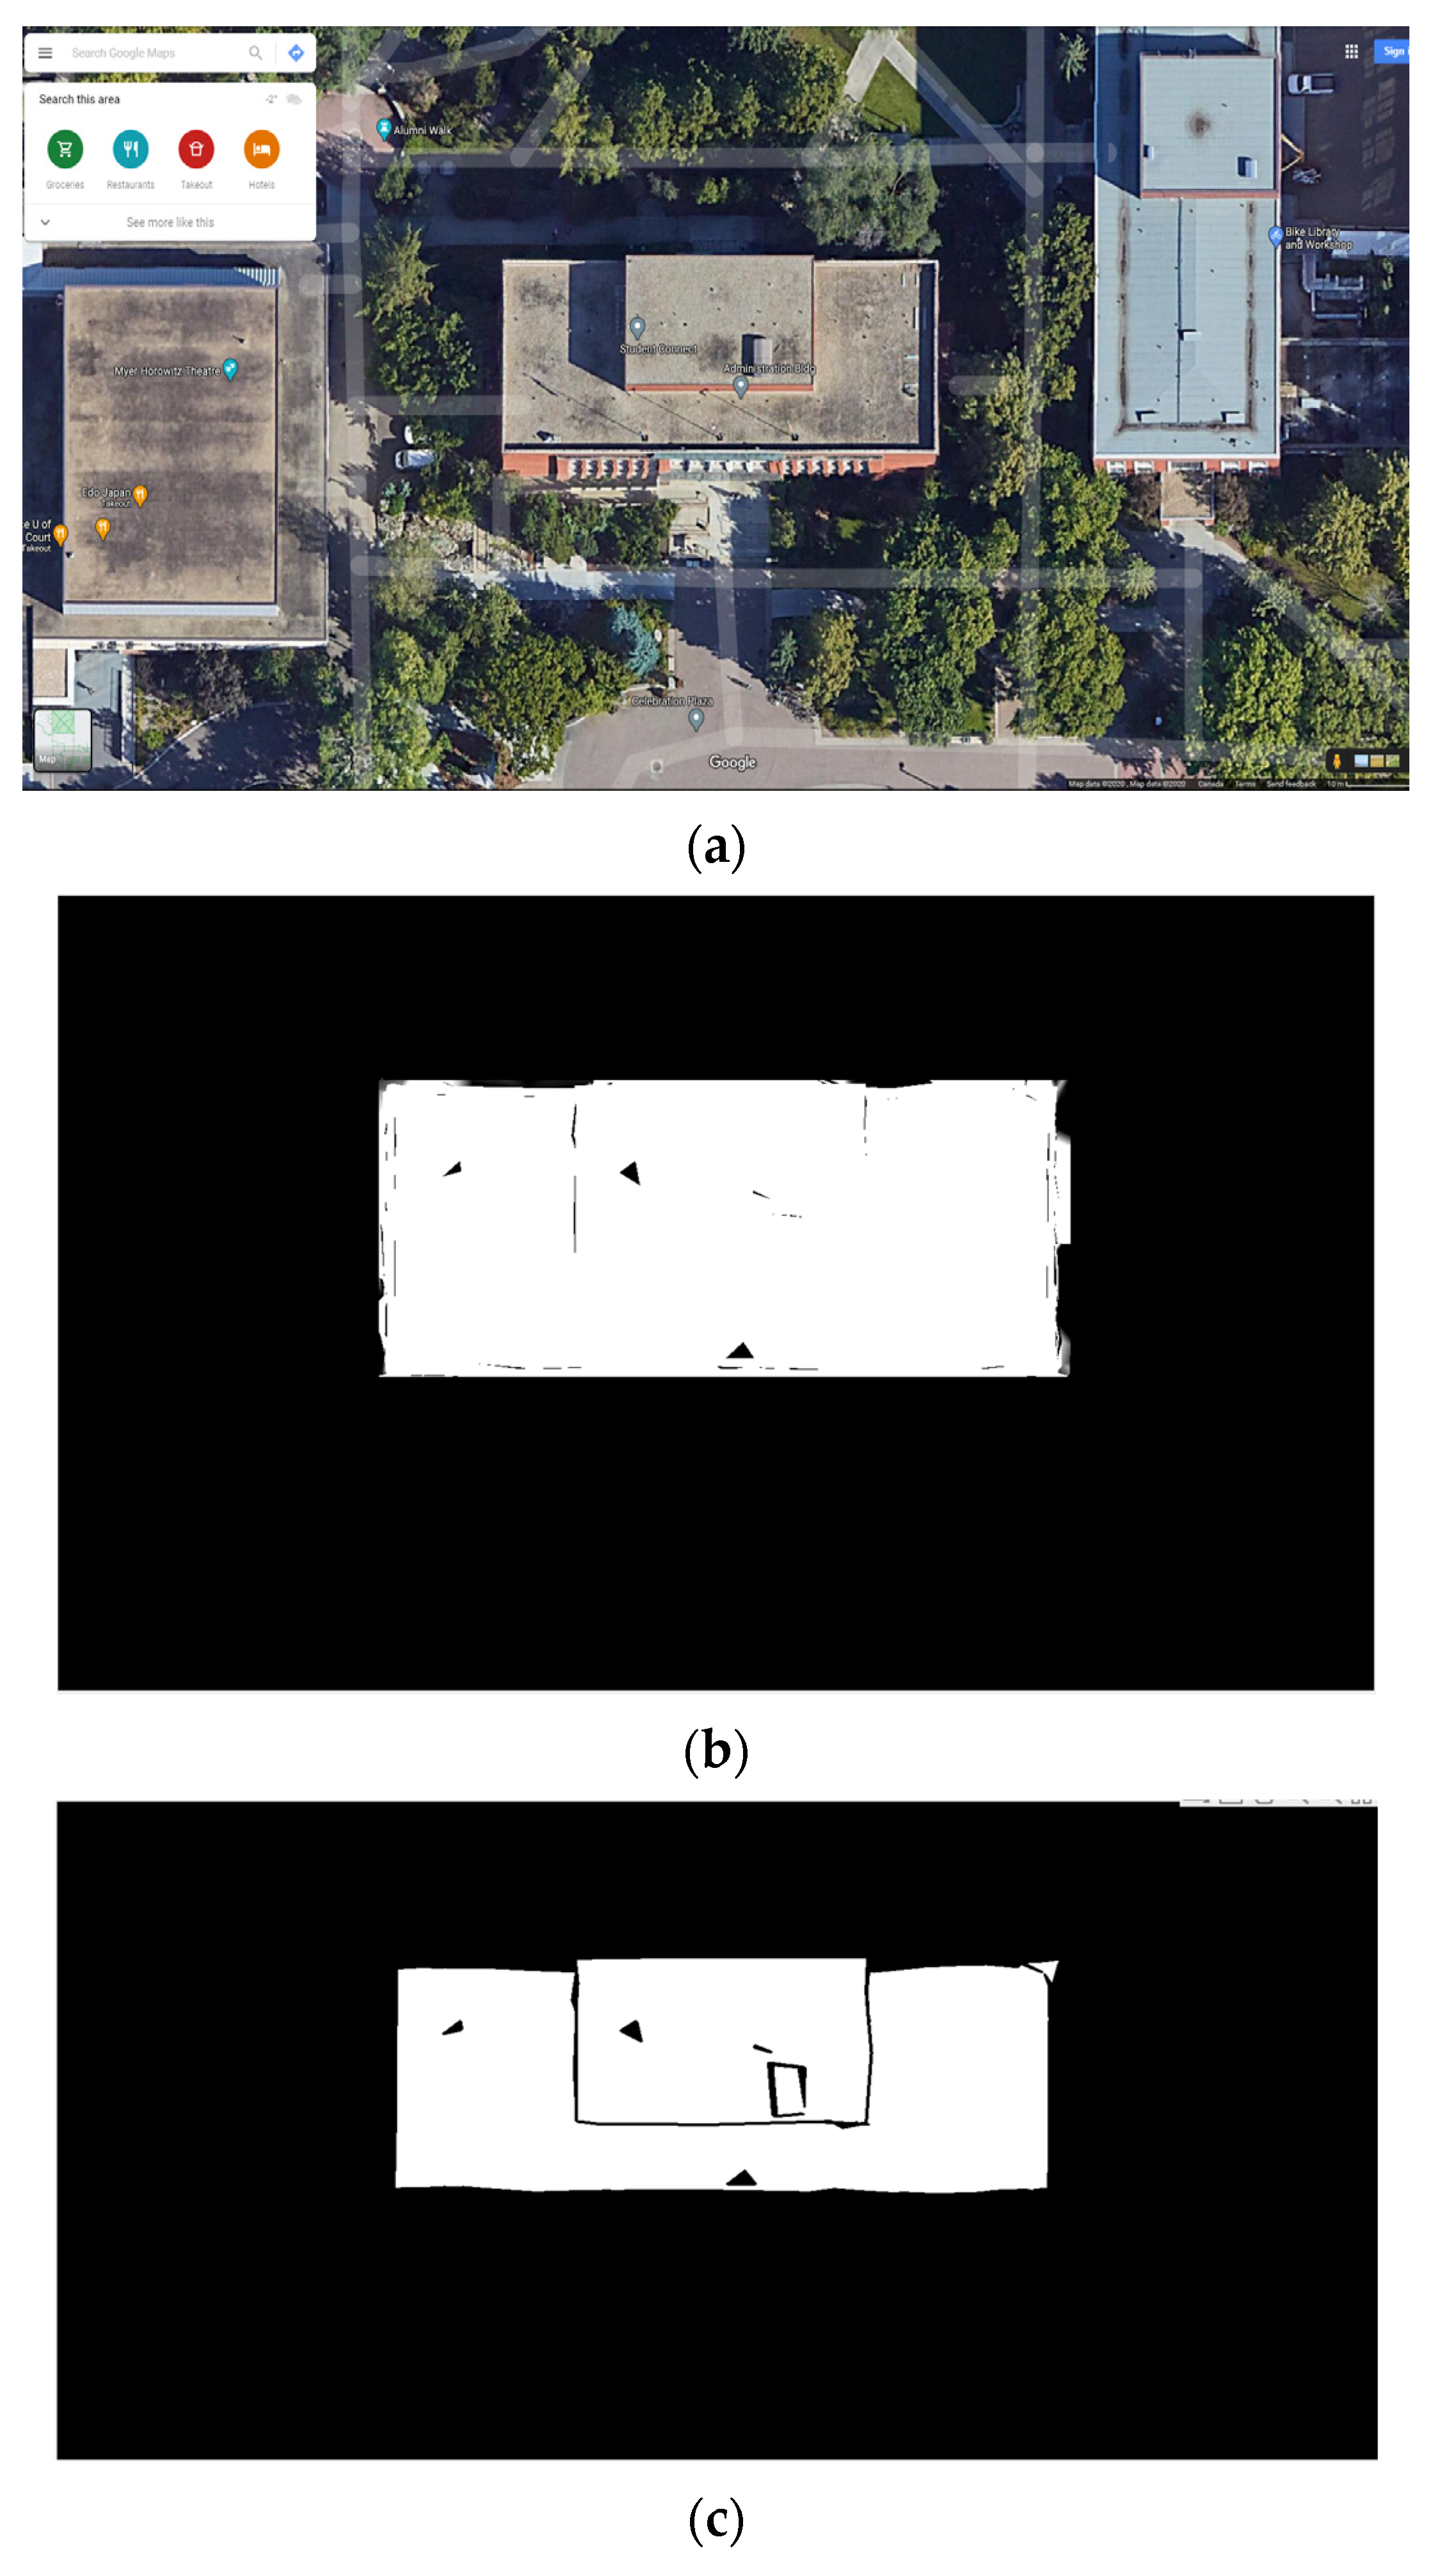
Based on the methods mentioned in Section 2.1, the authors of this work considered several building rooftop types: flat, slanted, and irregular. The roof recognition performance for the ADMIN and CAM buildings is evaluated in this sub-section as an example. A real-world satellite image of the ADMIN building is shown in Figure 7a. Figure 7b,c present the binary map of the ADMIN building before and after the identification step, respectively.
Figure 7b shows the original binary map of the ADMIN building where rooftops are connected together, which is very difficult to immediately use for further analysis. Figure 7c shows the result after the identification process. It can be seen that the outer rooftop was separated from the inner rooftop, which is consistent with the real-world satellite image shown in Figure 7a. In addition, it is clearly shown that most of the unwanted objects, including parapets and obstacles, were removed from binary maps. These objects were removed to avoid considering the area they occupy in the following calculations and to ensure a feasible and efficient PV installation.
Therefore, this algorithm was able to locate a small region in a rooftop that can fit at least one solar panel with the required walkways. Additionally, rooftops with significant height differences were separated to facilitate the analysis and independently optimize different rooftops.
The algorithm could also detect the difference between slopes to split challenging “joined” rooftops into their components, such as the wavy rooftops on the CAM building, as shown in the real-world satellite image of Figure 8a. Similar to the ADMIN building, Figure 8b,c show the binary maps of the CAM building before and after the identification step, respectively. By comparing Figure 8b,c, it can be clearly seen that the wavy rooftop was correctly separated into its rooftop segments. Additionally, the unwanted objects, such as the parapets and obstacles, were removed from the heightmaps.
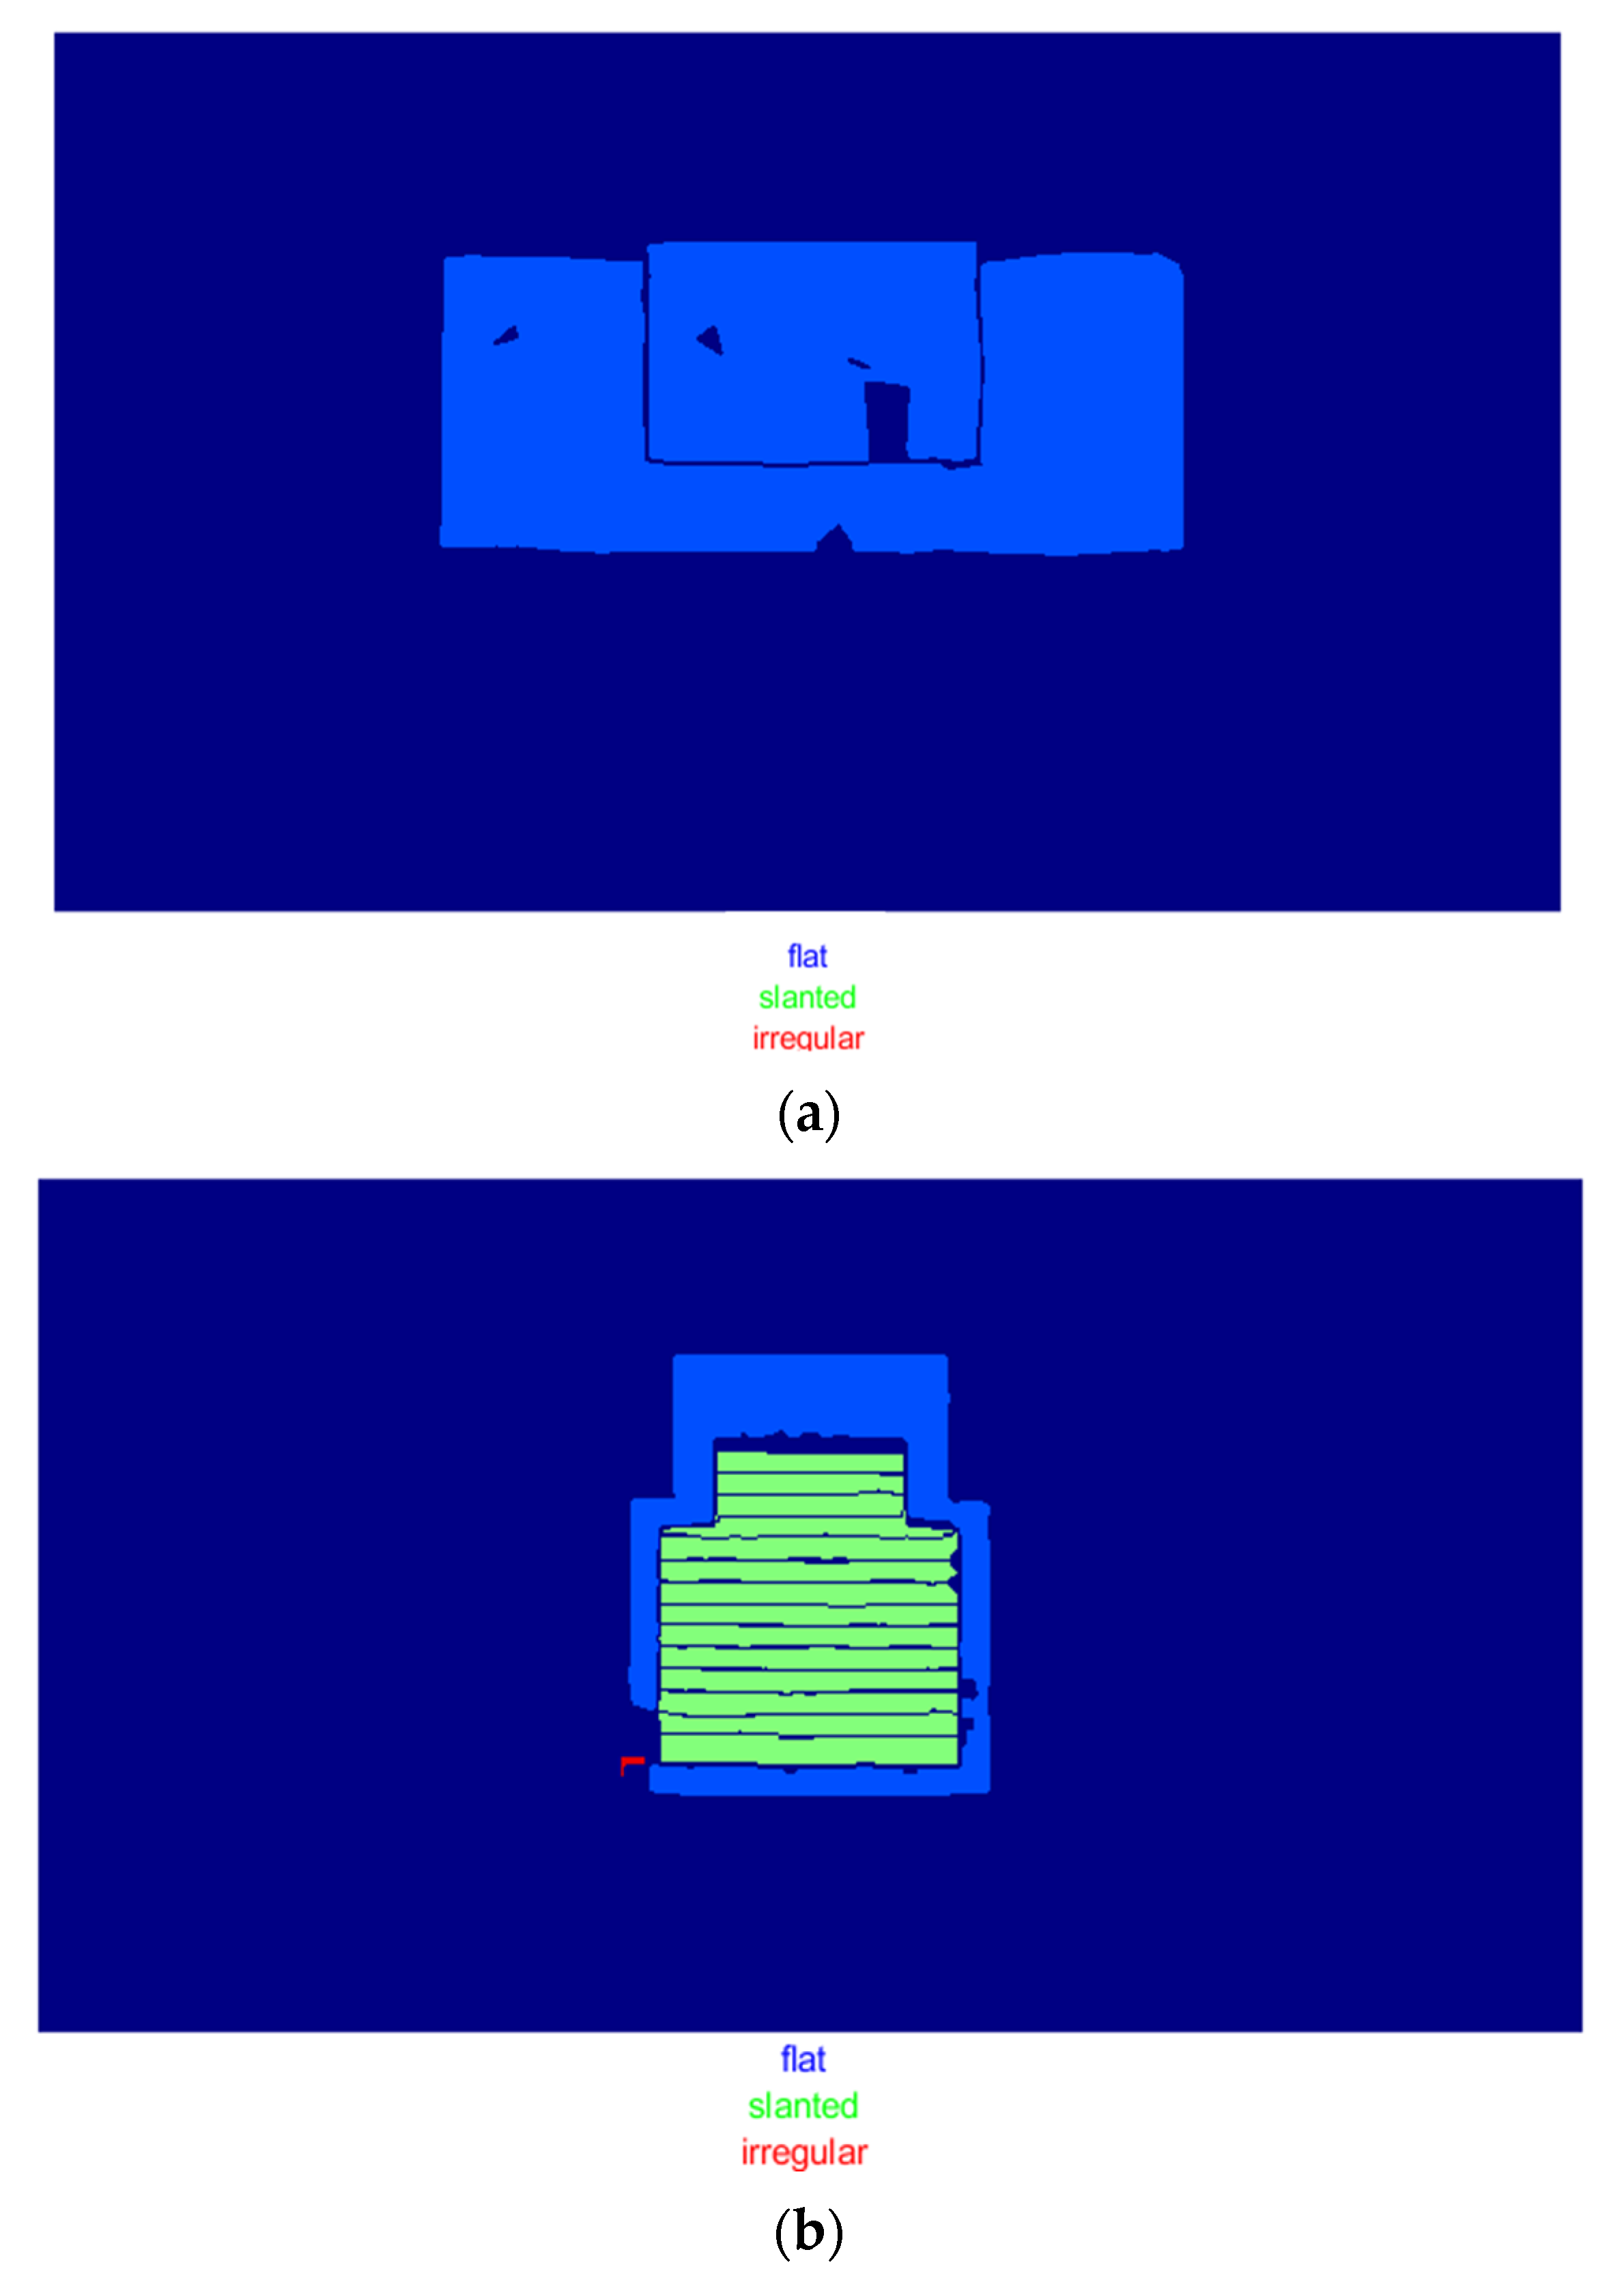
The classification results of the rooftop types; i.e., whether they were flat, slanted, or irregular; are depicted in Figure 9 for the ADMIN and CAM buildings. Figure 9a shows the rooftop of the ADMIN building, which only contains flat rooftops as shown in blue. However, the rooftop of the CAM building shown in Figure 9b includes all three types of rooftops (flat, slanted, and irregular). The outer rooftop in blue was classified as a flat rooftop; and the wavy section in green, which is located in the center of the building, consisted of 14 slanted rooftops. Additionally, a small irregular shape in red at the bottom-left corner of the heightmap was classified as an irregular object. It can be concluded that the algorithm worked well for the ADMIN and CAM buildings, and rooftops were assorted with an accuracy of more than 95%.
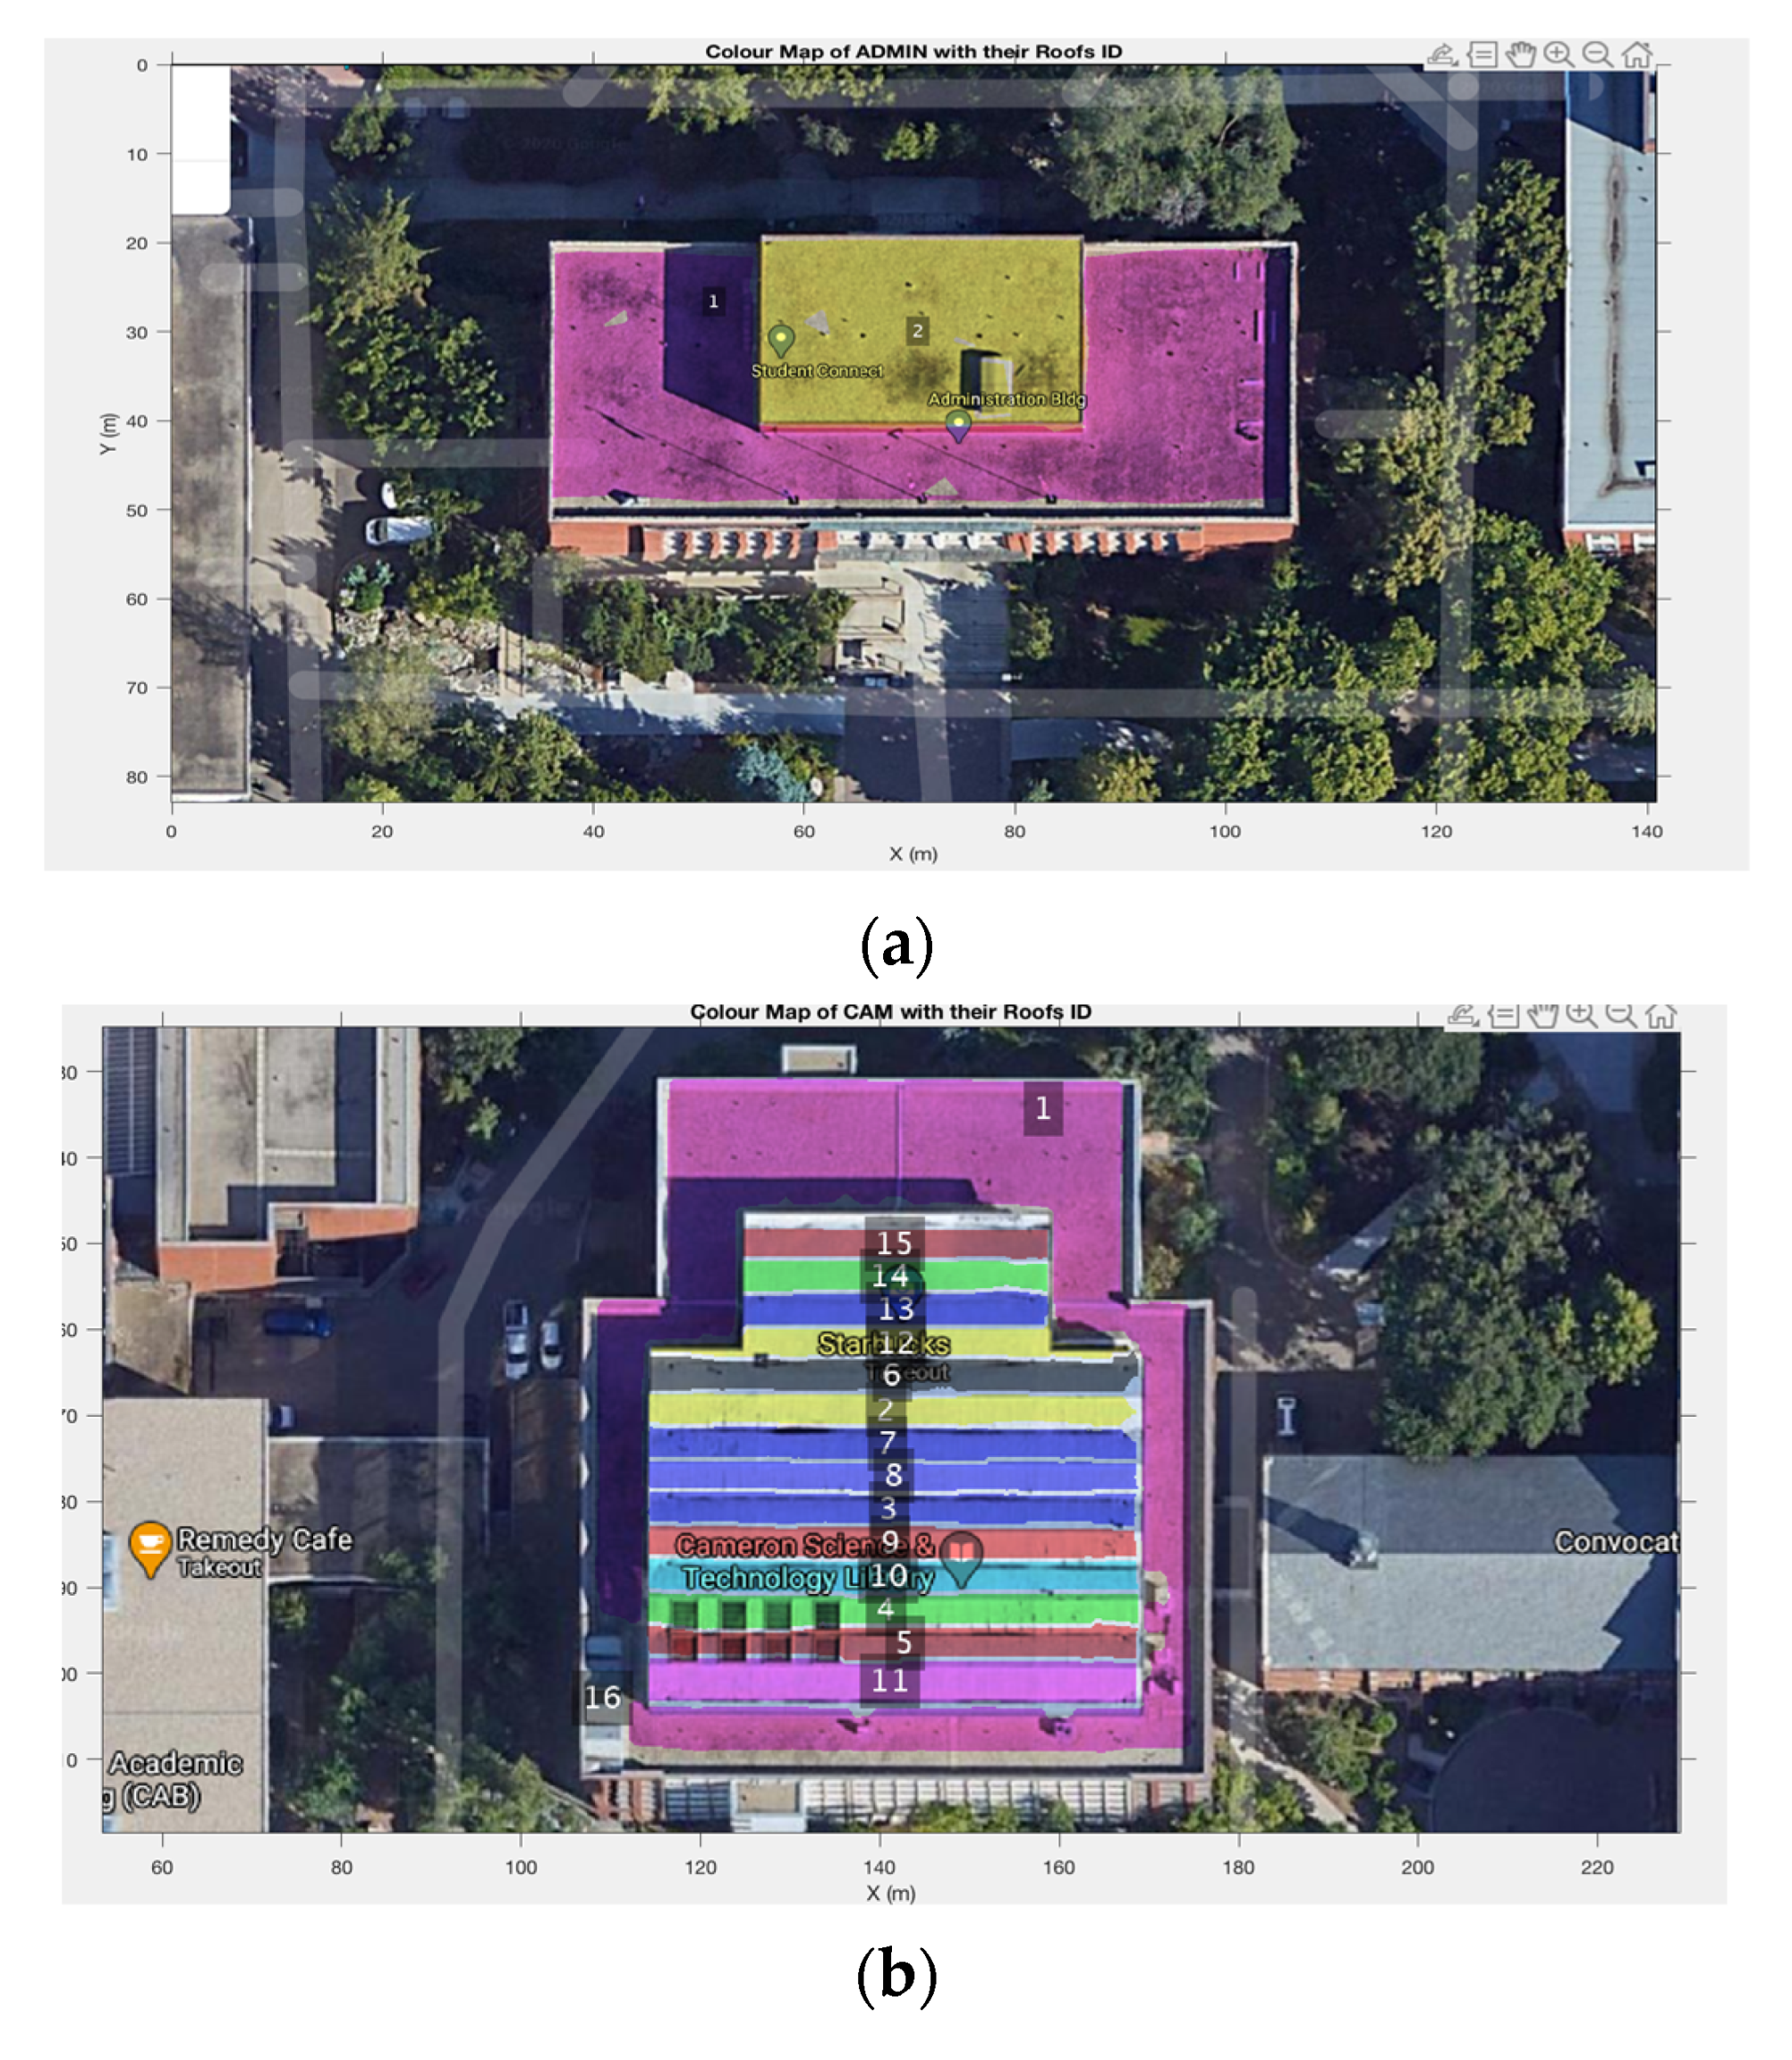
Next, we discuss the confidence scores of polygon approximation results and corresponding roof IDs of the ADMIN and CAM buildings. Roof IDs represent the order of an approximated rectangular shape under the polygon approximation algorithm. For the ADMIN building, the first roof and second roof had confidence scores of 0.735 and 0.799, respectively. Table 1 also presents the CAM building’s roofs IDs and their corresponding confidence scores. Note that roof 16 of the CAM building had a confidence score of 0 because it was classified as an irregular rooftop.
The roof IDs and their corresponding rooftops are shown in Figure 10a,b for the ADMIN and CAM buildings, respectively. When comparing confidence scores with the labelled roof satellite images in Figure 10, it can be seen that the smaller rooftops (rooftops with fewer corners) tended to obtain higher scores for their polygon approximation. Additionally, rooftops with wide, regular, and straightforward shapes were more likely to have higher scores; e.g., roof 15 was close to a perfect rectangle and had the highest accuracy score of almost 95% among all rooftops of the CAM building.

3.2. Shading Analysis Results

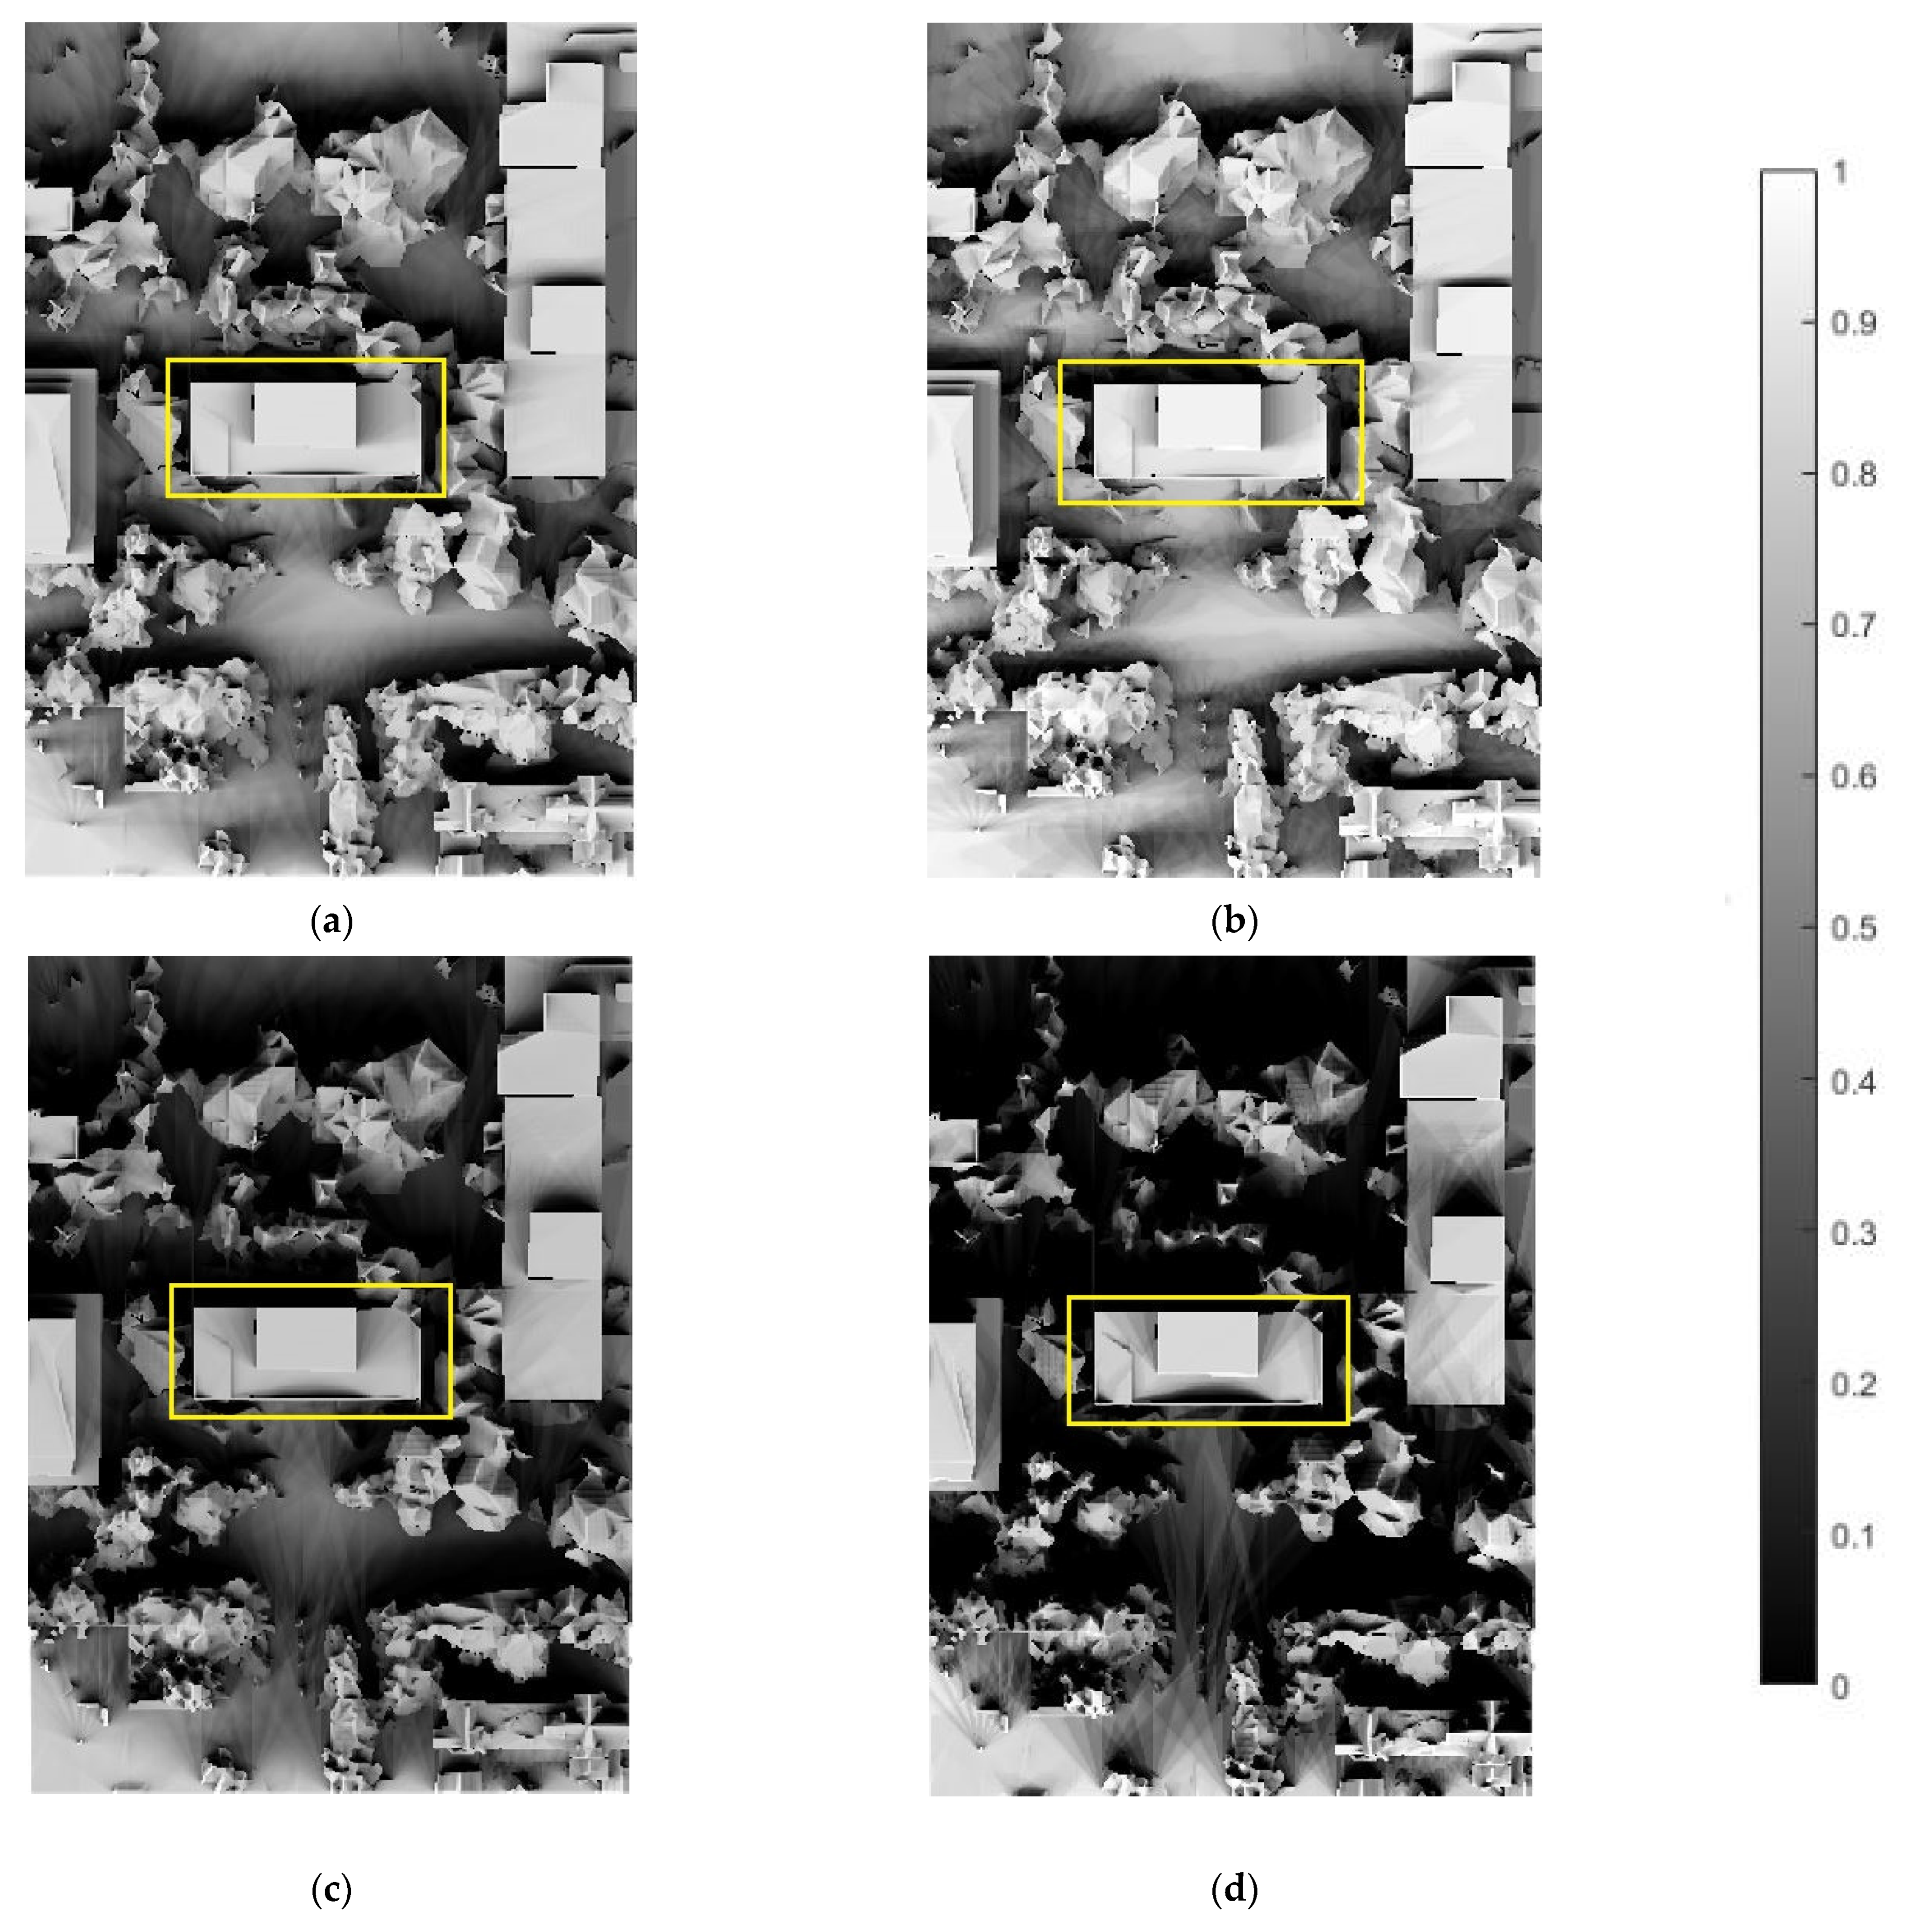
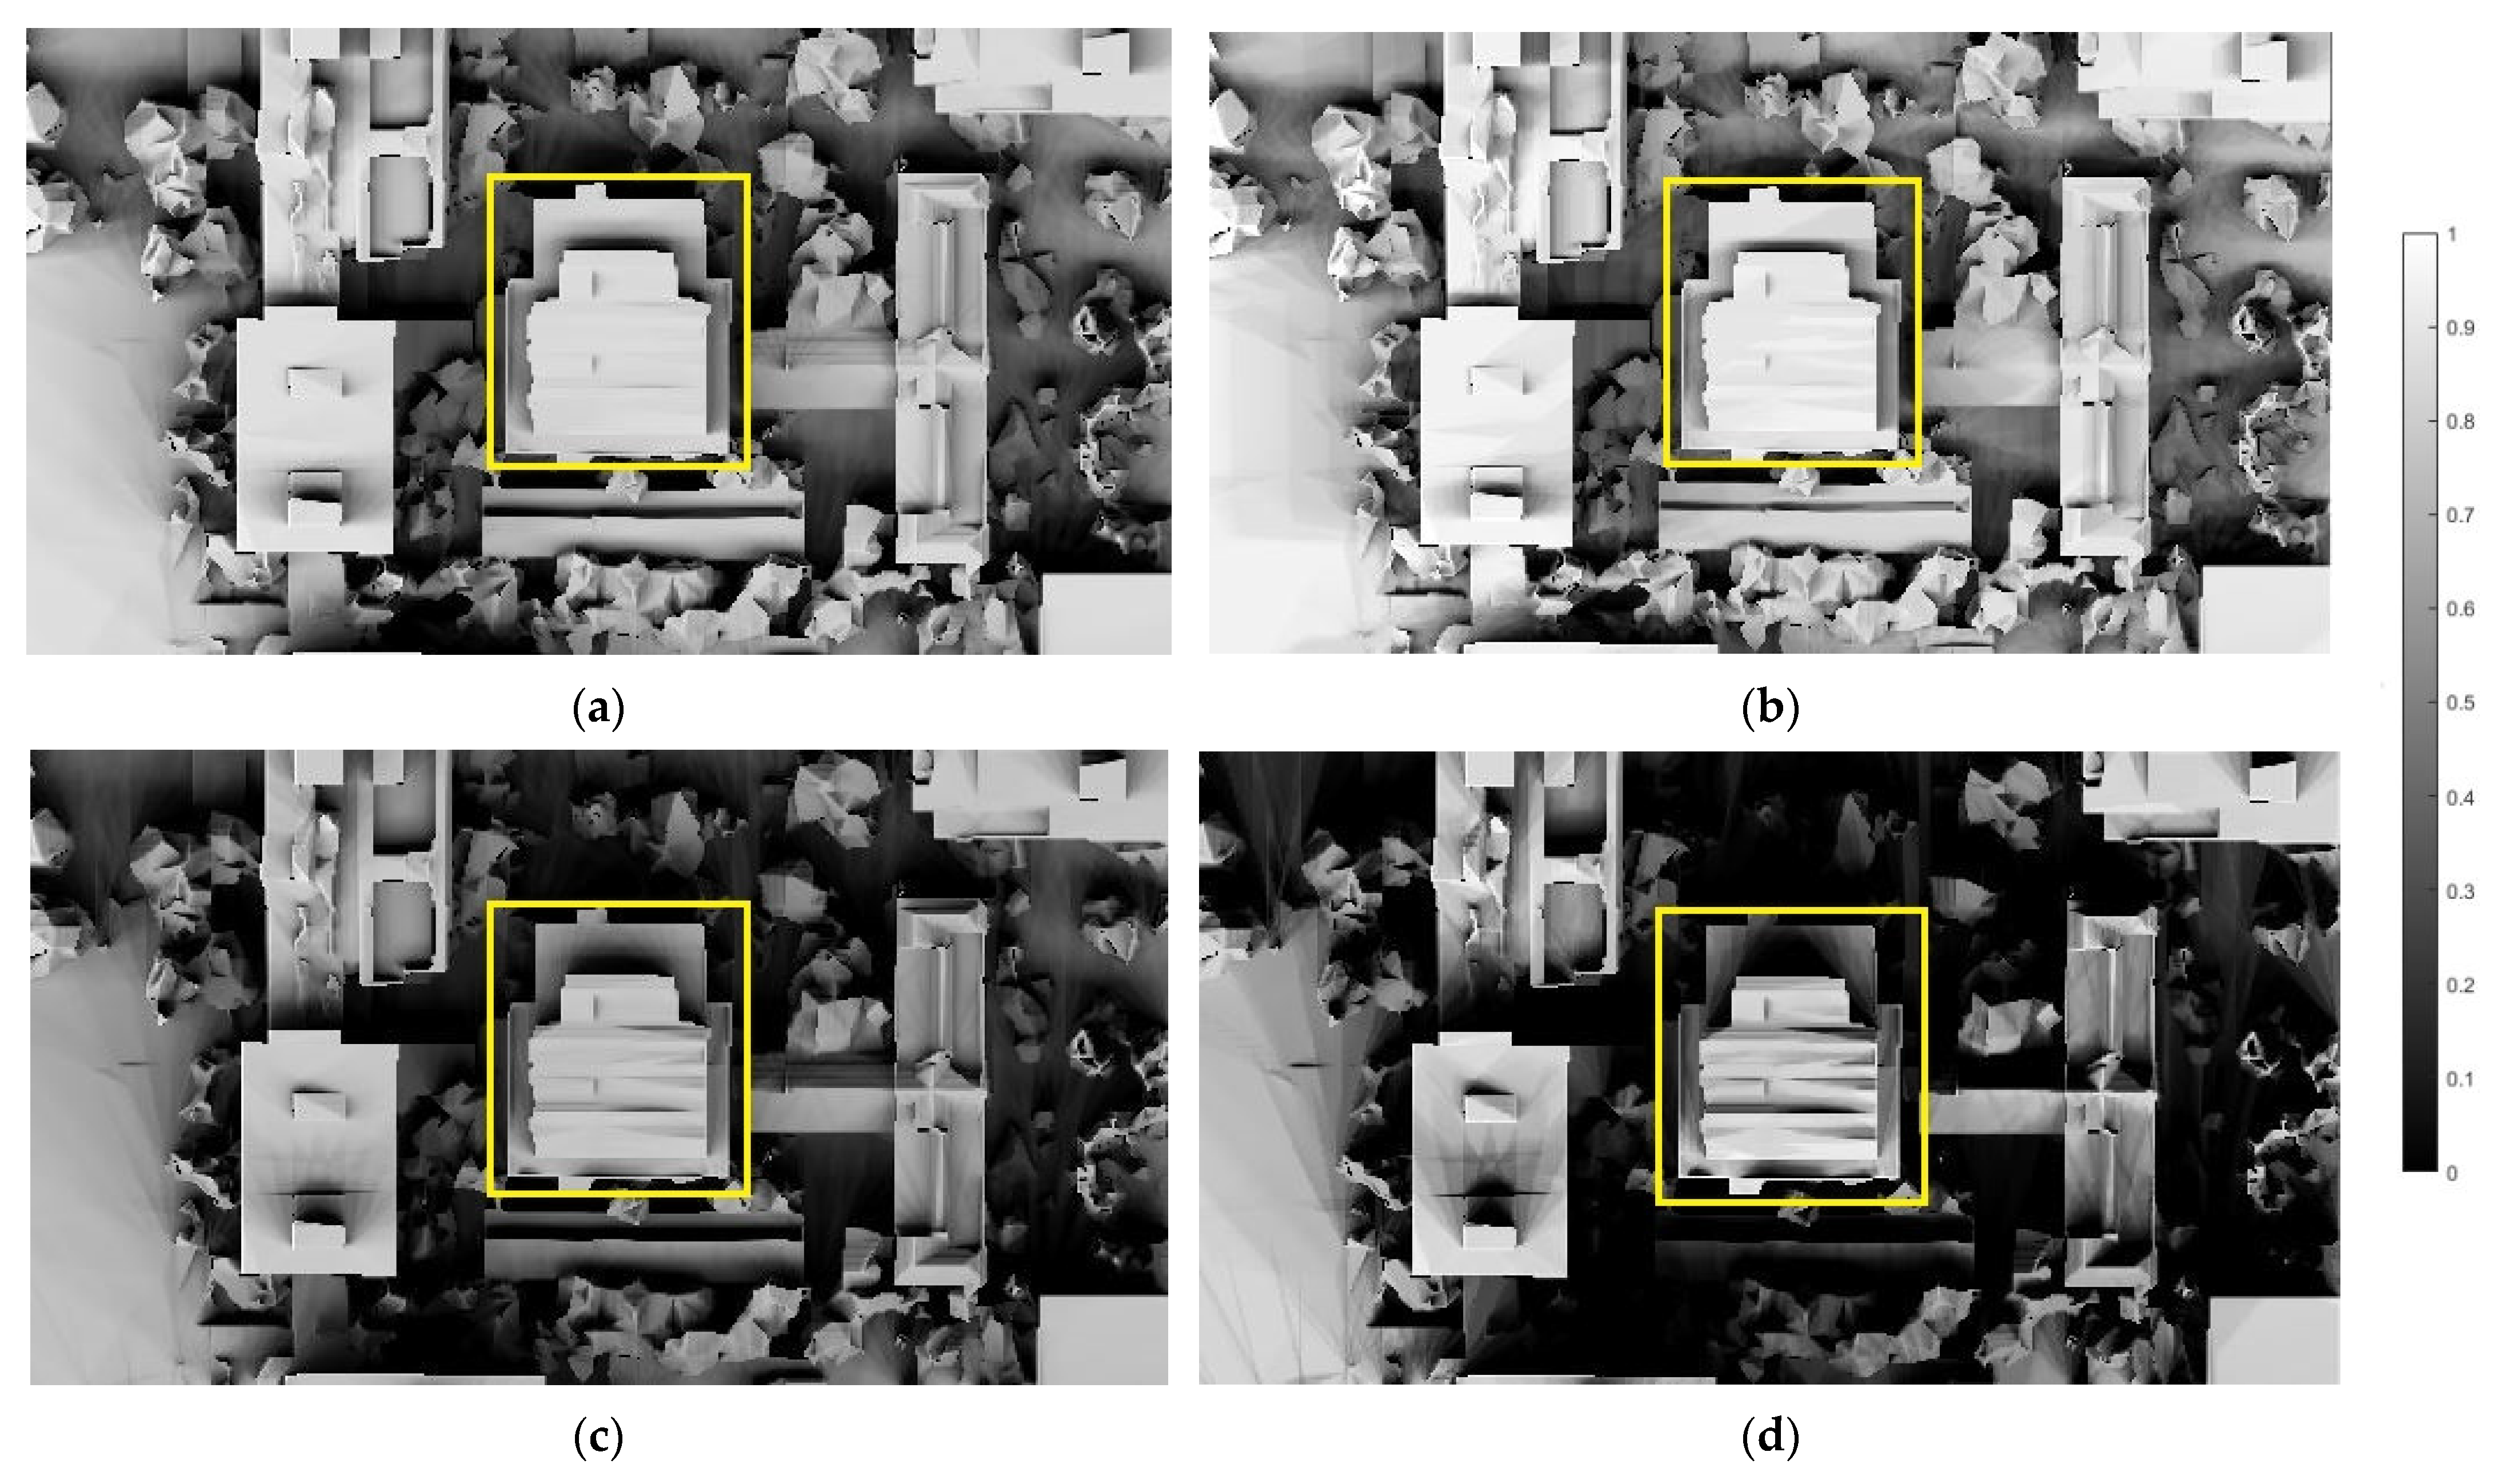
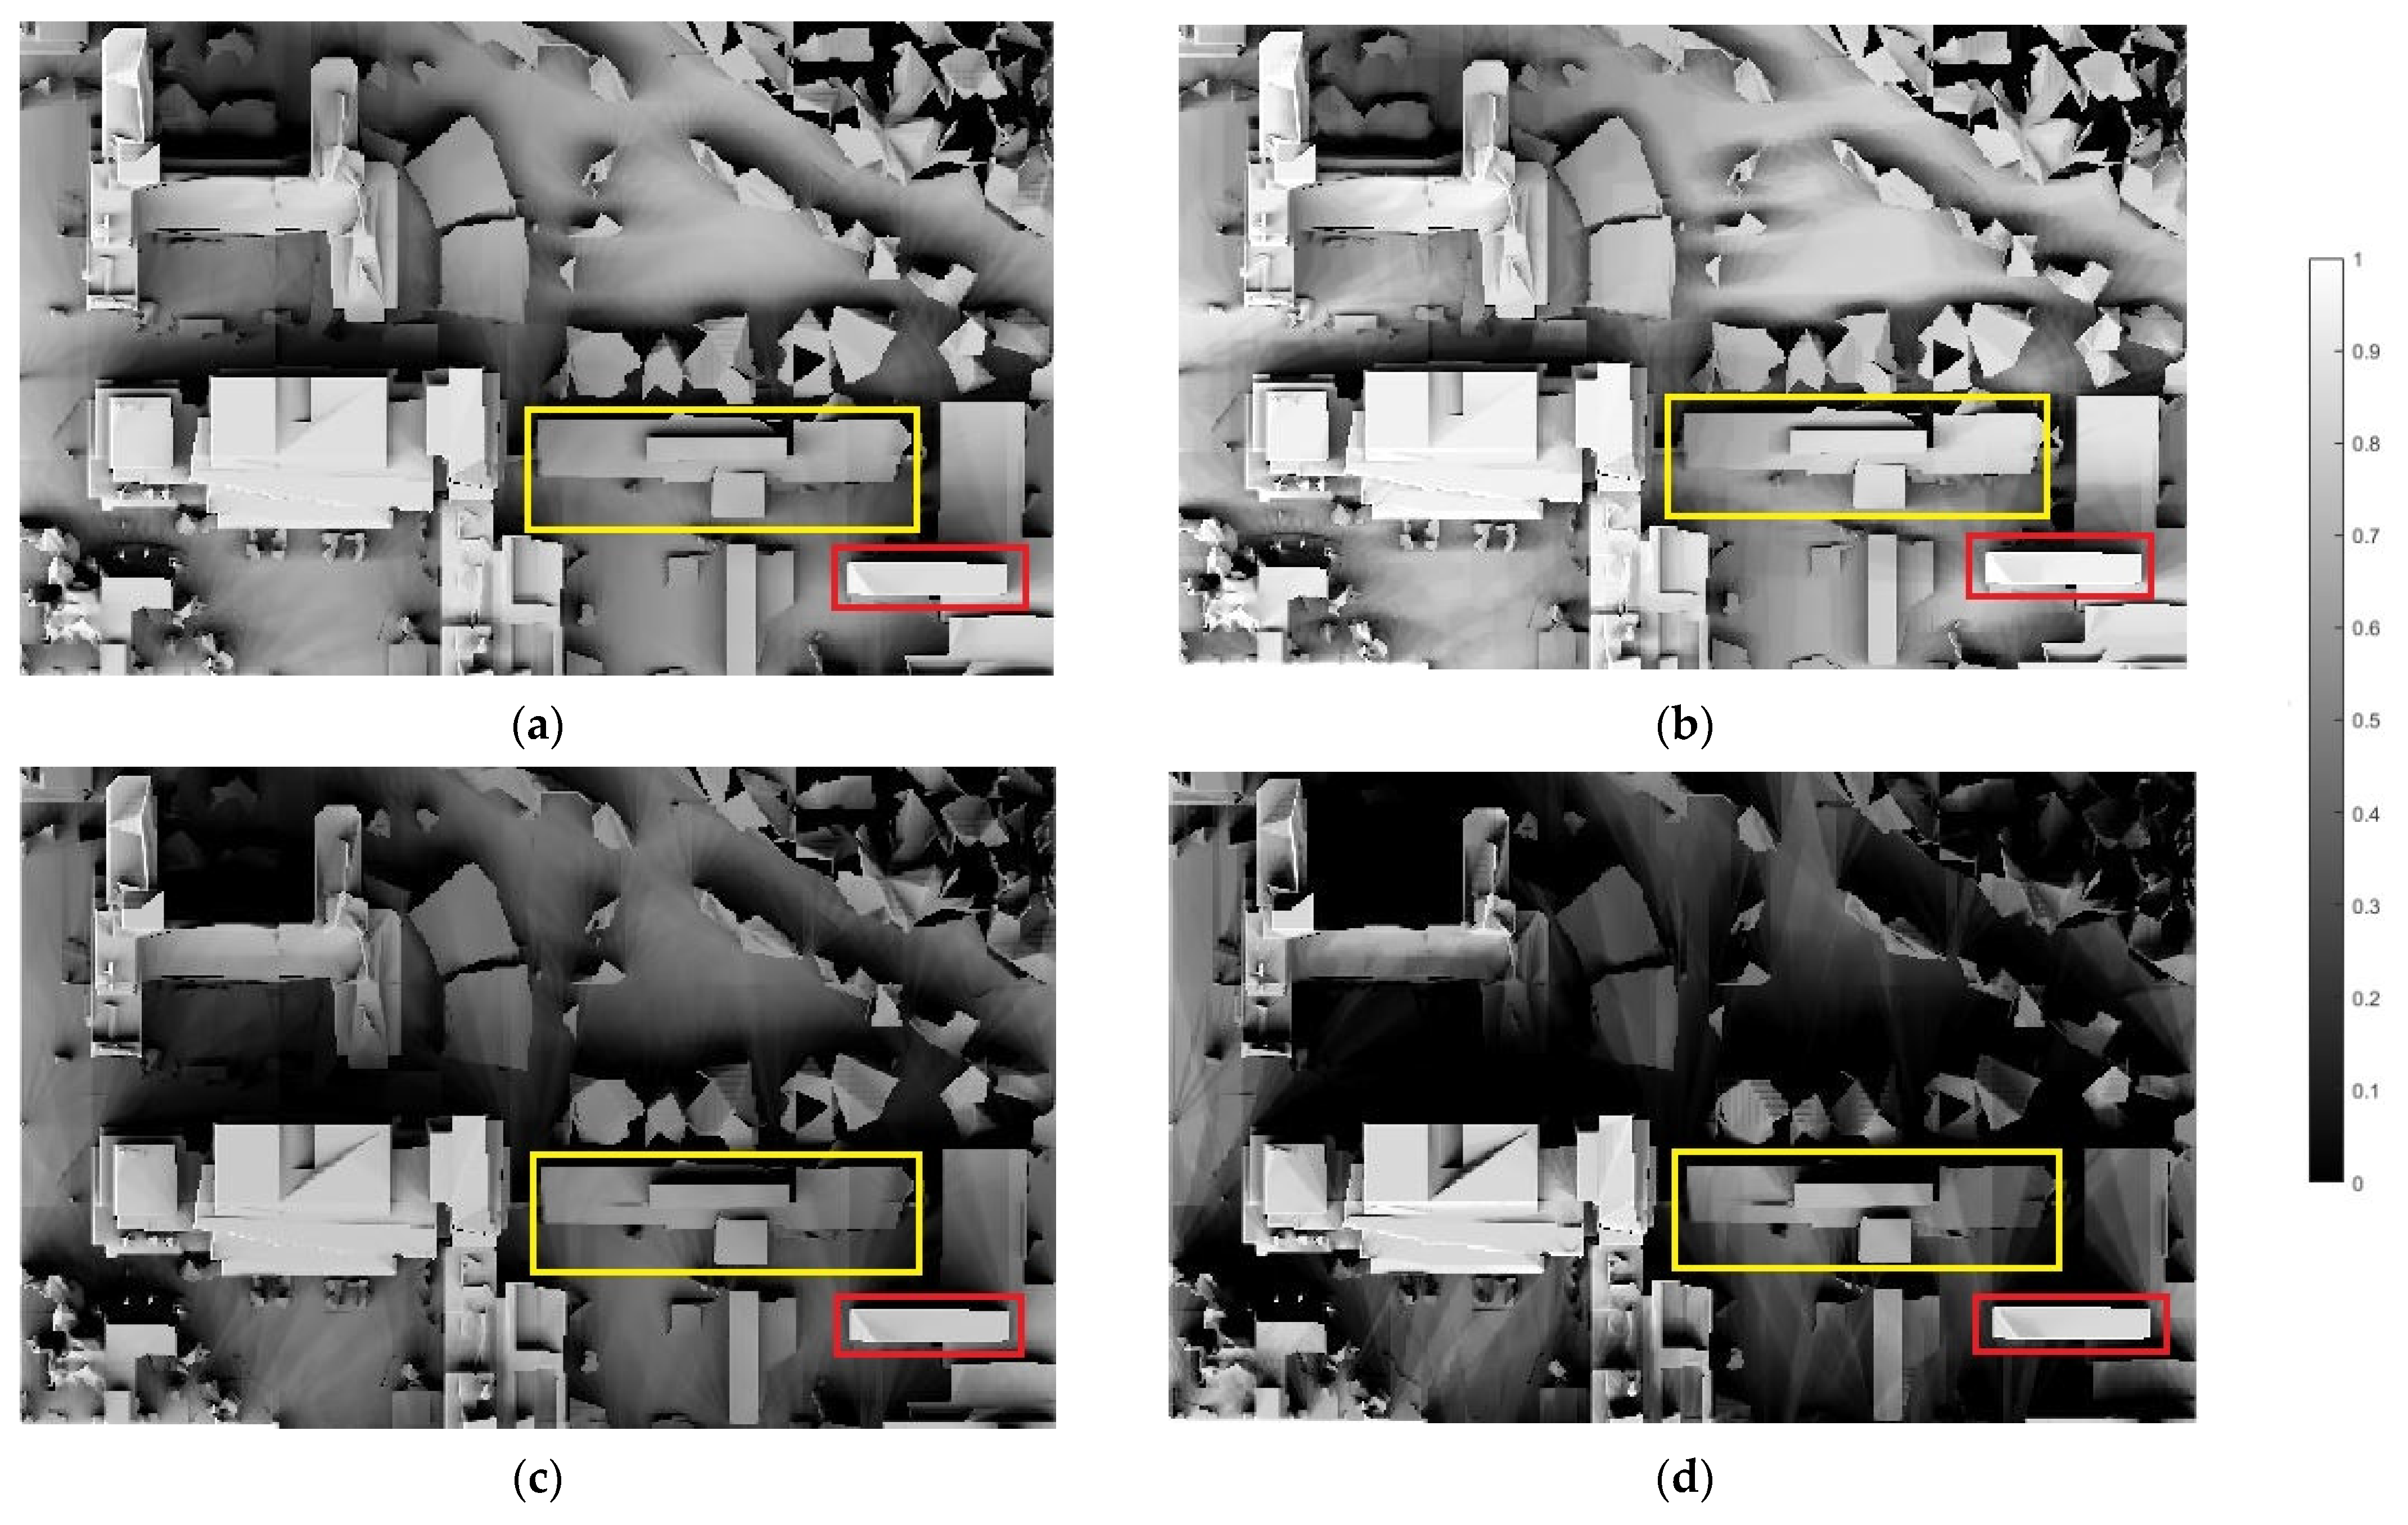
The presence of shadows due to the obstacles on the roofs and around buildings directly impacts PV output generation and may affect decisions regarding the installations. Figure 11, Figure 12 and Figure 13 illustrate the shading maps for the ADMIN, CAM, and EAS buildings, respectively, representing the average brightness score in different seasons. The March Equinox and September Equinox are the first days of the spring and fall in the northern hemisphere, respectively, and the June Solstice and December Solstice indicate the start of summer and winter, respectively. Yellow boxes indicate the target buildings. The taller building around the EAS is marked with a red box in Figure 13.
The figures above clearly show that the shading intensity in fall and winter had more impact on the buildings’ radiation recipient areas than in spring and summer for our study. Furthermore, in all three buildings, the induced shading by different heights of rooftops at the same building is clearly visible. Finally, a shadow cast by the tall building near the EAS building can also be observed on the right side of the EAS roofs, especially in winter and fall.

3.3. Solar Radiation Model and Annual Electricity Generation Validation

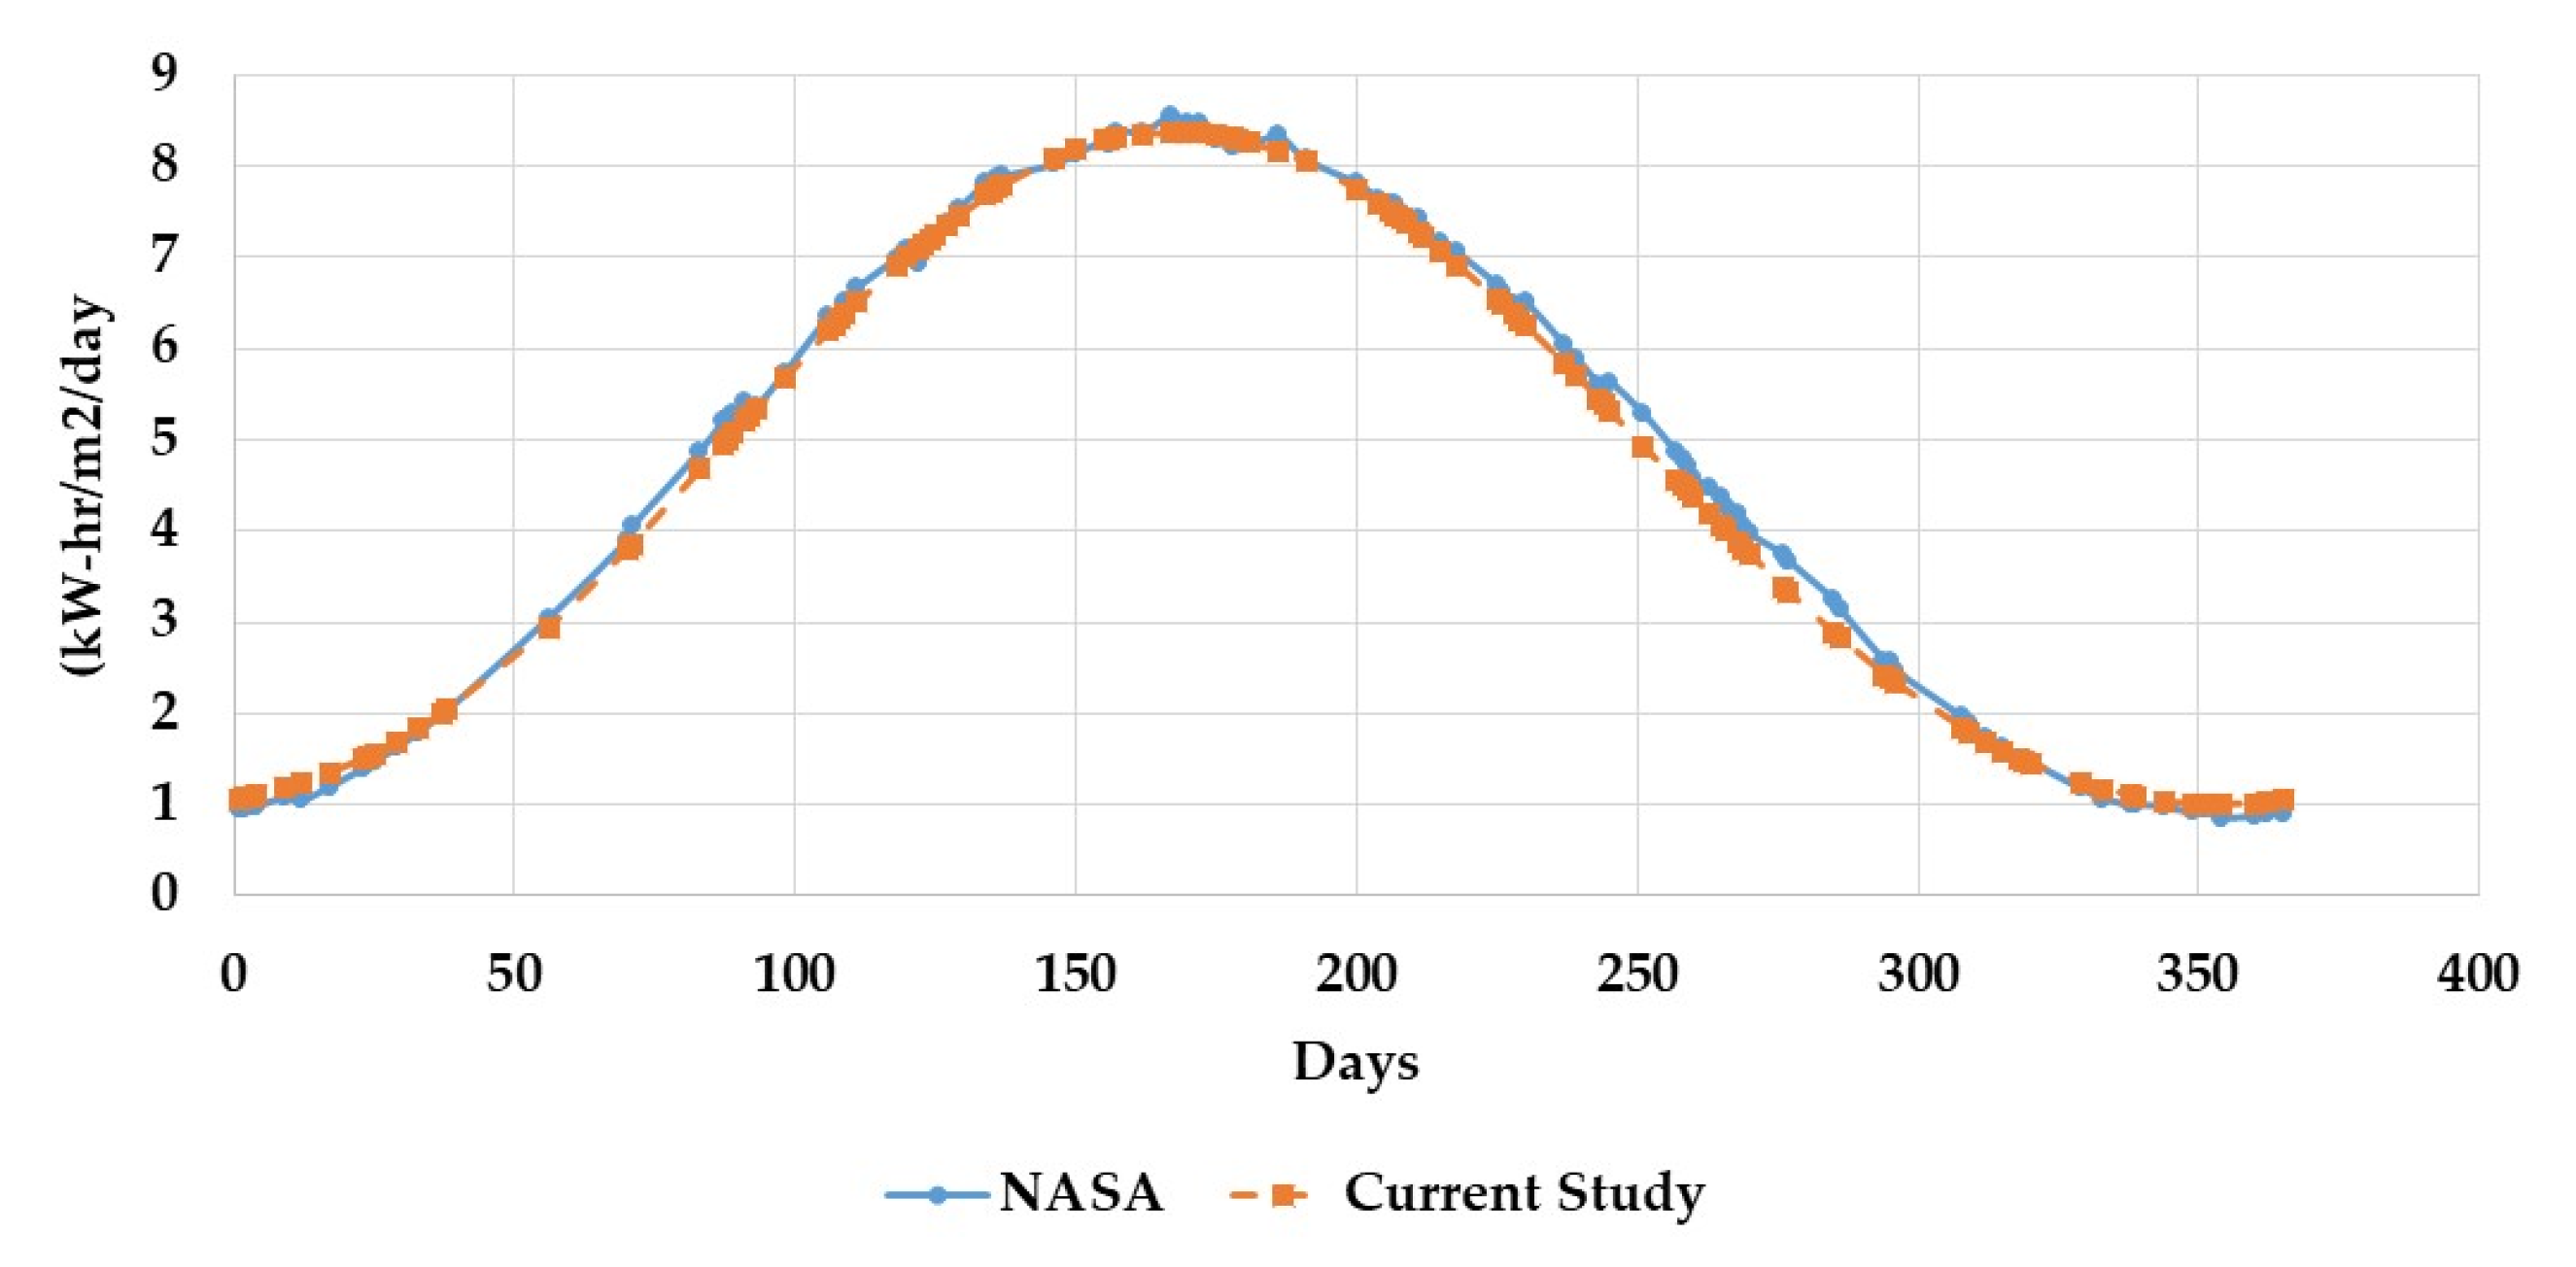
In order to validate the radiation data used in the optimization procedure, the computed daily clear-sky global horizontal radiation was compared to the NASA Prediction of Worldwide Energy Resources [46], as demonstrated in Figure 14. The resulting error of this comparison was only 4.31%.
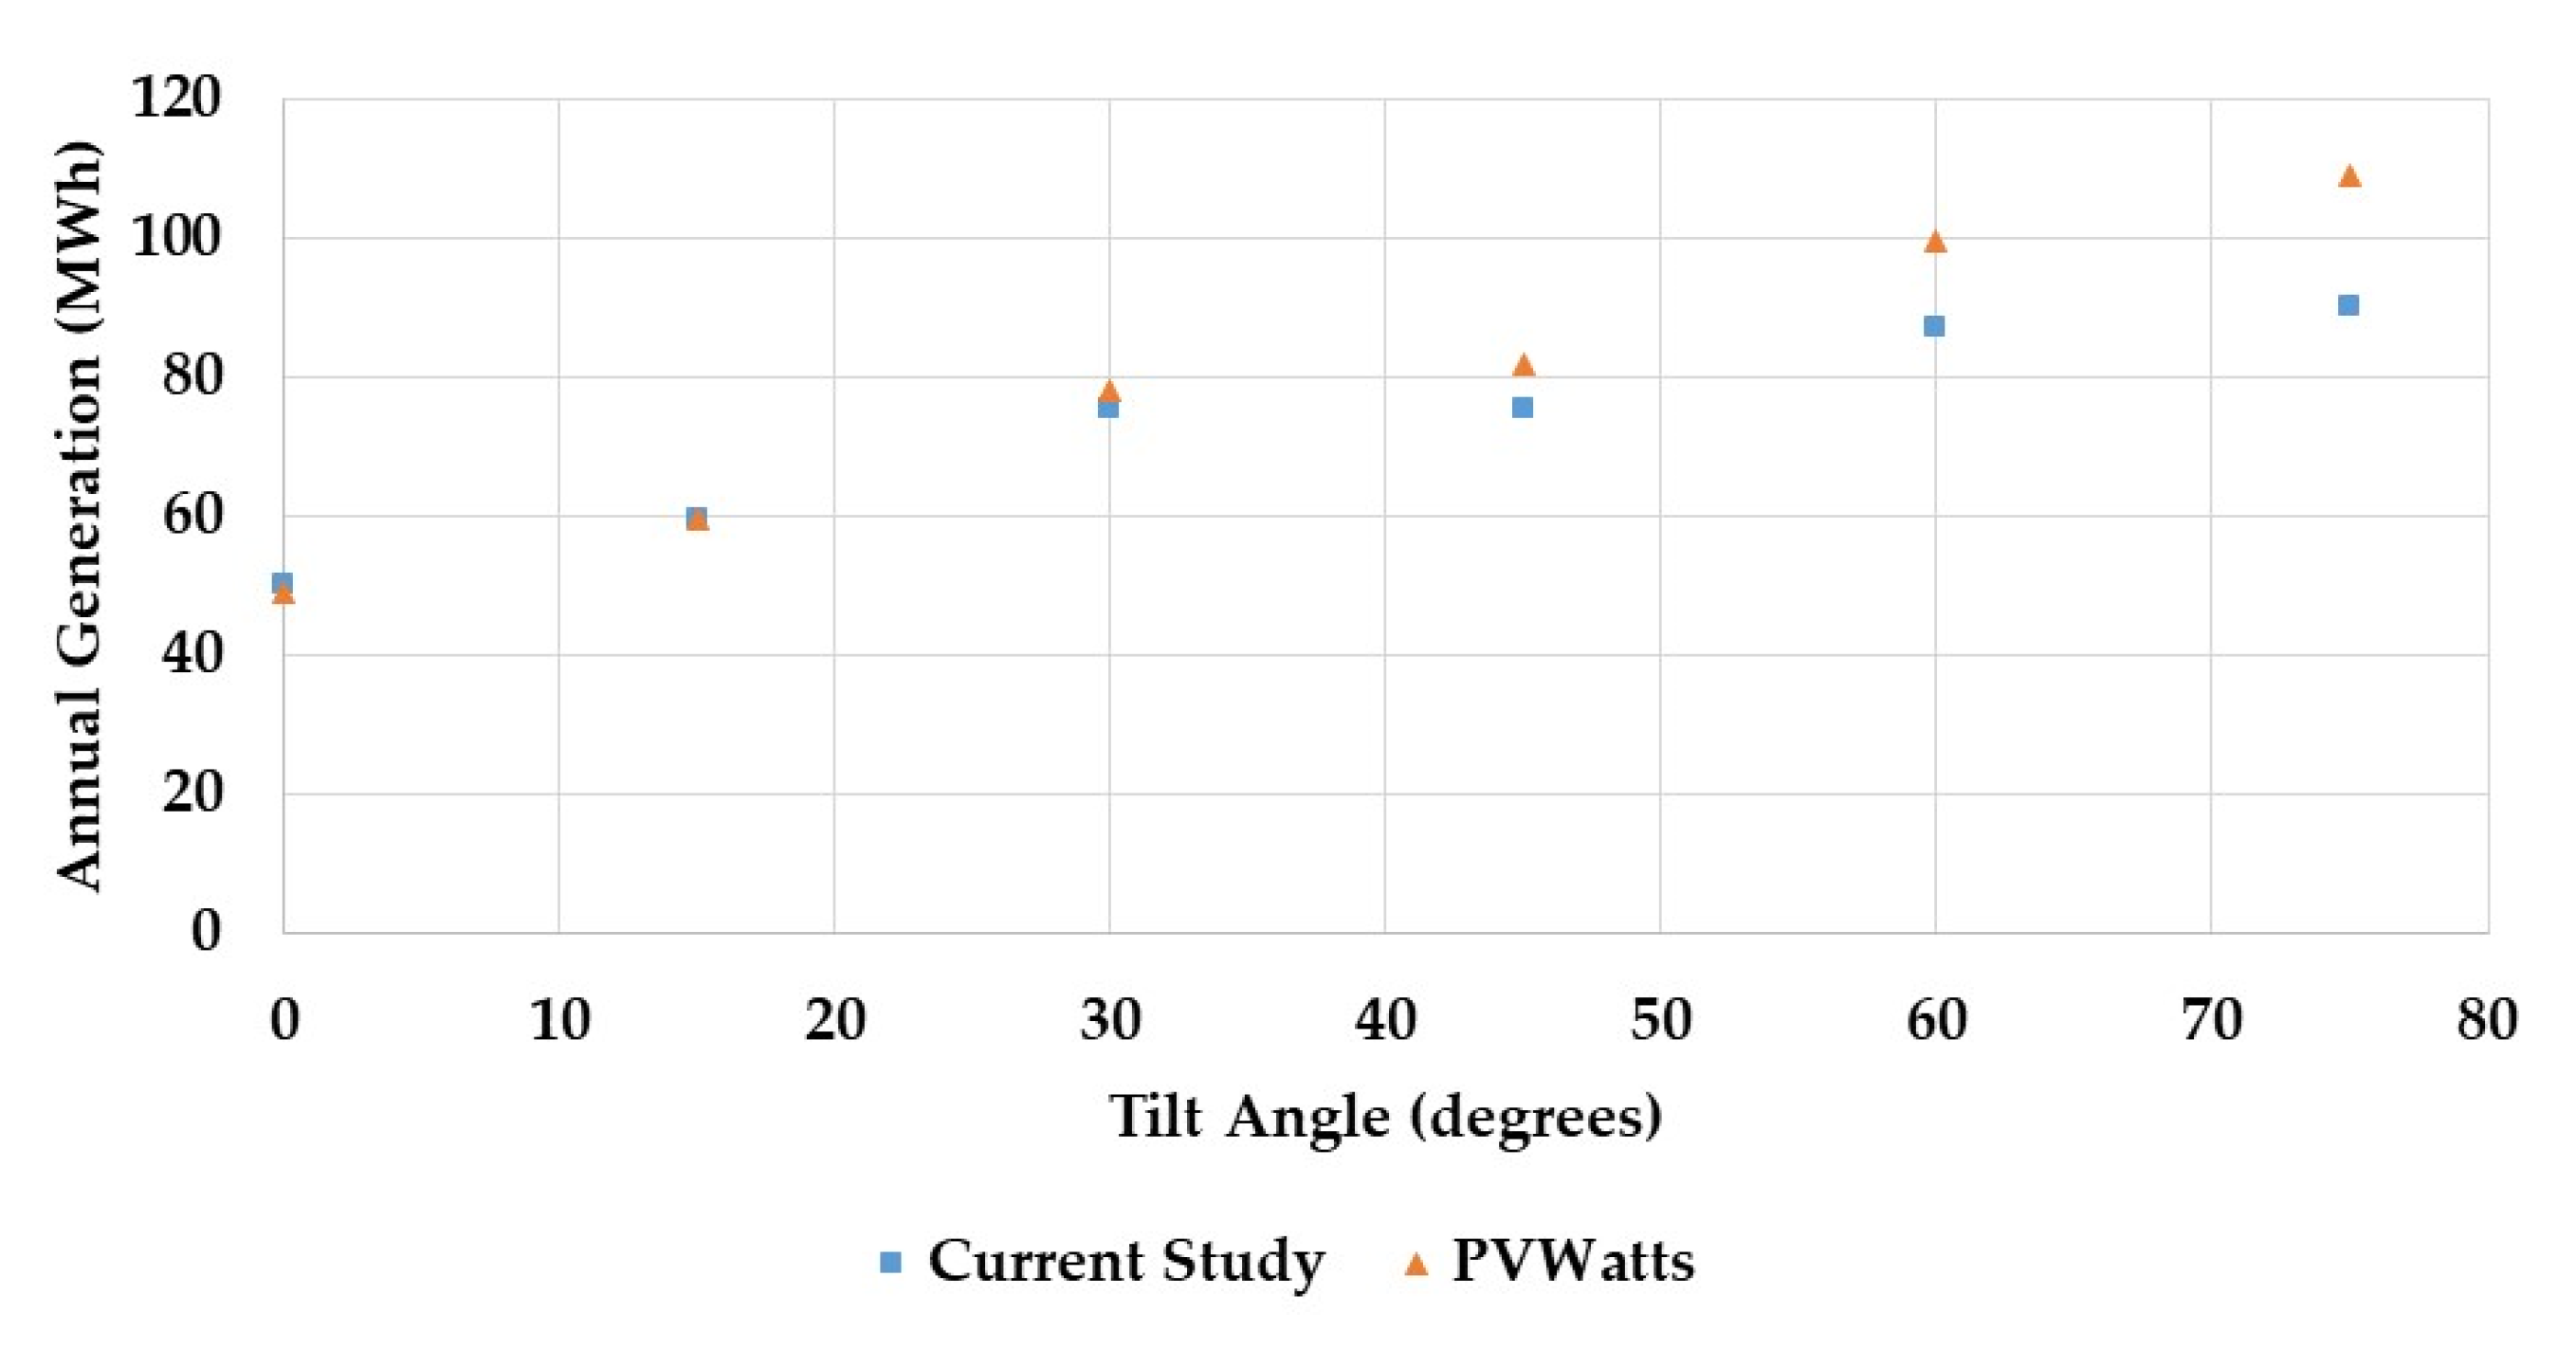
To validate the annual production of the PV systems, the data obtained from the present work were compared to the data of PVWatts® [47]. Figure 15 shows the annual energy generation of the ADMIN building at different tilt angles and fixed azimuth angles to the south. Inter-row spacing was also set to one meter. Note that PVWatts® considers the mutual shading effect on PV arrays with one-axis tracking and does not consider that effect for fixed roof-mounted arrays.
As represented in Figure 15, when the tilt angle was increased, significant differences could be seen in annual generation (between 10% and 20%) as the shadow length created in the back arrays became more remarkable when the tilt angle increased at a fixed inter-row spacing. In addition, PVWatts® does not consider the impact of mutual shading of fixed PV panels at higher tilt angles. On the other hand, the annual production difference between the proposed method and PVWatts® for the lower tilt angles was less than 5%. Therefore, the last two figures clearly show the validity of the proposed solar radiation model in this study.

3.4. Optimization Results

After identifying the rooftops of the ADMIN, CAM, and EAS buildings, the proposed optimization method was applied to find the optimum solar PV layout for the buildings. As mentioned earlier, due to the nonlinear nature of the optimization problem, the search space method was used to find the optimal value. Table 2 summarizes the optimum tilt angle ( β ), azimuth angle ( γ ), and inter-row spacing ( L i r ). For each building, the system layout was chosen using the proposed enveloped min–max multi-objective optimization algorithm to maximize electricity generation while minimizing the cost of installation and electricity purchased from the grid in terms of payback period, as mentioned in Equation (12). Table 2 presents the layout of the PV systems in the three buildings.
Based on the results from Table 2, all panels on the three buildings are almost due south (between south and 20 degrees to the west); and their tilt angle is slightly lower than the latitude angle of the investigated location, which is 53 ° .
The best performance for a solar panel is when its azimuth angle is zero degrees in the northern hemisphere and 180 degrees in the southern hemisphere [32]. However, in the present work, due to the sky cloudiness, shading of the surrounding objects, and adjacent panels, PV panel output could be influenced by some degrees of azimuth angle. Thus, the PV panels’ azimuth angle deviated from zero.
Table 3 presents the payback periods for each building based on the annual energy generation and the number of installed PV panels. The optimal payback years for ADMIN, CAM, and EAS were found to be 22.99, 27.20, and 26.91, respectively.
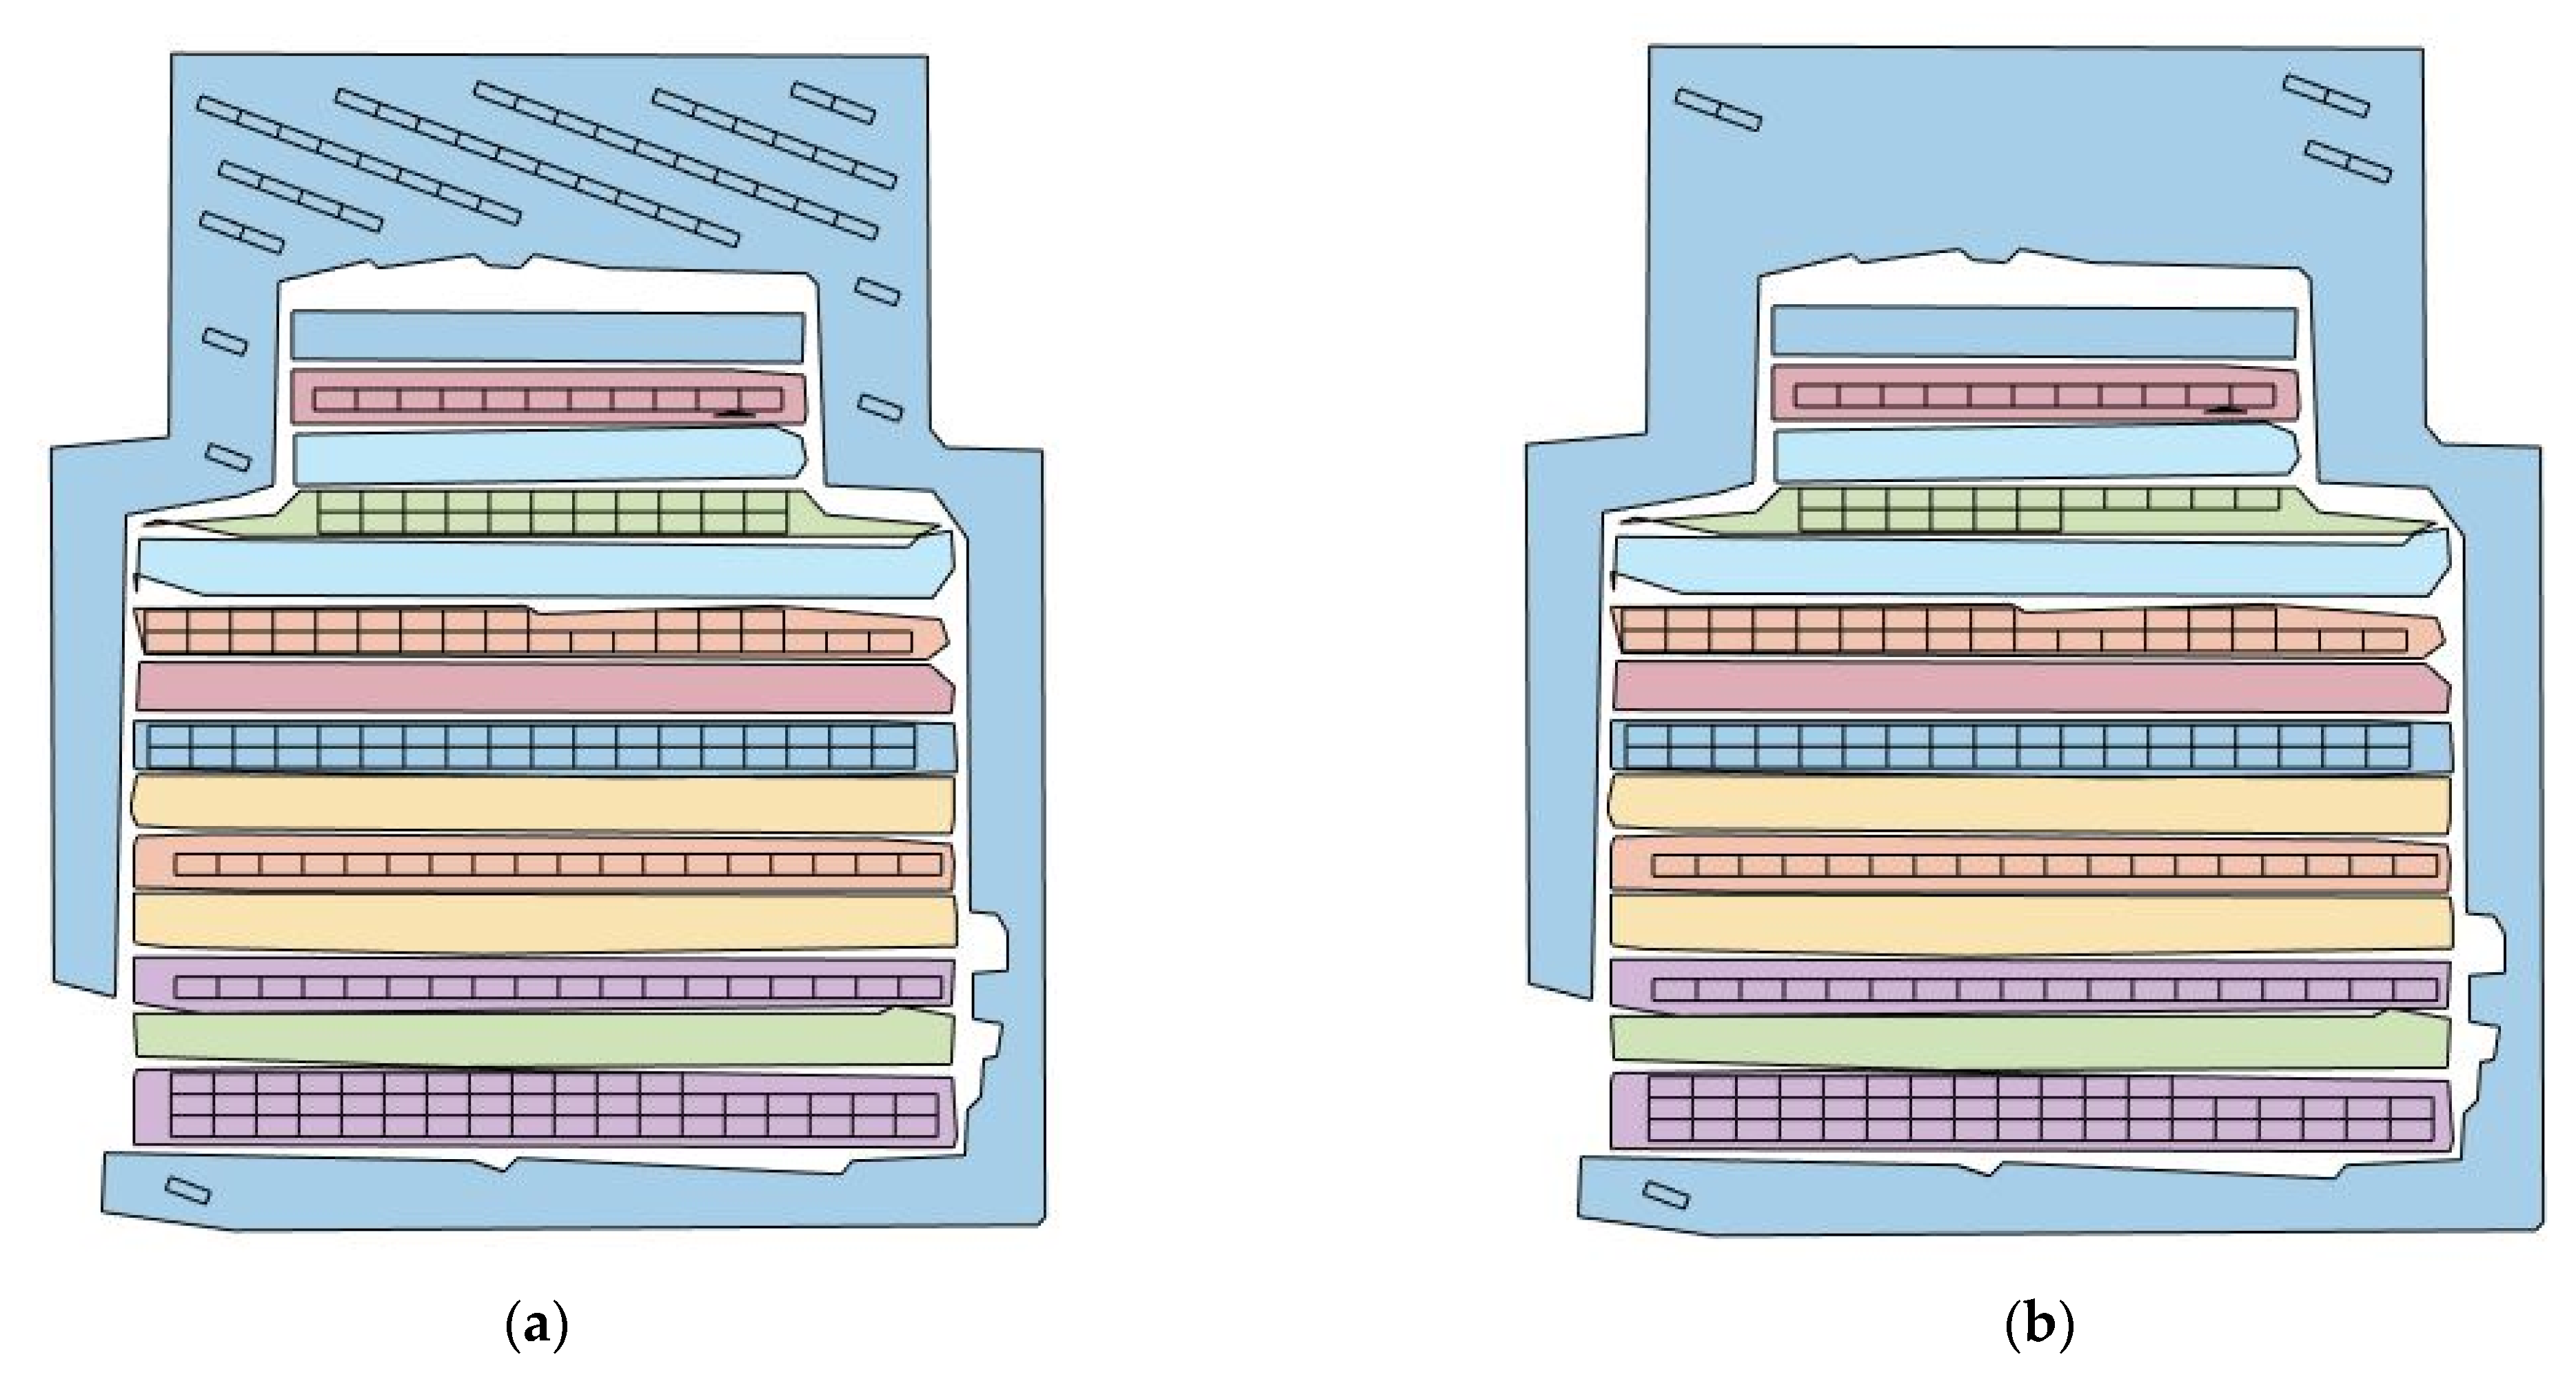
Figure 16a–c present the optimum layout of the PV system for the ADMIN, CAM, and EAS buildings’ roofs. The figures show the PV system layout in bird’s eye view and panel projection on the roofs.
The impact on panel arrangement in the ADMIN building due to three obstacles or irregular objects on the smaller roof and an obstacle on the larger roof is shown in Figure 16a. Many obstacles that impact PV module layout on the EAS building are clear in Figure 16c. In this figure, these obstacles are represented by enclosed white areas on the building rooftops.
In Figure 16b, it can be seen that the panels were placed on the flat roof at an angle of 50 degrees, which makes them appear smaller than the actual size due to the top–down view; but because the slope of the slanted roofs is about 10 degrees, the size of the panels installed on them are seen closer to their actual size. It can also be observed that, as stated in the methodology section, PV modules were not installed on the roofs facing north. Minimal obstacles on a limited number of roofs of the CAM building can also be seen in Figure 16b.
The other point gleaned from the above figures is the margin for fire safety seen around the PV panels on flat roofs. This is why panels were not installed in a small area of the flat roof of the CAM building. It can be seen that in slanted roofs, the margin had been neglected due to the presence of north-facing roofs that allow access to sloped roofs with panels. Furthermore, it can be observed from Figure 16b that all the panels on slanted roofs are facing south. Of the 185 panels installed on the CAM building, seven are on flat roofs and 178 are on slanted roofs. So, slanted roofs are playing a crucial role in the electricity generation of the CAM building. The south direction of the panels on sloping roofs is due to following the roofs’ orientation.
As mentioned earlier, panels with an average brightness score of less than 0.6 are removed from the system. Figure 17, Figure 18 and Figure 19 compare the PV systems with and without considering the shadow analysis for the three selected buildings.
In Figure 17, the main shadow impact on the ADMIN building can be observed by the effect of the top-level roof (orange color) on the lower level (blue color), which depicts seven panels’ elimination from the top right part of the blue colored roof. However, it can also be clearly seen that the ADMIN building has the lowest shadow impact of the three buildings. On the other hand, due to the highest level of the CAM building, which is the level with slanted roofs, large shading areas are induced on the lower flat roof, as shown in Figure 18. Therefore, many panels on the flat roof were removed. Thus, in both of these buildings, the shadow from different heights can be considered the primary shadow source that impacts the PV installation.
Another type of shadow generated by a tall building near the EAS building is also described and analyzed in this study. This type of shadow is only generated on the EAS building (the red box in Figure 13 identifies the tall building). Therefore, as shown in Figure 19b, PV panels on the bottom right of the EAS building were removed from the system. On the same figure, the removal of panels due to the building obstacles and the rooftops’ height difference is shown on the left side of the roof and the area between the top middle to the top right, respectively. Generally, the shadow impact generated by the roofs with different heights was the most dominant one and caused more panels elimination.
The resulting building energy generations are considered in Table 4 in comparison to the number of panels and the amount of solar energy generation in two modes with and without shading impact.
As reported in Table 4, the maximum and minimum reduction in energy generation due to obstacles’ shading impacts were 61.14% and 28.13% for the EAS building and the ADMIN building, respectively.
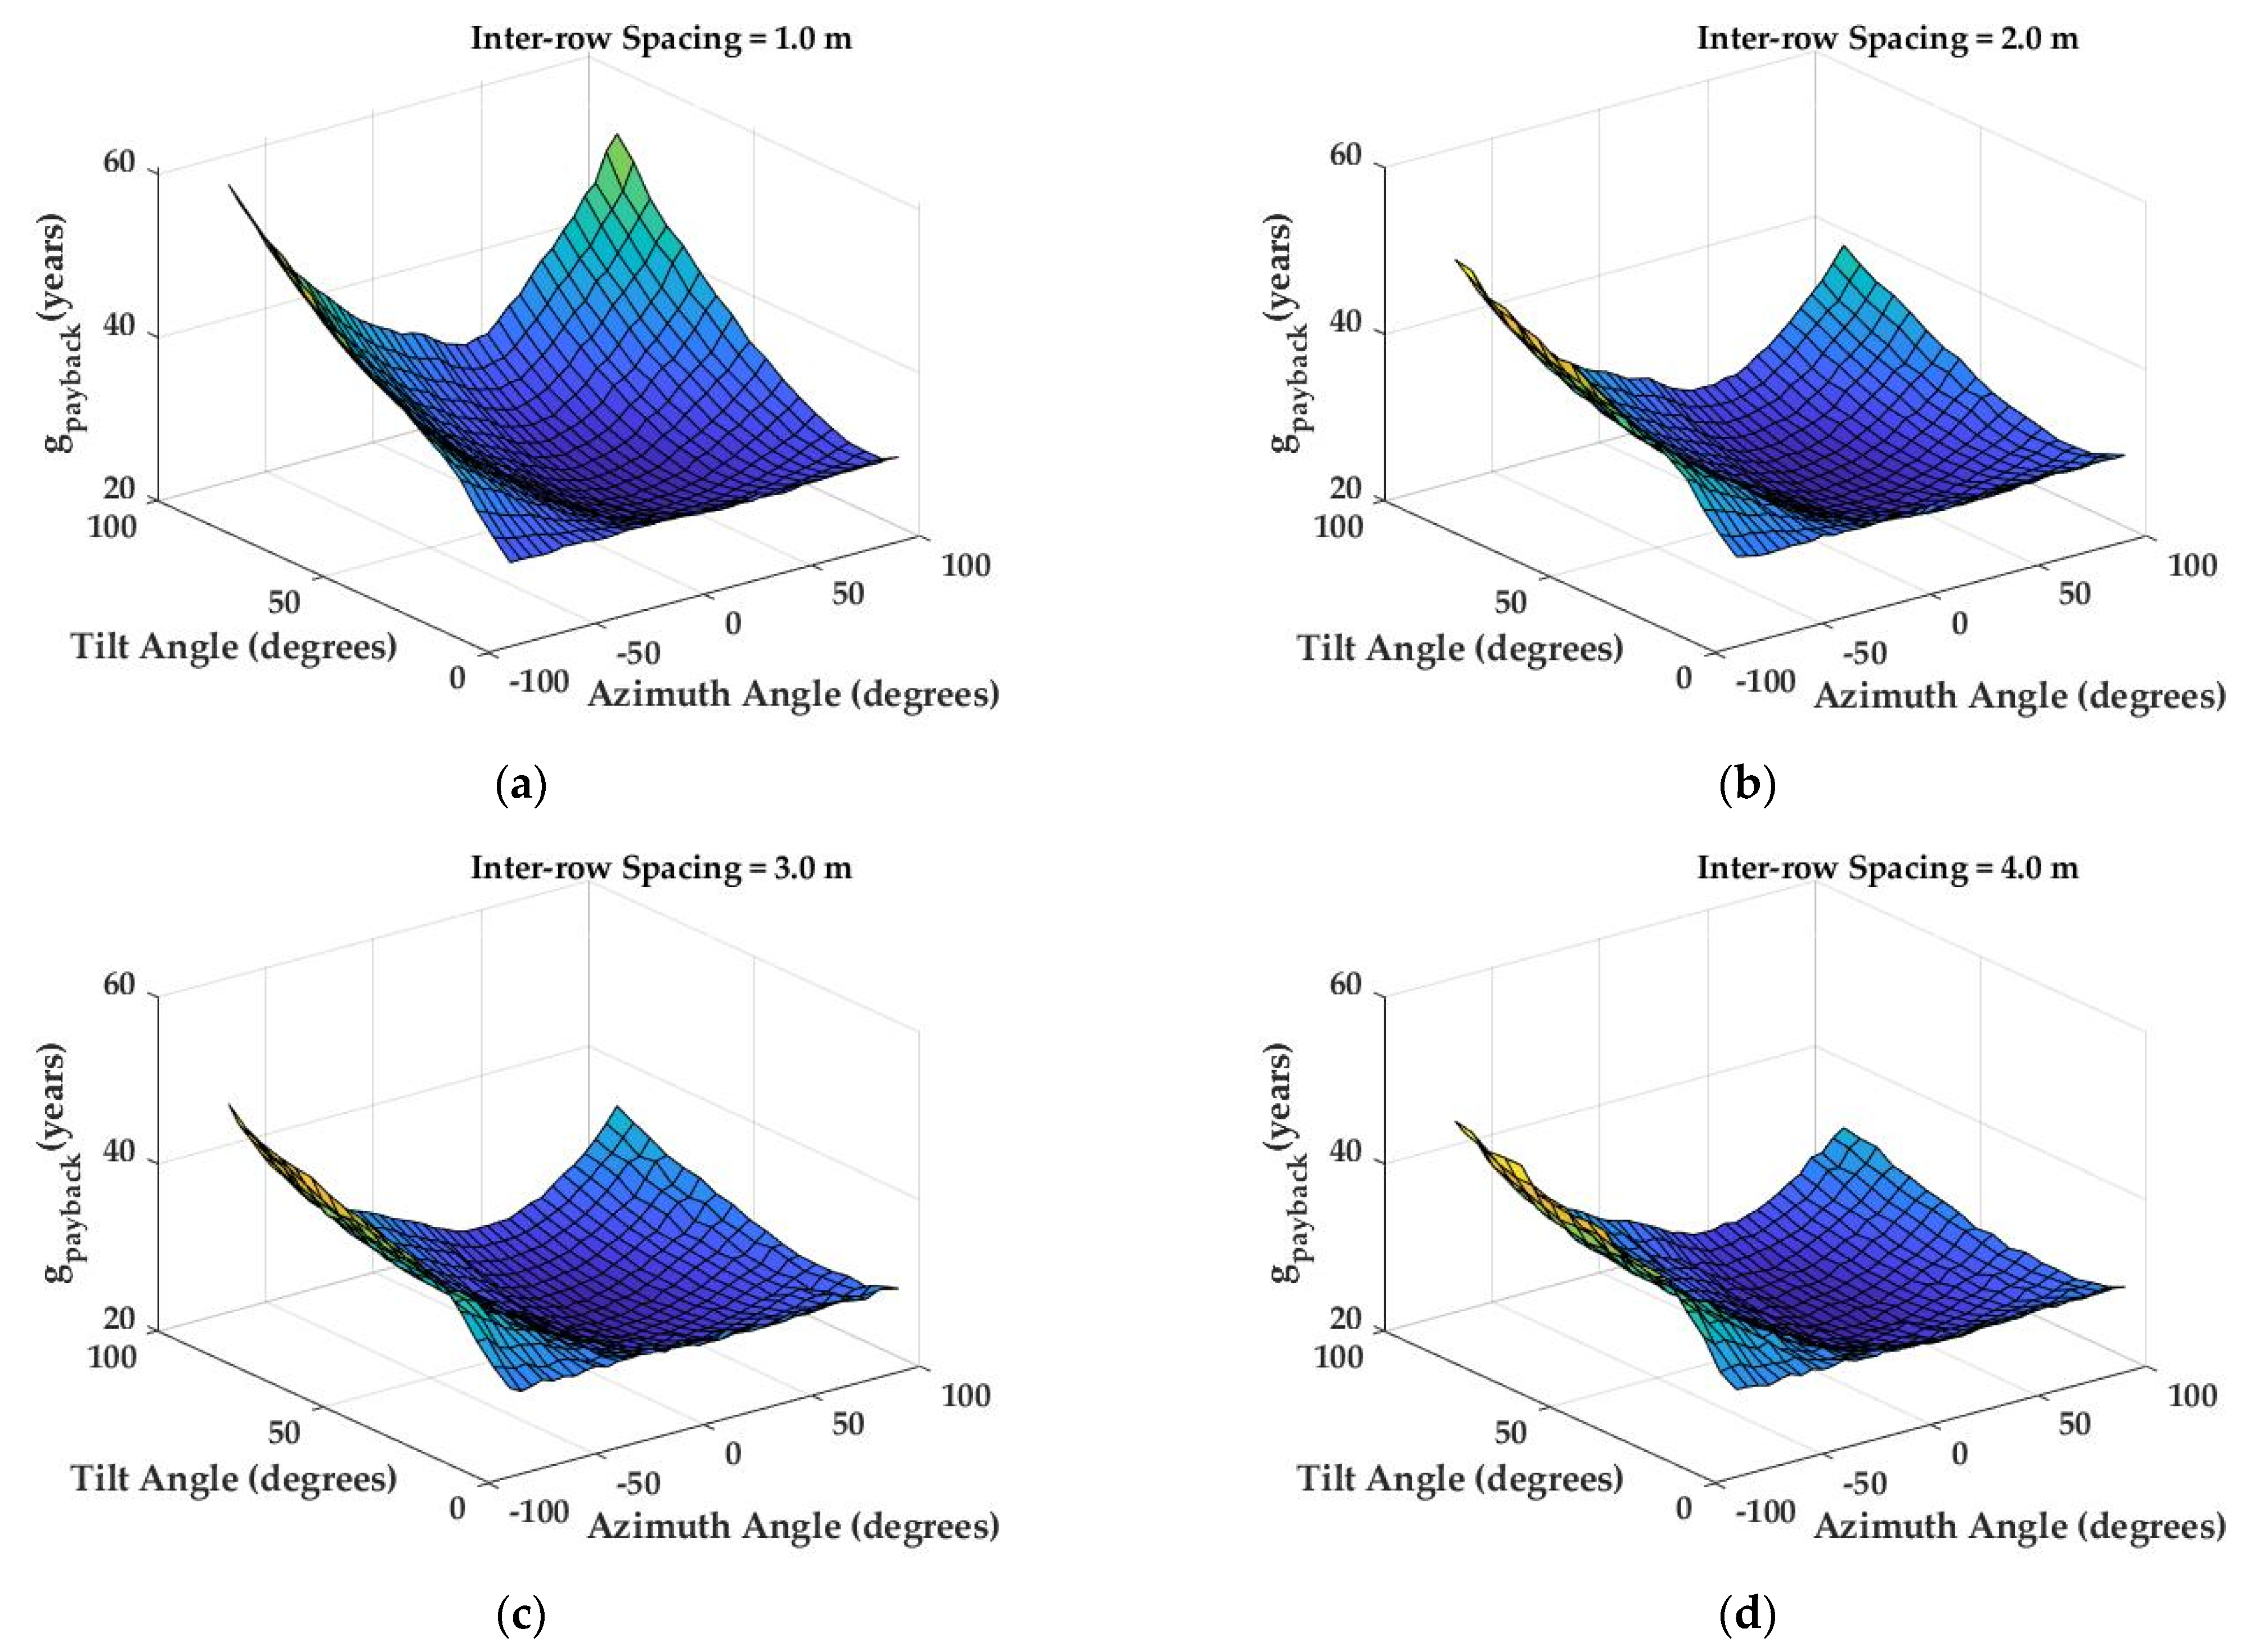
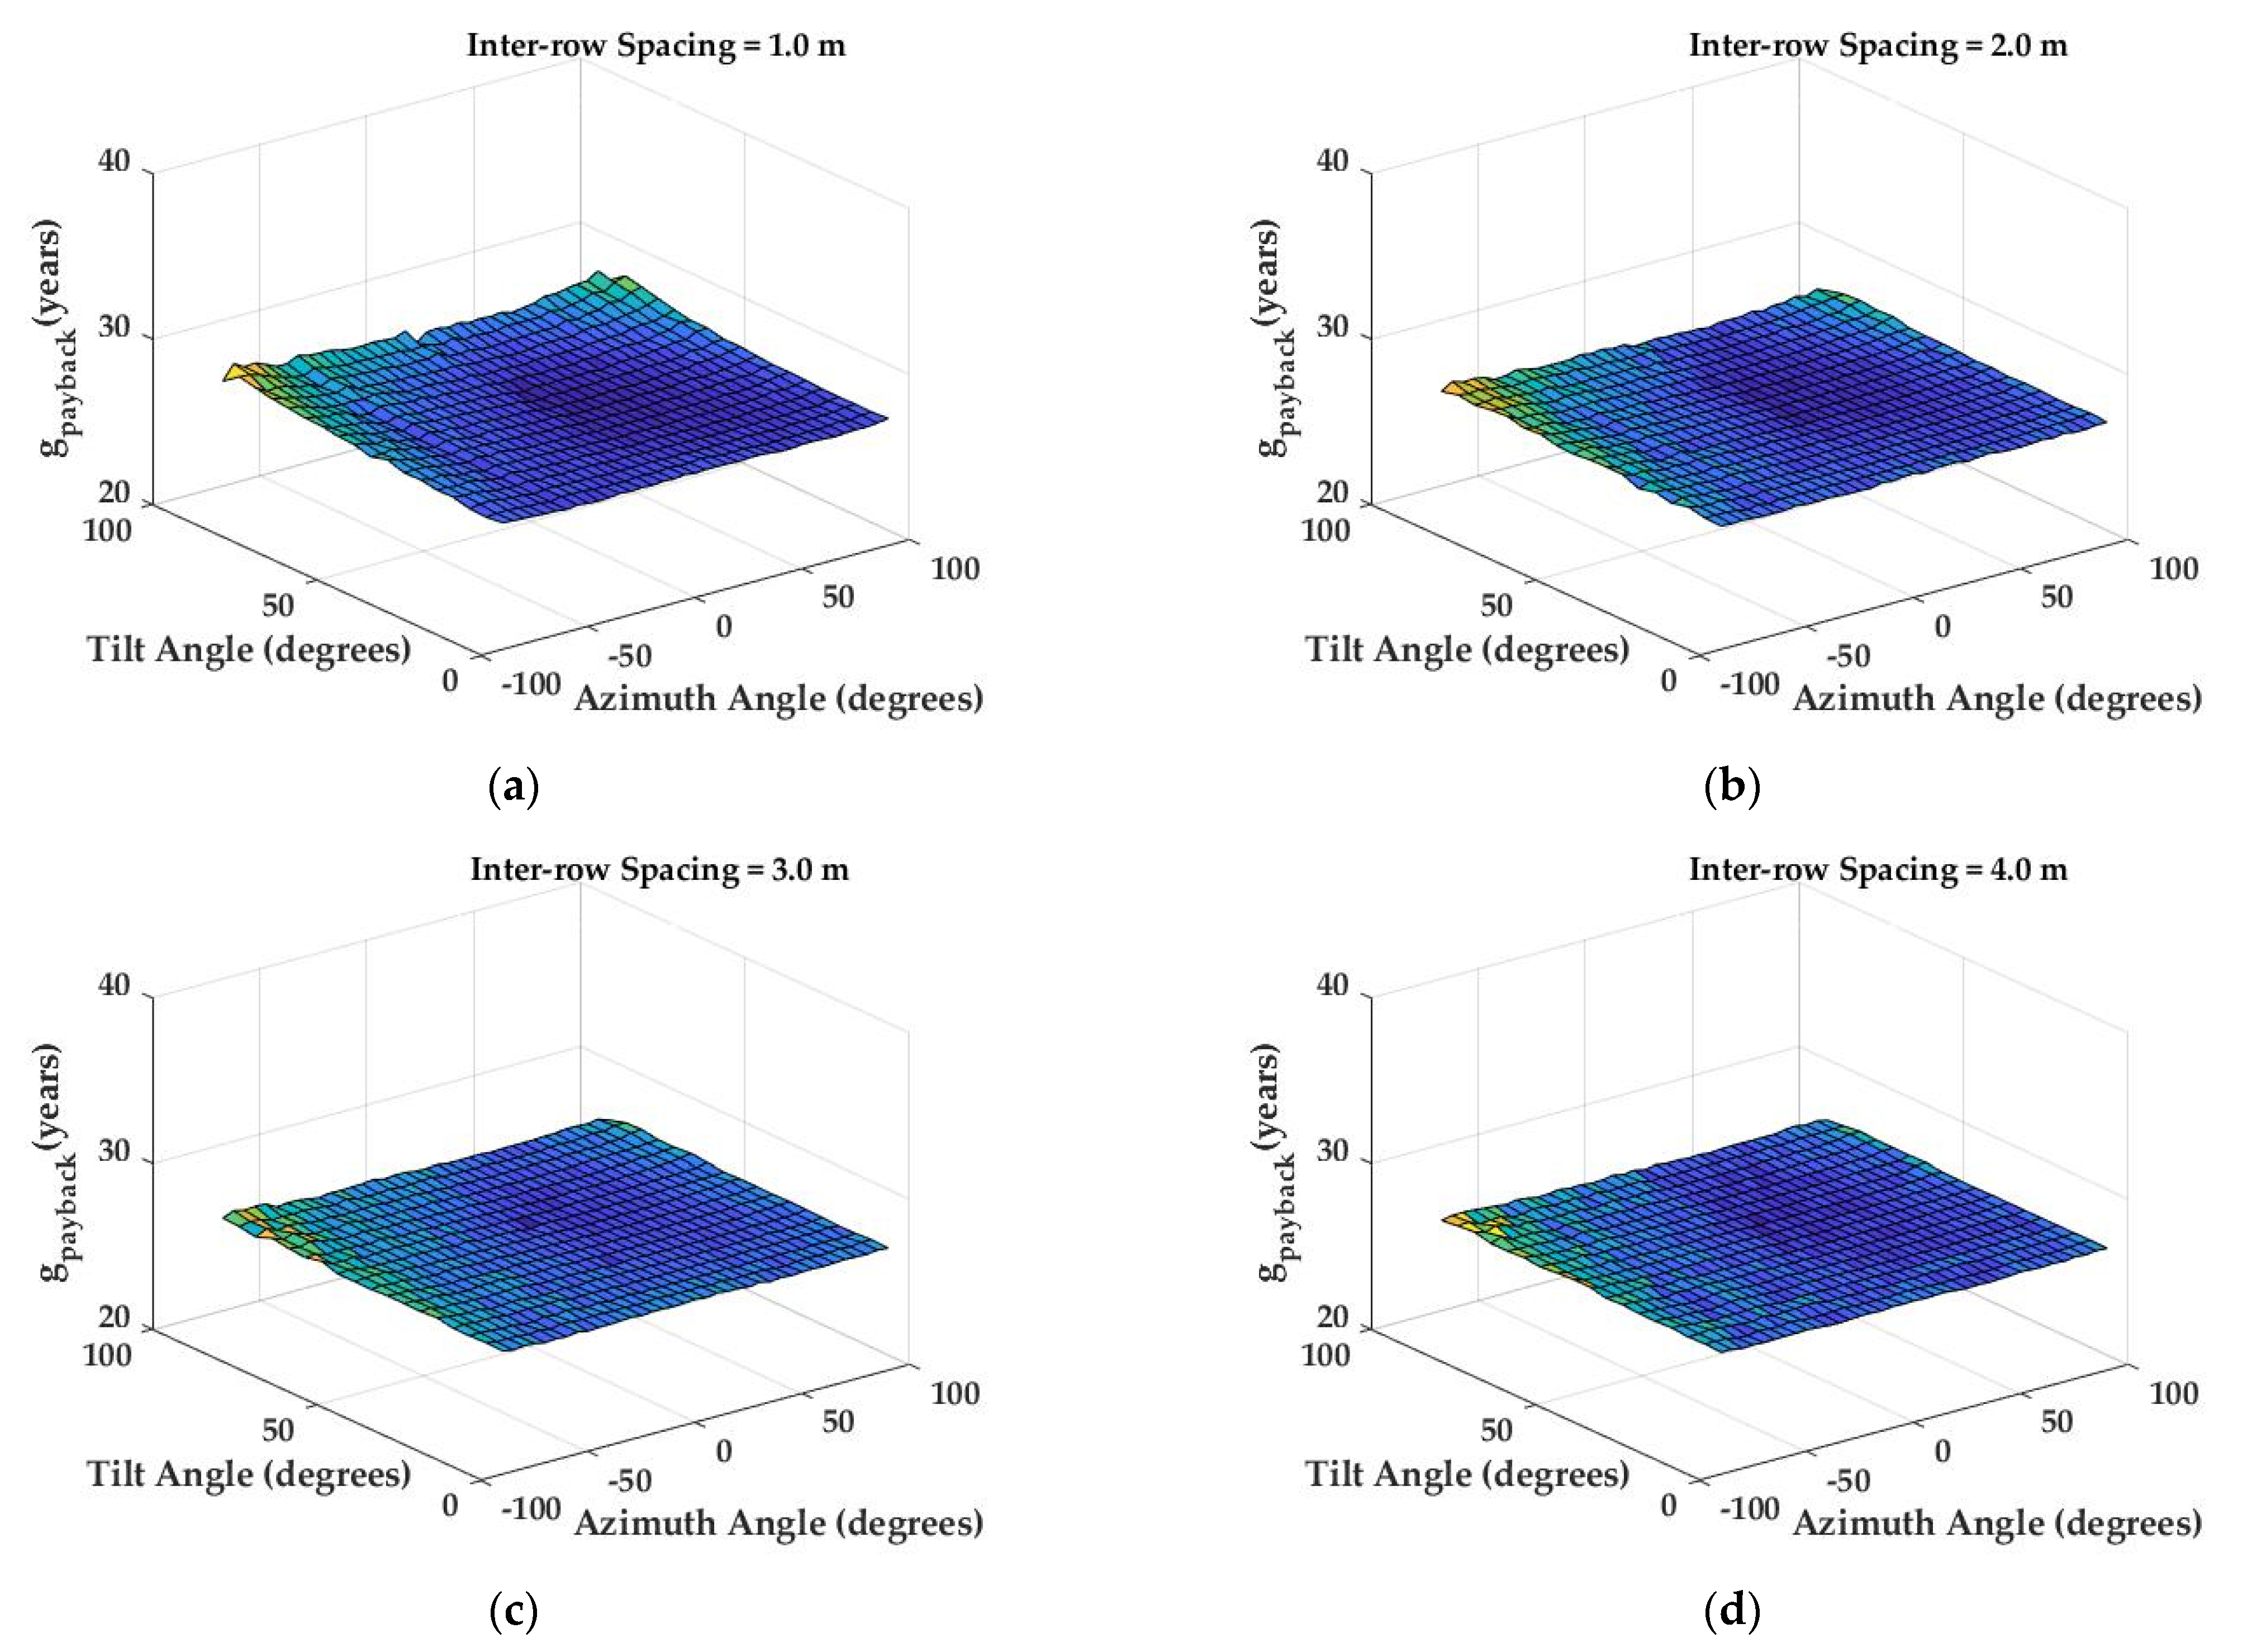
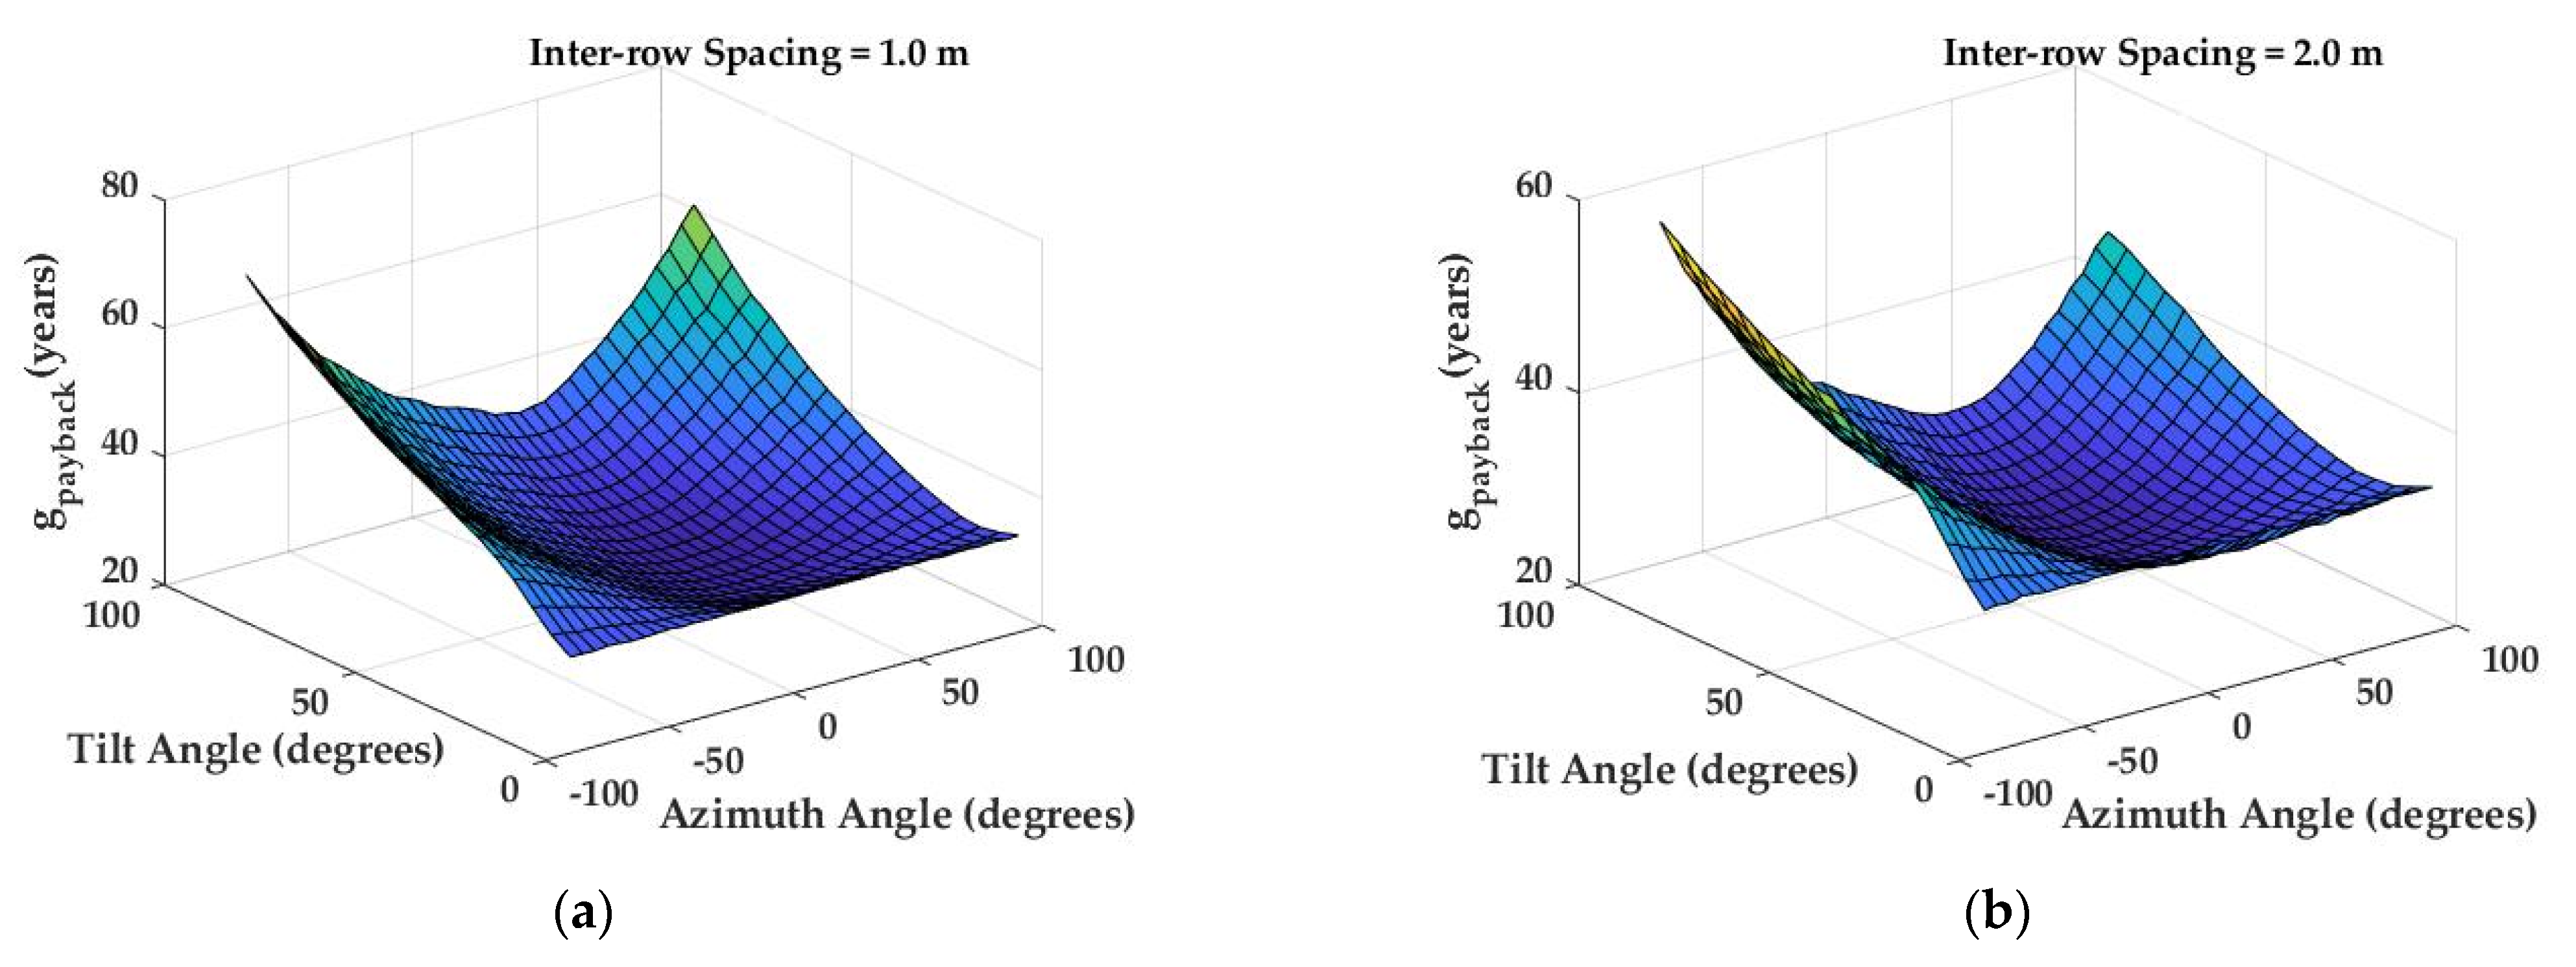
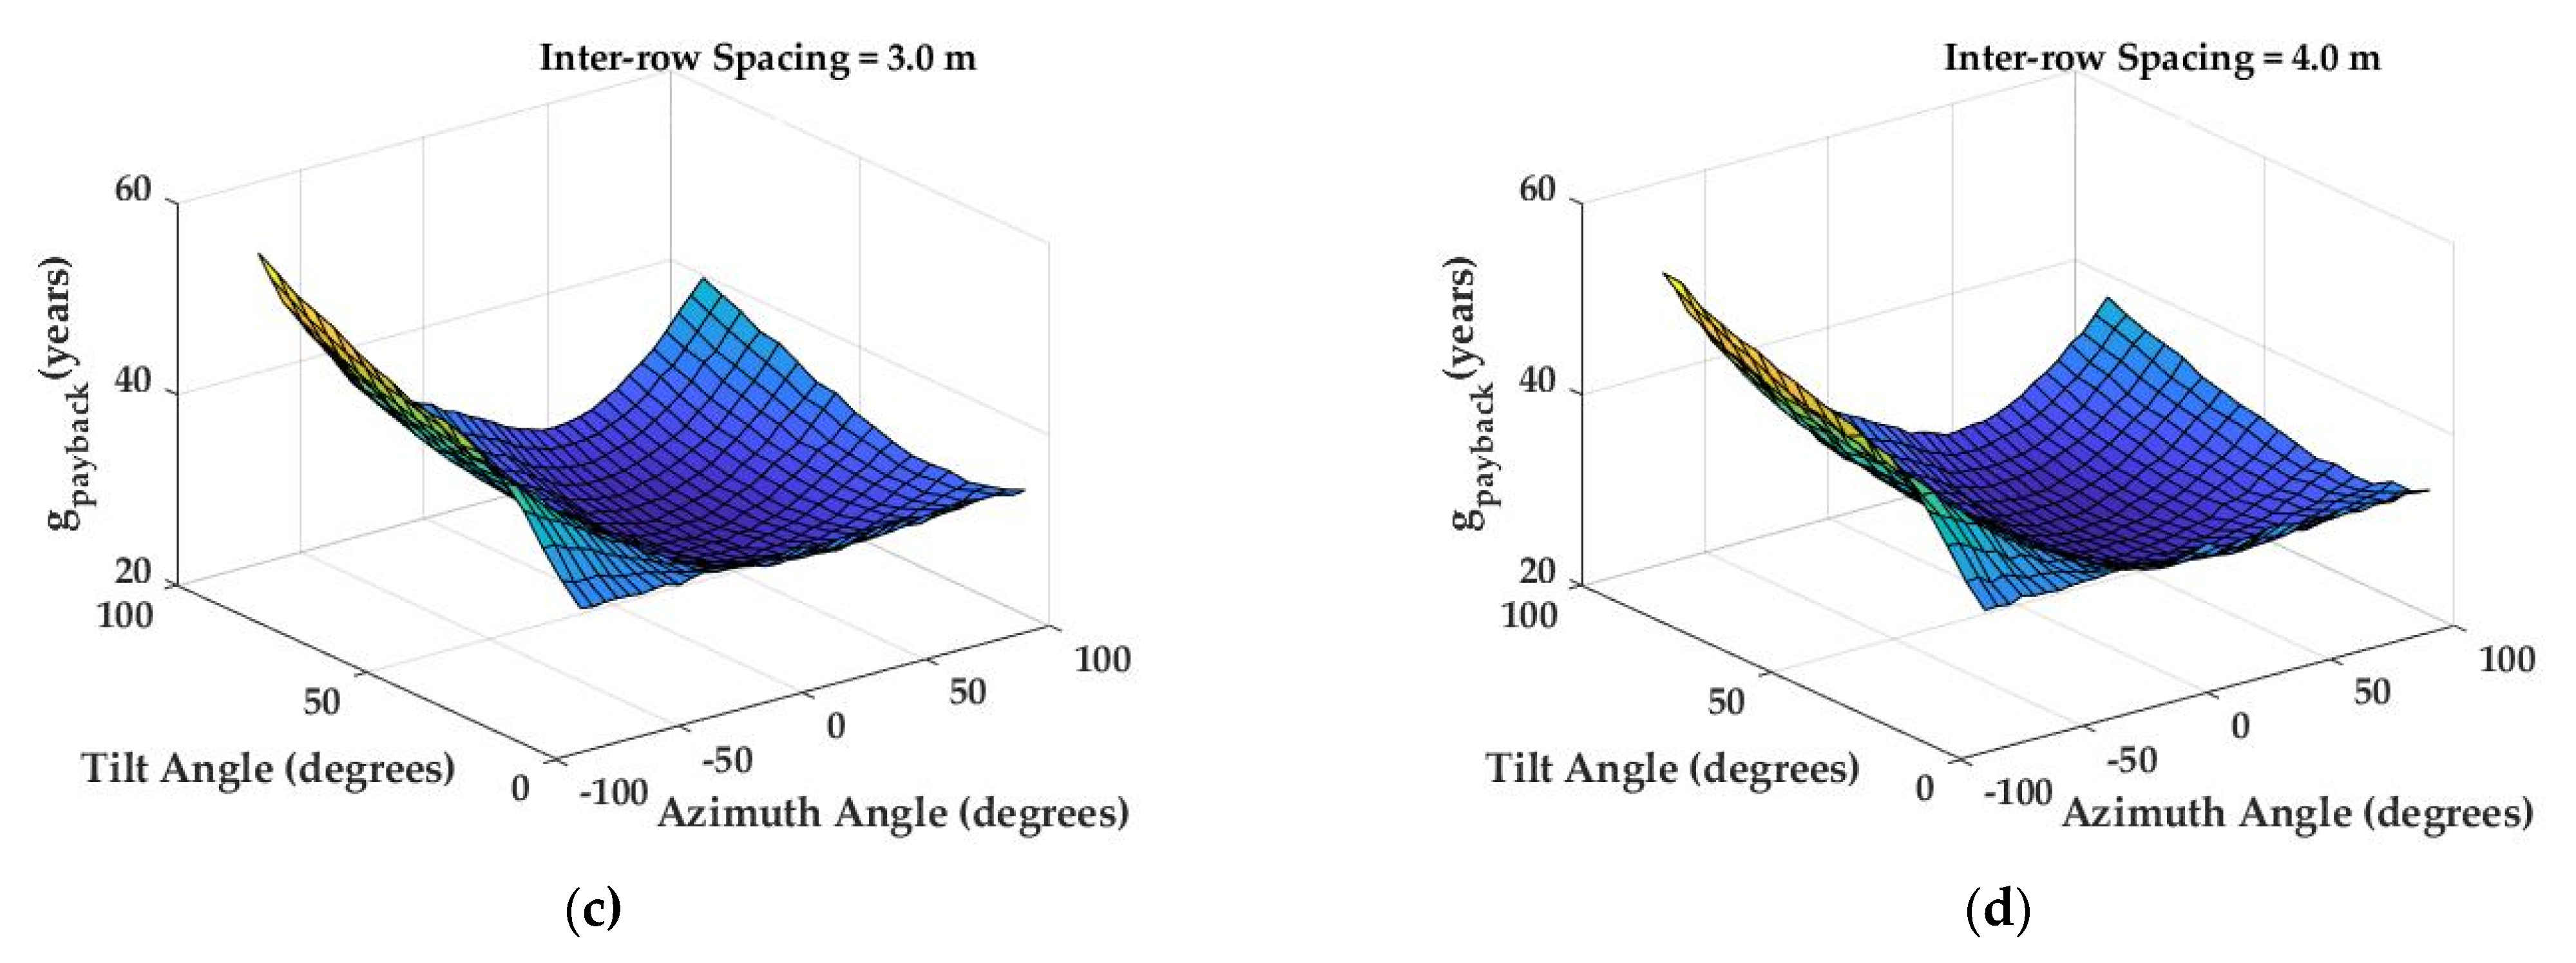
Figure 20, Figure 21 and Figure 22 are intended to aid understanding of objective function changes with controlled variables for the case study buildings. For the resulting simulated surfaces shown in these figures, the surface values between the actual points were approximated with minimal and negligible errors. In addition, the ultimate results of these figures represent the optimal payback years, the values of which are shown clearly in Table 3. The optimal payback years for the installed PV systems on the ADMIN, CAM, and EAS buildings were 22.99, 27.20, and 26.91, respectively.
Obviously, the payback for the CAM building was relatively constant for all the values of tilt angle, azimuth angle, and inter-row spacings. The reason for this is that, as mentioned, out of 185 panels installed on the roofs, only seven panels were installed on the flat rooftop on which their tilt angle, azimuth angle, and inter-row spacing could be changed. However, the rest of the panels were installed on slanted roofs, whose tilt and azimuth angles were fixed and precisely equal to the slope and orientation of those roofs, respectively, with no distance between the arrays. Therefore, the number of installed panels on slanted roofs and their annual electricity generation were always the same over the optimization’s variables in the search space. Furthermore, installing a significant number of PV panels would be impractical due to the shadow created on the flat surface. Consequently, the CAM building was found to have a limited range of payback due to trivial changes in the initial cost and annual output.
In the ADMIN and CAM buildings, as we moved from the optimal tilt angle to the lower tilt angles, the investment cost was found to decrease due to a reduction in the number of PV panels. Conversely, when the tilt angle increased from the optimal value, more panels could be placed on the roof, which would increase the investment cost. Of course, this would increase the system’s power generation and, eventually, income. However, the total increase in investment costs outweighs the positive impact of the annual revenue increase, leading to a higher payback time. Furthermore, changing the PV panels’ orientation towards east or west reduces system output and consequently the annual revenue, while the initial investment does not change much. As a result, the payback time increases. Moreover, changing the azimuth angle in the optimization problem leads to a higher rate increment in the objective function values compared to the tilt angle.
It is also worth noting that the present work can be compared to the Google Project Sunroof. The mentioned calculator from Google provides usable hours of solar energy, available areas for panel installation, and estimates of net money saving using the address it receives from the user. However, it does not provide information regarding how to place panels on the roofs, and more importantly, it can only be used for the addresses in the United States and Puerto Rico [48]. However, the current study’s privilege over the Google Project Sunroof is providing details of the layout of a PV system using optimization algorithms and considering economic aspects. Moreover, the proposed model also works for any city globally because it uses the sky clearness data.

3.5. Payback Time Analysis

In this sub-section, the payback time with and without considering incentives is considered. If governments support the implementation of solar projects, the payback time of the projects will be significantly reduced. Table 5 shows the impact of incentives in Alberta, which were recently cancelled for residential and commercial solar programs ($0.75 per watt) [49,50], considering the optimum layout of the PV system in the three buildings.
The general impression is that applying incentives reduced the payback time by around 27% for the case studies. Although incentives do not significantly increase return on investments, they make the payback period less than the specified PV panels’ expected life, which is twenty years.

4. Discussion

The present work’s results show the developed model’s strength in identifying and classifying roofs because all the rooftops in buildings, regardless of their shape, type, and appearance complexity, were well distinguished. In addition, the obstacles on the roofs were well identified, and their impact on the PV panels’ placement was clear.
In addition, the robustness of the proposed method became apparent when it addressed the non-linearity dilemma using the search space approach. The non-linearity of the system increased when more nonlinear variables, such as the main control variables of tilt and azimuth angles, were added to the optimization equation, and this non-linearity became even more complex due to the addition of other sensitive constraints, such as the number and location of PV panels and irregular roof dimensions. After approximating the optimization space with the discretization method, the proposed approach avoided the local optimal solutions and guaranteed convergence to the global optimal solution.
It should also be noted that the optimization process might be time-consuming because of the large, discretized domain that the optimization algorithm is required to search. That is why the final resolutions of the control variables in this study (such as the tilt and azimuth angles) and inter-row spacing were five degrees and 0.5 m, respectively. The resolution of the discretization process could be easily increased if more computational power is available.
Furthermore, it was seen that shadows could reduce more than half of the PV energy generation in certain cases, such as the EAS building. The shading impacts on the annual output of the PV systems in the ADMIN and CAM buildings, where there were no other tall buildings nearby, was mainly due to the difference in the height of the roofs of buildings. However, for the EAS building, apart from roofs’ different elevations, the presence of numerous obstacles on the roofs and a building taller than the EAS in its vicinity had a significant effect on reducing annual electricity output. Hence, the results revealed the importance of considering the shading effects of different components while calculating solar energy output.
The payback results for the selected buildings illustrate that installing PV systems is not feasible. The reason is that although the price of panels has remarkably decreased in recent decades, the initial cost of the PV installation still far outweighs the revenue of the grid energy-purchase saving. Another reason is the lower price of electricity in Alberta, Canada. If incentives from the government are considered in the economic analysis, the payback period could be significantly reduced. However, the authors did not rely on any incentives in the present study. If such incentives are included in calculations, the economic value of the solar PV could significantly increase, and the payback time may become much more favorable.
Nevertheless, the authors also examined the impact of incentives that have been eliminated in recent years on payback time. The results suggested that incentives at least result in a lower payback period than the panels’ lifespan. It should also be noted that other studies have also reported similar or even worse economic analysis results. For example, based on the cost of electricity at the time of the study, Korsavi et al. [19] also reported a return on investment of more than 40 years. In addition, Christiaanse et al. [17] pointed out that there is no return on investment without a 50% reduction in costs.
Lastly, the present work focused more on the economic and technical aspects of using solar PV systems. Other factors such as environmental impacts or buildings’ healthy living environment, as discussed in [51,52], could also be evaluated in another study.

5. Conclusions

The current study presents an image processing methodology to adapt to different types of rooftops and to mitigate associated challenges; thus, it can specify usable areas before running multi-objective optimization based on the enveloped min–max algorithm. Moreover, the impacts of multiple shading types on the PV panels installations and their energy generations were investigated. Hence, the proposed methodology assisted in achieving the study’s goal to develop a comprehensive design methodology to optimize solar PV installations on building rooftops while considering the detailed and complex rooftops shapes. Three buildings located on the University of Alberta campus were chosen as a case study. The results showed that, with the current situation of panel installation costs and without relying on any incentives, the initial investment could not be returned even with the most optimal arrangement of panels in such buildings in Alberta, Canada.
The extensive assessment and optimization of solar energy potential over rooftops can benefit investors and stakeholders for such a project. In general, the present work can be used in municipalities and commercial and educational buildings.
In future work, the authors will consider system model linearization instead of generating a search space for the optimization algorithm. Additionally, we will consider more details to show the potential applicability of the proposed approach to PV panel optimization. Finally, even though the proposed methodology was demonstrated for three campus buildings, our future goal is to expand this proposed method to city-wide scale applications.

Author Contributions

N.N. developed the optimization model of the rooftop solar layout, executed the simulation experiments, and wrote the manuscript. M.A.-S. contributed to improving the optimization structure and computer vision formulation, helped with writing and reviewing the manuscript, and provided general guidance. Y.Z. contributed to improving various parts of the computer vision simulations and seasonal shading analysis, helped with writing the manuscript. J.N. developed the first versions of the models for obtaining 3D models from Google Maps, the rooftop segmentation/classification, the polygon approximation, the annual shading simulation; and early simulation experiments. A.C.C. helped with improving the early versions of the models and algorithms and contributed to improving the computer vision algorithms and simulations. H.A. provided the system data and advice regarding the optimization model needs. M.V. provided important discussions, perspectives, and advice on industry needs, as well as the buildings’ demand data and interpretations. M.G. supervised this study, conceptualized the framework, acquired the funding, provided overall guidance, contributed to many fruitful discussions on the methodology, and reviewed the manuscript. All authors have read and agreed to the published version of the manuscript.

Funding

This work was supported and funded in by the Energy Management and Sustainable Operations (EMSO) at the University of Alberta (201902-01).

Institutional Review Board Statement

Not Applicable.

Informed Consent Statement

Not Applicable.

Data Availability Statement

The data can be made available upon request.

Acknowledgments

We express our deepest gratitude to members of the University of Alberta’s Energy Management and Sustainable Operations (EMSO), including Michael Versteege, Shannon Leblanc, and Jason Yuzyk of Utilities, for their insight and guidance in this study.

Conflicts of Interest

The authors declare no conflict of interest.

Nomenclature

ADMINAdministrative building
B a n n u a l Annual benefit ($)
B h Hourly benefit ($)
b r Pixel brightness score
b r s c o r e , a v g Yearly average of PV modules brightness scores
CAMCameron Library building
C w Installation cost per watt ( $ / W )
D h Hourly electricity demand
EASEarth and Atmospheric Sciences building
E p u r c h a s e , h Hourly buying price of electricity from the grid
E P V Equivalent present value ($)
E s e l l , h Hourly selling price of surplus electricity
G Output power of the module (W/m2)
G b e a m Beam radiation (W/m2)
G c s Clear-sky radiation (W/m2)
G d i f f Diffuse radiation (W/m2)
G G H Clear-sky global horizontal radiation (W/m2)
G h Hourly electricity generation
  G i m p Imported energy
G o n Extraterrestrial radiation (W/m2)
G PV   system PV system electricity generation
G r e f l Reflected radiation (W/m2)
i Discount or interest rate
I C Initial cost of the photovoltaic system ($)
i f l a t Roof flatness
k t Clear-sky index
L i r Inter-row spacing (m)
L m Length of modules (m)
L s Shadow length on the adjacent row (m)
n Number of years
numNumber of PV panels
n u m s h a d e d Number of shaded PV modules
n u m u n s h a d e d Number of unshaded PV modules
P Nominal power of modules (W)
t time interval
V m a x Maximum overvoltage threshold
V P C C Voltage at the point of common coupling
w m Width of modules (m)
β Surface tilt angle ( ° )
γ Surface azimuth angle ( ° )
δ Declination angle ( ° )
η Efficiency of the PV module
θ Incidence angle ( ° )
θ z Zenith angle ( ° )
v Percentile value
ρ g Surrounding reflectance
ϕ Latitude of the location ( ° )
ω Hour angle ( ° )

Appendix A

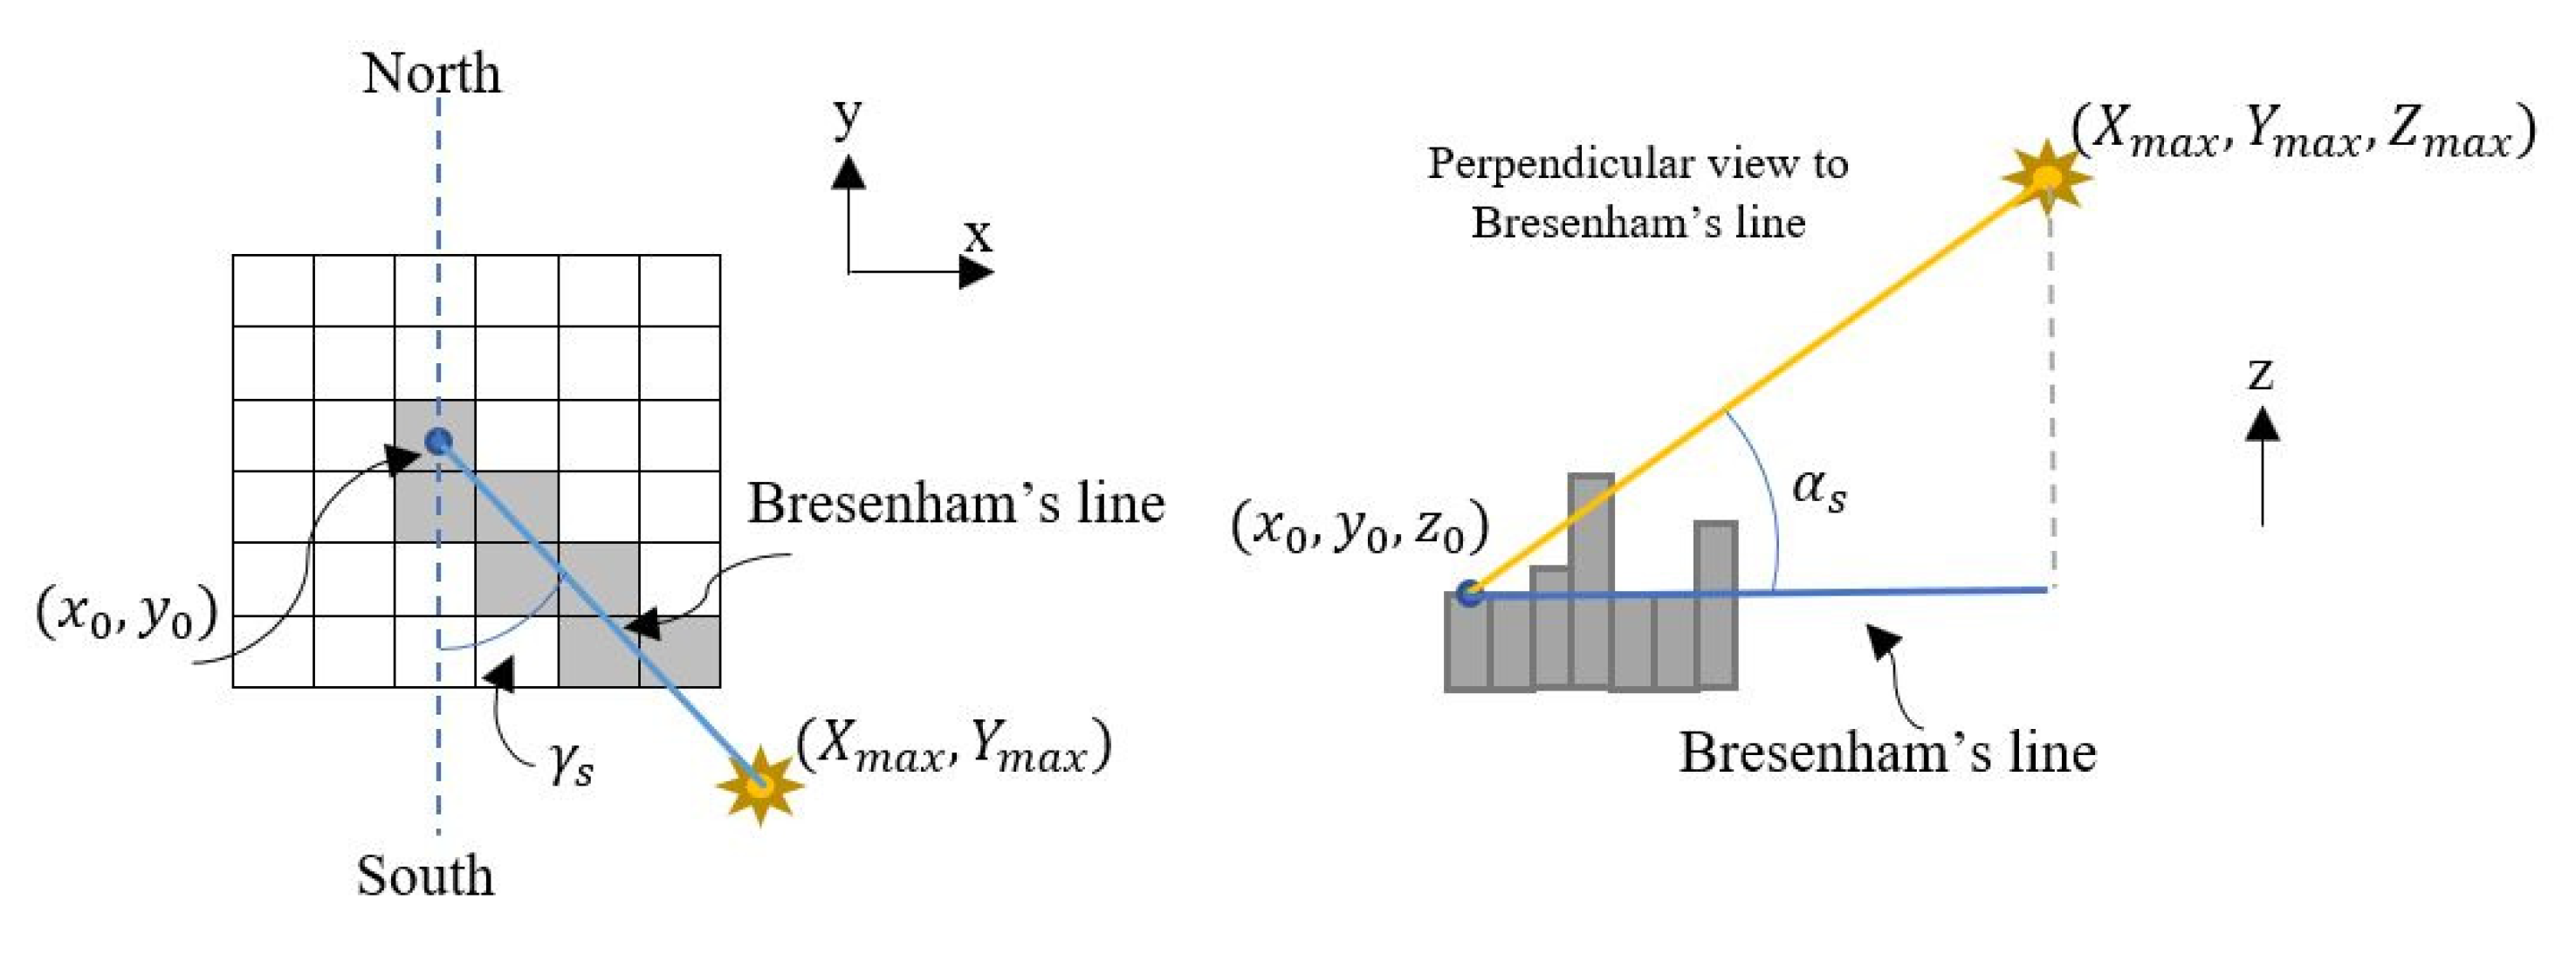
As shown in Figure A1, on a 2D plane, the direction of sun rays can be projected onto the ground. A Bresenham’s line is drawn and connects a reference pixel ( x 0 , y 0 ) to an arbitrary point ( X m a x , Y m a x ) on the projected line of this sunbeam on the XY plane. Based on Bresenham’s line algorithm, the line equation can be written as [53]:
[ x p ,   y p ] = b r e s e n h a m [ ( x o ,   y o ) , ( X m a x , Y m a x ) ]
where x p and y p are the discretized integer values assigned for pixels on the vector that connects ( x 0 ,   y 0 ) to ( X m a x , Y m a x ). Based on x p and y p , pixels along the Bresenham’s line can be specified, as shown in Figure A1 with the gray color. If any building on this line is presented with a height of pixels ( h p ) that is higher than the height of the sun rays’ projection (z component), the sun rays are blocked. Consequently, the reference pixel will be shaded and the brightness score will be zero. Conversely, a pixel with a direct line of sight to the sun will have a brightness score of one. The exact course of action should be repeated for other pixels to find their brightness score.
Figure A1. The Bresenham’s line schematic for the shaded pixels.
Energies 15 01738 g0a1

References

  1. Tian, W.; Heo, Y.; De Wilde, P.; Li, Z.; Yan, D.; Park, C.S.; Feng, X.; Augenbroe, G. A review of uncertainty analysis in building energy assessment. Renew. Sustain. Energy Rev. 2018, 93, 285–301. [Google Scholar] [CrossRef] [Green Version]
  2. Sha, K.; Wu, S. Multilevel governance for building energy conservation in rural China. Build. Res. Inf. 2016, 44, 619–629. [Google Scholar] [CrossRef]
  3. Farenyuk, G. The determination of the thermal reliability criterion for building envelope structures. Teh. Glas. 2019, 13, 129–133. [Google Scholar] [CrossRef]
  4. Yang, H.; Lu, L. The optimum tilt angles and orientations of PV claddings for building-integrated photovoltaic (BIPV) applications. J. Sol. Energy Eng. 2007, 129, 253–255. [Google Scholar] [CrossRef] [Green Version]
  5. Siraki, A.G.; Pillay, P. Study of optimum tilt angles for solar panels in different latitudes for urban applications. Sol. Energy 2012, 86, 1920–1928. [Google Scholar] [CrossRef]
  6. Rowlands, I.H.; Kemery, B.P.; Beausoleil-Morrison, I. Optimal solar-PV tilt angle and azimuth: An Ontario (Canada) case-study. Energy Policy 2011, 39, 1397–1409. [Google Scholar] [CrossRef]
  7. Kaddoura, T.O.; Ramli, M.A.M.; Al-Turki, Y.A. On the estimation of the optimum tilt angle of PV panel in Saudi Arabia. Renew. Sustain. Energy Rev. 2016, 65, 626–634. [Google Scholar] [CrossRef]
  8. Awad, H.; Salim, K.M.E.; Gül, M. Multi-objective design of grid-tied solar photovoltaics for commercial flat rooftops using particle swarm optimization algorithm. J. Build. Eng. 2020, 28, 101080. [Google Scholar] [CrossRef]
  9. Zhong, Q.; Tong, D. Spatial layout optimization for solar photovoltaic (PV) panel installation. Renew. Energy 2020, 150, 1–11. [Google Scholar] [CrossRef]
  10. Perez-Gallardo, J.R.; Azzaro-Pantel, C.; Astier, S.; Domenech, S.; Aguilar-Lasserre, A. Ecodesign of photovoltaic grid-connected systems. Renew. Energy 2014, 64, 82–97. [Google Scholar] [CrossRef] [Green Version]
  11. Awad, H.; Gül, M. Load-match-driven design of solar PV systems at high latitudes in the Northern hemisphere and its impact on the grid. Sol. Energy 2018, 173, 377–397. [Google Scholar] [CrossRef]
  12. Alghamdi, A.S. Potential for rooftop-mounted pv power generation to meet domestic electrical demand in saudi arabia: Case Study of a villa in jeddah. Energies 2019, 12, 4411. [Google Scholar] [CrossRef] [Green Version]
  13. Liu, C.; Xu, W.; Li, A.; Sun, D.; Huo, H. Analysis and optimization of load matching in photovoltaic systems for zero energy buildings in different climate zones of China. J. Clean. Prod. 2019, 238, 117914. [Google Scholar] [CrossRef]
  14. Teofilo, A.; Radosevic, N.; Tao, Y.; Iringan, J.; Liu, C. Investigating potential rooftop solar energy generated by Leased Federal Airports in Australia: Framework and implications. J. Build. Eng. 2021, 41, 102390. [Google Scholar] [CrossRef]
  15. Behura, A.K.; Kumar, A.; Rajak, D.K.; Pruncu, C.I.; Lamberti, L. Towards better performances for a novel rooftop solar PV system. Sol. Energy 2021, 216, 518–529. [Google Scholar] [CrossRef]
  16. Litjens, G.; Worrell, E.; Van Sark, W. Influence of demand patterns on the optimal orientation of photovoltaic systems. Sol. Energy 2017, 155, 1002–1014. [Google Scholar] [CrossRef] [Green Version]
  17. Christiaanse, T.V.; Loonen, R.C.G.M.; Evins, R. Techno-economic optimization for grid-friendly rooftop PV systems–A case study of commercial buildings in British Columbia. Sustain. Energy Technol. Assess. 2021, 47, 101320. [Google Scholar] [CrossRef]
  18. Awan, A.B.; Alghassab, M.; Zubair, M.; Bhatti, A.R.; Uzair, M.; Abbas, G. Comparative Analysis of Ground-Mounted vs. Rooftop Photovoltaic Systems Optimized for Interrow Distance between Parallel Arrays. Energies 2020, 13, 3639. [Google Scholar] [CrossRef]
  19. Korsavi, S.S.; Zomorodian, Z.S.; Tahsildoost, M. Energy and economic performance of rooftop PV panels in the hot and dry climate of Iran. J. Clean. Prod. 2018, 174, 1204–1214. [Google Scholar] [CrossRef]
  20. Tiwari, A.; Meir, I.A.; Karnieli, A. Object-based image procedures for assessing the solar energy photovoltaic potential of heterogeneous rooftops using airborne LiDAR and orthophoto. Remote Sens. 2020, 12, 223. [Google Scholar] [CrossRef] [Green Version]
  21. Google Maps. Available online: https://www.google.com/maps/@53.526864,-113.5241896,552m/data=!3m1!1e3 (accessed on 17 November 2021).
  22. Nofech, J.; Narjabadifam, N.; Awad, H.; Gül, M. Mapping the solar roof potential of the North Campus buildings at the University of Alberta. In Proceedings of the 8th European Conference on Renewable Energy Systems, Istanbul, Turkey, 24–25 August 2020. [Google Scholar]
  23. Karlsson, B. RenderDoc Version 1.1. 2019. Available online: https://renderdoc.org/ (accessed on 29 June 2021).
  24. Blender Foundation. Blender: A 3D Modelling and Rendering Package; Version 2.81, Stichting; Blender Foundation: Amsterdam, The Netherlands, 2019; Available online: https://www.blender.org/ (accessed on 29 June 2021).
  25. Michel, E. Maps Models Importer. GitHub Repository. 2019. Available online: https://github.com/eliemichel/MapsModelsImporter (accessed on 29 June 2021).
  26. Soille, P. Morphological Image Analysis: Principles and Applications; Springer Science & Business Media: Berlin/Heidelberg, Germany, 2013; pp. 173–174. [Google Scholar]
  27. Solomon, C.; Breckon, T. Fundamentals of Digital Image Processing: A Practical Approach with Examples in Matlab; John Wiley & Sons: Hoboken, NJ, USA, 2012. [Google Scholar]
  28. Langford, E. Quartiles in elementary statistics. J. Stat. Educ. 2006, 14. [Google Scholar] [CrossRef]
  29. Van Den Boomgaard, R.; Van Balen, R. Methods for fast morphological image transforms using bitmapped binary images. CVGIP Graph. Model. Image Process. 1992, 54, 252–258. [Google Scholar] [CrossRef]
  30. Sreedhar, K.; Panlal, B. Enhancement of images using morphological transformation. arXiv 2012, arXiv:1203.2514. [Google Scholar] [CrossRef]
  31. Beyerer, J.; León, F.P.; Frese, C. Machine Vision: Automated Visual Inspection: Theory, Practice and Applications; Springer: Berlin/Heidelberg, Germany, 2015; ISBN 3662477947. [Google Scholar]
  32. Duffie, J.A.; Beckman, W.A. Solar Engineering of Thermal Processes, 4th ed.; John Wiley & Sons: Hoboken, NJ, USA, 2013. [Google Scholar]
  33. Awad, H. Integrating Solar PV Systems into Residential Buildings in Cold-climate Regions: The Impact of Energy-efficient Homes on Shaping the Future Smart Grid. Ph.D. Thesis, Univeristy of Alberta, Edmonton, AB, Canada, 2018. [Google Scholar]
  34. Badescu, V. Verification of some very simple clear and cloudy sky models to evaluate global solar irradiance. Sol. Energy 1997, 61, 251–264. [Google Scholar] [CrossRef]
  35. Kacira, M.; Simsek, M.; Babur, Y.; Demirkol, S. Determining optimum tilt angles and orientations of photovoltaic panels in Sanliurfa, Turkey. Renew. Energy 2004, 29, 1265–1275. [Google Scholar] [CrossRef]
  36. Bany, J.; Appelbaum, J. The effect of shading on the design of a field of solar collectors. Sol. cells 1987, 20, 201–228. [Google Scholar] [CrossRef]
  37. van Vuuren, D.J.; Marnewick, A.L.; Pretorius, J.H.C. A Financial Evaluation of a Multiple Inclination, Rooftop-Mounted, Photovoltaic System Where Structured Tariffs Apply: A Case Study of a South African Shopping Centre. Energies 2021, 14, 1666. [Google Scholar] [CrossRef]
  38. Dağtekin, M.; Kaya, D.; Öztürk, H.H.; Kiliç, F.Ç. A study of techno-economic feasibility analysis of solar photovoltaic (PV) power generation in the province of Adana in Turkey. Energy Explor. Exploit. 2014, 32, 719–735. [Google Scholar] [CrossRef] [Green Version]
  39. Kornelakis, A.; Marinakis, Y. Contribution for optimal sizing of grid-connected PV-systems using PSO. Renew. Energy 2010, 35, 1333–1341. [Google Scholar] [CrossRef]
  40. Al-Saffar, M.; Musilek, P. Reinforcement learning-based distributed BESS management for mitigating overvoltage issues in systems with high PV penetration. IEEE Trans. Smart Grid 2020, 11, 2980–2994. [Google Scholar] [CrossRef]
  41. Thebault, M.; Gaillard, L. Optimization of the integration of photovoltaic systems on buildings for self-consumption–Case study in France. City Environ. Interact. 2021, 10, 100057. [Google Scholar] [CrossRef]
  42. White, J.A.; Grasman, K.S.; Case, K.E.; Needy, K.L.; Pratt, D.B. Fundamentals of Engineering Economic Analysis; John Wiley & Sons: Hoboken, NJ, USA, 2020; ISBN 1118881060. [Google Scholar]
  43. Budget 2020: A Plan for Jobs and the Economy—Open Government. Available online: https://open.alberta.ca/dataset/budget-2020 (accessed on 1 October 2021).
  44. CanadianSolar Datasheet. Available online: https://static.csisolar.com/wp-content/uploads/2019/12/07162836/CS-Datasheet-HiKu_CS3W-P_EN.pdf (accessed on 21 June 2021).
  45. Constante-Flores, G.E.; Illindala, M.S. Data-driven probabilistic power flow analysis for a distribution system with renewable energy sources using Monte Carlo simulation. IEEE Trans. Ind. Appl. 2018, 55, 174–181. [Google Scholar] [CrossRef]
  46. POWER|Data Access Viewer. Available online: https://power.larc.nasa.gov/data-access-viewer/ (accessed on 10 August 2021).
  47. PVWatts Calculator. Available online: https://pvwatts.nrel.gov/pvwatts.php (accessed on 1 October 2021).
  48. Project Sunroof. Available online: https://sunroof.withgoogle.com/ (accessed on 28 January 2022).
  49. Residential and Commercial Solar Program—EnergyRates.ca. Available online: https://energyrates.ca/alberta/residential-commercial-solar-program/ (accessed on 13 November 2021).
  50. Residential and Commercial Solar Program in Alberta. Available online: https://alberta-solar-installers.ca/program-types/residential-and-commercial-solar-program-in-alberta (accessed on 13 November 2021).
  51. Prada, M.; Prada, I.F.; Cristea, M.; Popescu, D.E.; Bungău, C.; Aleya, L.; Bungău, C.C. New solutions to reduce greenhouse gas emissions through energy efficiency of buildings of special importance–Hospitals. Sci. Total Environ. 2020, 718, 137446. [Google Scholar] [CrossRef] [PubMed]
  52. Bungău, C.C.; Prada, I.F.; Prada, M.; Bungău, C. Design and operation of constructions: A healthy living environment-parametric studies and new solutions. Sustainability 2019, 11, 6824. [Google Scholar] [CrossRef] [Green Version]
  53. Bresenham, J.E. Algorithm for computer control of a digital plotter. IBM Syst. J. 1965, 4, 25–30. [Google Scholar] [CrossRef]
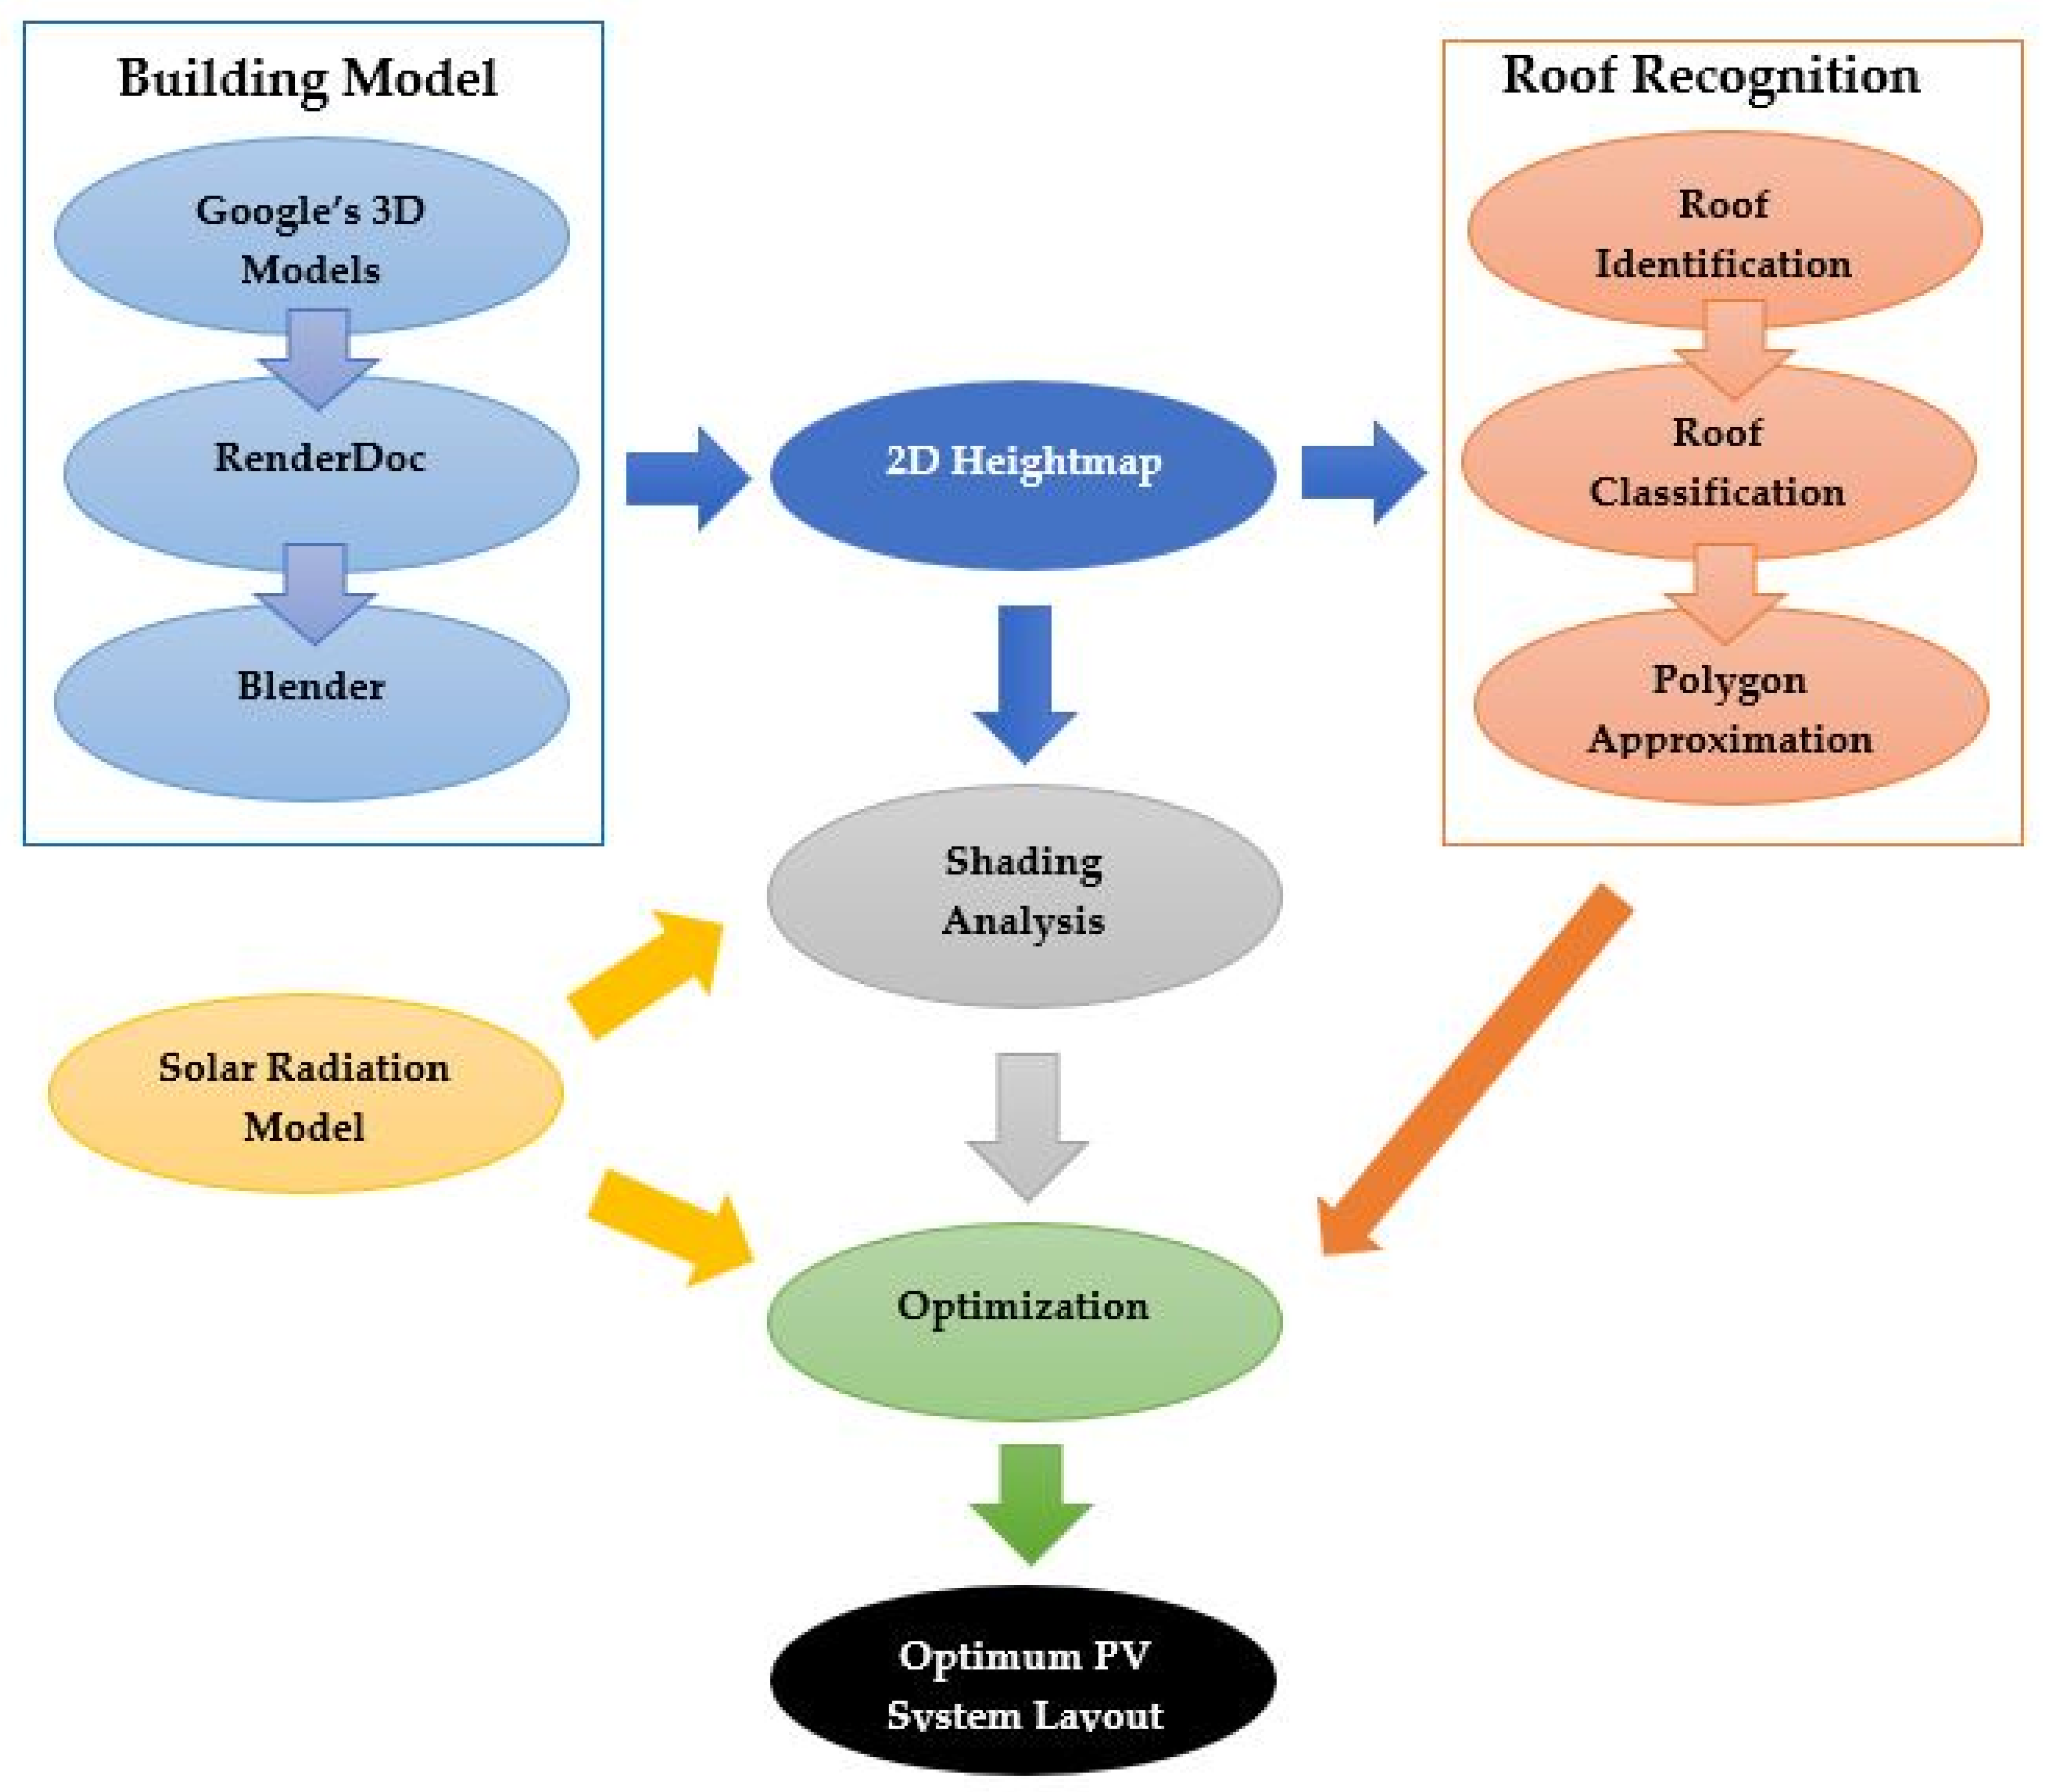
Figure 1. General procedure of the current study.
Energies 15 01738 g001
Figure 2. Obtaining a low ridge: (a) hypothetical butterfly roof, (b) linear morphological structuring element and heightmap of a blob, and (c) binary map of a low ridge.
Energies 15 01738 g002
Figure 3. Schematic of PV system with shading.
Energies 15 01738 g003
Figure 4. Schematic of pixels shading scores and two panels.
Energies 15 01738 g004
Figure 5. Hourly demand profiles of the three buildings during March 2019.
Energies 15 01738 g005
Figure 6. (a) Google Maps model of the ADMIN with textures (Imagery ©2021 Google, Imagery ©2021 Maxar Technologies, Map data ©2021) and (b) the extracted heightmap in pixels.
Energies 15 01738 g006
Figure 7. ADMIN building (a) satellite image (Imagery ©2021 Google, Imagery ©2021 Maxar Technologies, Map data ©2021), (b) binary map before roof identification, and (c) binary map after roof identification.
Energies 15 01738 g007
Figure 8. CAM building (a) satellite image (Imagery ©2021 Google, Imagery ©2021 Maxar Technologies, Map data ©2021), (b) binary map before roof identification, and (c) binary map after roof identification.
Energies 15 01738 g008
Figure 9. Rooftop classification result of (a) ADMIN building and (b) CAM building.
Energies 15 01738 g009
Figure 10. (a) Rooftop IDs of the ADMIN building and (b) Rooftop IDs of the CAM building. (Imagery ©2021 Google, Imagery ©2021 Maxar Technologies, Map data ©2021).
Energies 15 01738 g010
Figure 11. Average brightness score for the ADMIN building in (a) spring, (b) summer, (c) fall, and (d) winter.
Energies 15 01738 g011
Figure 12. Average brightness score for the CAM building in (a) spring, (b) summer, (c) fall, and (d) winter.
Energies 15 01738 g012
Figure 13. Average brightness score for the EAS building in (a) spring, (b) summer, (c) fall, and (d) winter.
Energies 15 01738 g013
Figure 14. Comparison of the clear-sky global horizontal radiation of current study and that of NASA.
Energies 15 01738 g014
Figure 15. Comparison of annual generation obtained from code and PVWatts for the ADMIN building.
Energies 15 01738 g015
Figure 16. Optimum layout of PV systems for (a) the ADMIN building, (b) the CAM building, and (c) the EAS building.
Energies 15 01738 g016
Figure 17. Comparison of PV module layout for the ADMIN building (a) without and (b) with shading analysis.
Energies 15 01738 g017
Figure 18. Comparison of PV module layout for the CAM building (a) without and (b) with shading analysis.
Energies 15 01738 g018
Figure 19. Comparison of PV module layout for the EAS building (a) without and (b) with shading analysis.
Energies 15 01738 g019
Figure 20. Objective function variation with tilt and azimuth angles for the ADMIN building for (a)   L i r of 1.0 m, (b)   L i r of 2.0 m, (c)   L i r of 3.0 m, and (d)   L i r of 4.0 m.
Energies 15 01738 g020
Figure 21. Objective function variation with tilt and azimuth angles for the CAM building for (a)   L i r of 1.0 m, (b)   L i r of 2.0 m, (c)   L i r of 3.0 m, and (d)   L i r   of 4.0 m.
Energies 15 01738 g021
Figure 22. Objective function variation with tilt and azimuth angles for the EAS building for (a)   L i r of 1.0 m, (b)   L i r of 2.0 m, (c)   L i r of 3.0 m, and (d)   L i r of 4.0 m.
Energies 15 01738 g022aEnergies 15 01738 g022b
Table 1. Confidence scores for CAM building rooftops.
Roof IDConfidence Scores
10.756
20.856
30.828
40.865
50.810
60.839
70.927
80.906
90.859
100.824
110.866
120.873
130.850
140.853
150.950
160.000
Table 2. Optimum obtained values for three variables of the optimization objective.
Optimum Values of Variables
VariableADMIN *CAM **EAS ***
L i r (m)2.02.02.0
γ (degrees)202015
β (degrees)455050
* ADMIN: Administration Building; ** CAM: Cameron Library Building; *** EAS: Earth and Atmospheric Sciences Building.
Table 3. Payback years based on the annual energy generation and the number of installed panels for ADMIN, CAM, and EAS buildings.
BuildingAnnual Energy Generation (MWh)Number of PanelsPayback (Years)
ADMIN *35.137322.99
CAM **75.2818527.20
EAS ***41.9510226.91
* ADMIN: Administration Building; ** CAM: Cameron Library Building; *** EAS: Earth and Atmospheric Sciences Building.
Table 4. Comparison of obstacles shading effect on the PV systems’ generation and modules numbers.
BuildingPanels Number with Obstacles ShadingPanels Number without Obstacles ShadingPV System Annual Output (MWh) with Obstacles ShadingPV System Annual Output (MWh) without Obstacles ShadingPercentage of Generation Difference (%)
ADMIN *738035.1348.8828.13
CAM **18523075.28123.0638.83
EAS ***10217841.95107.9761.14
* ADMIN: Administration Building; ** CAM: Cameron Library Building; *** EAS: Earth and Atmospheric Sciences Building.
Table 5. Payback time considering incentives for optimum layout of a PV system in the ADMIN, CAM, and EAS buildings.
BuildingPayback without Incentives (Years)Payback with Incentives (Years)
ADMIN *22.9916.82
CAM **27.2019.90
EAS ***26.9119.69
* ADMIN: Administration Building; ** CAM: Cameron Library Building; *** EAS: Earth and Atmospheric Sciences Building.
Publisher’s Note: MDPI stays neutral with regard to jurisdictional claims in published maps and institutional affiliations.