Article

Raman Spectroscopy Characterization of Mineral Oil and Palm Oil with Added Multi-Walled Carbon Nanotube for Application in Oil-Filled Transformers

by
Nur Sabrina Suhaimi
,
Mohd Taufiq Ishak
*,
Muhamad Faiz Md Din
,
Fakhroul Ridzuan Hashim
and
Abdul Rashid Abdul Rahman
Department of Electrical and Electronic Engineering, Faculty of Engineering, National Defence University of Malaysia, Kuala Lumpur 57000, Malaysia
*
Author to whom correspondence should be addressed.
Energies 2022, 15(4), 1534; https://doi.org/10.3390/en15041534
Submission received: 13 January 2022 / Revised: 27 January 2022 / Accepted: 27 January 2022 / Published: 19 February 2022
(This article belongs to the Special Issue High Voltage Insulating Materials-Current State and Prospects 2022)

Abstract

:
This century is experiencing a generation of nanotechnologies that makes use of the remarkable properties of nanofluids in applications such as electrical systems, industrialization, and others. In this paper, mineral oil (MO) and palm oil (PO), with multi-walled carbon nanotube (CNT), have been synthesized for use in oil-filled transformer applications. This research aims to use Raman characterization to assess the feasibility of CNT nanofluids samples at 0.02 g/L and 0.03 g/L concentrations. The chemical structure bonding that exists in the Raman band between 700 cm−1 and 3100 cm−1 regions is identified and analyzed, accordingly. After baseline removal and normalization, the precision band location and intensity of oil samples are fitted with a Gaussian profile. It was discovered that the peak at ~1440 cm−1 has the highest intensity for six oil samples, which is attributed to the (C–H) methylene scissors vibration of the CH2 group. Based on the FWHM profile and integrated area under the curve of PO, it was discovered that CNT contributes to the structural stability defect of PO. Principal component analysis (PCA) is also used in this study to classify different samples based on chemical composition and identify the spectral characteristics with the highest degree of variability.

1. Introduction

Recently, there has been a rising interest in expanding the use of biodegradable vegetable oils in transformer applications, mostly due to environmental as well as health and safety concerns that have arisen as a result of changes in economic and supply constraints. Because of its non-toxicity, biodegradability, resource renewability, affordable cost, and high viscosity index, many researchers have discussed the use of palm oil (PO) as insulating oil [1,2,3,4]. As the world’s second-largest manufacturer behind Indonesia, PO production is critical for the Malaysian economy. Palm oil plants were originally introduced to Malaysia at the beginning of the 1870s, and the PO industry has since broadened its export market to more than 140 nations [5]. Existing technologies have extended product yields and allowed trade to traverse borders, particularly between Malaysia and other nations.
Several studies have recently been conducted by dispersing various types of nanoparticles in insulating oil for transformer applications known as nanofluid [6,7,8]. For example, Ram A. et al. investigated the electrical efficiency of two nanoparticles (Al2O3 and ZnO) following dispersion in three different kinds of vegetable oil (sunflower oil, rice bran oil, and corn oil) at varied volume concentration ratios and discovered that both nanoparticles react positively and effectively [9]. Furthermore, Asse et al. [10] investigated the effect of FeO3 on the breakdown voltages of palm kernel oil methyl esters in 2022, resulting in a 40% improvement in AC breakdown voltage when compared to conventional transformer oil. Vegetable oil is a better option for transformer mineral oil since it has higher oxidation stability and less gas generation during the reaction, as well as improved dielectric and thermal properties. Hence, the suspension of nanoparticles is expected to provide better insulation and cooling attributes than conventional transformer oil. Besides, nanofluids are recognized in the dielectric community as a potential replacement liquid insulation for transformers.
Therefore, in this study, multi-walled carbon nanotubes (CNT) are dispersed in conventional transformer oil, petroleum-based mineral oil (MO), and proposed vegetable oil; palm-based oil (PO), respectively. CNT, which was discovered by Sumio Iijima in 1991 [11], has received the interest of researchers due to its hexagonal lattice, exceptional durability, tuneable electrical behavior, ballistic electron transport, excellent field emission, current carrying capacity outweighing superconductors, and many more. According to previous literature, CNT has a clear and consistent potential to improve MO in aspects of AC breakdown voltage and lightning impulse performance [12,13]. CNT has proven to be a one-of-a-kind system for analyzing spectra in one-dimensional systems, while Raman spectroscopy has developed immensely effective equipment for the characterization of the sample’s molecules. Many features in the Raman spectra of CNT can be identified with specific phonon modes and Raman scattering processes that contribute to each feature.

2. Materials and Methods

2.1. Materials

For the purpose of the research, Hyrax petroleum-based mineral oil (MO) and refined, bleached, and deodorized palm oil (PO) from Aliff manufacturers were used as the main oils, to which CNTs were added in this study. For each oil, two concentrations of CNT, 0.02 g/L and 0.03 g/L were dispersed, measured, and analyzed accordingly.

2.2. Preparation of Nanofluids

The purification process is a compulsory requirement before dispersing or testing oil for transformer application. The purification procedure began with the filtering of MO and PO three times with a Nalgene Rapid-Flow disposable filter with a pore size of 0.2 µm. Filtering is a critical step for eliminating solid particles, and failure to do so can lead to future transformer defects such as arcing, overheating, corona discharges, and other complications. Following the filtration procedure, the CNT was weighed at 0.02 g/L and 0.03 g/L concentrations and added to the oil samples. The oil-CNT mixture was swirled for 30 min at room temperature with 520 rpm agitation using a magnetic stirrer. The resultant mixture was then put in a Q700 sonicator with 40% rated power, 20 kHz capability, and a power rating of 700 W for 120 min. During the preparation of nanofluids, most researchers utilized magnetic stirring techniques in conjunction with the sonication process to produce a homogeneous dispersion and prevent cluster formation, respectively. The mixture, also defined as a CNT nanofluid, was heated and degassed for 24 h in a vacuum drying oven adjusted to 60 °C and 10 Mbar after the sonication process [12,13]. Drying and degassing methods effectively remove moisture from the oil, which prevents oxidation, dissolved combustible gas, and physical contamination during testing.

2.3. Raman Spectroscopy Analysis

In general, Raman spectroscopy is a measurement technique that utilizes a laser light source that illuminates a sample to observe and identify the vibrational structure of molecules. When a photon resonates with the functional groups of a sample molecule, Raman scattering generally occurs, and when a high-powered laser is used as the light source, the component of interest can indeed be positioned further away than the one with proximity spectroscopy. Raman spectroscopy is a low-cost detection system that is much cheaper than DGA analysis for diagnosing faults in transformer oil. Raman is also a sensitive method for detecting changes in transformer oil components. Furthermore, Raman can help determine the structural stability of liquid after being modified with nanomaterial [14]. Therefore, Raman spectroscopy is a promising approach and technique for determining the precise structural parameters of oil samples. Besides, Raman spectroscopy is extensively utilized in many disciplines of research to analyze and identify the components of a material. Several studies on molecular or component identification have previously been conducted, such as quantitative aging diagnostics of oil-paper insulation, assessing insulation performance, and others [15,16,17,18,19].
In the insulation world, researchers typically used Raman to detect furfural dissolving in transformer oil because multiple materials can be detected simultaneously using a single-frequency laser. Prior to qualitative and quantitative analysis, Chen et al. [17] extracted the vibrational modes of furfural molecules in 2016. Somekawa et al. [18] also performed Raman spectroscopy to diagnose faults in transformer oil that would otherwise require complex and time-consuming procedures. The Raman peak assigned by Somekawa et al. is at 1612 cm−1, 1478 cm−1 and 1573 cm−1 (C=C stretching mode), 1660–1715 cm−1 (C=O stretching mode), 1372 cm−1 (H–C–C/O bending mode), and 1398 cm−1 (C–C stretching mode) respectively. The aromatic content and acidity of transformer oil increase as it ages, giving rise to C=O and C=C bonds. Dehydrogenation of naphthenic compounds results in the formation of conjugated C=C double bonds. Therefore, Section 2 of this paper addresses the nanofluid sample preparation method and Raman spectroscopy measurement procedure, while Section 3 addresses the results and discussion.
The Raman Spectrometer Microscope utilizes the inelastic scattering of light to analyze the chemical composition and energy band gap of the molecule. It is a highly successful technique for determining the detailed structure of bonding quality for oil samples under diverse circumstances. Renishaw Raman instruments, including an In Via confocal Raman microscope, a combination/hybrid system (SEM-Raman and SPM/AFM-Raman), a portable Raman analyzer (RA100 fiber probe device), and Renishaw’s WiRETM (Window-based Raman Environment) software is implemented in this study to provide specific data processing and analysis tools.
For experimental set-up, 785 nm laser excitation sources with 1200 lines/mm grating, 10 s time of exposure, and 1% laser power were applied in this research. Once monochromatic light (laser) interacts with the target sample, the interaction between photons and the composition of oil sample molecules scatters the incident light, resulting in Raman scattering. The amount of energy transmitted indicates the vibrational and/or rotational energy of the molecular bonds in the sample. Each Raman data extract from oil samples is analyzed using WiRETM and Origin2021 specialized software, which includes denoising, baseline correction, and multiple peak curve fitting analysis. Principal component analysis (PCA) was performed using the SIMCA 17 multivariate data analysis software.

3. Results

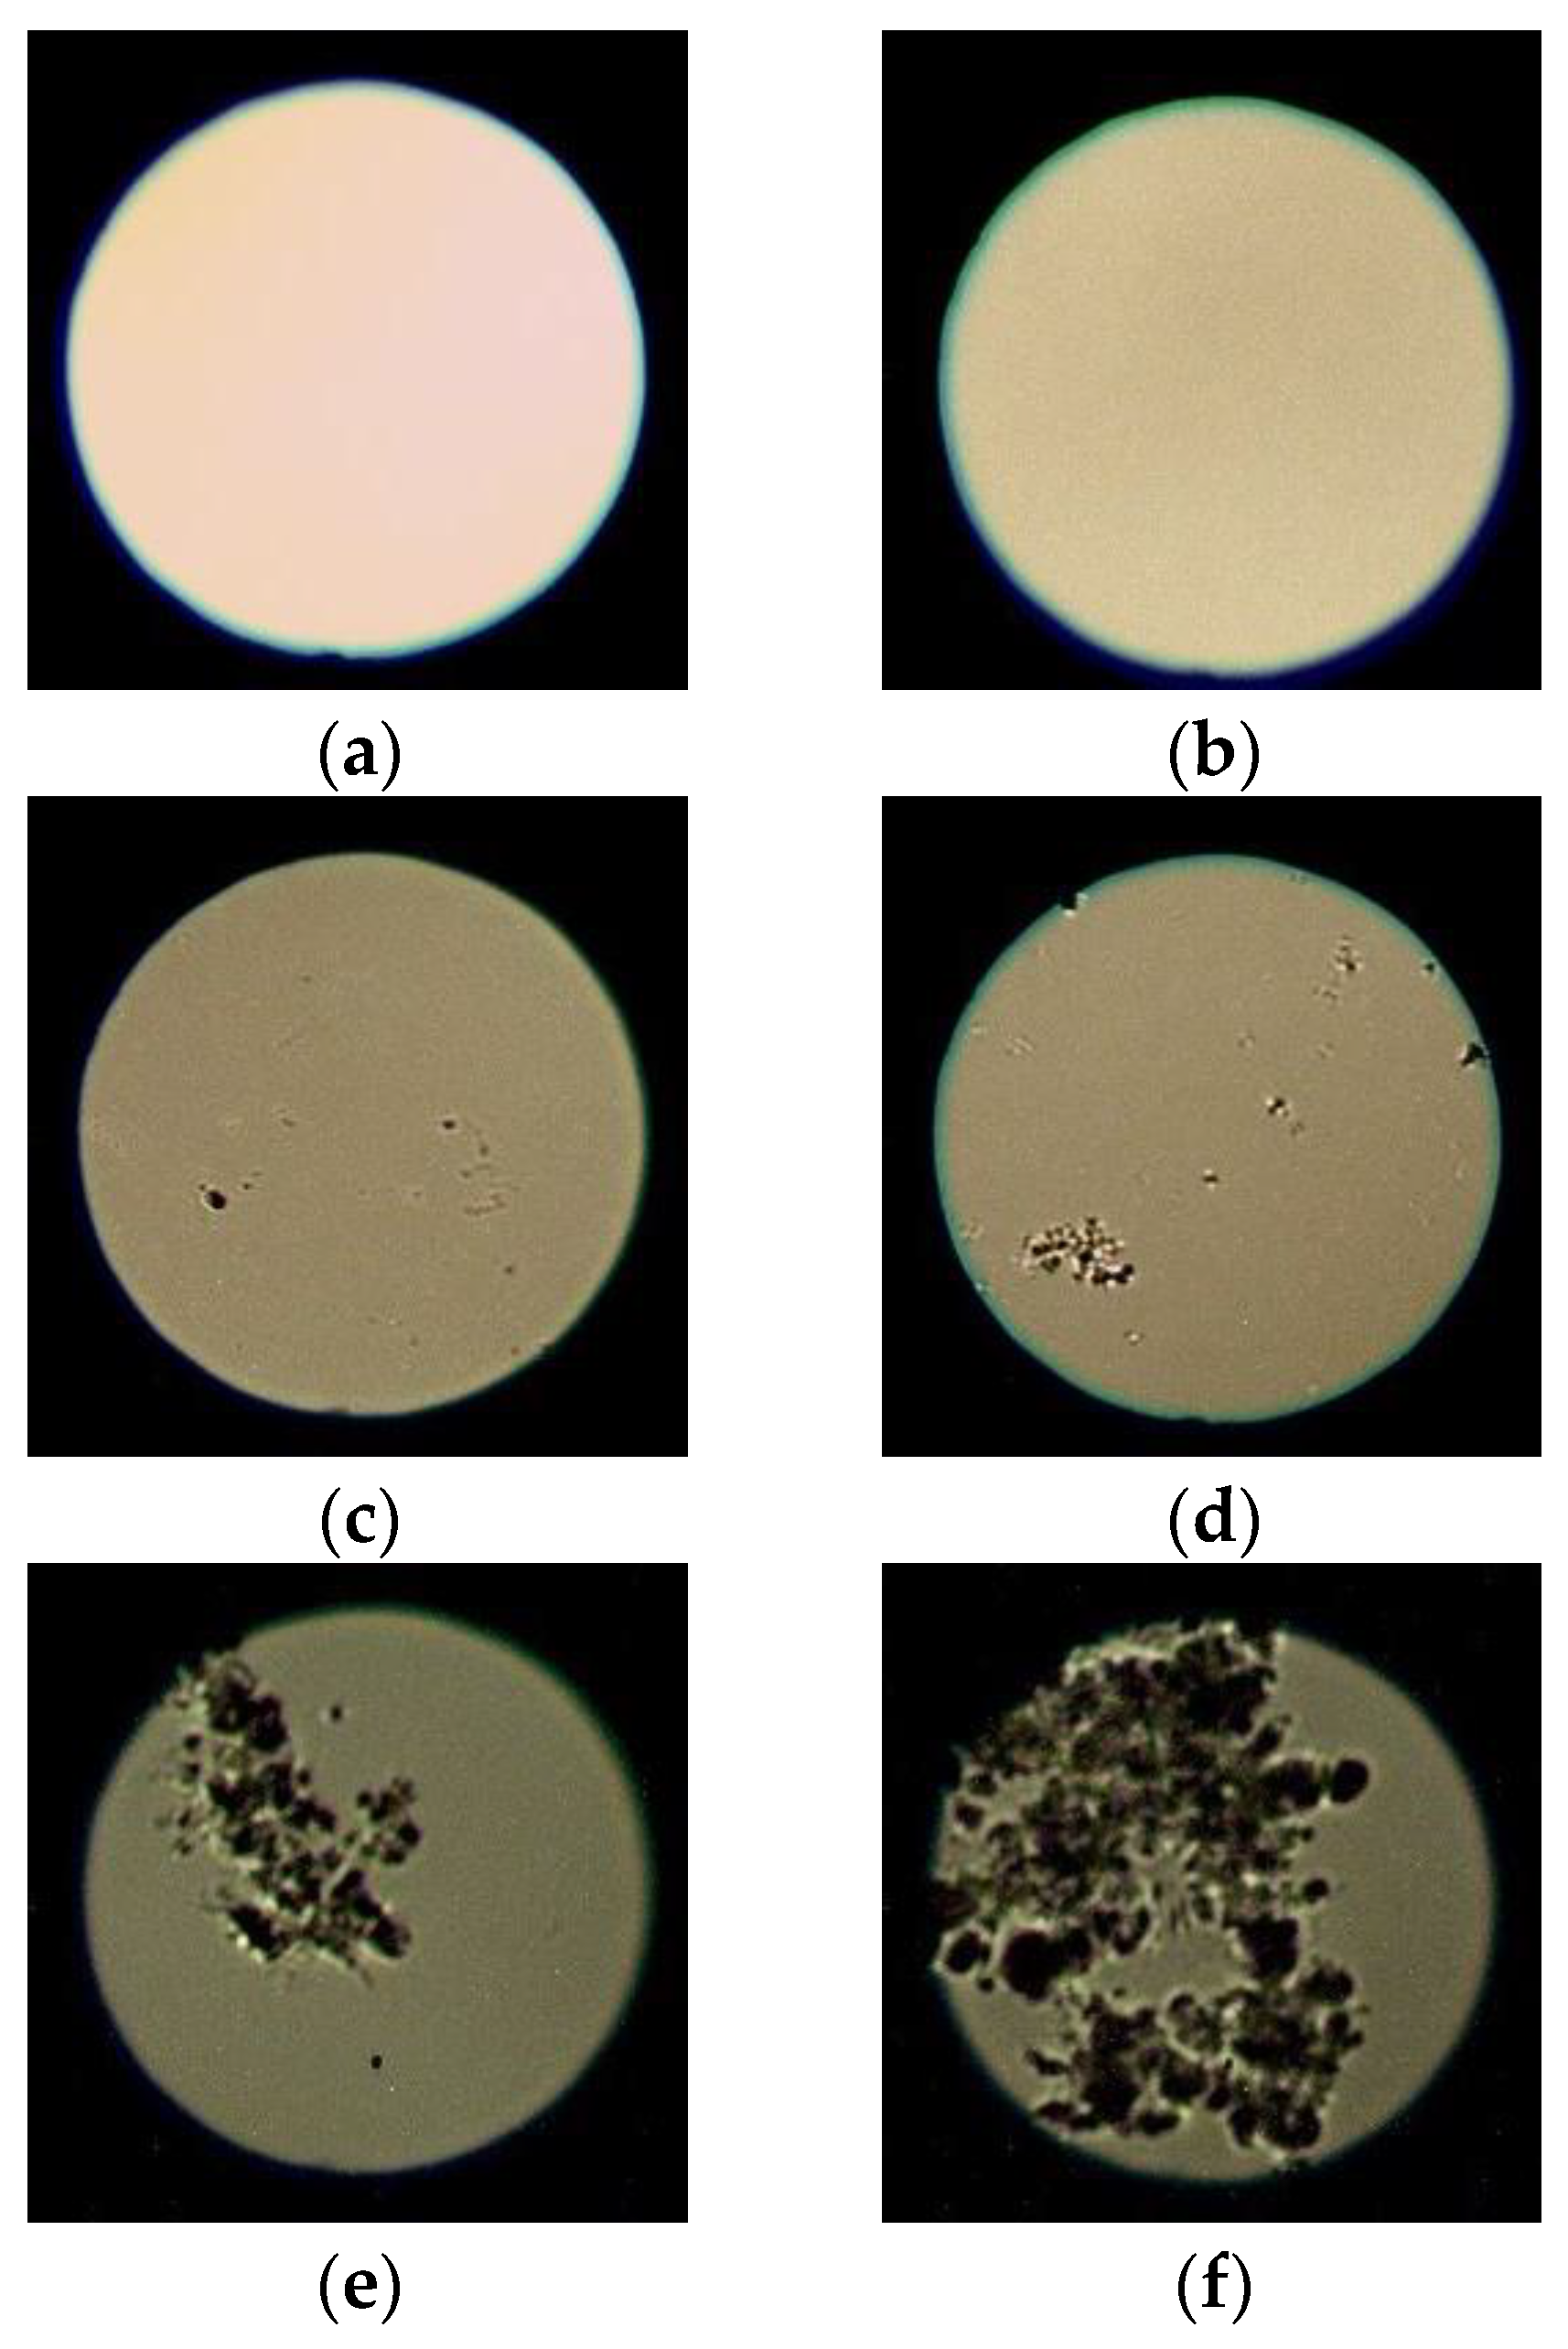
3.1. Raman Optical Images

The optical images of oil samples measured by Raman microscope are equipped with bright-field illumination and some imaging techniques (fluorescence imaging and scanning electron microscopy) to obtain a fast-optical sample overview. The laser of Raman also assists in illuminating a circular region on the sample. Hence, it could produce a 2D dimensional Raman image, as shown in Figure 1.
Referring to Figure 1a,b, it is clear that there are no additional or black particles visible in the optical image. While Figure 1c,d present some obvious black particles, which might represent CNT particles. In comparison to Figure 1c,d, the presence of CNT is quite high in Figure 1e,f. PO samples may have native CNT agglomeration, while MO consists of the positive detectable distribution of CNT. The hydrophobic patch on the MO surface may interact with the hydrophobic sidewall of the intact CNT, facilitating CNT adsorption in MO solution [20]. Section 3.2 proceeded over the chemical and structural information extracted from Raman data in a wider context.

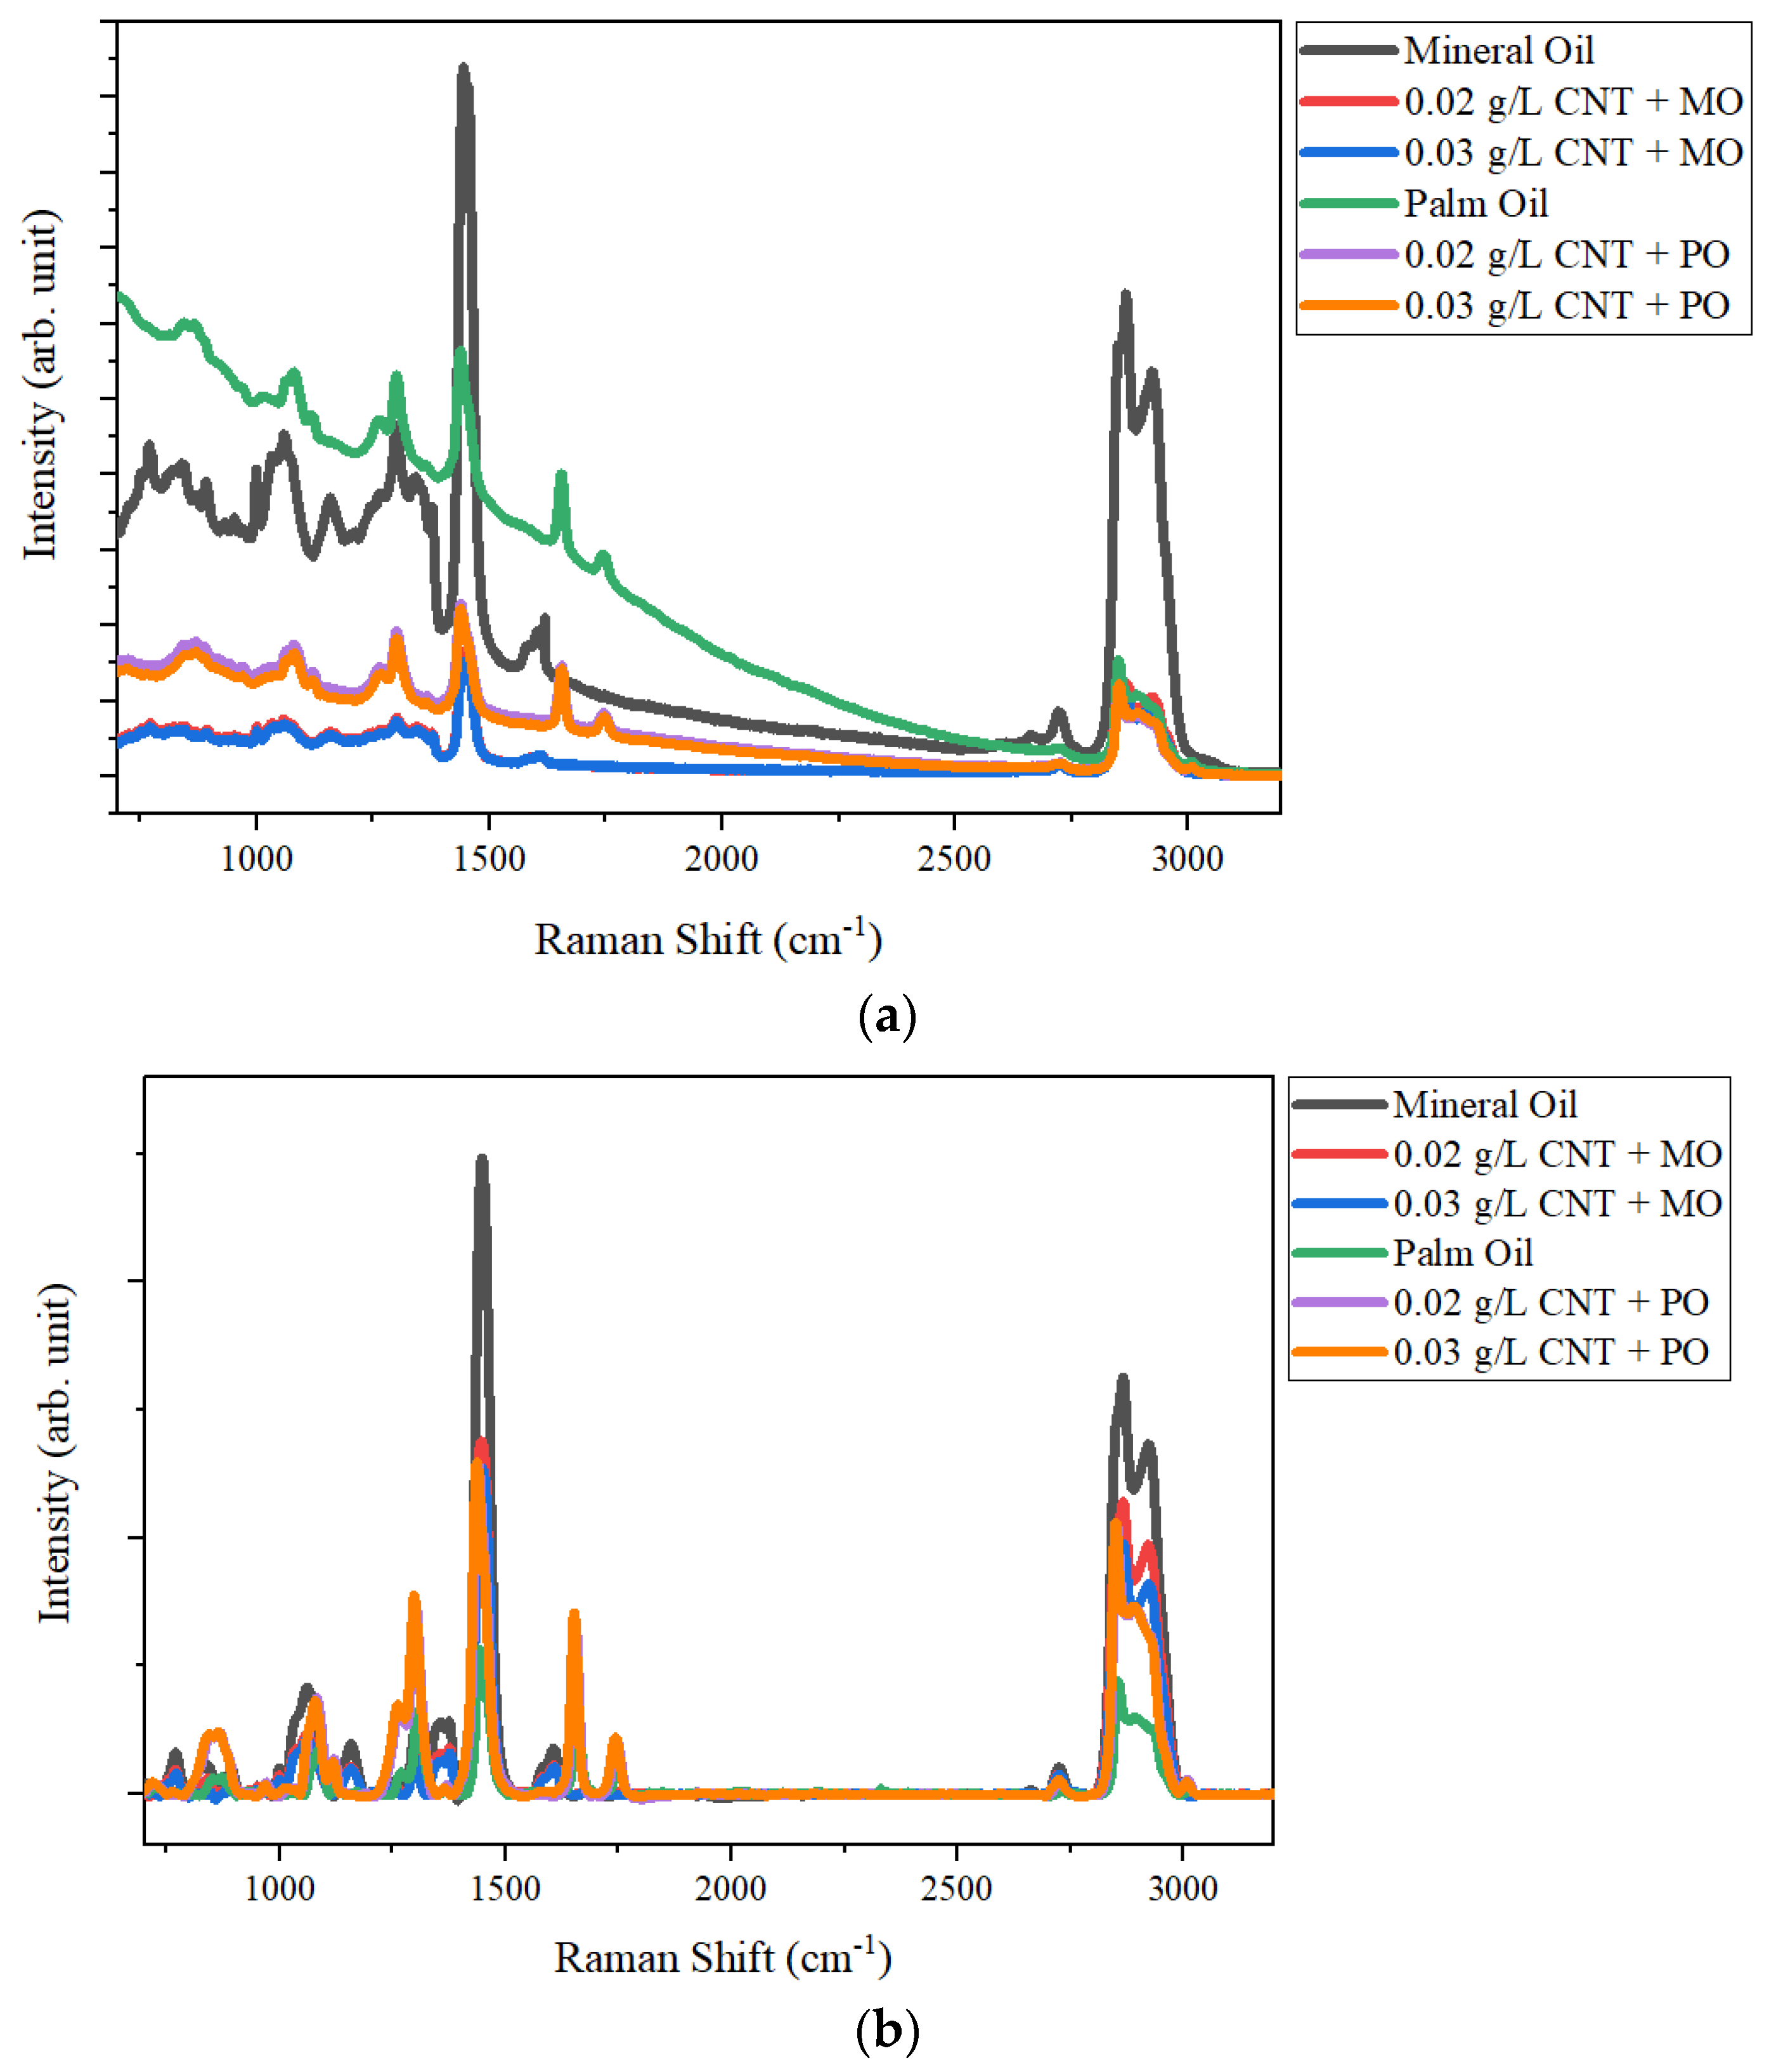
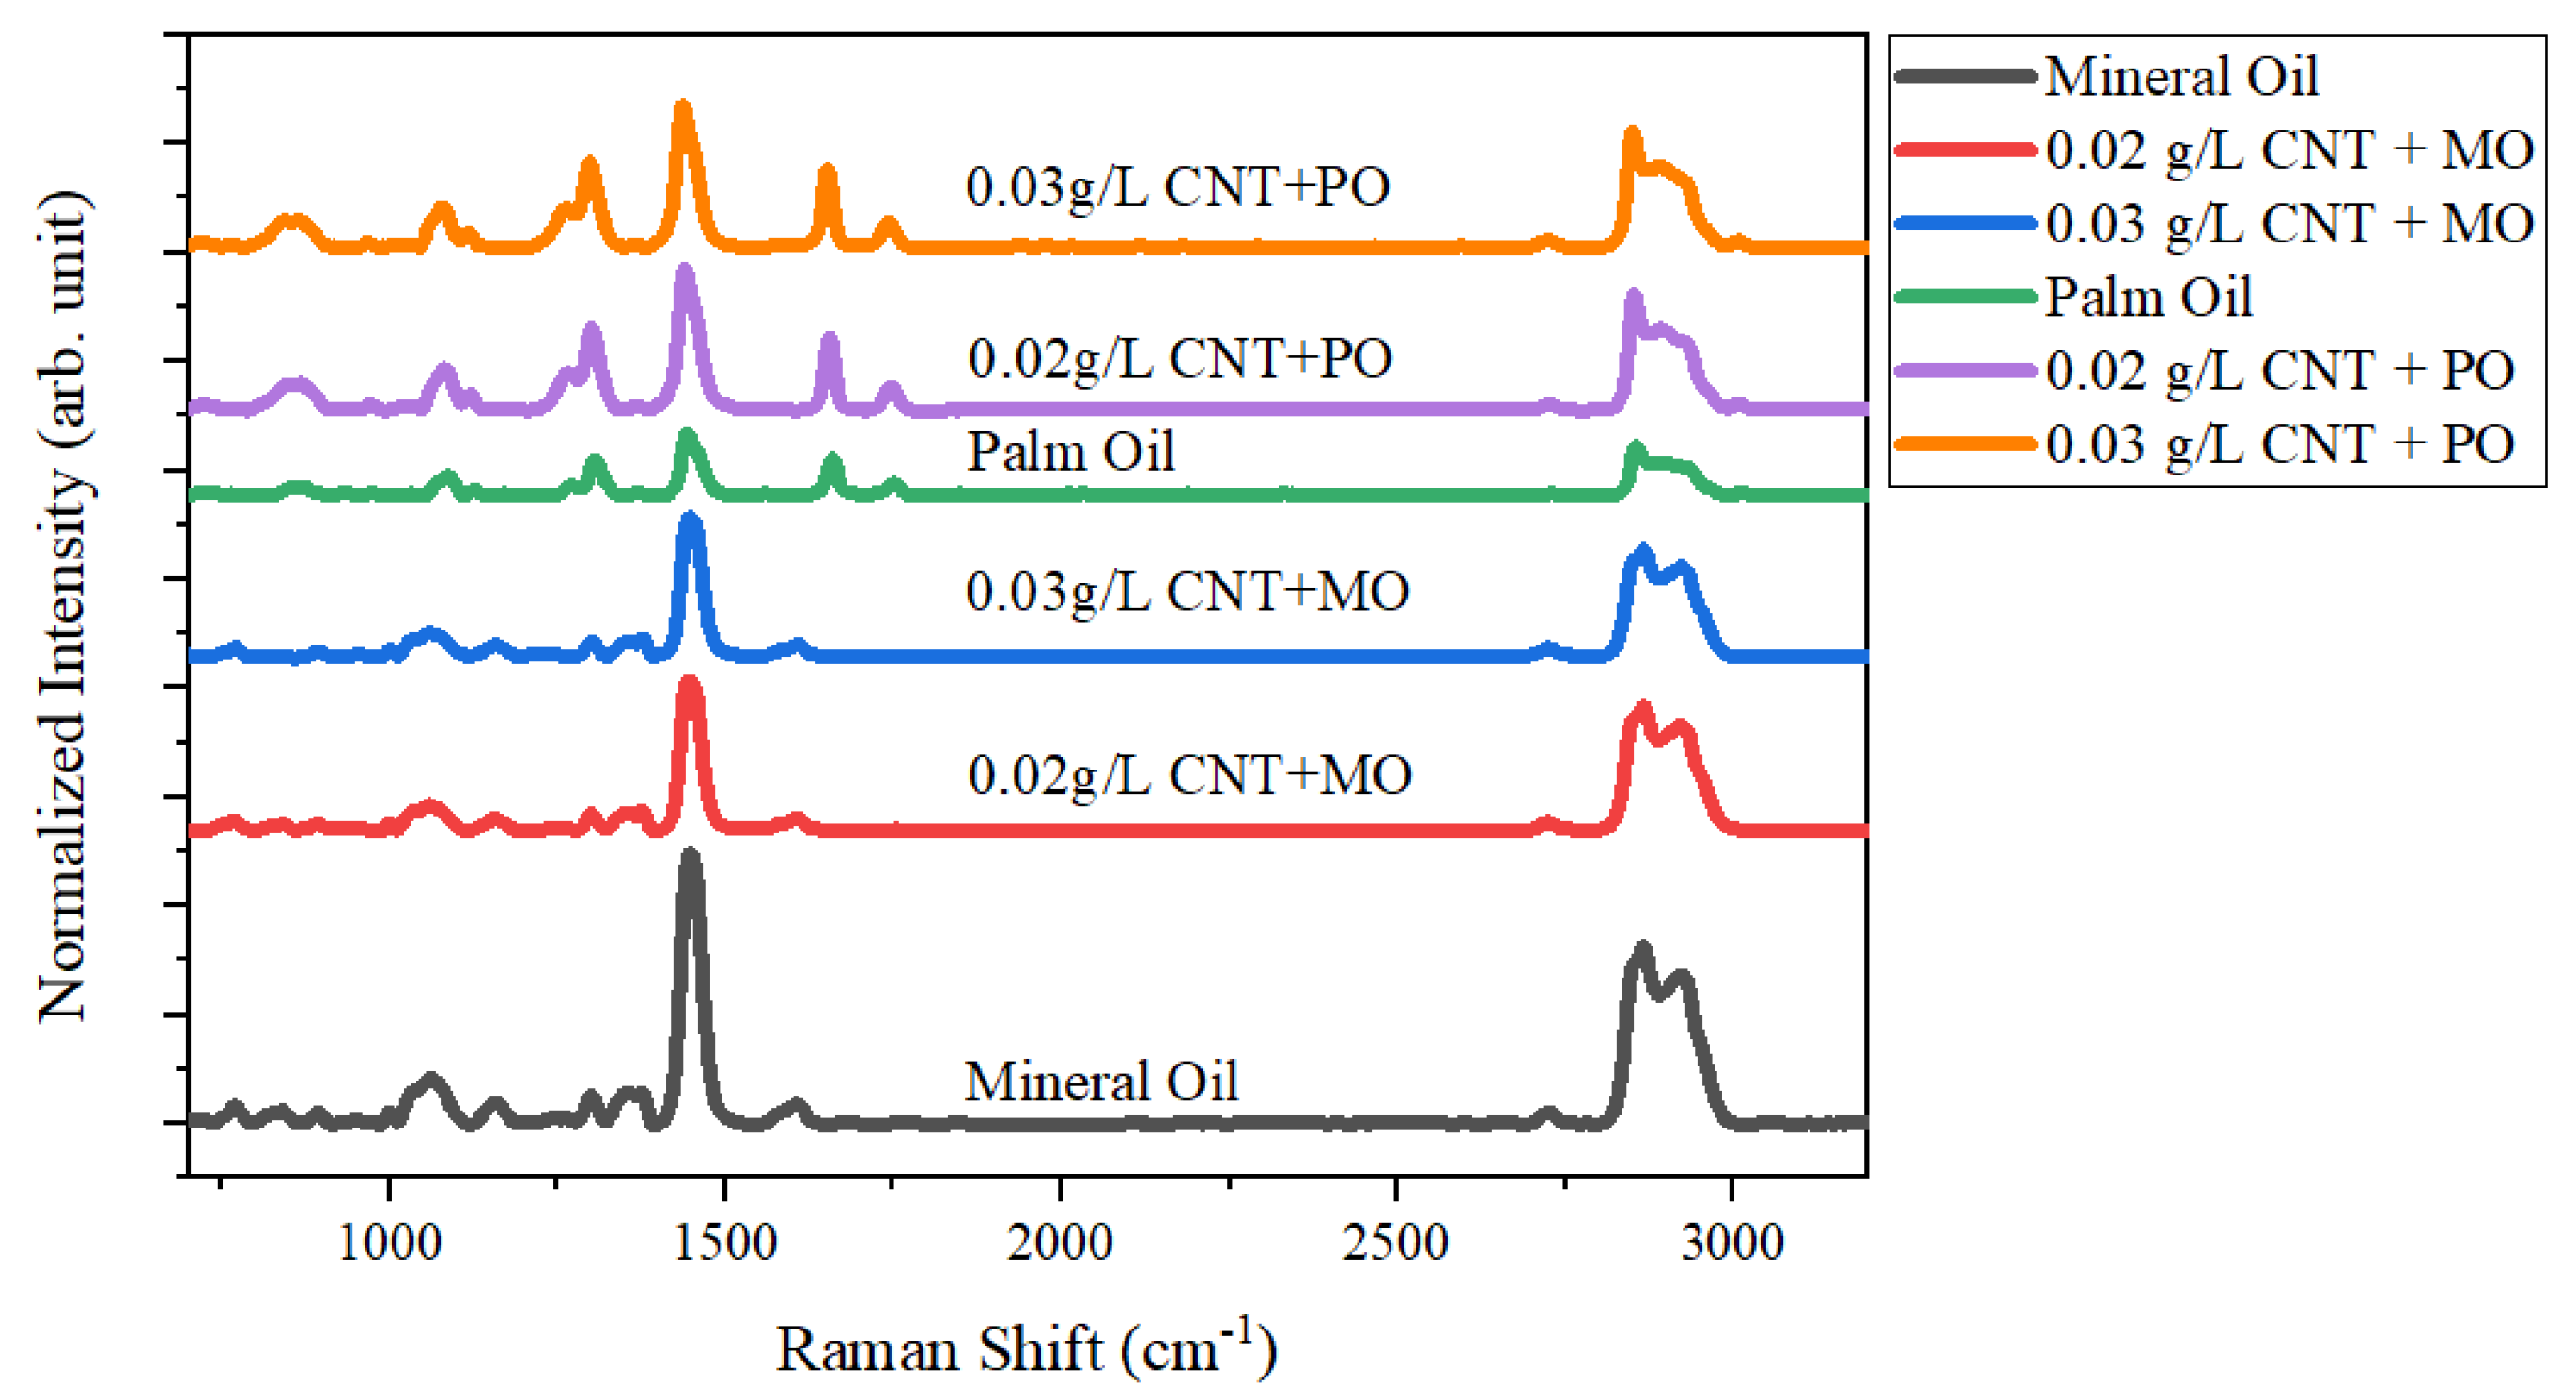
3.2. Qualitative Detection of CNT Nanofluids

Raman spectroscopy involves the interaction of laser light with molecular vibrations, which causes the energy of the laser photons to be shifted up or down (e.g., Raman shift). The energy shift provides useful information about the system’s vibrational modes and can be used to specify the type of bonds present in the compound. Raman spectroscopy examines a compound’s chemical structure which depicts data on the identification of chemical bonds, contamination, and impurities.
Initially, samples may exhibit Raman spectra with varying degrees of fluorescence or thermal background, as shown in Figure 2a. Hence, the Raman spectra are pre-processed to remove spikes and undesirable backgrounds, as well as a baseline adjustment for fluorescence correction. The second-derivate (zeroes) method is used to determine the specific point of baseline shape. Furthermore, the adjacent-averaging smoothing is applied to the data with a ‘10′ smoothing window ‘0.05′ threshold value. As can be seen in Figure 2b, this process improves the signal-to-noise ratio. Figure 3 presents the stacked plot of Raman data for oil samples after the normalization process from 700 cm−1 to 3100 cm−1 wavelengths. To easily compare the sample’s condition, the min–max normalization method is performed from 0 to 1 value in this study.
The normalized spectra of MO and MO with CNT deviate significantly from the spectra of PO and PO with CNT, as shown in Figure 3. From 1600 cm−1 to 1800 cm−1, there is a slight additional band compared to the MO and MO with CNT samples. Analyzing from 1200 cm−1 to 1400 cm−1, the intensity of the MO and MO with CNT are also relatively lower than other samples. However, it can be observed that all samples have similar bands around ~1060 cm−1, ~1448 cm−1, ~2858 cm−1, and ~2918 cm−1 Raman shift. For most studies of spectral diagnosis, bands below 1500 cm−1 are dominated by bending, deformation, and ring vibration of the molecules. Bands within the range of 1500 cm−1 to 4000 cm−1 are characterized by various stretching modes of functional groups of molecules [21]. The precision in-band region and intensity might improve, respectively, on the condition that the observed bands are adapted with the appropriate profile, which will be discussed in Section 3.3.

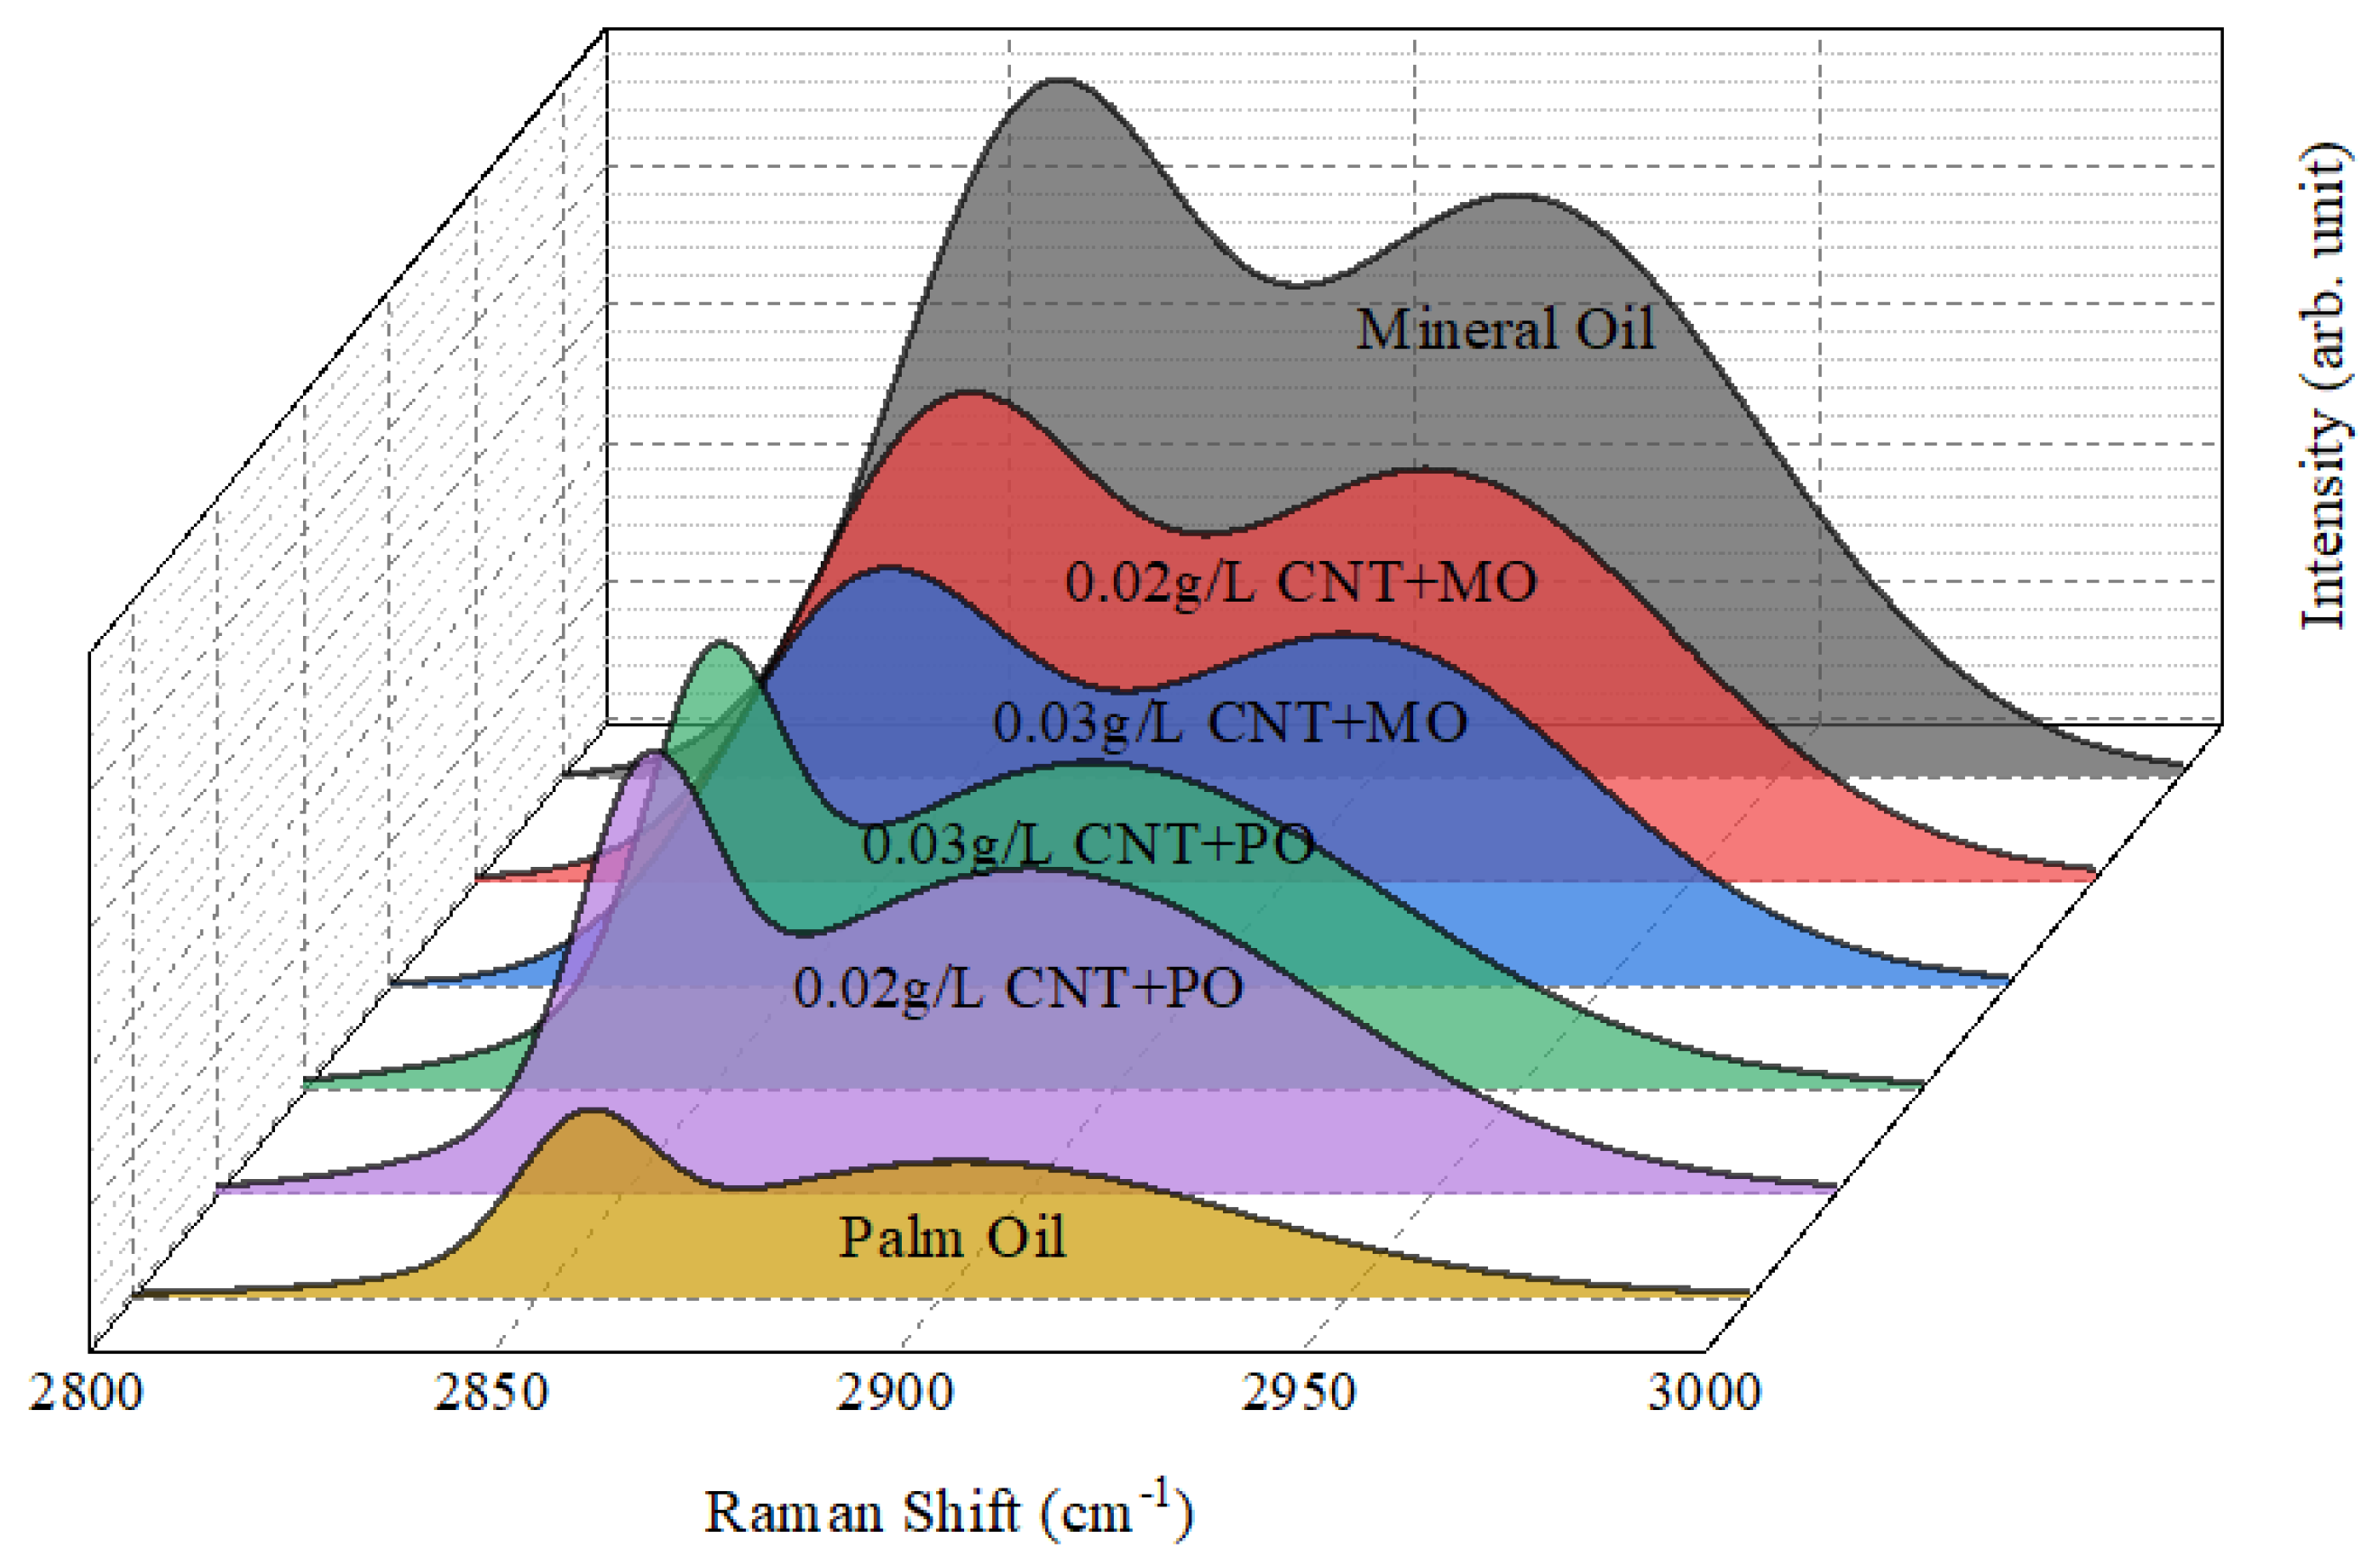
3.3. Multiple Peak Fitting Analysis

Most of the Raman-active samples provide more than one representative band, some of which may be partially overlapped or isolated yet close to one another, necessitating group fitting. Fitting overlapping or proximate, multiple bands appropriately and precisely is often complicated. This is because, on the one hand, these Raman peaks generally have diverse peak shapes and widths, and it is preferable to fit each peak with an individual peak shape and width. Curve fitting calculates high accurate values for sample and complex bands system that overlap. To measure multi-component peak regions of samples, all Raman shifts from 700 cm−1 to 3100 cm−1 were fit into a Gaussian function as shown in Equation (1) with a 10% threshold height. Figure 4 shows the sample curve model of a Gaussian function calculated based on the fitting peak (Equation (1)) accordingly.
y = y 0 + A e 4 ln 2 ( x x c ) 2 w 2 π 4 ln 2 n .
Figure 5 shows the results of multiple peak fitting of oil samples loaded with CNT after baseline correction. It can be observed that as CNT dispersed in MO, the number of peaks identified decreases from 11 to 9 peaks at 0.02 g/L concentration and 8 peaks at 0.03 g/L concentration. This can be explained by the significant changes in the MO structure of the C network caused by these functional groups, which hinders the resonant Raman processes. In the case of PO, there is an extra peak approximately at 1120 cm−1 (shown by a blue circle) which corresponds to the C-N group after dispersing some CNT.
Focusing on Figure 5b,c, there are two missing bands around 800 cm−1 (shown by red circles) compared to Figure 5a, which indicate the existence of low frequency (C–O–C) vibrations that disappear after adding some CNT. It can also be observed that after dispersing 0.03 g/L concentration of CNT nanofluid in MO, bands at 1156 cm−1, 1375 cm−1, and 1599 cm−1 are also missing compared to MO and MO with 0.02 g/L CNT concentration. The band at 1156 cm−1 is attributed to in-phase (C–C) stretching vibrations of the polyene chain [22], while bands at 1375 cm−1 and 1599 cm−1 attributes to the (H–C–C/O) bending mode and (C=C) aromatic stretching mode, which describes the characteristic of diamond and graphite. If higher concentrations of amorphous carbon are present, those two peaks can be observed respectively [23]. The Raman band at region 1060 cm−1 usually indicates the phosphate unit, while bands around 1300 cm−1 and 1352 cm−1 region attributed to the CH2 twist in the fatty acid [24].
For the palm oil (PO) spectra in Figure 5d, the bands at 848 cm−1, 872 cm−1, and 1083 cm−1 correspond to the vibration of the (C–C) of proline, (C–C) stretching vibrations of amino acids (hydroxyproline) and (C–C) stretching vibration of the (CH2)n group, and the band approximately at 1269 cm−1 refers to the (=C–H) deformation of cis (R–HC=HCR). The stronger bands at 1306 cm−1 and 1448 cm−1 region indicate the (C–H) bending twist of the CH2 group and (C–H) scissoring of the CH2 group. The peak at the 1658 cm−1 region indicate (C=C) and cis (C–H) groups of unsaturated fatty acids, while the peak at 1749 cm−1 is (C=O) stretching vibration of ester bond carbonyl [25,26,27]. The C=O stretching vibration indicates the presence of ketones and aldehydes.
Focusing on the stronger bands centered at ~1440 cm−1 region as shown in Figure 6a,b indicates (C–H) methylene scissors vibration of CH2 group, which peaks near this frequency are indicative of alkanes and cycloalkanes (C6H12) [18,28]. By comparing the carbon–hydrogen C–H bonding and carbon–carbon C–C bonding structure, it can be observed that the C–H structure tends to have a higher frequency. This is mainly because of the fact that hydrogen atoms are significantly lighter than carbon atoms [25,26,27,29]. Aside from observing the Raman shift’s intensity data, the full-wave at half maximum (FWHM) of the dominated peak is also estimated in this study. FWHM is the diameter of a peak at half of its intensity height which reflects the structural distribution [30]. The concentrations of MO with 0.02 g/L and 0.03 g/L CNT show the lowest FWHM with only 2.62% and 1.66% difference when compared to the MO sample. In contrast to the PO condition without any CNT, PO with 0.02 g/L and 0.03 g/L CNT yield increment for about 9.71% and 8.43%, respectively. Lower FWHM signifies the highest structural stability and has the potential to be used as insulation oil in transformer applications. In contrast, a high defect density and local compositional variations might cause a broadening peak of PO.
It is also noticed that as more CNTs are dispersed in the PO (i.e., high CNT concentration), the strong intensity peak tends to shift to the lower band, which is attributed to molecules with longer chemical bond lengths. The reduction or elongation of the bond length is a result of the alteration in inter-particle interactions. It also can happen due to the increasing size of particles in PO molecules. This result might correlate with the optical image behaviour of PO after mixing with CNT as depicted in Section 3.1.
The Raman spectra of the oil samples from the 2800–3000 cm−1 region can be seen in Figure 7. Two strong spectrum peaks can be observed, which resemble saturated hydrocarbon composition representing the diversity of CH, CH2, and CH3 groups [31]. The vibrational modes of this spectral region can be defined as an alkyl C-H stretch. However, it is possible that a ring NC(H)NCH stretching can be assigned to one of them, as reported in one study. However, the peak at areas ~2858 cm−1 and ~2900 cm−1 are assigned as CH2 asymmetric and symmetric stretching modes [32]. Focusing on PO samples, after adding CNT, it is observed that the integrated area under both two peaks increased tremendously. This proved that the effects of increasing disorder open more channels for the inelastic scattering process, thus increasing the integrated area under the PO sample [33].
Theoretically, the Raman spectroscopy analysis of oil samples can be split into a first-order (700–1800 cm−1) and second-order (2300–3300 cm−1) region. The only Raman-active band predicted by group theory in the first-order region is the G band at ~1580 cm−1, which is described as in-plane atomic displacements. However, the G band only exists in mineral oil and MO with 0.02 g/L CNT sample. All other bands derive from the existence of deformities such as point defects (vacancies, impurities) or planar defects (crystal edges, stacking faults) that cause “disorder” in the lattice and intensify double-resonant scattering denominated as D bands. Because the D bands developed from a resonant mechanism, these bands are dispersive and their position, shape, and intensity differ with the energy of the exciting laser. Referring to the Raman spectra in this study, the D band (~1350 cm−1) is observed at MO and MO with CNT sample [34].
In the second-order region, overtones or bands due to combination scattering also appear as a result of double-resonant processes and are commonly labeled “G” bands. The most intense and perhaps most interesting one is the G′ band at ~2700 cm−1 region. The G′ and G″ bands are fundamental for analyzing the behavior of each graphitic material. It was noticed that oil sample peculiarities detected a higher intensity of G′ and G″ bands (Figure 7, which shifted to ~2850 cm−1 and ~2900 cm−1, respectively. The ratio of six oil samples’ intensities, as shown in Table 1, are smaller than 1. Some authors attributed that G′ band represents an interconnection with boundary phonon, which is also correlated with the D band, while the G″ band corresponds to the number of states that electrons are allowed to occupy at a specified energy level [33,34,35]. In particular, deficiencies in the graphitic structure are highly vulnerable to infrared excitation, resulting in significant variation in the intensity of bands D and G bands.

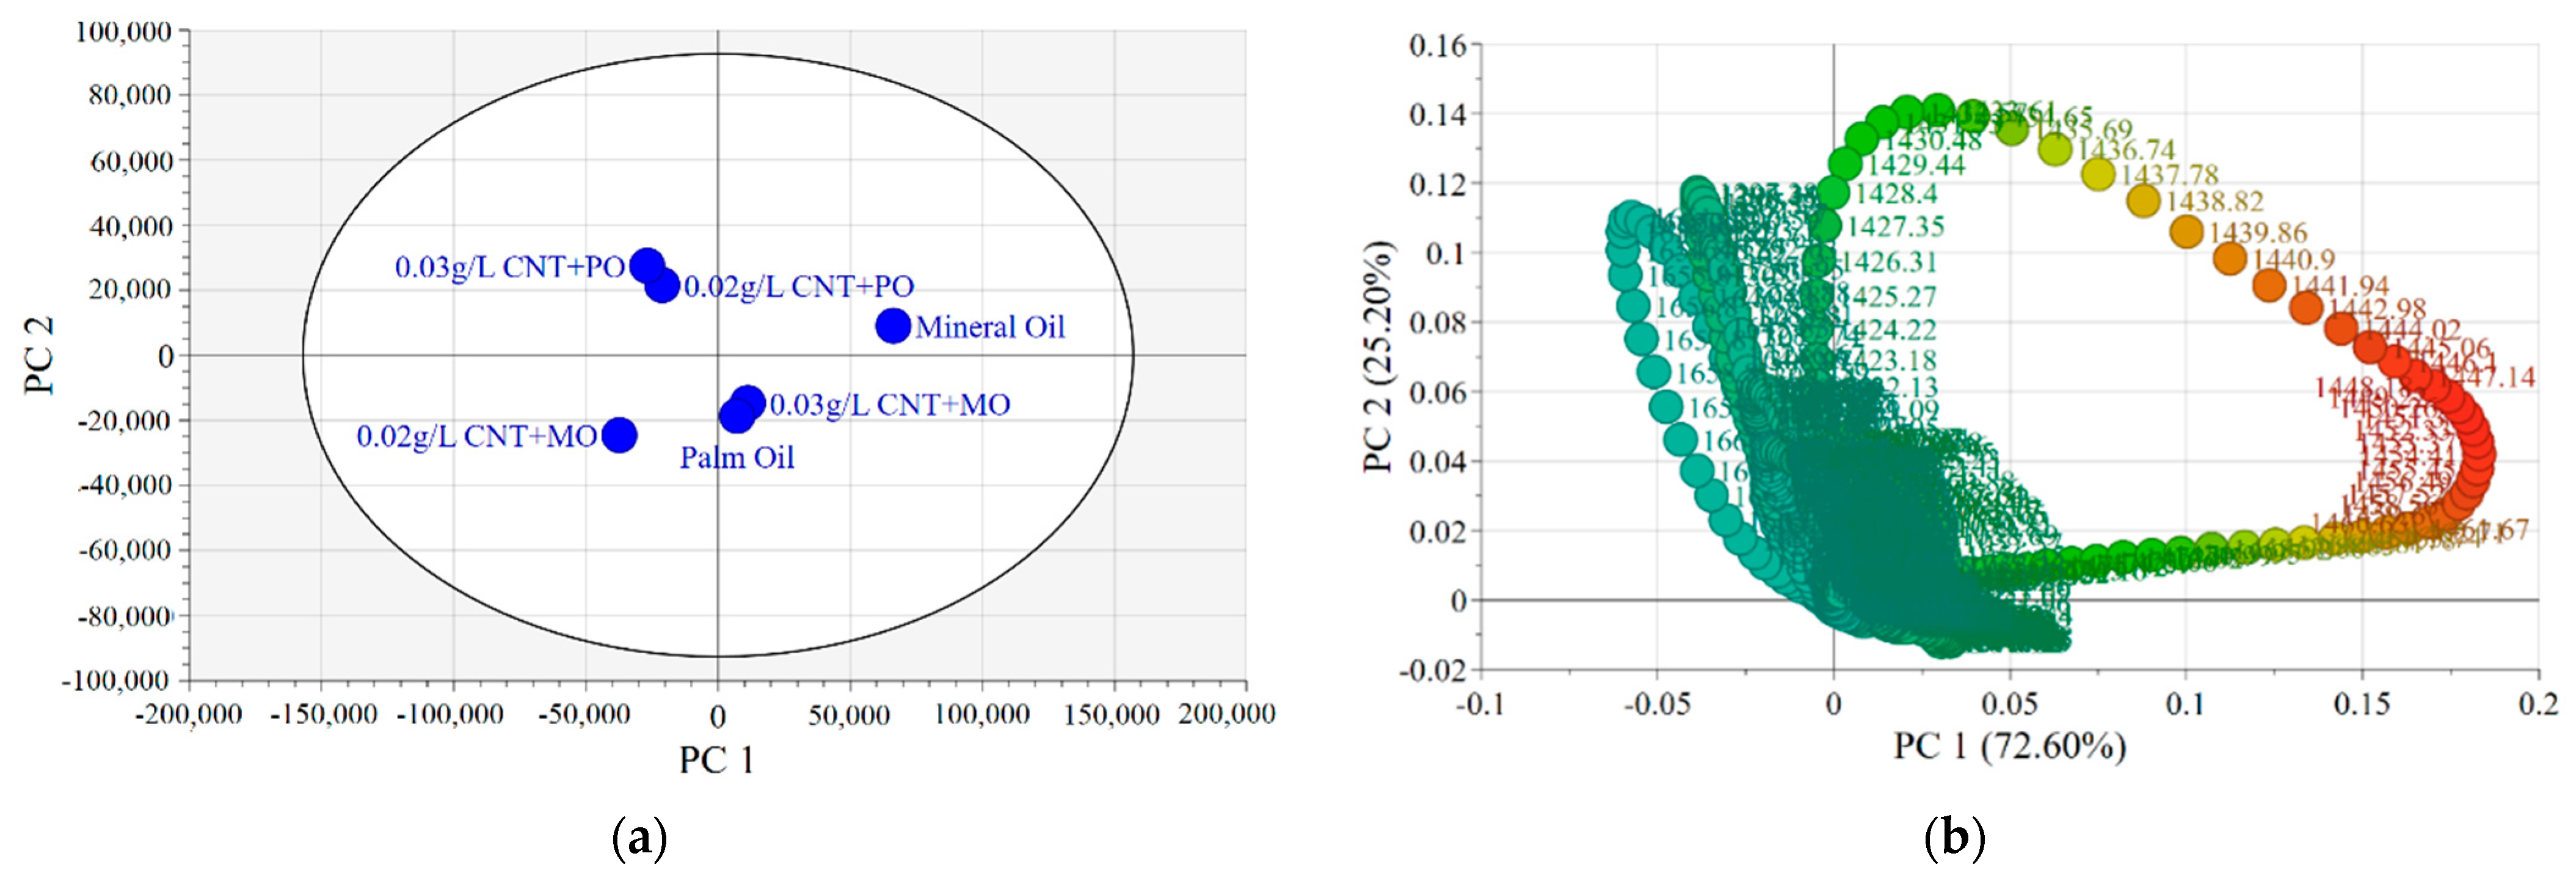
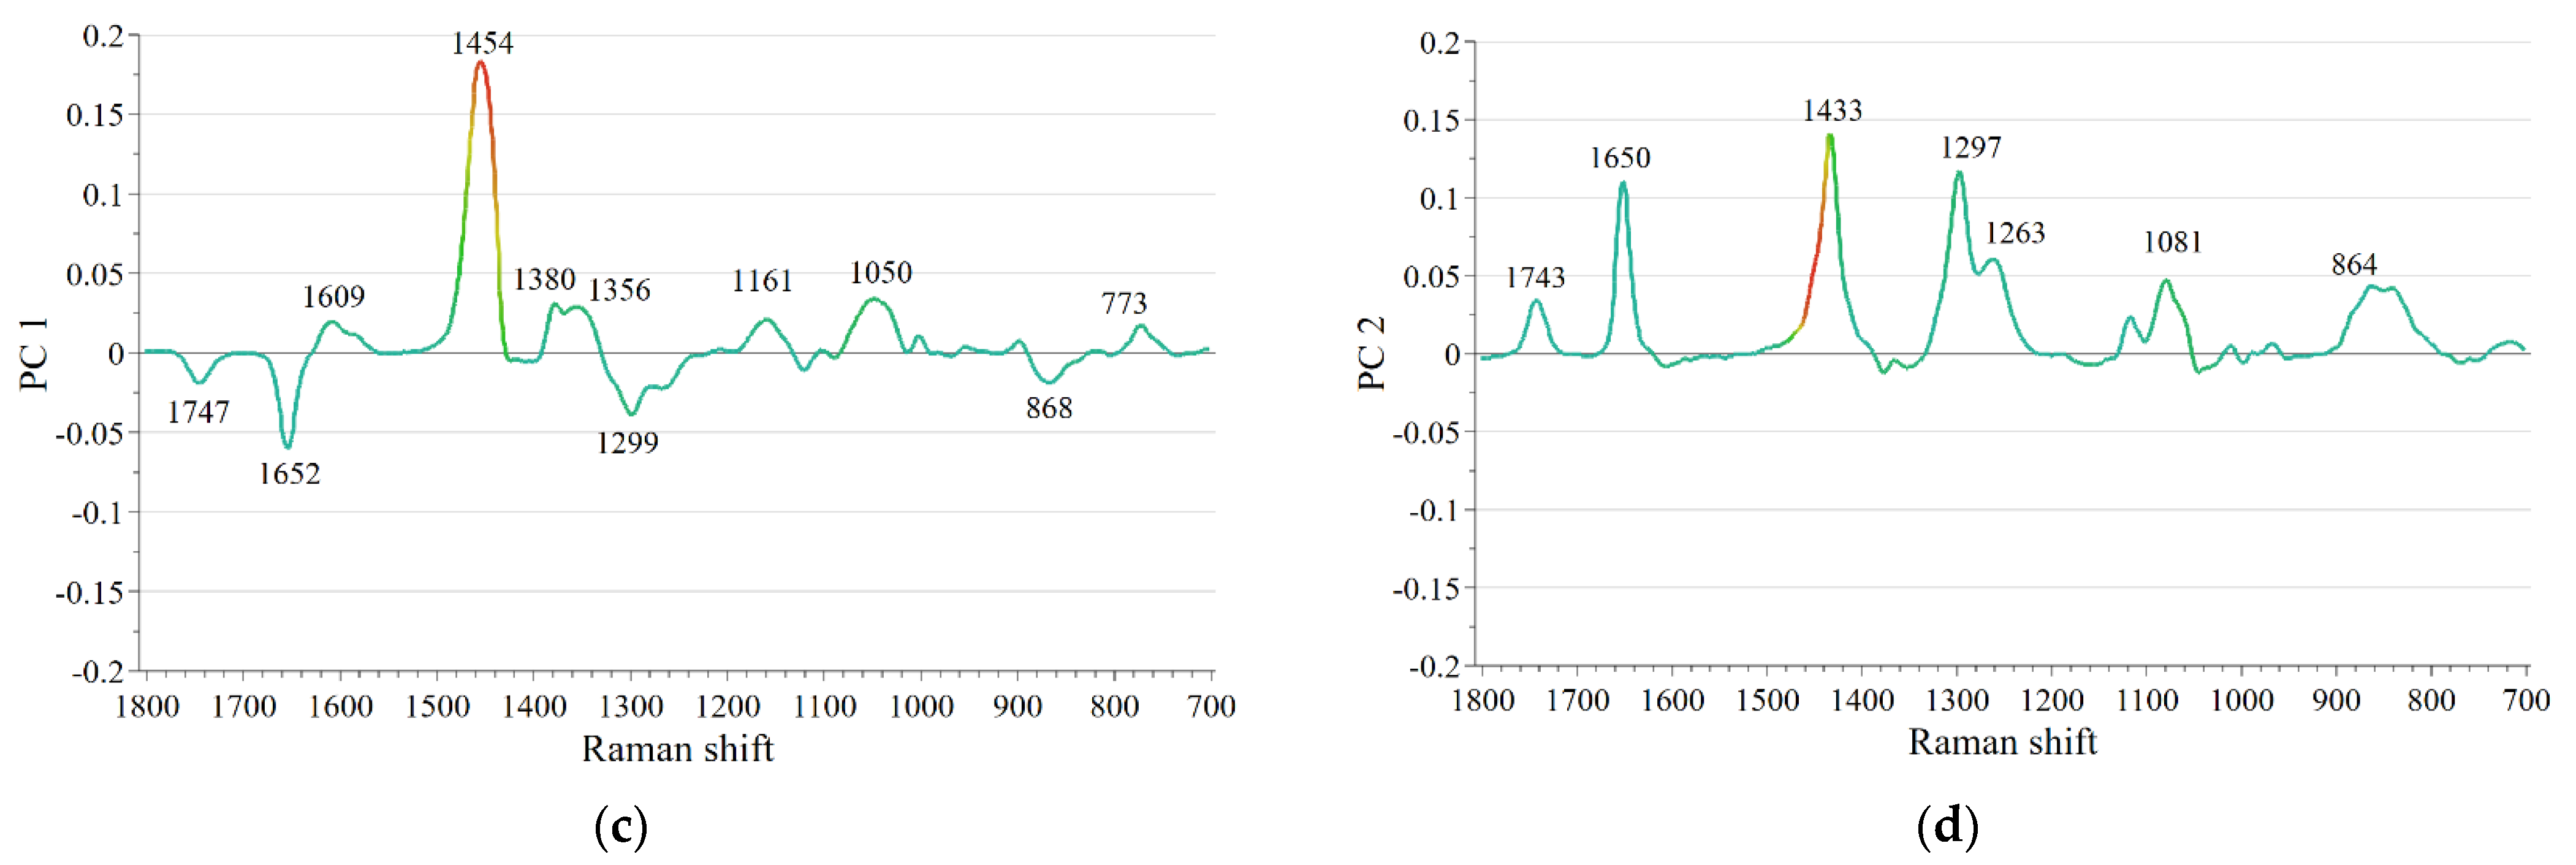
3.4. Principal Component Analysis

Following normalization, a multivariate data analysis named principal component analysis (PCA) is applied where eigenvalue decomposition of descriptive data covariance is performed to automatically analyse the Raman spectrum and highlight the spectral differences of the samples [36]. The relative intensities between 700–1800 cm−1 consist of some interesting characteristics for the oil samples, hence that range is utilized as the data source for PCA analysis.
Figure 8a present the PCA score plot of the first two principal components (PC) of Raman data sets for six oil samples, where no outliers have been identified within the data set. The score plot provides a map of how the structural data of Raman relate to each other. Each of the mean spectra is represented by a dot, as shown in Figure 8b. The loading graph, as shown in Figure 8c,d, identifies the major contributing factors for the pattern seen in the PCA model. The contribution rates of the principal component (PC1) explained 72.60% of the variance and the second (PC2) is 25.20%, respectively. The total variance explained by the first two PC was 97.80%. This result implies that the PCA model accurately represents the majority of the information in the original data.
The first PC (PC1) was dominated by a positive loading coefficient centered on characteristic mineral oil Raman bands; 1609, 1454, 1380, 1356, 1161, 1050, and 773 cm−1 (Figure 8c). Observed can be that the palm oil after being dispersed with 0.02 g/L and 0.03 g/L concentration of CNT is located at the upper left area and clustered together, which represents a similar structure profile and positively correlated to each other. Both concentrations depict a negative score for PC1 but a positive score for PC2 (Figure 8a). This is because of characterization caused by the intense band at the 1650 cm−1 region, which represents higher content of C=C stretching vibration compared to the palm oil after being dispersed with CNT. The application of PCA combines distinct spectral areas and allows additional information to be retrieved from the spectral data, which leads to a comprehensive study concerning independent datasets.

4. Conclusions

In this report, structural and chemical properties of synthesized multi-walled carbon nanotube (CNT) with conventional transformer oil, mineral oil and vegetable oil, and palm oil was thoroughly investigated. Raman spectroscopy indicated a few significant differences of spectra before and after dispersing 0.02 g/L and 0.03 g/L CNT concentration in MO and PO. However, it can be observed that all samples have similar peaks around ~1060 cm−1 (phosphate unit), ~1448 cm−1 (C–H bending twist), ~2858 cm−1, and ~2918 cm−1 (C–H stretching) Raman shift. The highest bands centered at ~1440 cm−1 region represents (C–H) methylene scissors vibration of CH2 group, which peaks around this wavelength signifying alkanes and cycloalkanes (C6H12). It can also be observed that the C–H structure has a significantly higher intensity than the C–C bonding structure. This is attributed to the hydrogen atom, which is much lighter than the carbon atom. When compared to the MO sample, MO with CNT concentrations of 0.02 g/L and 0.03 g/L CNT seemed to have the lowest FWHM with just 2.62 and 1.66% differences. In comparison to the PO characteristics, 0.02 g/L and 0.03 g/L CNT nanofluid-based PO yield increases of 9.71 and 8.43%, respectively. A lower FWHM indicates the maximum structural stability and the possibility for application as insulation oil in the transformer. Raman methods coupled with PCA analysis are suggested for nanofluid characterization detection and quantification for future study.

Author Contributions

Investigation, N.S.S. and A.R.A.R.; resources, validation, M.F.M.D., M.T.I. and F.R.H.; writing—original draft, N.S.S.; writing—review and editing, N.S.S., M.T.I. and M.F.M.D. All authors have read and agreed to the published version of the manuscript.

Funding

This research was funded by the Ministry of Higher Education (FRGS/1/2018/TK04/UPNM/02/3).

Institutional Review Board Statement

Not applicable.

Informed Consent Statement

Not applicable.

Data Availability Statement

Not applicable.

Conflicts of Interest

The authors declare no conflict of interest.

References

  1. Katim, N.I.A.; Ishak, M.T.; Amin, N.A.M.; Hamid, M.H.A.; Ahmad, K.A.; Azis, N. Lightning Breakdown Voltage Evaluation of Palm Oil and Coconut Oil as Transformer Oil under Quasi-Uniform Field Conditions. Energies 2018, 11, 2676. [Google Scholar] [CrossRef] [Green Version]
  2. Makmud, M.Z.H.; Illias, H.A.; Chee, C.Y. Partial Discharge Behaviour within Palm Oil-Based Fe2O3 Nanofluids under AC Voltage. IOP Conf. Ser. Mater. Sci. Eng. 2017, 210, 012034. [Google Scholar] [CrossRef] [Green Version]
  3. Suleiman, A.A.; Muhamad, N.A.; Bashir, N.; Murad, N.S.; Arief, Y.Z.; Phung, B.T. Effect of Moisture on Breakdown Voltage and Structure of Palm Based Insulation Oils. IEEE Trans. Dielectr. Electr. Insul. 2014, 21, 2119–2126. [Google Scholar] [CrossRef]
  4. Suhaimi, N.S.; Md Din, M.F.; Ishak, M.T.; Rahman, A.R.A. Statistical Analysis on AC Breakdown Voltage of CNT Nanofluid with Mineral Oil and Palm Oil. In Proceedings of the 2018 IEEE 7th International Conference on Power and Energy, PECon 2018, Kuala Lumpur, Malaysia, 3–4 December 2018; pp. 111–116. [Google Scholar]
  5. Dan, S.A.M.; Hashim, F.H.; Raj, T.; Huddin, A.B.; Hussain, A. Classification of Oil Palm Fresh Fruit Bunches (FFB) Using Raman Spectroscopy. Int. J. Eng. Technol. 2018, 7, 184. [Google Scholar] [CrossRef]
  6. Suhaimi, S.N.; Rahman, A.R.A.; Din, M.F.M.; Hassan, M.Z.; Ishak, M.T.; Jusoh, M.T.B. A Review on Oil-Based Nanofluid as Next-Generation Insulation for Transformer Application. J. Nanomater. 2020, 2020, 2061343. [Google Scholar] [CrossRef]
  7. Saidur, R.; Leong, K.Y.; Mohammed, H.A. A Review on Applications and Challenges of Nanofluids. Renew. Sustain. Energy Rev. 2011, 15, 1646–1668. [Google Scholar] [CrossRef]
  8. Mukherjee, S.P.S. Preparation and Stability of Nanofluids—A Review. IOSR J. Mech. Civ. Eng. 2013, 9, 63–69. [Google Scholar] [CrossRef]
  9. Ram, A.; Ramaian, P.; Iruthayarajan, W.; Siluvairaj, M.; Karthik, R. Performance Studies on Dielectric and Physical Properties of Eco-Friendly Based Natural Ester Oils Using Semi-Conductive Nanocomposites for Power Transformer Application. IET Sci. Meas. Technol. 2018, 12, 323–327. [Google Scholar] [CrossRef]
  10. Asse, J.-B.; Mengounou, G.M.; Imano, A.M. Impact of FeO3 on the AC Breakdown Voltage and Acidity Index of a Palm Kernel Oil Methyl Ester Based Nanofluid. Energy Rep. 2022, 8, 275–280. [Google Scholar] [CrossRef]
  11. Iijima, S. Helical Microtubules of Graphitic Carbon. Nature 1991, 354, 56–58. [Google Scholar] [CrossRef]
  12. Suhaimi, N.S.; Md Din, M.F.; Ishak, M.T.; Abdul Rahman, A.R.; Mohd Ariffin, M.; Hashim, N.I.; Wang, J. Systematical Study of Multi-Walled Carbon Nanotube Nanofluids Based Disposed Transformer Oil. Sci. Rep. 2020, 10, 20984. [Google Scholar] [CrossRef] [PubMed]
  13. Suhaimi, N.S.; Din, M.F.; Rashid, A.; Rahman, A.; Hayati, M.; Hamid, A.; Aqilah, N.; Amin, M.; Fathul, W.; Wan, H.; et al. Optimum Electrical and Dielectric Performance of Multi-Walled Carbon Nanotubes Doped Disposed Transformer Oil. Energies 2020, 13, 3181. [Google Scholar] [CrossRef]
  14. Deb, H.; Nunisa, J.; Moon Sun Naiding, M.; Jidung, S.; Sarmah, D. Transformer Oil Quality Diagnostic Using Spectroscopy Techniques-A Review. ADBU J. Electr. Electron. Eng. 2019, 3, 43–50. [Google Scholar]
  15. Chen, X.; Chen, S.; Yang, D.; Luo, H.; Yang, P.; Cui, W. Quantitative Prediction of Aging State of Oil-Paper Insulation Based on Raman Spectroscopy. AIP Adv. 2021, 11, 035001. [Google Scholar] [CrossRef]
  16. Song, R.; Chen, W.; Yang, D.; Shi, H.; Zhang, R.; Wang, Z. Aging Assessment of Oil-Paper Insulation Based on Visional Recognition of the Dimensional Expanded Raman Spectra. IEEE Trans. Instrum. Meas. 2021, 70, 6007110. [Google Scholar] [CrossRef]
  17. Chen, W.; Gu, Z.; Zou, J.; Wan, F.; Xiang, Y. Analysis of Furfural Dissolved in Transformer Oil Based on Confocal Laser Raman Spectroscopy. IEEE Trans. Dielectr. Electr. Insul. 2016, 23, 915–921. [Google Scholar] [CrossRef]
  18. Somekawa, T.; Fujita, M.; Izawa, Y.; Kasaoka, M.; Nagano, Y. Furfural Analysis in Transformer Oils Using Laser Raman Spectroscopy. IEEE Trans. Dielectr. Electr. Insul. 2015, 22, 229–231. [Google Scholar] [CrossRef]
  19. Yadav, N.; Jarial, R.K.; Rao, U.M. Characterization of Mineral Oil Based Fe3O4 Nanofluid for Application in Oil Filled Transformers. Int. J. Electr. Eng. Inform. 2018, 10, 338–349. [Google Scholar] [CrossRef]
  20. Kim, B.C.; Lee, I.; Kwon, S.J.; Wee, Y.; Kwon, K.Y.; Jeon, C.; An, H.J.; Jung, H.T.; Ha, S.; Dordick, J.S.; et al. Fabrication of Enzyme-Based Coatings on Intact Multi-Walled Carbon Nanotubes as Highly Effective Electrodes in Biofuel Cells. Sci. Rep. 2017, 7, 40202. [Google Scholar] [CrossRef]
  21. Mehta, M.; Naffa, R.; Maidment, C.; Holmes, G.; Waterland, M. Raman and ATR-FTIR Spectroscopy Towards Classification of Wet Blue Bovine Leather Using Ratiometric and Chemometric Analysis. J. Leather Sci. Eng. 2020, 2, 3. [Google Scholar] [CrossRef]
  22. Tsuyama, S.; Taketani, A.; Murakami, T.; Sakashita, M.; Miyajima, S.; Ogawa, T.; Wada, S.; Maeda, H.; Hanada, Y. Quantitative Prediction of a Functional Ingredient in Apple Using Raman Spectroscopy and Multivariate Calibration Analysis. Appl. Phys. B Lasers Opt. 2021, 127, 92. [Google Scholar] [CrossRef]
  23. Johnson, D.W. Application of Raman Spectroscopy to Lubricants, Lubricated Surfaces, and Lubrication Phenomena. Spectroscopy 2011, 26, 46–50. [Google Scholar]
  24. Frost, R.L.; López, A.; Xi, Y.; Granja, A.; Scholz, R.; Lima, R.M.F. Vibrational Spectroscopy of the Phosphate Mineral Kovdorskite—Mg 2PO4(OH)·3H2O. Spectrochim. Acta—Part A Mol. Biomol. Spectrosc. 2013, 114, 309–315. [Google Scholar] [CrossRef] [PubMed] [Green Version]
  25. Vaskova, H.; Buckova, M. Multivariate Study of Raman Spectral Data of Edible Oils. WSEAS Trans. Environ. Dev. 2018, 14, 02022. [Google Scholar] [CrossRef] [Green Version]
  26. Li, Y.; Huang, W.; Pan, J.; Ye, Q.; Lin, S.; Feng, S.; Xie, S.; Zeng, H.; Chen, R. Rapid Detection of Nasopharyngeal Cancer Using Raman Spectroscopy and Multivariate Statistical Analysis. Mol. Clin. Oncol. 2015, 3, 375–380. [Google Scholar] [CrossRef]
  27. Jin, H.; Li, H.; Yin, Z.; Zhu, Y.; Lu, A.; Zhao, D.; Li, C. Application of Raman Spectroscopy in the Rapid Detection of Waste Cooking Oil. Food Chem. 2021, 362, 130191. [Google Scholar] [CrossRef]
  28. Orange, D.; Knitile, E.; Farber, D.; Williams, Q. Raman Spectroscopy of Crude Oils and Hydrocarbon Fluid Inclusions: A Feasibility Study. Miner. Spectrosc. 1996, 5, 65–81. [Google Scholar]
  29. Batakliev, T.; Petrova-Doycheva, I.; Angelov, V.; Georgiev, V.; Ivanov, E.; Kotsilkova, R.; Casa, M.; Cirillo, C.; Adami, R.; Sarno, M.; et al. Effects of Graphene Nanoplatelets and Multiwall Carbon Nanotubes on the Structure and Mechanical Properties of Poly(Lactic Acid) Composites: A Comparative Study. Appl. Sci. 2019, 9, 469. [Google Scholar] [CrossRef] [Green Version]
  30. Ujihara, T.; Munetoh, S.; Kusunoki, K.; Kamei, K.; Usami, N.; Fujiwara, K.; Sazaki, G.; Nakajima, K. Crystal Quality of a 6H-SiC Layer Grown over Macrodefects by Liquid-Phase Epitaxy: A Raman Spectroscopic Study. Thin Solid Film. 2005, 476, 206–209. [Google Scholar] [CrossRef]
  31. Zhang, N.; Tian, Z.J.; Leng, Y.Y.; Wang, H.T.; Song, F.Q.; Meng, J.H. Raman Characteristics of Hydrocarbon and Hydrocarbon Inclusions. Sci. China Ser. D Earth Sci. 2007, 50, 1171–1178. [Google Scholar] [CrossRef]
  32. Phillips, L.; Abbas, N.; Mojica, E.-R.E. Raman Spectroscopic Characterization of An Ionic Liquid (1-Butyl-3- Methylimidazolium Thiocyanate). J. Undergrad. Chem. Res. 2021, 2021, 1–4. [Google Scholar]
  33. Bokobza, L.; Bruneel, J.-L.; Couzi, M. Raman Spectra of Carbon-Based Materials (from Graphite to Carbon Black) and of Some Silicone Composites. C—J. Carbon Res. 2015, 1, 77–94. [Google Scholar] [CrossRef] [Green Version]
  34. Skrzypek, E. First- and Second-Order Raman Spectra of Carbonaceous Material through Successive Contact and Regional Metamorphic Events (Ryoke Belt, SW Japan). Lithos 2021, 388–389, 106029. [Google Scholar] [CrossRef]
  35. Antunes, E.F.; Lobo, A.O.; Corat, E.J.; Trava-Airoldi, V.J.; Martin, A.A.; Veríssimo, C. Comparative Study of First- and Second-Order Raman Spectra of MWCNT at Visible and Infrared Laser Excitation. Carbon 2006, 44, 2202–2211. [Google Scholar] [CrossRef]
  36. Barros, I.H.A.S.; Paixão, L.S.; Nascimento, M.H.C.; Lacerda, V.; Filgueiras, P.R.; Romão, W. Use of Portable Raman Spectroscopy in the Quality Control of Extra Virgin Olive Oil and Adulterated Compound Oils. Vib. Spectrosc. 2021, 116, 103299. [Google Scholar] [CrossRef]
Figure 1. Optical images of (a) mineral oil, (b) palm oil, (c) mineral oil with 0.02 g/L CNT, (d) mineral oil with 0.03 g/L CNT (e) palm oil with 0.02 g/L CNT, (f) palm oil with 0.03 g/L CNT.
Energies 15 01534 g001
Figure 2. Raman spectrum of oil sample (a) before the pre-processed (b) after the pre-processed operation.
Energies 15 01534 g002
Figure 3. A stacked plot of Raman spectrum after normalization process.
Energies 15 01534 g003
Figure 4. The Gaussian function is used for multiple peak fitting in Raman spectra.
Energies 15 01534 g004
Figure 5. Multiple peak fitting of (a) mineral oil, (b) palm oil, (c) mineral oil with 0.02 g/L CNT, (d) mineral oil with 0.03 g/L CNT, (e) palm oil with 0.02 g/L CNT, (f) palm oil with 0.03 g/L CNT.
Energies 15 01534 g005
Figure 6. The Raman spectra at 1448 cm−1 region for (a) mineral oil and mineral oil with 0.02 g/L and 0.03 g/L CNT, (b) palm oil and palm oil with 0.02 g/L and 0.03 g/L CNT.
Energies 15 01534 g006aEnergies 15 01534 g006b
Figure 7. The Raman spectra of the oil samples from the 2800–3000 cm−1 region.
Energies 15 01534 g007
Figure 8. Principal component analysis model of the data set for six oil samples; (a) Score plot, (b) loadings scattered plot in PC1 and PC2, (c) loadings in PC1, (d) loading in PC2.
Energies 15 01534 g008aEnergies 15 01534 g008b
Table 1. Raman spectra information on two strong peaks at second order region.
Oil SamplesPeak 1FWHMAreaPeak 2FWHMAreaIG′/IG
Mineral Oil2858.4341.6049649,0832918.1969.52141,022,0560.9795
0.02 g/L CNT + MO2857.8141.3858447,5162917.8370.4247729,0160.9794
0.03 g/L CNT + MO2858.6641.4006385,9852918.4069.2314612,1690.9795
Palm Oil2855.8019.335763,6972902.4882.2877279,0420.9839
0.02 g/L CNT + PO2852.8019.4551149,4802900.2684.4675693,8160.9836
0.03 g/L CNT + PO2850.4619.3156148,5362897.2684.5314698,1620.9838
Publisher’s Note: MDPI stays neutral with regard to jurisdictional claims in published maps and institutional affiliations.

