1. Introduction
Tight oil resources in the world are very rich and have great economic value. The proportion of tight oil reservoirs in China is gradually increasing, and the efficient development of such oil and gas resources is an important task in oil field [
1,
2]. However, due to poor physical properties, low permeability, small pore throat, and poor pore connectivity of tight oil reservoirs, it is difficult for injected water to enter deep strata and the oil recovery is low in the process of conventional waterflooding development [
3,
4,
5].
Improving the production of matrix crude oil is the key to waterflooding development of tight oil reservoirs. Imbibition has obvious effects on the development of low-permeability, ultra-low-permeability, and even tight oil reservoirs and has become one of the important measures to improve the recovery of tight sandstone reservoirs [
6,
7,
8,
9]. Imbibition means that in the porous medium, the water phase (wetting phase) replaces the oil phase (non-wetting phase) through the action of capillary force. There are many factors that affect the oil displacement effect by imbibition, such as reservoir physical properties, fluid characteristics, temperature, and pressure [
10,
11,
12,
13,
14].
Surfactant has good ability to reduce interfacial tension and wetting reversal and is a commonly used imbibition system [
15,
16,
17,
18,
19,
20]. On the one hand, surfactant can improve the wettability of the reservoir rock surface, changing it from oil-wet to water-wet, and capillary force becomes the driving force for core imbibition. On the other hand, surfactant can reduce the oil/water interfacial tension and reduce the adhesion work of crude oil peeling from the wall of porous medium, reduce the Jamin effect of oil drop passing through the pore throat, and make more crude oil be converted into movable oil for production. Many scholars at home and abroad have studied the application of surfactants in core imbibition and oil drainage. Chen et al. [
21] used surfactant to change the core wettability to water wet and the static imbibition recovery rate reached 65.2%. Xie et al. [
22] found that the injection of 0.2% DWS surfactant can increase the dynamic imbibition recovery by 16.2%. Lu et al. [
23] observed that under the action of surfactant, the recovery rate of core dynamic imbibition was almost twice that of static imbibition.
For the dynamic imbibition process of surfactants, the flow velocity during the displacement process is also an important factor that affects the ultimate recovery of imbibition [
24,
25,
26]. In the process of displacement, too high or too low a flow rate of surfactant injection is not conducive to oil recovery by surfactant imbibition [
27]. When the injection flow rate is too high, although the displacement effect can be fully exerted, in this case, the imbibition system will be taken away by the high-velocity solution before it has time to infiltrate into the matrix, which is not conducive to the imbibition system giving full play to the imbibition effect and can also cause serious water channeling problems [
28]. When the injection flow rate is too low, it will appear to be a problem of insufficient driving power, and the oil from the matrix infiltration into the fracture cannot be fully carried out, which will also affect the ultimate oil recovery [
29]. Bingyu Ji et al. [
30] thought that there is an optimal displacement velocity for the water-wet dual media model through mathematical model calculation and analysis. Yuqiang Peng et al. [
31] studied the impact of injection rate on sandstone imbibition and found that the saltwater imbibition recovery rate first increased rapidly, then decreased rapidly, and finally stabilized. There is also an optimal displacement rate.
At present, research on dynamic imbibition of core mainly focuses on enhancing oil recovery after the action of surfactant. However, when oil drop discharges from core, it is accompanied by a series of processes such as appearance, growth, and discharge, and the characteristics of the discharge action of imbibed oil drops and the influence of the discharge behavior are still unclear.
In this study, the pore and throat structure and mineral composition of the core sample are analyzed first, and then the oil drop visualization instrument was used to observe the discharge phenomenon of oil drops during dynamic imbibition process. The oil drop discharge form was analyzed and the influence of various factors on the oil drop discharge behavior was explored, so that its dynamic imbibition performance of surfactant in tight cores was obtained, which can be used to optimize the fluid properties and production strategy during imbibition in the matrix near fracture. At the same time, for tight reservoirs, increasing the fracture network complexity and expanding the contact area between liquid and fractures will help to improve the recovery. This study provides a basis for surfactant to improve dynamic imbibition oil recovery performance of tight sandstone reservoir.
2. Experimental
This part consists of three parts: materials, equipment, and procedure.
2.1. Materials
The tight sandstone core samples were outcrop from the upper Shaxi Temple formation of the middle Jurassic in Sichuan, China. The permeability range of the cores was 0.3–0.45 mD and the porosity range was 13.4–13.9%. The permeability of cores used in the comparative experiment was 5.3 mD,20.1 mD and 49.9 mD, respectively. Furthermore, the porosity was 11.3–16.7%. Mixed oil was prepared from the mixture of dehydrated crude oil (Jimsar block, Zhundong Oilfield, China) with kerosene by the volume ratio of 1:4. The viscosity of oil is 1.59 × 10
−3 Pa·s at 80 °C. Compared with crude oil, the mixed oil has better injection performance under laboratory condition. Cocamidopropyl sulfobetaine (ASB, Connaught Industry, Shanghai, China), was used as a surfactant and was configured with synthetic formation water. The total dissolved solids (TDS) of the synthetic formation water in this study was 29,790 mg/L, and the specific ion composition is shown in
Table 1.
2.2. Equipment
Goniometer (JC2000D, Powereach, Shanghai, China) was used to measure the contact angles of oil drops on the core chips surface. Helium porosimeter (PMI-100, Yineng, Beijing, China) was used to measure the effective porosity. Gas permeameter (ULP-613, Beijing Yineng, Beijing, China) was used to measure Klinkenberg permeability of the cores. Electric dehydration apparatus (DIS-2, Jiangsu Hongbo, Jiangsu, China) was used for dehydration of crude oil. Core vacuum pressure saturation device (BH-1, Jiangsu Hai‘an, Jiangsu, China) was used to saturate the core sample with oil under high pressure. Viscometer (PVS, Brookfield, Middleboro, MA, USA) was used to measure the viscosity of oil. Fully automatic mercury porosimeter (IV9520, Micromeritics, Norcross, GA, USA) was used to measure core pore size. DMAX-3C diffractometer (XRD, Rigaku Corp, Tokyo, Japan) was used to determine core mineral composition.
2.3. Procedure
Firstly, the pore throat structure and mineral composition of the core were tested, and then the experiment on discharge behavior of oil drop in dynamic imbibition was carried out.
2.3.1. Measurement of Pore and Throat Structure of Core Sample
The high-pressure mercury intrusion experiment is an important way to obtain the characteristic parameters of reservoir rock pore throats [
32]. The basic principle of high-pressure mercury injection is that the non-wetting phase mercury overcomes the capillary resistance and enters the pores. The core sample was put into a closed dilatometer and evacuated for testing. The mercury injection process was a step-by-step pressure increasing process. After the pressure was stable, the accumulated mercury inlet saturation under this pressure was measured, and the volume of mercury entering the pore represented the volume of the connected pore under this pore throat size.
2.3.2. Quantitative Analysis of Core Mineral Composition
In order to avoid the destruction of the mineral crystal structure, 60–100 g of the dried core sample is selected to be artificially broken into powder. About 5 g was put into an agate mortar and ground to about 300 mesh, and the core mineral X-ray diffraction test was performed.
2.3.3. Discharge Behavior of Oil Drop during Dynamic Imbibition
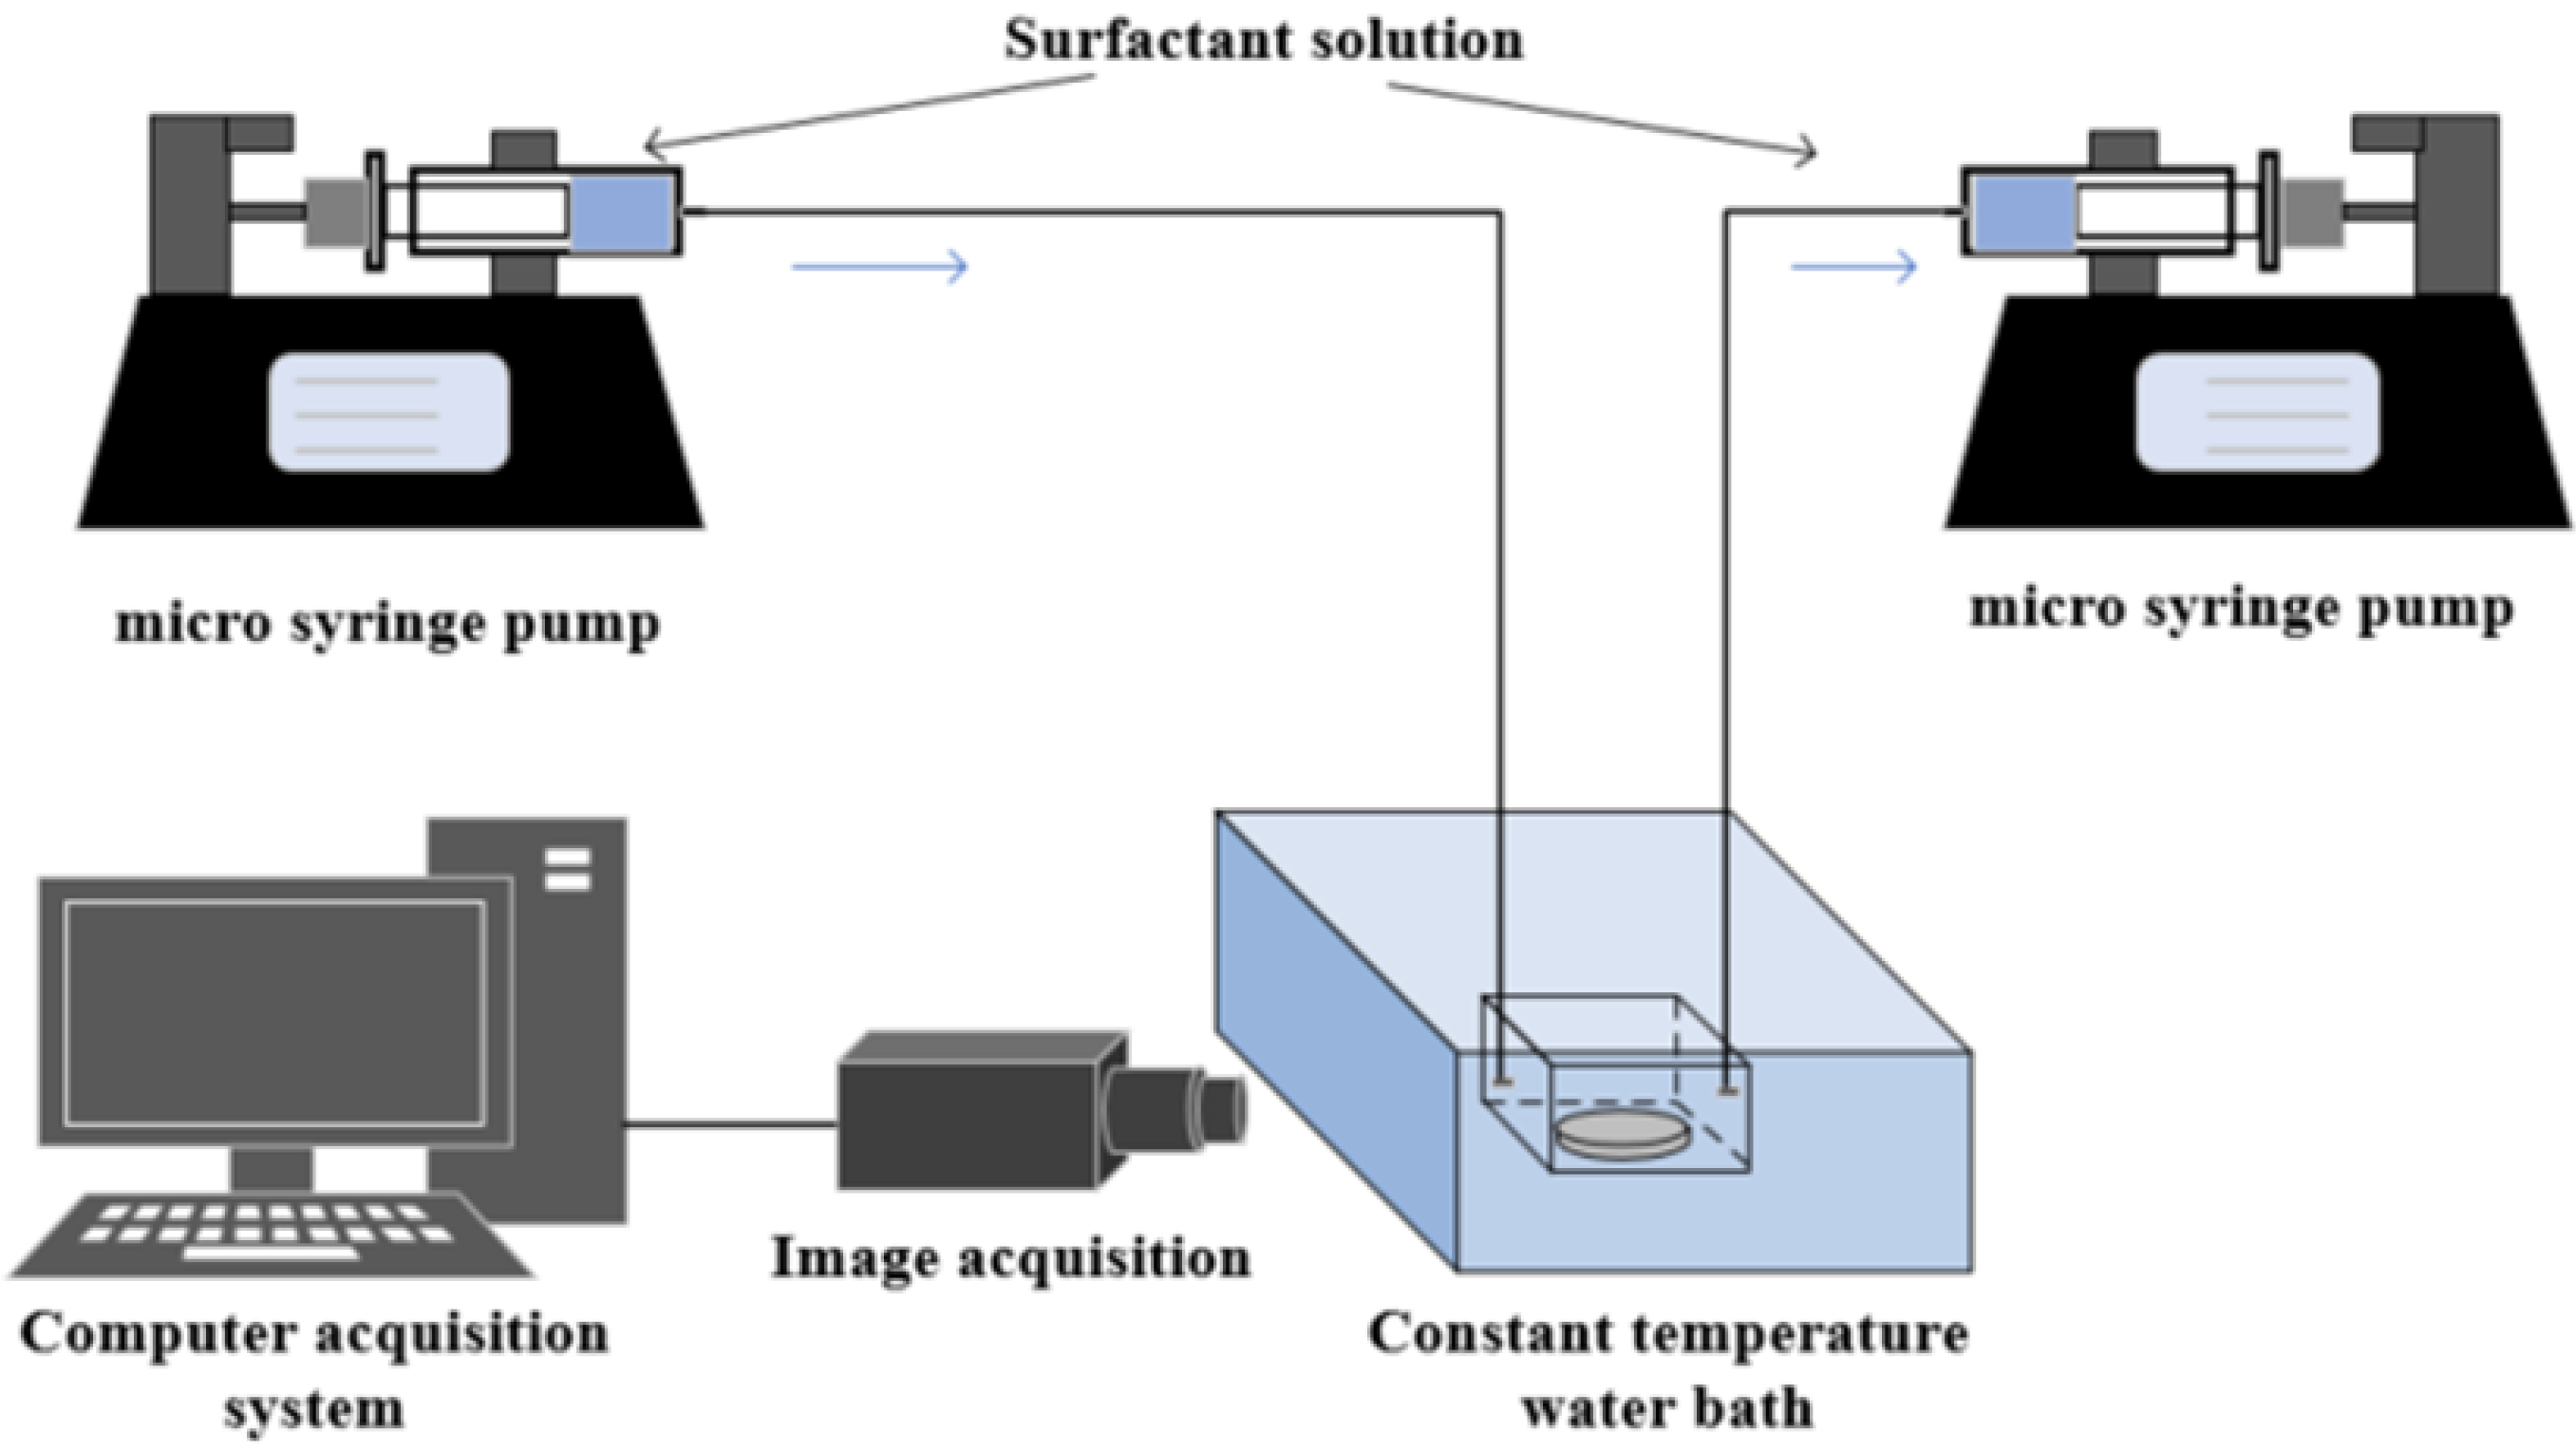
In order to observe the discharge phenomenon of oil drop in the dynamic imbibition process and explore the influence of various factors on the behavior of oil drop discharge, a microscopic experimental device for observing discharge of oil drops from tight core was designed, as shown in
Figure 1.
The experimental instrument was used to record the growth and discharge process of oil drops in dynamic imbibition. The specific experimental steps are as follows:
- (1)
The core was cut into different lengths: 0.5 cm, 1 cm, 1.5 cm, 2 cm. Then, the core is cleaned with ultrasonic for 5 min to remove the blockage of core pores caused by dust;
- (2)
The core chips were dried in a 110 °C oven for more than 8 h, and the dry weight was weighed;
- (3)
The core chips were saturated with oil under high pressure of 20 MPa, and the wet weight of the cores was weighed. Then saturated core chips were soaked in mixed oil for later use;
- (4)
Synthetic formation water was prepared, and surfactant solutions with different concentrations were prepared with synthetic formation water. The surfactant solutions were vacuumed to eliminate bubbles inside;
- (5)
The circulating water bath was opened and the temperature was set at 80 °C. The surfactant solution was poured into the transparent sample container in circulating water bath, and the temperature of the surfactant solution was measured after 30 min of circulation;
- (6)
The core chip was immersed in surfactant solution, and the surface of the surfactant solution was kept at a fixed distance from the core chip during the experiment;
- (7)
The micro syringe pump was filled with surfactant solution. The injection pump was turned on to inject it into the sample container at a constant flow rate of 1 mL/min. At the same time, in order to ensure that the liquid level in the container was always the same, the extraction pump was also turned on at a speed of 1 mL/min;
- (8)
The position between the sample and the camera was adjusted so that the shape of oil drop can be observed clearly. The camera was turned on and the process of oil drop growth and discharge from the surface was photographed and captured at regular intervals;
- (9)
The first few oil drops discharged from the surface of the sample were observed. The photos taken after the experiment were analyzed.
3. Results
Firstly, the core properties were analyzed, then the discharge characteristics of oil drop in the process of dynamic imbibition were observed, and the influence of various factors on oil drop discharge behavior was further explored.
3.1. Analysis of Core Properties
Dynamic imbibition effect of tight reservoir is influenced by pore structure and mineral composition.
3.1.1. Pore Size Characteristic
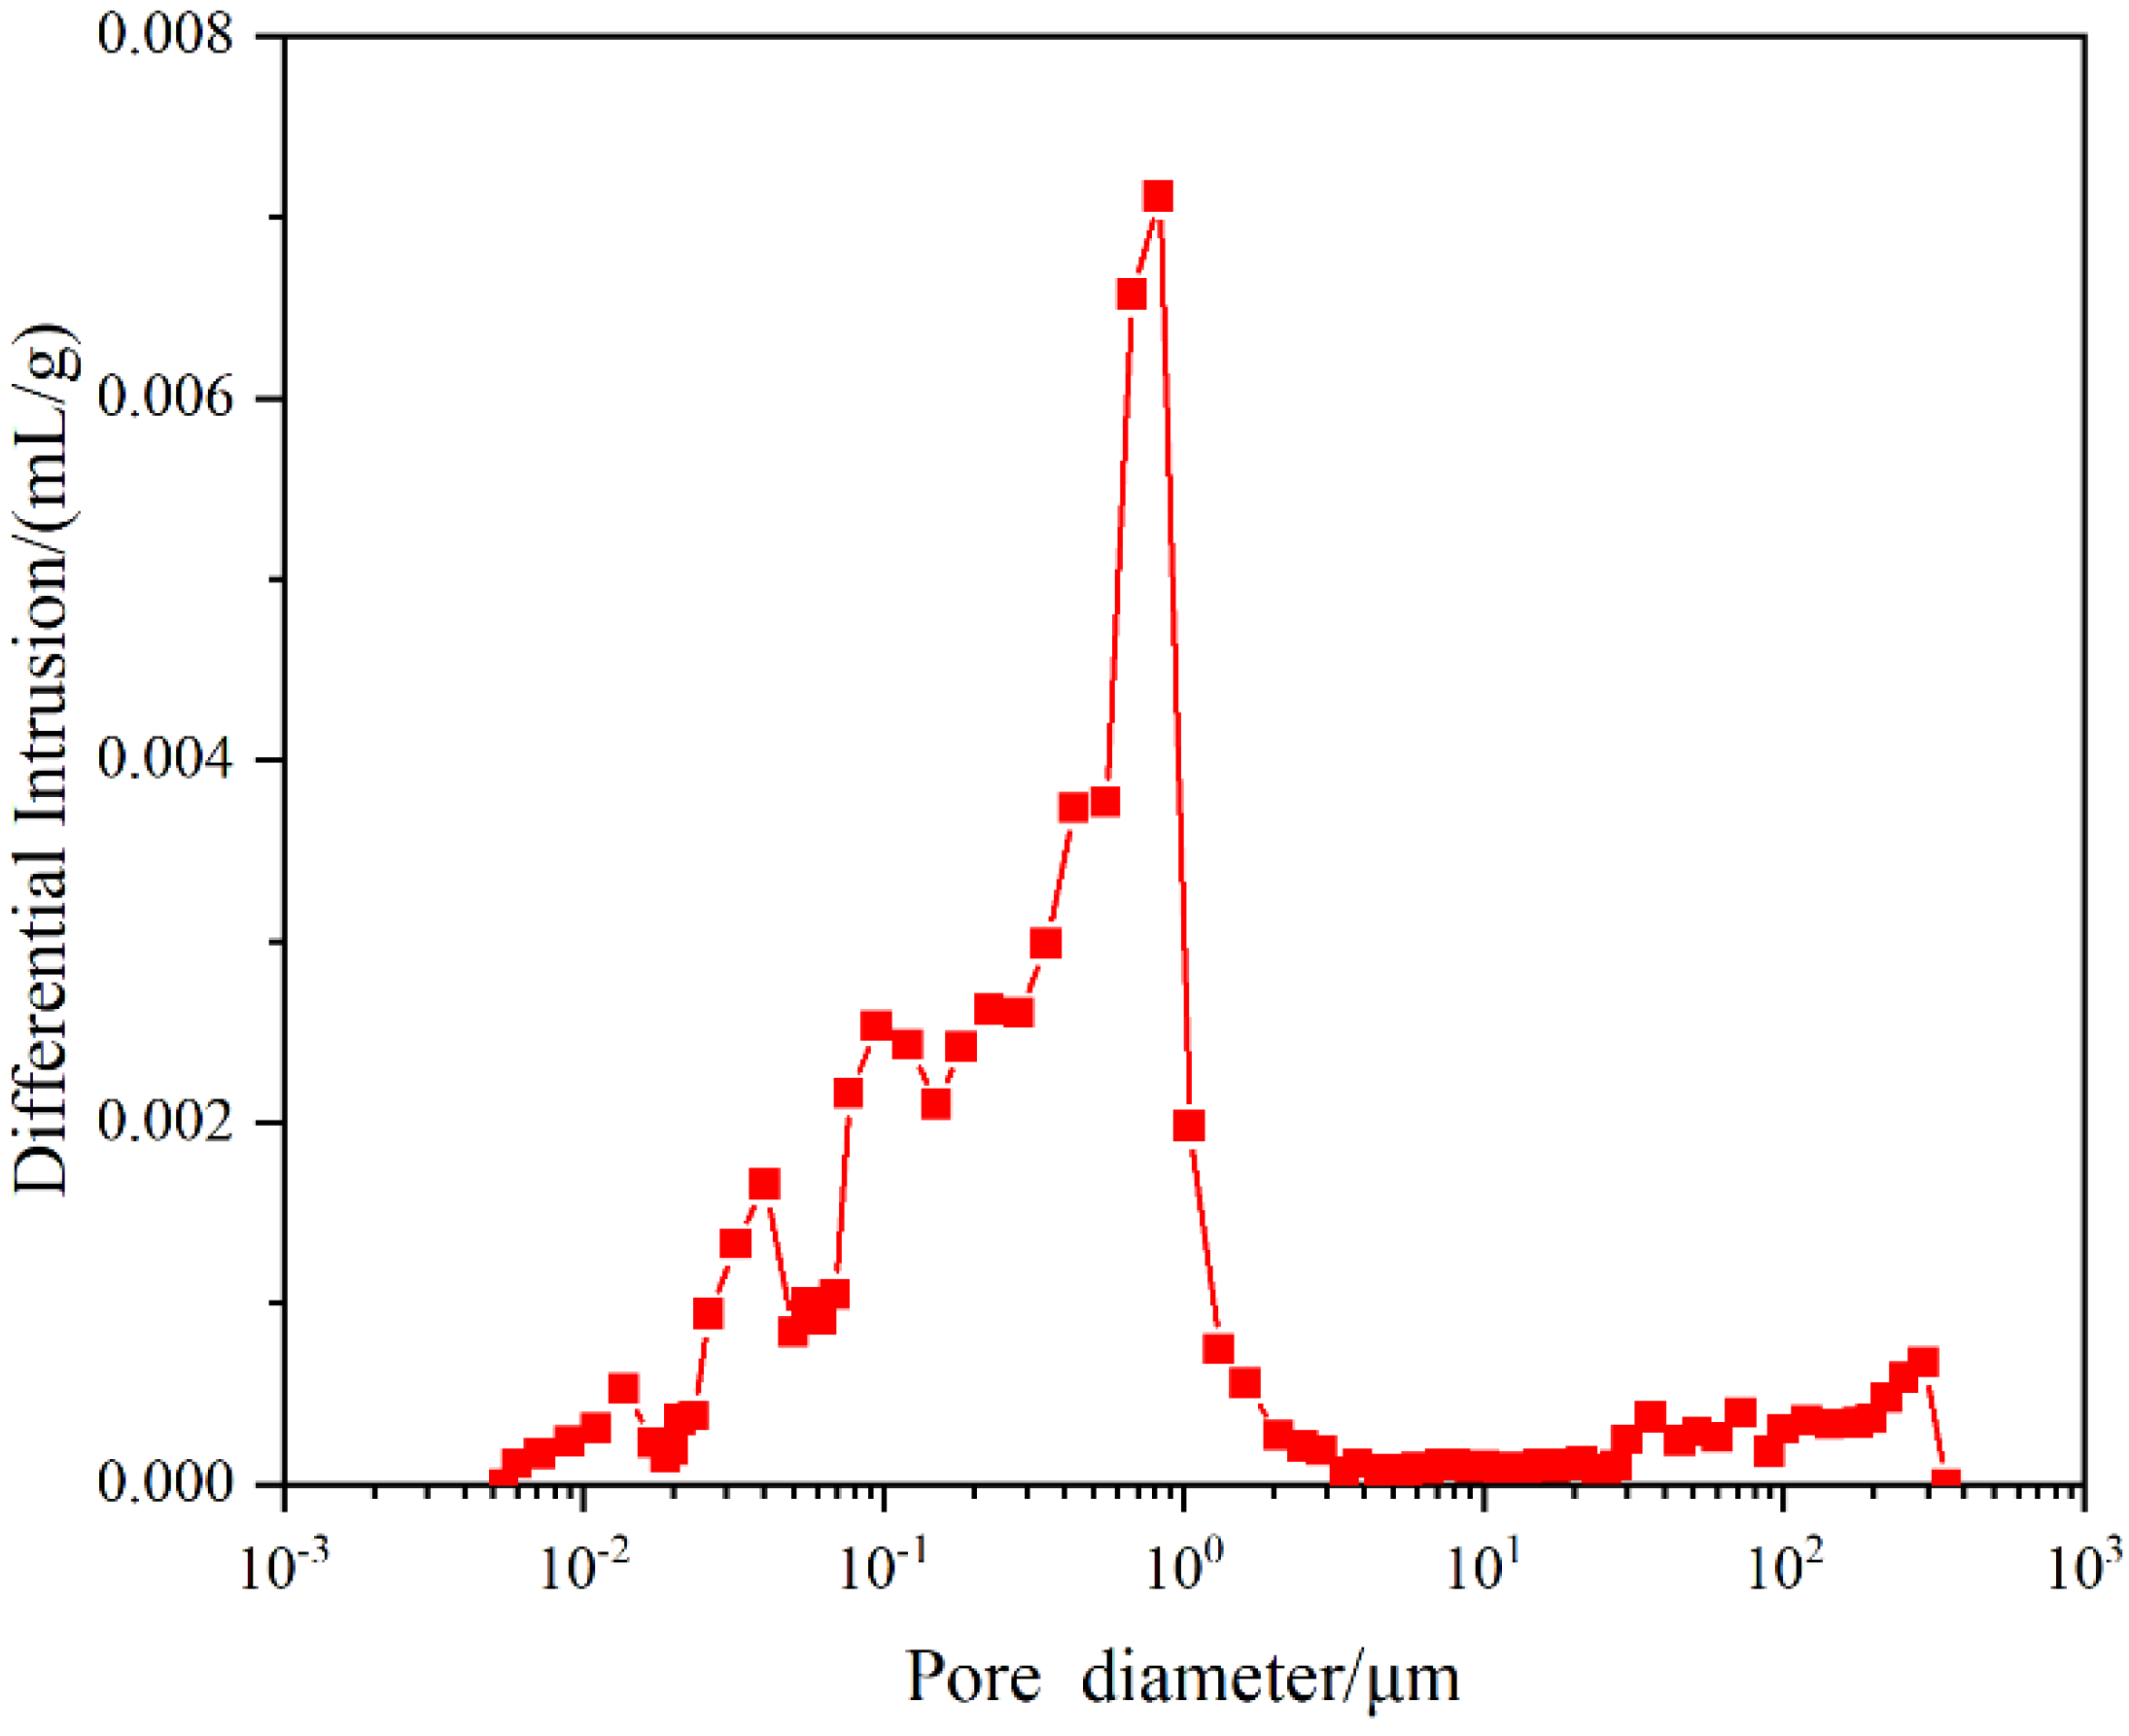
The pore throat structure of tight reservoir is very complex, which has a great influence on the imbibition of tight reservoir. The results of mercury intrusion experiments can be used to indirectly study the characteristics of reservoir pore throats. The measurement result of pore throat distribution of 0.35 mD core is shown in
Figure 2.
The core pore diameter of tight oil reservoir basically presented a single-peak distribution characteristic, and the diameter was mainly distributed in the range of 0.07–1.1 μm. Different pore diameters have different contributions to the imbibition effect. There were also a small number of small pores distributed in the range of 0.006–0.07 μm and large pores distributed in the range of 30.1–293.3 μm. Smaller pores have greater capillary force, which will promote the imbibition of water phase. However, the core pore diameter is small, the internal throats are staggered, and the complex pore throat structure will increase the resistance of the oil drop discharge from the core in the process of imbibition.
3.1.2. Mineral Composition
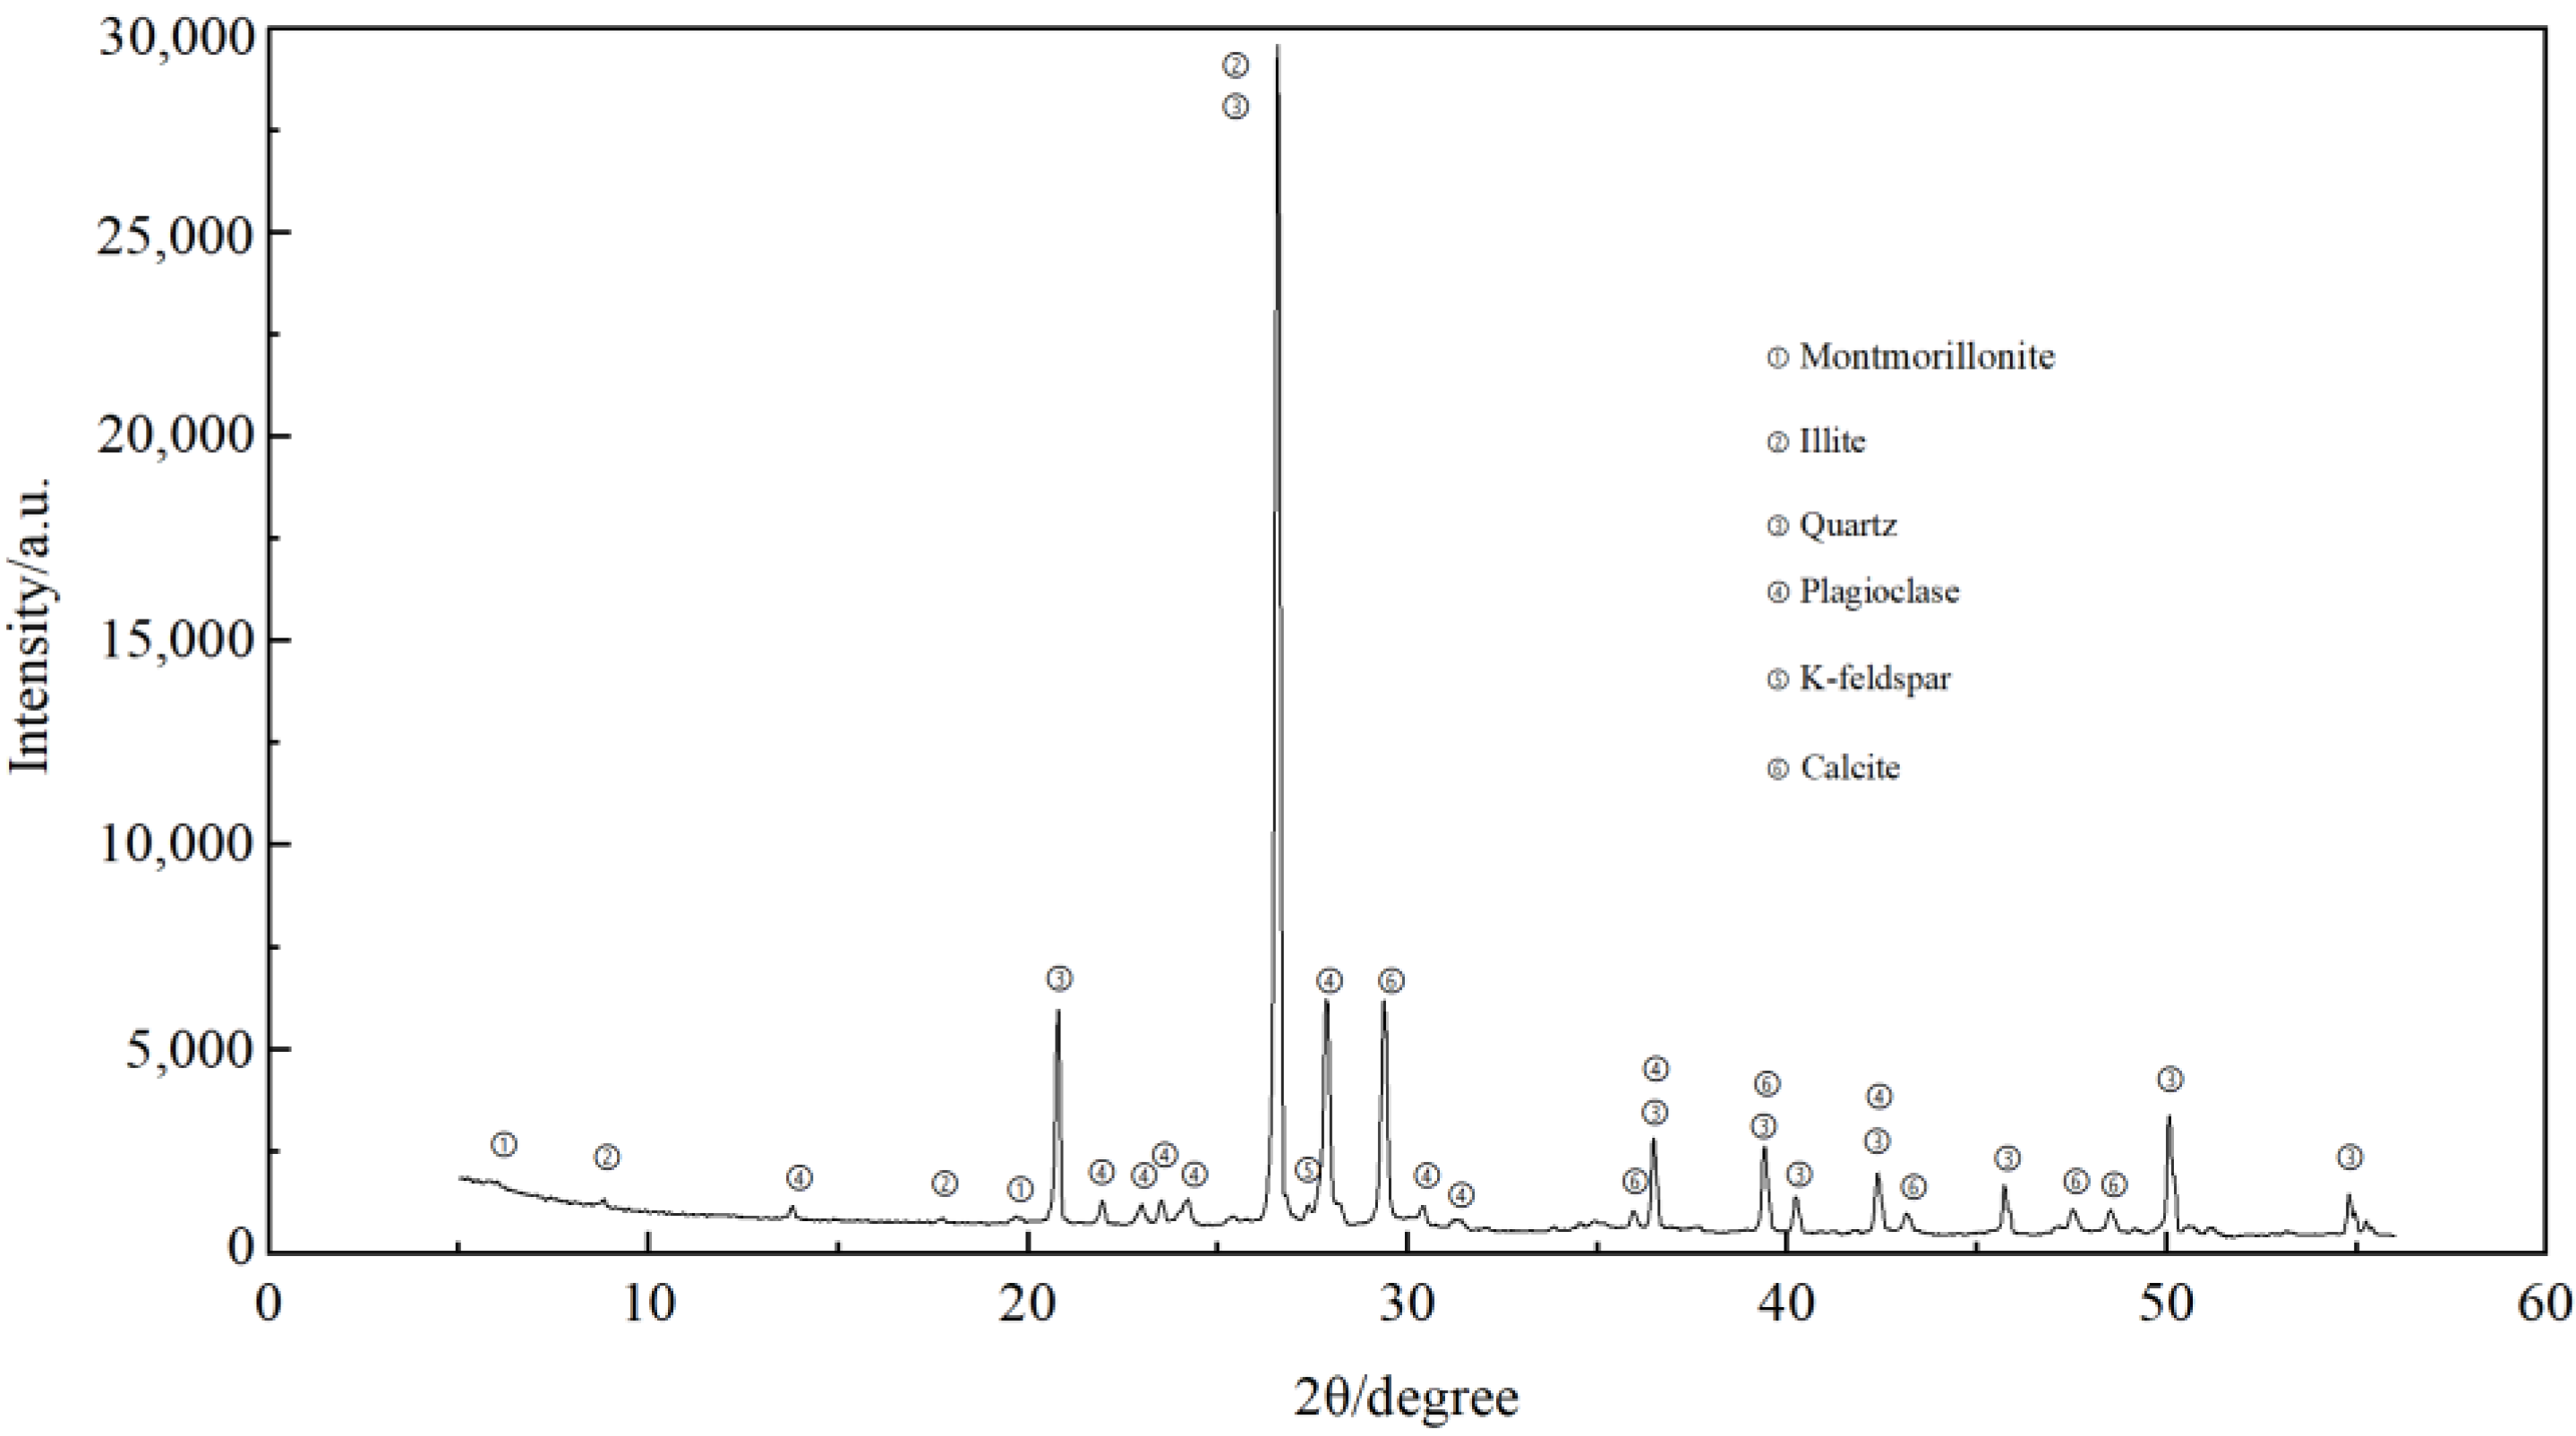
The wettability of sandstone is affected by the relative content of hydrophilic minerals (Quartz, Illite), intermediate wettability (Calcite, Feldspar), and lipophilic minerals (Illite and Montmorillonite mixed layer, Chlorite), and the imbibition effect is related to the wettability [
33]. The mineral X-ray diffraction pattern of the core sample is shown in
Figure 3, and the main mineral content in the core sample is shown in
Table 2.
In this experiment, the core mineral composition was dominated by Quartz (average content of 49.6%), followed by Plagioclase (average content of 27.8%). Clay content was 4.7%, of which the average content of Illite was 1.2% and the average content of Montmorillonite was 3.5%. The hydrophilic mineral content in the core reached 50.8%, so it exhibited hydrophilic properties and helped the process of imbibition.
3.2. Discharge Process of Oil Drop during Dynamic Imbibition
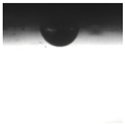
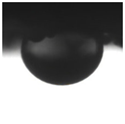
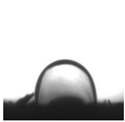
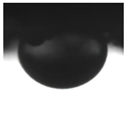
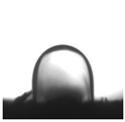
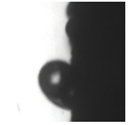
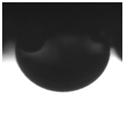
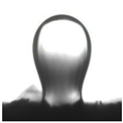
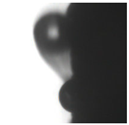
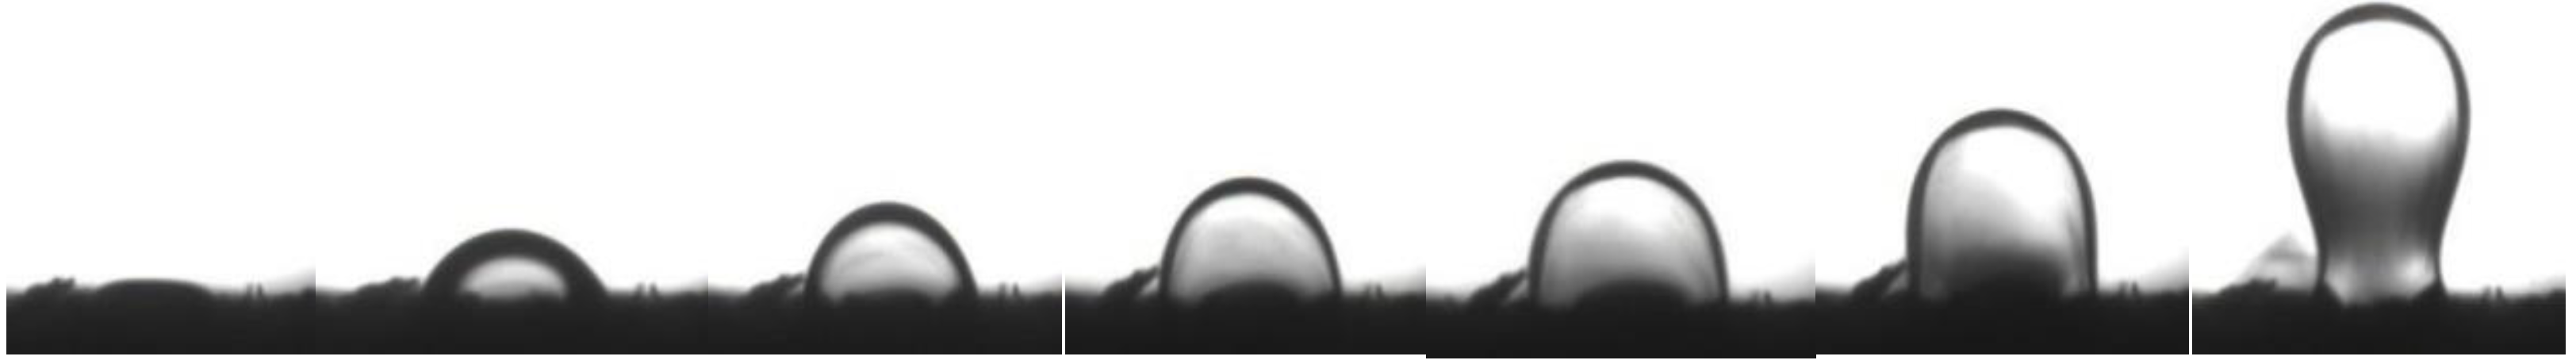
Core chips soaked in surfactant solution will spontaneously imbibe and discharge oil drops. Under the action of water flow, dynamic imbibition occurs. The morphological changes of discharged oil drop on the surface of a tight core chip during imbibition are shown in
Figure 4. In order to quantitatively describe the size of the oil drop growth and growth rate, while considering that the oil drop is not a regular shape during the growth process, the maximum width and maximum height of the oil drop are used to describe the size of it. According to the pixel measurement of the oil drop size in the obtained picture and the magnification used by the camera during the experiment, the actual size of the oil drop can be obtained.
In the process of imbibition, the growth rate of oil drop in height was greater than that in width. With the increasing volume of oil drop, the shape of it gradually changed from a semicircle to inverted drop shape and finally separated from the surface of core chip.
3.3. Discharge Behavior of Oil Drop during Dynamic Imbibition
A variety of physical parameters (surfactant flow rate, oil/water interfacial activity, fracture direction, core chip thickness, permeability, and other parameters) can affect the discharge behavior of oil drop.
3.3.1. Effect of Surfactant Flow Rate
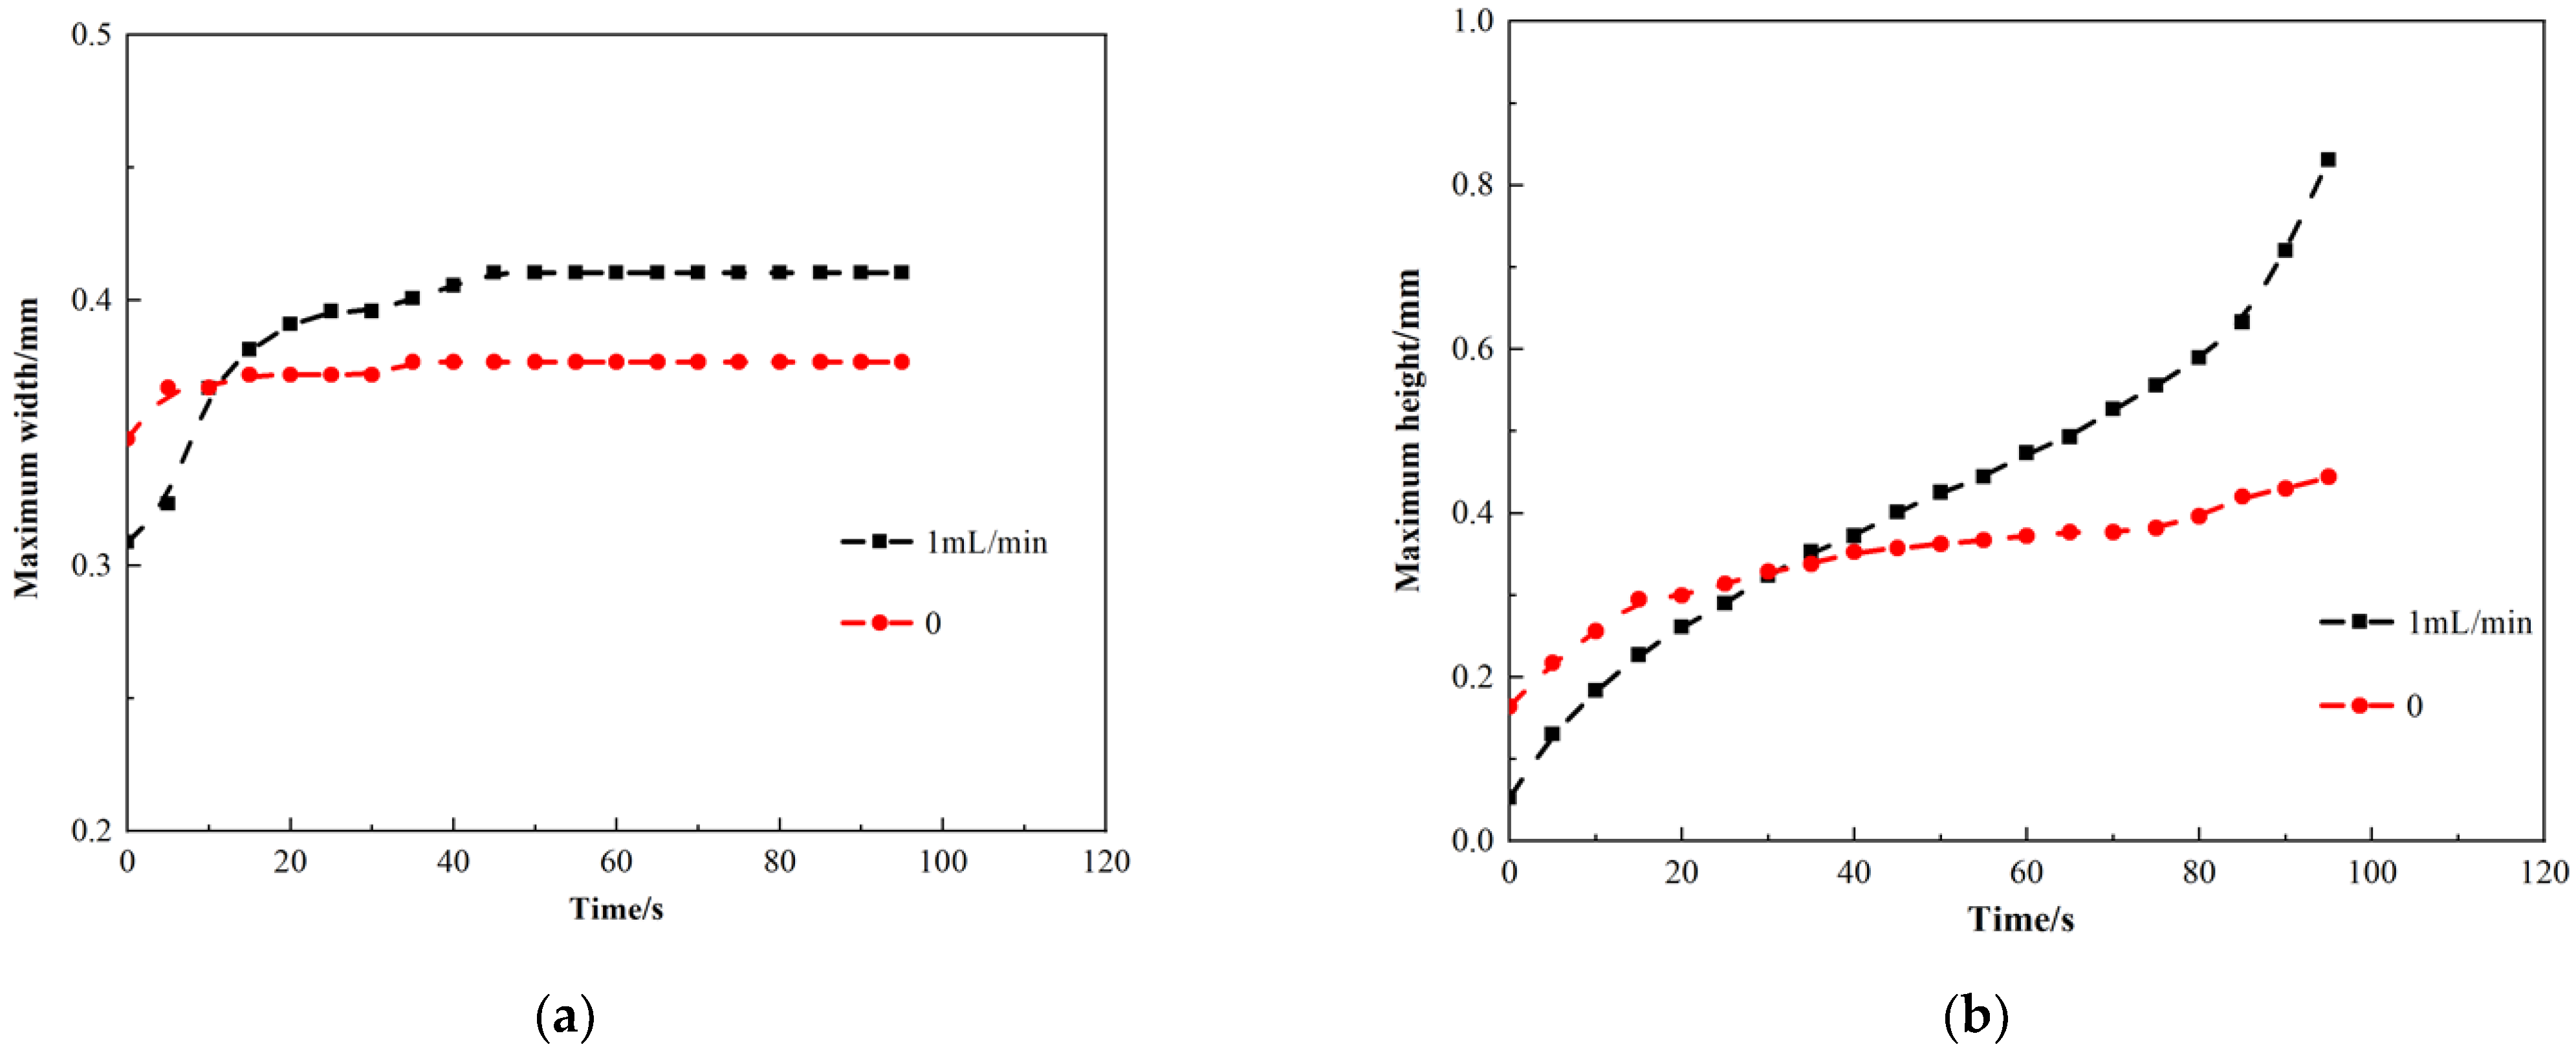
In this experiment, the discharge behavior of oil drop at different flow rates was investigated. A 0.1% ASB surfactant solution was prepared in the experiment, the core chip saturated with oil was immersed in surfactant solution, and the circulating water bath was opened and the temperature was set at 80 °C. The injection pump was turned on to inject the surfactant solution at a constant flow rate of 1 mL/min. At the same time, in order to keep the liquid level of transparent container constant, the extraction pump was also turned on at a speed of 1 mL/min. Then, a new core chip was replaced, and the pump speed was changed to 0, and the comparative experiment was carried out. The comparison of maximum width and height of oil drop at different flow rates was shown in
Figure 5.
In the case of external fluid flow, the oil drop discharge process was faster. The growth rate of oil drop in height and width was faster than that without fluid flow. The height of the oil drop increased more obviously, which was helpful for oil drop to separate from the solid surface. When there was an external fluid flowing, there would be a shearing effect on the growth of oil drop. It could promote the drainage of oil drop from the surface of the core slice to a certain extent. In the later stage of oil drop growth, the height of oil drop was larger in the presence of external fluid. The external shearing force exerted greater force on the long side of inverted drop shape (i.e., the maximum height of the oil drop).The oil drop broke away from the surface of core chip faster and discharged at the later stage, and the height of the oil drop increases faster.
However, due to low injection speed of the surfactant solution, the shearing effect caused by the flow was very weak. Therefore, from the experimental results, the growth rate of a single oil drop was not much faster in the presence of external fluid flow. Considering the actual reservoir situation, there were two processes: oil drop was discharged from rock surface in imbibition process and driven by water flooding in fractures. Only when the speed of these two processes matched could the maximum recovery be achieved. Compared with the previous dynamic imbibition study with matrix-fracture model [
34], if the surfactant flow rate was too fast or too slow, the oil recovery rate was not the best. Only at a suitable surfactant flow rate, the oil recovery by surfactant imbibition could reach the maximum oil recovery.
3.3.2. Effect of Oil/Water Interfacial Activity
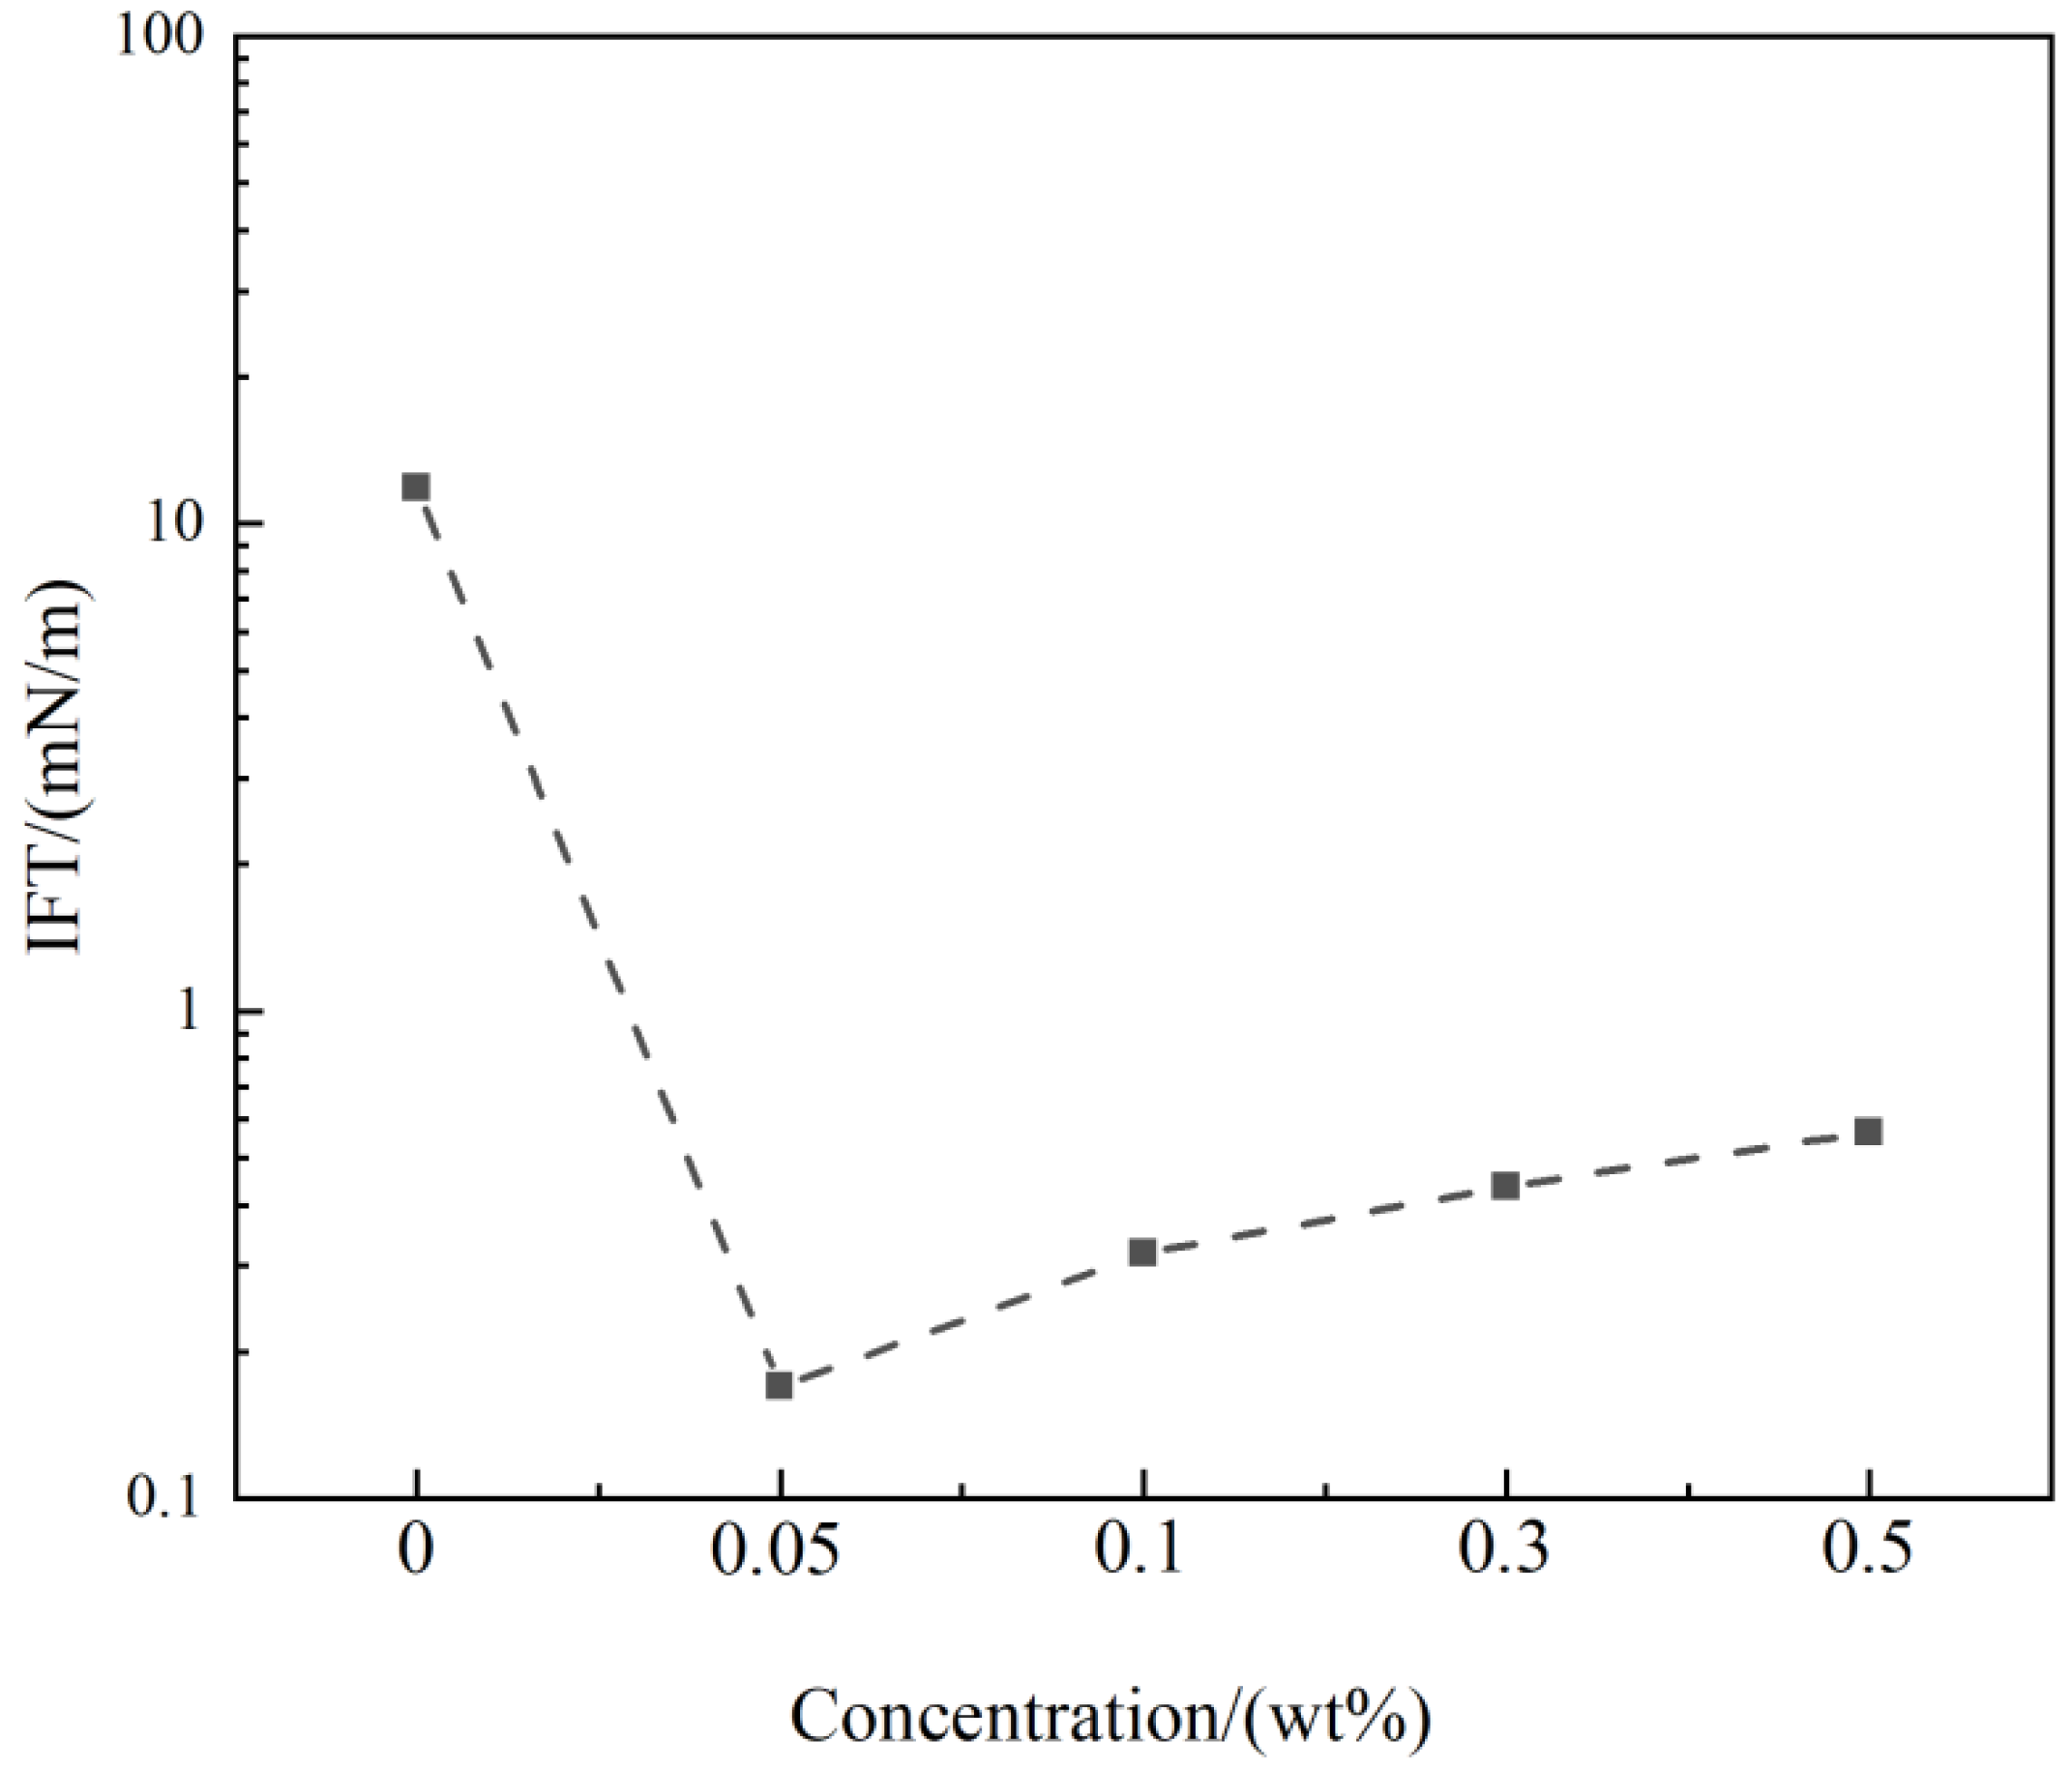
The main driving force affecting the occurrence of imbibition is capillary force, and IFT is a major factor affecting capillary force. In this part of the experiment, the behavior of oil drop discharge under different oil/water IFT conditions (
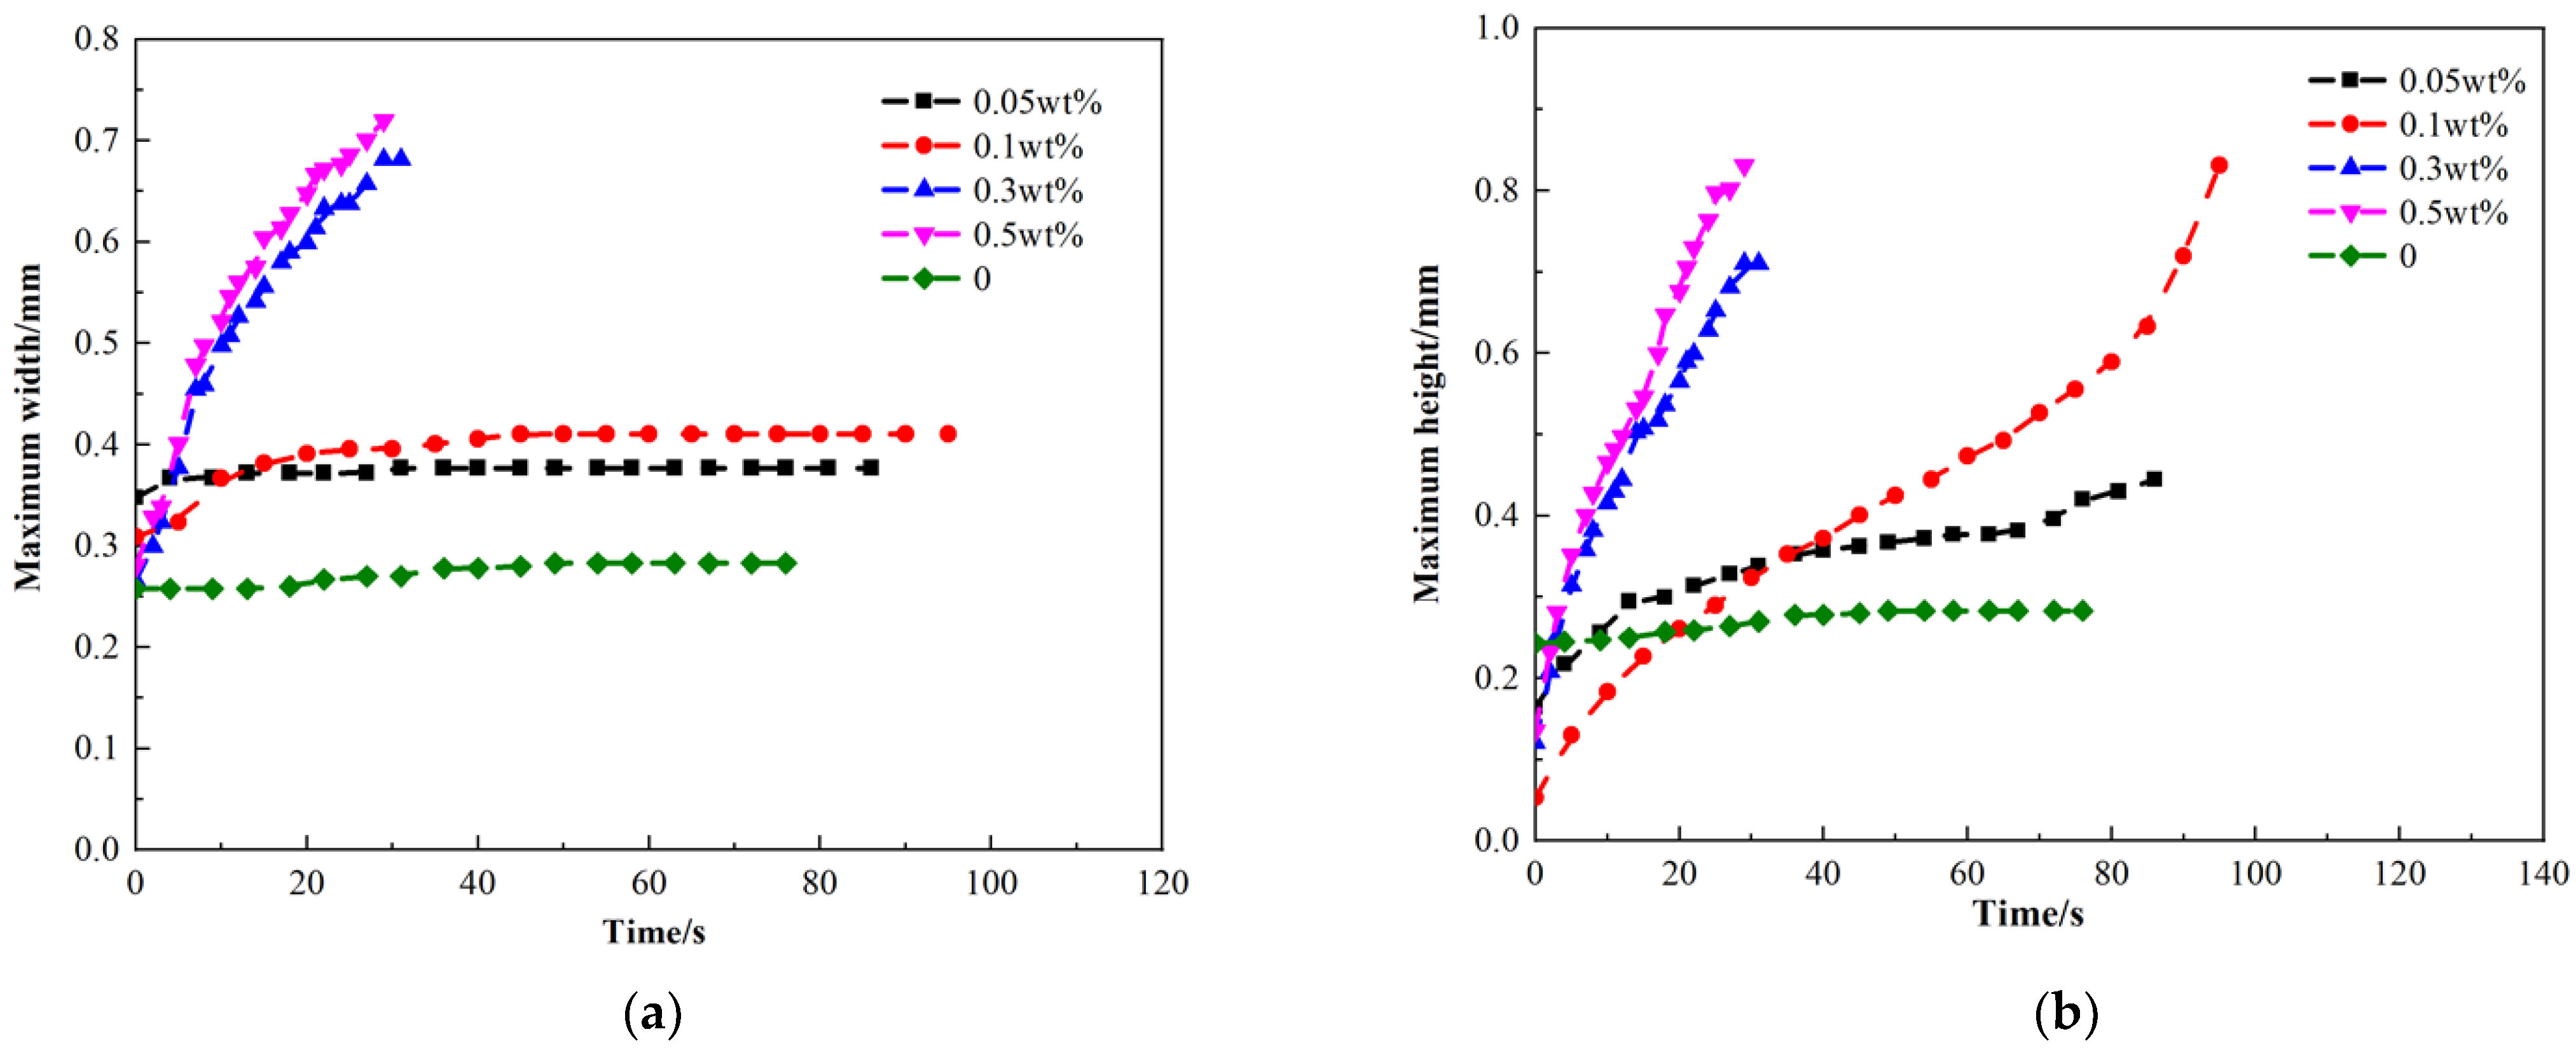
Figure 6) was investigated. ASB surfactant solutions with mass concentrations of 0.05%, 0.1%, 0.3%, and 0.5% were selected, the oil-saturated core chips were immersed in surfactant solution with different concentrations and synthetic formation water respectively, and the discharge process at 80 °C was observed and recorded. The maximum height and width of oil drop are used to reflect the size of the growth of oil drop. The experimental results are shown in
Figure 7:
When solution contained surfactant, as the concentration of surfactant increased, the interfacial tension (IFT) gradually increased. The discharge rate of oil drop in the fracture gradually increased, which meant the rate of imbibition gradually increased. The IFT increased from 0.32 mN/m to 0.59 mN/m, and the breaking time of the discharged oil drop was reduced by 66.3%. However, in synthetic water group with high IFT, the discharge rate was much slower. The main driving force for imbibition was capillary force. It is the motive force for water to enter the core spontaneously, and it increased with the increase of IFT. Within a certain range, as the IFT increased, the imbibition rate gradually increased, but this growth relationship was limited. The adsorption of surfactants on the oil/water interface can effectively reduce the IFT, which meant that the adhesion work was reduced, resulting in an enhanced ability of the oil to desorb and deform from the pore wall, and the displacement efficiency was improved. With the increase of surfactant concentration, the displacement efficiency was also correspondingly increased, resulting in the improvement of imbibition rate. For tight oil reservoirs, in order to improve the recovery, it was not necessary to pursue low IFT only but to consider various factors comprehensively to obtain the maximum oil recovery.
3.3.3. Effect of Oil Drop Discharge Direction
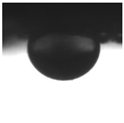
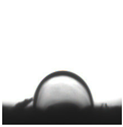
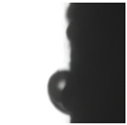
Artificial fractures formed by fracturing communicate with natural fractures, and the formed fractures have multiple directions. In order to simulate the discharge of oil drops at different positions of the actual oil layer wall, ASB surfactant solution with a mass concentration of 0.1% was prepared, and the oil-saturated core chips were immersed in the surfactant solution at 80 °C. The position of the core chip in the surfactant solution was adjusted, and the oil drops on the top, bottom, and side of the core sheet were observed and recorded respectively. Typical images of oil drops at different positions are shown in
Table 3.
The growth rate and discharge characteristics of oil drops from the top, side, and bottom surfaces were very different. Compared with oil drop discharged from the bottom of the core, the oil drops discharged from the top and sides of the core grew faster and were easier to discharge. The pictures of oil drops at different positions at the same time interval are captured in
Table 2. It could be clearly observed that the growth rate of oil drop from the top surface was the fastest, while the growth rate of oil drop from the bottom surface was the slowest. This was because when the core chip was immersed in the surfactant solution, the imbibition effectively occurred at 80 °C. For the oil drops appearing on the wall of core, they were mainly affected by gravity, buoyancy, capillary force, and viscous force caused by the flow of external fluid.
The difference between oil drops at the top and bottom of the core was mainly due to buoyancy [
35]. When the oil drop was immersed in surfactant solution, it was mainly affected by the combined forces of vertical downward gravity, vertical upward buoyancy, and capillary force perpendicular to the wall surface. Capillary force was always a driving force for the growth and separation of oil drop. Therefore, for the oil drop emerging from the top surface of the core chip, the direction of the buoyancy force and capillary force was the same. In other words, in this case, buoyancy was an effective supplement to the growth of oil drop. Therefore, oil drop could be easily discharged from the surface of the core. On the contrary, for oil drop emerging from the bottom surface of the core chip, the buoyancy force was opposite to the capillary force, resulting in the buoyancy force acting as a resistance to the growth of the oil drop. Therefore, the growth rate of oil drop would become slower. For the oil drop emerging from the side of the core chip, the direction of buoyancy was perpendicular to the capillary force direction, so the buoyancy force was not as good at promoting the growth of the oil drop.
For the oil drop discharged from the side of the core, compared with oil drops discharged from the top and bottom, the difference in oil drop size characteristics was too obvious to be able to be directly compared effectively. Therefore, the following mainly discussed the related characteristics of the growth of oil drops discharged from the top and bottom of the core chip. The change of oil drops during the experiment is shown in
Figure 8:
The maximum width and height of the oil drop is gradually increased with time until it stabilized at the end. The height of the oil drop discharged from the top of the core chip increases faster and faster with time, and the height of the oil drop discharged from the bottom of the core chip gradually slowed down. In the vicinity of 100 s, the height and width of the oil drop discharged from the top of the core no longer changed. This was because the buoyancy force at this moment gradually increased due to the gradual increase in volume, both buoyancy and capillary force. The resultant force overcame the effect of gravity, causing the oil drop to float away from the core chip. The oil drop discharged from the bottom of the core chip prevented the oil drop from rising due to the presence of the core chip. At the same time, the bottom surface of the core chip was flat and level, and the oil drop was not easy to flow away from the side surface. In the time range of the experimental observation, the oil drop did not separate from the surface of the core chip but eventually grew at a steady rate. Therefore, the final width of the oil drop discharged from the bottom surface was larger than that discharged from the top. For tight oil reservoirs, fracturing creates more fracture surfaces, which help to provide more contact surfaces, so that oil drops can be more easily discharged from the upper surface of the fracture. This can effectively improve the oil recovery rate in matrix near fractures and higher oil recovery.
3.3.4. Effect of Core Chip Thickness
The experiment investigated the influence of different core chip thickness on the oil drop discharge process. In the experiment, the core chips with thicknesses of 0.5 cm, 1 cm, 1.5 cm, and 2 cm saturated with experimental mixed oil were immersed in 80 °C ASB surfactant solution. The growth and separation process of the oil drops were recorded by the camera. The width and length of oil drops discharged on core chips of different thicknesses are shown in
Figure 9:
The smaller the thickness of the core chip, the faster the width and length of the oil drop increased. The core thickness was reduced from 2 cm to 1 cm, and the oil drop rupturing and rising time was reduced by 74.7%. This was related to the amount of oil saturated in the core chip. Of the four core chips with different thicknesses in the experiment, the maximum width of the oil drop was increasing. For samples with larger thicknesses (1.5 cm and 2 cm), it could also be observed that the oil drop had a rapid growth at the beginning and a relatively gentle growth in the later period. For a thin sample, the growth of the oil drop discharged from the sample had always maintained a relatively stable growth process.
To some extent, the growth rate of oil drop width and height reflects the overall imbibition rate of the core. The larger the core thickness, the lower the core imbibition rate. The thickness of the core does not affect the radius of the throat inside core, so it does not have much influence on the capillary force that drives the imbibition. However, with the increase of core thickness, the complexity of the throat interlacing inside the core increases, and the complicated throat structure makes the resistance of oil drop discharge in the process of imbibition increase correspondingly. Therefore, under the condition of the same capillary force, the larger the core thickness, the slower the oil drop was discharged from the core through imbibition, and the lower the imbibition rate macroscopically. For the transformation of tight oil reservoirs, fracture network fracturing combined with dense cutting technology can create more fracture surfaces, reduce the size of the matrix block, and help improve the oil recovery in the affected area through imbibition.
3.3.5. Effect of Core Permeability
ASB surfactant solution with a mass fraction of 0.1% was used, and the oil drop discharge process of core chips with different permeability (core permeability of 0.5 mD, 5.3 mD, 20.1 mD, and 49.9 mD respectively) at 80 °C was investigated. The experimental results are shown in
Figure 10.
As the permeability increased, the maximum width and height of the discharged oil drop increased faster, but the rapture time was extended by 4.8 times. For each oil drop observed in the experiment, the growth rate of its height and width reflected the growth characteristics of a single oil drop. From a macro point of view, this rate also reflects the imbibition rate of all cores to a certain extent. The occurrence of imbibition is mainly due to the effect of capillary force. For a core with a lower permeability, the inner pore throat diameter is also smaller. It can be known from the calculation formula of capillary force that the size of capillary force is inversely proportional to the size of core throat radius. However, the smaller the core permeability, the more nano-scale pores and throats exist in core. The existence of these pores and throats will produce strong Jamin effect, which will hinder the imbibition process of oil drop in core. This means that when the pores and throats inside the core become smaller, on the one hand, it can effectively provide more power for imbibition (the increase of capillary force), but on the other hand, it increases the resistance in the process of imbibition, and there is a competitive mechanism between them. When the permeability decreases, the growth rate of oil drop decreases, which means that the increase in resistance caused by the inner throat diameter of the core has a greater effect on the imbibition rate. It can be seen that during the development of tight oil reservoir, hydraulic fracturing forms a large number of fractures in the formation, which can effectively connect the matrix, reduce the resistance in the process of imbibition, and increase the rate of imbibition.
4. Discussion
Tight oil reservoirs have small pores and throats, and fluid flow is difficult. Even if the reservoir is fractured and oil production increases, the decline rate is still very fast. The formation energy is insufficient, so it is necessary to supplement the formation energy by injecting fluid. Tight oil reservoirs are mainly developed by water injection, but in the process of water injection development, it is difficult for the injected water to penetrate deep into the formation and the degree of crude oil recovery is low. The size of surfactant molecules is small, which can effectively enter deep pores and throats and maximize the use of crude oil in rock pores and throats. However, the resistance to the separation and discharge of crude oil in pores and throats of tight oil reservoirs is very large, and how to improve the dynamic imbibition rate is a difficult problem. Capillary action is the driving force that allows the imbibition solution to overcome some resistance and separates the oil from the surface of pores and throats. The energy used to overcome the resistance can be expressed by the adhesion work, with a smaller amount of adhesion work indicating a higher displacement effect. Reducing the adhesion work can effectively reduce the resistance to imbibition and increase dynamic imbibition rate. The adhesion-work reduction can be expressed by the adhesion-work-reduction factor E [
22]:
where W
s is the adhesion work of a compound system of surfactant/oil/rock, W
s = σ
s (1 − cosθ
s); W
w is the adhesion work of a compound system of water/oil/rock, W
w = σ
w (1 − cosθ
w); E is the adhesion-work-reduction factor; σ
w is the IFT between oil and water (in mN/m); σ
s is the IFT between oil and surfactant (in mN/m); θ
w is the contact angle of water on rock surface (in degrees); and θ
s is the contact angle of surfactant on rock surface (in degrees).
It can be seen from
Table 4 that E is greatly affected by the value of the IFT. The smaller the IFT, the smaller the E, the smaller the adhesion work, and the smaller the imbibition resistance. When the IFT increased from 0.16 mN/m to 0.59 mN/m, the contact angle only decreased from 96.07° to 86.65° [
34], and the E increased from 0.013 to 0.040. However, at the same time, because tight reservoirs were usually accompanied by the development of microfractures, when the surfactant flowed along the microfractures during the injection process, a higher recovery rate could be obtained, but at this time, we should also pay attention to the dynamic adsorption amount of surfactant molecules in microfractures. The surfactant molecules gathered on the surface of the microfracture spread inside the core under the surfactant-concentration gradient, which formed a surfactant solution inside the core and changed the wettability of the core. When the adsorption amount in the fracture increased, the number of surfactant molecules entering the matrix also increased, the ability to change the wettability of the matrix, the transformation ability, and mobility of the oil drops during the imbibition process became stronger, and the recovery was also improved. Therefore, in order to obtain the maximum oil recovery and recovery efficiency, low interfacial tension should not be the only factor pursued, and various factors should be considered comprehensively.


 ,
, 

