Article

Influence of Temperature on Lightning Performance of Mineral Oil

1
Institute of Electrical Power Engineering, Lodz University of Technology, Stefanowskiego 20, 90-537 Lodz, Poland
2
Ecole Centrale de Lyon, University of Lyon, Ampere CNRS 5005, 69130 Ecully, France
*
Author to whom correspondence should be addressed.
Energies 2022, 15(3), 1063; https://doi.org/10.3390/en15031063
Submission received: 11 January 2022 / Revised: 27 January 2022 / Accepted: 29 January 2022 / Published: 31 January 2022
(This article belongs to the Special Issue High Voltage Insulating Materials-Current State and Prospects 2022)

Abstract

:
This article deals with the influence of temperature on the lightning impulse breakdown voltage (LI BDV) of mineral oil in a non-uniform electric field. The experiments were performed in point–plane electrode arrangements under a standard lightning impulse voltage of negative polarity. The LI BDV for the temperatures of 20, 40, 60, 80, 100 and 110 °C was measured using a step method with registration of the light signals emitted during pre-breakdown and breakdown phases. The average propagation velocity was also determined. The results confirm that the mineral oil tested under LI voltage behaves similarly to AC voltage-based stress. The LI BDV increases with temperature up to 100 °C and then tends to decrease. The results demonstrated that viscosity dependent processes are responsible for increasing the LI BDV with temperature up to the 100 °C; and liquid vapor formation processes are responsible for decreasing the LI BDV at temperatures equal to and higher than 100 °C.

1. Introduction

Oil power transformers are the most commonly used solution in the global energy system in terms of transmission and distribution of electrical energy. The commonly applied insulating medium in such transformers is mineral oil [1]. Despite the fact that the market of insulating liquids has been under strong development and more and more products, which are alternative to mineral oil, have appeared [2,3,4], mineral oil-based transformers still constitute the largest percentage of operating units. One of the main parameters determining the performance of insulating fluids used in power transformers is breakdown voltage (BDV) under alternating current (AC) stress that is measured both before filling the transformer and when transformer is in service. In the latter, AC BDV constitutes an important diagnostic factor [5]. It is worth noting that the operating conditions of a power transformer change dynamically. With the change of its load or weather conditions, the temperature of oil changes too. Under normal operating conditions, the temperature may reach even 80 °C, while in critical situations (temporary overload), the temperatures may even hit 100 °C [6]. Temperature is not the only parameter that influences the AC BDV of oil. Moisture content and impurities in the oil volume also influence the AC BDV. In oil, water may be dissolved or emulsified [7,8,9]. The amount of water dissolved in the oil depends on the temperature, level of aging, and type of oil. Water contained in the oil significantly reduces the AC BDV. Figure 1 gives an example, in this field, showing how the moisture content in transformer mineral oil influences the AC BDV. The data presented is based on [10]. The AC BDV is measured for a standard system of hemispherical electrodes with a 2.5 mm gap between them.
The effect of moisture is especially important for small electrode gaps (<1 cm) in both homogeneous and non-homogeneous electric fields. The reduced electric strength for low moisture content is caused by dissolved water, while emulsified water lowers this parameter even more. The permissible water content in the form of a solution in fresh and clean oil at the temperature of 20 °C is approximately 0.01%. When this value is higher a saturation occurs and the water precipitates in the form of an emulsion or suspension, which causes a rapid drop in electrical strength and disqualifies the oil from further use. In addition to water, there may be other contaminants in the oil, in particular metallic particles, released from the windings or the tank; or dielectrics, released from the insulation (paper, pressboards). However, it is worth noting that when the distance between the electrodes is higher then we observe less influence of the impurities and water content on the electric strength of oil [8,9].
On the other hand, when lightning impulse (LI) voltage is considered, even in the case of small electrode gaps, the influence of moisture and other impurities on the electrical strength is weak [7,8,9]. Other factors influencing the electrical strength of oil are the shape of the electrodes, gap between them or voltage polarity, for DC (direct current) and LI voltage. As the electrode gap increases, along with the level of field inhomogeneity, the dielectric strength of oil, obviously, decreases. The volume effect is important when measuring electrical strength of oil in homogeneous and slightly inhomogeneous fields [11,12,13]. For a given electrode’s gap, the electrical strength decreases as the surface area of the electrode increases; it also decreases for the constant surface area when increasing the electrode gap. The polarity of the voltage has an influence when considering a non-uniform electric field. For negative polarity, the breakdown voltage is greater than that for the positive one [9,14]. Electrical strength is also influenced by the voltage exposure time. As it extends, the electrical strength decreases. On the other hand, pressure influences the BDV both in a homogeneous and inhomogeneous field in such a way that it increases strongly as pressure increases. This regularity applies to both the AC voltage and, above all, the LI voltage. The reason for this is due to the reduction of the potential gas bubbles in the oil volume, that are the weak points where the discharges are initiated [9,15]. In addition, when electric field stress is lower than the value determining breakdown, bubbles can be seen forming on the electrodes. The dielectric strength of transformer oil decreases if it is not degassed as the pressure decreases.
The influence of temperature on electrical strength under LI voltage, has not been widely described in the literature, and there are practically no published papers on this topic. Data concerning the influence of the temperature increase of mineral oil on its electrical strength mainly refer to AC voltage, as in the exemplary quoted works [7,9,13,16]. Those results indicate that the electrical strength of pure and dry mineral oil practically does not change with temperature until it reaches a value of approximately 80 °C, then it begins to decline. On the other hand, pure mineral oil that contains moisture behaves differently. Its electrical strength increases up to a temperature of 80 °C. This is explained by the conversion of the emulsified water into dissolved water. However, after reaching a temperature of 80 °C, the electrical strength decreases, which is associated with the process of water evaporation and the formation of gas bubbles, facilitating the initiation and development of discharges up to breakdown [7,9,13,15,16,17]. The relationship, in this regard, confirming the, above quoted, considerations and showing how the moisture content in transformer mineral oil influences the curves describing the relationships between electrical strength of the oil versus temperature, is presented in Figure 2. This figure was elaborated on the basis of data derived from [16]. These data concern the results of the measurements carried out with AC voltage in accordance with commonly accepted standard methodology [18].
Based on the considerations mentioned above, it can be assumed that the increase in the temperature of mineral oil will have a similar effect on its LI BDV. However, the results contained in [19] contradict this assumption. The authors examined eight insulating fluids used in the cable industry, divided into two groups: five with low viscosity and three with high viscosity. For each of the liquids, the BDV was tested at two temperatures: 25 °C and 90 °C. The research showed that the LI BDV of the mineral oil decreased with increasing temperature.
Due to the small number of literature sources, in which the influence of the temperature increase of mineral oil on its LI BDV was tested, and also to check whether the relationships from the tests at AC voltage are valid also at LI voltage, an experiment was conducted. Recognition of the influence of temperature change on pre-breakdown and breakdown phenomena in insulating oil at LI voltage may bring new insight to mineral oil behaviour under LI stress.

2. Methodology of the Studies

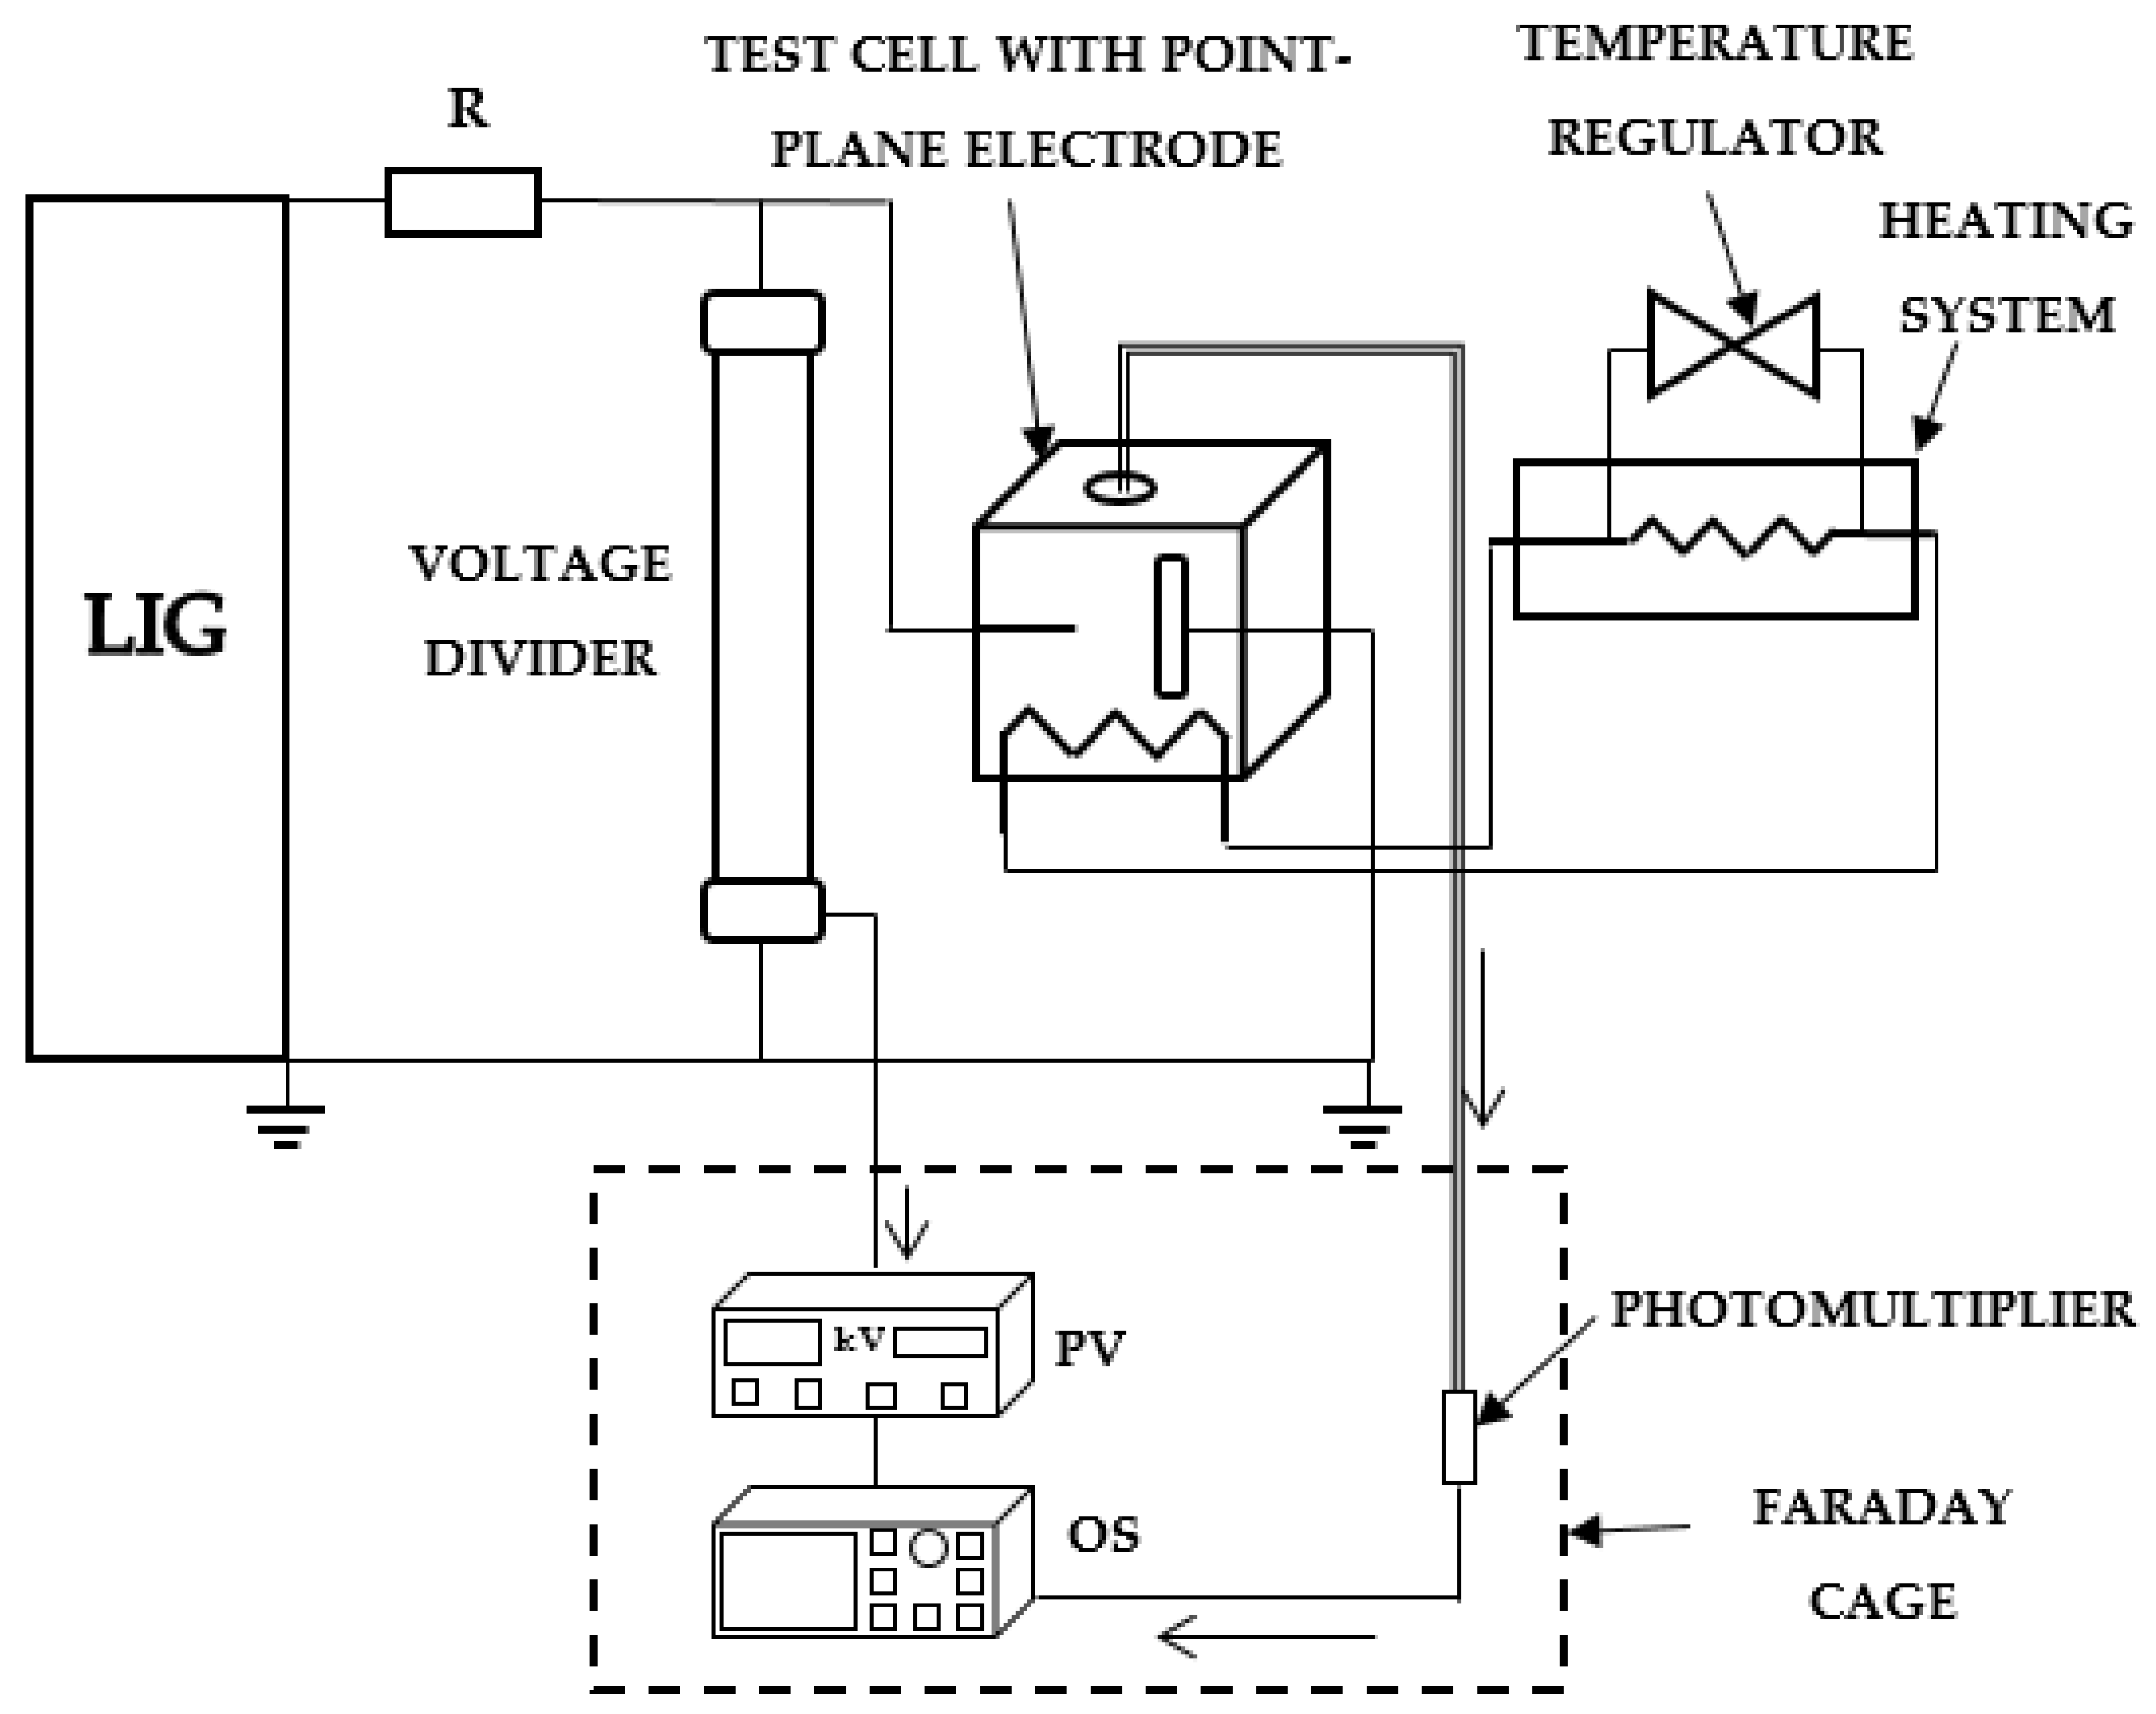
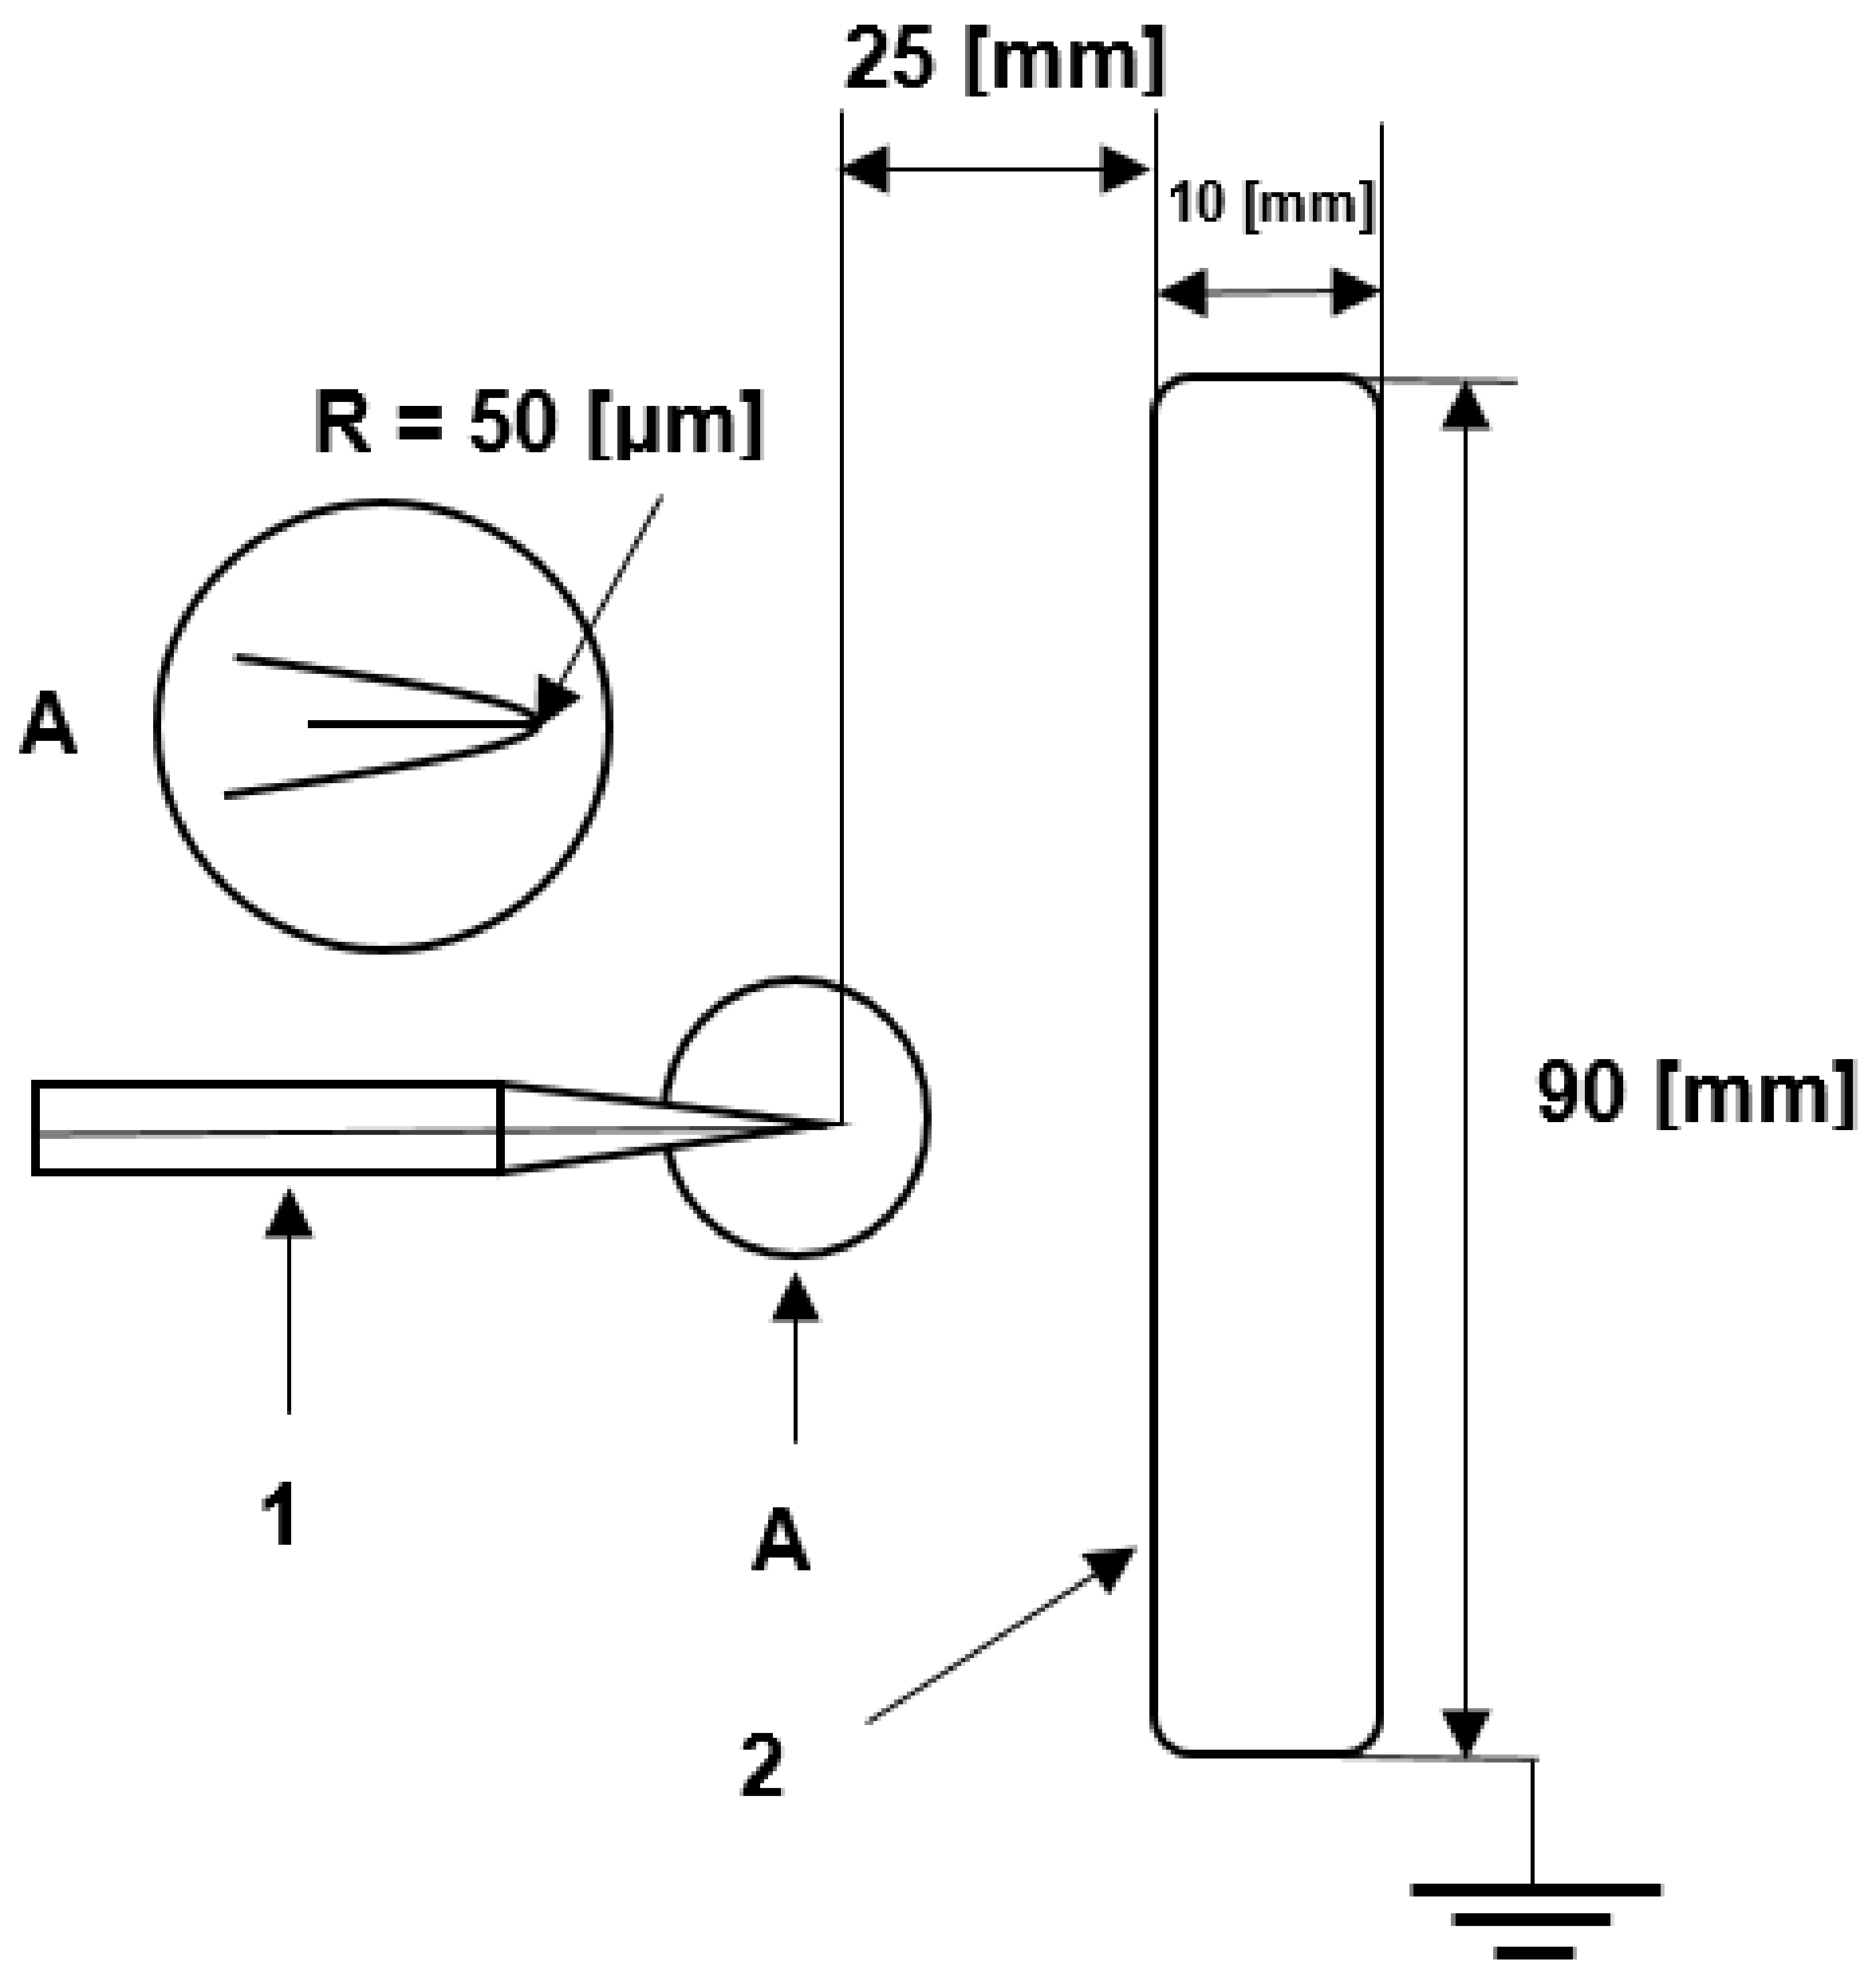
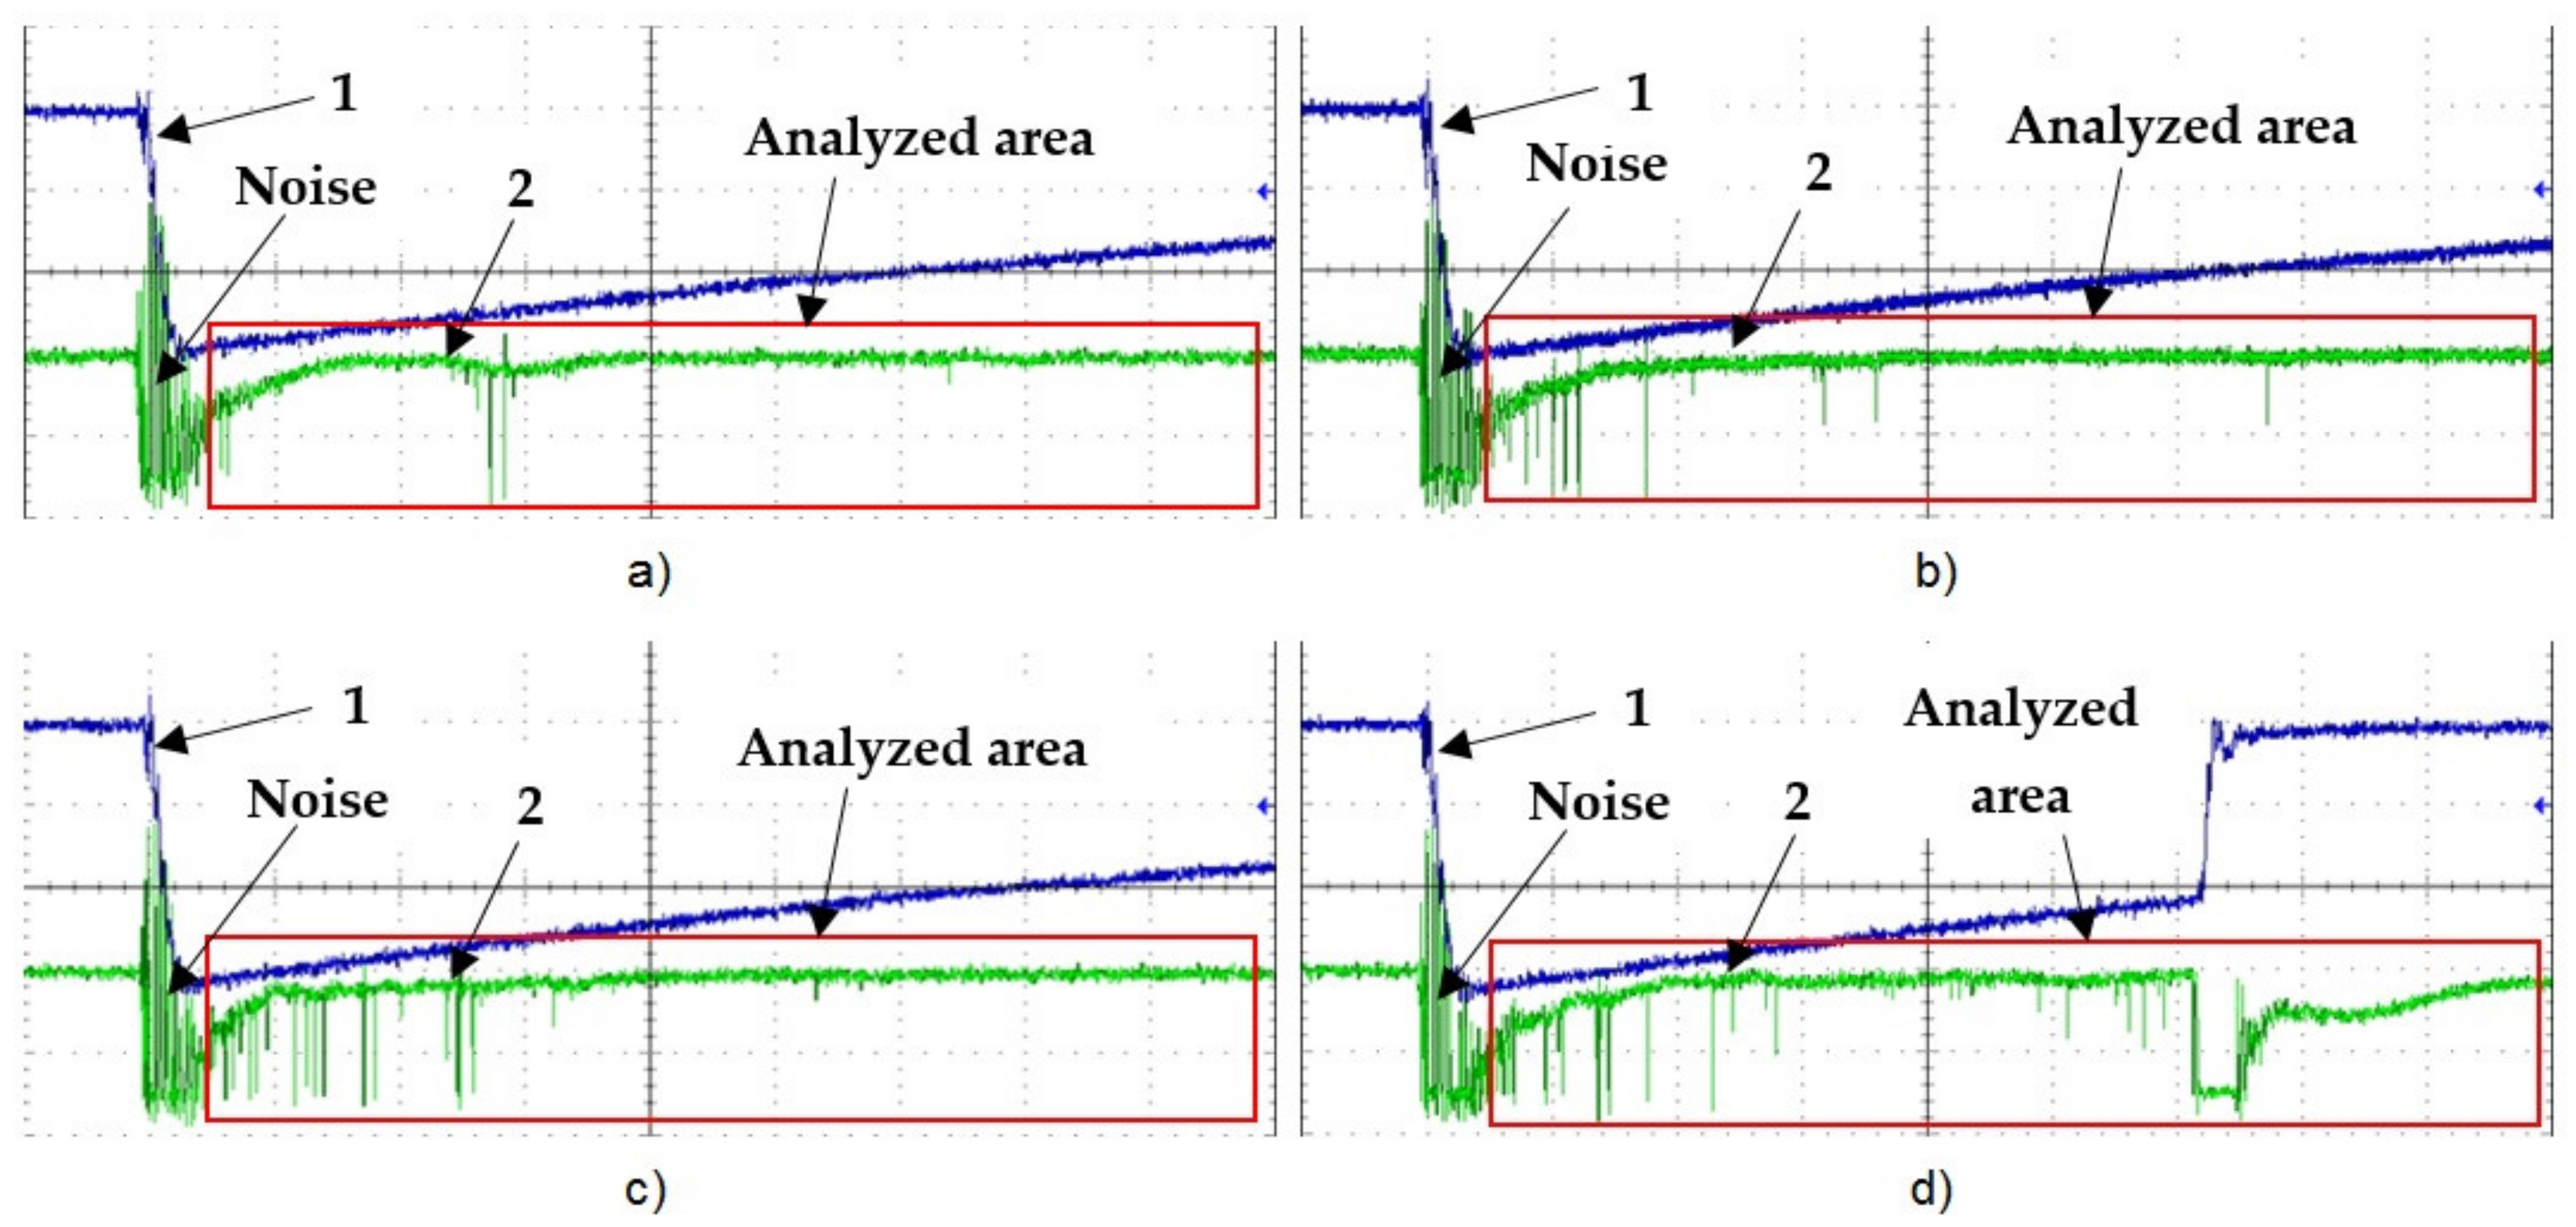
2.1. Measurement Setup

The studies are performed on the experimental setup presented in Figure 3.
The voltage supply is a six-stage, 600 kV Marx generator that provides a negative standard lightning impulse voltage of 1.2/50 µs. Meanwhile, an oscilloscope is used to record the voltage waveform as well as the light accompanying the pre-breakdown and breakdown phenomena. The light pulses are collected using a photomultiplier with a spectral range of 300–850 nm. The peak value meter, oscilloscope and photomultiplier with accessories are all enclosed in a Faraday cage.
Measurements are performed in a test cell with a point-plate electrode system as shown in Figure 4. The test cell is a cube shape, has a volume of approximately 6 litres, and is made of transparent material (Perspex). The radius of the curvature of the high voltage tungsten point electrode is 50 µm, while the diameter of the grounded electrode is 90 mm. The gap between the electrodes is 25 mm.
A system that enables oil heating, and maintaining its temperature at a constant value during the measurement, consists of an additional sealed heating cell filled with insulating mineral oil, which serves as a heat carrier (see Figure 3). A 1 kW heater is placed in this heating cell. It heats the oil, which, due to the flow forced by the pump, is directed to the coil placed in the test cell with the electrode system. The oil, which is used in the measurements, is heated by convection. The heating system acts together with a temperature controller, which records the temperature in the test cell using a PT100 probe. This allows the heating system to automatically turn off after reaching the pre-set temperature in the test cell.

2.2. Measurement Procedure
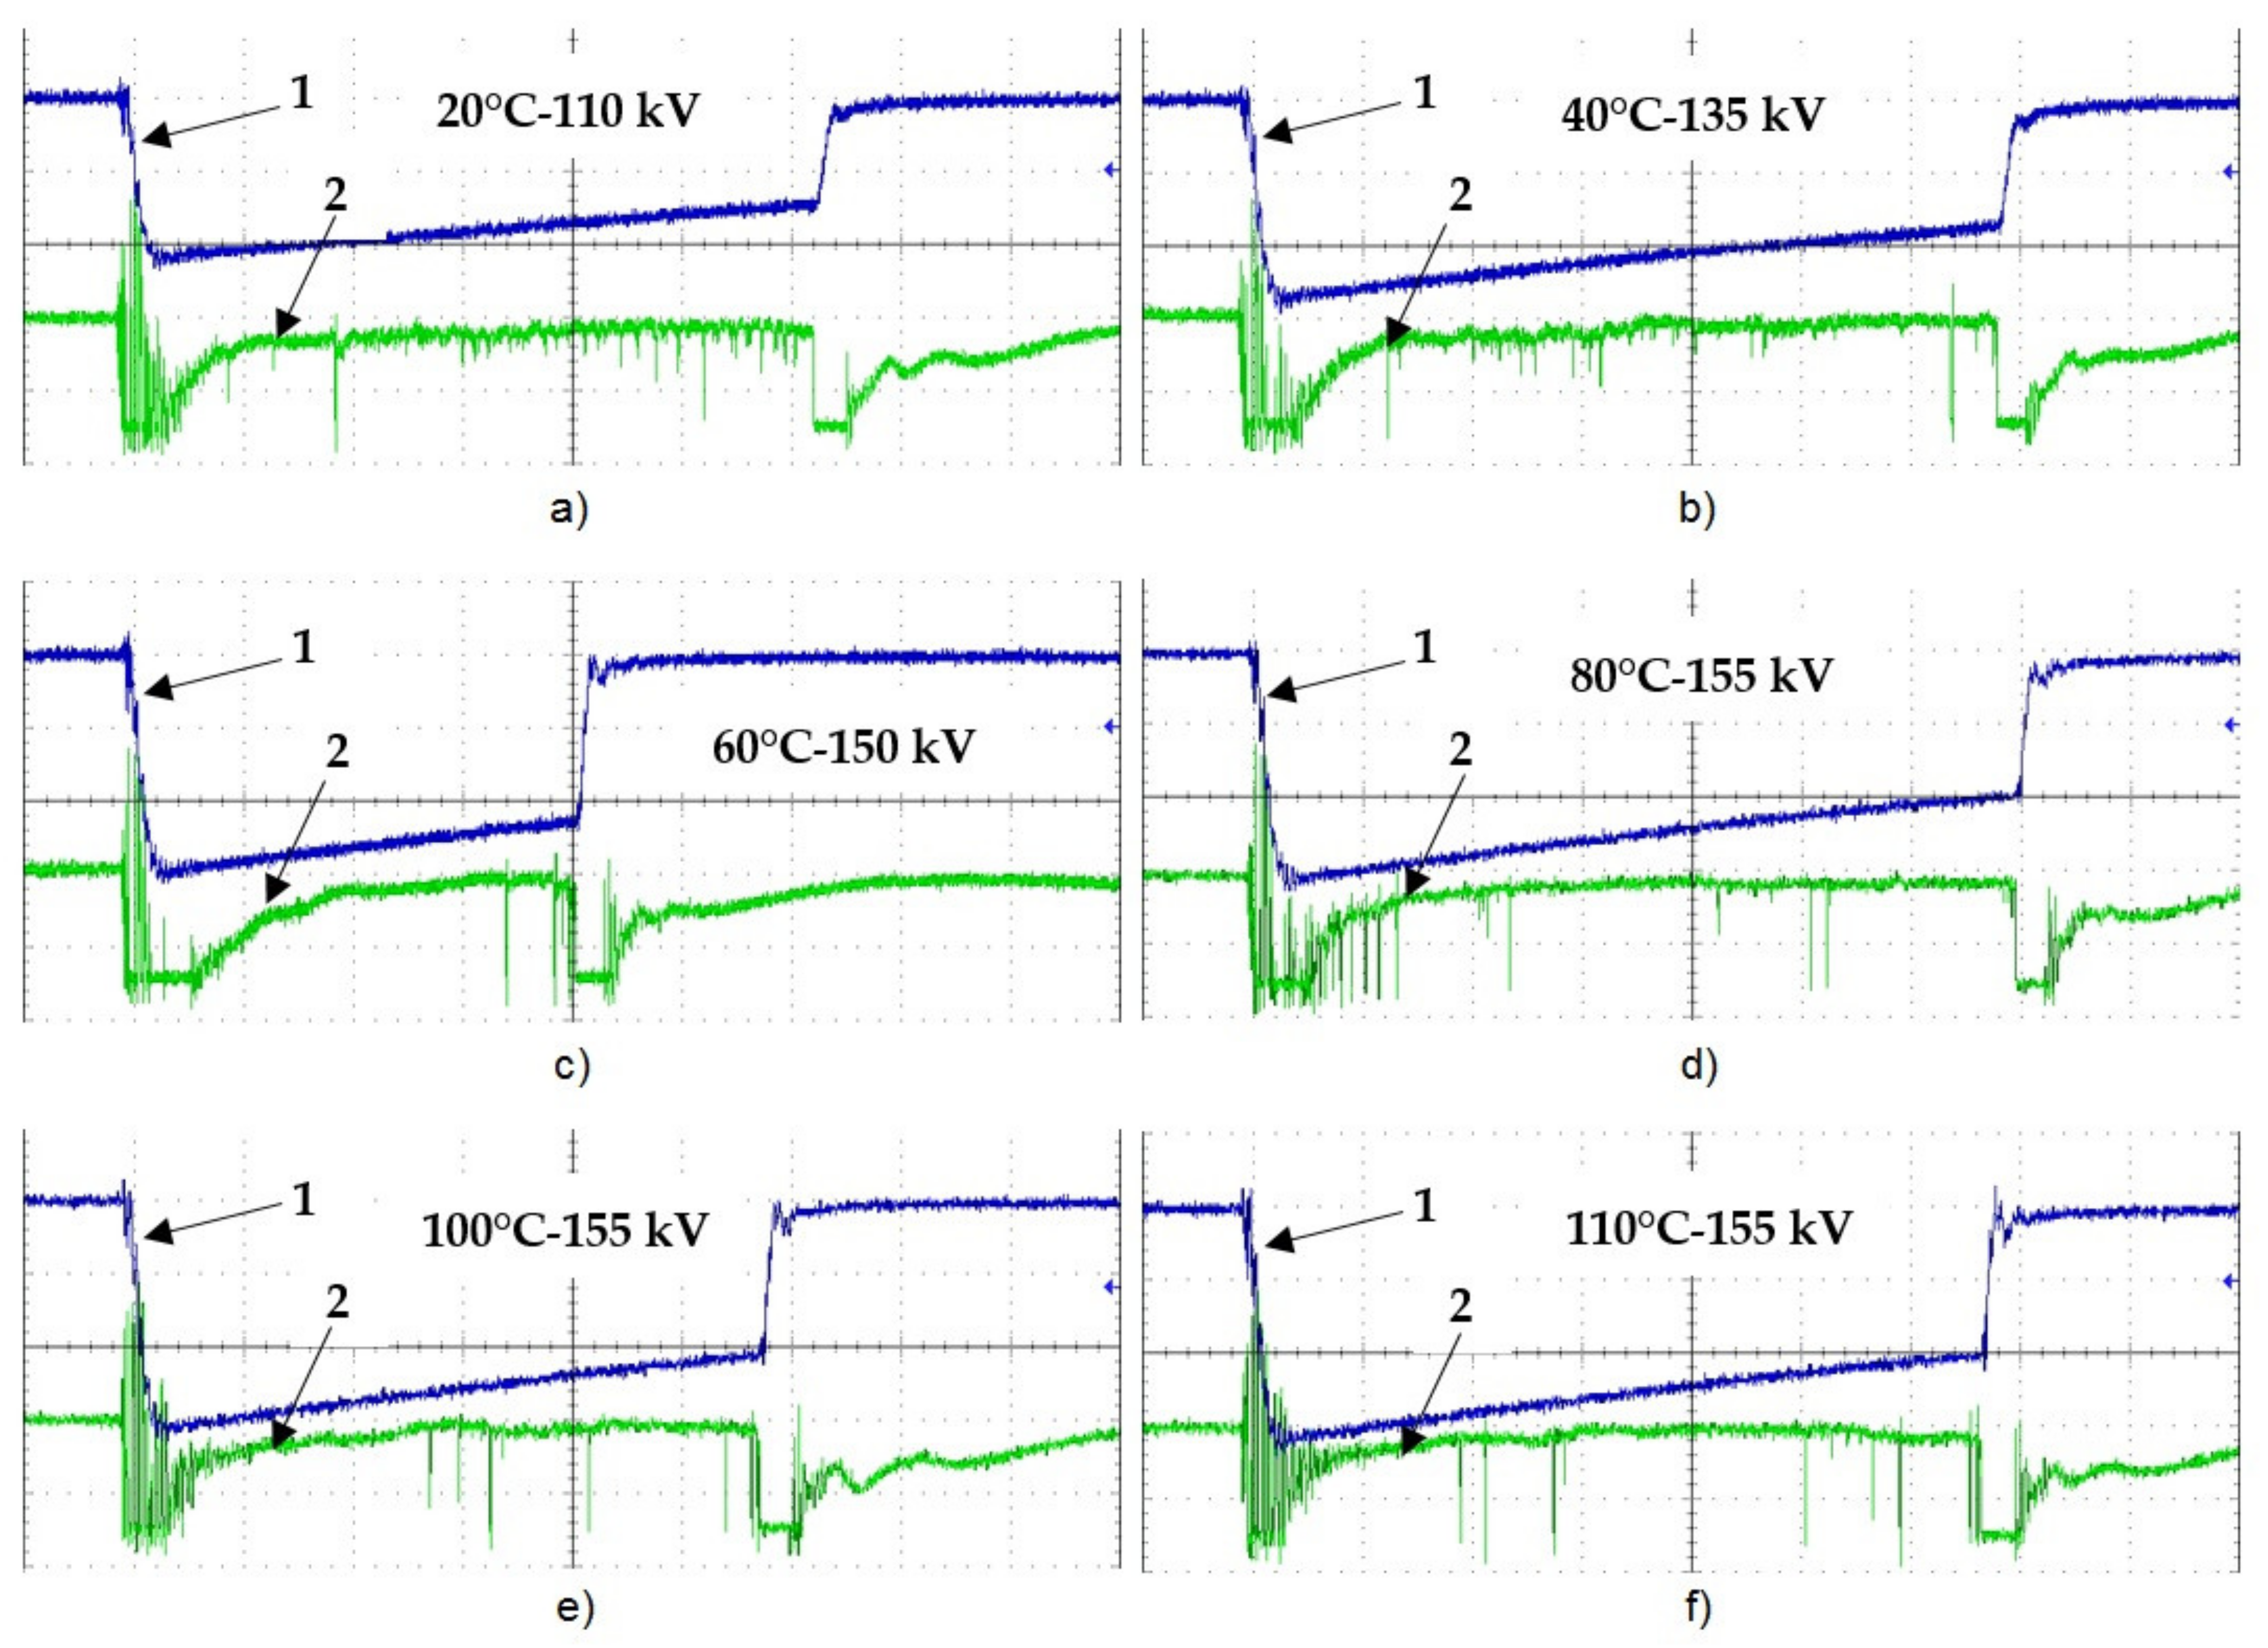
The LI BDV measurements are carried out using the stepwise method, a method generally used in this type of study [14,20,21]. The lightning impulse is applied at the electrode system with a step ΔU equal to 5 kV. One shot per step methodology is used. The value of the starting voltage is determined, in each case, experimentally and it differs depending on the oil temperature. The waiting time between successive shocks is one minute. The oil is then stirred and a 30 min waiting period is applied before proceeding to the next test. The value of the breakdown voltage is noted in each case based on the registered voltage waveform and the value shown by the peak value meter. Both signals are recorded using a resistive voltage divider placed in a high voltage circuit, as shown in Figure 3.
The oil sample is replaced with a new one at each new temperature level. Similarly, the point electrode is replaced by a new one after one measurement series. The mineral oil tested is of a naphthenic type and is uninhibited. It is manufactured by Nynas and its trade name in Nytro Draco. The temperatures selected for the tests are 20 °C, 40 °C, 60 °C, 80 °C, 100 °C and 110 °C. In order to increase the credibility of the obtained results, five series are performed for each temperature and each series consists of 10 measurements. Table 1 summarizes the selected characteristic parameters of the tested mineral oil before starting the experiment.

3. Results

Table 2 presents the results of the five series of measurements of the LI BDV, the average values as well as the corresponding standard deviations. Figure 5 presents these results in the form of a graph with an approximated curve describing the observed trend.
The results demonstrated that the LI BDV of the tested mineral oil increased with temperature, up to 80 °C (circa 90 °C when looking at an approximated curve). This may be due to the removal of moisture. After reaching a temperature of 100 °C, the LI BDV began to decrease. This dependence is consistent with the available data on AC BDV [7,8,9,10,11,13]. Although the temperature step change, up to 100 °C, was practically constant (every 20 °C), it can be noted that the average values of the BDV do not behave in a linear fashion. The greatest increase was observed when the oil was heated from 20 °C to 40 °C, where the difference between these two levels reached over 30 kV. For the next temperature ranges the difference was smaller, up to the level of around 1 kV when the temperature changes from 80 °C to 100 °C. On the other hand, at the highest considered temperature (110 °C), a decrease of approximately 4 kV in the LI BDV was observed. When analysing the trend of the changes, it can be assumed that along with further increase in the temperature of the insulating oil, its LI BDV will continue to decrease. However, it is worth noting that such high temperatures occur only during the malfunction of transformer, and not during its standard operation [5,6]. Thus, consideration of temperatures higher than 110 °C seems unreasonable. Moreover, testing mineral oil at temperatures close to its flash point may be dangerous.
The LI BDV was not the only one parameter analysed in this work. The waveforms of the light emitted in the pre-breakdown and breakdown phase were analysed too. Those are registered together with the voltage waveform. Figure 6 gives an example of the series of such oscillograms for consecutive voltage steps. In Figure 6a–c, the applied voltage did not lead to breakdown, while Figure 6d shows the appearance of a breakdown. A sudden voltage collapse is clearly visible after approximately 25 µs from the moment of applying the voltage. The presented examples refer to the tests carried out at 80 °C.
Referring to the above quoted oscillograms, more frequent light pulses with increased voltage can be observed, which is a well-known finding. This is typical behaviour for the discharges reported in the literature when describing the pre-breakdown phenomena in dielectric liquids [2,3,9,14,20,21]. Especially the example concerning 155 kV which includes more light pulses than the oscillogram related to lower testing voltages. This means that initiated streamers are probably more branched and more dense in their structure. However, the effect of intensification of the discharge phenomena just before breakdown is visible in the example concerning breakdown.
Figure 7a–f presents examples of breakdowns for the subsequently analysed temperatures. There are no evident differences between the examples presented. One can notice the higher peak values of the light pulses when temperature is higher. However, the higher temperatures are connected with higher values of BDV, thus this finding is not surprising.
From the analysis of the collected oscillograms, it is possible to estimate the average time to breakdown (tb) in each case and on this basis the average propagation velocity (vb) of the streamers leading to breakdown. The time to breakdown is interpreted as the time between the voltage waveform onset and the time when the voltage collapses. In turn, the average propagation velocity is calculated by dividing the electrode gap by the time to breakdown. The data obtained in both areas are presented in Table 3.
Based on the data collected in Table 3, it can be noted that the time to breakdown changes to a small extent with increasing temperature, but no clear trend can be observed for this parameter. In general, the longer times to breakdown concern the temperatures from 80 °C to 110 °C, thus these values of temperature for which higher LI BDV is observed. As the gap distance was the same throughout the studies there are no specific findings in terms of propagation velocity of the streamers leading to breakdown. The streamers of the velocities in the range of 0.96–1.22 mm/µs are the so-called slow developing streamers (of the second-mode type according to [9,20,21]), thus the physical nature of pre-breakdown phenomena must be the same independent of temperature. However, some details connected with the temperature have to be considered to explain the differences noticed, which will be discussed further in next Section.

4. Discussion

The results obtained regarding the influence of temperature on the lightning impulse breakdown voltage of mineral oil should be considered in two ways: (1) the processes occurring below the temperature, at which the water dissolved in oil is released in the form of bubbles, and (2) the processes occurring for the temperatures equal or above this point. In the first case, it is expected to observe an increase in the LI BDV due to the viscosity dependent processes; while in the second case, the processes may be attributed to the appearance of liquid vapor bubbles as a result of reaching the boiling point [9,22].
As we look at the results from the studies, the tendency of the first way is easy to observe. Starting from a temperature of 20 °C the BDV increases with each applied level of temperature. Since it is a known fact that the viscosity of saturated hydrocarbons decreases with temperature independently of the number of isomers, this relationship may be solely treated as directly connected with the known tendency of the BDVs. The question of how viscosity influences the breakdown processes may be answered when setting the liquid viscosity with the mobility coefficient of the charged molecules as well as the recombination factor. The decrease of liquid viscosity causes the increase of ion and electron mobility. The mobility of the charged molecules is higher with temperature so it may be expected to observe a decrease in BDV when temperature increases. So where does the dependence observed in the experiment come from? It may be that the positive ions created due to ionization processes, and that are moving towards the negative point in the tail of the electron (streamer) avalanche are neutralized with the electrons starting from HV electrode as a new avalanche due to recombination processes. Positive ions have enough high energy, as they are characterized by higher mobility, to recombine with electrons which have just started moving and thus not yet reached high kinetic energy. When the temperature is higher, the mobility of ions increases and the described process of recombination is easier to reach. The above is confirmed by the evaluated average propagation velocities of the streamers leading to breakdown. These average velocities are lower when temperature increases. Individual electron avalanches may be faster with increasing temperature (higher voltage applied), but new avalanches creating final plasma channels with initial streamers developed more slowly.
When the critical temperature is reached (herein 100 °C), the explanation should be focused on the possibility of appearance of liquid vapor bubbles. These bubbles, generated as a result of vaporization, become a kind of ionization bullet, as they have lower electrical permittivity when surrounded by a liquid medium and are susceptible to easier ionization. Hence, the processes of streamer development are accelerated due to the existing weak points in oil volume and the breakdown voltage decreases.

5. Conclusions

The results demonstrated that:
(1)
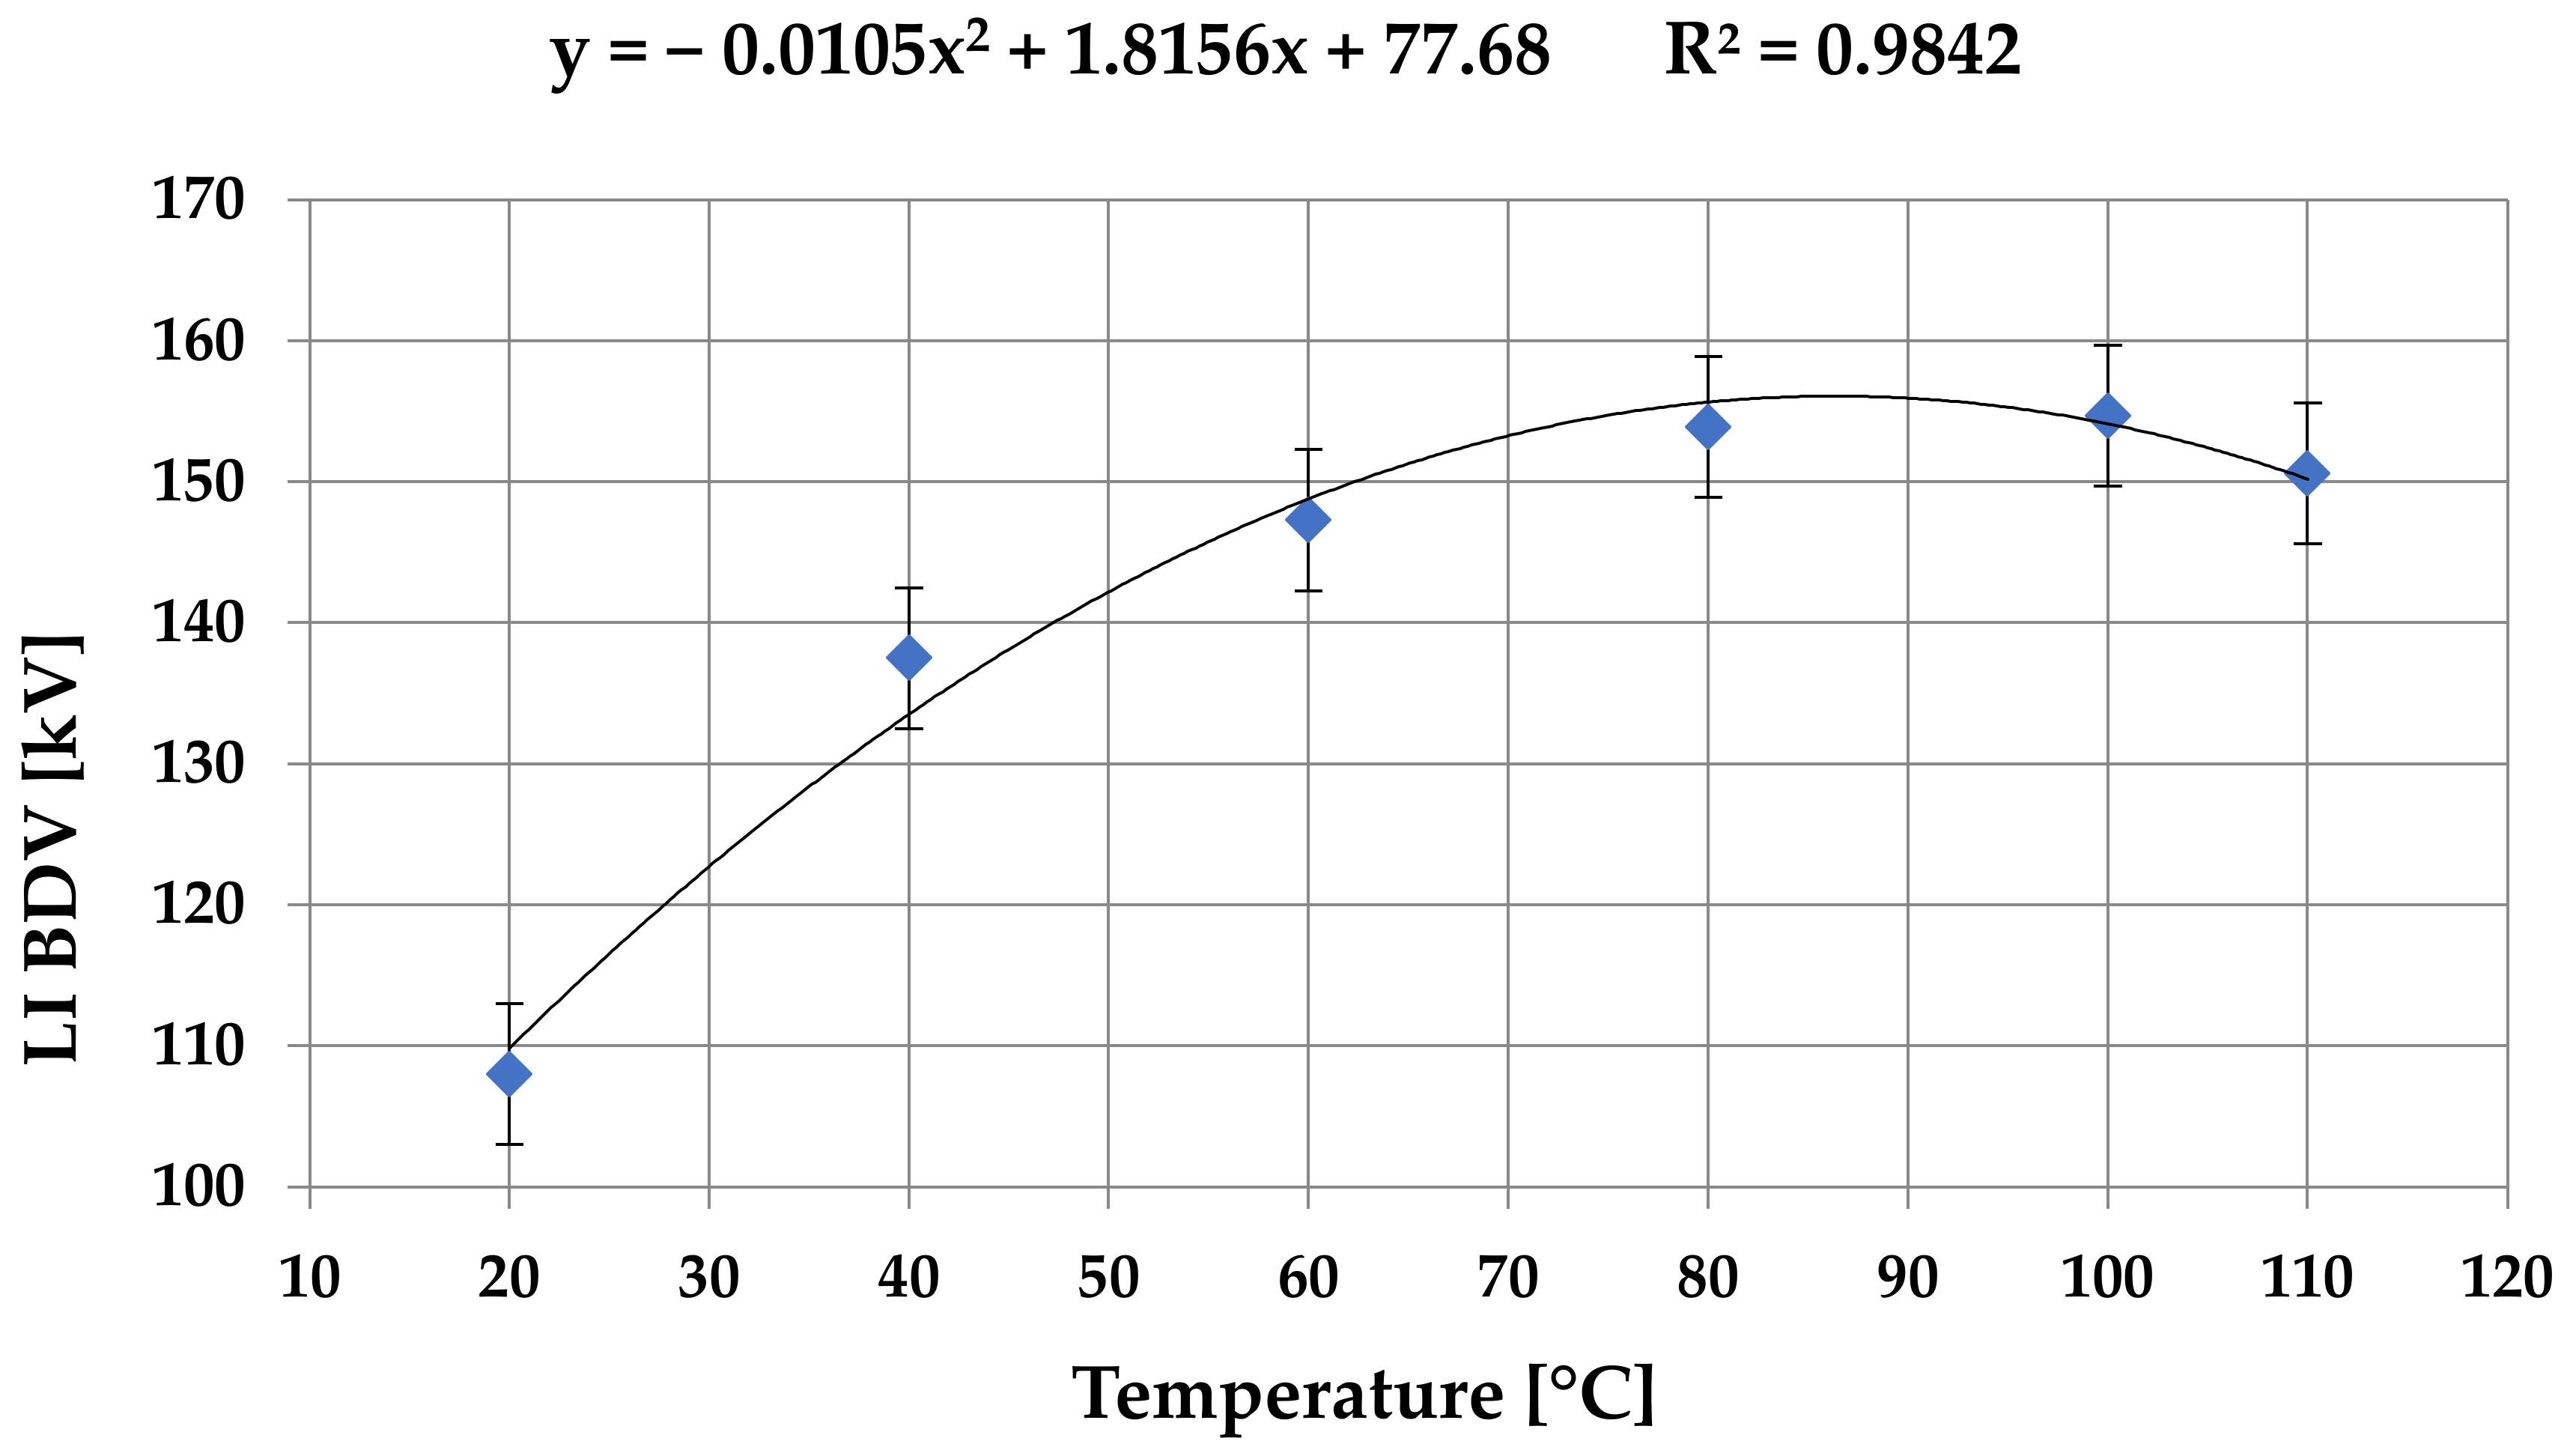
An increase in the temperature of mineral transformer oil leads to an increase in its LI BDV up to a temperature of approximately 100 °C. Above this value, the LI BDV decreases. This confirms that the oil stressed by LI voltage behaves similarly to AC voltage-based stress. Due to the volatile conditions in oil power transformers, this is undoubtedly a favourable property that increases the reliability of a used insulation system. Of course, there is a critical temperature above which BDV starts to decrease, but it is a temperature which does not appear in the normal conditions of transformer operation.
(2)
An interesting relationship is observed in terms of times to breakdown and the average propagation velocity of streamers leading to breakdown. The shortest time (higher velocities) concern lower temperatures (20–60 °C), which are characterized by lower breakdown voltages; for higher temperatures, these times are longer (velocities lower), which is also a positive finding in the context of the analysed phenomena.
(3)
Two different explanations of the observed relationship between LI BDV and temperature are possible: viscosity dependent processes responsible for increasing the LI BDV with temperatures up to 100 °C; and bubble formation processes for temperatures equal to and higher than 100 °C.
Since the relationships obtained within the studies concern only mineral oil, it seems to be necessary to carry out similar measurement procedures for the other liquids available on the market, including, first of all, synthetic and natural esters. This will be the next step of the authors’ research.

Author Contributions

Conceptualization, T.P.; methodology, P.R. and T.P.; validation, P.R., T.P., F.S. and A.B.; formal analysis, P.R., T.P., F.S. and A.B.; investigation, T.P. and F.S.; writing—original draft preparation, P.R., T.P., F.S. and A.B.; writing—review and editing, P.R., T.P., F.S. and A.B.; visualization, F.S.; supervision, P.R. and T.P.; All authors have read and agreed to the published version of the manuscript.

Funding

This research received no external funding.

Data Availability Statement

Not applicable.

Conflicts of Interest

The authors declare no conflict of interest.

References

  1. Fofana, I. 50 years in the development of insulating liquids. IEEE Electr. Insul. Mag. 2013, 29, 13–25. [Google Scholar] [CrossRef]
  2. Mohan Rao, U.; Fofana, I.; Jaya, T.; Rodriguez-Celis, E.M.; Jalbert, J.; Picher, P. Alternative dielectric fluids for transformer insulation system: Research progress, challenges, and future prospects. IEEE Access 2019, 7, 184552–184571. [Google Scholar] [CrossRef]
  3. Rozga, P.; Beroual, A.; Przybylek, P.; Jaroszewski, M.; Strzelecki, K. A review on synthetic ester liquids for transformer applications. Energies 2020, 13, 6429. [Google Scholar] [CrossRef]
  4. Shen, Z.; Wang, F.; Wang, Z.; Li, J. A critical review of plant-based insulating fluids for transformer: 30-year development. Renew. Sustain. Energy Rev. 2021, 141, 110783. [Google Scholar] [CrossRef]
  5. Piotrowski, T.; Rozga, P.; Kozak, R. Analysis of excessive hydrogen generation in transformers in service. IEEE Trans. Dielectr. Electr. Insul. 2015, 22, 3600–3607. [Google Scholar] [CrossRef]
  6. Bochenski, B.; Mosinski, F.; Piotrowski, T. Monitoring and forecasting of power transformer ratings using DTR computer program. In Proceedings of the International. Conference “Computer as a Tool” (EUROCON), Warsaw, Poland, 9–12 September 2007; pp. 1373–1377. [Google Scholar] [CrossRef]
  7. Nossier, A.; El-Debeiky, S.; Hashad, I.F.; A-Barry, H. Effect of temperature on the breakdown probability of liquid dielectrics. IEEE Trans. Electr. Insul. 1981, 15, 502–505. [Google Scholar] [CrossRef]
  8. Fleszynski, J.; Lutynski, B.; Skowronski, J.I. Effect of impurities on the breakdown of insulating oil in long gaps. J. Electrost. 1979, 7, 47–55. [Google Scholar] [CrossRef]
  9. Klimkin, V.F.; Korobeynikov, S.M. Impulse Breakdown of Liquids; Springer: Berlin/Heidelberg, Germany, 2007. [Google Scholar]
  10. Piotrowski, T.; Wojciak, M. Repeatability of measurement results of breakdown voltage of moistened and contaminated transformer oil. In Proceedings of the International Conference on Power Transformers “Transformer 19”, Torun, Poland, 7–9 May 2019; pp. 83–94. [Google Scholar]
  11. Wilson, M.P.; Timoshkin, I.V.; Given, M.J.; Macgregor, S.J.; Wang, T.; Sinclair, M.A.; Thomas, K.J.; Lehr, J.M. Breakdown of mineral oil: Effect of electrode geometry and rate of voltage rise. IEEE Trans. Dielectr. Electr. Insul. 2012, 19, 1657–1664. [Google Scholar] [CrossRef] [Green Version]
  12. Rozga, P.; Hantsz, D. Influence of volume effect on electrical discharge initiation in mineral oil in the setup of insulated electrodes. Electr. Eng. 2017, 99, 179–186. [Google Scholar] [CrossRef] [Green Version]
  13. Danikas, M.; Sarathi, R.; Morsalin, S. A short review of some of the factors affecting the breakdown strength of insulating oil for power transformers. Eng. Technol. Appl. Sci. Res. 2020, 10, 5742–5747. [Google Scholar] [CrossRef]
  14. Rozga, P.; Rapp, K.J.; Stanek, M. Lightning properties of selected insulating synthetic esters and mineral oil in point-to-sphere electrode system. IEEE Trans. Dielectr. Electr. Insul. 2018, 25, 1699–1705. [Google Scholar] [CrossRef]
  15. Beroual, A.; Tobazeon, R. Effects of hydrostatic pressure on the prebreakdown phenomena in dielectric liquids. In Proceedings of the Conference on Electrical Insulation & Dielectric Phenomena-Annual Report 1985, Amherst, NY, USA, 20–24 October 1985; pp. 44–49. [Google Scholar] [CrossRef]
  16. Musil, R.; Baur, M.; Pfister, W. Testing practices for the AC breakdown voltage testing of insulation liquids. IEEE Electr. Insul. Mag. 1995, 11, 21–26. [Google Scholar] [CrossRef]
  17. Zhang, Y.; Tao, X.; Pan, C.; Tang, J. Role of air bubbles in the breakdown of flowing transformer oil. IEEE Trans. Dielectr. Electr. Insul. 2020, 27, 1752–1760. [Google Scholar] [CrossRef]
  18. IEC 60156: 2018; Insulating Liquids—Determination of the Breakdown Voltage at Power Frequency—Test Method. International Electrotechnical Commission: Geneva, Switzerland, 2018.
  19. Chana, J.C.; Cometa, E.T. Impulse breakdown characteristics of insulating oils and their behaviour in oil-paper composites. In Proceedings of the Conference on Electrical Insulation and Dielectric Phenomena, Leesburg, VA, USA; pp. 447–452. [CrossRef]
  20. Mohan Rao, U.; Fofana, I.; Beroual, A.; Rozga, P.; Pompili, M.; Calcara, L.; Rapp, K.J. A review on pre-breakdown phenomena in ester fluids: Prepared by the international study group of IEEE DEIS liquid dielectrics technical committee. IEEE Trans. Dielectr. Electr. Insul. 2020, 27, 1546–1560. [Google Scholar] [CrossRef]
  21. Beroual, A.; Zahn, M.; Badent, A.; Kist, K.; Schwabe, A.J.; Yamashita, H.; Yamazawa, K.; Danikas, M.; Chadband, W.D.; Torshin, Y. Propagation and structure of streamers in liquid dielectrics. IEEE Electr. Insul. Mag. 1998, 14, 6–17. [Google Scholar] [CrossRef] [Green Version]
  22. Adamczewski, I. Ionization, Conductivity and Breakdown in Dielectric Liquids; Taylor and Francis LTD: Abingdon, UK, 1969. [Google Scholar]
Figure 1. Influence of water content on the AC BDV of mineral oil, based on [10].
Energies 15 01063 g001
Figure 2. Relationships between the electric strength of mineral oil and temperature at different levels of moisture content in oil, the curves were elaborated on the basis of data presented in [16].
Energies 15 01063 g002
Figure 3. Experimental setup: LIG, lightning impulse generator; R, limiting resistor; PV, peak value meter; OS, oscilloscope.
Energies 15 01063 g003
Figure 4. Electrode system applied in the studies: 1, point electrode; 2, grounded electrode.
Energies 15 01063 g004
Figure 5. Relationship between lightning impulse breakdown voltage and temperature. y, regression line; R2, correlation factor.
Energies 15 01063 g005
Figure 6. Examples of the oscillograms of successive phases of the step voltage tests at 80 °C. 1, voltage [50 kV/div.]; 2, light [arbitrary units]; time base, 4 µs/div.: (a) 145 kV, (b) 150 kV, (c) 155 kV, (d) 160 kV.
Energies 15 01063 g006
Figure 7. Examples of the oscillograms for subsequently analyzed temperatures: 1, voltage [50 kV/div.]; 2, light [relative units]; time base, 4 µs/div.: (a) 20 °C, (b) 40 °C, (c) 60 °C, (d) 80 °C, (e) 100 °C, (f) 110 °C.
Energies 15 01063 g007
Table 1. Selected characteristic parameters of the tested mineral oil.
ParameterUnitValue
AC BDVkV66.8
densityg/mL0.882
water contentppm24.6
dielectric permittivity-2.24
dielectric loss factor at 90 °C-0.0042
surface tensionmN/m29.5
Table 2. Summary of average values of LI BDV and standard deviations at the selected temperatures.
Temperature20 [°C]40 [°C]60 [°C]80 [°C]100 [°C]110 [°C]
Breakdown Voltage:Average Value [kV] for the Five Series of Measurements
Series 1112.5136.5148.5155.5154150.5
Series 2105.0138.5151.5157.5155.5151.0
Series 3110.0142.1147.0154.0157.5153.0
Series 4107.0133.0142.5150,5152.0152.0
Series 5104.5137.5147.0152.0154.5146.5
Breakdown Voltage:Average Value for All Measurements [kV]
108137.5147.3153.9154.7150.6
Standard Deviation [kV] for the Five Series of Measurements
Series 19.811.318.115.97.07.2
Series 26.912.312.711.611.47.4
Series 313.210.316.911.08.610.1
Series 410.98.911.17.68.28.6
Series 59.07.511.89.86.48.8
Standard Deviation for All Measurements [kV]
9.910.114.111.28.38.4
Table 3. Average times to breakdown and standard deviations for five series of measurement at the selected temperatures.
Temperature20 [°C]40 [°C]60 [°C]80 [°C]100 [°C]110 [°C]
Time to Breakdown:Average Value [µs]for the Five Series of Measurements
Series 122.222.821.527.727.328.2
Series 223.519.722.825.225.024.9
Series 322.819.119.224.522.924.6
Series 422.722.524.828.521.125.5
Series 523.518.324.124.525.319.7
Time to breakdown:Average Valuefor All Measurements [µs]
22.920.522.526.124.324.8
Standard Deviation of Time to Breakdown [µs] for the Five Series of Measurements
Series 13.95.54.39.412.29.1
Series 22.24.95.75.25.56.0
Series 32.74.73.15.64.56.1
Series 44.03.07.99.23.69.4
Series 51.83.111.32.46.14.1
Standard Deviation of Time to Breakdown for All Measurements [µs]
3.14.77.47.17.47.8
Average Propagation Velocity [mm/µs]
1.091.221.110.961.031.00
Publisher’s Note: MDPI stays neutral with regard to jurisdictional claims in published maps and institutional affiliations.

