Article

Modeling of Gas Migration in Large Elevation Difference Oil Transmission Pipelines during the Commissioning Process

1
PipeChina Southwest Pipeline Company, Chengdu 610037, China
2
Petroleum Engineering School, Southwest Petroleum University, Chengdu 610500, China
*
Author to whom correspondence should be addressed.
Energies 2022, 15(4), 1379; https://doi.org/10.3390/en15041379
Submission received: 25 December 2021 / Revised: 3 February 2022 / Accepted: 8 February 2022 / Published: 14 February 2022

Abstract

:
Oil pipeline construction and operation in mountainous areas have increased in southwestern China, with oil consumption increasing. Such liquid pipelines laid in mountainous areas continuously undulate along the terrain, resulting in many large elevation difference pipe segments. Serious gas block problems often occur during the commissioning process of these pipelines due to the gas/air accumulation at the high point of the pipe, which causes pipeline overpressure and vibration, and even safety accidents such as bursting pipes. To solve this problem, the gas–liquid replacement model and its numerical solution are established with consideration of the initial gas accumulation formation and the gas segment compression processes in a U-shaped pipe during the initial start-up operation. Additionally, considering the interactions of the gas-phase transfer in the continuous U-shaped pipe, and the influence of the length, inclination angle, and backpressure on the air vent process, the gas migration model for a continuous U-shaped pipe is established to predict the gas movement process. Finally, the field oil pipe production data were applied to verify the model. The results demonstrate that the maximum deviation between the calculated pressure during the start-up process and real data is 0.3 MPa, and the critical point of crushing the gas in the pipe section is about 0.2 Mpa. Additionally, the results show that the mass transfer of the gas section in the multi-pipe hydraulic air vent process causes the gas accumulation section to increase in downstream of the pipe. This study’s achievements can provide theoretical guidance and technical support for the safe and stable operation of continuous undulating liquid pipelines with large drops.

1. Introduction

Oil pipeline construction and operation in mountainous areas have increased in southwestern China, with oil consumption increasing. Due to the complex terrain and vertical rivers in these regions, pipelines need to be laid in continuously undulating mountainous areas. Many unexpected situations occur during the start-up process, and some operating parameters of the pipeline even exceed the design range. In the actual operation of pipelines in complex terrains with continuous, large elevation areas, there are problems with gas accumulation and migration, especially in areas with large-drop pipelines. During the start-up process, when the water head overturns the high point, it will flow in the form of slack flow to the low depression of the pipe section and generate liquid accumulation [1]. At this point, the gas in the downhill section will be sealed at the high point by the liquid accumulation generated at the low-lying point, forming a large gas–liquid coexistence area, as shown in Figure 1.
Air inside pipelines may occur due to various reasons: maintenance work, start-up operations, filling and emptying maneuvers, etc. [2]. The presence of gas causes many issues when commissioning undulating pipelines. For example, gas will cause liquid column separation, as well as causing the pipeline to vibrate [3]. If instantaneous bubble collapse occurs, the pipe material and structure may be damaged. If the gas enters the downstream pump station, it may cause cavitation of the centrifugal pump, reducing its efficiency, and, in severe cases, destroying the equipment in the station. Because liquid cannot fill the entire pipeline, transportation efficiency will decrease and energy consumption will increase [4,5]. Therefore, the gas accumulation section generated in the pipe production process needs to be discharged.
In past actual engineering practice, the traditional method of installing air vent valves and exploratory vents by personnel to relieve the gas accumulation sections was often used [6]. This method results in several problems: (1) some of the oil/water will inevitably be released during the process of opening the valve, causing environmental problems in the surrounding area. (2) Installing air vent valves and their auxiliary facilities will increase the investment in the project. (3) Opening holes at the high point of the pipeline compromises the structural integrity of the pipeline. (4) The actual undulating pipeline can have many high points, but the number of air vent valves installed is limited, so even after the air vent valve removes some of the air mass, there may still be a large amount of gas in the pipeline. (5) The site may not only be inoperable but may also create waste. If the pressure at the high point where the air vent valve is installed is too low, then when the valve is opened, not only will the gas in the pipe not be discharged, but air may be sucked in instead. (6) The “water hammer” induced by the sudden change in pressure caused by the high-point air vent can interfere with the air vent process and also adversely affect the operation of the pipeline.
Given the above problems, people have gradually proposed the concept of the “hydraulic air vent”, which entails hydraulically crushing the gas accumulation section of the pipeline, and allowing the gas to discharge from the pipeline with the water or oil flow by dispersing small bubbles. This process is often referred to as “bubble breaking” in the literature and involves studying the law of gas–liquid two-phase flow during the commissioning of undulating pipelines. The mechanism of bubble collapse is very complicated, and only a few researchers have attempted to investigate it experimentally. Jepson [7] found that the “aeration” phenomenon in a liquid plug is similar to bubble breakage in the water leap process. He observed the formation process of small bubbles in a liquid plug by photographing the slug body and found that some of the broken small bubbles flowed back and re-polymerized with Taylor bubbles, resulting in a “net” bubble breaking speed. Livinus and Verdin [8] observed that the pipe diameter, pipe inclination, and oil viscosity affected the drift velocity of the elongated bubble. Based on the VOF method, Wu et al. [9] established a 2D transport model of gas to study the transport of gas in the liquid. Fernandes et al. [10] proposed that as the liquid film enters the liquid plug, a large vortex forms at the head of the liquid plug, producing strong turbulence and causing the bubble to burst. Fan et al. [11], and Bonetto and Lahey [12], proposed that the bubble breaking process in the head of the slug was similar to the process of a stream of liquid rushing into a static pool. Bonetto and Lahey [12], Manolis [13], Grotjahn and Mewes [14], and Andreussi et al. [15,16] found that the bubbles break off the tail of the long bubble and enter the liquid plug only when the speed of the “pushed” liquid film exceeds a nearby value. Lu et al. [17] found that the bubble begins to burst mainly from the bubble tail because the pressure difference between the inside and outside of the bubble tail is the highest. Due to buoyancy force, small bubbles in the liquid film will move upwards and polymerize with Taylor bubbles. Hence, the gas content in the liquid film is usually ignored. However, Bacon et al. [18] found that the gas content in a liquid film is much higher than that in the air–water during bubble breakage experiments on an air–oil two-phase system, which shows that bubble breakage is more serious in air–oil systems. Nydal and Banerjee [19] found that the bubble breakage phenomenon becomes more noticeable with increasing liquid plug speed, and the bubble breakage can only be ignored when the liquid plug speed is small enough. Brauner and Ullmann [20] demonstrated that the wall jet and the shear layer formed when the liquid at the tail of a long bubble in a liquid film rushes into the liquid plug were important explanations for tail fragmentation The breaking speed is determined by the balance between the kinetic energy of the turbulent field and the surface energy of the bubble. Zhang [21] analyzed the mechanism of bubble breakage based on bubble stress calculation. He showed that during the rupture process, the gas phase was subjected to destructive force and sustaining force. The former force breaks the bubbles, whereas the latter maintains the shape of the bubbles. The balance between these two forces determines whether the bubble bursts. In addition, Zhang [21] built a one-dimensional quasi-steady-state pressureless wave model for the gas-bearing section at the downslope of a large-drop pipeline, which can describe the change process of parameters such as the position, pressure, and length of the gas-bearing section over time. Zhang [22] built a two-dimensional model for the shape of a massive stationary air pocket in the downhill section and proposed a combined model for air pocket movement based on the position and shape of the air pocket. Chen et al. [23] investigated bubble migration in inclined pipes using the Eulerian–Lagrangian coupling scheme. Zeng and Xu [24] studied the distribution function of bubble diameters in a polydisperse bubble flow field and verified that the diameter distribution of bubble flow in a pipe follows a lognormal distribution. Chen [25,26] conducted an experimental study on the law of bubble breakage in an air–water two-phase system by building an experimental loop. Combining experimental phenomena and data analysis, the bubble breaking phenomenon during the production process of an undulating pipeline was described in detail. The gas–liquid two-phase flow law during the bubble breaking process was analyzed, and the effects of liquid flow velocity, downslope and upslope pipeline inclination angles, and the size of the backpressure of the pipe section on the bubble breaking process were presented. A hydraulic breakage model was established based on hydraulic breakage of air pockets. Rosero et al. [27] complemented the quantitative analysis of Celis et al. on the dynamics of small and large bubbles in expansions and contractions with a detailed description of the physical mechanisms that lead to the fragmentation and merging of bubbles. Rodrigues et al. [28] observed that the gas accumulation tends to grow at low flow velocities.
According to the above investigations, current models cannot describe the problem of “hydraulic air vents” during the commissioning of a continuous undulating pipeline with large drops. In particular, the gas phase moves between the many connected undulating pipe sections, yielding an even more complicated “hydraulic air vent” process, and complicated pressure and gas–liquid flow rate variations. During such a process, the pipe backpressure gradually accumulates, affecting the gas-phase transfer between these units [29]. Hence, this paper establishes the gas-phase migration model, which is suitable for the commissioning process of continuous undulating large-drop liquid pipelines and can accurately predict the gas accumulation and pipe section pressure of each U-shaped unit.

2. The Gas-to-Liquid Replacement Model

2.1. The Gas-to-Liquid Replacement and Two-Phase Flow Processes

The process of filling a pipeline with water replaces the atmospheric air in the pipeline with water, and gas–liquid two-phase flow often occurs when there is a large drop in the pipeline [30]. Table 1 shows the large differences between the gas–liquid two-phase flow in commissioning and the traditional gas–liquid two-phase flow.
Zhang [31] demonstrated that the flow patterns in the water filling process mainly include stratified flow, slug flow, and dispersed bubbly flow. The flow pattern in the pipe is affected by many factors such as the pipe inclination angle, water filling rate, and pipe diameter. At the initial water filling stage, a gas accumulation section forms in the downslope section of the pipeline. The buoyancy and friction forces in the gas section are balanced, and the gas section is almost stationary. At this point, the gas and liquid are considered to be in a stratified flow pattern [32]. As the water filling rate increases, the tail of the long gas section begins to break, forming small bubbles and transforming to slug flow and dispersed bubble flow. Small bubbles may coalesce in the downstream uphill section and remain in the next steep downhill section.

2.2. Modeling the Gas–Liquid Two-Phase Flow

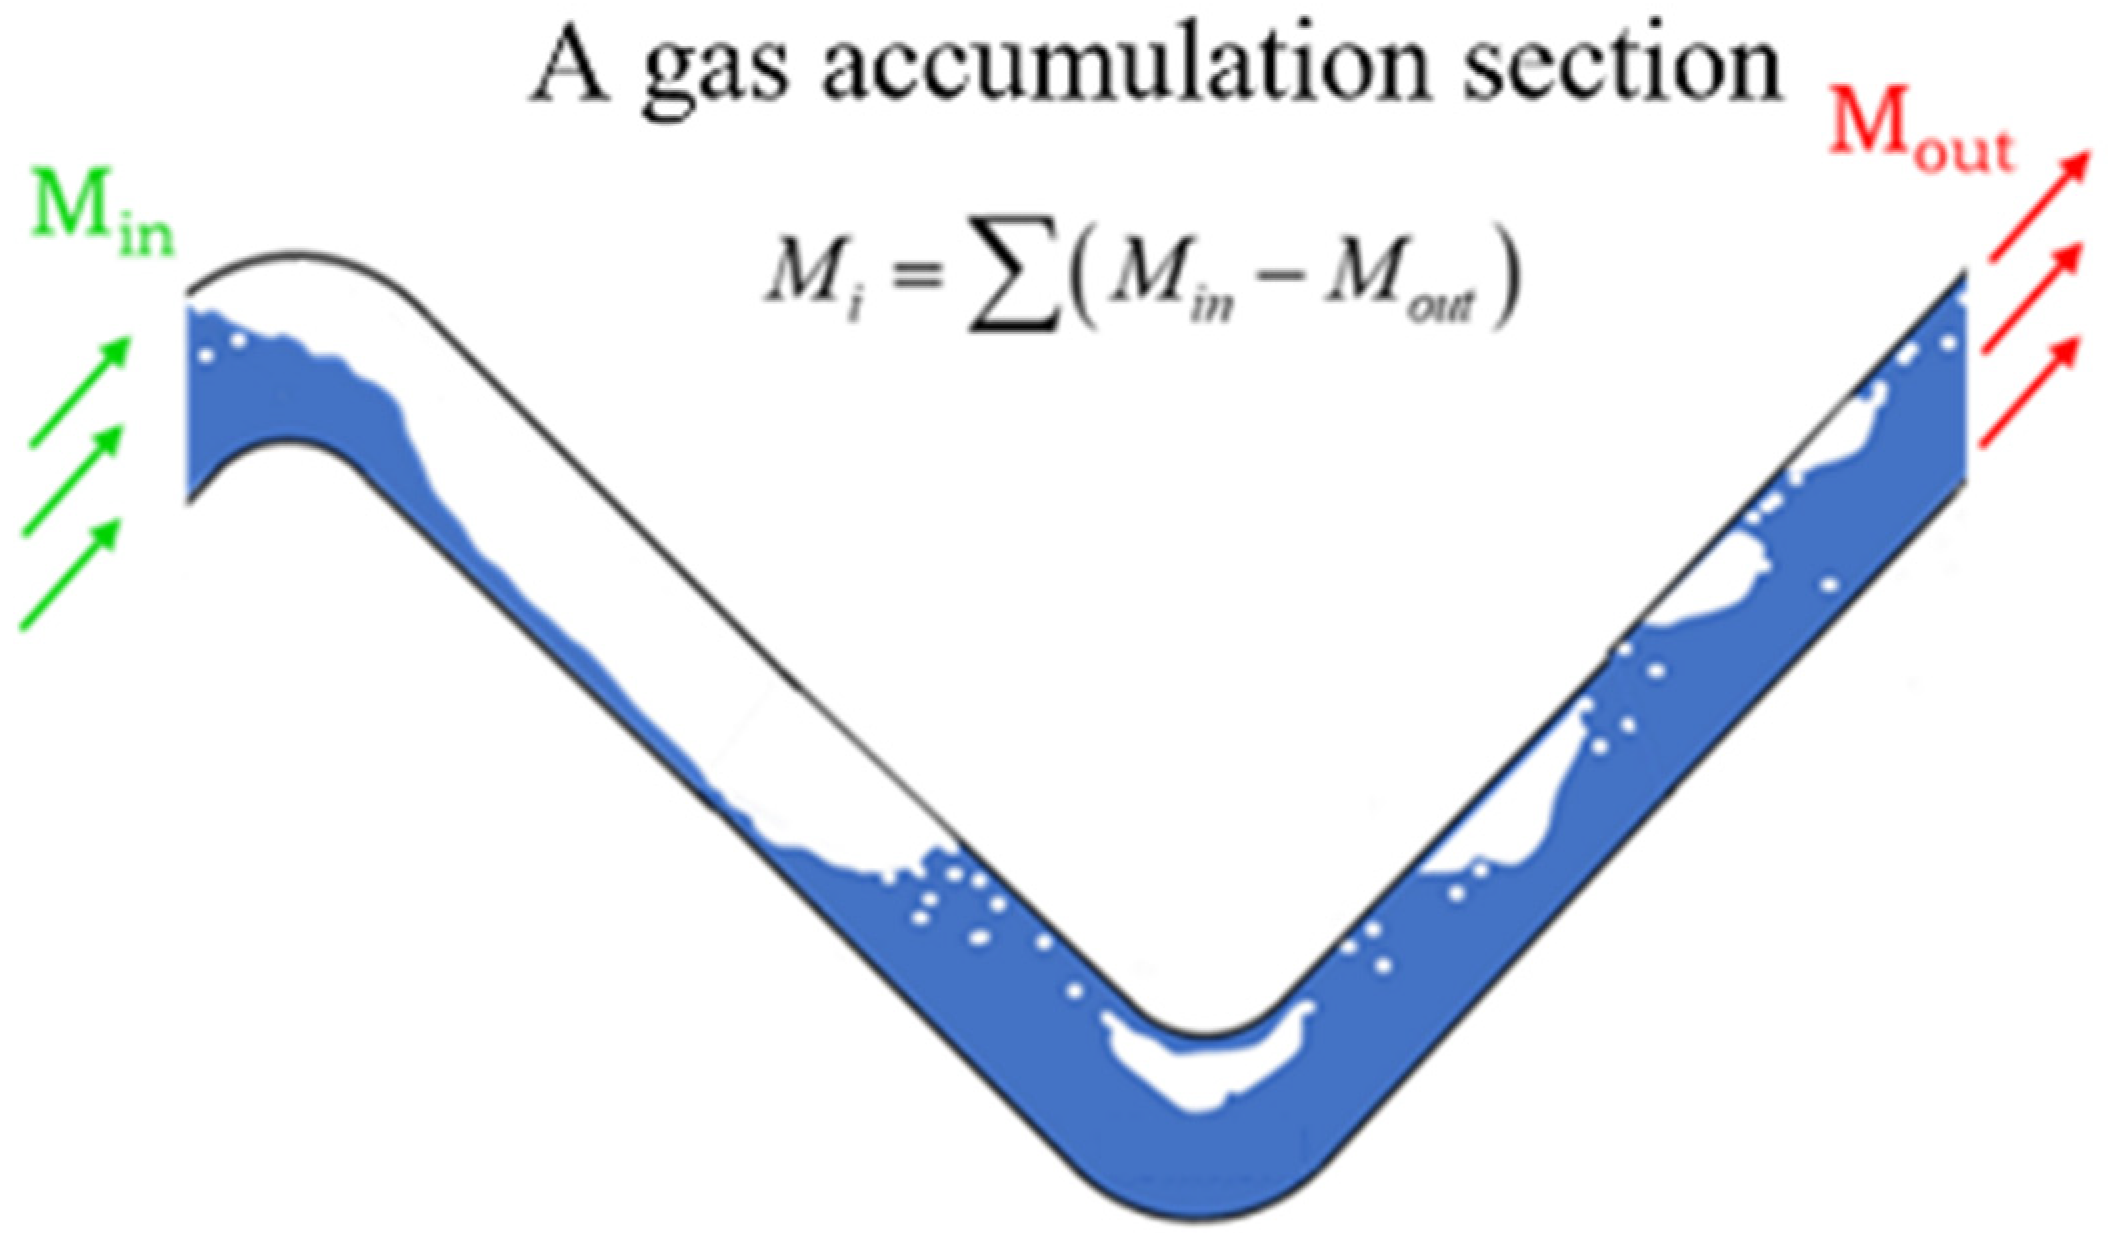
2.2.1. The Formation of Gas Accumulation Section

The pipeline uses a water–air displacement process such as water intermodal transportation or the commissioning of partial pipe sections filled with water. The pipe is firstly filled with atmospheric air before the water enters into the pipe. When the water flows over the high point of the pipe, some air accumulates at the high point of the pipe, and the water flows by itself to the low point of the pipe in the form of a dissatisfied flow [33]. At this time, the flow of water can be regarded as the flow of an open channel. Scholars have modeled and analyzed the air content [34]. A schematic diagram of open channel flow is shown in Figure 2. This article used the Xie formula to calculate the average flow velocity during uniform flow.
v l = C R θ l
where vl is the average flow velocity of the liquid phase; C is the Xie coefficient; θ l is the inclination angle of the downslope section of the pipeline; R is the hydraulic radius of the pipe.
The liquid phase flow rate is calculated as follows:
Q l = A l v l
where Al is the overcurrent cross-sectional area of the liquid phase; Ql is the liquid flow rate.
The Xie coefficient is calculated with the Manning formula:
C = 1 n R 6
where n is the roughness factor; in this paper, n is 0.01.
Some supplementary equations are as follows:
R = A l S l
A l = r 2 ( δ 1 2 sin 2 δ )
S l = 2 r δ
where Sl is the wet cycle of the liquid phase; r is the pipe radius; δ is the liquid phase inscribed angle.
By iteratively solving Equations (1) to (6), the gas content and initial gas content of the gas accumulation section sealed in the downslope section of the pipeline by the liquid accumulation at the low point can be obtained.

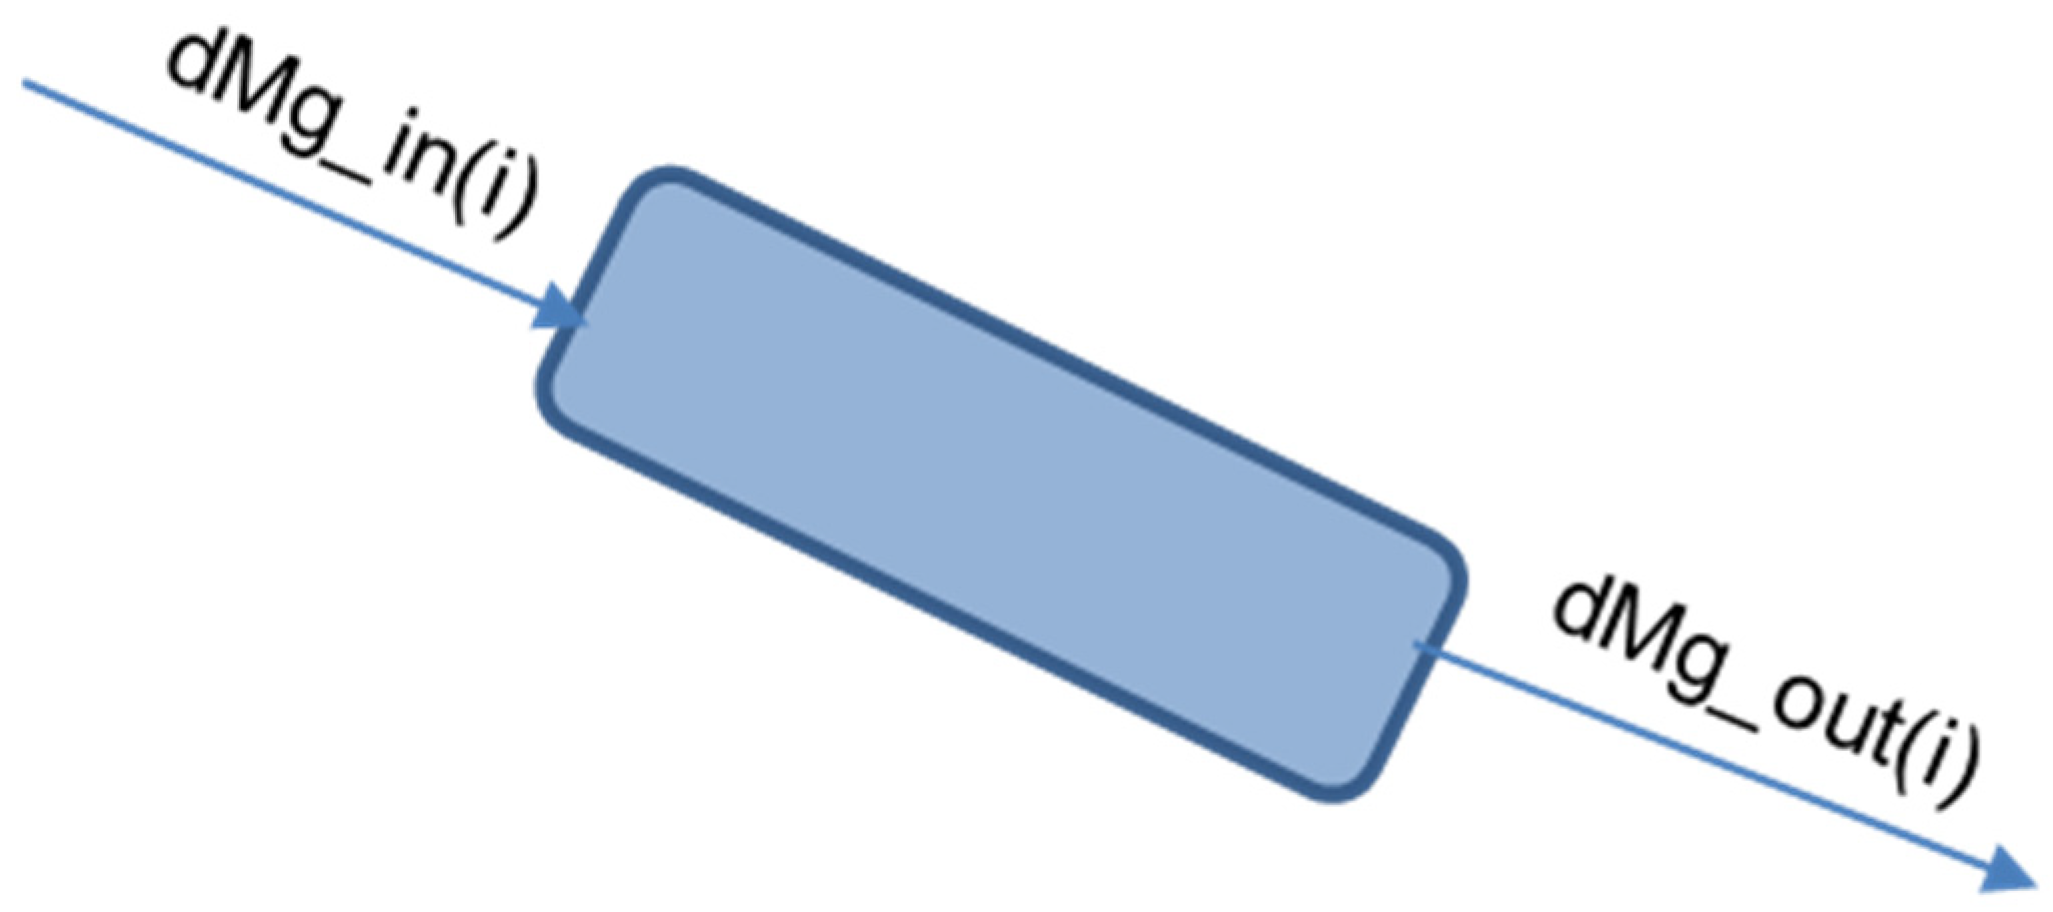
2.2.2. Compression Model of the Gas Accumulation Section

Once the gas accumulation section forms in the pipe downslope section, the accumulated liquid at the low position of the pipe blocks the gas migration. Hence, the accumulated liquid amount begins to increase, and therefore the gas phase is compressed. The gas accumulation section enters the new compression stage [35]. Assuming that backpressure at the end of the uphill liquid section is equal to the atmospheric pressure, the gas–liquid two-phase model for the U-shaped pipe section was built to study the variations in the pressure, length, and liquid level. A schematic diagram of the U-shaped pipe section is shown in Figure 3.
(1) Gas-phase continuity equation
Taking the air pocket at the downhill section as the control body, the mass of the air pocket remains a constant during the air pocket compression stage, yielding the equation
m g t = 0
(2) Liquid-phase continuity equation
Taking the liquid phase of the entire U-shaped pipe section as the control body yields the equation
m l t = ρ l Q l
where ml is the mass of the liquid phase in the control body; ρl is the liquid-phase density; Ql i is the volume flow of the liquid phase at the inlet of the downslope section.
(3) Momentum equation at the downslope section
A schematic diagram of downhill stratified flow is shown in Figure 4. Taking the two-phase region of the downslope section as the control body, using the gas–liquid two-phase stratified flow two-fluid model proposed by Taitel and Dukler [36], for the two-phase momentum equation, the pressure gradient term can be eliminated to obtain Equation (9):
( ρ l ρ g ) g sin θ 1 τ l S l A l + τ g S g A g τ i S i ( 1 A l + 1 A g ) = 0
where ρg is the density of the gas phase; Ag is the cross-sectional area of the gas phase, and Al is the cross-sectional area of the liquid phase; τ is the shear stress; S is the wet cycle; the subscripts g, l, and i represent the gas phase, liquid phase, and interphase, respectively.
{ S g = D ( π δ ) S l = D δ S i = D sin δ
The shear forces τg and τl at the pipe wall adopt the Blasius formula; the interface shear force τi ignores the interface fluctuation.
{ τ g = f g ρ g v g 2 2 τ l = f l ρ l v l 2 2 τ i = f i ρ g ( v g v l ) 2 2
where f is the coefficient of friction; v is the speed; the subscripts g, l, and i represent the gas phase, liquid phase, and interphase, respectively.
Assuming that the gas accumulation section is stationary at the high point, that is, vg = 0, Equations (9) and (10) can be simplified to
{ ( ρ l ρ g ) g sin θ τ l S l A ( 1 H g ) = τ i S i ( 1 A ( 1 H g ) + 1 A H g ) H g = 1 - 1 π ( δ 1 2 sin 2 δ )
where vsl is the liquid-phase conversion speed; μl is the dynamic viscosity of the liquid phase; Dhl is the equivalent hydraulic diameter of the liquid; Re is the Reynolds number.
The interphase friction coefficient fi adopts the value of 0.0142, as recommended by Shoham and Taitel [37].
(4) Momentum equation of liquid accumulation section
Taking the liquid accumulation section as the control body yields the momentum equation
( P g P a ) A F i ( h 1 sin θ 1 + h 2 sin θ 2 ) ρ l A ( h 2 h 1 ) g = t [ ρ l A ( h 1 sin θ 1 + h 2 sin θ 2 ) u ] ρ l Q l 2 A ( 1 H g )
where Pa is the atmospheric pressure at the outlet of the pipeline; Fi is the unit resistance along the way; hl is the liquid height in the upstream downslope section; u is the forward velocity of the liquid in the downstream upslope section; u and Fi are calculated by Equations (14) and (15), respectively:
A L = r 2 ( δ 1 2 sin 2 δ )
F i = ρ l g A β Q l 2 m ν l m D 5 m
where β is a coefficient, taken as 0.0246 for the hydraulically smooth zone; m is a coefficient, taken as 0.25 for the hydraulically smooth zone; vl is the kinematic viscosity.
(5) Supplementary equation
In the process of accumulated liquid movement, the increasing speed of the liquid level in the downslope section is equal to the height change speed of the gas accumulation section, yielding
h 1 sin θ 1 t + L g t = 0
Equations (7), (8), (13), (14), and (16) are solved simultaneously to obtain Pg, h1, h2, u, and Lg at each time step. Then, these solved parameters are input into Equation (12) as priority known parameters to solve the new Hg. The solution methods can be the finite difference method and the Newton iteration method. Hence, the pressure and gas accumulation length along the pipeline can be obtained.
It should be noted that this is the modeling process of a single U-shaped pipe section, and the process of gas migration and pressure transmission needs to be considered in the linkage calculation process.

3. Analysis of Gas Migration in Different Pipeline Topographies

As mentioned above, an actual long-distance undulating pipeline can be regarded as being composed of multiple U-shaped pipe sections. Each U-shaped pipe section includes a downhill section and an uphill section, connected by a bend at the low point. Because the actual terrain is undulating, the shapes of the U-shaped pipe sections composed of the upper and lower slope sections differ in terms of the pipe lengths, elevation differences, and inclination angles. Therefore, the movement characteristics of the air pocket in the downslope section differ from each other. It is necessary to study the effects of a U-shaped section topography with different structures on the discharge of the downslope gas accumulation section and to determine the internal gas and hydraulic air vent at different points along the long-distance pipeline.

3.1. Division of Different Pipeline Terrains

To analyze the commissioning process in undulating terrain, we firstly classify the pipeline in terms of the inclination angle, backpressure, and elevation differences, which also allows exploring the terrain in terms of the inclination angle and elevation difference [38]. In an actual pipeline, the inclination angle usually refers to the angle between the centerline of the pipeline and the horizontal direction (ranging from −90° to 90°), which is positive in the counterclockwise direction and is often replaced by a slope in practical engineering [39]. The slope is calculated by dividing the height difference of a certain section by the mileage difference, which is the tangent of the pipe angle. The slope range of most pipelines is approximately 2~10‰, and the corresponding relationship is as shown in Table 2.
The angle of inclination is an important factor when characterizing a “large drop” and affects the gas accumulation in the pipeline. This paper takes a crude oil pipeline in China as an example to show the classifications. The maximum drop in the pipeline within 20 km is 1500 m. According to the table data, its slope is about 75‰, and the inclination angle is about −4.25°. The mileage, elevation, and slope data for the entire pipeline are shown in Figure 5.
Figure 5 shows a large error in the slope calculated from the adjacent measurement points, which is caused by inaccurate measurement values and using the original and non-segmented slope calculation method. The correct slope should be calculated with two points at a fixed interval while removing abnormal measurement points. Accordingly, we obtain a simplified slope profile, as shown in Figure 6. As a result, the division of pipe sections can be further refined, and the pipe can be divided into a simplified terrain composed of several upslope and downslope sections. The calculation units can be combined to form a U-shaped pipe, and the full pipe flow can be calculated from the initial section.

3.2. The Hydraulic Air Vent Model of a Continuous Undulating Pipeline

Continuous large-drop pipelines often have multiple gas accumulation sections, and the pressure in each gas accumulation section constantly changes during the water filling process [40]. The compression model of the accumulation section can be used to obtain the pressure in the downslope section of the U-shaped pipe where the current water head is located. The air pressure of each pipe section before the current head needs to be corrected based on the original calculation. A schematic diagram of continuous U-shaped gas accumulation is shown in Figure 7.
In the liquid plug growth model, the gas accumulation section where the water head is located can directly use the accumulated gas compression model, whereas other U-shaped pipe sections need to consider changes in the backpressure based on the former. In other words, in the momentum equation of the liquid plug body, if the original backpressure Pa changes, this new backpressure becomes the accumulation pressure Pg(n) in the adjacent downstream section.
( P g ( n - 1 ) P g ( n ) ) A F i ( h 1 sin θ 1 + h 2 sin θ 2 ) ρ l A ( h 2 h 1 ) g = t [ ρ l A ( h 1 sin θ 1 + h 2 sin θ 2 ) u ] ρ l Q l 2 A ( 1 H g )
Assuming the current pipe section of the water head is numbered as n, the liquid plug growth model can be used to iteratively solve the parameters of each U-shaped pipe section. The calculation matrices for the length and pressure of the air pocket are expressed by Equation (18) with the use of the finite difference method.
A X = B A = [ a 11 a 12 0 0 0 0 a 22 0 a 24 0 0 0 a 33 a 34 a 35 0 0 0 a 44 0 0 a 52 a 53 0 0 ] X = [ P g k + 1 L g k + 1 h 1 k + 1 h 2 k + 1 u k + 1 ] T
The calculation methods of the related parameters in Equation (18) are as follows:
{ a 11 = L g k a 12 = P g k a 22 = H g k Δ t a 24 = 1 sin θ 2 Δ t a 33 = ρ 1 A u k sin θ 1 Δ t a 34 = ρ 1 A u k sin θ 2 Δ t a 35 = ρ l A ( h 1 k sin θ 1 Δ t + h 2 k sin θ 2 Δ t ) a 44 = 1 a 52 = 1 a 53 = 1 sin θ 1
In a continuous pipeline, the calculation formula of the parameters related to the backpressure in the matrix needs to be adjusted so that it can be used to calculate the pressure and air changes of the first n − 1 pipe sections when the water head flows in the nth pipe section. The calculation formulas need to be transformed into the form of Equation (20):
{ b 1 = 2 P g k L g k b 2 = Q l A + h 2 k sin θ 2 Δ t H g k L g k Δ t b 3 = ( P g k P a ) A F i ( h 1 k sin θ 1 + h 2 k sin θ 2 ) ρ l A ( h 2 k h 1 k ) g + ρ l Q l 2 A ( 1 H g k ) + 2 ρ l A ( u k h 1 k sin θ 1 Δ t + u k h 2 k sin θ 2 Δ t ) b 4 = h 2 k + u k sin θ 2 Δ t
{ b 3 ( 1 ) = ( P g k ( 1 ) P g k ( 2 ) ) A F i ( h 1 k sin θ 1 + h 2 k sin θ 2 ) ρ l A ( h 2 k h 1 k ) g + ρ l Q l 2 A ( 1 H g k ) + 2 ρ l A ( u k h 1 k sin θ 1 Δ t + u k h 2 k sin θ 2 Δ t ) b 3 ( n - 1 ) = ( P g k ( n - 1 ) P g k ( n ) ) A F i ( h 1 k sin θ 1 + h 2 k sin θ 2 ) ρ l A ( h 2 k h 1 k ) g + ρ l Q l 2 A ( 1 H g k ) + 2 ρ l A ( u k h 1 k sin θ 1 Δ t + u k h 2 k sin θ 2 Δ t )
The calculation mainly considers the effect of the backpressure changes on the accumulated gas pressure, ensuring the quasi-steady-state calculation in the flow state. This method can also be used to connect pipe sections during pigging, with only the static pressure change needing to be considered during exhaustion.
In the mass transfer part of the gas accumulation section, it is necessary to consider that the gas mass has a transfer effect both before and after, which is mainly reflected in the upstream gas inflow and the gas in this section after the gas is broken and flows downstream. The process is shown in Figure 8 and Figure 9.
The above model is solved by the following procedures at each time step. Firstly, the gas–liquid two-phase flow is solved to calculate the pressure and liquid hold-up along the pipeline, so that the gas accumulation sections can be located. However, the liquid hold-up and pressure along each pipe section are affected by other sections connected to this section. The upstream and downstream boundary conditions used in the gas–liquid two-phase flow model should be calculated based on the hydraulic air vent model. Finally, all the variables along the pipeline are solved. The detailed solution procedures are depicted in Figure 10. All the above procedures are repeated until the water head reaches the end of the pipe.

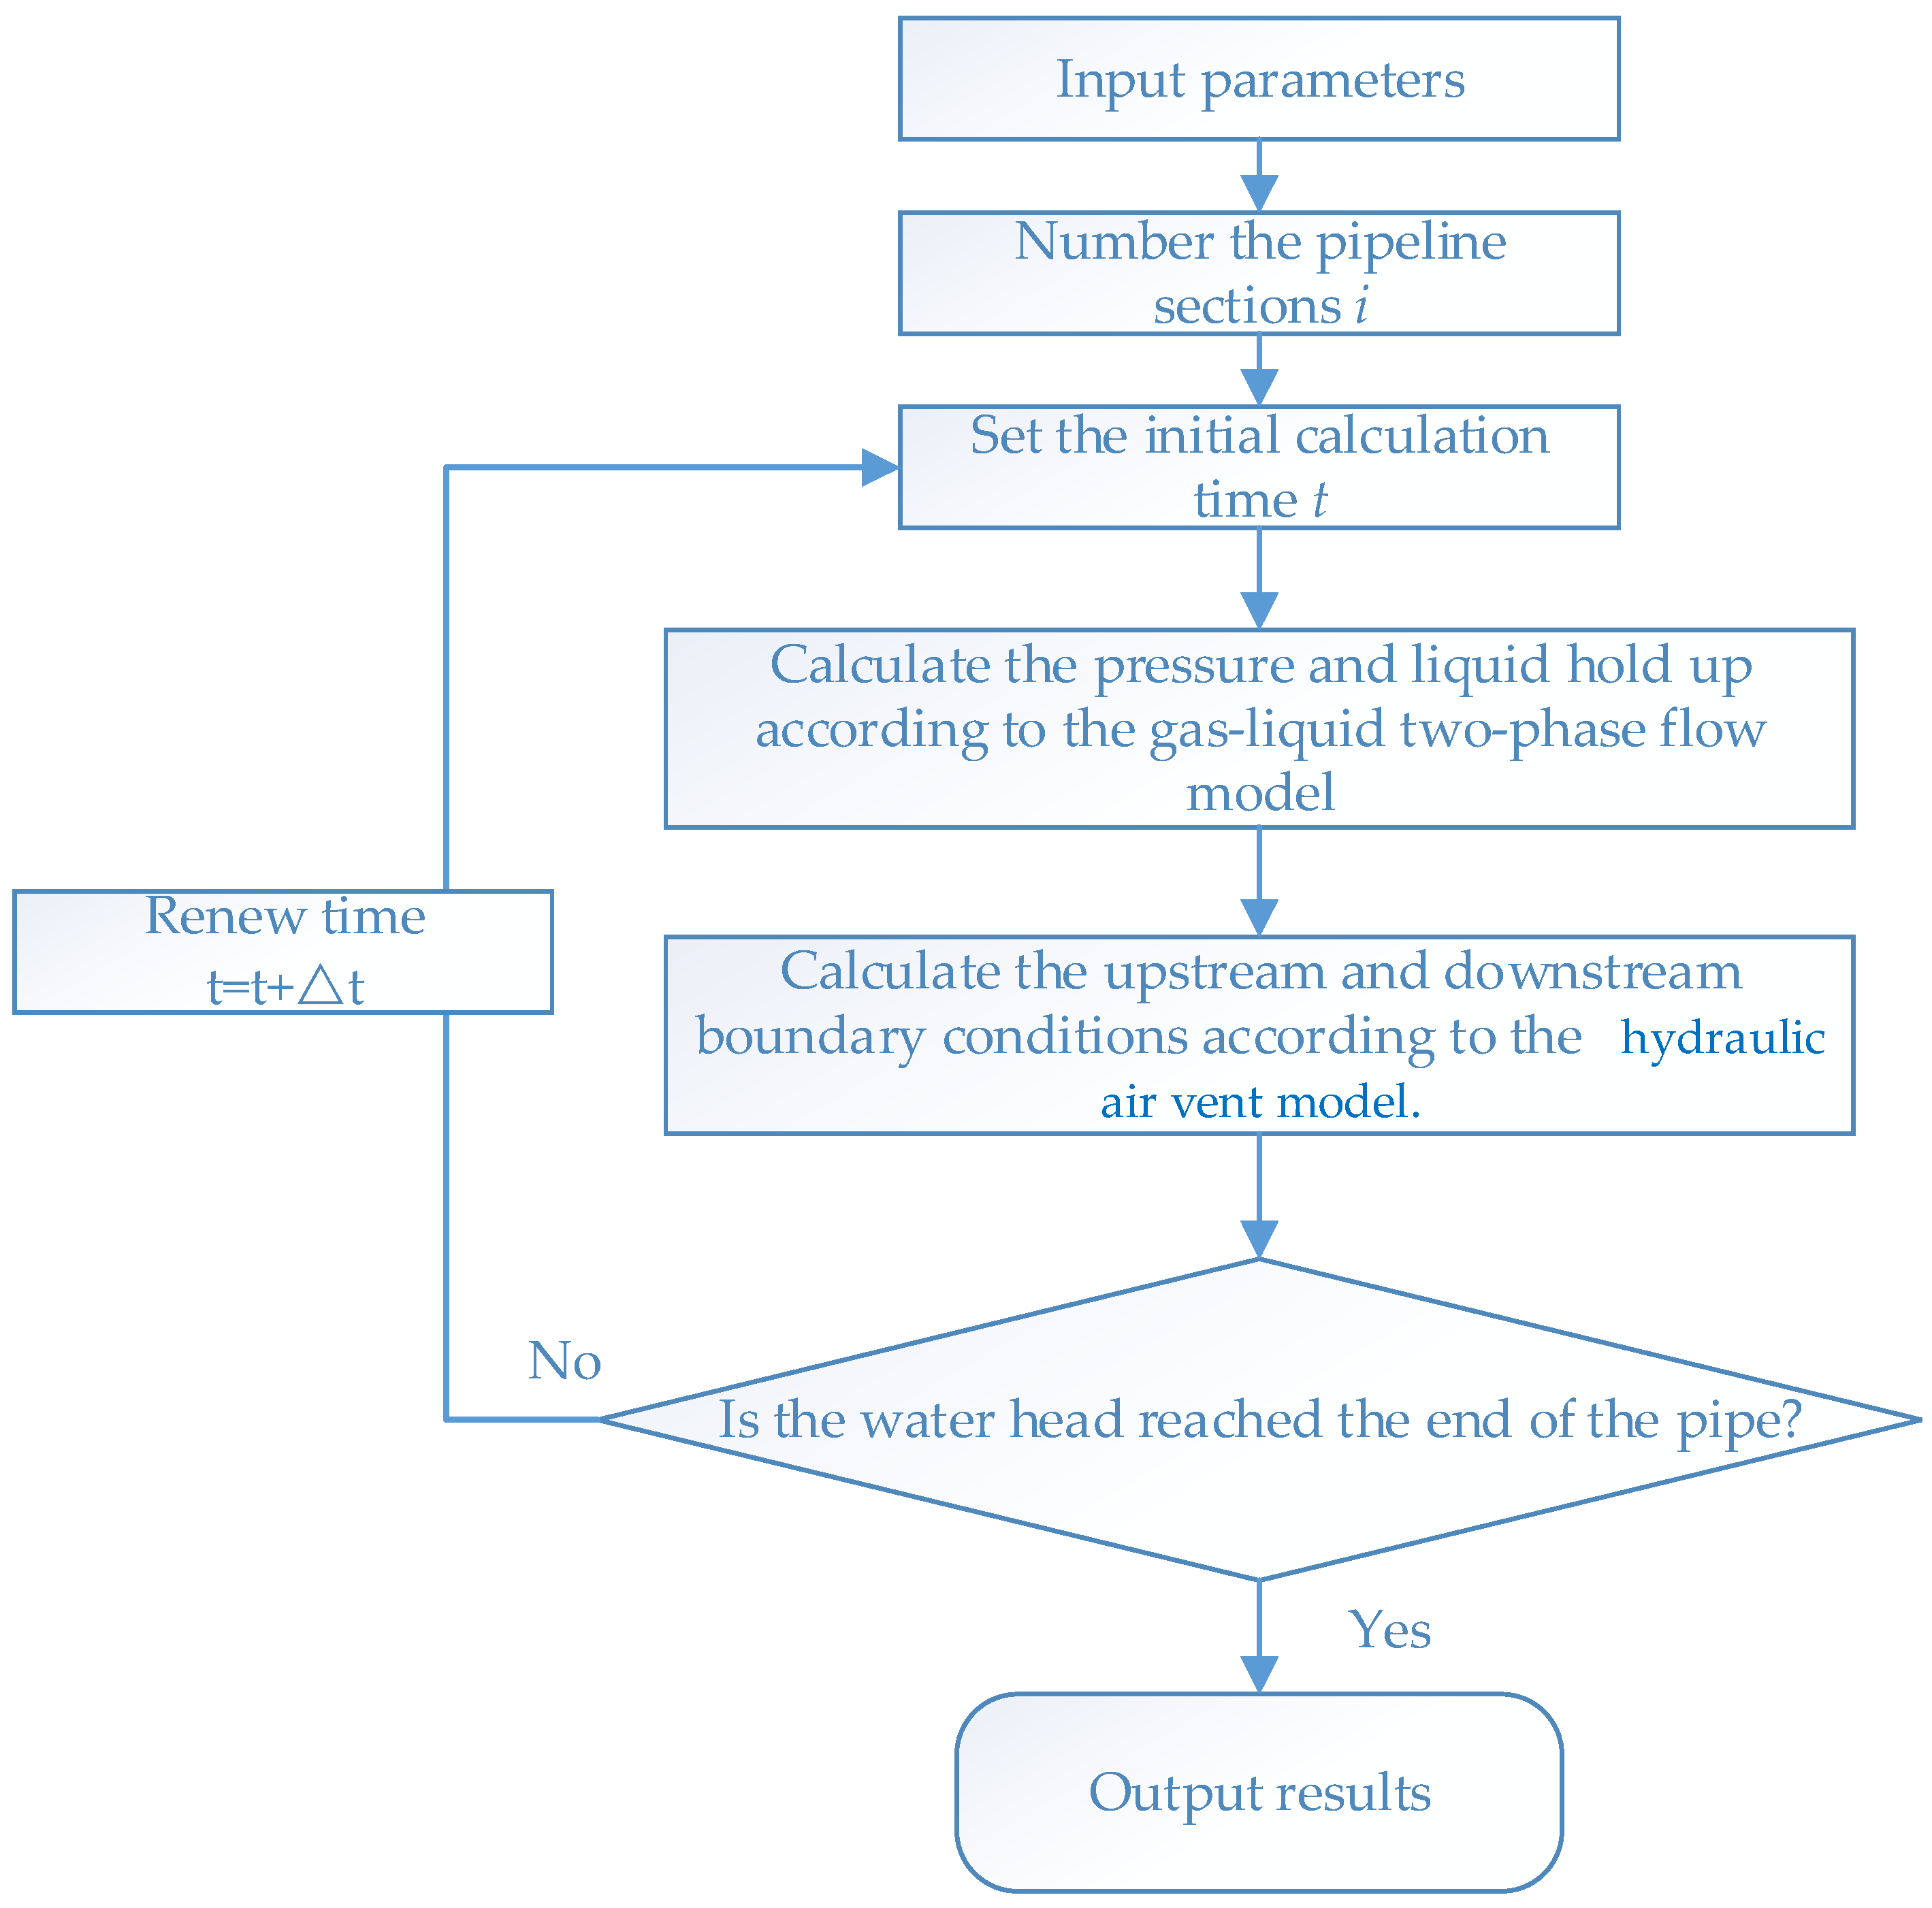
4. Calculation of Gas-Phase Migration in a Continuous Undulating Pipeline

This example uses a real crude oil pipeline to simulate the working conditions by simplification. The elevation along the pipe is shown in Figure 5, and the pipe inner diameter is 0.7786 m. Five pump stations and thirty valve chambers are installed along the pipeline. The positions of all the pump stations and some of the valve chambers are presented in Table 3 and Table 4, respectively. During the commissioning process, it is difficult to measure the real air volume in the pipe, so the pressure at pump stations #1 and #2 and at valve chambers 16#, 20#, 24#, 27#, 29#, and 30# was applied to validate the model. In the simulation process, the controlled variable method was used, which mainly considers the influence of the terrain itself on the hydraulic air vent and always maintains the consistency of parameters such as the flow rate and pipe diameter. The flow rate was here set to 869 m3/h.
The actual inlet pressure variations with time at pump station #1 and pump station #2 during the commissioning process were used to validate the model. Comparisons between the simulation pressure and actual pressure are shown in Figure 11 and Figure 12. It can be seen that the calculated pressure of the model is in good agreement with the actual pressure data of the commissioned pipeline, and the maximum error is within 0.3 MPa. The model has a certain degree of accuracy for the simulation of the pressure of the continuous undulating pipeline during the start-up process, as well as a certain degree of credibility for the pipeline accumulation pressure, density, and other parameters as well as the system’s hydraulic air vent simulation.
Moreover, comparisons between the calculated pressures and those at six valve chambers are depicted in Figure 13. The results show that the relative deviation is less than 8% and the maximum deviation is less than 0.25 MPa, which represents high accuracy in the two-phase flow simulation.
The simulation results in Figure 14, Figure 15 and Figure 16 show that the gas in the pipe section is first compressed during the compression process, causing the rising pressure. As the pressure rises, gas bubble crushing begins after reaching the critical point of crushing, and the quality of the gas section and the pressure decrease.
There are notable mass transfer effects before and after the first and second gas sections. Based on the topography and theoretical model, it can be concluded that due to insufficient backpressure, the first section has a low crushing speed, and backward mass transfer occurs during the crushing process. For the second pipe section, the length and height differences of the upslope section are relatively large, and the pipe can be quickly broken if the backpressure is large. The third and fourth pipe sections also have mass transfer during the overall process.
From the comprehensive experimental and simulation data analysis of the multi-pipe hydraulic air vent process, the following analysis results can be obtained:
(1)
The hydraulic air vent speed is affected by the backpressure. For the same pipe length, the larger the upwards inclination angle, the faster the gas bubble breakage and the larger the hydraulic air vent volume.
(2)
The multi-pipe hydraulic air vent process is more complicated than that of a single pipe and is affected by gas mass transfer and backpressure transfer. In comparison with the single-pipe flow, the multi-pipe flow is more dangerous due to backpressure fluctuations, the faster hydraulic air vent speed, and the higher air pressure.
(3)
The mass transfer of the gas section is one of the reasons for the overpressure at some points of the pipeline. The gas section at the point with the highest backpressure is more likely to be completely broken, and the broken bubbles will be transmitted downstream of the pipe, forming a new gas section in a new pipe section with a lower backpressure that may even exceed the length of the original gas section.
(4)
In pipe sections with a low backpressure, and pipe sections with large differences in the backpressure between the front and back of the sections, special attention should be paid to preventing pressure overrun, and gas should be timely vented to prevent air resistance at high points.
(5)
In addition to high points, temporary air vent valves should be installed at some locations where the terrain is undulating and where it is difficult to establish the backpressure. Alternatively, it is necessary to control the flow rate and to vent the air during the commissioning process.

5. Conclusions

This paper built a comprehensive gas–liquid replacement model to simulate the gas migration during the commissioning process of a continuous U-shaped pipe. The actual pipe pressures were applied to validate the model. The main conclusions are as follows:
(1)
The presence of gas migration in the continuous section will seriously affect the state of gas storage in the pipeline, resulting in abnormal pressure.
(2)
Considering the mutual influence of the gas-phase transfer between each pipe section in large elevation difference oil transmission pipelines, and the effect of the length, inclination, and backpressure of each pipe section on the air vent process, the gas-phase migration model established in this paper is suitable for a commissioning process of continuous undulating large-drop liquid pipelines, as it can accurately predict the gas accumulation and pipe section pressure of each U-shaped unit.
(3)
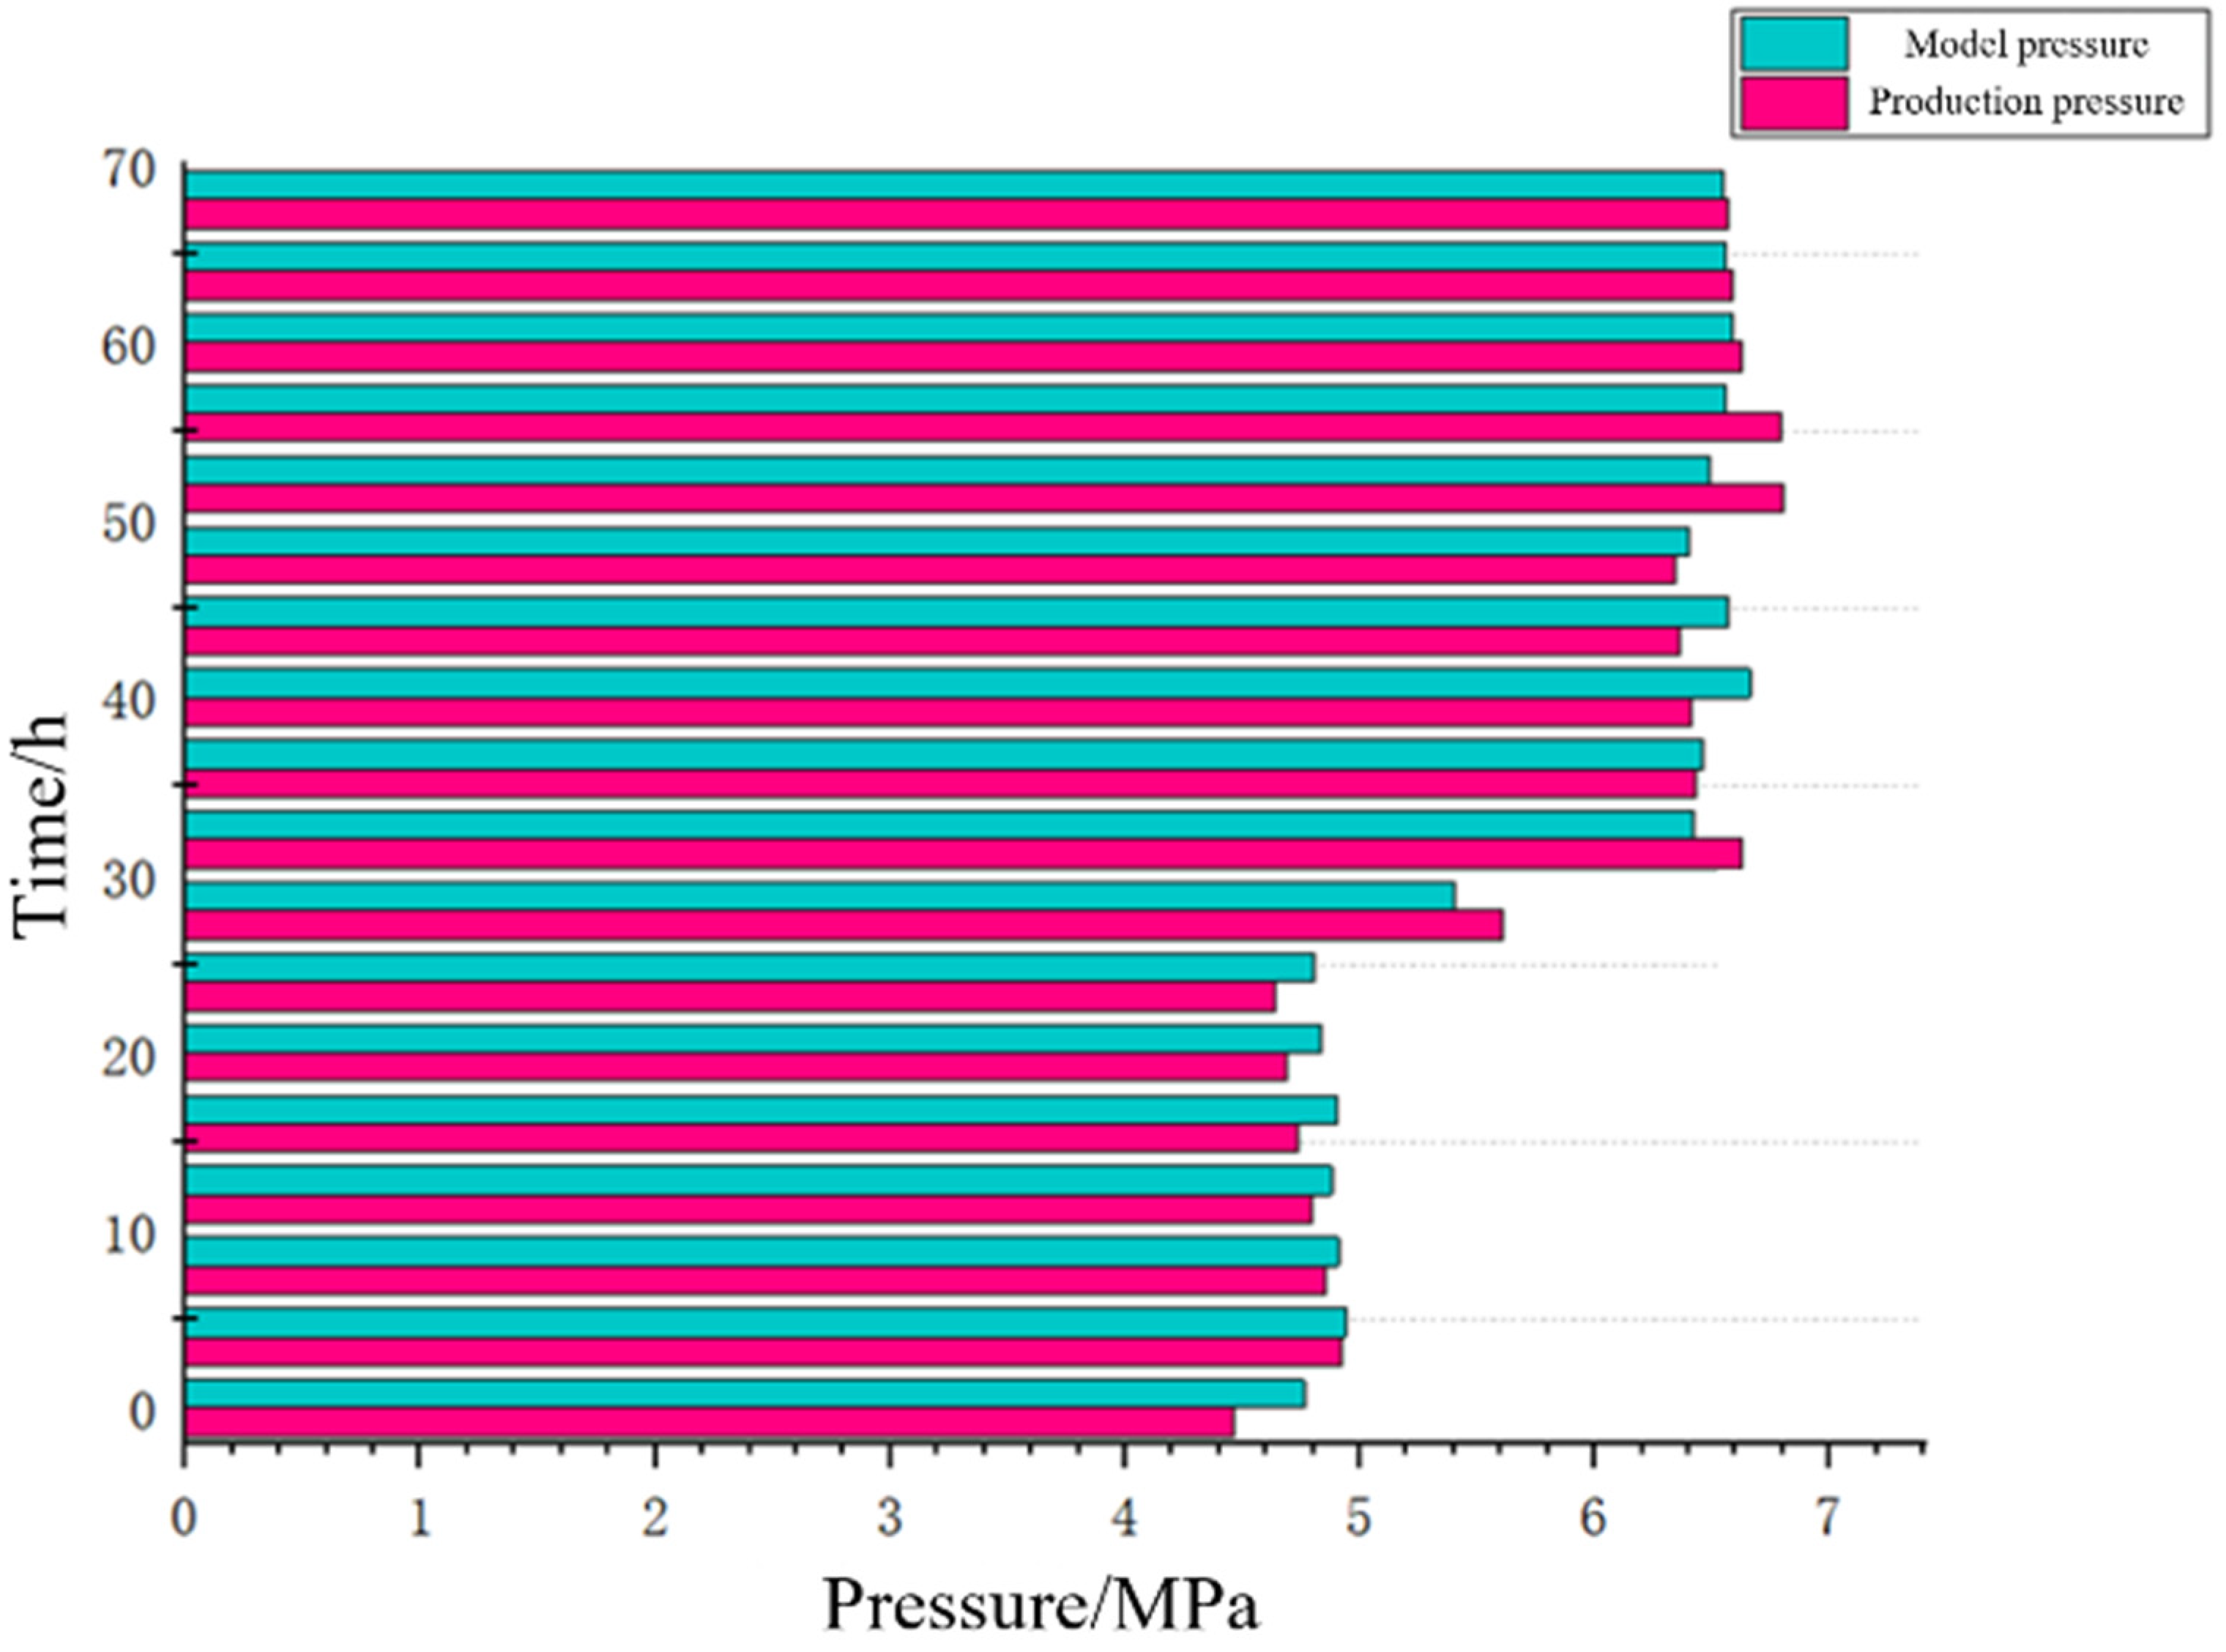
The model results were compared with the on-site production data of a domestic crude oil pipeline. The results demonstrate that the maximum deviation between the calculated pressure during the start-up process and real data is 0.3 MPa, indicating that the model can provide theoretical guidance and technical support for the safe and stable operation of continuous undulating liquid pipelines with large drops, in the future.
(4)
In the simulation process, the controlled variable method was used, which mainly considers the influence of the terrain itself on the hydraulic air vent but ignores some other parameters. In future research, more consideration should be given to the properties of the pipe and the liquid, such as the pipe diameter, and liquid density and viscosity, which will contribute to a broader application range of the model. Additionally, more experimental results will be useful to verify and improve the model.

Author Contributions

Conceptualization, L.F.; methodology, H.Z.; validation, H.Z. and Y.S.; formal analysis, W.C.; investigation, Y.S. and W.C.; writing—original draft preparation, L.F.; writing—review and editing, Z.L.; review and editing, W.J. All authors have read and agreed to the published version of the manuscript.

Funding

This research received no external funding.

Institutional Review Board Statement

Not applicable.

Informed Consent Statement

Not applicable.

Data Availability Statement

All data are presented in the paper.

Conflicts of Interest

The authors declare no conflict of interest.

References

  1. Jia, W.; Zhang, Y.; Li, C.; Luo, P.; Song, X.; Wang, Y.; Hu, X. Experimental and numerical simulation of erosion-corrosion of 90° steel elbow in shale gas pipeline. J. Nat. Gas Sci. Eng. 2021, 89, 103871. [Google Scholar] [CrossRef]
  2. Romero, G.; Fuertes-Miquel, V.S.; Coronado-Hernández, Ó.E.; Ponz-Carcelén, R.; Biel-Sanchis, F. Transient Phenomena Generated in Emptying Operations in Large-Scale Hydraulic Pipelines. Water 2020, 12, 2313. [Google Scholar] [CrossRef]
  3. Gong, J.; Yan, D.F. Analysis of flow characteristics for slack line flow in a long slope pipeline. J. China Univ. Pet. (Ed. Nat. Sci.) 1995, 19, 65–72. [Google Scholar]
  4. Gong, J.; Yan, D.F. Transient analysis for slack line flow in a long slope pipeline. J. Fushun Pet. Inst. 1996, 16, 45–50. [Google Scholar]
  5. Chen, Q.X.; Sang, G.S. Some technical problems about high elevation pipeline. Oil Gas Storage Transp. 1998, 17, 11–13. [Google Scholar]
  6. Jia, W.; Ban, J.; Liang, F.; Cheng, T.; He, Y.; Li, C. A New Homogeneous Non-Equilibrium Model to Compute Vapor-Liquid Two-Phase Critical Pressure Ratios of Multicomponent Hydrocarbon Mixtures. J. Loss Prev. Process Ind. 2020, 68, 104338. [Google Scholar] [CrossRef]
  7. Jepson, W.P. The flow characteristics in horizontal slug flow. In Proceedings of the 3rd International Conference on Multiphase Flow, The Hague, The Netherlands, 18–20 May 1987; pp. 187–198. [Google Scholar]
  8. Livinus, A.; Verdin, P.G. Experimental study of a single elongated bubble in liquid in under 10-degree upwardly inclined pipes. Exp. Therm. Fluid Sci. 2021, 120, 110247. [Google Scholar] [CrossRef]
  9. Wu, L.-Y.; Liu, L.-B.; Han, X.-T.; Li, Q.-W.; Yang, W.-B. Numerical simulation on dynamic behaviors of bubbles flowing through bifurcate T-junction in microfluidic device. Chin. Phys. B 2019, 28, 104702. [Google Scholar] [CrossRef]
  10. Fernandes, R.C.; Semiat, R.; Dukler, A.E. Hydrodynamic model for gas-liquid slug flow in vertical tubes. AIChE J. 1983, 29, 981–989. [Google Scholar] [CrossRef]
  11. Fan, Z.; Lusseyran, F.; Hanratty, T.J. Initiation of slugs in horizontal gas-liquid flows. AIChE J. 1993, 39, 1741–1753. [Google Scholar] [CrossRef]
  12. Bonetto, F.; Lahey, R.T. An experimental study on air carry under due to a plunging jet. Int. J. Multiph. Flow 1993, 19, 281–294. [Google Scholar] [CrossRef]
  13. Manolis, I.G. High Pressure Gas-Liquid Slug Flow. Ph.D. Thesis, Imperial College London, London, UK, 1995. [Google Scholar]
  14. Grotjahn, K.; Mewes, D. Measurements and calculations on the transient behaviour of two-phase slug flow in a horizontal pipe. In Proceedings of the Fourth International Conference on Multiphase Flow, New Orleans, LA, USA, 27 May–1 June 2001. [Google Scholar]
  15. Andreussi, P.; Bendiksen, K. An investigation of void fraction in liquid slugs for horizontal and inclined gas—Liquid pipe flow. Int. J. Multiph. Flow 1989, 15, 937–946. [Google Scholar] [CrossRef]
  16. Bendiksen, K.H.; Malnes, D.; Nydal, O.J. On the modeling of slug flow. Chem. Eng. Commun. 1996, 141–142, 71–102. [Google Scholar] [CrossRef]
  17. Lu, J.; Wang, T.; Li, L.; Yin, Z.; Wang, R.; Fan, X.; Tan, D. Dynamic Characteristics and Wall Effects of Bubble Bursting in Gas-Liquid-Solid Three-Phase Particle Flow. Processes 2020, 8, 760. [Google Scholar] [CrossRef]
  18. Bacon, R.P.; Scott, D.M.; Thorpe, R.B. Large bubbles attached to spargers in downwards two-phase flow. Int. J. Multiph. Flow 1995, 21, 949–959. [Google Scholar] [CrossRef]
  19. Nydal, O.J.; Banerjee, S. Dynamic slug tracking simulations for gas-liquid flow in pipelines. Chem. Eng. Commun. 1996, 141–142, 13–39. [Google Scholar] [CrossRef]
  20. Brauner, N.; Ullmann, A. Modelling of gas entrainment from Taylor bubbles. Part A: Slug flow. Int. J. Multiph. Flow 2004, 30, 239–272. [Google Scholar] [CrossRef]
  21. Zhang, N.; Gong, J.; Min, X.H.; Gao, F.L.; Chen, S.D.; Li, X.P. The influence of elevation on the commissioning of China West products pipeline. Oil Gas Storage Transp. 2008, 27, 5–8. [Google Scholar]
  22. Zhang, X.Y. Study on the Hydraulic Characteristics of Oil Pipeline Direct Commissioning Process. Master’s Thesis, China University of Petroleum, Beijing, China, 2015. [Google Scholar]
  23. Chen, S.; Gong, J.; Li, W.; Yang, Q.; Shi, G.; Li, X.; Shi, B.; Song, S.; Lv, P.; Fan, D.; et al. A new transient model of multi-scale bubble migration and evolution during gas-liquid flow in pipelines. J. Pet. Sci. Eng. 2021, 205, 108888. [Google Scholar] [CrossRef]
  24. Zeng, Y.; Xu, W. Investigation on Bubble Diameter Distribution in Upward Flow by the Two-Fluid and Multi-Fluid Models. Energies 2021, 14, 5776. [Google Scholar] [CrossRef]
  25. Chen, Y.Y. Study on Air Entrainment in Downhill Section of Large Slope Pipeline. Master’s Thesis, China University of Petroleum, Beijing, China, 2014; pp. 70–77. [Google Scholar]
  26. Chen, Y.Y.; Gong, J.; Yu, D.; Wu, H.H.; Li, X.P.; Gao, B.X. Development of slack flow analysis software for large-slope pipeline. Oil-Gas Field Surf. Eng. 2013, 32, 1–2. [Google Scholar]
  27. Rosero, C.M.P.; Celis, G.E.O.; Loureiro, J.B.R.; Silva Freire, A.P. Phenomenology of bubble breakup and coalescence in sudden expansions and contractions in vertical pipes. Int. J. Multiph. Flow 2022, 146, 103840. [Google Scholar] [CrossRef]
  28. Rodrigues, R.L.P.; Bertoldi, D.; dos Santos, E.N.; Schneider, F.A.; Neto, M.A.M.; da Silva, M.J.; Morales, R.E.M. Experimental analysis of downward liquid-gas slug flow in slightly inclined pipes. Exp. Therm. Fluid Sci. 2019, 103, 222–233. [Google Scholar] [CrossRef]
  29. Jia, W.; Yang, F.; Li, C.; Huang, T.; Song, S. A unified thermodynamic framework to compute the hydrate formation conditions of acidic gas/water/alcohol/electrolyte mixtures up to 186.2 MPa. Energy 2021, 230, 120735. [Google Scholar] [CrossRef]
  30. Chen, W.; Xu, H.-L.; Kong, W.-Y.; Yang, F.-Q. Study on three-phase flow characteristics of natural gas hydrate pipeline transmission. Ocean Eng. 2020, 214, 107727. [Google Scholar] [CrossRef]
  31. Zhang, N. Study on Two Phase Flow Law of Liquid Gas Replacement Process in Undulating Pipeline. Ph.D. Thesis, China University of Petroleum, Beijing, China, 2009. [Google Scholar]
  32. Wang, K.X.; Wang, Y.; Ma, J. Transient numerical simulation of gas-liquid two-phase flow in long distance water supply pipeline. In Proceedings of the 4th International Workshop on Renewable Energy and Development (IWRED), Sanya, China, 24–26 April 2020. [Google Scholar]
  33. Jia, W.; Okuno, R. Modeling of asphaltene and water associations in petroleum reservoir fluids using cubic-plus-association EOS. AIChE J. 2018, 64, 3429–3442. [Google Scholar] [CrossRef]
  34. Masiukiewicz, M.; Anweiler, S. Precise Evaluation of Gas–Liquid Two-Phase Flow Pattern in a Narrow Rectangular Channel with Stereology Method. Energies 2021, 14, 3180. [Google Scholar] [CrossRef]
  35. Huang, Y.; Yang, J.; Meng, L.; Chen, X.; Luo, M.; Li, W. Numerical Investigation on Gas Accumulation and Gas Migration in the Wavy Horizontal Sections of Horizontal Gas Wells. Math. Probl. Eng. 2020, 2020, 7275209. [Google Scholar] [CrossRef]
  36. Taitel, Y.; Dukler, D. Two phase slug flow. Adv. Heat Transf. 1990, 20, 83–132. [Google Scholar]
  37. Shoham, O.; Taitel, Y. Stratified turbulent-turbulent gas-liquid flow in horizontal and inclined pipes. AIChE J. 1984, 30, 377–385. [Google Scholar] [CrossRef]
  38. Zhang, D.; Zhang, H.; Rui, J.; Pan, Y.; Liu, X.; Shang, Z. Prediction model for the transition between oil–water two-phase separation and dispersed flows in horizontal and inclined pipes. J. Pet. Sci. Eng. 2020, 192, 107161. [Google Scholar] [CrossRef]
  39. Jia, W.; Lin, Y.; Yang, F.; Li, C. A novel lift-off diameter model for boiling bubbles in natural gas liquids transmission pipelines. Energy Rep. 2020, 6, 478–489. [Google Scholar] [CrossRef]
  40. Liu, E.; Guo, B.; Wang, M.; Ma, X.; Peng, Y. Analysis of the water-filling process for crude oil pipelines with a large drop in height. Energy Sci. Eng. 2020, 8, 2100–2115. [Google Scholar] [CrossRef]
Figure 1. Schematic diagram of the gas accumulation section formed during the commissioning of a large-drop pipeline.
Energies 15 01379 g001
Figure 2. Schematic diagram of open channel flow.
Energies 15 01379 g002
Figure 3. Schematic diagram of the accumulated gas compression model.
Energies 15 01379 g003
Figure 4. Schematic diagram of downhill stratified flow.
Energies 15 01379 g004
Figure 5. Elevation mileage and gradient map of a crude oil pipeline in China.
Energies 15 01379 g005
Figure 6. Simplified diagram of a section of the crude oil pipeline in China.
Energies 15 01379 g006
Figure 7. Schematic diagram of continuous U-shaped gas accumulation.
Energies 15 01379 g007
Figure 8. Schematic of air segment mass changes.
Energies 15 01379 g008
Figure 9. Mass change diagram of a single gas accumulation unit.
Energies 15 01379 g009
Figure 10. Solution procedure of the proposed model.
Energies 15 01379 g010
Figure 11. Comparison of the inlet pressure at pump station #1.
Energies 15 01379 g011
Figure 12. Comparison of the inlet pressure at pump station #2.
Energies 15 01379 g012
Figure 13. Comparison of the pressures at various valve chambers.
Energies 15 01379 g013
Figure 14. Variation in the pressure of a gas section in the multi-pipe simulation example.
Energies 15 01379 g014
Figure 15. Variation in the mass change of a gas section in the multi-pipe simulation example.
Energies 15 01379 g015
Figure 16. Variation in the mass flow rate of a gas section during gas bubble crushing in the multi-pipe simulation example.
Energies 15 01379 g016
Table 1. Differences between gas–liquid two-phase flow in pipe commissioning process and the traditional gas–liquid two-phase flow.
TypeInlet ConditionsGas in PipeGas Migration
Gas–liquid two-phase flow in commissioningLiquid phase onlyAtmospheric airThe gas section is sealed at a high point and can be transported after meeting certain conditions
Traditional gas–liquid two-phase flowGas–liquid two-phaseInjected gas into the inletThe gas and liquid move at the same time or have a speed difference
Table 2. The relationship between the pipe angle, radian, and slope.
Angle
φ
RadianSlope (‰)
0.250.00444.36
0.50.00878.73
0.750.013113.09
10.017517.46
1.250.021821.82
1.50.026226.19
1.750.030530.55
20.034934.92
2.250.039339.29
2.50.043643.66
Table 3. The positions of the pump stations.
Pump StationMileage (km)Elevation (m)
#10735
#2106.8883
#3153.31854
#4248.11688
#5402.41770
Table 4. The positions of some of the valve chambers.
Valve ChamberMileage (km)Elevation (m)
#16269.91861
#20353.01451
#24411.11832
#27480.62401
#29533.11832
#30548.11799
Publisher’s Note: MDPI stays neutral with regard to jurisdictional claims in published maps and institutional affiliations.

