Article

Numerical Investigation on the Mechanism of Transpiration Cooling for Porous Struts Based on Local Thermal Non-Equilibrium Model

1
College of Aerospace and Civil Engineering, Harbin Engineering University, Harbin 150001, China
2
School of Energy Science and Engineering, Harbin Institute of Technology, Harbin 150001, China
*
Author to whom correspondence should be addressed.
Energies 2022, 15(6), 2091; https://doi.org/10.3390/en15062091
Submission received: 21 February 2022 / Revised: 8 March 2022 / Accepted: 8 March 2022 / Published: 13 March 2022

Abstract

:
Struts as an important structure in the combustion chamber of hypersonic flight vehicles to inject fuel into main flow face a severe thermal environment. Transpiration cooling is considered as a potential method to provide a thermal protection for struts. This paper presents a numerical investigation on transpiration cooling for a strut based on Darcy–Forchheimer model and the local thermal non-equilibrium model and analyzes the mechanism of transpiration cooling. A coolant film and a velocity boundary layer are formed on the strut surface and the shock wave is pushed away from the strut, which can effectively reduce the heat load exerted on the strut. The temperature difference between coolant and solid matrix inside the porous strut is analyzed, a phenomenon is found that the fluid temperature is higher than solid temperature at the leading edge inside the porous strut. As flowing in the porous medium, the coolant absorbs heat from solid matrix, and the fluid temperature is higher than solid temperature at the stagnation point of the strut. The influence of coolant mass flow rate and various coolants on transpiration cooling is studied. As mass flow rate increases, the cooling efficiency becomes higher and the temperature difference between fluid and solid in the porous medium is smaller. The coolant with a lower density and a higher specific heat will form a thicker film on the strut surface and absorbs more heat from solid matrix, which brings a better cooling effect for strut.

1. Introduction

The scramjet engine plays an important role in the air breathing hypersonic vehicles. However, the mean stream flows into the combustion chamber of scramjet engine with a supersonic speed, so the fuel can only stay in the chamber for several milliseconds, and cannot mix well with the main flow, which makes it difficult to be ignited. Strut is a structure inside the combustion chamber of scramjet, which can inject fuel into the high-speed main flow and make the main flow and fuel better mixed. However, a strut faces an extremely severe thermal environment. In the combustion chamber, due to the presence of the strut, the supersonic flow forms a shock wave, and the heat and force load on the strut is further amplified [1,2,3,4], especially on its leading edge. For instance, the heat flux on the leading edge of a strut is estimated to be 100 MW/m2 when a scramjet flies at a Mach 12 [5]. In such circumstance, traditional thermal protection methods cannot provide an ideal cooling effect, and a more effective measure needs to be taken.
Transpiration cooling is an efficient and reliable method that can be used on a strut for thermal protection. In the process of transpiration cooling, the coolant flows through the porous media and reduce heat by the strong convection heat transfer between the coolant and porous media. In addition, the coolant flows out of the porous media and forms a thin layer on its surface, which increases the thermal resistance between the high-temperature main flow and porous media [6,7]. Due to the high cooling efficiency and low coolant consumption, transpiration cooling is considered to be a promising method for thermal protection and favored in the aerospace industry [8,9].
A large number of experimental investigations on transpiration cooling has been conducted [10,11]. Greuel et al. [12] experimentally proved that when the blowing rate is less than 0.7%, the transpiration cooling efficiency increases linearly with the increase of coolant. Qian [13] used solid hydrogel as coolant and Wu [14] combined sublimation and transpiration cooling, to improve the cooling effect for porous plates. Foreest [15] and Wang et al. [16,17] respectively observed and analyzed the ice formation on a nose cone under supersonic condition in the process of transpiration cooling with phase change. Jiang et al. [6,18] studied a combined cooling method for porous struts and observed the bow shock waves in front of the struts.
Numerical studies on transpiration cooling are always in process [11,19]. Langener et al. [20] proposed a one-dimensional heat-balance model and validated that the specific heat capacity and the mass flow rate are two main factors that influence the cooling efficiency. Jiang et al. [21] validated that the heat transfer coefficient between coolant and solid matrix increases with the increase of coolant flow rate. Ding [22] proposed a double layer cooling structure which combined transpiration cooling and film cooling to improve the cooling efficiency on the leading edge of a cone nose. Huang et al. [23,24] numerically investigated transpiration cooling for porous struts. The results showed that the wedge angle of strut is a factor that affects cooling effect, and the optimum wedge angle is 30°. Xiong [25] confirmed that the coolant injected from the leading edge of strut pushes the stagnation point away from the surface, but additional cooling methods are needed to improve the cooling efficiency at the leading edge.
Wang et al. [26] obtained an analytical solution for transpiration cooling in the local thermal non-equilibrium (LTNE) model with the second and third types of thermal boundary conditions, and gave a quantitative criterion to choose local thermal or local non-thermal equilibrium model. Shi [27] combined two-phase mixture model and LTNE model, and studied the factors influencing the temperature and saturation distribution within the solid matrix of a porous plate. Xiao [7] proposed a two-step multi-region numerical scheme for transpiration cooling using LTNE model in supersonic flow.
Thermal protection for a scramjet combustion chamber has always been an important research topic. Strong aerodynamic heat has always been a threat to the strut and transpiration cooling is an effective thermal protection required. To simplify the physical problem, most of the investigations on the transpiration cooling for strut base on the local thermal equilibrium (LTE) model, which assumes that fluid in the porous media has the same temperature as the solid matrix, which deviates the real physics. In this paper, a numerical investigation on transpiration cooling for strut is conducted based on the local thermal non-equilibrium model. The effect of transpiration cooling on flow field in combustion chamber and the effectiveness of transpiration cooling are discussed. The mechanism of transpiration cooling, including the temperature difference between coolant and solid matrix inside porous medium, is further explored by changing coolant mass flow rate and adopting various coolants.

2. Simulation Method

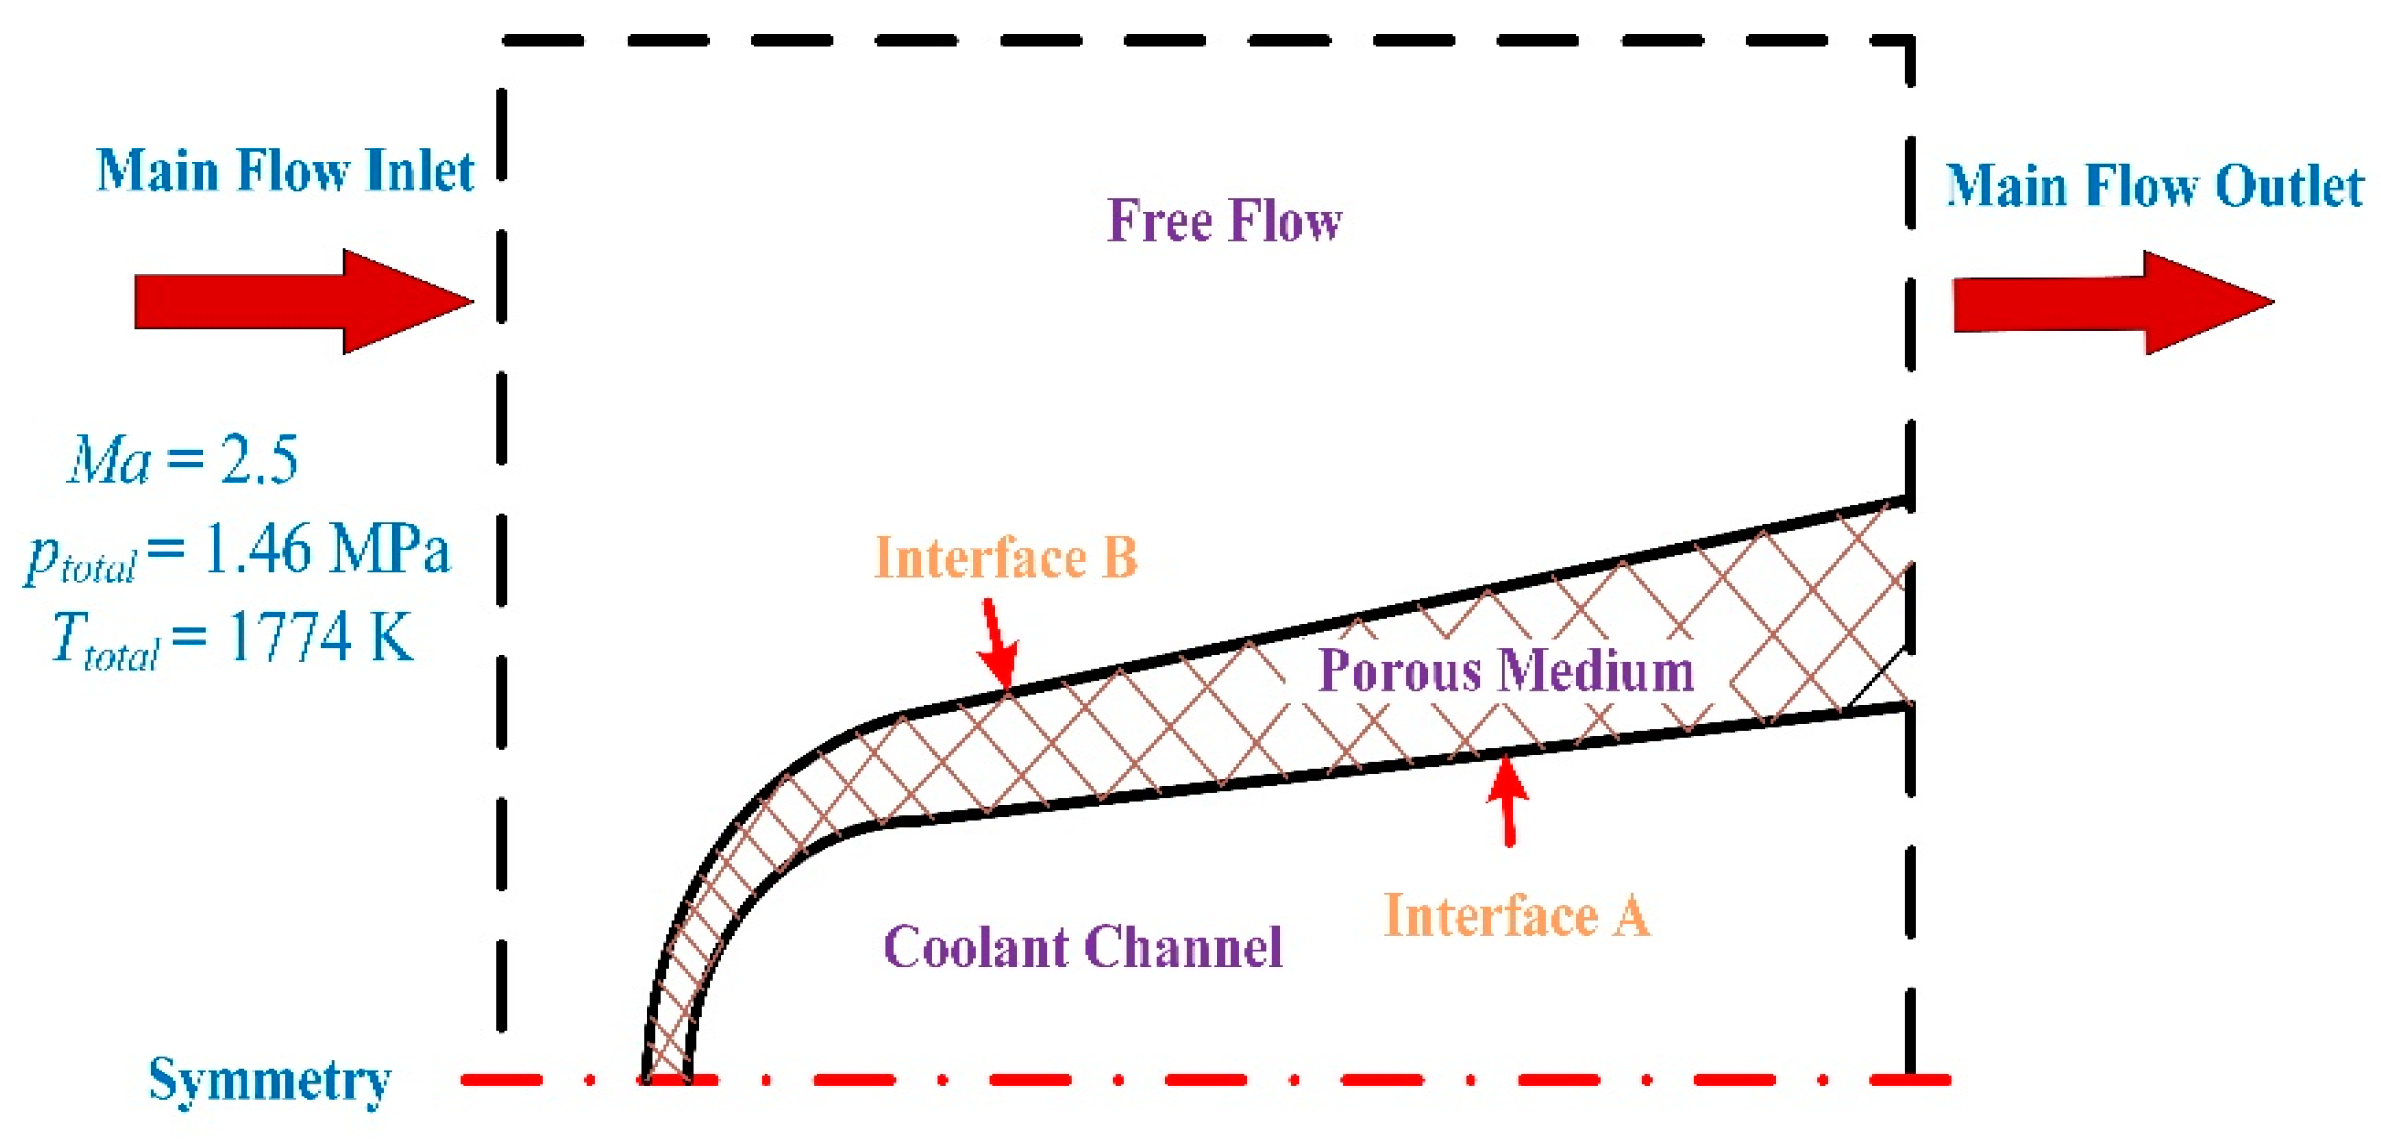
2.1. Geometry Model and Boundary Conditions

A 3D model was used to investigate the transpiration cooling for strut in combustion chamber according to the experiment conducted by Huang [23]. Figure 1 shows the geometry model of strut and combustion chamber. The strut sintered by stainless-steel particles with an average diameter dp = 25 μm, was 37.5 mm in length, 10 mm in width and 38.5 mm in height. A 1-mm-thick-porous rib separated the cavity into two parts, which were the coolant channel [23]. The coolant flowed out to the strut surface through the porous medium, forming the transpiration cooling for the strut.
The main flow in the combustion chamber consisted of 20% water vapor, 20.9% oxygen and 59.1% nitrogen in mass fraction. The main flow at a Mach number of 2.5, a total pressure of 1.46 MPa, and a total temperature of 1774 K was used to simulate the environment in the combustion chamber. Methane was used as the coolant with a temperature of 300 K.

2.2. Governing Equations

The transpiration cooling for porous struts is a typical cross-scale flow. The main flow is macroscopic and supersonic, the flow inside the porous medium is microscopic and low-speed, and the flow in the coolant channel is macroscopic and low-speed. Therefore, the computational domain is divided into three parts: free flow, porous medium, and coolant chamber.
In the free flow and coolant chamber, the flow is turbulent and compressible, and Shear-Stress Transport k-ω (SST k-ω) model is selected in the calculation. The continuity, momentum and energy equations are as follows [22]:
( ρ V ) = 0
( ρ V V ) = p + τ = + x j ( ρ u i u j ¯ )
( V ( ρ E + p ) ) = ( k f T + τ = V )
where E is total energy, which can be expressed as:
E = c p T
In the porous medium, the internal solid matrix increases the flow resistance, which should be considered in the momentum equation. The Darcy–Forchheimer model takes viscous loss and inertial loss into account [28], and is selected to describe the momentum conservation. For the isotropic single-phase flow, the continuity equation and momentum equation can be expressed as [7]:
t ( ε ρ f ) + ( ε ρ f V ) = 0
t ( ε ρ f V ) + ( ε ρ f V V ) = ε p + ( ε τ ) ε 2 K μ f V ε 3 F K ρ f | V | V
where K and F respectively represents the permeability and the inertia coefficient of porous media and their reciprocal represents the viscous resistance and inertial resistance, respectively. K and F can be calculated by the following equations [29].
K = d p 2 ε 3 / ( 150 ( 1 ε ) 2 )
F = 1.75 / ( 150 ε 1.5 )
Inside the porous media, the coolant is driven by pressure, which will conduct forced convection with the solid matrix. The temperature of fluid inside the porous medium changes continuously and cannot reach the transient temperature equilibrium with the adjacent porous solid matrix, so the temperature of the fluid and the solid are two variables. The LTNE model, which considers the temperature difference between fluid and solid at the same position, is adopted to better reflect the actual physical situation in the calculation. Two equations are needed to describe the temperatures of fluid and solid respectively. According to Xiao [7], the specific expressions are as follow:
t ( ε ρ f E f ) + ( ρ f V E f ) = ( ε k f T f ) + h f s A f s ( T s T f )
t ( ( 1 ε ) ρ s E s ) = ( ( 1 ε ) k s T s ) + h f s A f s ( T f T s )
The particle-to-fluid heat transfer coefficient hfs in the two energy equations is an important parameter for heat convection. In the process of flow, the physical properties of fluid are constantly changing, resulting in the constant changes in the heat transfer coefficient. Nusselt number is a function of porosity, Reynolds number, and Prandtl number. For the porous materials with extremely small pores, the molecular free path is equivalent to the pore size, and the speed slip and temperature jump caused by the micro-scale effect should be taken into account. Xu [30] modified the Nusselt number by Knudsen number.
N u f s = h f s d p / k f = ( 0.933 ε 2 0.245 ε + 0.0165 ) Re 0.8 Pr 1 / 3
N u f s = h f s d p / k f = ( 0.933 ε 2 0.245 ε + 0.0165 ) Re 0.8 Pr 1 / 3 / ( 1 + 24 K n )
where Kn is Knudsen number, representing the ratio of the molecular free path to the characteristic length. The heat exchange between coolant and solid matrix is realized in the calculation through User-Defined Function (UDF) according to Equation (12).

2.3. Numerical Mesh and Method

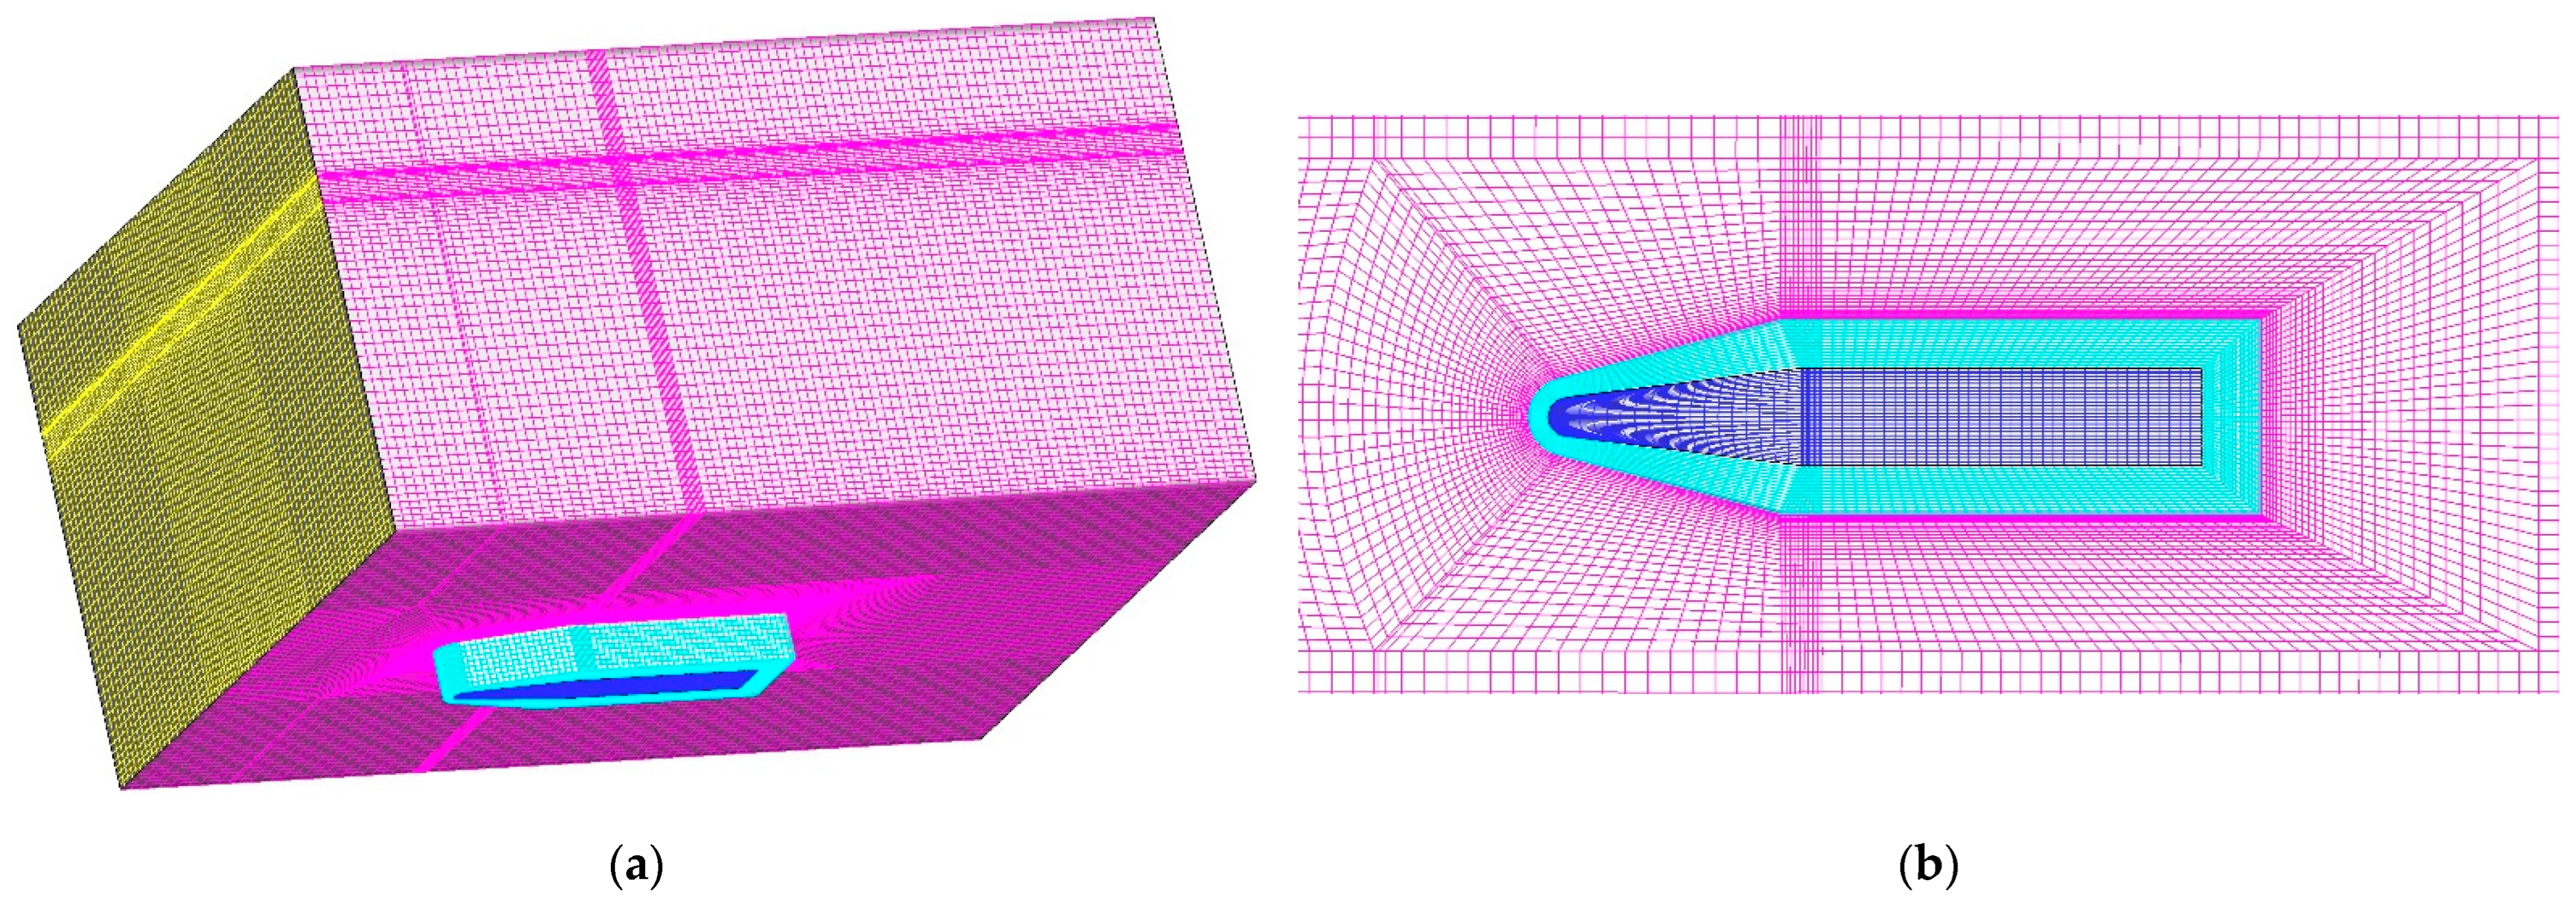
2.3.1. Numerical Mesh

In this study, ICEM was used for grid generation. The structured mesh is refined near the wall of the strut to better capture the shock wave and boundary layer. The coolant flow inside the porous medium is complicated, so mesh is refined inside the porous strut. As shown in Figure 2, there are spatial overlaps at the junctions, where the different domains share grid nodes, and there are two kinds of boundary conditions at one boundary. One is the heat and mass transfer boundary between fluid and fluid, and the other is the heat transfer boundary between fluid and solid. The splicing grid is adopted in order to realize information transfer between the different computational domains.
The grid independence is studied with three mesh strategies: Mesh 1 with 0.7 million nodes, Mesh 2 and Mesh 3 with 1.4 and 2.8 million nodes respectively. The temperatures at the leading edge on the top of the strut for different meshes are shown in Table 1. The mesh with 1.4 million elements is selected after balancing the accuracy and calculation time and meshes of the calculation model are shown in Figure 3.

2.3.2. Numerical Method

In the process of transpiration cooling for the strut, the coolant flows through the porous medium to the surface of the strut and mixes with the high-speed mainstream. The huge speed difference and the difference in the flow direction make it difficult to converge in the calculation. In order to solve the problem of cross-scale flow and reduce the interference of momentum source term, a two-step calculation method is adopted. Figure 4 shows the procedure of the two-step numerical method. First, the supersonic mainstream is calculated with the Darcy–Forchheimer model closed, until the converged result is obtained. The shock wave can be easily captured and obviously observed, and the inlet and outlet mass flow are conserved during the calculation. Then open the porous medium model and perform the full-field coupling iterative calculations.

2.3.3. Numerical Validation

As mentioned in Section 2.2, accurate description of heat exchange between fluid and solid matrix in porous media has great influence on the correctness of numerical simulation results. The numerical simulations based on LTE and LTNE model were performed respectively. As shown in Table 2, in order to verify the numerical model and calculation strategy, the numerical results were compared with the experimental results in reference.
The dimensionless length x/L is introduced here where x represents the position of thermocouples in the experiment, and L represents the length of the strut. It can be seen that a more accurate result can be obtained by the simulation based on the LTNE model, and compared to the experiment results, the relative error is within a reasonable range. Therefore, the calculation model and numerical method can be considered to be reliable.

3. Results and Discussion

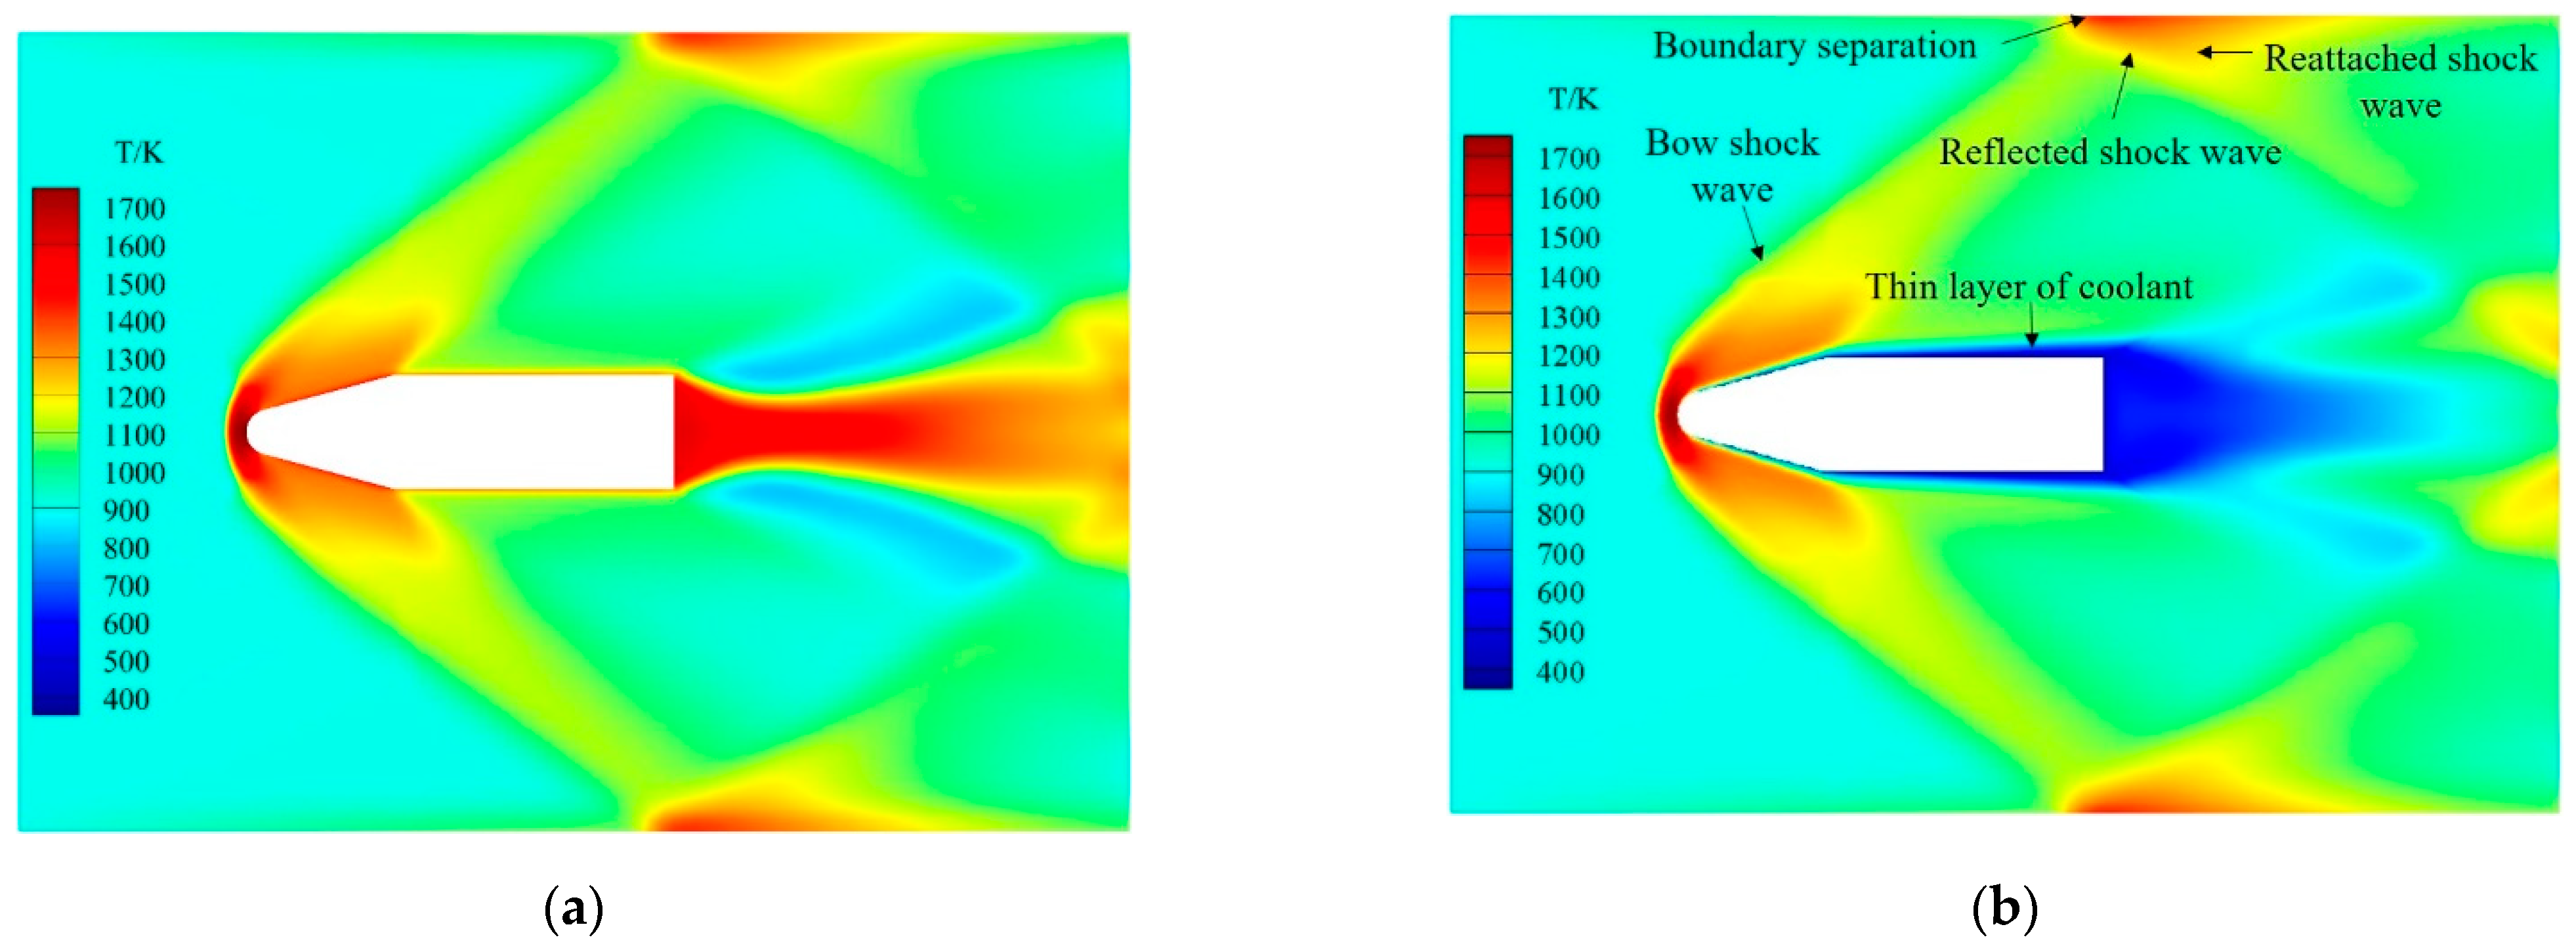
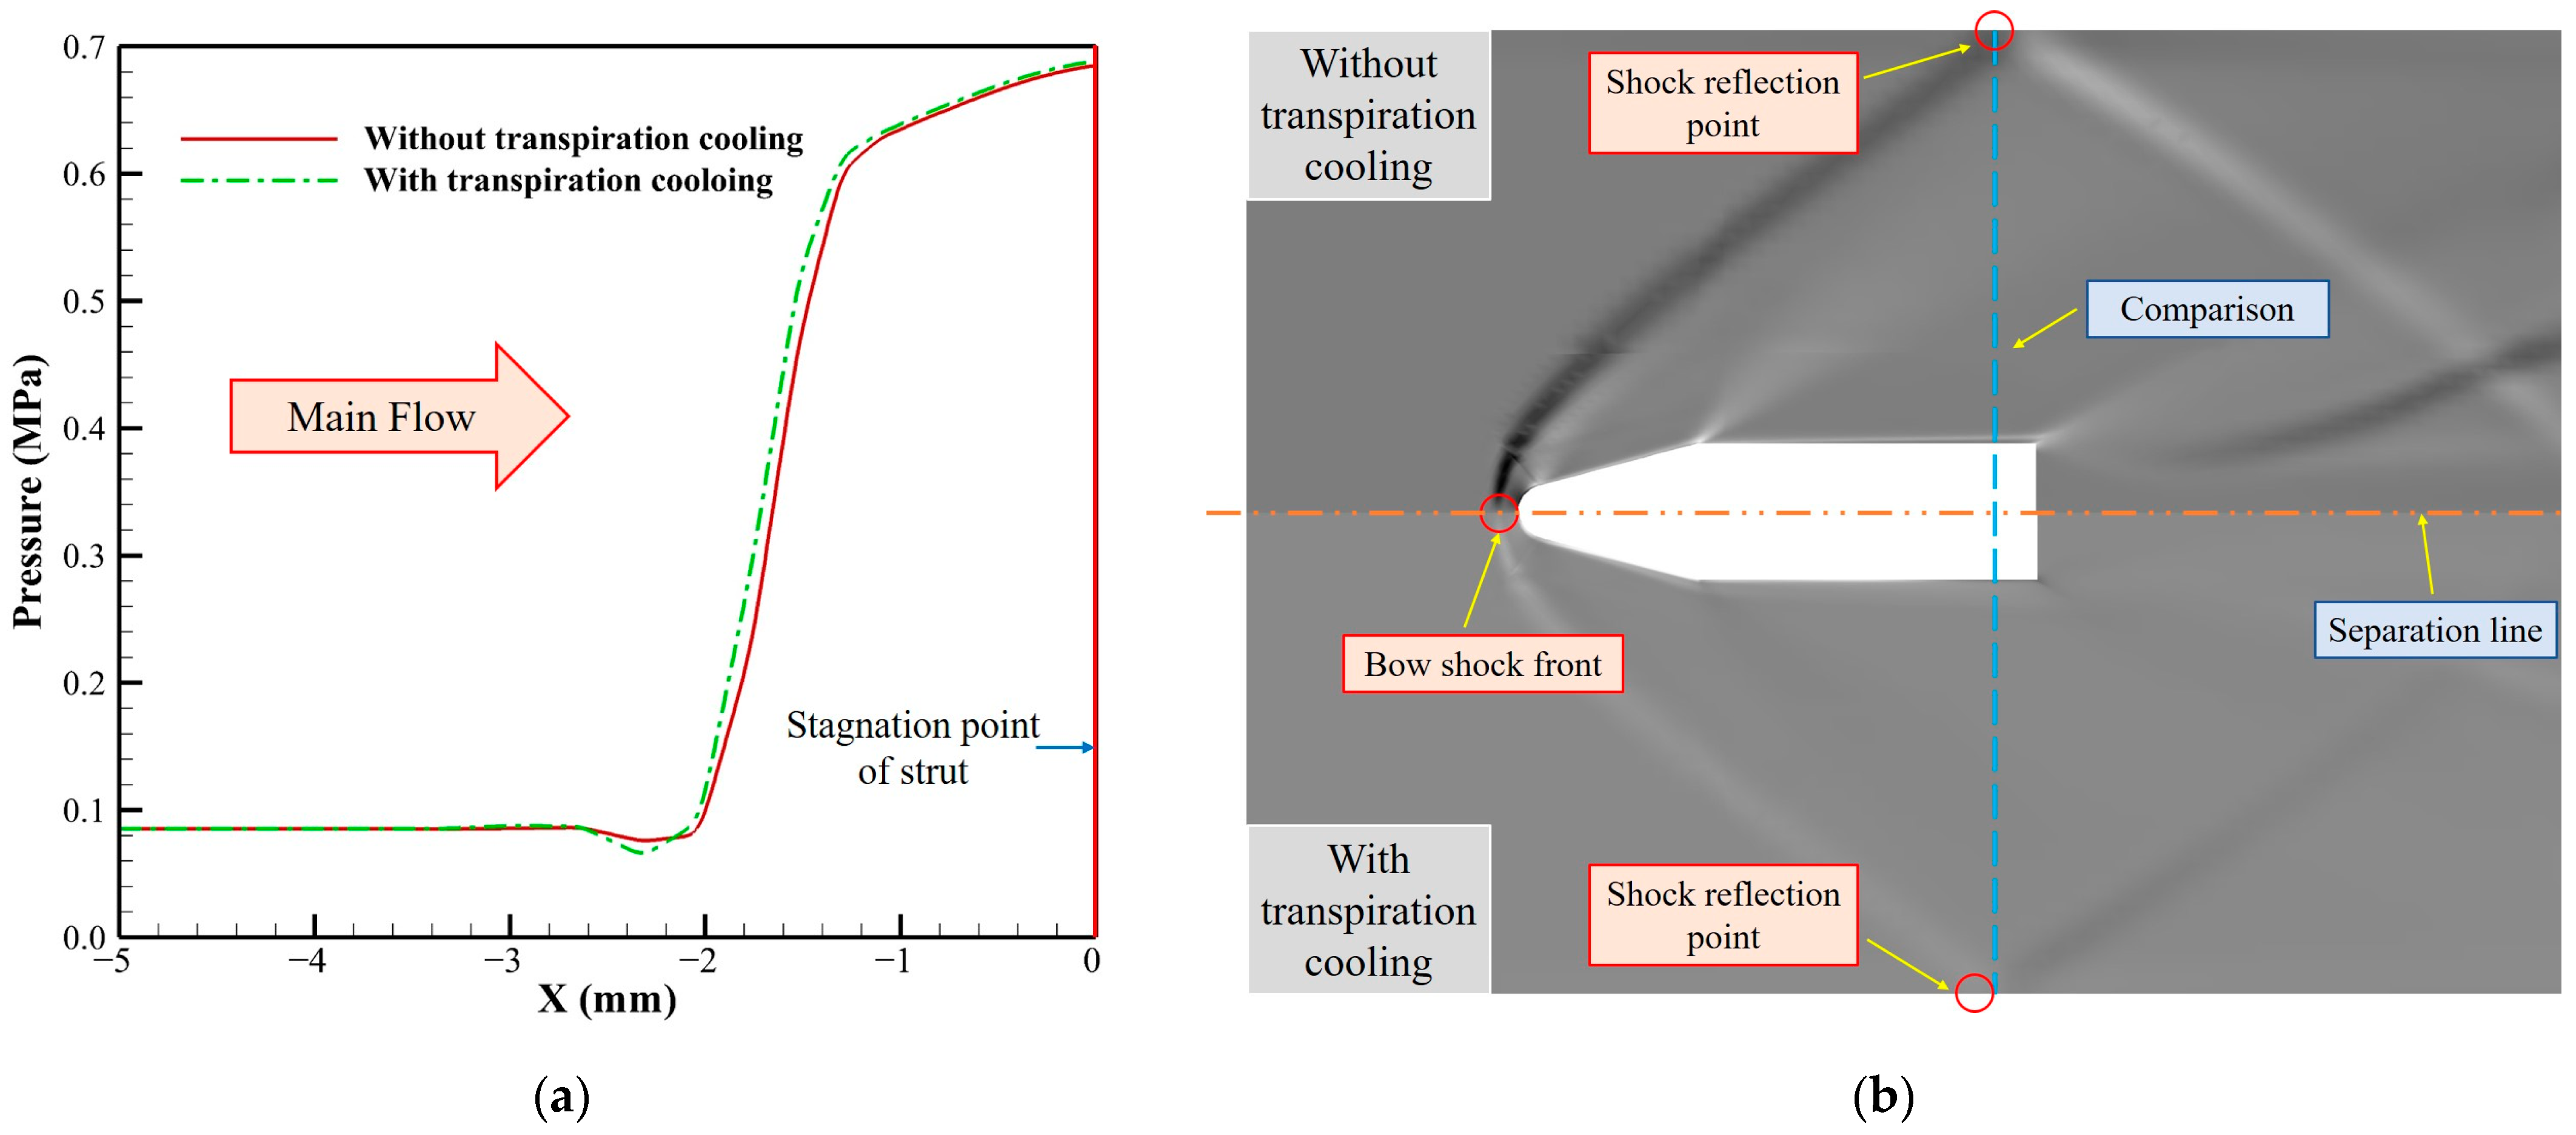
3.1. Mechanism of Transpiration Cooling for Strut

In order to analyze the effectiveness of transpiration cooling, numerical simulations were carried out on the flow field of struts with and without transpiration cooling.
Figure 5 shows the temperature distribution on the cross-section at z = 25 mm for the flow field around the struts with and without transpiration cooling. The supersonic flow forms a bow shock wave at the leading edge of struts and the shock wave reflects after impacting the combustion chamber wall. Due to the oblique shock wave, there is an adverse pressure gradient in the boundary layer on the chamber wall, resulting in boundary layer separation. The separation of boundary layer plays a compression role on the mainstream fluid and generates a reattached shock wave. Comparing the temperature distribution near the strut with and without transpiration cooling, it can be observed that the temperature on the surface of the strut without transpiration cooling is much higher than that with transpiration cooling. When there is no transpiration, the strut surface is heated due to the existence of entropy layer, which causes the high temperature. As shown in Figure 5b, a thin film of coolant with low temperature is formed on the strut surface, which can provide a thermal protection.
Figure 6 shows the comparison of velocity distribution for the flow field around the struts with and without transpiration cooling on z = 25 mm cross-section. The velocity distribution in the boundary layer on the surface of strut with transpiration cooling is obviously different from that without transpiration cooling. The velocity boundary layer on the strut without transpiration cooling is extremely thin. The main flow stagnates on the strut surface, because the viscous force and kinetic energy is dissipated in the form of heat, which heats the strut surface. It can be seen from Figure 7 that methane flows slowly through the porous strut to the surface and is driven downstream by the high-speed mainstream by viscosity effect. The coolant forms a velocity boundary layer of a certain thickness on the strut surface. Thus, the high-temperature mainstream is isolated from the surface of the strut.
As the highest temperature appears at the leading edge of the strut, the mechanism of transpiration cooling is further studied by analyzing the pressure field here. As shown in Figure 8a, the coolant flows out of the leading edge of strut and pushes the shock wave away from the stagnation point. It can be observed in Figure 8b that the shock reflection point on the combustion chamber surface moves forward when the strut is protected by transpiration cooling, which is another evidence for the shock wave being pushed away from the leading edge of strut. With the increase of the distance between shock wave and strut surface, the strong aerodynamic heat generated after the shock wave diffuses to the surrounding environment, which can greatly reduce the aerodynamic heat on the strut surface. Meanwhile, the aerodynamic force exerted at the stagnation point is reduced.
Cooling efficiency η is introduced to judge the effectiveness of transpiration cooling, as shown in Equation (13) [24,31].
η = T r T w T r T c
where Tc is the inlet temperature of coolant, Tw is local temperature of strut surface, and Tr is the free stream recovery temperature, which can be expressed as:
T r = T ( 1 + r γ 1 2 M a 2 )
where T is the temperature of main flow, r is the recovery factor, and γ is the specific heat ratio.
Figure 9 shows the temperature and cooling efficiency distribution on the surface of strut. In the figure, X represents the position along the strut surface, X = 0 mm corresponding to the stagnation point and X = 37.5 mm corresponding to the trailing edge of the strut. At the stagnation point, the temperature is the highest and the cooling efficiency is the lowest. As the accumulation of coolant on the strut surface along the flow direction of mainstream, the thermal resistance of the boundary layer increases, and the cooling efficiency becomes higher. The flow field at the inflection point and trailing edge of the strut is disturbed by geometric factors, leading to the rise of temperature and reduction in cooling efficiency. However, the temperature of strut surface is reduced within the tolerable temperature range of material, meaning that transpiration cooling can provide an effectively thermal protection for strut.
As the numerical simulation bases on the LTNE model, the temperature of coolant and solid matrix inside the porous medium can be obtained and analyzed. Figure 10 shows the temperature distribution of fluid and solid inside the leading edge of the strut on different cross-sections in the direction z. In the figure, X represents the position along the center line inside the leading edge of porous strut, whose total length is 1 mm. The simulation results show that the temperature of solid is higher than that of the coolant in most areas in the porous medium, and the coolant plays a role in cooling the struts. However, the temperature of solid is lower than that of the fluid at the stagnation point region adjacent to the high-temperature mainstream. According to the growth rate of the temperatures, the whole flow process can be divided into four parts along the flow direction of coolant. First, in the range of 0.93 mm < X < 1 mm, coolant flows into the porous strut from coolant channel. The specific heat of the coolant gradually increases with temperature, and the heat sink increases, so the temperature growth rate is slow. Second, in the range of 0.20 mm < X < 0.93 mm, as coolant flows inside the porous medium, the convective heat transfer occurs between coolant and solid matrix and the fluid temperature and solid temperature increases simultaneously. Third, in the range of 0.07 mm < X < 0.20 mm, the high-temperature main flow has a greater impact on the coolant and solid matrix, and it can be observed that the fluid temperature rises faster and exceeds the solid temperature. It can be explained by the difference in heat absorption capacity of fluid and solid. Inside the porous medium with a certain volume, the total mass of fluid is far less than solid because of its low density. Therefore, although the specific heat of fluid is larger, the temperature of fluid rises more than that of solid, when absorbing the same quantity of heat. Finally, in the range of 0 mm < X < 0.07 mm, affected by exit effect and cross-scale flow, the growth rate of fluid and solid temperature is slow again near the stagnation point. Larger heat load is exerted on strut on z = 30 mm cross-section than that on z = 10 mm cross-section, resulting in the larger temperature difference at the stagnation point.

3.2. Influence of Coolant Mass Flow Rate on Transpiration Cooling

The mass flow rate of coolant is an important factor that affects the effect of transpiration cooling. In this section, numerical simulations are performed under the condition of four different flow rates: 7.5 g/s, 12.5 g/s, 17.5 g/s, and 22.5 g/s. It can be seen from Figure 11 that the increasing mass flow of coolant requires a larger pressure difference to drive the coolant flowing through the porous strut. The mass flow rate of coolant is approximately proportional to the inlet pressure. As shown in Figure 12, the pressure along the center line inside the leading edge of the porous strut decreases linearly along the flow direction of coolant. As the mass flow rate increases, the coolant needs to overcome greater viscous resistance and inertia resistance, and pressure gradient along the path increases. Due to the scale effect, the pressure gradient at the inlet and outlet is relatively smaller than that in the middle of the strut, and the gradient is larger when the mass flow of the coolant is larger.
Figure 13 shows the injection velocity vertical to the strut surface of coolant from porous medium to main flow. The increase of the coolant flow rate directly increases the flow velocity of the coolant, which makes the heat exchange enhanced in the porous medium. Figure 14a,b respectively shows the temperature and cooling efficiency distribution on the strut surface along the flow direction of mainstream under the condition of different mass flow rates of coolant. As the mass flow rate increases, the coolant boundary layer thickens, which brings a higher cooling efficiency on the strut surface. Due to the huge pressure, the injection velocity of coolant at the leading edge is slow, and less coolant flows out of the strut from its leading edge, causing the high temperature and low cooling efficiency. Due to the special structure, the injection velocity of coolant at the inflection point of the strut is relatively slow. Furthermore, an enhanced mixing effect of the coolant and high-temperature mainstream at the inflection point, leading to the more heat loads here. The two reasons together cause the fluctuation in the temperature and cooling efficiency distribution on the surface of the strut.
Since the LTNE model is adopted in the calculation, the influence of mass flow rate on the temperature difference between coolant and solid matrix is studied. Figure 15 shows the temperature difference between fluid and solid inside the strut at the leading edge. The law of temperature change is the same as mentioned above. As the coolant mass flow rate increases, the heat exchange between coolant and solid matrix is enhanced, and fluid temperature and solid temperature tend to be the same. The coolant flows in and out of the strut, making the fluid and solid temperature in the middle part of the porous medium be in a dynamic equilibrium. As the coolant mass flow rate increases, more heat can be absorbed by coolant and the equilibrium can be reached earlier. Therefore, the position of Ts = Tf moves forward along the flow direction of coolant with the increase of coolant mass flow. In addition, the temperature differences near the coolant channel and main flow are reduced with the mass flow rate increased. Figure 16 shows the relationship between solid temperature at the leading edge of strut and coolant flow rates. According to Equation (12), at a certain position, Knudsen number and Reynolds number are approximate to a power function, where the temperature is related to Knudsen number, and flow rate is related to Reynolds number. Therefore, the solid temperature and coolant flow rate conforms to the power function, and it can be inferred that further increasing the coolant flow rate will not bring an obvious decrease in solid temperature.

3.3. Influence of Various Coolants on Transpiration Cooling

Air, methane and helium are used as coolant respectively in this study to further study the effect of transpiration cooling. Figure 17 shows the temperature and cooling efficiency on the strut surface at the mass flow rate of 17.5 g/s. When helium is used as the coolant, the temperature at the leading edge of the strut is the lowest, and the overall cooling efficiency is the highest, followed by methane and air. Analysis shows that there are reasons for this result.
On one hand, at the same mass flow rate, the density of methane, air and helium is different, leading to the difference in injection velocity. Helium with the lowest density has the highest injection velocity, as shown in Figure 18. Figure 19 shows the pressure distribution in front of the strut, where X represents the position along the center line of the combustion chamber on z = 25 mm cross-section in front of the stagnation point of the strut, X = 0 mm corresponding to the stagnation point of the strut. The main flow is pushed farthest away from the leading edge of strut when helium is used as coolant, which brings the best cooling effect at the leading edge. Figure 20 shows the mass fraction distribution of the three coolants near the struts. When helium is used as coolant, the thickest layer of coolant is formed. The blow effect makes the high-temperature main flow away from the strut. Helium brings the strongest blow effect on the mainstream, followed by methane and air.
On the other hand, the difference in thermophysical properties, especially the specific heat, of the three kinds of coolant bring the different cooling effect. Figure 21 shows the specific heat of the coolant as a function of temperature. Helium as the coolant has the largest specific heat, followed by methane and air, indicating that helium can absorb the most heat from the solid matrix. Therefore, as shown in Figure 22, the temperature difference between the solid matrix and coolant inside the porous strut is the smallest when helium is used as coolant.

4. Conclusions

A numerical investigation on transpiration cooling for strut is performed. In order to obtain the results closer to the actual physics, Darcy–Forchheimer model and LTNE model are adopted to describe the flow and heat transfer inside the porous medium. The conclusions can be drawn as follows:
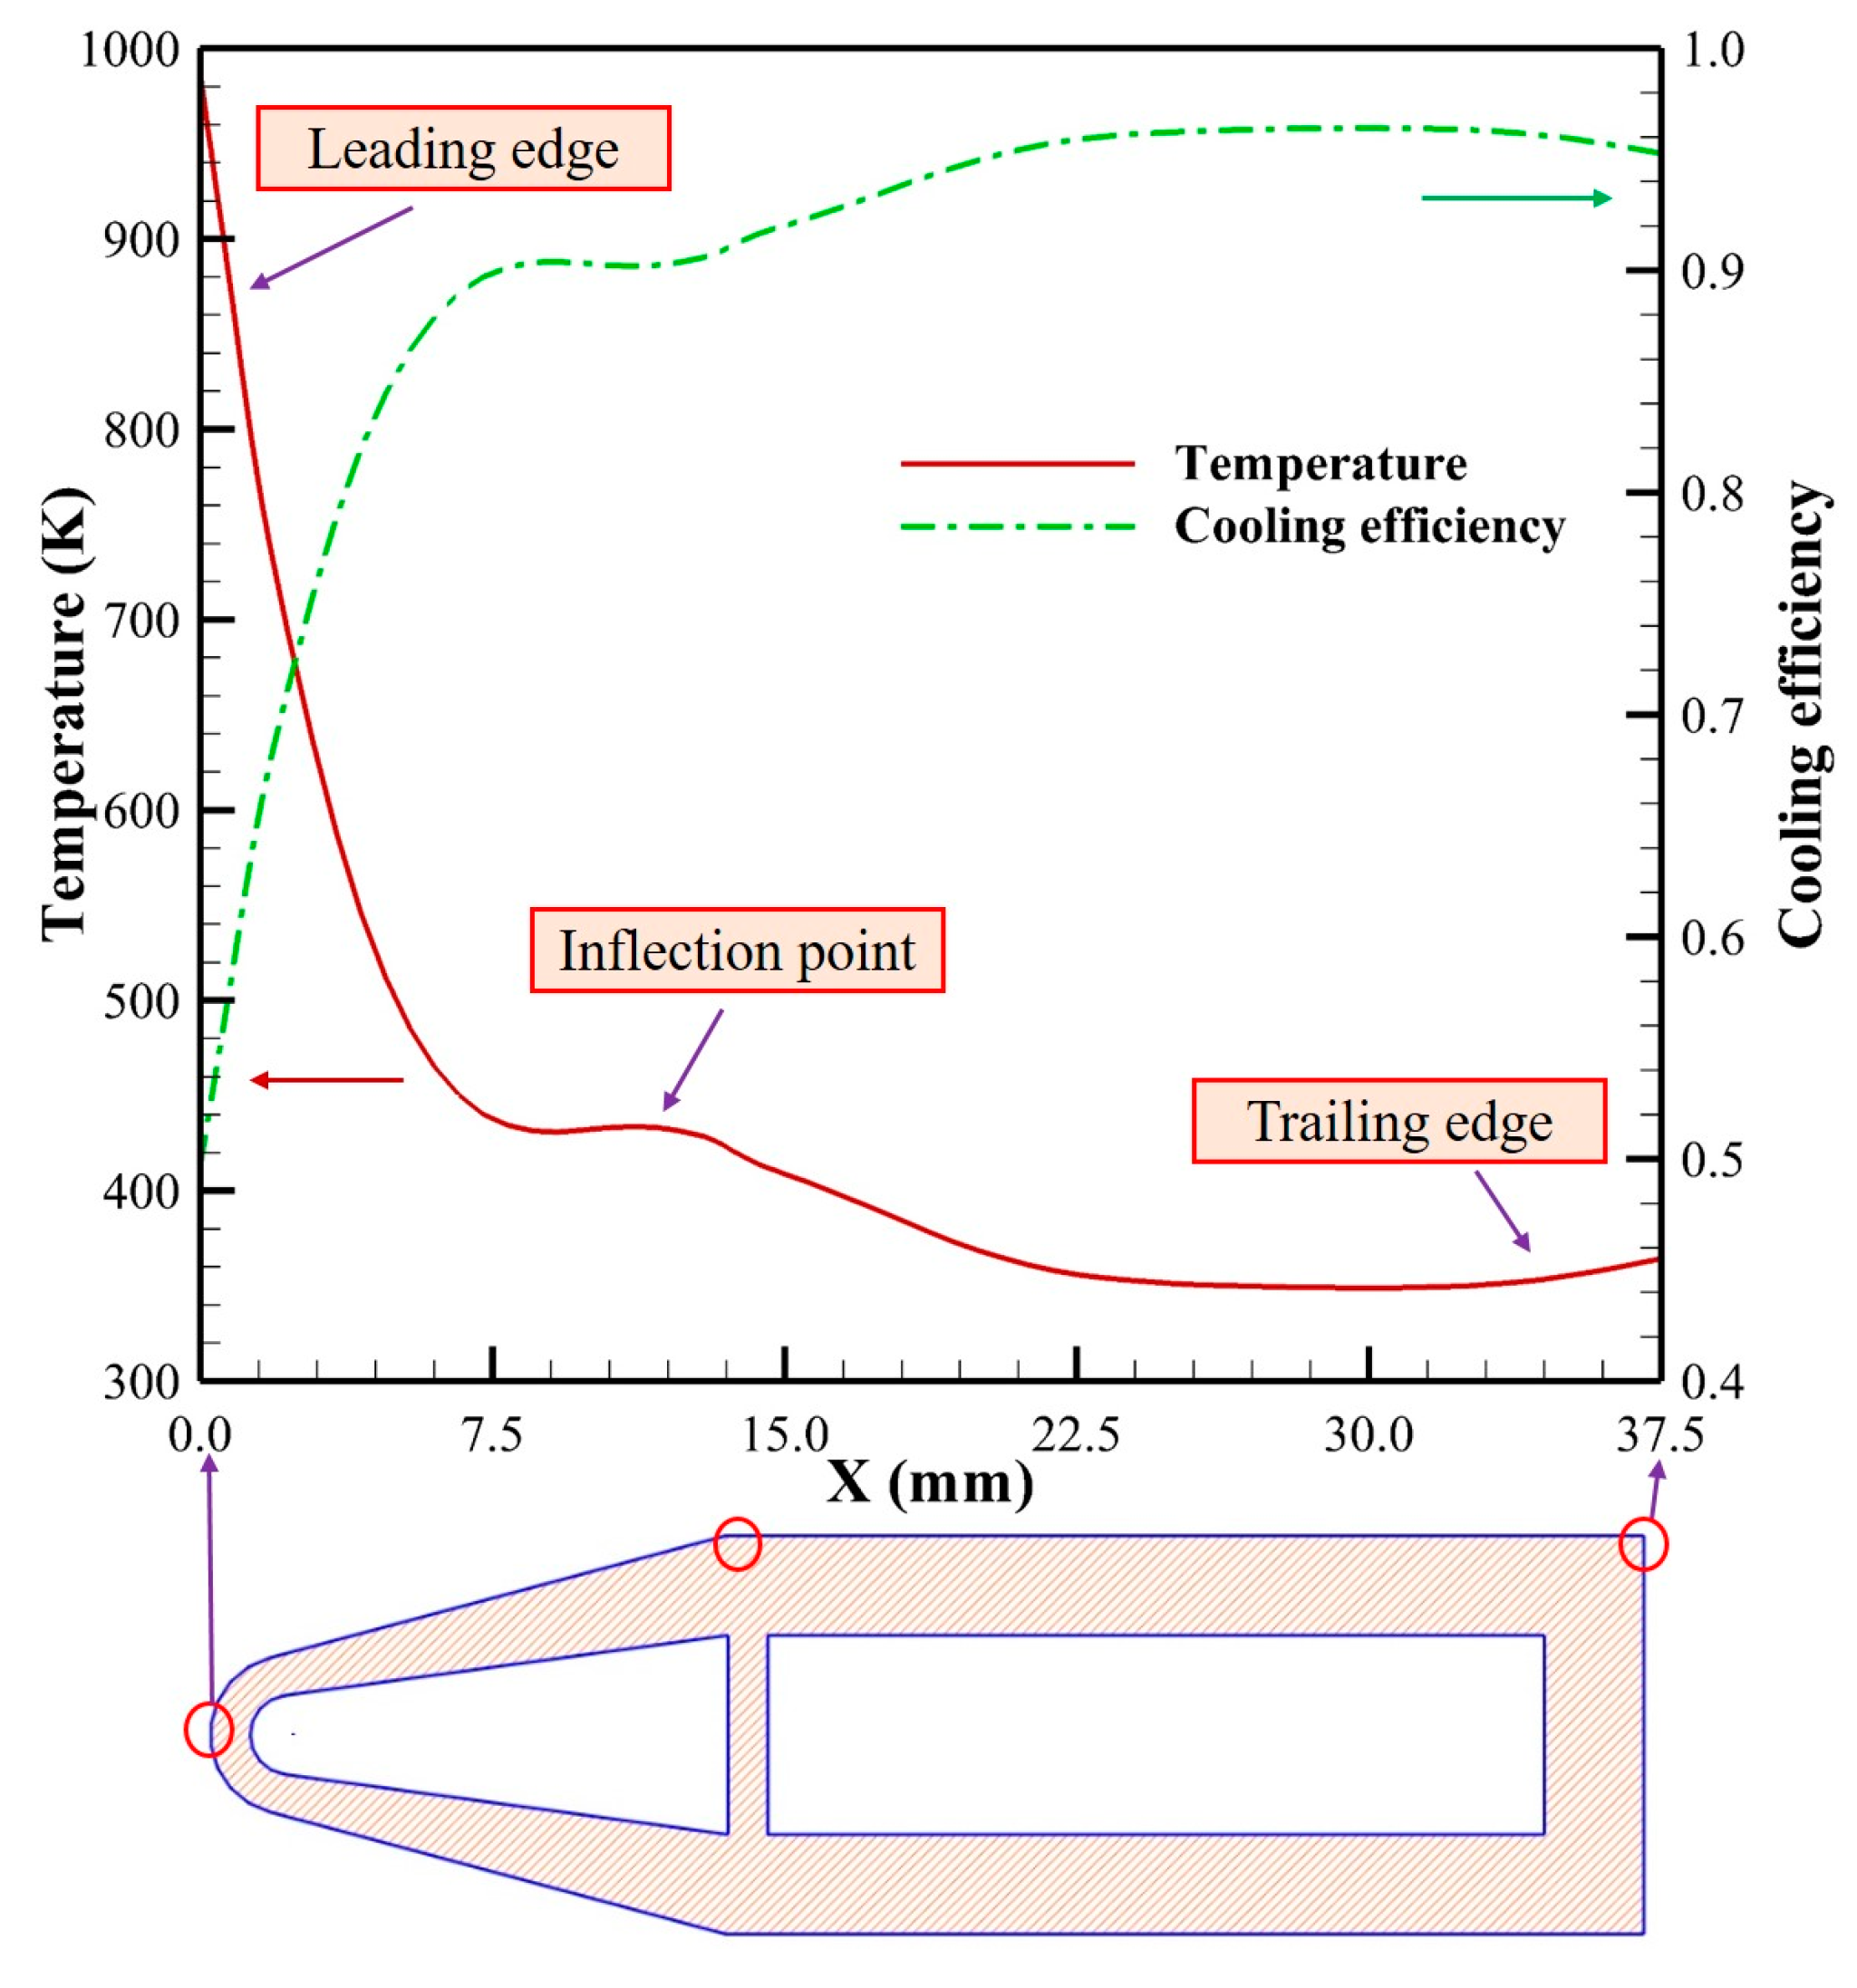
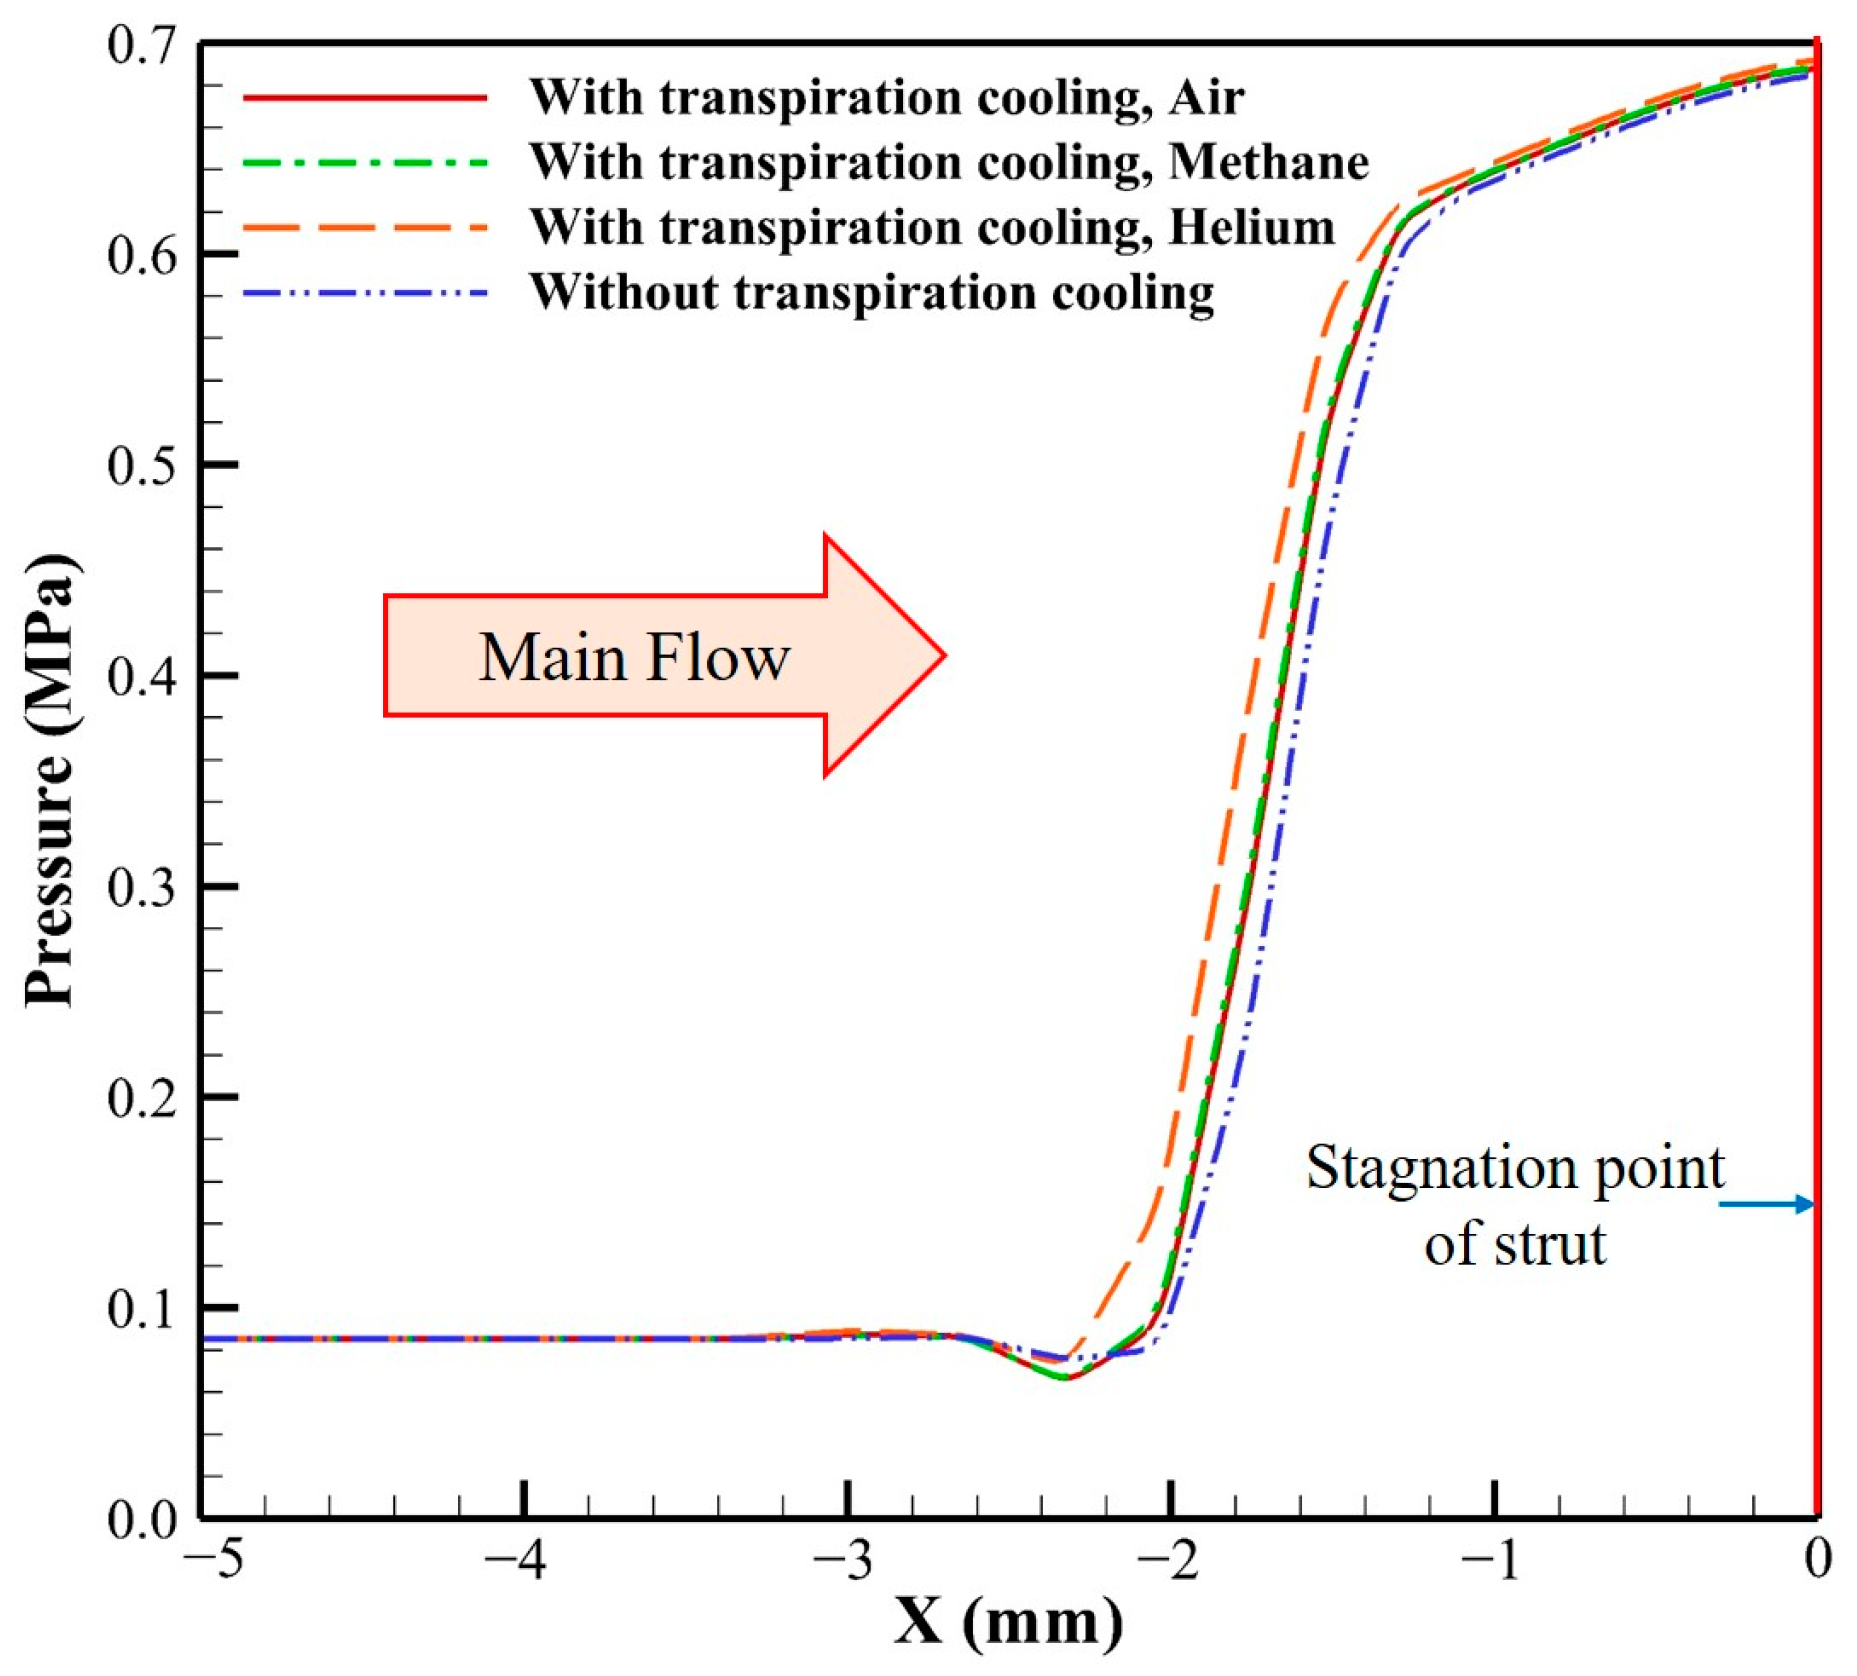
  • In the process of transpiration cooling, the coolant with low temperature flows through porous medium, forming a film on the surface of strut and making the velocity boundary layer thicker, which effectively protect the strut. The bow shock wave is pushed away from strut, reducing the heat and force load exerted on the leading edge of strut.
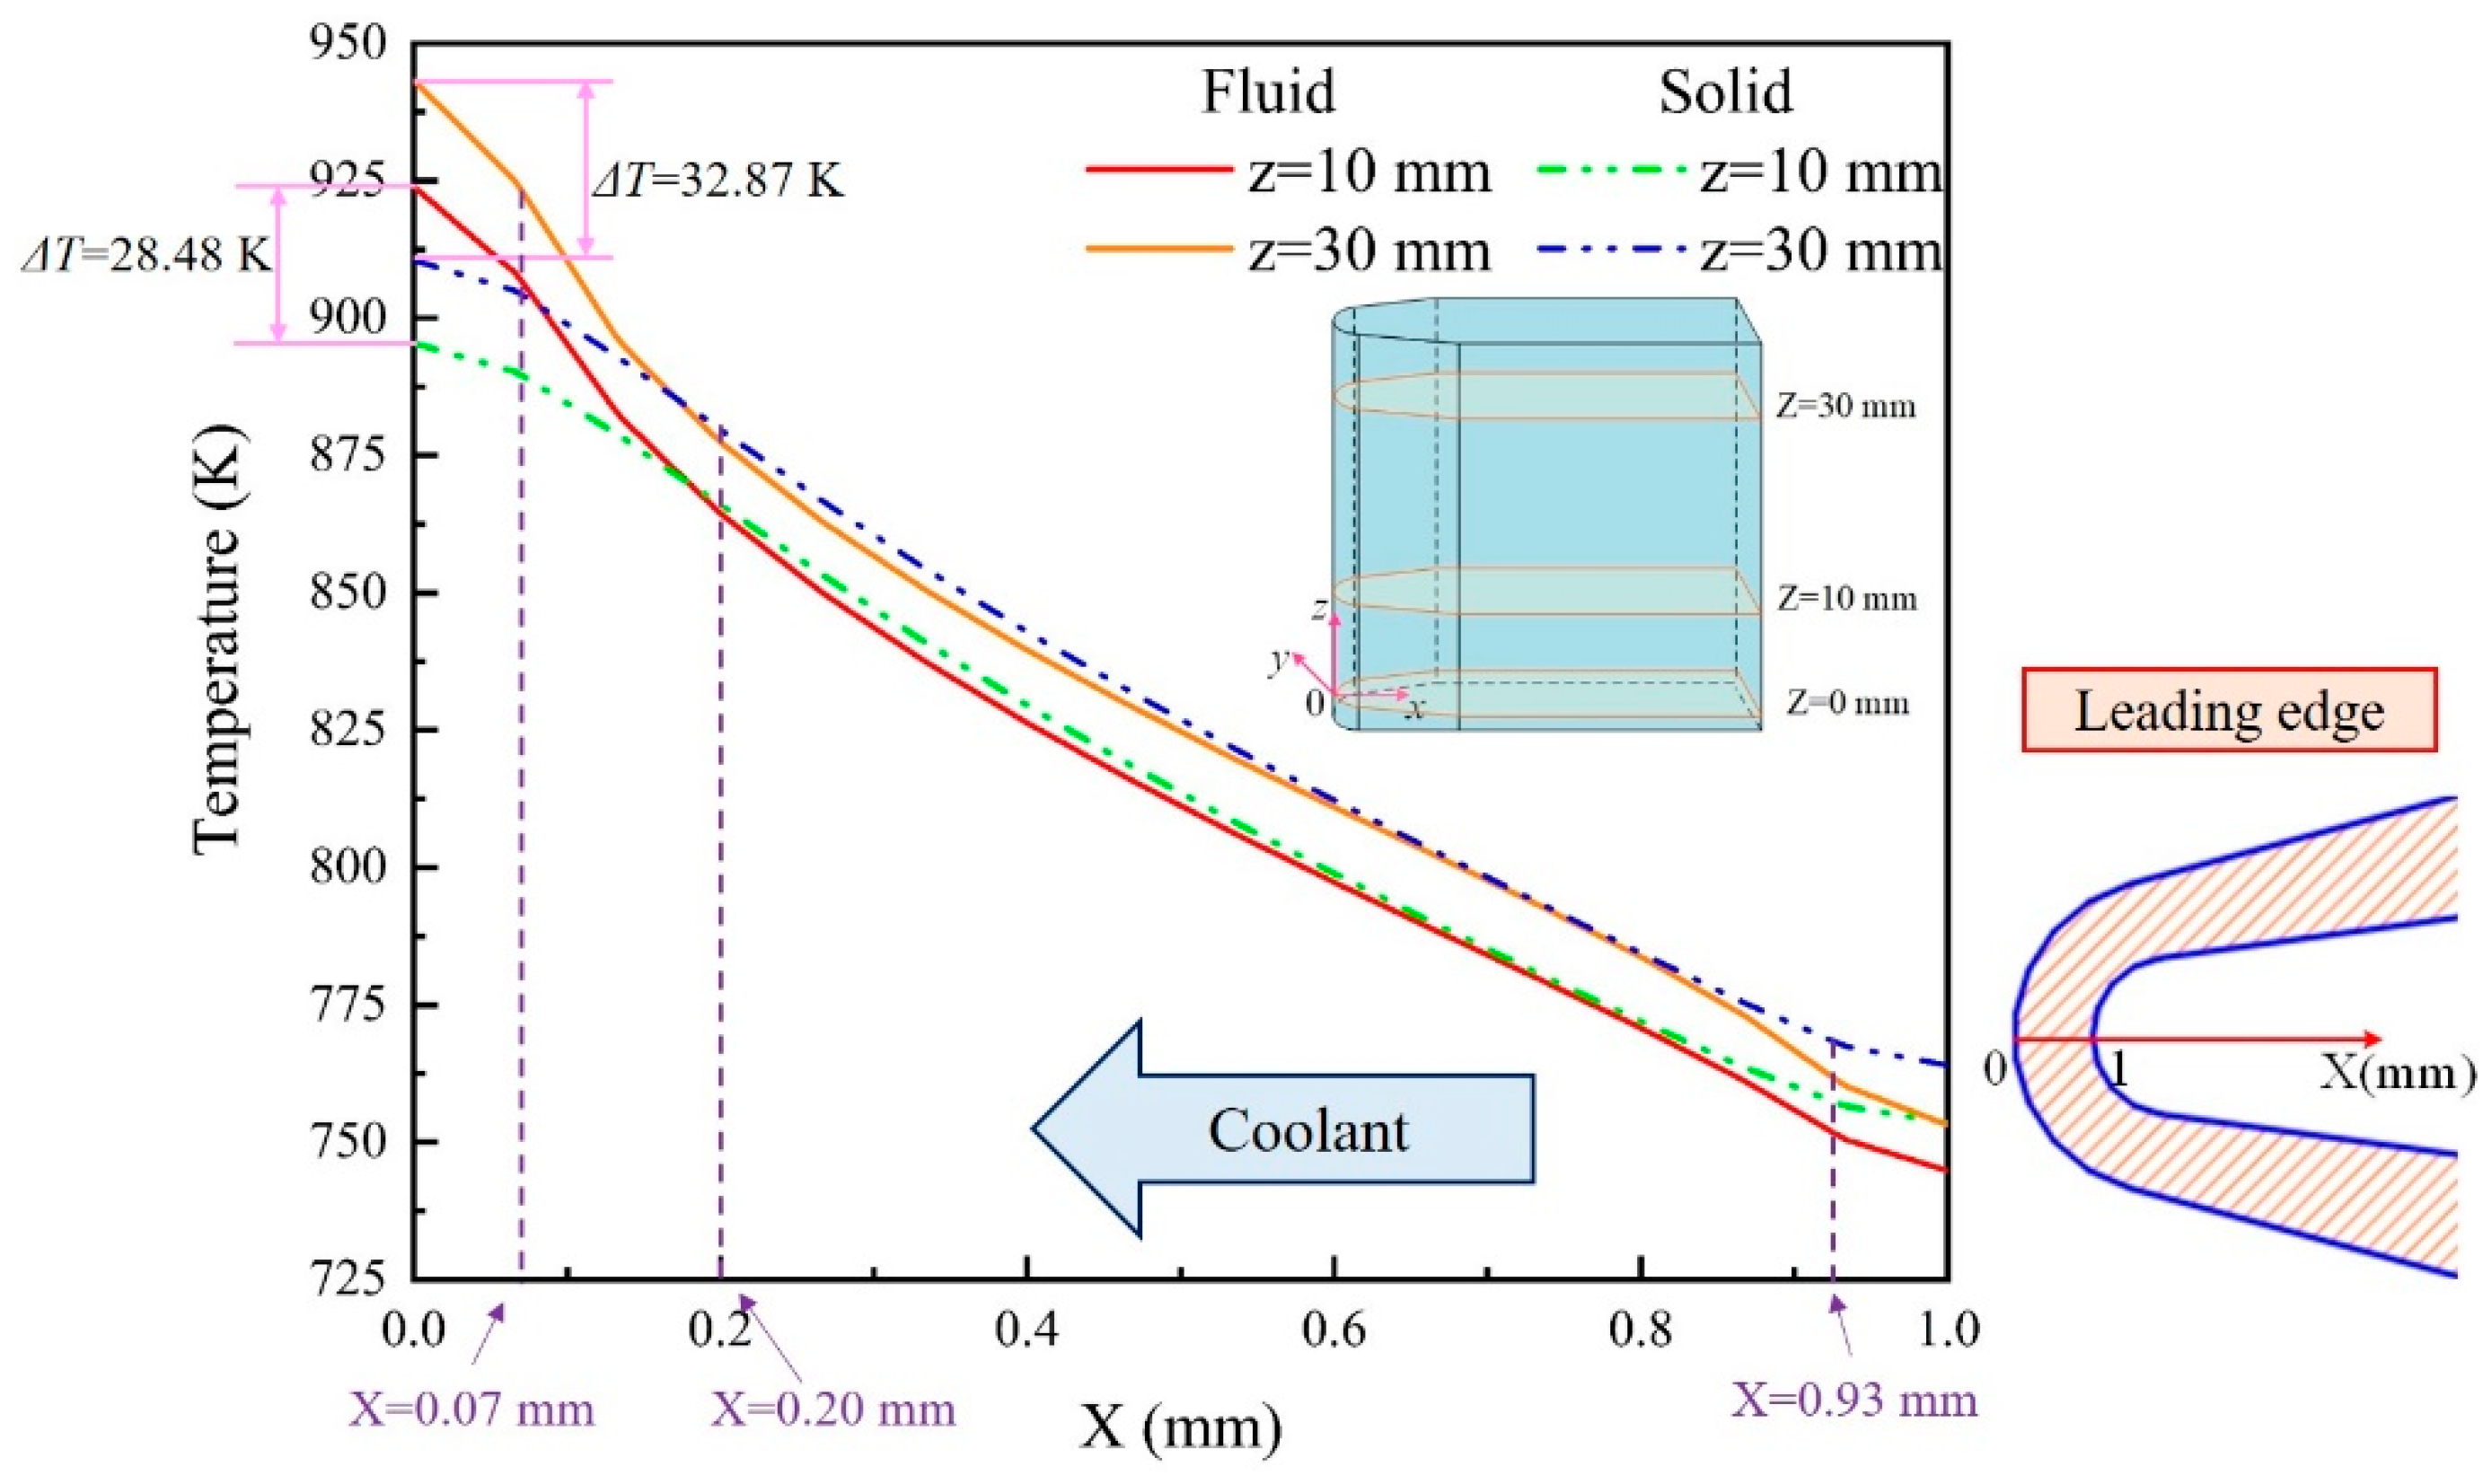
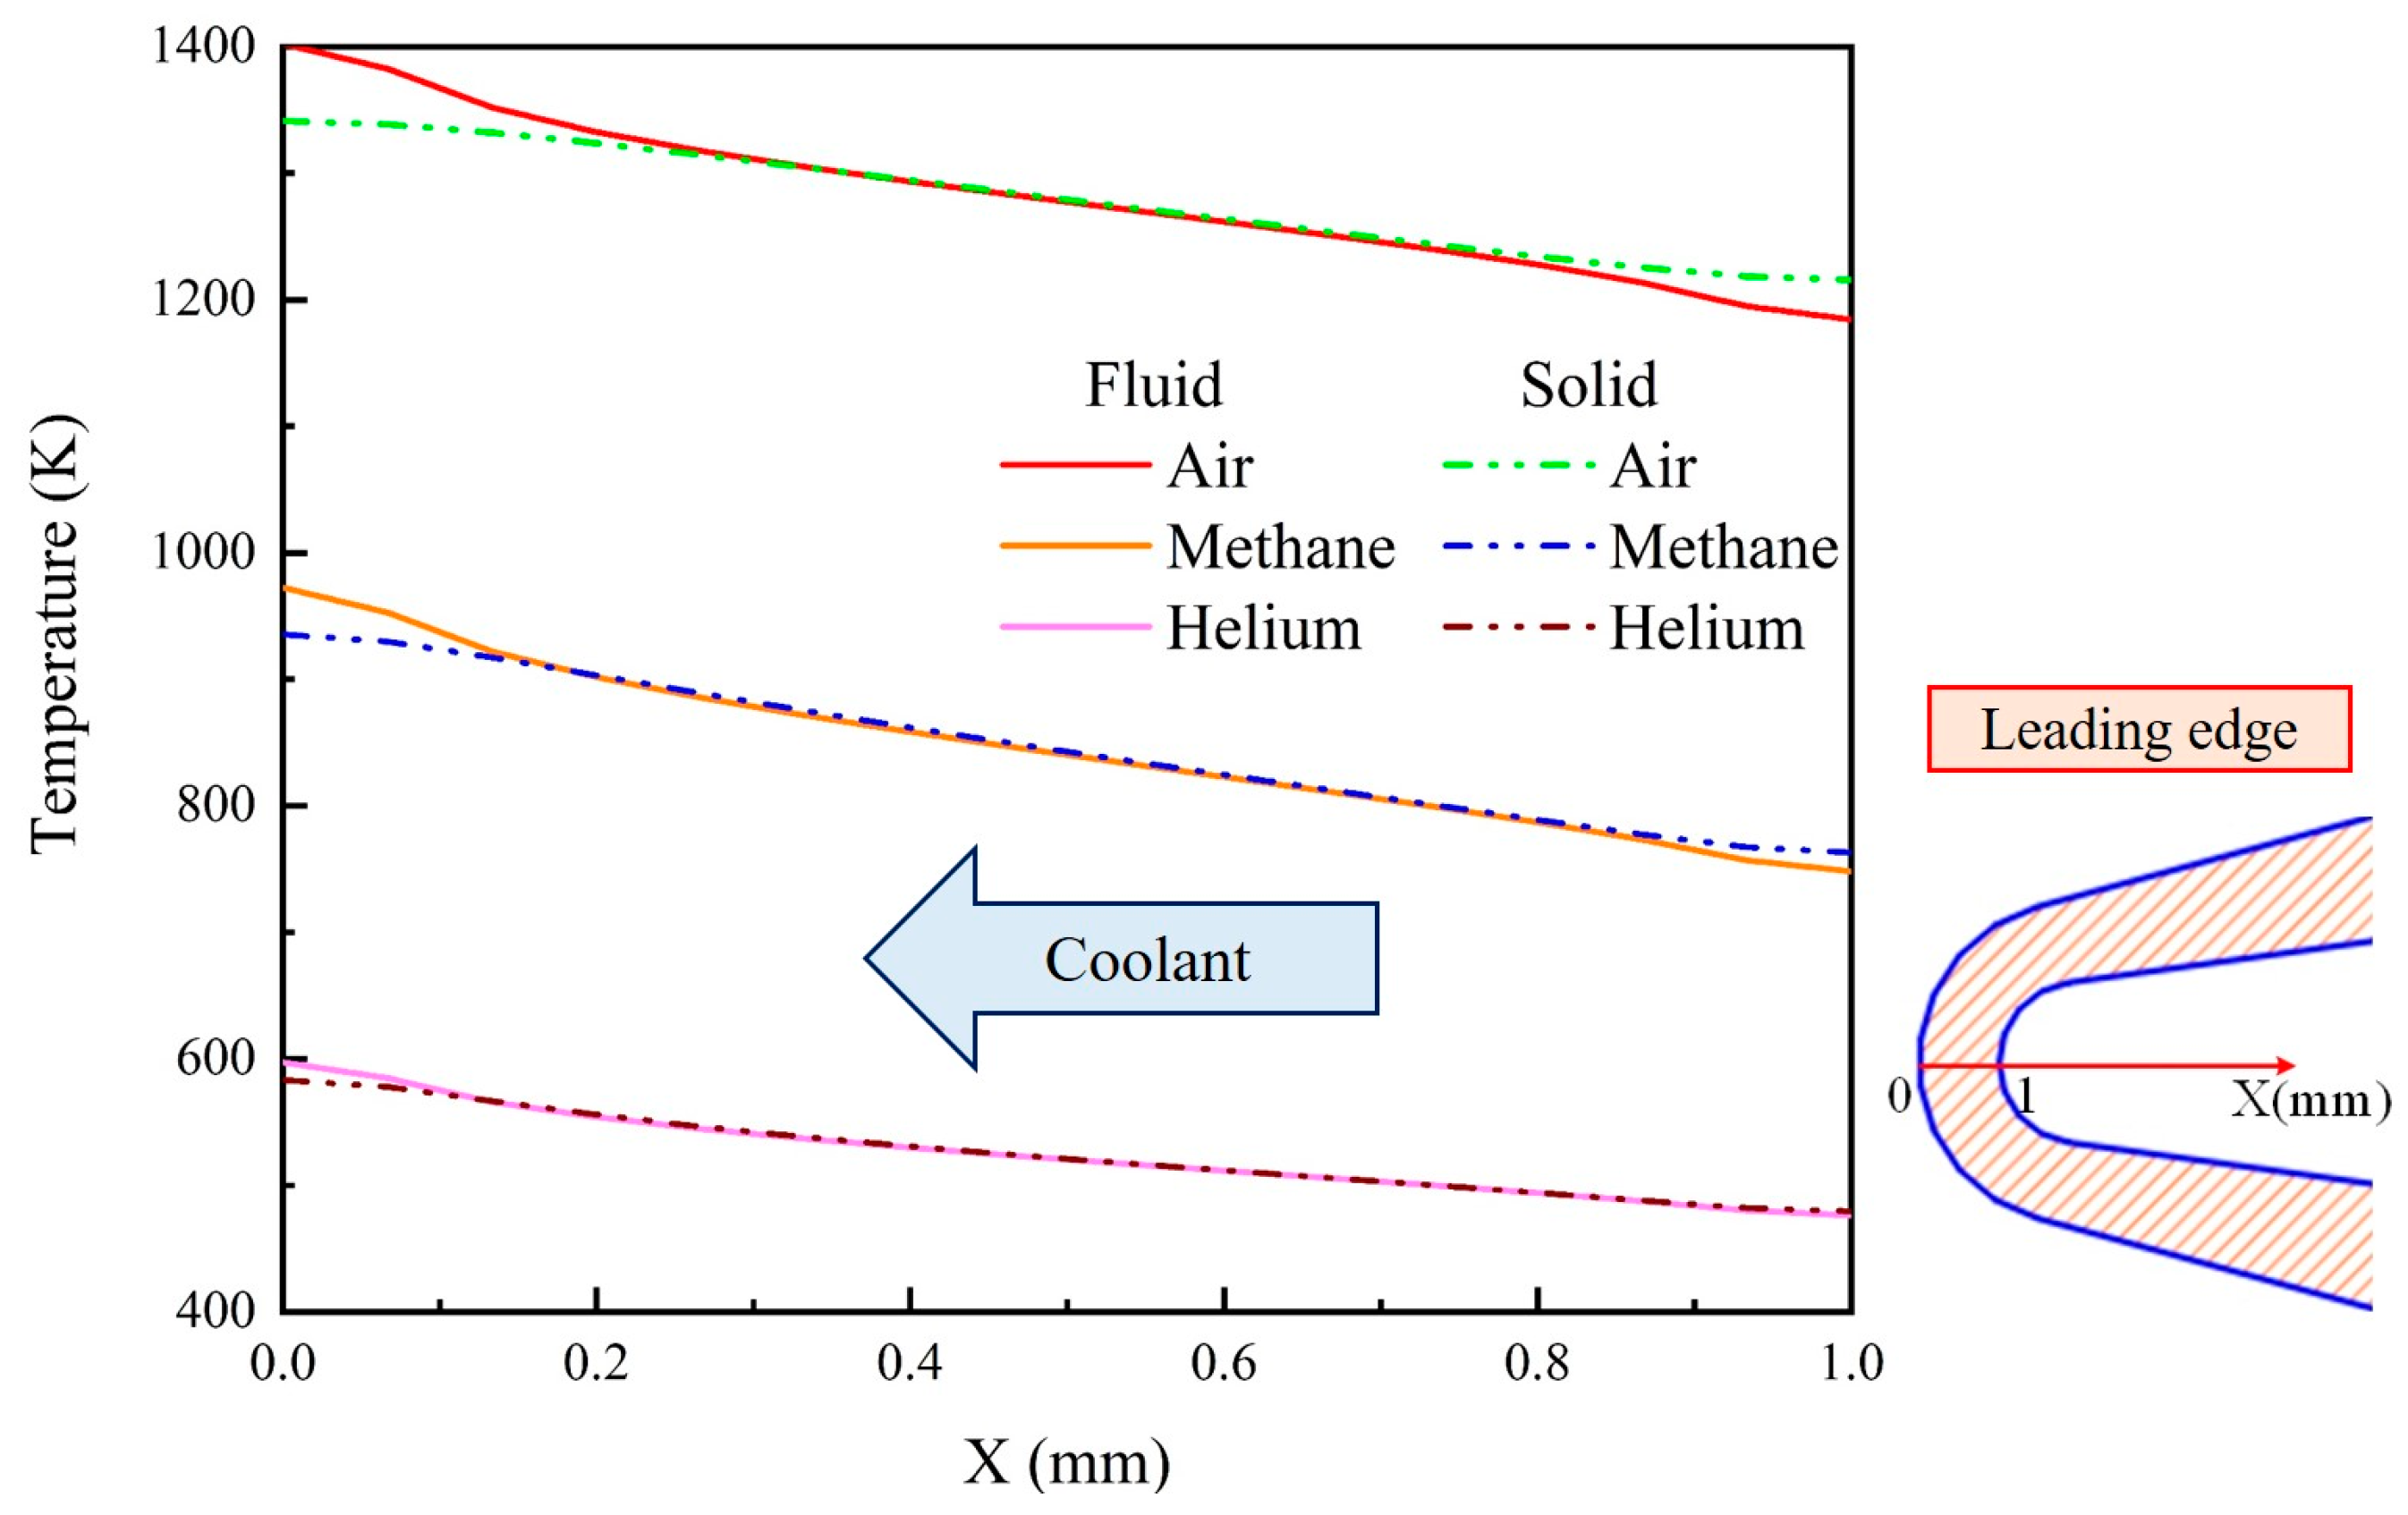
  • The temperature difference between fluid and solid inside the porous medium is analyzed and the phenomenon that fluid temperature is higher than solid temperature at the leading edge inside the strut is observed and explained. Density of fluid is far lower than that of solid, so the total mass of fluid is far less than that of solid in a certain volume of porous medium. Though the specific heat of fluid is larger, the fluid temperature rises higher when absorbing same quantity of heat.
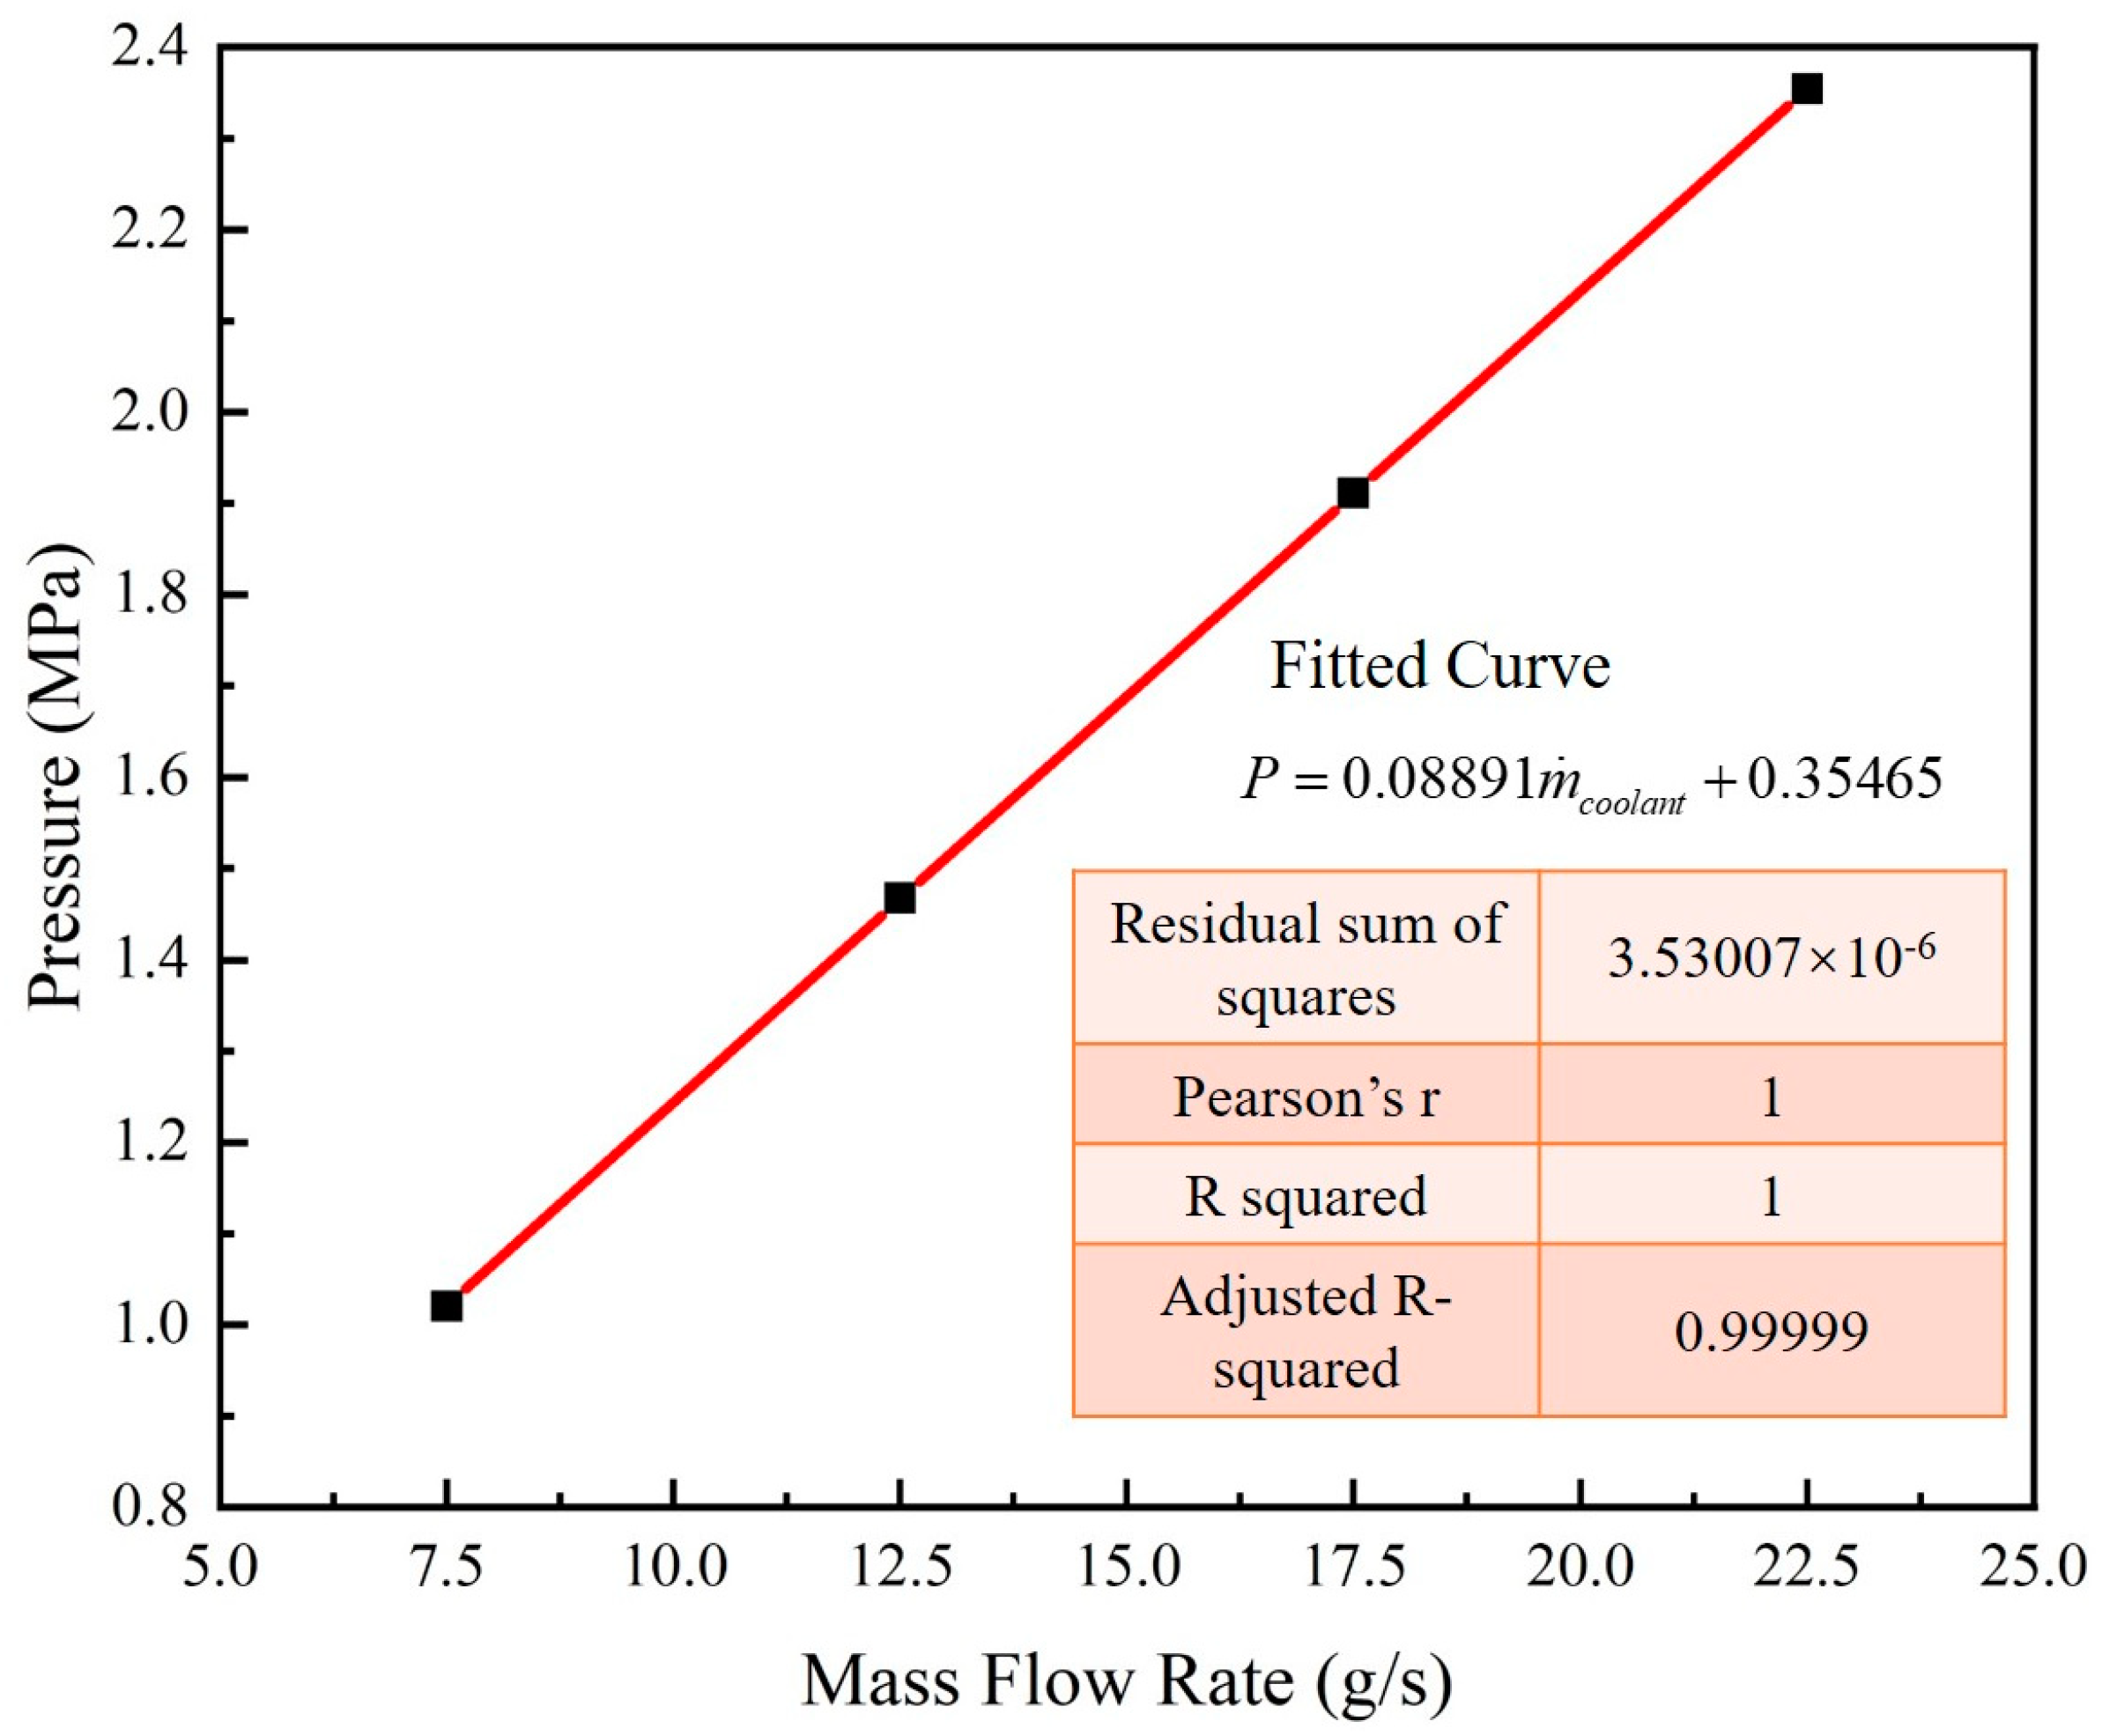
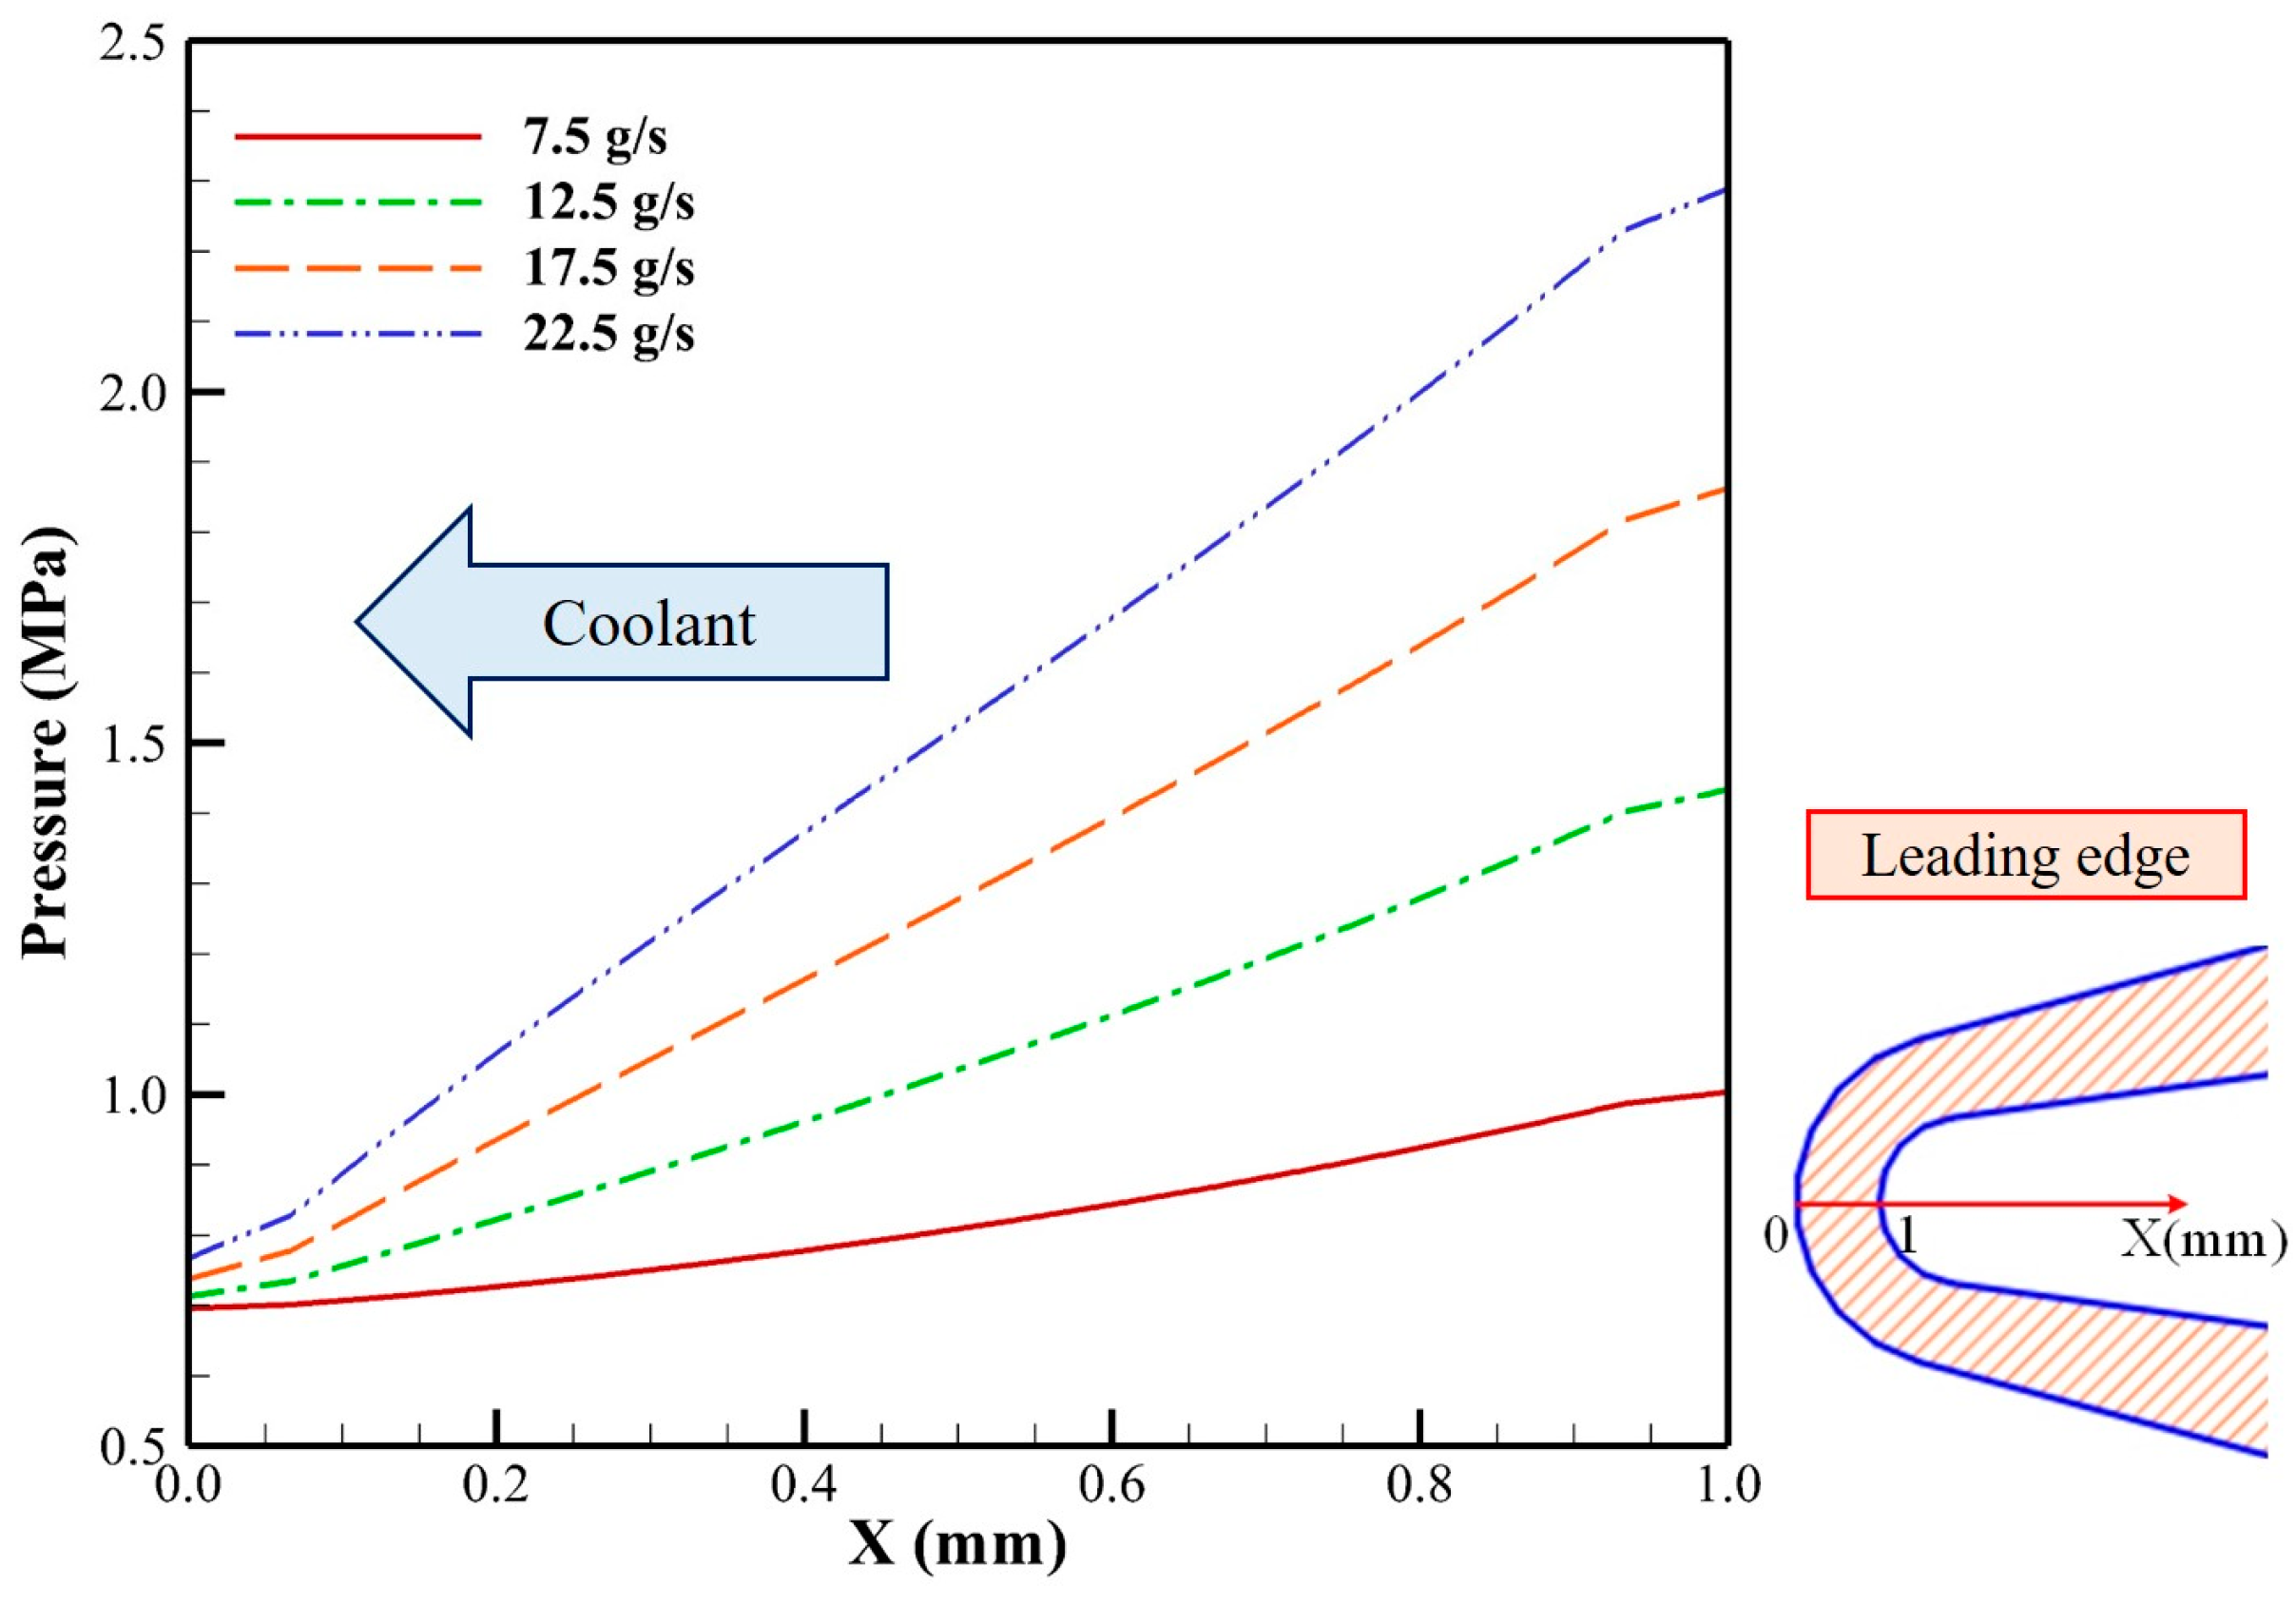
  • As the mass flow rate of coolant increases, the heat transfer between fluid and solid in the porous medium is enhanced, so that the fluid and solid temperature can early reach the balance and the temperature difference is smaller at both the inlet and outlet of the coolant. Besides, the solid temperature at the leading edge of porous strut and coolant mass flow rates show a power function, and when the coolant flow rate reaches a certain level, further increasing the flow rate will not bring an obvious improvement on cooling effect.
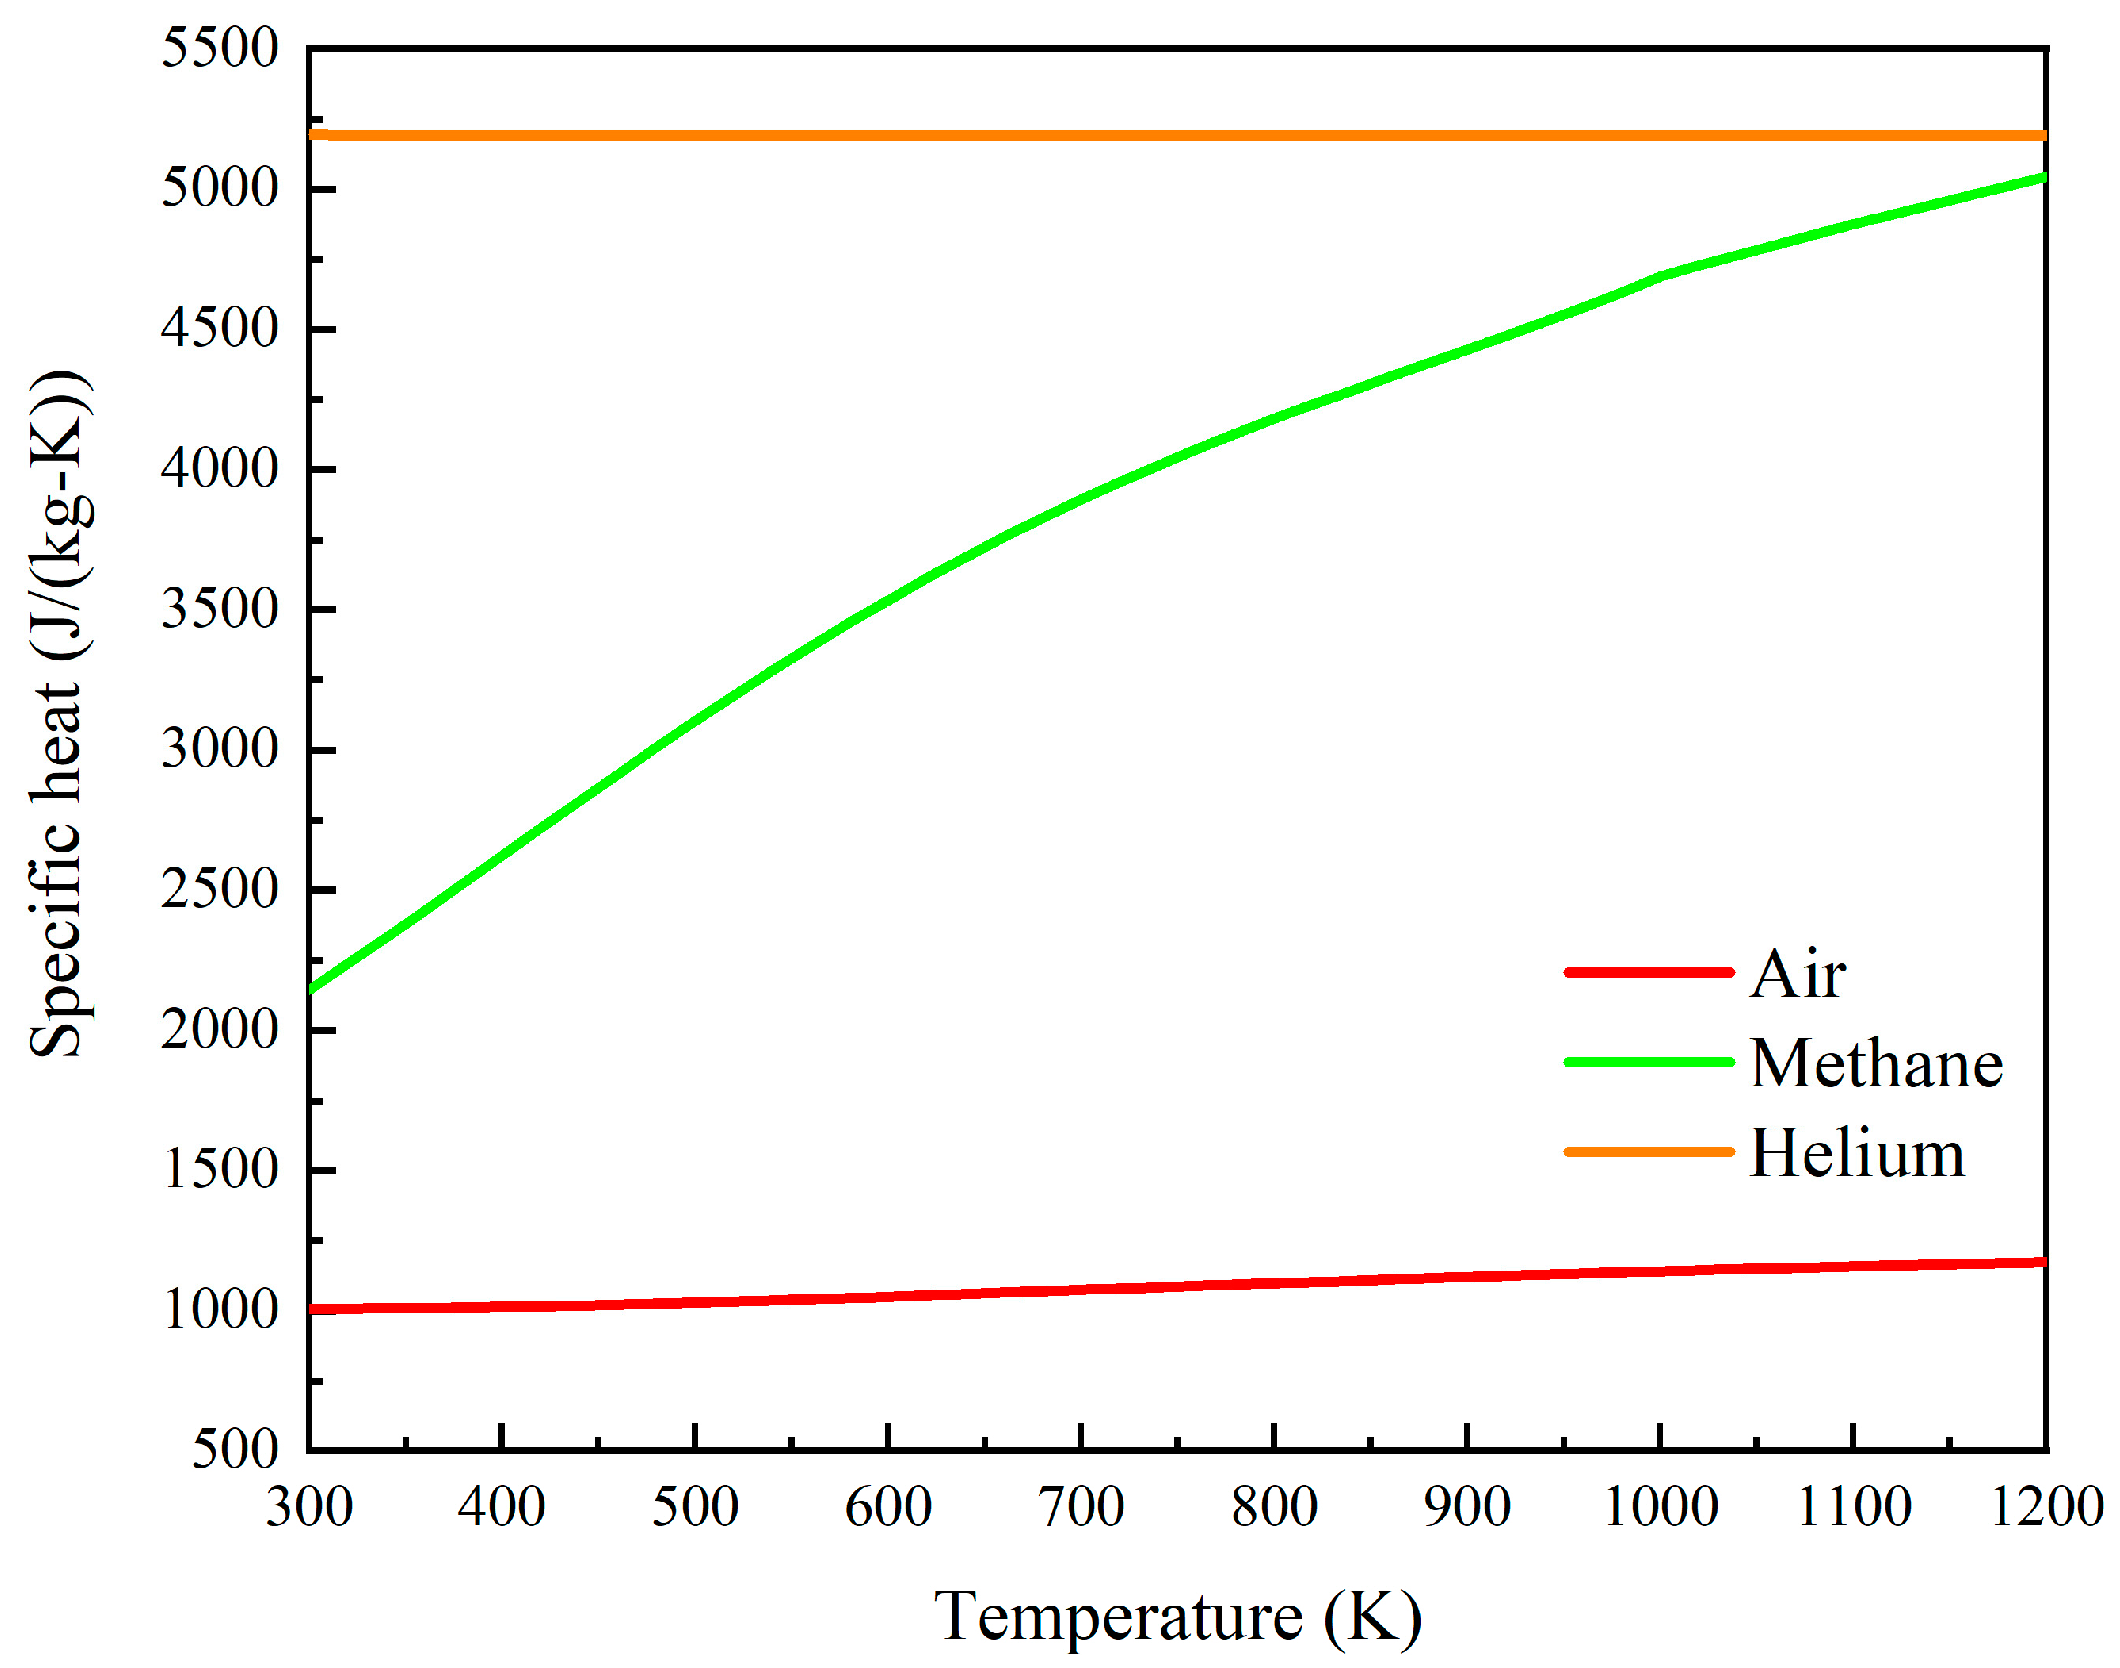
  • The density and specific heat of coolant are two factors that influence the effect of transpiration cooling. When using a low-density coolant, the injection velocity to the main flow is larger, which brings more obvious blow effect on the mainstream and pushes the shock wave farther away from the stagnation point, providing a better cooling effect. The coolant with higher specific heat has a better heat absorption capacity, resulting a stronger dynamic equilibrium between the fluid and solid inside the porous medium.

Author Contributions

Conceptualization, H.Y. and X.L.; methodology, H.Y. and X.L.; software, X.L.; validation, X.L. and Y.B.; formal analysis, X.L.; investigation, Y.B.; resources, H.Y.; data curation, Y.B.; writing—original draft preparation, X.L.; writing—review and editing, H.Y. and Y.B.; visualization, Y.B.; supervision, G.W.; project administration, G.W. All authors have read and agreed to the published version of the manuscript.

Funding

This research received no external funding.

Institutional Review Board Statement

Not applicable.

Informed Consent Statement

Not applicable.

Data Availability Statement

The data that support the findings of this study are available from the corresponding author upon reasonable request.

Conflicts of Interest

The authors declare no conflict of interest.

Nomenclature

Latin
AfsSpecific surface area of porous media: [m−1]
dpParticle diameter, [μm]
ETotal energy, [J/kg]
FInertia coefficient
hfsHeat transfer coefficient between fluid and solid in porous media, [W/m2·K]
KPermeability of porous media, [m2]
KnKnudsen number
LTotal length of strut, [mm]
m ˙ Mass flow rate, [kg/s]
MaMach number
NufsNusselt number in porous media
pPressure, [Pa]
PrPrandtl number
ReReynolds number
TTemperature, [K]
VVelocity, [m/s]
Greek
εPorosity of porous media
μDynamic viscosity, [Pa·s]
ρDensity, [kg/m3]
τShear stress tensor, [Pa]
Subscripts
coolantCoolant
fFluid
rRecovery
sSolid
Abbreviations
LTELocal Thermal Equilibrium
LTNELocal Thermal Non-Equilibrium
UDFUser-Defined Function

References

  1. Gerlinger, P.; Stoll, P.; Kindler, M.; Schneider, F.; Aigner, M. Numerical investigation of mixing and combustion enhancement in supersonic combustors by strut induced streamwise vorticity. Aerosp. Sci. Technol. 2008, 12, 159–168. [Google Scholar] [CrossRef] [Green Version]
  2. Pandey, K.M.; Roga, S.; Choubey, G. Computational Analysis of Hypersonic Combustor Using Strut Injector at Flight Mach 7. Combust. Sci. Technol. 2015, 187, 1392–1407. [Google Scholar] [CrossRef]
  3. Tani, K.; Kanda, T.; Kudou, K. Aerodynamic Performance of Scramjet Inlet Models with a Single Strut. J. Propul. Power 2006, 22, 905–912. [Google Scholar] [CrossRef]
  4. Desikan, S.L.N.; Kurian, J. Mixing Studies in Supersonic Flow Employing Strut Based Hypermixers. In Proceedings of the 41st AIAA/ASME/SAE/ASEE Joint Propulsion Conference & Exhibit, Tucson, AZ, USA, 10–13 July 2005. [Google Scholar]
  5. Bouchez, M.; Saunier, E.; Peres, P.; Lansalot, J. Advanced carbon/carbon injection strut for actual scramjet. In Proceedings of the Space Plane and Hypersonic Systems and Technology Conference, Norfolk, VA, USA, 18–22 November 1996. [Google Scholar]
  6. Jiang, P.; Huang, G.; Zhu, Y.; Liao, Z.; Huang, Z. Experimental investigation of combined transpiration and film cooling for sintered metal porous struts. Int. J. Heat Mass Transf. 2017, 108, 232–243. [Google Scholar] [CrossRef]
  7. Xiao, X.; Zhao, G.; Zhou, W. Numerical investigation of transpiration cooling for porous nose cone with liquid coolant. Int. J. Heat Mass Transf. 2018, 121, 1297–1306. [Google Scholar] [CrossRef]
  8. Herbertz, A.; Ortelt, M.; Müller, I.; Hald, H. Transpiration Cooled Ceramic Thrust Chamber Applicability for High-Thrust Rocket Engines. In Proceedings of the 48th AIAA/ASME/SAE/ASEE Joint Propulsion Conference & Exhibit, Atlanta, GA, USA, 30 July–1 August 2012. [Google Scholar]
  9. Zhu, Y.; Jiang, P.; Sun, J.; Xiong, Y. Injector Head Transpiration Cooling Coupled with Combustion in H2/O2 Subscale Thrust Chamber. J. Thermophys. Heat Transf. 2013, 27, 42–51. [Google Scholar] [CrossRef]
  10. Wang, J.; Messner, J.; Stetter, H. An Experimental Investigation on Transpiration Cooling Part II: Comparison of Cooling Methods and Media. Int. J. Rotating Mach. 2004, 10, 355–363. [Google Scholar] [CrossRef]
  11. Xu, G.; Liu, Y.; Luo, X.; Ma, J.; Li, H. Experimental investigation of transpiration cooling for sintered woven wire mesh structures. Int. J. Heat Mass Transf. 2015, 91, 898–907. [Google Scholar] [CrossRef]
  12. Haidn, O.; Greuel, D.; Herbertz, A.; Ortelt, M.; Hald, H. Transpiration Cooling Appllied to C/C Liners of Cryogenic Liquid Rocket Engines. In Proceedings of the 40th AIAA/ASME/SAE/ASEE Joint Propulsion Conference & Exhibit, Fort Lauderdale, FL, USA, 11–14 July 2004. [Google Scholar]
  13. Qian, K.; Wang, J.; He, F.; Wu, Y.; Zhou, Z. An experimental investigation on transpiration cooling performances using solid hydrogel as coolant. Appl. Therm. Eng. 2019, 158, 113753. [Google Scholar] [CrossRef]
  14. Wu, N.; Wang, J.; Dong, W.; Ding, R. An experimental investigation on combined sublimation and transpiration cooling for sintered porous plates. Int. J. Heat Mass Transf. 2018, 116, 685–693. [Google Scholar] [CrossRef]
  15. van Foreest, A.; Sippel, M.; Gülhan, A.; Esser, B.; Ambrosius, B.A.C.; Sudmeijer, K. Transpiration Cooling Using Liquid Water. J. Thermophys. Heat Transf. 2009, 23, 693–702. [Google Scholar] [CrossRef]
  16. Shen, L.; Wang, J.; Dong, W.; Pu, J.; Peng, J.; Qu, D.; Chen, L. An experimental investigation on transpiration cooling with phase change under supersonic condition. Appl. Therm. Eng. 2016, 105, 549–556. [Google Scholar] [CrossRef]
  17. Zhao, L.; Wang, J.; Ma, J.; Lin, J.; Peng, J.; Qu, D.; Chen, L. An experimental investigation on transpiration cooling under supersonic condition using a nose cone model. Int. J. Therm. Sci. 2014, 84, 207–213. [Google Scholar] [CrossRef]
  18. Huang, G.; Zhu, Y.; Liao, Z.; Lu, T.; Jiang, P.; Huang, Z. Experimental Study on Combined Cooling Method for Porous Struts in Supersonic Flow. J. Heat Transf. 2018, 140, 022201. [Google Scholar] [CrossRef]
  19. Prokein, D.; von Wolfersdorf, J. Numerical simulation of turbulent boundary layers with foreign gas transpiration using OpenFOAM. Acta Astronaut. 2019, 158, 253–263. [Google Scholar] [CrossRef]
  20. Langener, T.; von Wolfersdorf, J.; Steelant, J. Experimental Investigations on Transpiration Cooling for Scramjet Applications Using Different Coolants. AIAA J. 2011, 49, 1409–1419. [Google Scholar] [CrossRef]
  21. Jiang, P.; Lu, X. Numerical simulation of fluid flow and convection heat transfer in sintered porous plate channels. Int. J. Heat Mass Transf. 2006, 49, 1685–1695. [Google Scholar] [CrossRef]
  22. Ding, R.; Wang, J.; He, F.; Wang, M.; Luan, Y.; Dong, G.; Tang, L. Numerical investigation on a double layer combined cooling structure for aerodynamic heat control of hypersonic vehicle leading edge. Appl. Therm. Eng. 2020, 169, 114949. [Google Scholar] [CrossRef]
  23. Huang, Z.; Zhu, Y.; Jiang, P.; Xiong, Y. Investigation of a Porous Transpiration-Cooled Strut Injector. J. Propul. Power 2015, 31, 278–285. [Google Scholar] [CrossRef]
  24. Huang, Z.; Zhu, Y.; Xiong, Y.; Jiang, P. Investigation of transpiration cooling for sintered metal porous struts in supersonic flow. Appl. Therm. Eng. 2014, 70, 240–249. [Google Scholar] [CrossRef]
  25. Xiong, Y.; Zhu, Y.; Jiang, P. Numerical Simulation of Transpiration Cooling for Sintered Metal Porous Strut of the Scramjet Combustion Chamber. Heat Transf. Eng. 2013, 35, 721–729. [Google Scholar] [CrossRef]
  26. Wang, J.; Wang, H. A Discussion of Transpiration Cooling Problems through an Analytical Solution of Local Thermal Nonequilibrium Model. J. Heat Transf. 2006, 128, 1093–1098. [Google Scholar] [CrossRef]
  27. Shi, J.; Wang, J. A Numerical Investigation of Transpiration Cooling with Liquid Coolant Phase Change. Transp. Porous Media 2011, 87, 703–716. [Google Scholar] [CrossRef]
  28. Lee, S.L.; Yang, J. Modeling of Darcy-Forchheimer drag for fluid flow across a bank of circular cylinders. Int. J. Heat Mass Transf. 1997, 40, 3149–3155. [Google Scholar] [CrossRef]
  29. Jiang, P.; Ren, Z. Numerical investigation of forced convection heat transfer in porous media using a thermal non-equilibrium model. Int. J. Heat Fluid Flow 2001, 22, 102–110. [Google Scholar] [CrossRef]
  30. Xu, R.; Huang, Y.; Jiang, P.; Wang, B. Internal heat transfer coefficients in microporous media with rarefaction effects. Sci. China Technol. Sci. 2012, 55, 2869–2876. [Google Scholar] [CrossRef]
  31. Langener, T.; von Wolfersdorf, J.; Kuhn, M.; Steelant, J. Transpiration Cooling with Supersonic Flows and Foreign Gas Injection. In Proceedings of the 46th AIAA/ASME/SAE/ASEE Joint Propulsion Conference & Exhibit, Nashville, TN, USA, 25–28 July 2010. [Google Scholar]
Figure 1. Geometrical and physical model. (a) Schematic of the strut with transpiration cooling in the combustion chamber; (b) top view of the strut.
Energies 15 02091 g001
Figure 2. Interfaces in the numerical simulation.
Energies 15 02091 g002
Figure 3. Meshes of calculation model. (a) Full calculation domain of the chamber and strut; (b) the meshes near the strut.
Energies 15 02091 g003
Figure 4. Numerical method.
Energies 15 02091 g004
Figure 5. Temperature distribution (a) Without transpiration cooling; (b) With transpiration cooling.
Energies 15 02091 g005
Figure 6. Velocity distribution.
Energies 15 02091 g006
Figure 7. Methane mass fraction distribution.
Energies 15 02091 g007
Figure 8. Pressure distribution and shock wave (a) Pressure distribution in front of strut; (b) Movement of the shock wave.
Energies 15 02091 g008
Figure 9. Temperature and cooling efficiency distribution on strut surface.
Energies 15 02091 g009
Figure 10. Temperature difference between fluid and solid on different z cross-sections.
Energies 15 02091 g010
Figure 11. Relationship between mass flow rate and inlet pressure of coolant.
Energies 15 02091 g011
Figure 12. Pressure distribution at the leading edge inside strut.
Energies 15 02091 g012
Figure 13. Injection velocity of coolant under different coolant flow rates.
Energies 15 02091 g013
Figure 14. Temperature and cooling efficiency distribution on strut surface under different coolant flow rates. (a) Temperature distribution; (b) cooling efficiency distribution.
Energies 15 02091 g014
Figure 15. Temperature difference between fluid and solid under different coolant flow rates.
Energies 15 02091 g015
Figure 16. Relationship between coolant mass flow rate and outlet wall temperature.
Energies 15 02091 g016
Figure 17. Temperature and cooling efficiency distribution on strut surface under various coolants.(a) Temperature distribution; (b) Cooling efficiency distribution.
Energies 15 02091 g017
Figure 18. Injection velocity of coolant.
Energies 15 02091 g018
Figure 19. Pressure distribution in front of strut.
Energies 15 02091 g019
Figure 20. Mass fraction distribution. (a) Air; (b) Methane; (c) Helium.
Energies 15 02091 g020
Figure 21. Specific heat of the coolants.
Energies 15 02091 g021
Figure 22. Temperature difference between fluid and solid under various coolants.
Energies 15 02091 g022
Table 1. Calculation results and calculation time on three meshes.
Mesh123
Number of grids (million)0.71.42.8
Stagnation temperature (K)167514911502
Calculation time (h)254270
Table 2. Comparison of experimental and numerical results.
Relative Position (x/L)Experiment Temperature (K)Numerical Simulation
LTELTNE
Temperature (K)Relative Error (%)Temperature (K)Relative Error (%)
0.4437.4382.512.6461.75.6
0.9306.3367.019.8348.313.7
1.0349.9365.24.4347.70.6
Publisher’s Note: MDPI stays neutral with regard to jurisdictional claims in published maps and institutional affiliations.

