1. Introduction
Although the tight sandstone reservoir has the characteristic of low porosity and low permeability (less than 1 × 10
−3 μm), it contains considerable oil and gas resources, which are an important force to replace conventional oil and gas energy and support the future oil and gas revolution [
1,
2,
3]. Unlike conventional sandstone reservoirs, poor physical properties (porosity, permeability), strong heterogeneity, and complex pore structure are typical features of tight sandstone reservoirs, and the pore size distribution can be divided into microscale pores and nanoscale pores [
4,
5]. Consequently, only a profound understanding of the pore structure characteristics of tight sandstone can accurately evaluate the petrophysical properties of tight sandstone reservoirs.
In order to characterize the pore structure of tight sandstone, various experimental testing techniques have been widely used, including X-ray diffraction (XRD) [
6], high-pressure mercury injection (HPMI) [
7], small-angle neutron scattering (SANS) [
8], low-temperature gas adsorption (N
2/CO
2, GA) [
9], nuclear magnetic resonance (NMR) [
10,
11,
12], cast thin section (CTS) [
13], scanning electron microscope (SEM) [
14,
15,
16], focused ion beam microscope (FIB-SEM) [
17], micro/nano CT scanning and the resulting digital rock technology [
18,
19]. It has been recognized that the advantages and limitations for each test technique exist at the same time, and only one testing technique cannot fully reveal the pore structure characteristics of tight sandstone. Therefore, a variety of experimental methods and theories have been comprehensively used by many scholars, to accurately and comprehensively characterize the full pore-throat size distribution of tight sandstone reservoirs [
20,
21].
In order to accurately evaluate the water saturation of tight sandstone reservoirs through well logging, it is significant for comprehensive research to be conducted on the influence of pore structure on the electrical properties of tight sandstone [
22]. Due to the complexity of different factors, it is not very straightforward to quantitatively study the influence of various pore structure parameters of tight sandstone on electrical properties through traditional petrophysical methods. Therefore, the numerical methods are more practical and effective than the experimental methods [
23]. In the past two decades, digital rock technology has proved to be an effective method to study the electrical properties of rocks, including the percolation network model [
24,
25], random-walk method [
26], lattice Boltzmann method (LBM) [
27,
28] and finite-element method (FEM) [
29,
30,
31].
In the simulation process, a three-dimensional digital rock model needs to be constructed. However, due to the different scales of pores and throats, it is difficult to build a real three-dimensional digital rock of tight sandstone [
32]. There are two kinds of digital rock reconstruction methods, numerical reconstruction method, and laboratory experimental method [
33]. At present, scholars have conducted enough work to construct a three-dimensional digital rock of tight sandstone, trying to combine the information of pores and throats at different scales. Bera [
34] developed a novel experimental procedure that combines microscopic CT of different resolutions with SEM and FIB-SEM. This method can not only characterize the pore structure of sandstone on different scales, but also reflect the actual spatial distribution of mineral components. However, due to the highly experimental cost, it is difficult to apply this method to a large number of tight sandstones. Liu [
35] combined micro-CT, a quantitative evaluation of minerals by scanning electron microscopy (QemScan), and a modular automated processing system (MAPS) experiments to construct a fine three-dimensional digital rock of multicomponent tight sandstone. This method fully considers the contribution of micro-pores, but it needs advanced equipment for testing, and the construction process is very complicated.
Tight sandstones with different pore structures have different electrical properties. Bian [
36] used the petrophysical data of three types of reservoirs to demonstrate that the pore structure controls the resistivity response of the hydrocarbon-bearing layer, and thus, affects the logging interpretation. Liu [
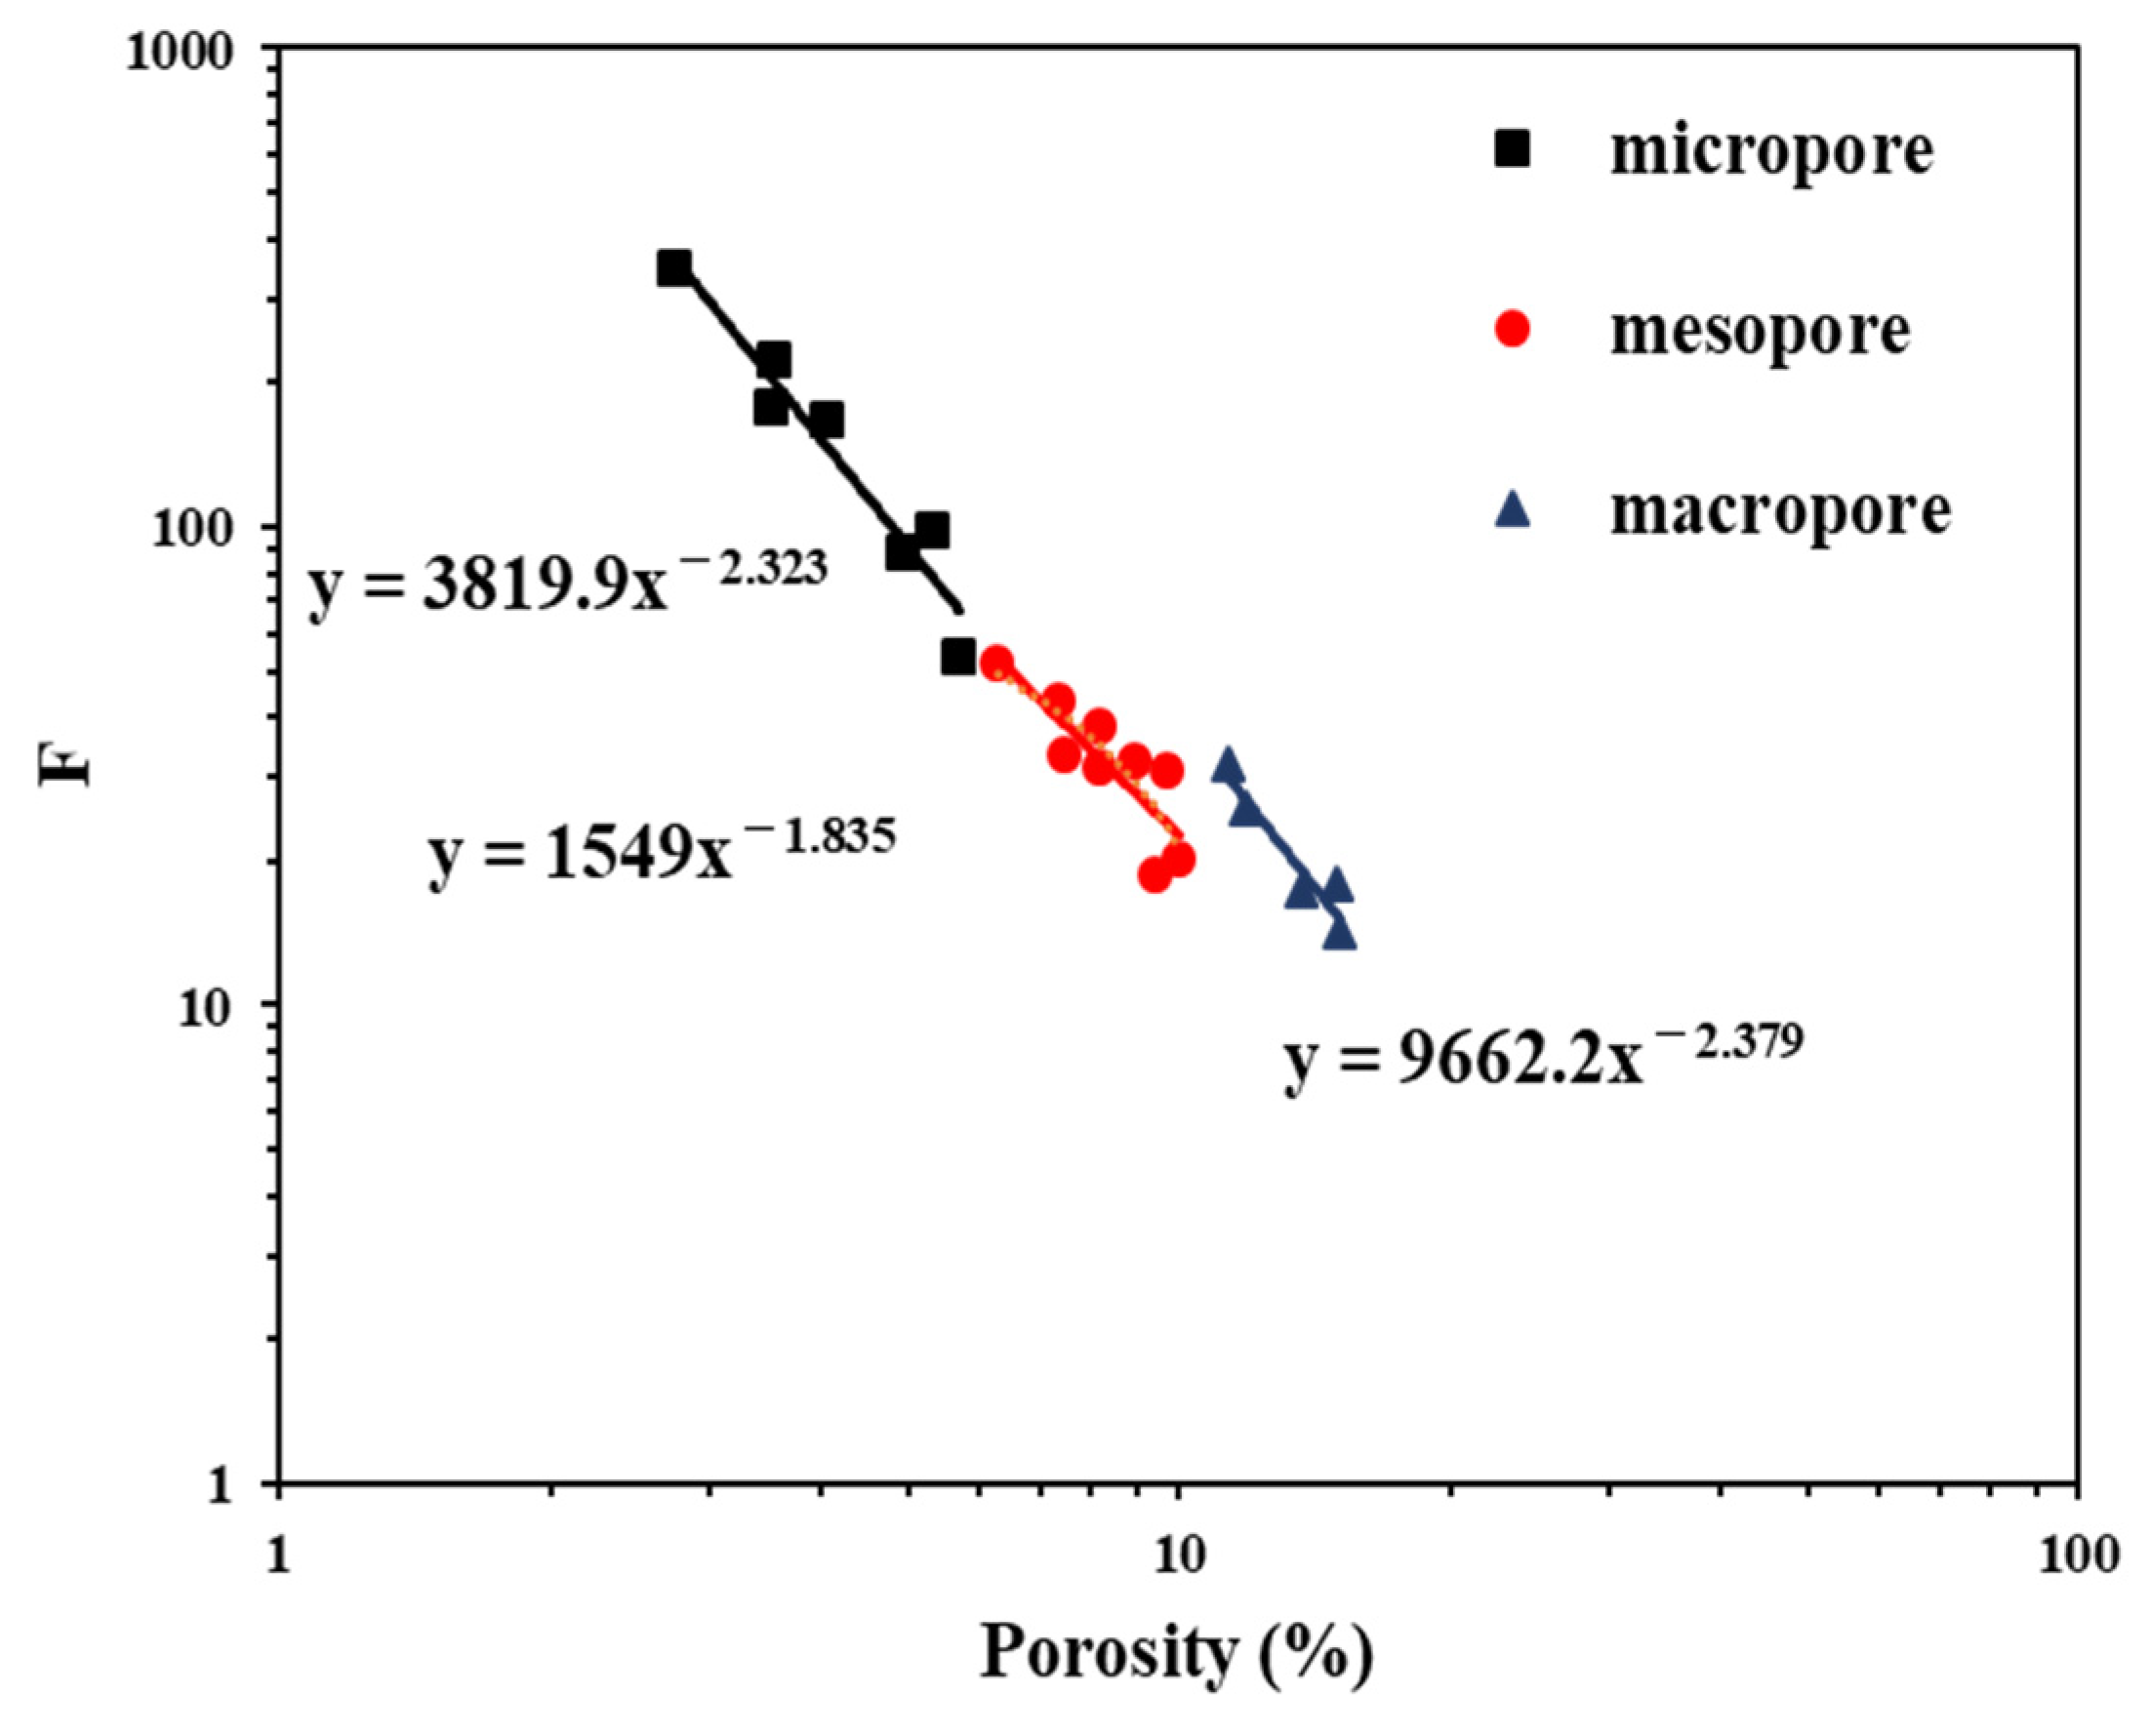
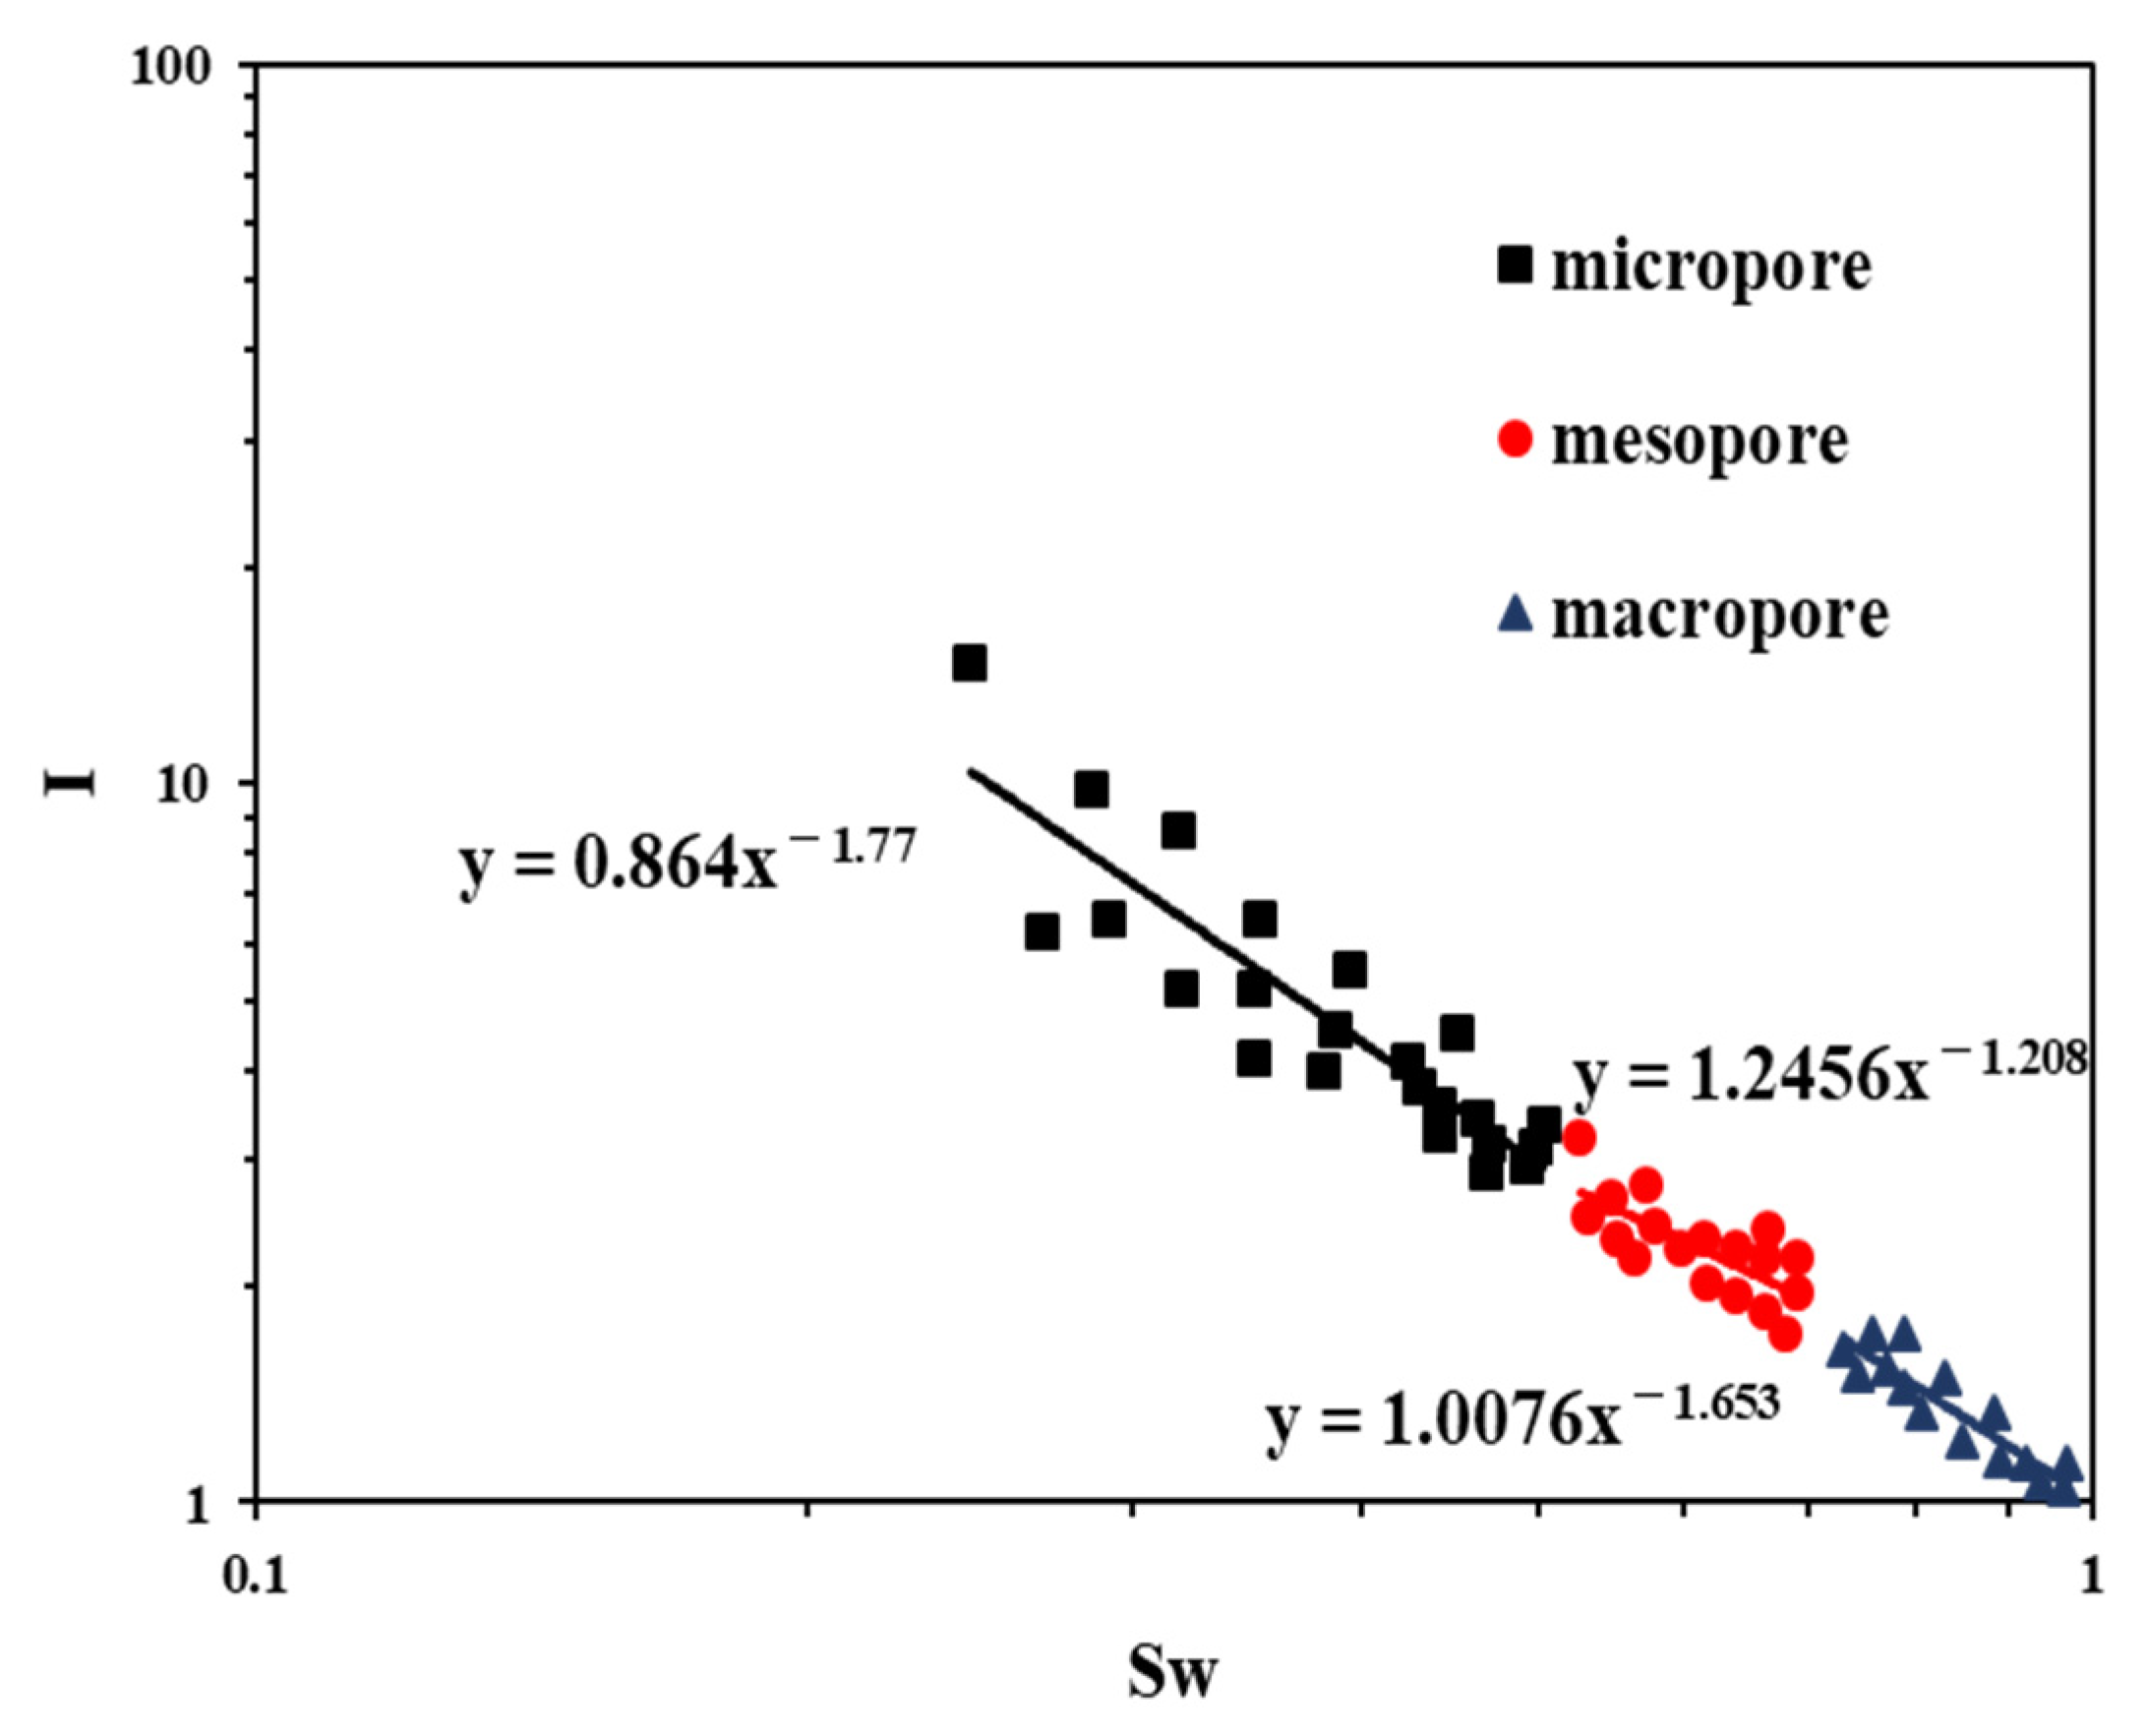
37] found that the relationship between porosity and formation factor (F), water saturation and resistivity index (I-Sw) differs from that of conventional rocks. Wu [
38] simplified the tight sandstone reservoir into a two-dimensional pore-throat model, and quantitatively analyzed the influence of pore structure parameters on rock electrical properties by using the finite-element method. Liu [
39] believes that traditional digital rocks ignore the contribution of micro-pores in tight sandstone to electrical conductivity, resulting in the inability to accurately evaluate formation saturation. Although various methods have been used to study the influence of pore structure on electrical properties, it is still unclear how different pore structure parameters affect rock electrical properties.
Due to the complex pore structure, strong heterogeneity, and complex electrical characteristics of tight sandstone, Archie’s equation is no longer applicable to the calculation of water saturation [
40]. At present, Archie’s equation with variable parameters is still used to evaluate tight sandstone saturation in field practice. Li [
41] constructed the function of the ratio of large and small pores, and the saturation index n through nuclear magnetic resonance and rock electrical property experiments, and achieved the goal of obtaining the saturation through the Archie formula with variable parameters. However, this method requires NMR logging data, and thus, its applicability is limited. Hu [
42] found that the small throat developed in tight sandstones led to the “non-Archie” phenomenon. In addition, the large pores and small pores in tight sandstone are equivalent to trapezoidal pores and straight pores, respectively, and the conductive mechanism of tight sandstone is formed by the parallel formation of these two types of pores. On this basis, the corresponding saturation model is proposed. However, this model only considers the parallel conduction of formation pores, and does not point out the corresponding basis. Therefore, it is urgent to propose a saturation evaluation model for the tight sandstone reservoir that comprehensively considers the pore structure and conductive mechanism.
In this study, the tight sandstone reservoir in Bonan oilfield was selected as the research object. Micro-CT, MICP, CTS, and NMR with conventional core physical experiments (porosity and permeability) were carried out to construct a multi-scale three-dimensional digital rock model of tight sandstone. The pore network model was extracted by using the maximum ball algorithm; then, the electrical parameters, such as formation factors, water saturation, and resistivity index were quantitatively derived. Subsequently, the effects of five micro-pore structure parameters such as pore size, throat size, pore-throat size, coordination number, and shape factor on electrical properties were quantitatively studied. On this basis, the saturation of the tight sandstone reservoir was evaluated, combined with the three-component automatic mixed-connection conductivity model.
3. Materials and Methods
From the current numerous digital rock modeling methods, the CT scanning method is the most accurate method for constructing digital rock, which can best reflect the microscopic pore structure of real cores. However, even when the resolution is as high as 1 μm, the porosity of the three-dimensional digital rock is still less than the results of laboratory porosity measurements, indicating that there are micro-pores in the rock core whose size is less than the CT scanning resolution [
50]. The existence of micro-pores makes the porosity of the digital core lower than that of the experiment, which affects the pore connectivity of the digital rock and is not conducive to subsequent numerical simulation research.
In order to overcome this disadvantage, an innovative method of constructing high-precision digital rock by combining CT scanning, mercury injection, NMR, and a casting-thin section experiment was proposed. The example shows that this method has the advantages of strong operability, low cost, and good treatment effect, and can construct nano-digital rock.
3.1. Construction of 3D Digital Rock by X-ray CT
In this study, the threshold method was used to binarize the three-dimensional gray image obtained by X-ray CT scanning (
Figure 1a). The threshold method is a traditional image segmentation method. Its advantages are simple implementation, a small amount of calculation, and relatively stable performance. Therefore, it has become the most basic and widely used segmentation technology in image segmentation. Image threshold segmentation technology makes use of the difference in gray value between the target to be extracted and its background in the gray image. If the image is regarded as a combination of two types of regions with different gray levels—the target and background—an appropriate threshold is selected to determine whether each pixel in the image should belong to the target region or the background region, so as to convert it into the corresponding binary image.
Figure 1b shows the binary image of Y288-10.
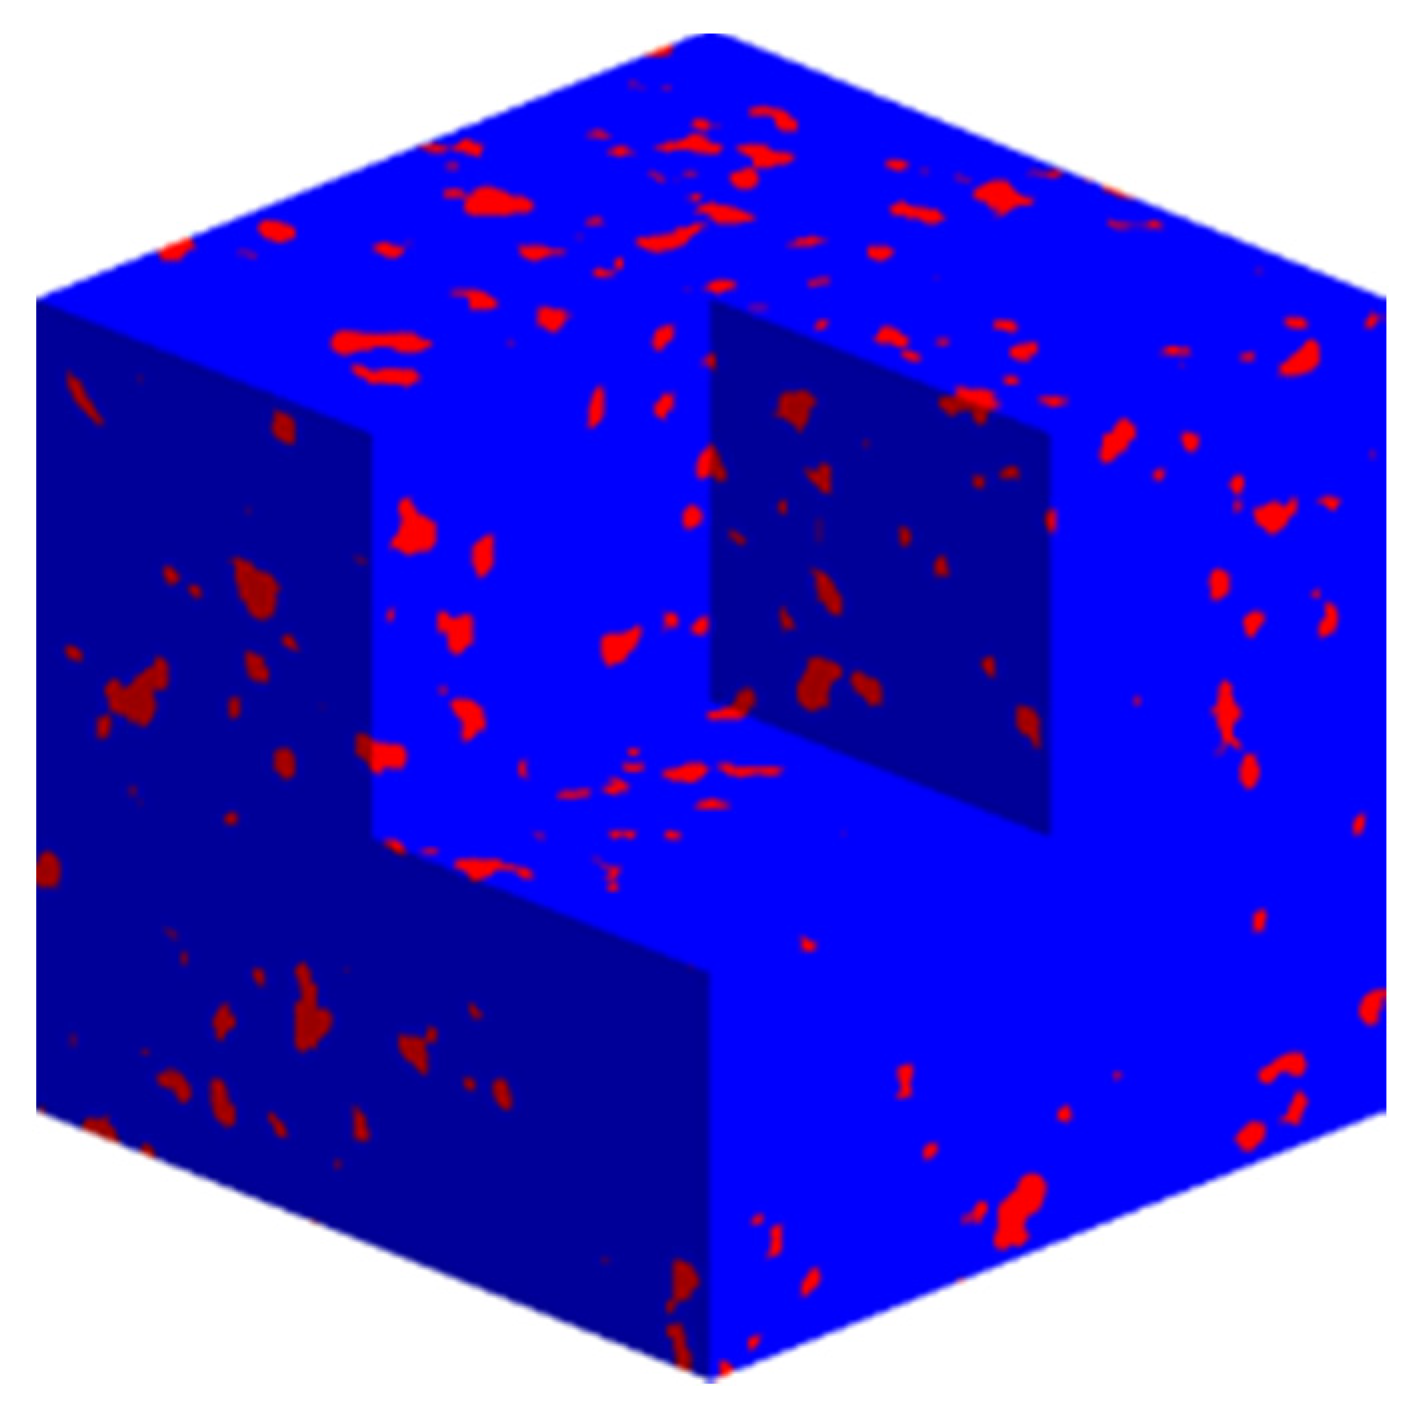
By accumulating the binarized image slices and using the three-dimensional visualization technology, the digital rock constructed by the X-ray CT method was obtained, as shown in
Figure 2, in which blue is the skeleton and red is the pore.
Three-dimensional digital rock with a complex pore structure can be constructed from the X-ray CT method, but it is limited by the resolution. It needs to construct nanoscale 3D digital rock with a FIB-SEM instrument, but FIB-SEM is expensive. Therefore, it is particularly important to propose a new nanoscale digital rock reconstruction technology.
3.2. Extraction of Complex Pore Structure Parameters
3.2.1. Extraction of Throat Radius Distribution from Mercury Injection Data
The mercury injection method is based on the fact that mercury has great surface tension and generally does not wet the rock. Taking mercury as a non-wetting phase and injecting it into the rock pores under a certain pressure, the relationship curve between capillary force and mercury saturation, namely the capillary pressure curve, was obtained by calculating the equilibrium capillary force and mercury injection amount [
51].
For the mercury injection method, the mercury injection data were converted to the throat radius with the following formula:
Thus, the cumulative probability distribution of throat radius can be obtained, as shown in
Figure 3.
3.2.2. Extract Pore Radius Distribution from Nuclear Magnetic Resonance Data
In a porous formation, pore fluid can be divided into two parts: pore interface fluid and free fluid in the pore. Fluid molecules move and diffuse constantly in the pore space. According to the NMR relaxation mechanism of pore fluid, ignoring the terms with small influencing factors, the transverse relaxation time
T2 can be expressed by Equation (2) [
52]:
In the actual formation, the pore structure was very complex, and the specific surface had a nonlinear relationship with the pore diameter, which can be expressed as:
It can be seen from Equation (3) that the observed relaxation time
T2 corresponds to the average aperture
rc in a one-to-one relationship. Therefore,
T2 distribution was used to evaluate pore size and pore size distribution. If we divide the two ends of Equation (1) and Equation (3) above, respectively, there will be:
, that is, the conversion coefficient of the nuclear magnetic resonance
T2 spectrum to the pseudo-capillary pressure curve. Then, this can be expressed as:
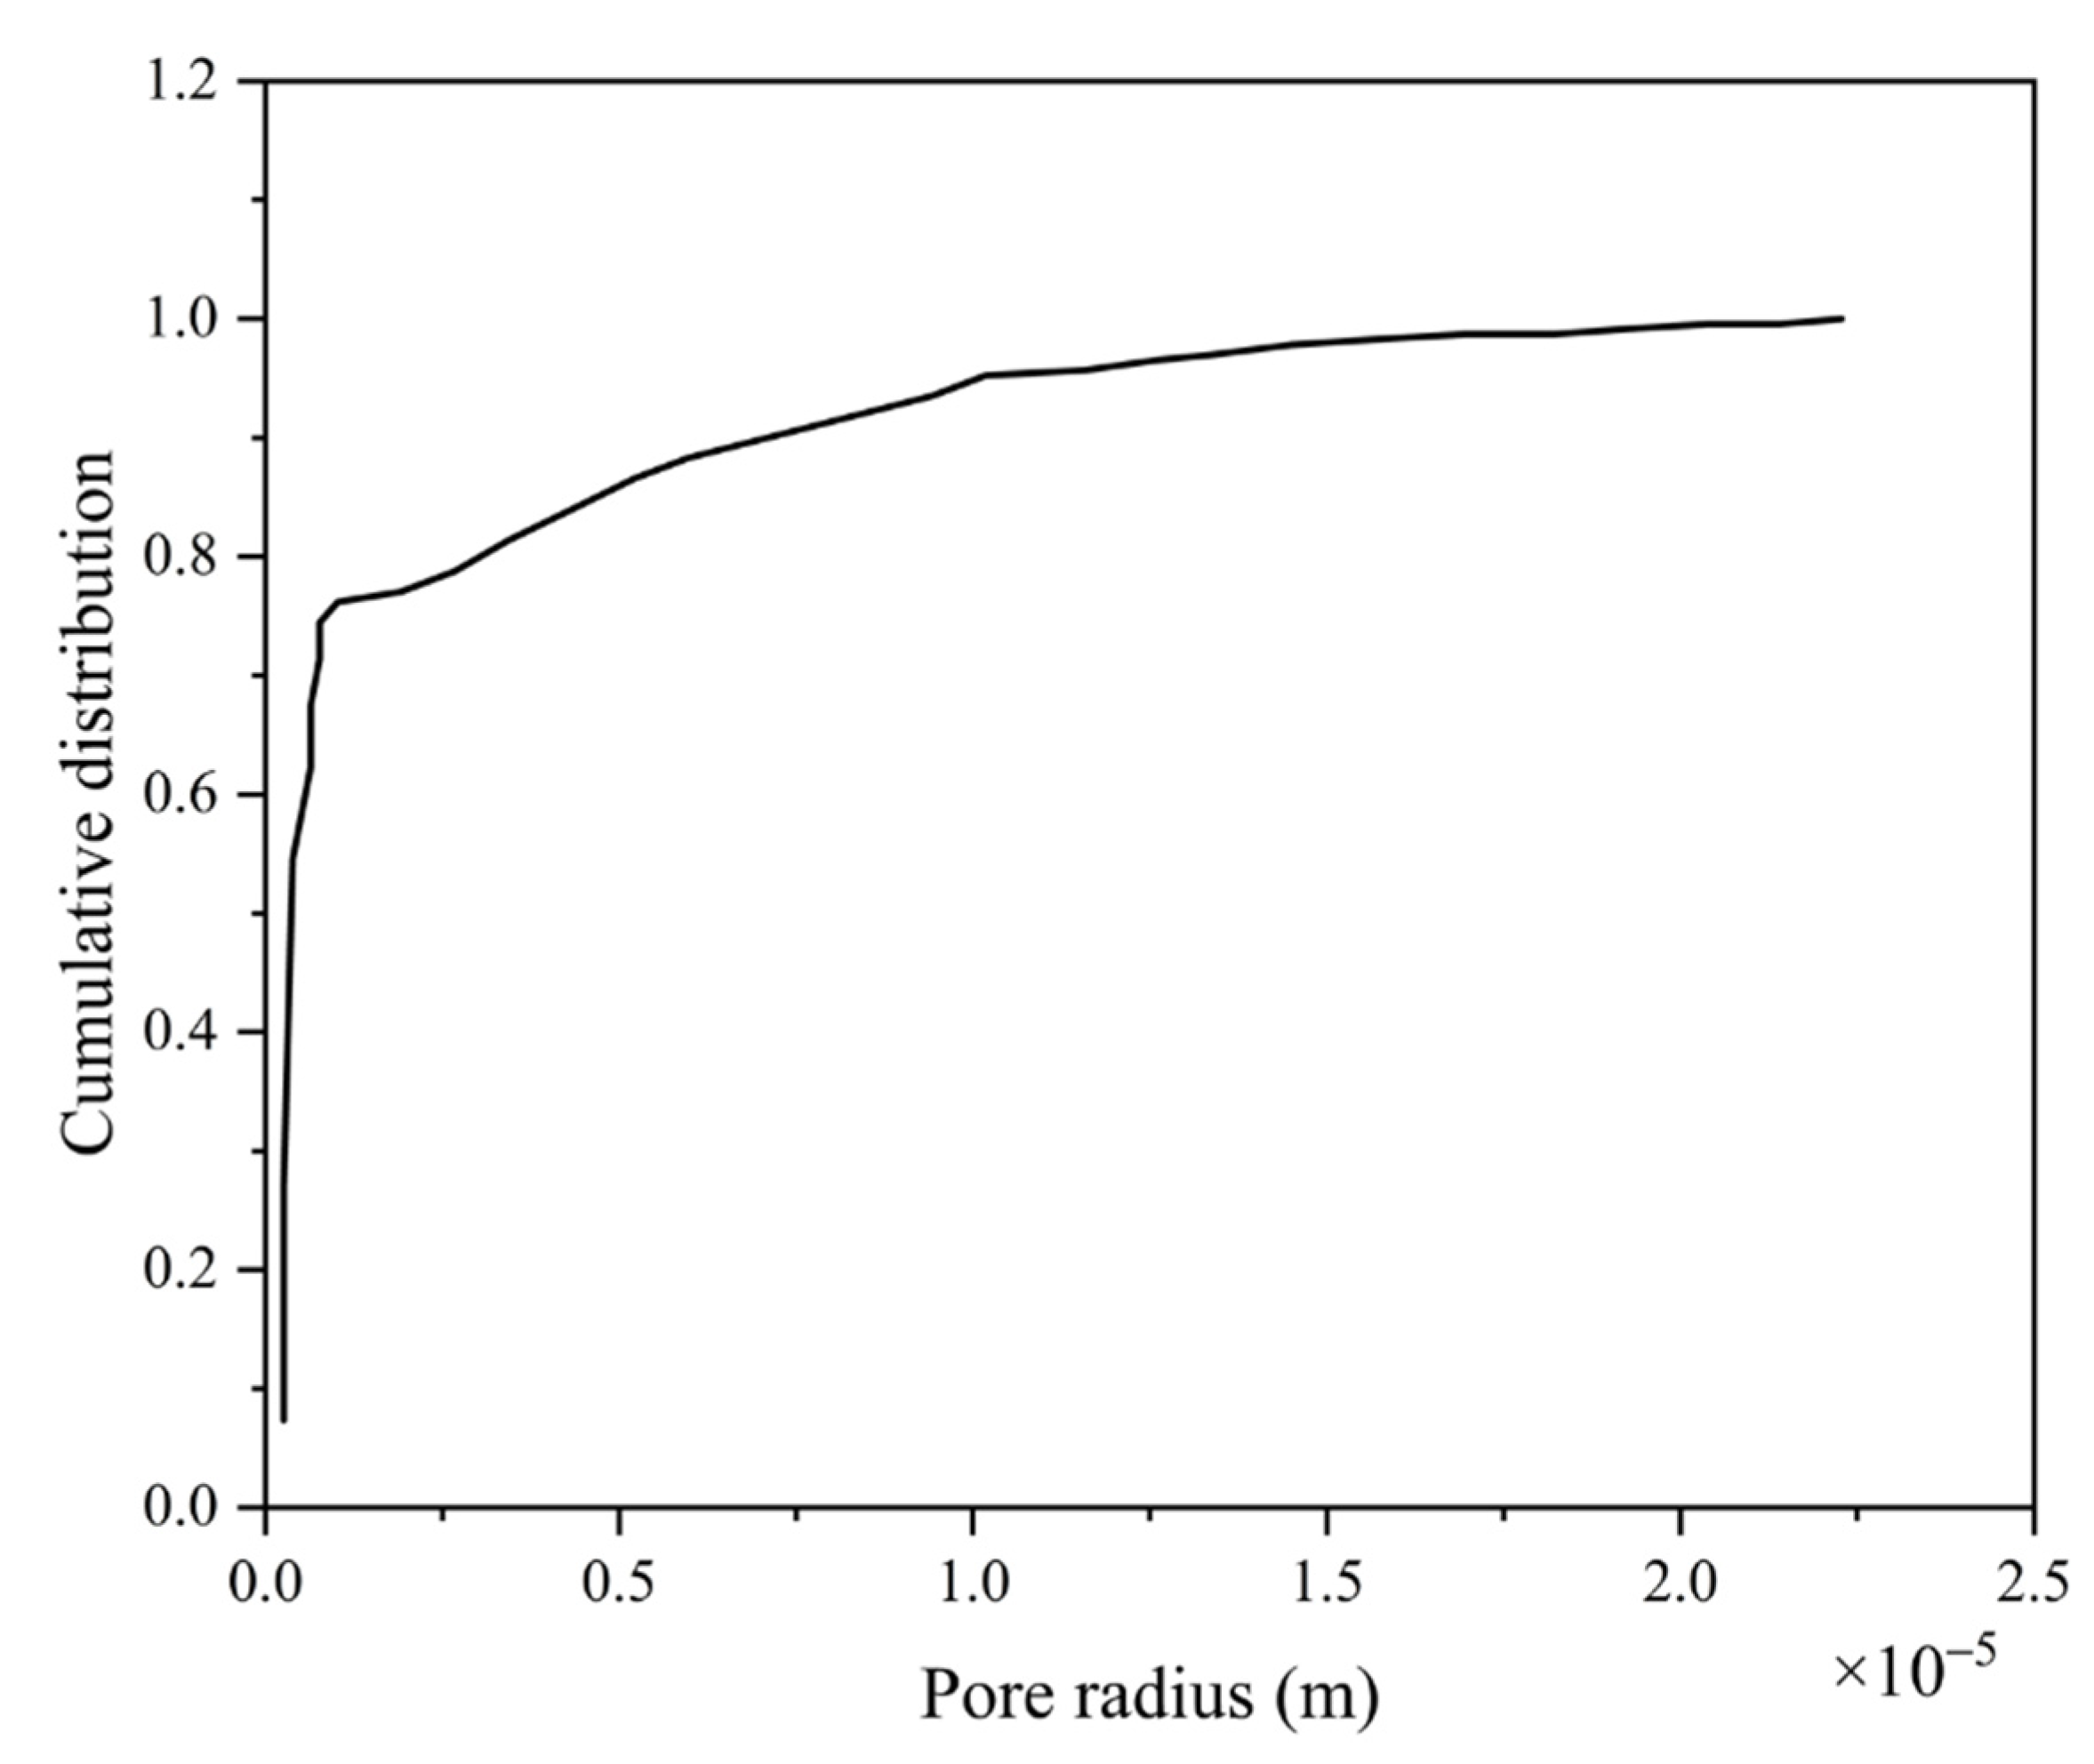
According to the core analysis of the Bonan oilfield, the product of the constant C, and the porosity and permeability, satisfy the fitting relationship. According to the conversion relationship between the capillary pressure and the pore radius, the pore radius distribution was obtained.
Figure 4 shows the cumulative probability distribution of the pore radius.
3.2.3. Extraction of the Coordination Number Distribution from the Cast-Thin Data
The coordination number distribution was extracted from the cast thin section. First, we binarized the slice image. Black represents the pores and white represents the skeleton. We discretized the binarized image, then the coordination number distribution was obtained by using the maximum ball method.
The maximum ball method adopts a clustering algorithm, and the pore space of a two-dimensional image can be fully represented by the maximum ball set. In order to analyze the topology of pore space, the largest ball needed to be fused into clusters. Firstly, for each pixel of the pore space, we searched the pixels around the point, then determined whether there were rock particles in the pixel. If there were no rock particles, we increased the search radius. When it came into contact with the rock particles, we determined the maximum ball corresponding to the pixel, and calculated the lower and upper limits of the maximum ball radius. Each pixel located in the pore space had a largest ball, but many of the largest balls were completely contained in other balls. These balls were redundant were, therefore, removed. According to the position of the center of the largest ball and the upper and lower limits of the radius, the repeated largest ball was cleared. In this way, different maximum ball clusters were formed. The size of the largest ball set was sorted. When two large balls connecting clusters were in contact, the smallest ball in contact was the throat. The two large pores were considered to be connected, and the coordination number of the two large balls was increased by one. After the cycle, the coordination number of the local largest ball (pore) was determined [
53]. The distribution of coordination numbers is shown in
Figure 5.
3.3. Construction of Complex Pore Structure of Digital Rock by Multi-Scale Fusion Method
Section 3.1 discussed the X-ray CT scanning digital rock, which can obtain digital rock with a large pore scale.
Section 3.2 mainly reflected on the size distribution and pore coordination, and the number of pores and throats of all cores through nuclear magnetic resonance, mercury injection, and cast-thin section experiments, which can build high-resolution digital rocks lower than CT scanning resolution, that is, digital rocks with a micro-pore scale. Multi-scale digital rock with complex pore structure was obtained by superimposing the large-scale digital rock with the small-scale digital rock.
To construct micro-scale digital rock, mercury injection and nuclear magnetic data were used to intercept the part with a pore-throat radius less than CT scanning resolution, as the input pore-throat parameters were generated by the random network. The selected cut-off value was related to CT scanning resolution; The pore coordination number distribution was obtained by using the cast-thin data as the input coordination number parameter generated by the random network. By comparing the digital rock porosity obtained by CT scanning with the experimental porosity, the size of the lost porosity of the digital rock scanned by CT was derived. The pore network topology was constructed by using the intercepted pore-throat radius distribution under the constraint of coordination number distribution; furthermore, the pores and throats whose radii were less than the resolution of digital rock were intercepted by using the cumulative probability distribution map of pore radius and cumulative probability distribution map of throat radius to generate the network model, and the network model was discretized into micro-pore digital rock. After discretization, the porosity of the micro-pore digital core was consistent with that lost by the CT scan.
Taking into account the limited operating capacity of the computer, for the Y288-10 digital rock with a resolution of 1.30 μm, we chose to increase the resolution by three times, that is, 0.433 μm. The part with a pore-throat radius smaller than 1.30 μm and larger than 0.433 μm, obtained by mercury injection and NMR, were taken as the input pore parameter generated by the random network. For Y288-10 digital rock intercepted a 200 × 200 × 200 digital rock area, the porosity of the digital rock was 6.06%. The resolution was increased to 0.433 um, and the size of the digital core became 600 × 600 × 600. The absolute permeability of core, calculated by lattice Boltzmann method, was 0 mD.
The digital rock model of 600 × 600 × 600 was constructed by using mercury injection, nuclear magnetic resonance, and cast-thin section data, with a resolution of 0.433 μm. The porosity was 0.22%, which was due to the loss of most of the micro-pores when the digital rock was constructed by the X-ray CT method. The microporous digital rock was superimposed with the CT scanned digital rock by voxel through the multi-scale fusion algorithm. Skeleton voxels are still skeleton voxels after superposition. In other superimposed cases, they were all pore voxels. After the superposition, a high-resolution 3D digital rock was generated.
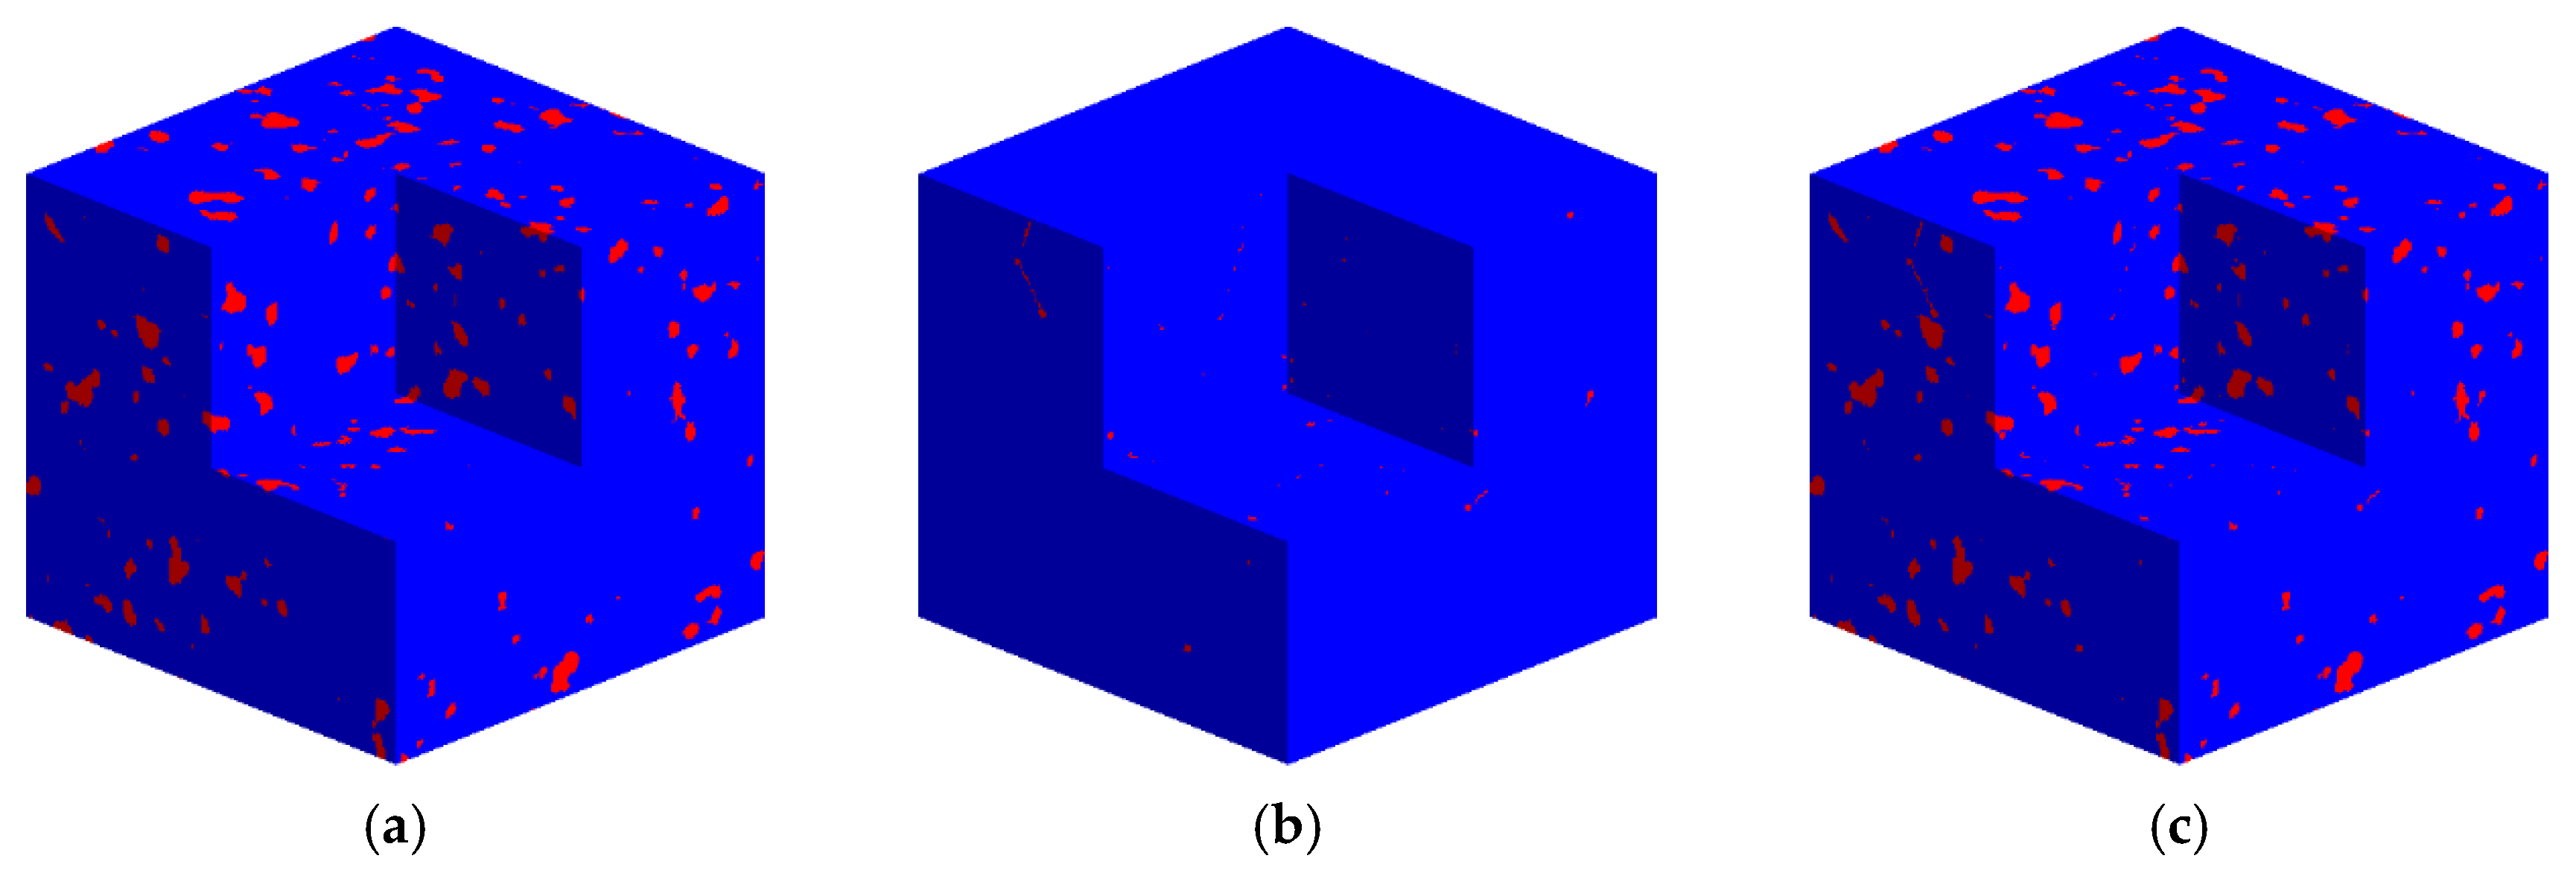
Figure 6a is the Y288-10 digital rock constructed by X-ray CT scanning, and
Figure 6b is the microporous digital rock constructed by mercury intrusion, nuclear magnetic resonance, and cast-thin section methods.
Figure 6c is a high-resolution 3D digital rock with a complex pore structure constructed by stacking the CT scanning digital rock and micro-pore digital rock obtained in the first two steps. The digital rock porosity obtained by superposition is 6.27%, which is closer to the experimental porosity of the Y288-10 core of 6.40%, with a relative error of 2.03%. The absolute permeability of the high-resolution digital rock, obtained by lattice Boltzmann calculation superposition, is 0.06 mD, and the experimental permeability of core Y288-10 is 0.05 mD; therefore, the calculated results are in good agreement with the experimental results. The high-resolution digital rock constructed by the combination of micron CT scanning and mercury injection, NMR has greatly improved porosity and permeability, which are closer to the experimental results, and which verify the feasibility of this innovative method.
3.4. Verification of Digital Rock with Complex Pore Structure
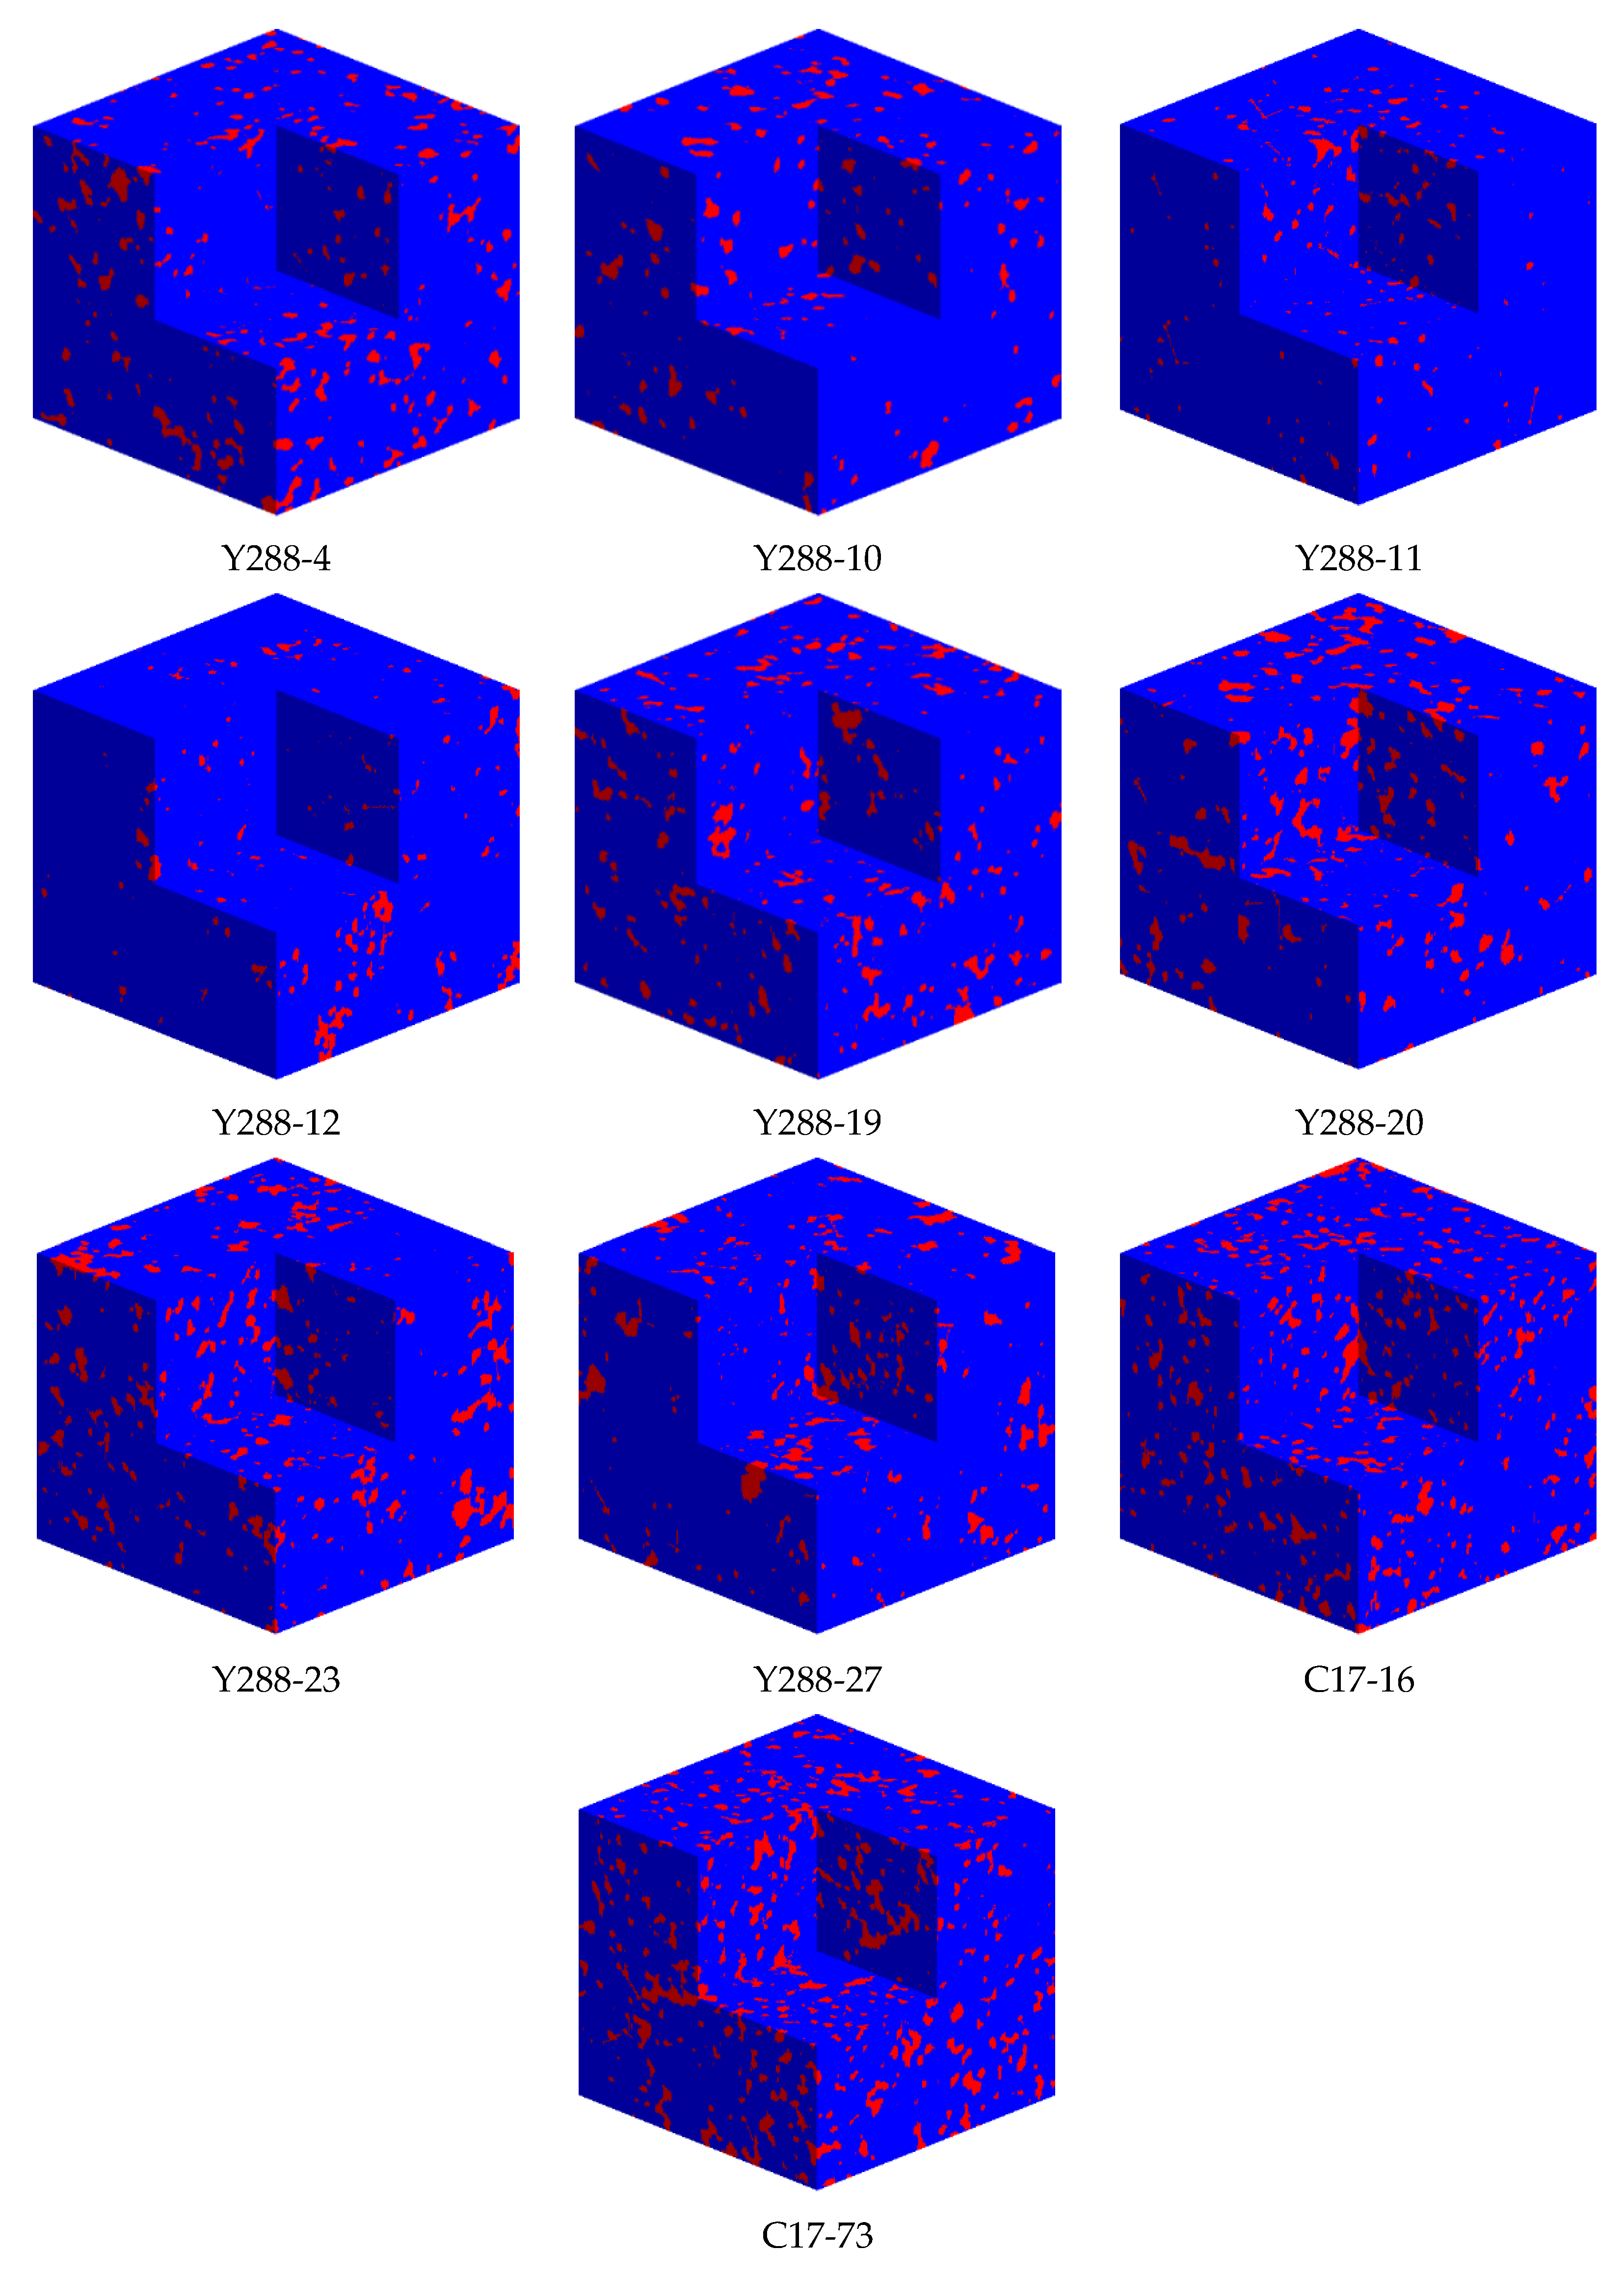
In order to verify the accuracy and versatility of this method, 10 tight sandstones were scanned by X-ray CT, including Y288-4, Y288-10, Y288-11, Y288-12, Y288-19, Y288-20, Y288-23, Y288-27, C17-16, and C17-73. A multi-scale three-dimensional digital rock was constructed by using the digital core construction method with a complex pore structure. The digital rocks with complex pore structure are shown in
Figure 7.
The comparison between digital rock with complex pore structure and experimental values are exhibited in
Table 1. The value of the new method was obtained by superimposing micro-pores on digital rock scanned by CT, and a small number of pores overlapped in the three-dimensional space.
It can be seen from
Table 1 that the error between the parameters calculated by constructed digital rock and the experimental measurement results is less than 8%, and the average error is 2.61%, indicating that the digital rock construction method under complex pore conditions is reliable.
4. Analysis of Micro-Pore Structure of Tight Sandstone
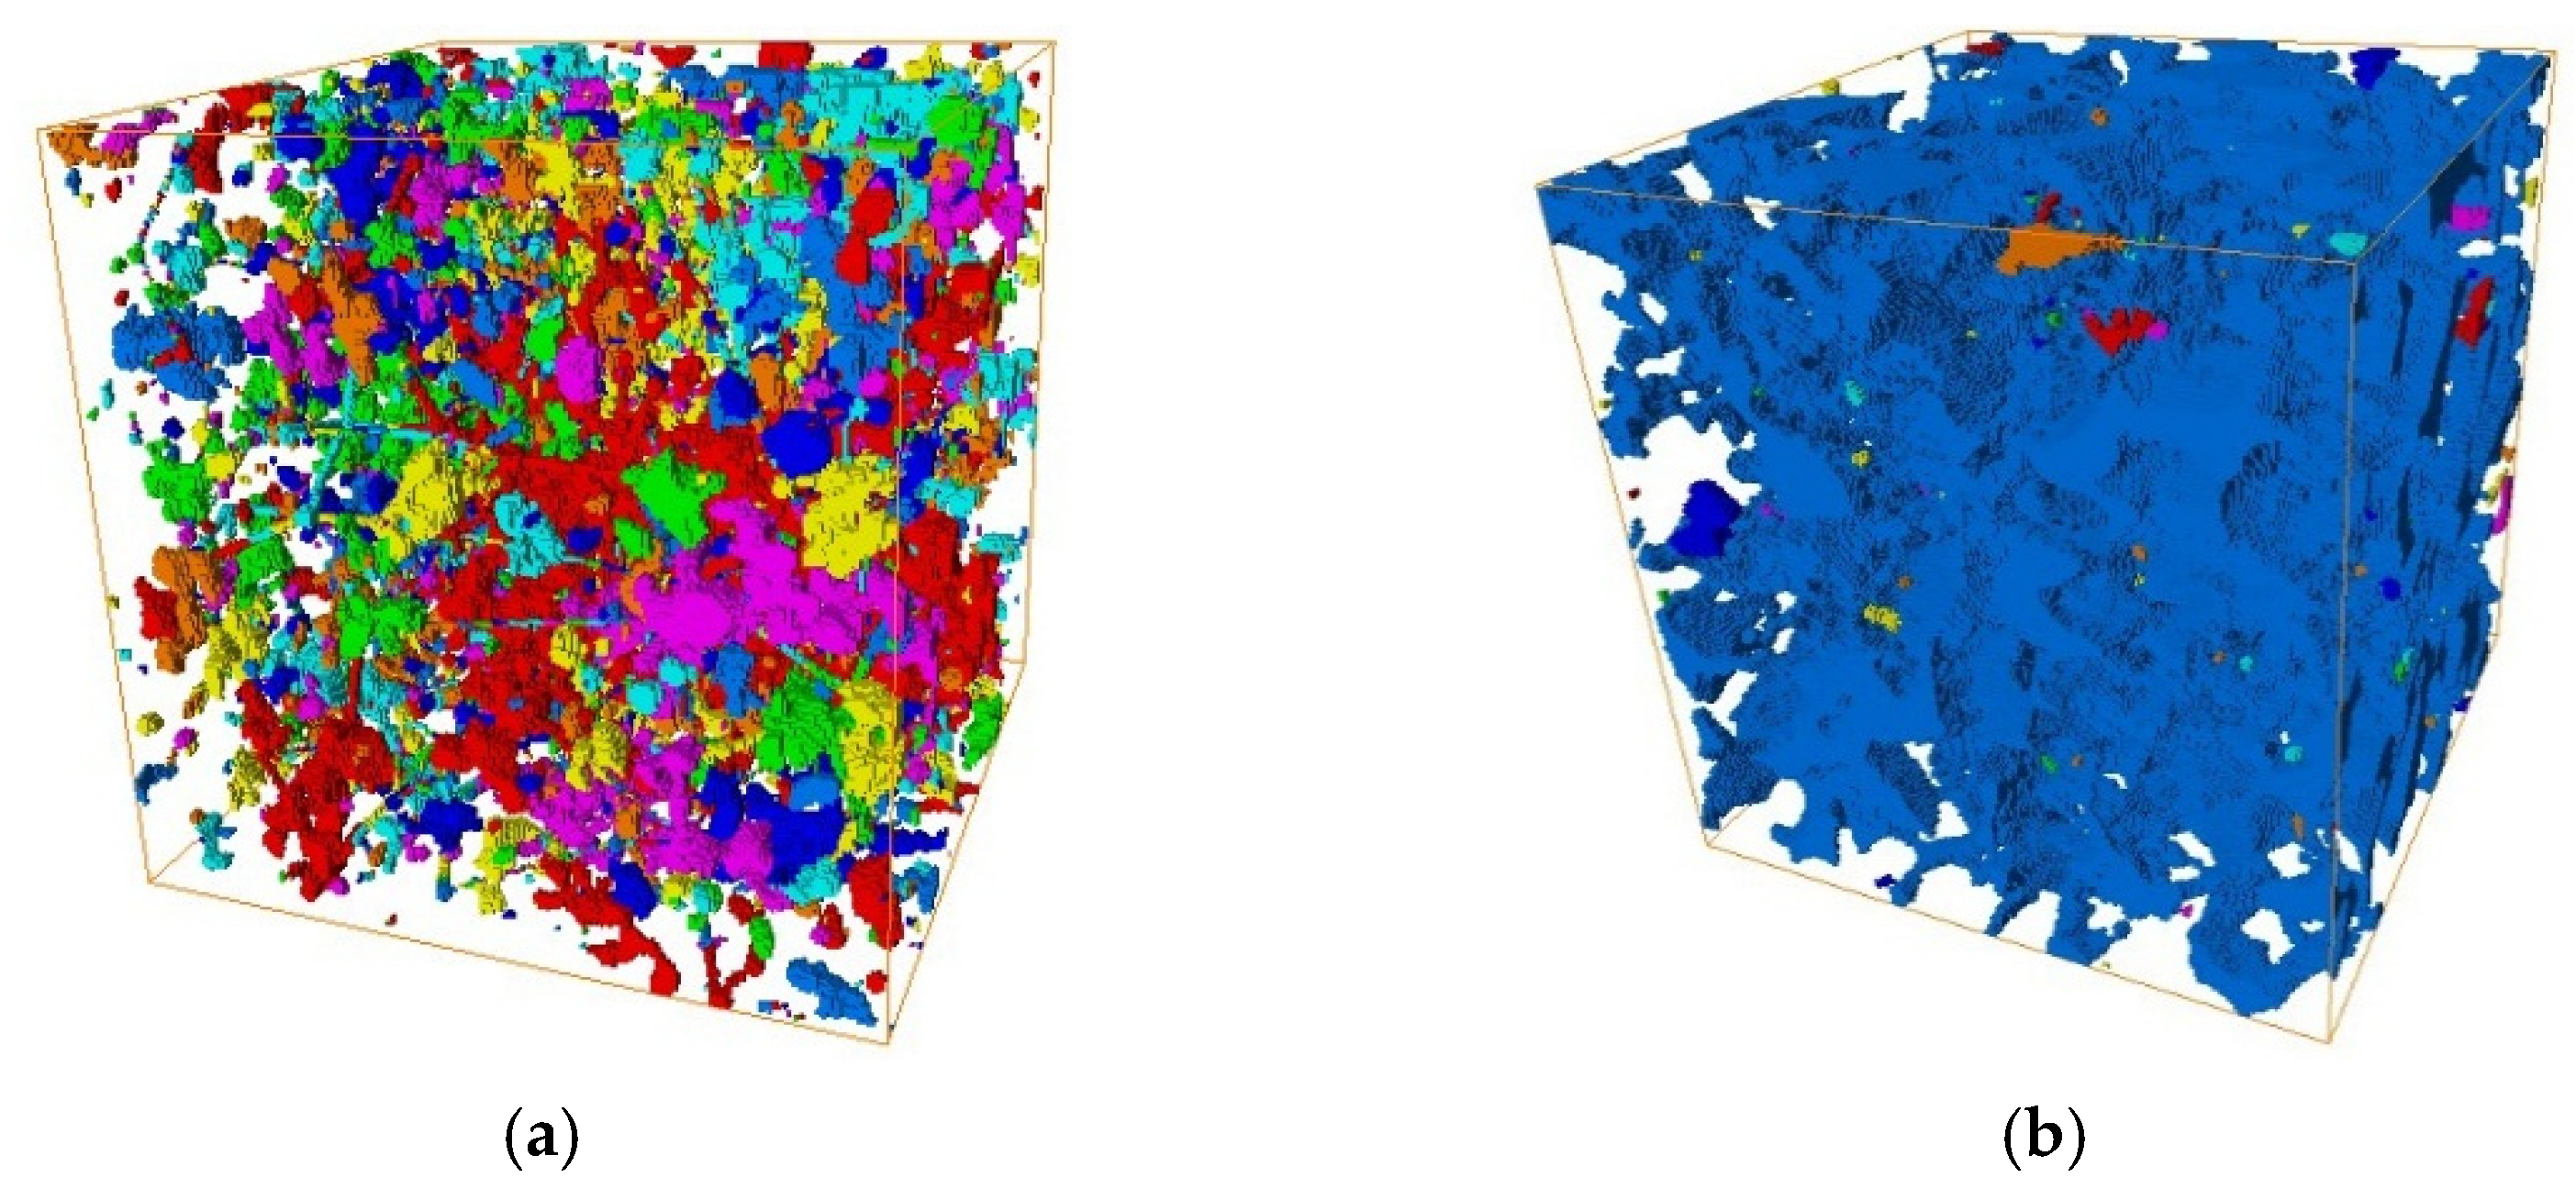
The microstructure characteristics of tight sandstone and homogeneous high porosity and high permeability sandstone are quite different. Generally speaking, the pore throat of tight sandstone is unevenly distributed, with low porosity and low permeability. In this study, the digital rock Y288-19 of tight sandstone with a complex pore structure fused in multi-scale (
Figure 8a) was compared with Berea sandstone, a natural sandstone recognized by the academic community (
Figure 8b), to analyze the microstructure differences between tight sandstone and homogeneous sandstone.
Figure 8 shows the pore spatial distribution of different digital rocks. Different colors represent the connectivity of different pores. The more colors, the worse the connectivity, and the fewer colors, the better the connectivity of the pores. It can be seen from the figure that the pore connectivity of tight sandstone Y288-19 is very poor compared with Berea sandstone.
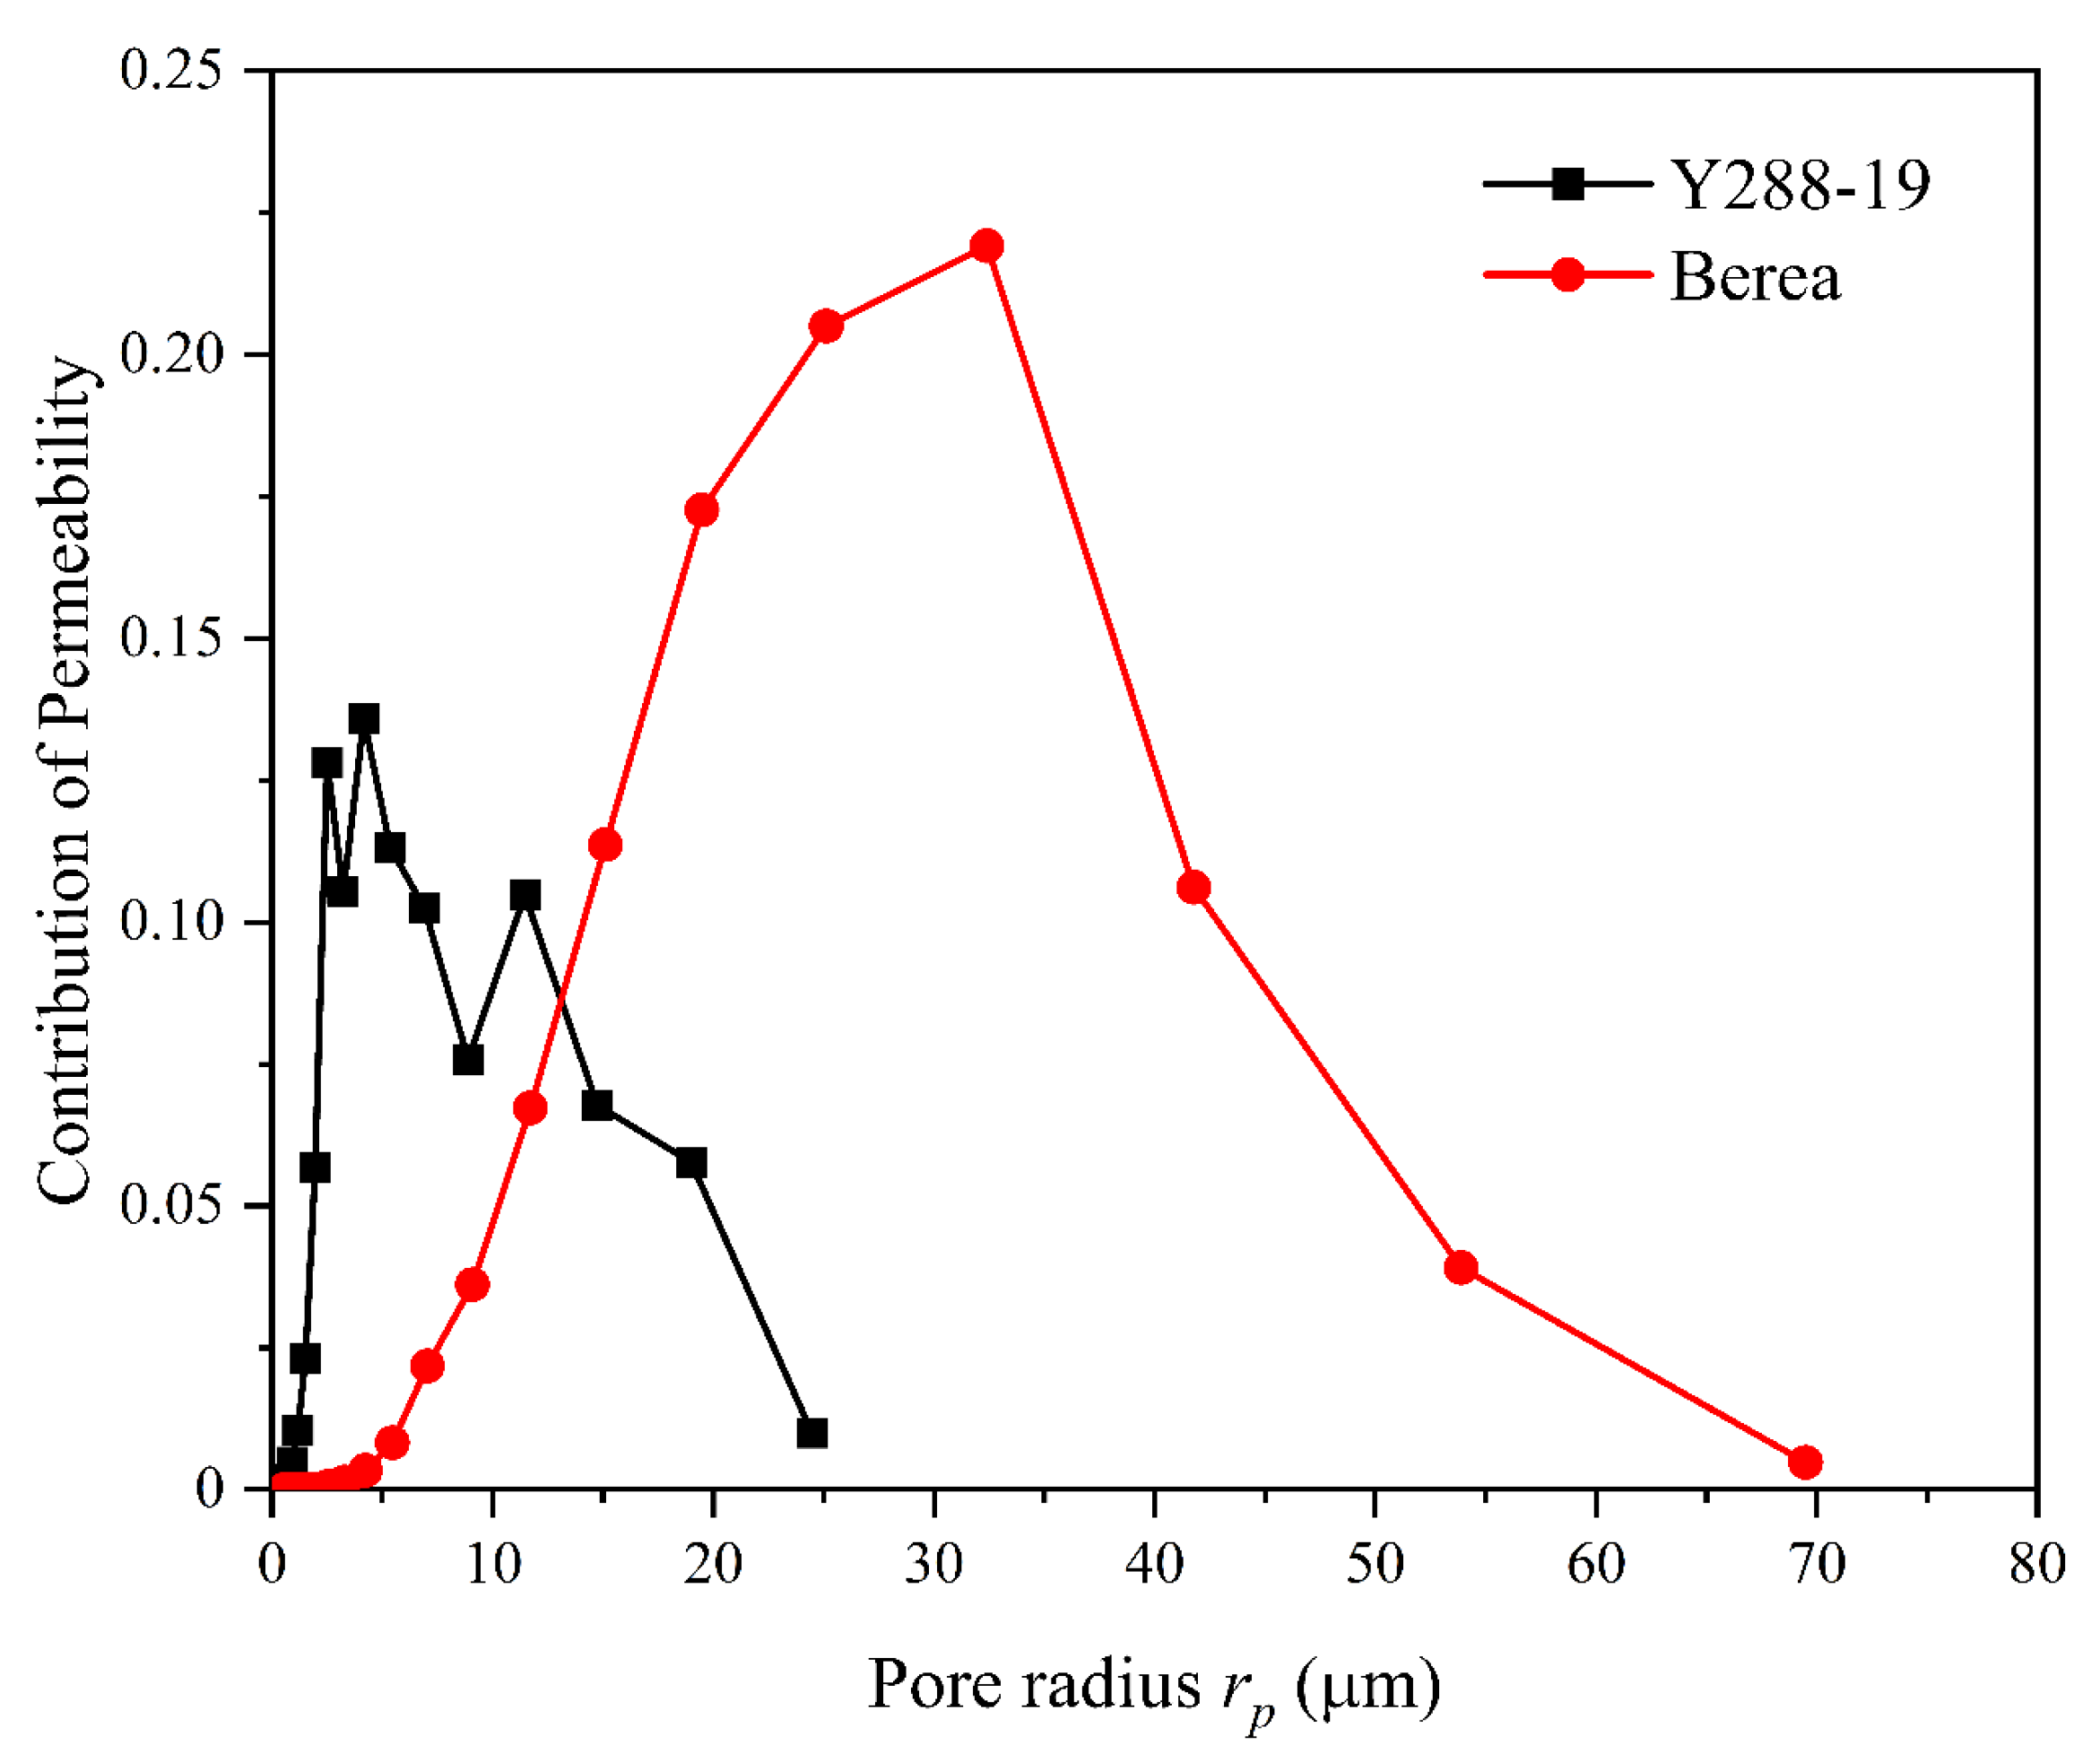
According to the CT scanned digital rock, the probability of pore radius is counted according to the logarithmic interval, and the pore radius distribution of the core can be obtained. According to the pore radius distribution, the permeability contribution curve could be expressed by Equation (6) [
54]:
where: Δ
Kj,
rj, and
αj are the permeability contribution value, pore or throat radius value and frequency of the
jth interval. The pore radius corresponding to the maximum permeability contribution was selected as the characteristic value of each core pore radius.
It can be seen from
Figure 9 that, compared with homogeneous sandstone Berea, the pore radius distribution of tight sandstone is concentrated in small pores, the overall pore radius is small, and the characteristic value of the pore radius is small. In contrast, the pore radius distribution of Berea in homogeneous sandstone is concentrated in medium pores, and the characteristic value of pore radius is large. This also reflects that the total porosity of tight sandstone is generally low. Similarly, the throat radius distribution and absolute permeability contribution curve of the two types of cores can be obtained.
As can be seen from
Figure 10, compared with homogeneous sandstone Berea, the throat radius distribution of tight sandstone is concentrated in small pores, and the overall throat radius is small, and the characteristic value of the throat radius is small. The radius distribution of the Berea throat of homogeneous sandstone is concentrated in medium pores, and the characteristic value of the pore throat is large. As the throat size is the key factor in controlling fluid flow, the small throat radius of tight sandstone reflects the low-permeability characteristics of tight sandstone [
55].
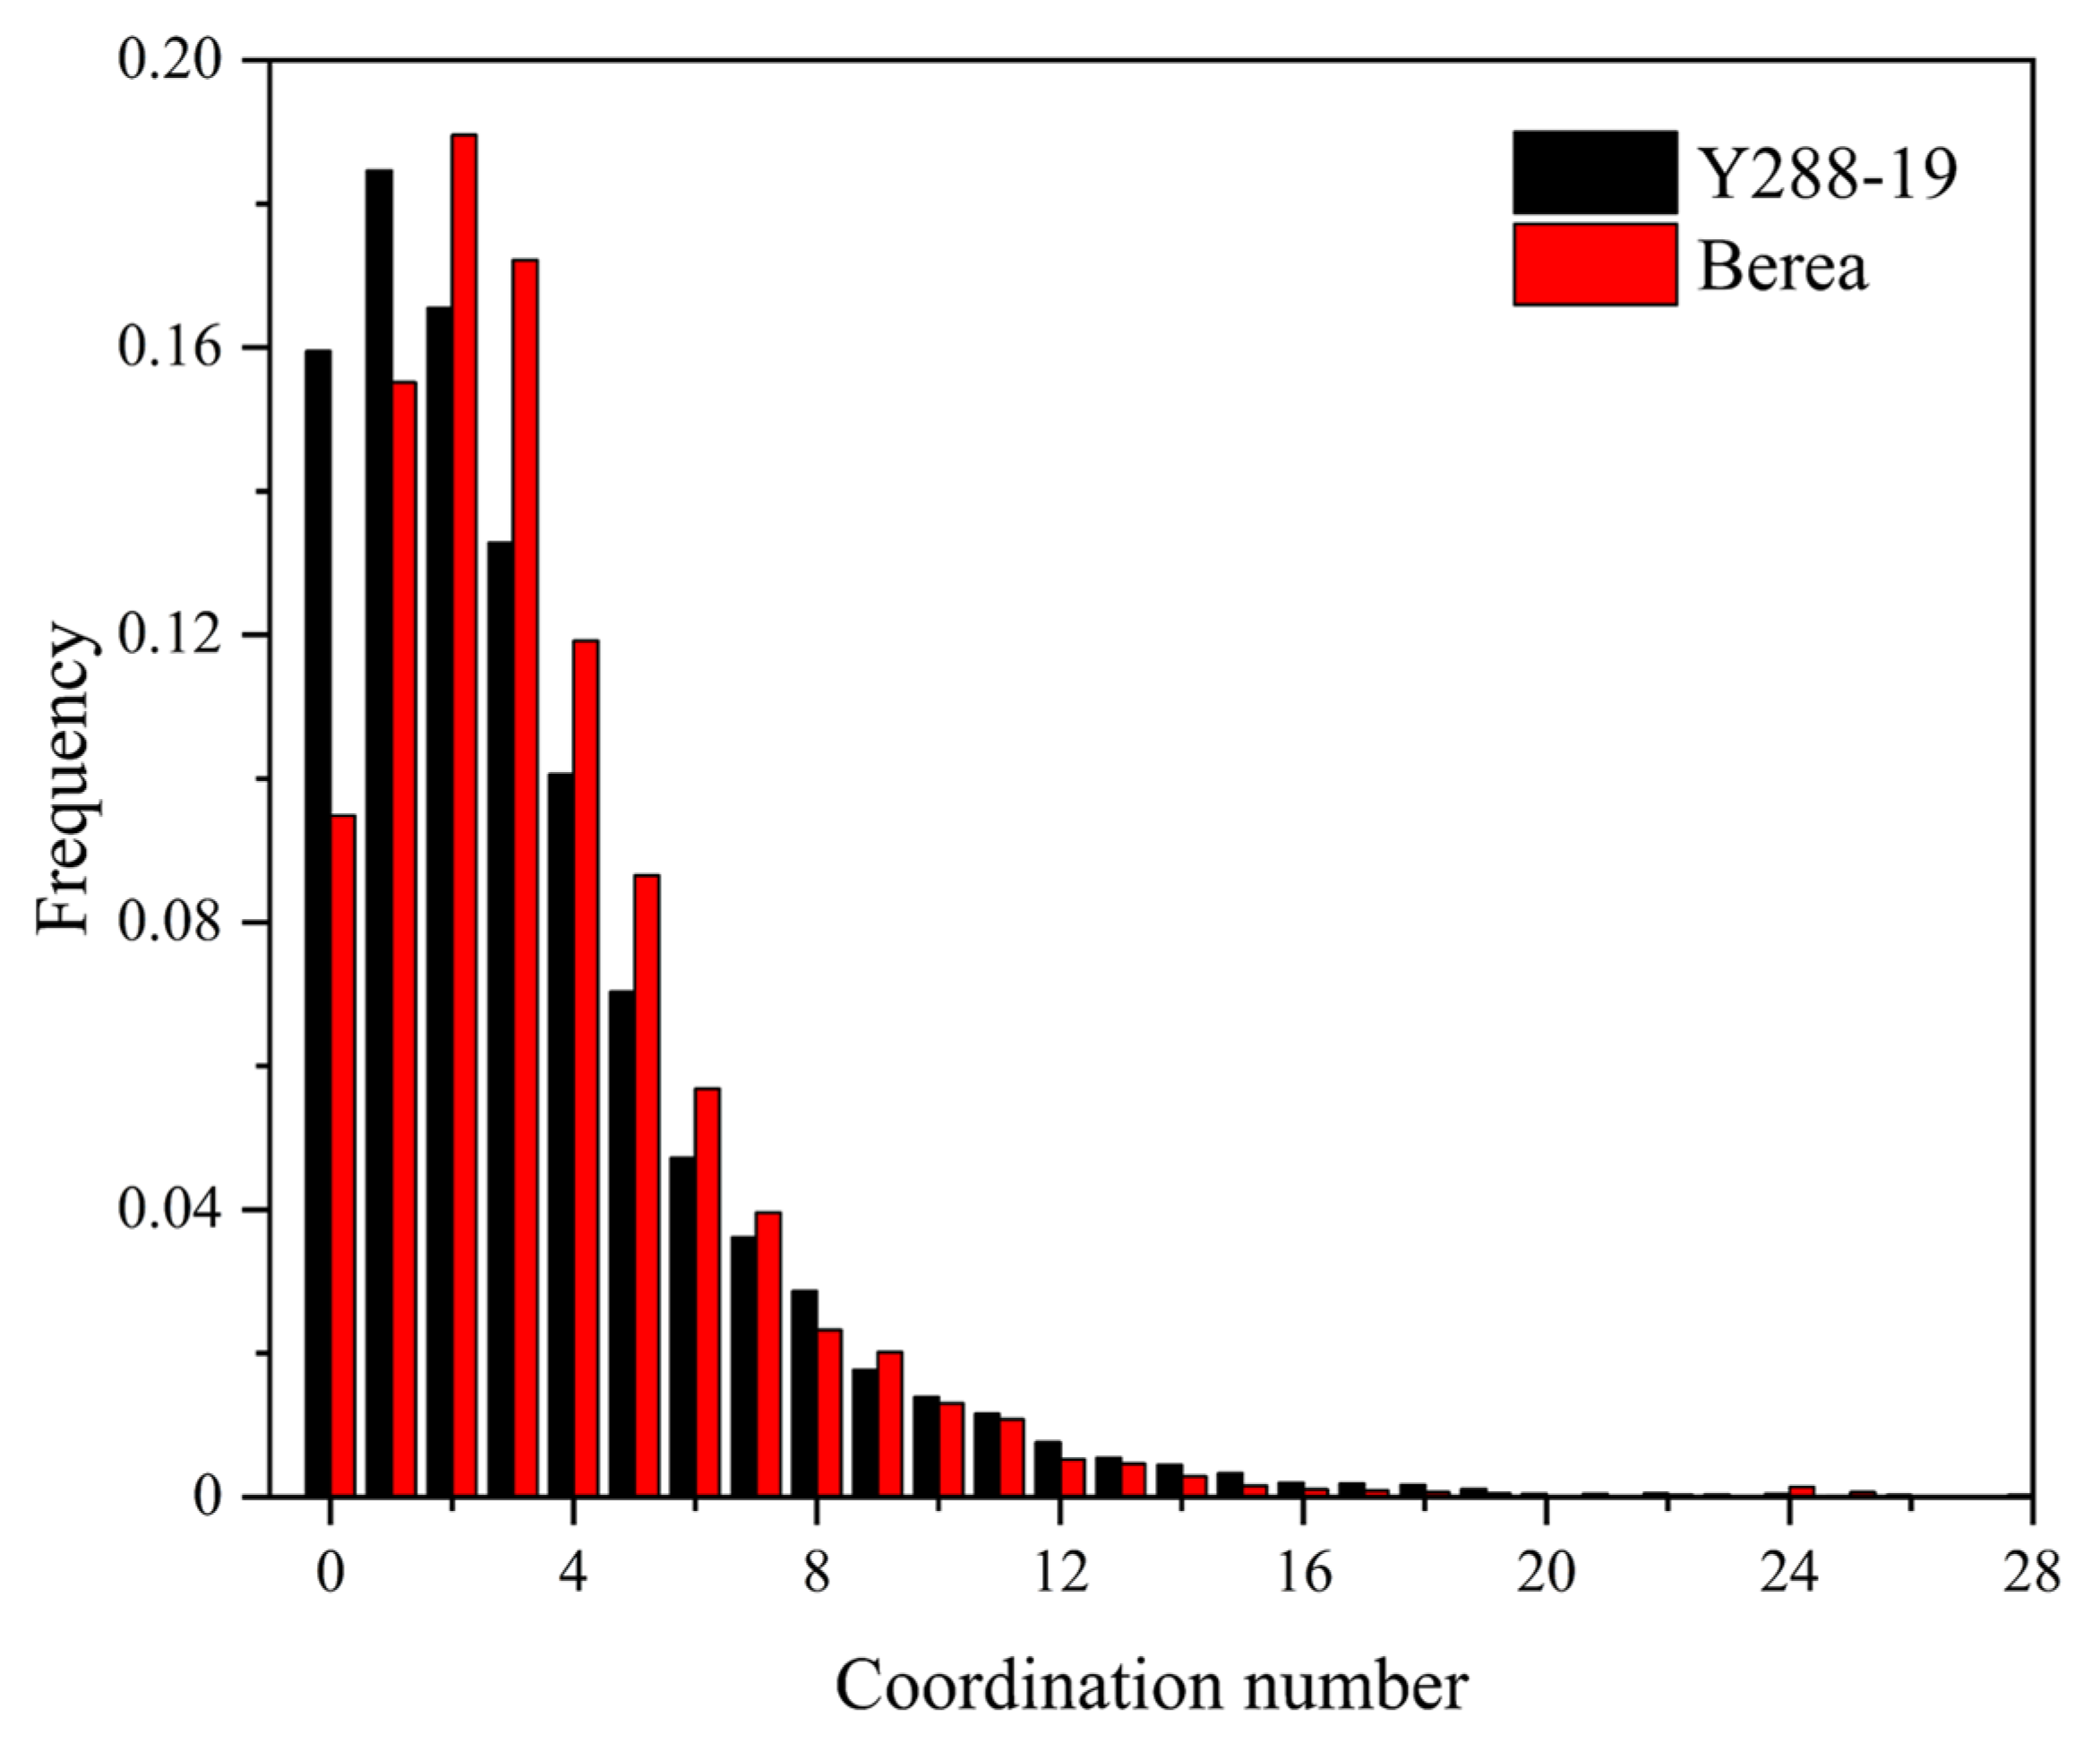
The connectivity between rock pores has a significant impact on the oil–water displacement process, micro-distribution and current flow. At the microscopic level, the coordination number is used to describe the connectivity between pores. The larger the coordination number, the better the connectivity between rock pores [
56]. Based on the statistical coordination number distribution of digital rocks, the coordination number distribution of each core is shown in
Figure 11. The average coordination number is calculated by the Equation (7):
where,
Ca represents the average coordination number, dimensionless;
n represents the coordination number, dimensionless;
αn represents the frequency of pores with coordination number n in the total number of pores, dimensionless.
It can be seen from
Figure 11 that the overall coordination number of tight sandstone Y288-19 is significantly smaller than that of homogeneous sandstone Berea, indicating that the pore connectivity of tight sandstone is poor, which is also an important reason for the low permeability of tight sandstone.
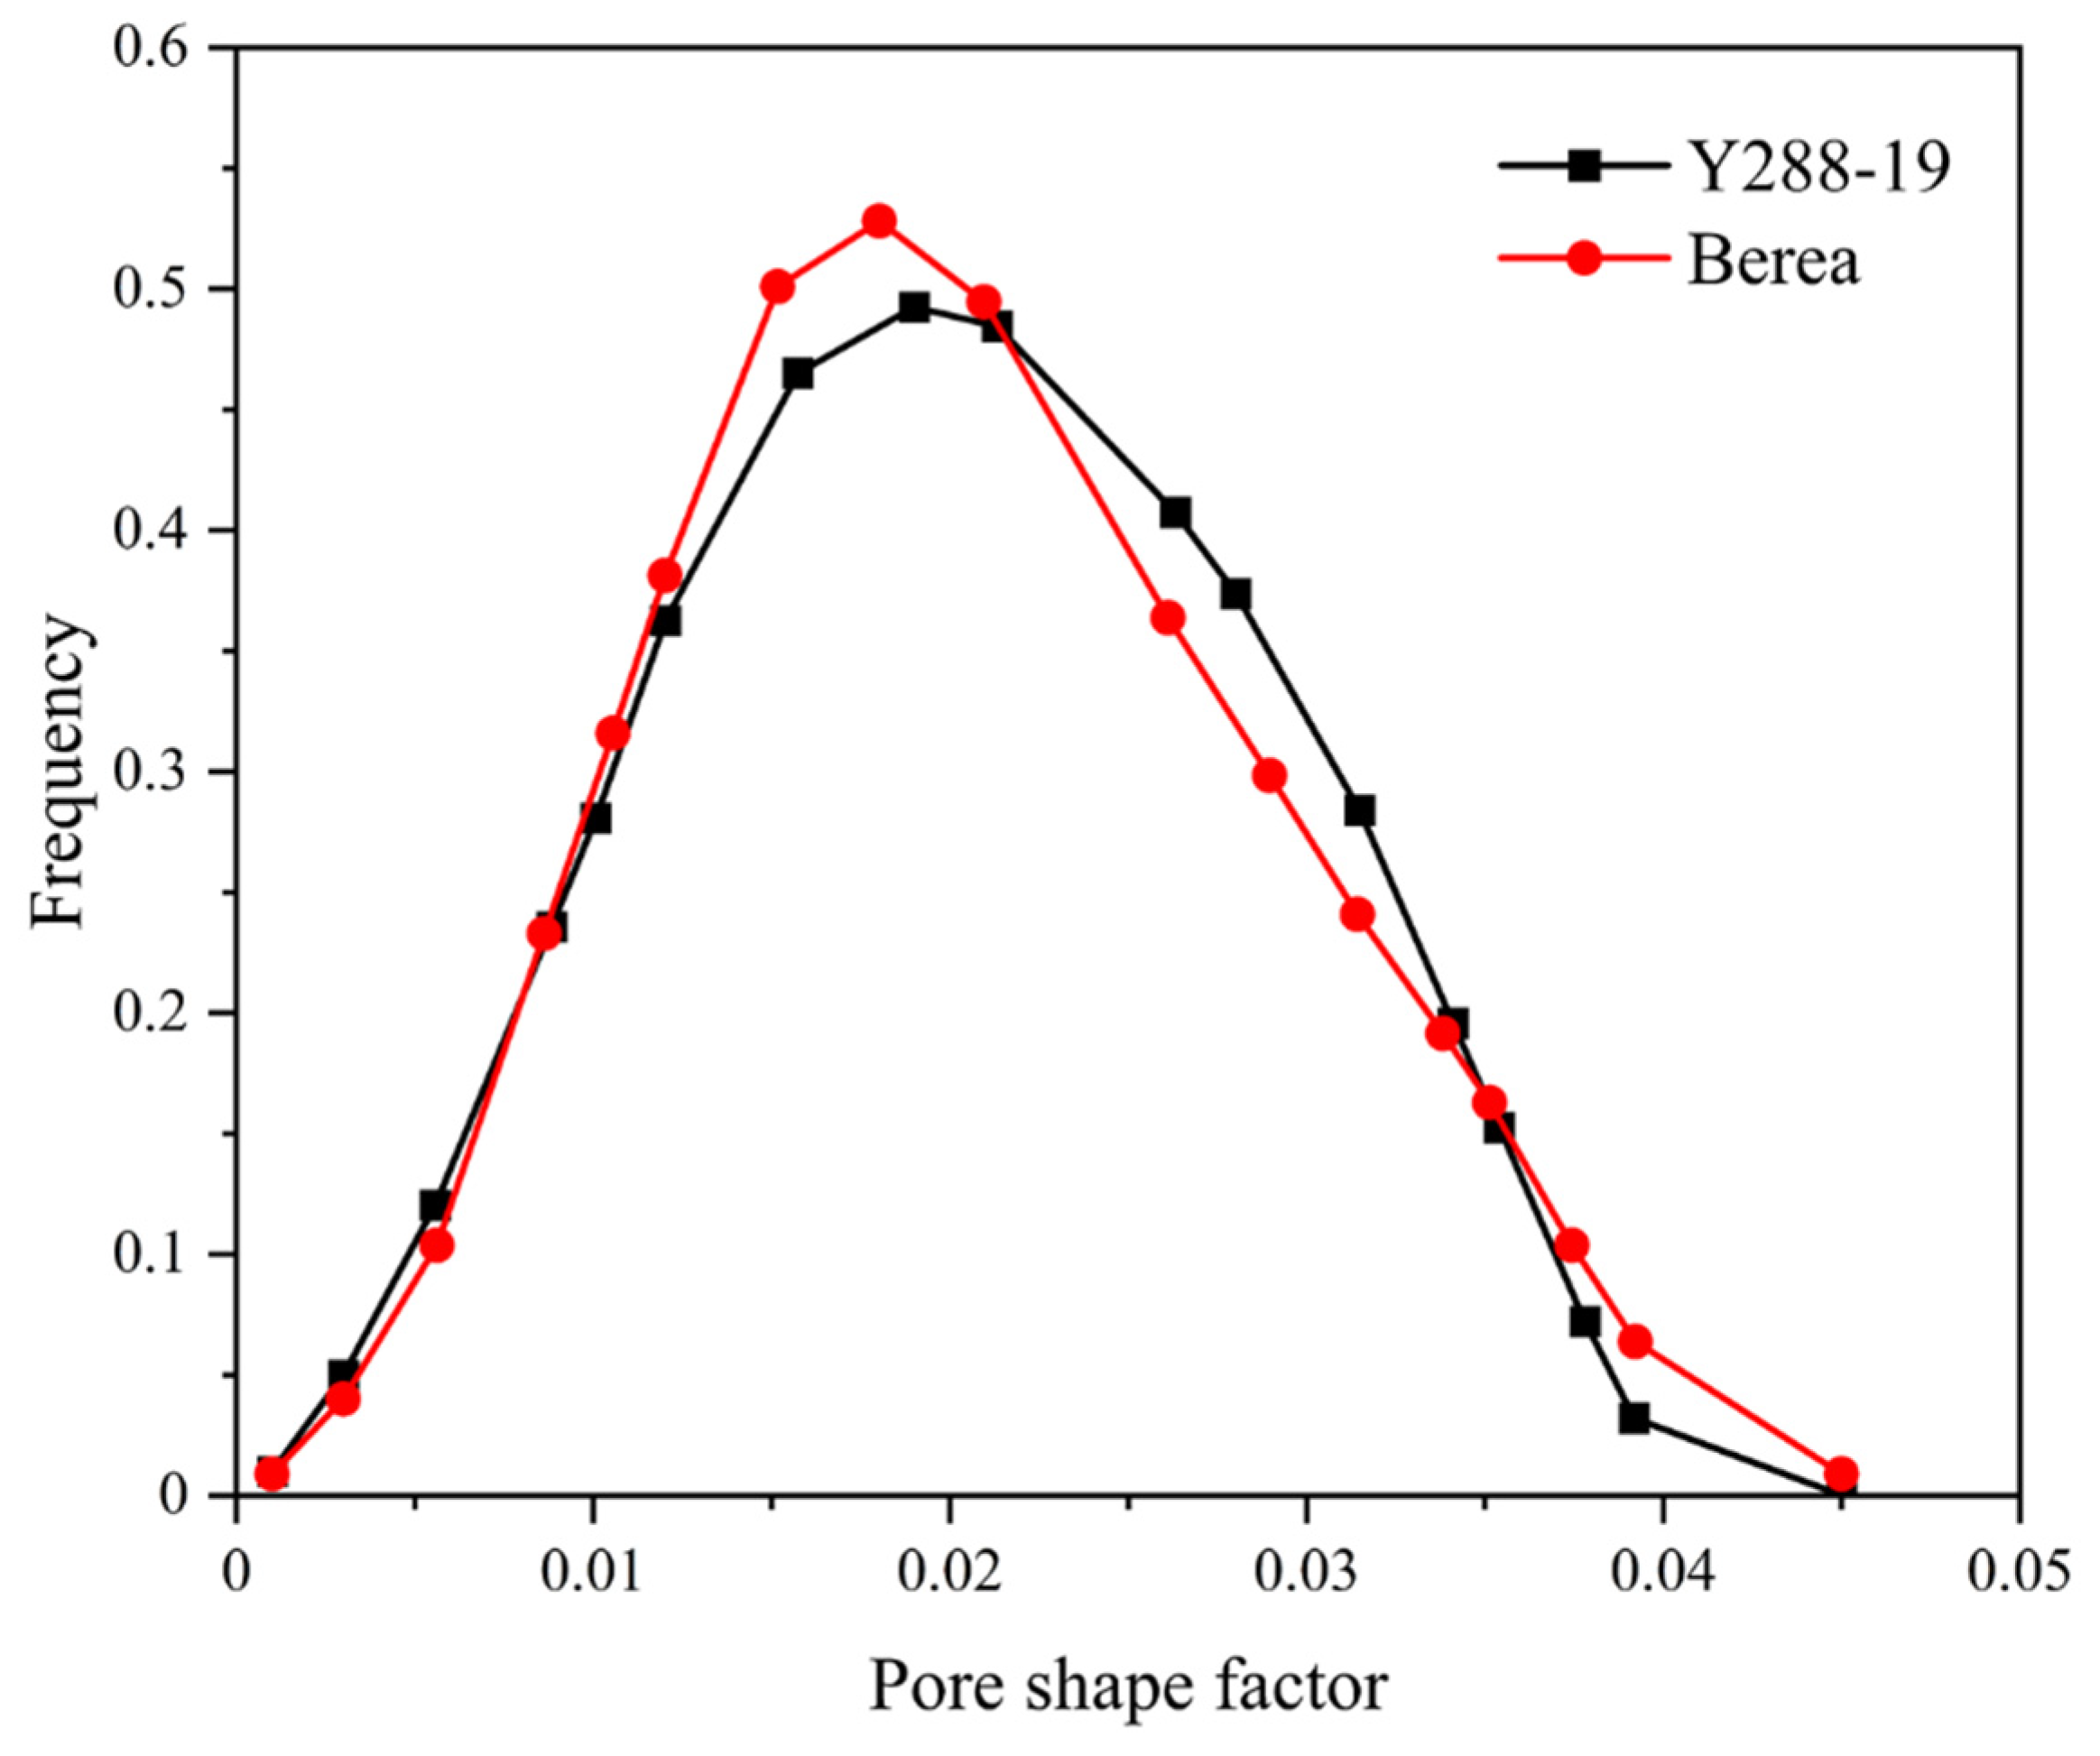
The shape of the pores and throats has a major influence on the simulation of multiphase flow. In order to use regular geometry to represent complex pore or throat shape, it is necessary to quantitatively characterize the pores and throats of the real core, so the shape factor is introduced. The shape factor
G is defined as:
where,
A is the cross-sectional area of the pore and
P is the perimeter of the cross-section.
In the process of constructing digital rock, a regular geometric body with a shape factor equal to that of a real pore or throat is utilized to represent pore or throat. The cross-sections of regular geometry are generally square, circular and triangular. Although the shapes of complex and irregular pores and throats in regular geometry are far from those in real cores, they have important geometric characteristics of pore space in real cores. In addition, because regular geometry with a triangular and square cross section has a corner structure, two-phase or multiphase fluid can flow in the same pore element or throat element as the pore network model. For example, the wetting phase can flow at the corner rather than at the center of the regular geometry, which is closer to the flow observed in the real core two-phase or multiphase flow experiment [
57].
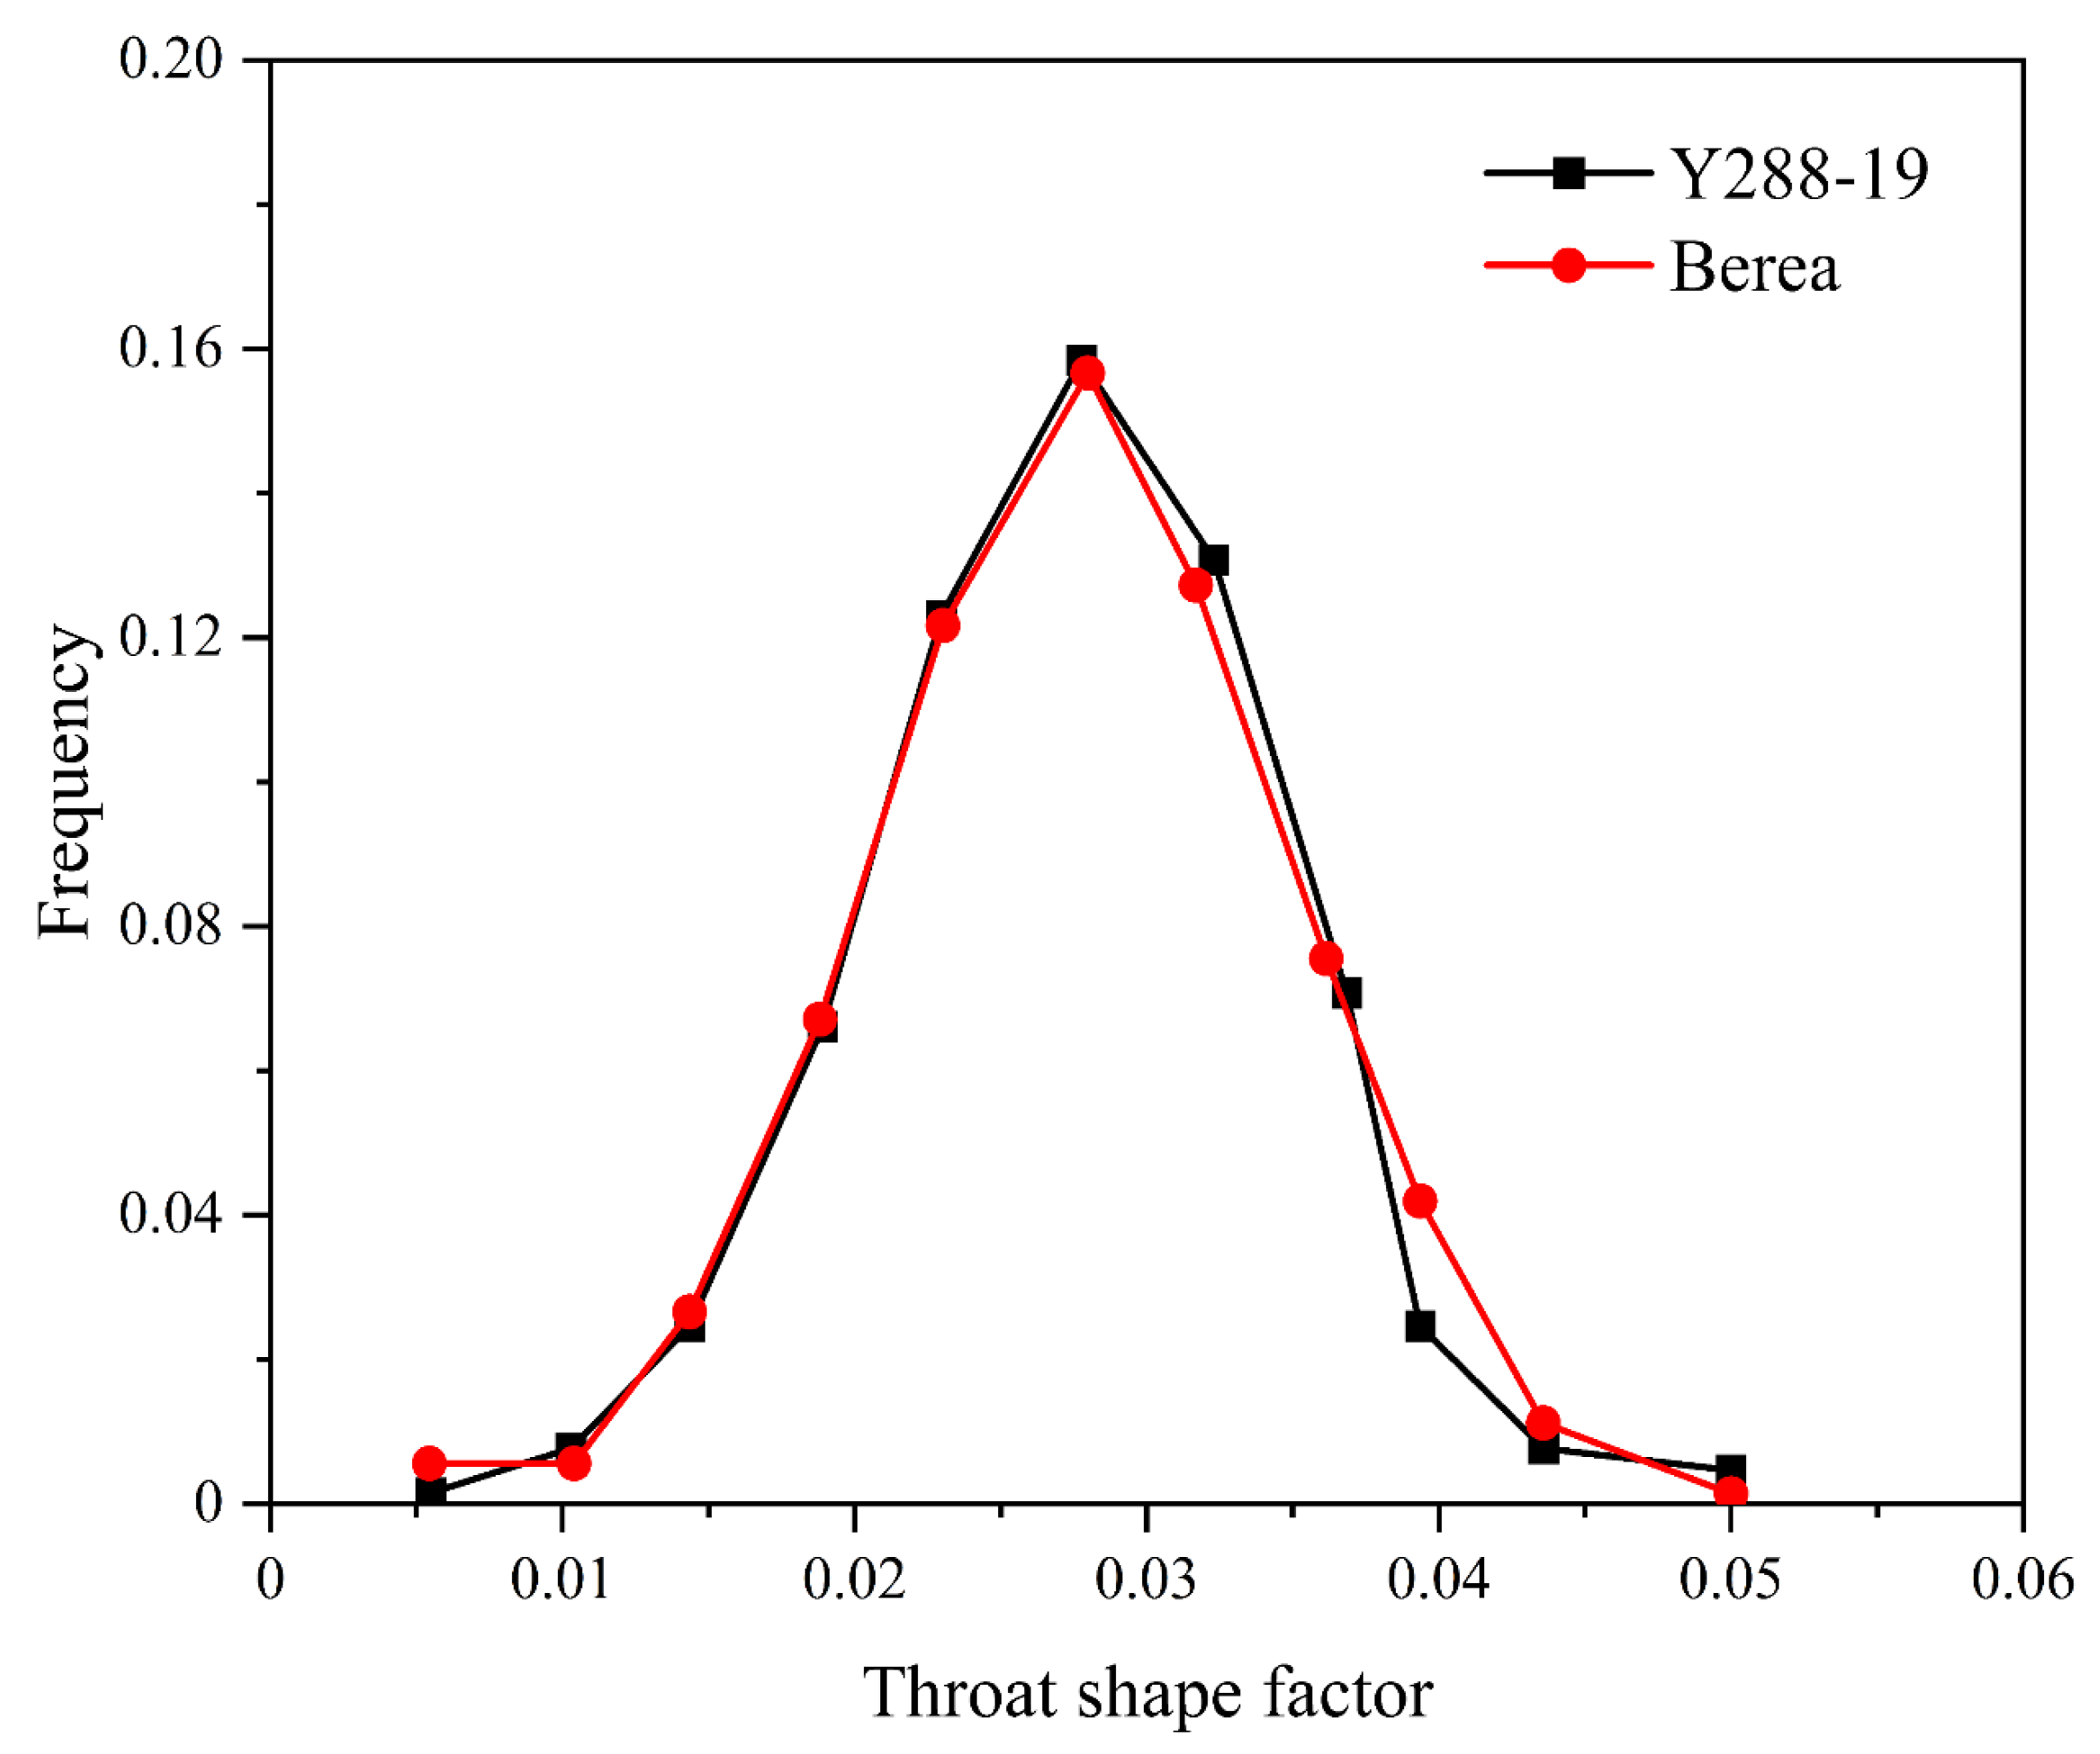
It can be seen from
Figure 12 and
Figure 13 that the shape factor of tight sandstone Y288-19 is slightly smaller than that of homogeneous sandstone Berea, but it is basically the same. It indicates that the roundness of the pore-throat shape of tight sandstone is slightly worse than that of homogeneous sandstone. In general, the pore-throat shape of tight sandstone has a negligible influence on the electrical characteristics and seepage characteristics of rock compared with homogeneous sandstone Berea. The resistivity index under different water saturations was calculated by the finite-element method; then, the electrical property difference between tight sandstone Y288-19 and homogeneous sandstone Berea was studied.
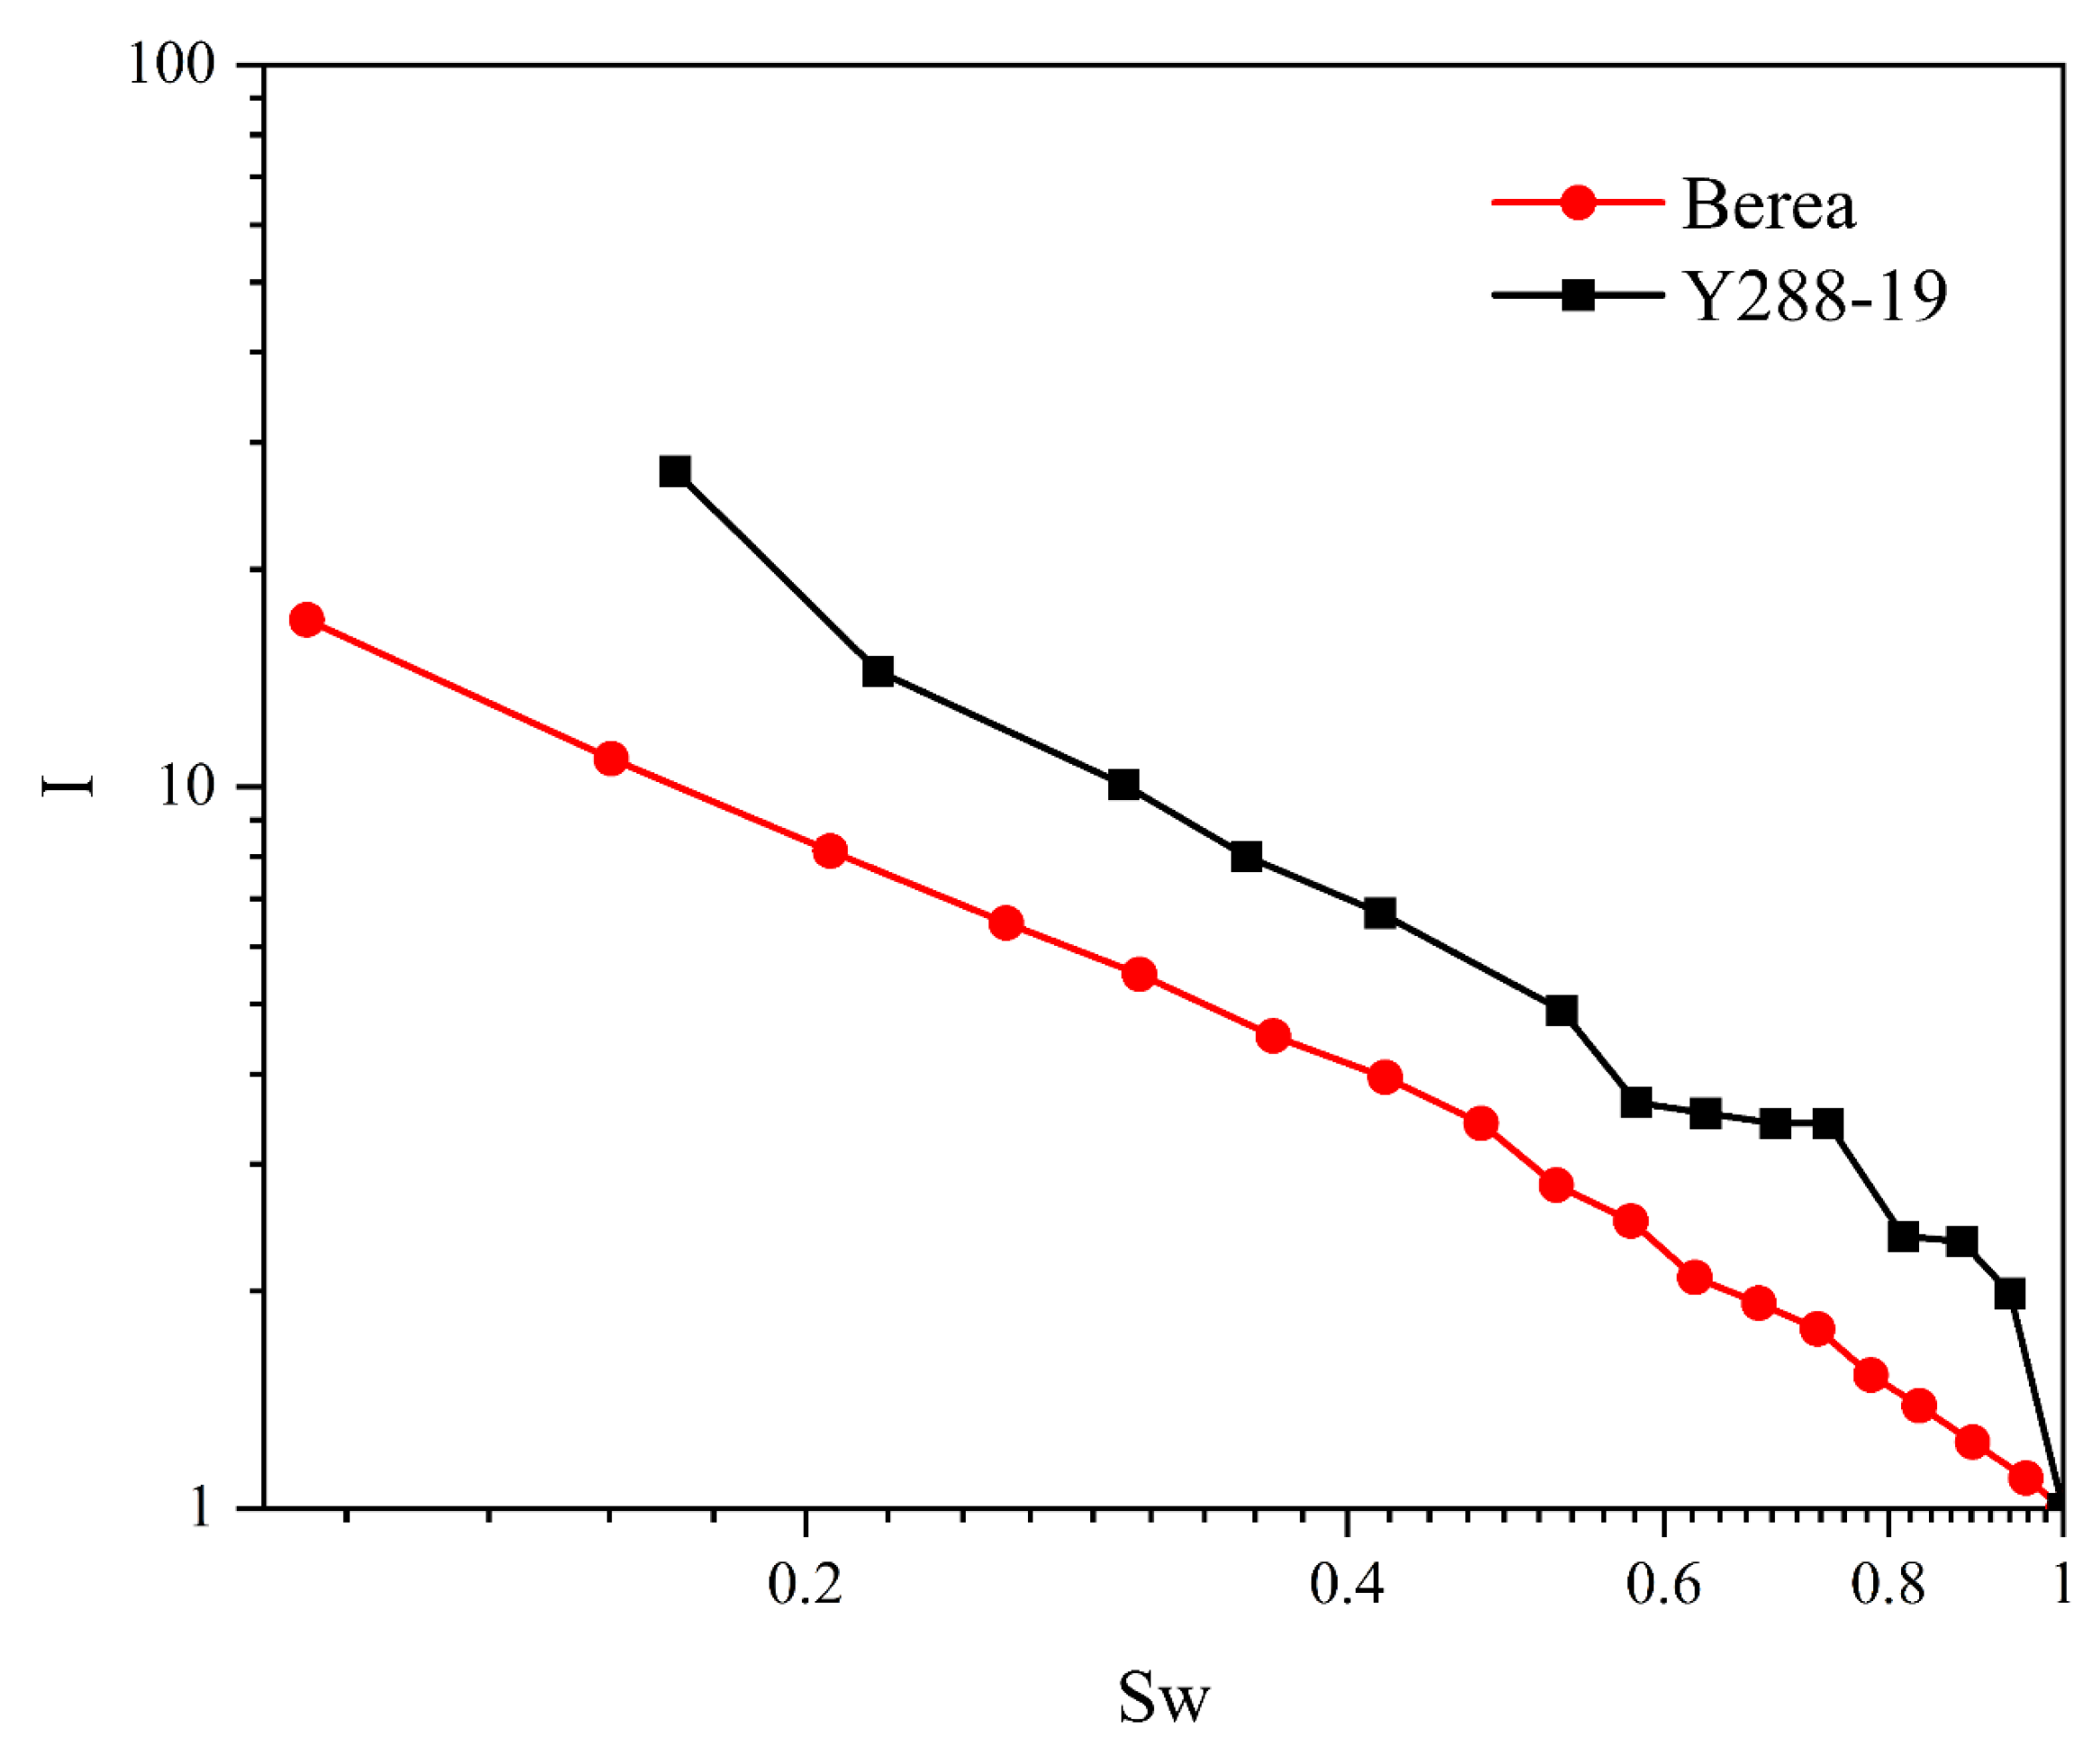
I-Sw curve of tight sandstone Y288-19 and homogeneous sandstone Berea is shown in
Figure 14. It can be seen that the homogeneous sandstone Berea satisfies the Archie phenomenon, while tight sandstone is not simply linear on the I-Sw double logarithm curve. This phenomenon is mainly caused by the small radius of the maximum connected pore-throat of tight sandstone and the complex structure of the pore throat [
58].
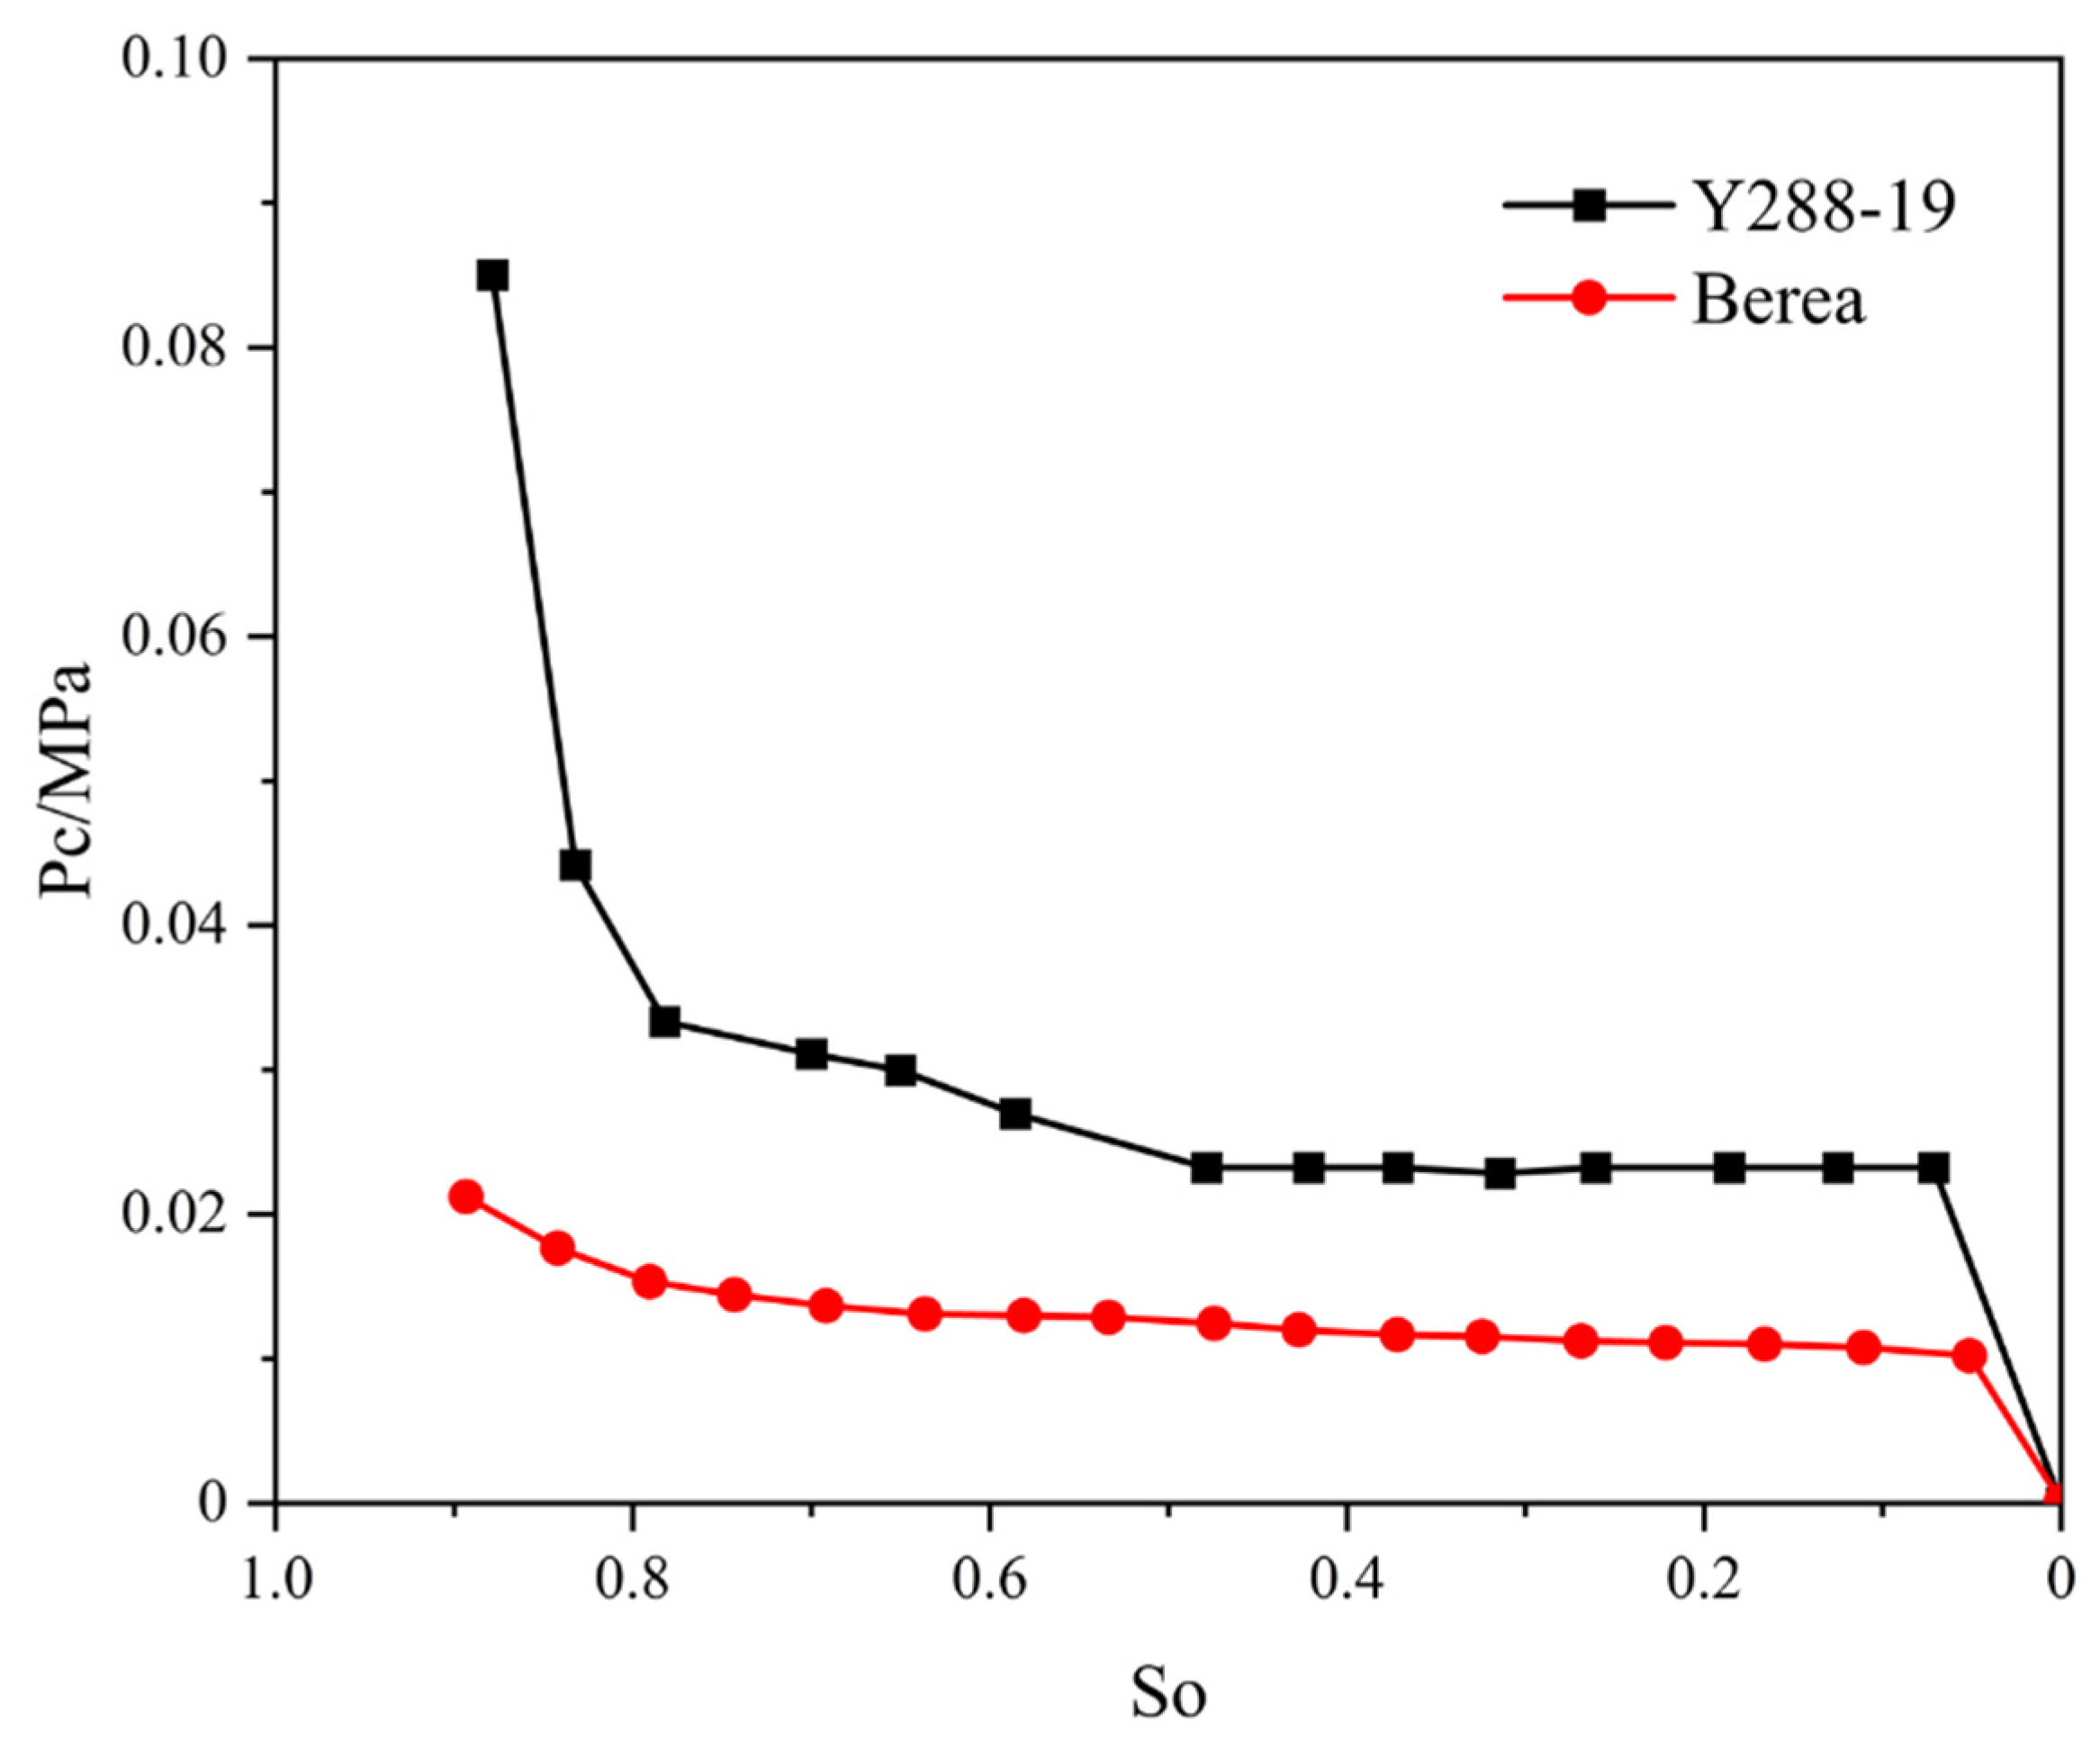
For the digital rocks, Y288-19 and Berea sandstone, different oil saturations corresponding to different pressures are obtained by applying different pressures to simulate the process of oil and water displacement, then the capillary pressure curve is obtained. The capillary pressure curves of the two types of cores are shown in
Figure 15 below. It can be seen from the figure that the displacement pressure of tight sandstone Y288-19 is 0.0235 Mpa. When the displacement pressure is reached, the non-wetting phase passes through the maximum connecting pore throat. Due to the complex pore structure of tight sandstone, the invading non-wetting phase is unevenly distributed in the pore throat. The non-wetting phase has little effect on the rock resistivity, especially when it invades parallel macro-pores. At this time, the increased rate of resistivity index I is slow. As the non-wetting phase continues to invade the pore space, especially when pores are connected in series, the rock resistivity increases rapidly, and resistivity index I also increases. When the capillary pressure breaks through the displacement pressure, the non-wetting phase continues to enter other pore spaces from the smaller throat; its internal complex pore-throat structure makes the oil phase distribution uneven, and the I-Sw double logarithm curve is not a simple linear relationship. The Berea displacement pressure of homogeneous sandstone is 0.0102 Mpa, which is less than that of tight sandstone, indicating that the maximum connected pore-throat radius of Berea sandstone is greater than that of tight sandstone. As the pore throats are evenly distributed, the non-wetting phase is evenly distributed after invading the pore space, and the increased rate of resistivity is basically unchanged in double logarithmic coordinates, which is a typical Archie phenomenon.
The numerical simulation method was used to study the changes of different SO when the non-wetting phase invaded the pore space under the same capillary pressure Pc value, and the formation factors under different water saturations were obtained. In a laboratory measurement, each capillary pressure Pc value corresponded to only one SO. Therefore, only one corresponding SO was reserved for a Pc value in the numerical simulation, and the final SO under a Pc was selected as the corresponding value.
5. Effect of Micro-Pore Structure of Tight Sandstone on Rock Electrical Properties
5.1. Effect of Pore Size on Rock Electrical Properties
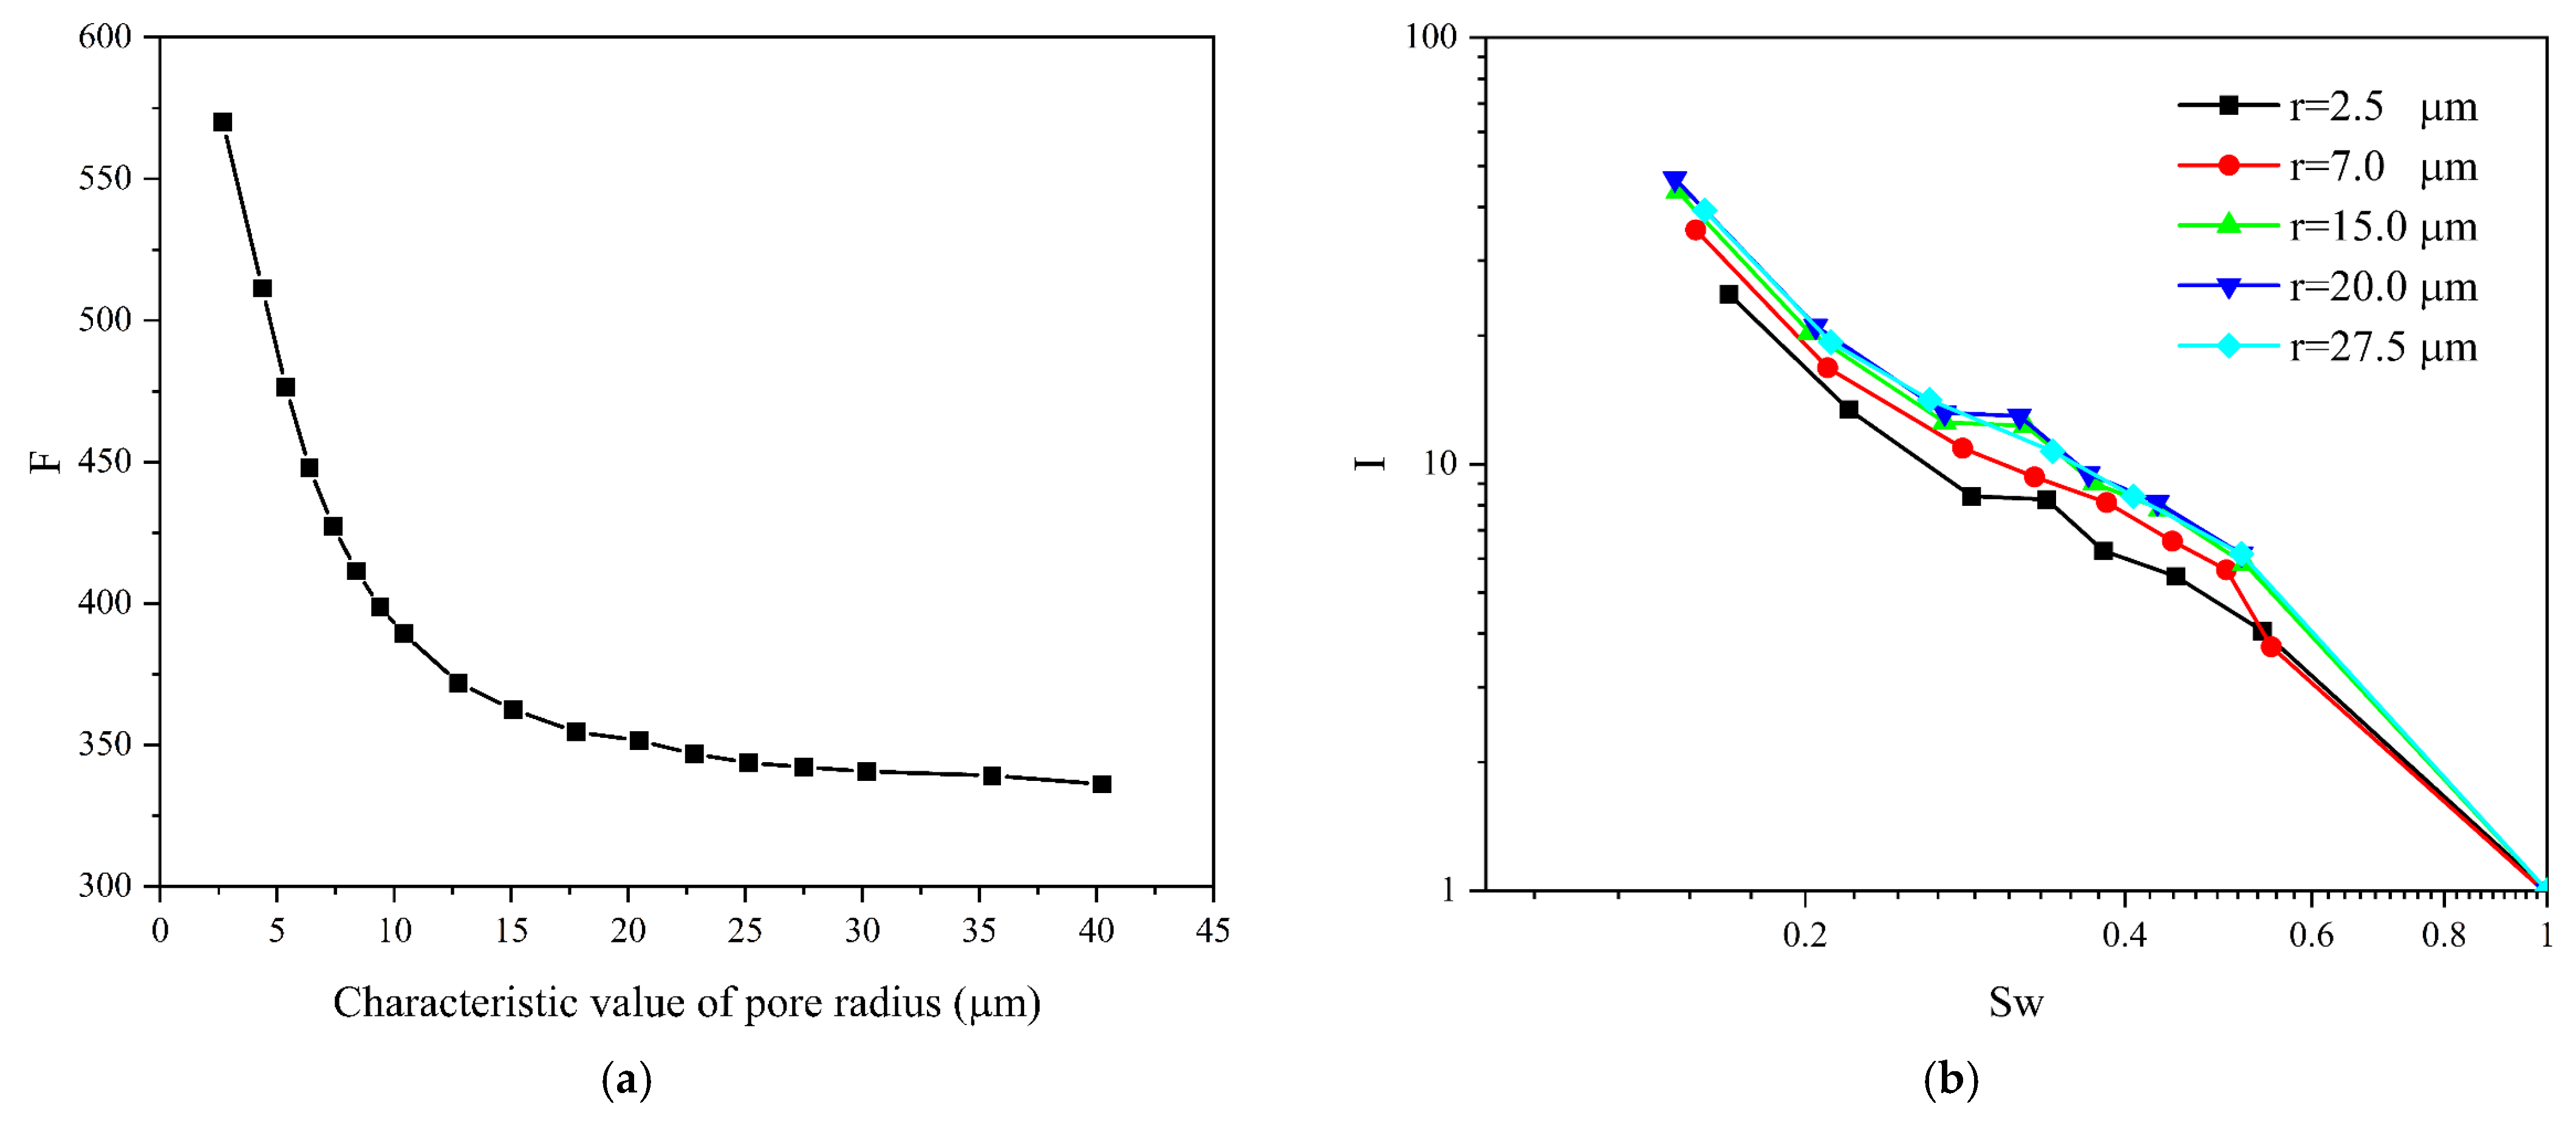
In order to analyze the influence of pore size on rock electrical properties, the characteristic values of the pore radius were selected, other parameters were kept unchanged, and the pore size distribution was changed in multiples, then transformed into digital rocks with different pore sizes after discretization. In order to eliminate the influence of formation-water resistivity, the finite-element method was utilized to solve the formation factors of digital rocks with different pore sizes. The relationship curve between different pore radius eigenvalues and formation factors of the core is shown in
Figure 16a. It can be seen from the figure that, with an increase in the characteristic value of the pore radius, the curve can be divided into two parts. The formation factors decrease rapidly at first, then tend toward a stable value. In the first part, due to the increase in pore space, the conductivity of rock is increased and the formation factor is reduced; The second part tends to be stable because the size of the throat remains unchanged. Although the characteristic value of the pore radius is increased and the resistance of the pore part is very small, the resistivity of the throat part connected in series with it remains unchanged. Therefore, the resistivity of the whole rock is basically unchanged, and the formation factors are also unchanged.
Figure 16b shows the relationship between different water saturations and resistance increase coefficients. As can be seen from the figure, under the same water saturation, the resistivity index of rock increases with an increase in the overall pore radius, which indicates that the fluid distribution in the model changes due to the increase in pore volume. As the pore radius continues to increase, the I-Sw curve is basically unchanged.
5.2. Influence of Throat Size on Rock Electrical Properties
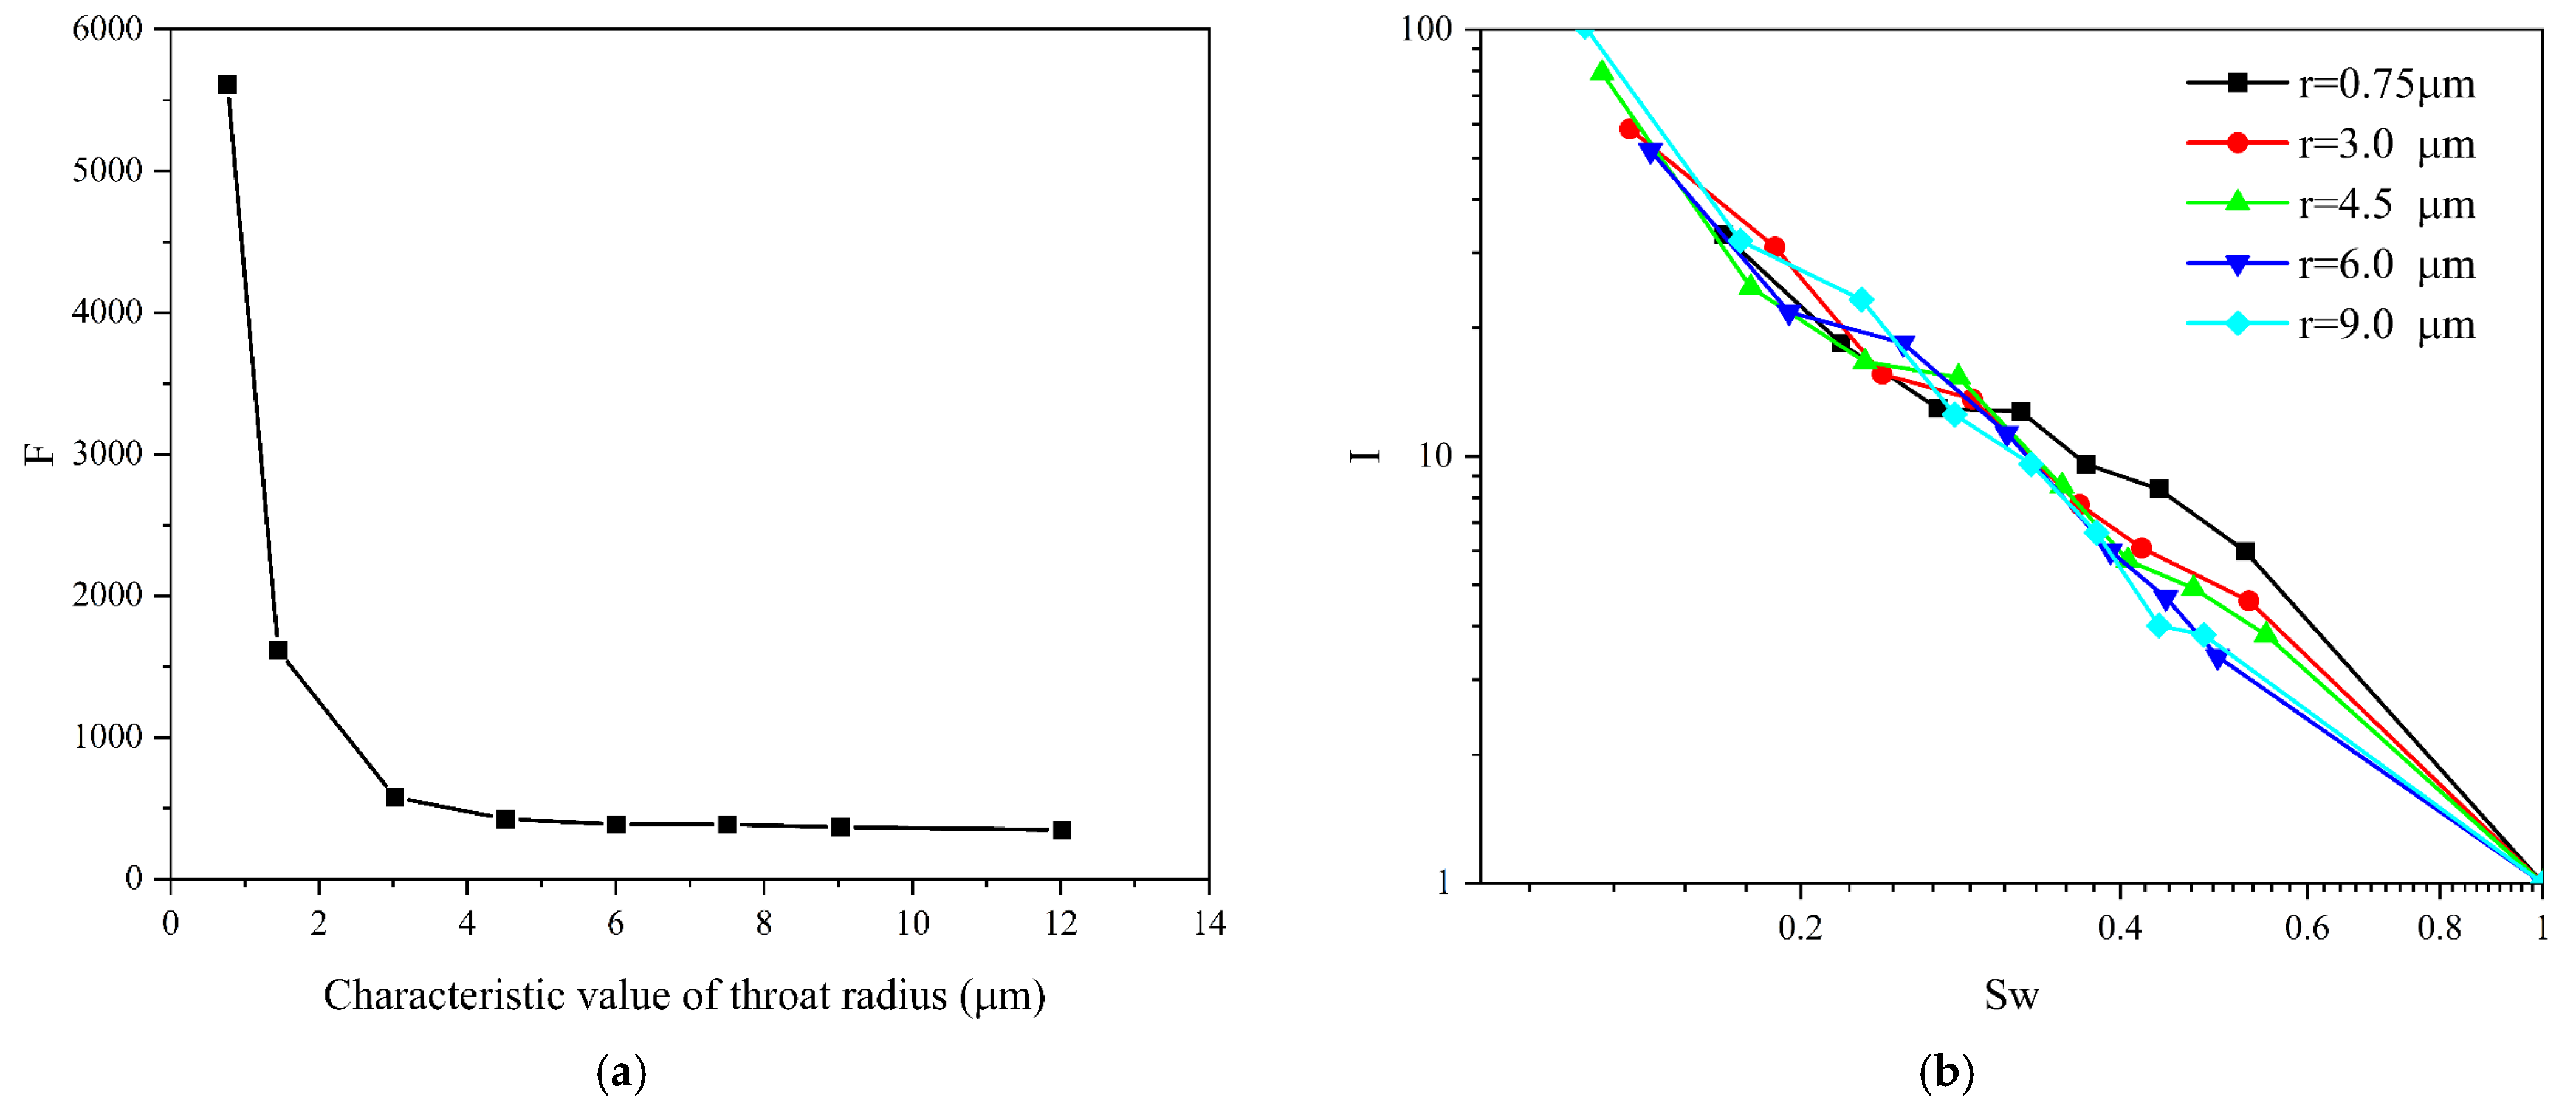
In order to analyze the influence of throat size on rock electrical properties, the eigenvalues of the throat radius were selected. It can be seen from
Figure 17a that with an increase in the characteristic value of the throat radius, the curve can also be divided into two parts. The formation factors first decrease rapidly, then tend to a stable value. In the first part, due to increase in the throat space, the rock conductivity increases and the formation factor decreases; The second part tends to be stable because the increase in throat has exceeded the pore size, the pore resistance remains unchanged, and the pore has become the main factor controlling the rock resistivity.
Figure 17b is the relationship between different water saturations and the resistivity increase coefficient under different throat radius eigenvalues. It can be seen from the figure that the influence of the change in the throat radius on the resistivity index is different under different water saturations. In the middle- and high-water saturation section (Sw > 40%), the resistivity index decreases with an increase in throat radius eigenvalue. Combined with the relationship curves between characteristic values of different pore radii and formation factors, it can be found that the larger the pore–throat ratio, the greater the resistivity index; however, the increased amplitude is smaller than other pore structure factors. In the low water saturation section, with an increase in the characteristic value of the throat radius, the resistivity index has no obvious change, which is due to the complex pore structure of tight sandstone. When the throat increases, the distribution of the non-wetting phase changes unevenly. The conductive path of rock changes greatly under different throat radii, especially when the water saturation is low; this is also the difference between tight sandstone and homogeneous sandstone.
5.3. Influence of Pore-Throat Size on Rock Electrical Properties
In order to analyze the influence of pore-throat size on rock electrical properties, the average pore radius distribution eigenvalues and throat radius distribution eigenvalues were selected as the eigenvalues of pore-throat radius. It can be seen from
Figure 18a that the curve decreases in the form of a power function with an increase in pore-throat size. This shows that when the pore structure does not change, but the porosity is increased exponentially, the cementation index and pore tortuosity of the rock remains unchanged, and the formation factors and porosity fully satisfy the relationship of the Archie equation.
Figure 18b shows the relationship between different water saturations and resistivity indexes under different characteristic values of pore-throat radius. It can be seen from the figure that the relationship curve between water saturation and the resistivity index remains unchanged no matter how many times the pore-throat radius changes at the same time. This shows that as long as the pore structure does not change, the distribution of fluid in rock pores under different water saturations will not change.
5.4. The Influence of Coordination Number on the Electrical Properties of Rocks
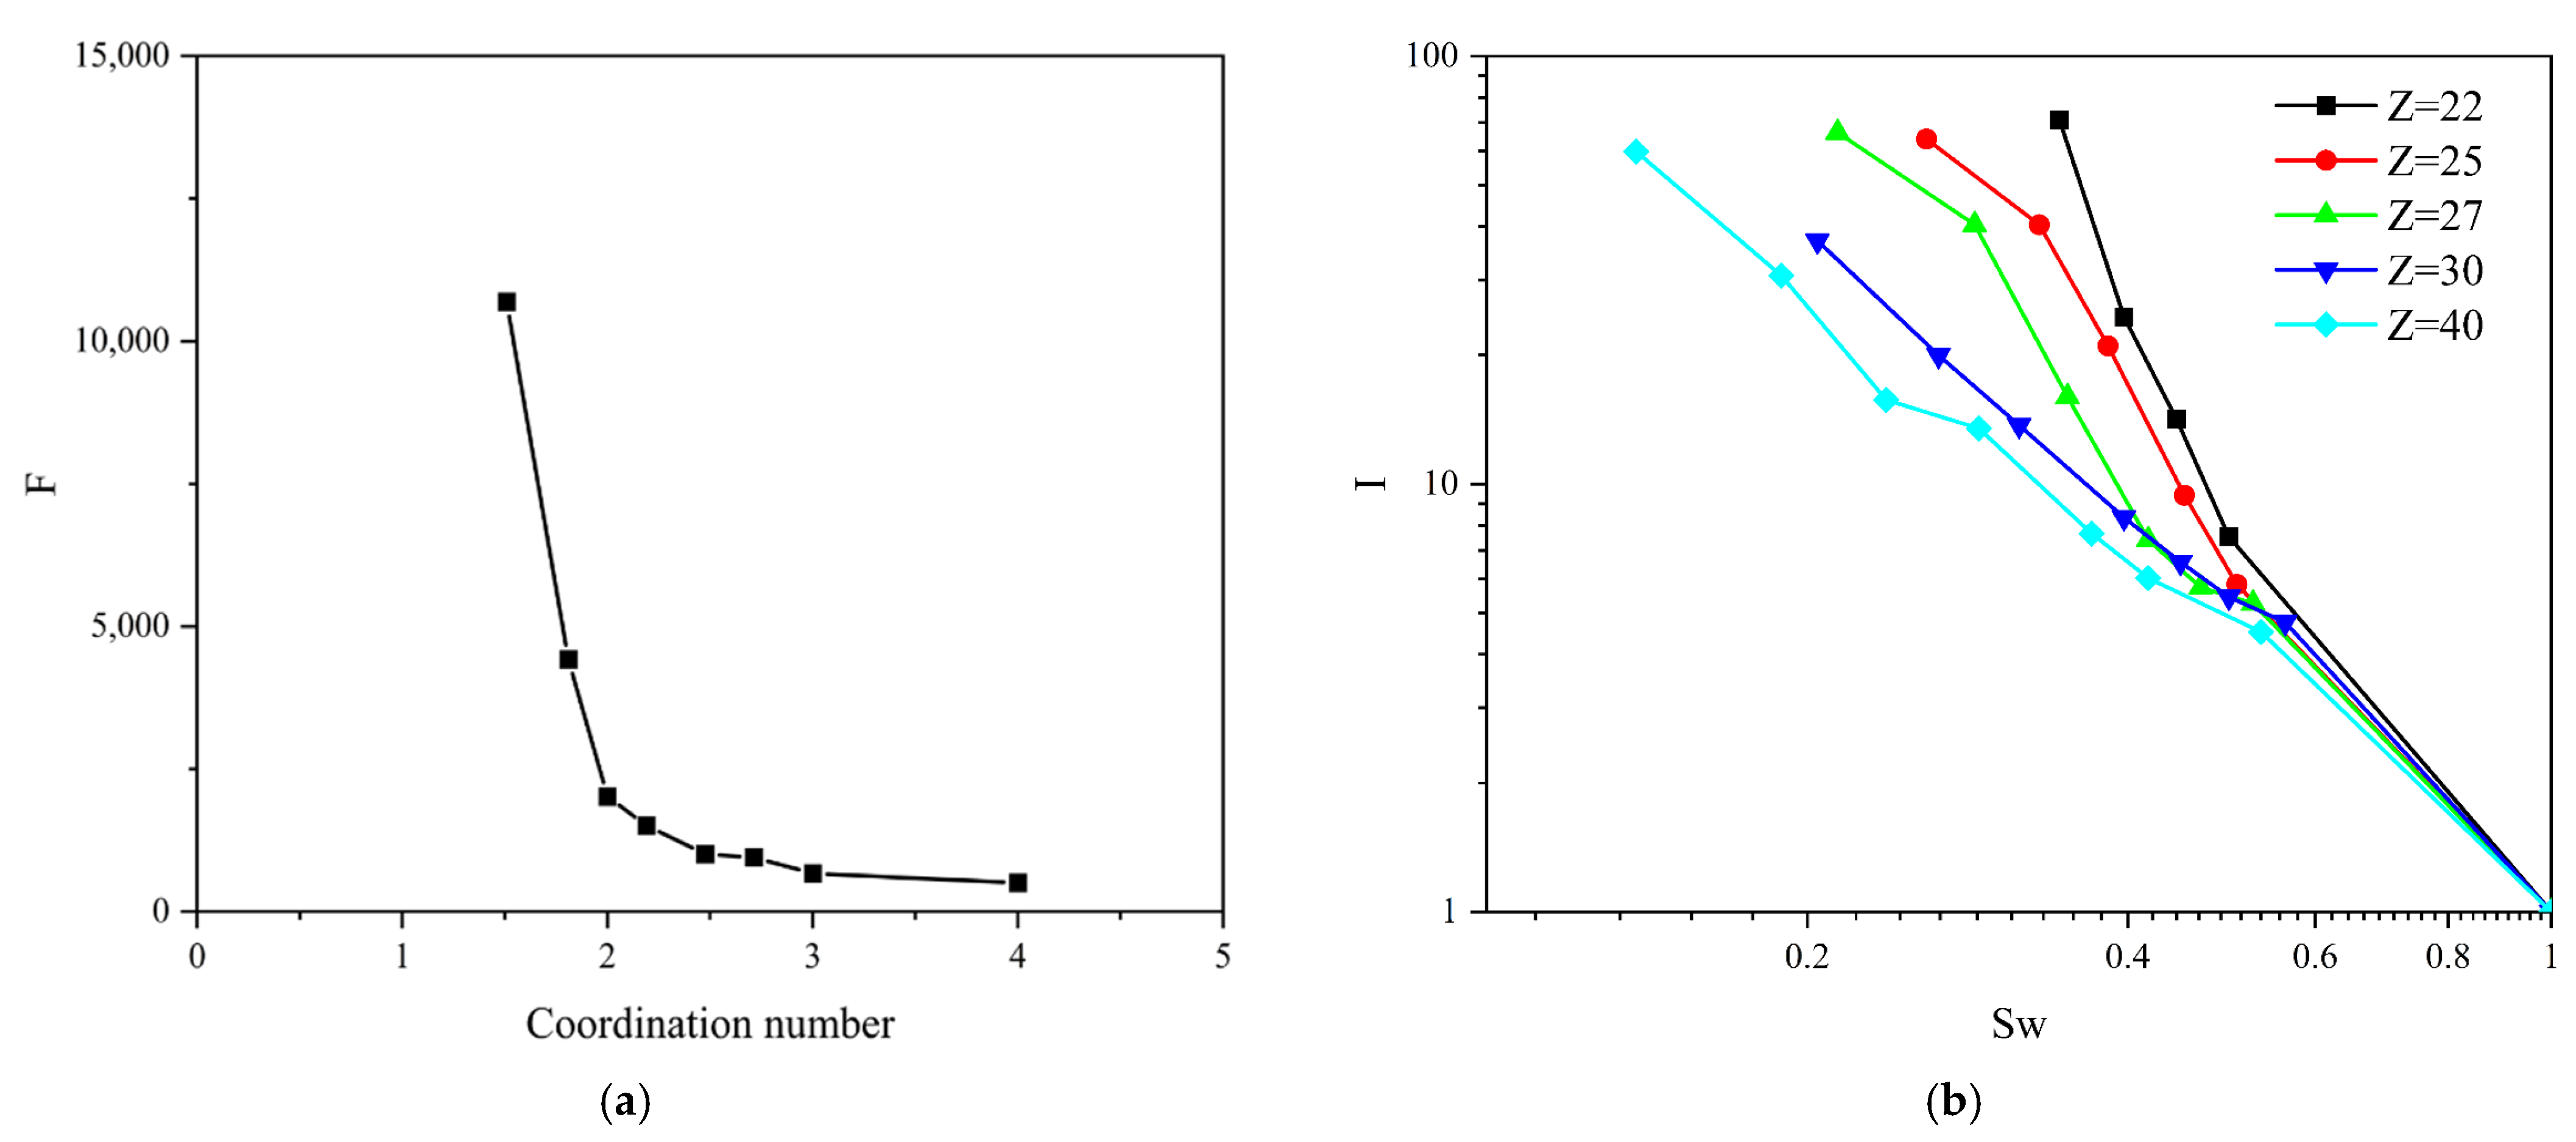
In order to analyze the influence of coordination number on rock electrical properties, the average coordination number was selected for research. It can be seen from
Figure 19a that the larger the average coordination number, the better the connectivity between pores, and the more the fluid flow channels and parallel path of current flow increase. Therefore, the resistivity of rock and formation factors will decrease.
Figure 19b shows the relationship between different water saturations and resistivity indexes under different coordination numbers. It can be seen from the figure that with an increase in the coordination number, the resistivity index decreases greatly under the same water saturation, especially when the water saturation is relatively low, and the influence is relatively weak under high water saturation. This is explained by the fact that the larger the coordination number, the better the pore connectivity. Under low water saturation, it is easier for water to find the connected channel through the whole core, which reduces the current flow path and the resistivity index. However, in the case of high water saturation, as most pore channels contain water, the resistivity index does not decrease significantly.
5.5. Influence of Shape Factor on the Electrical Properties of Rocks
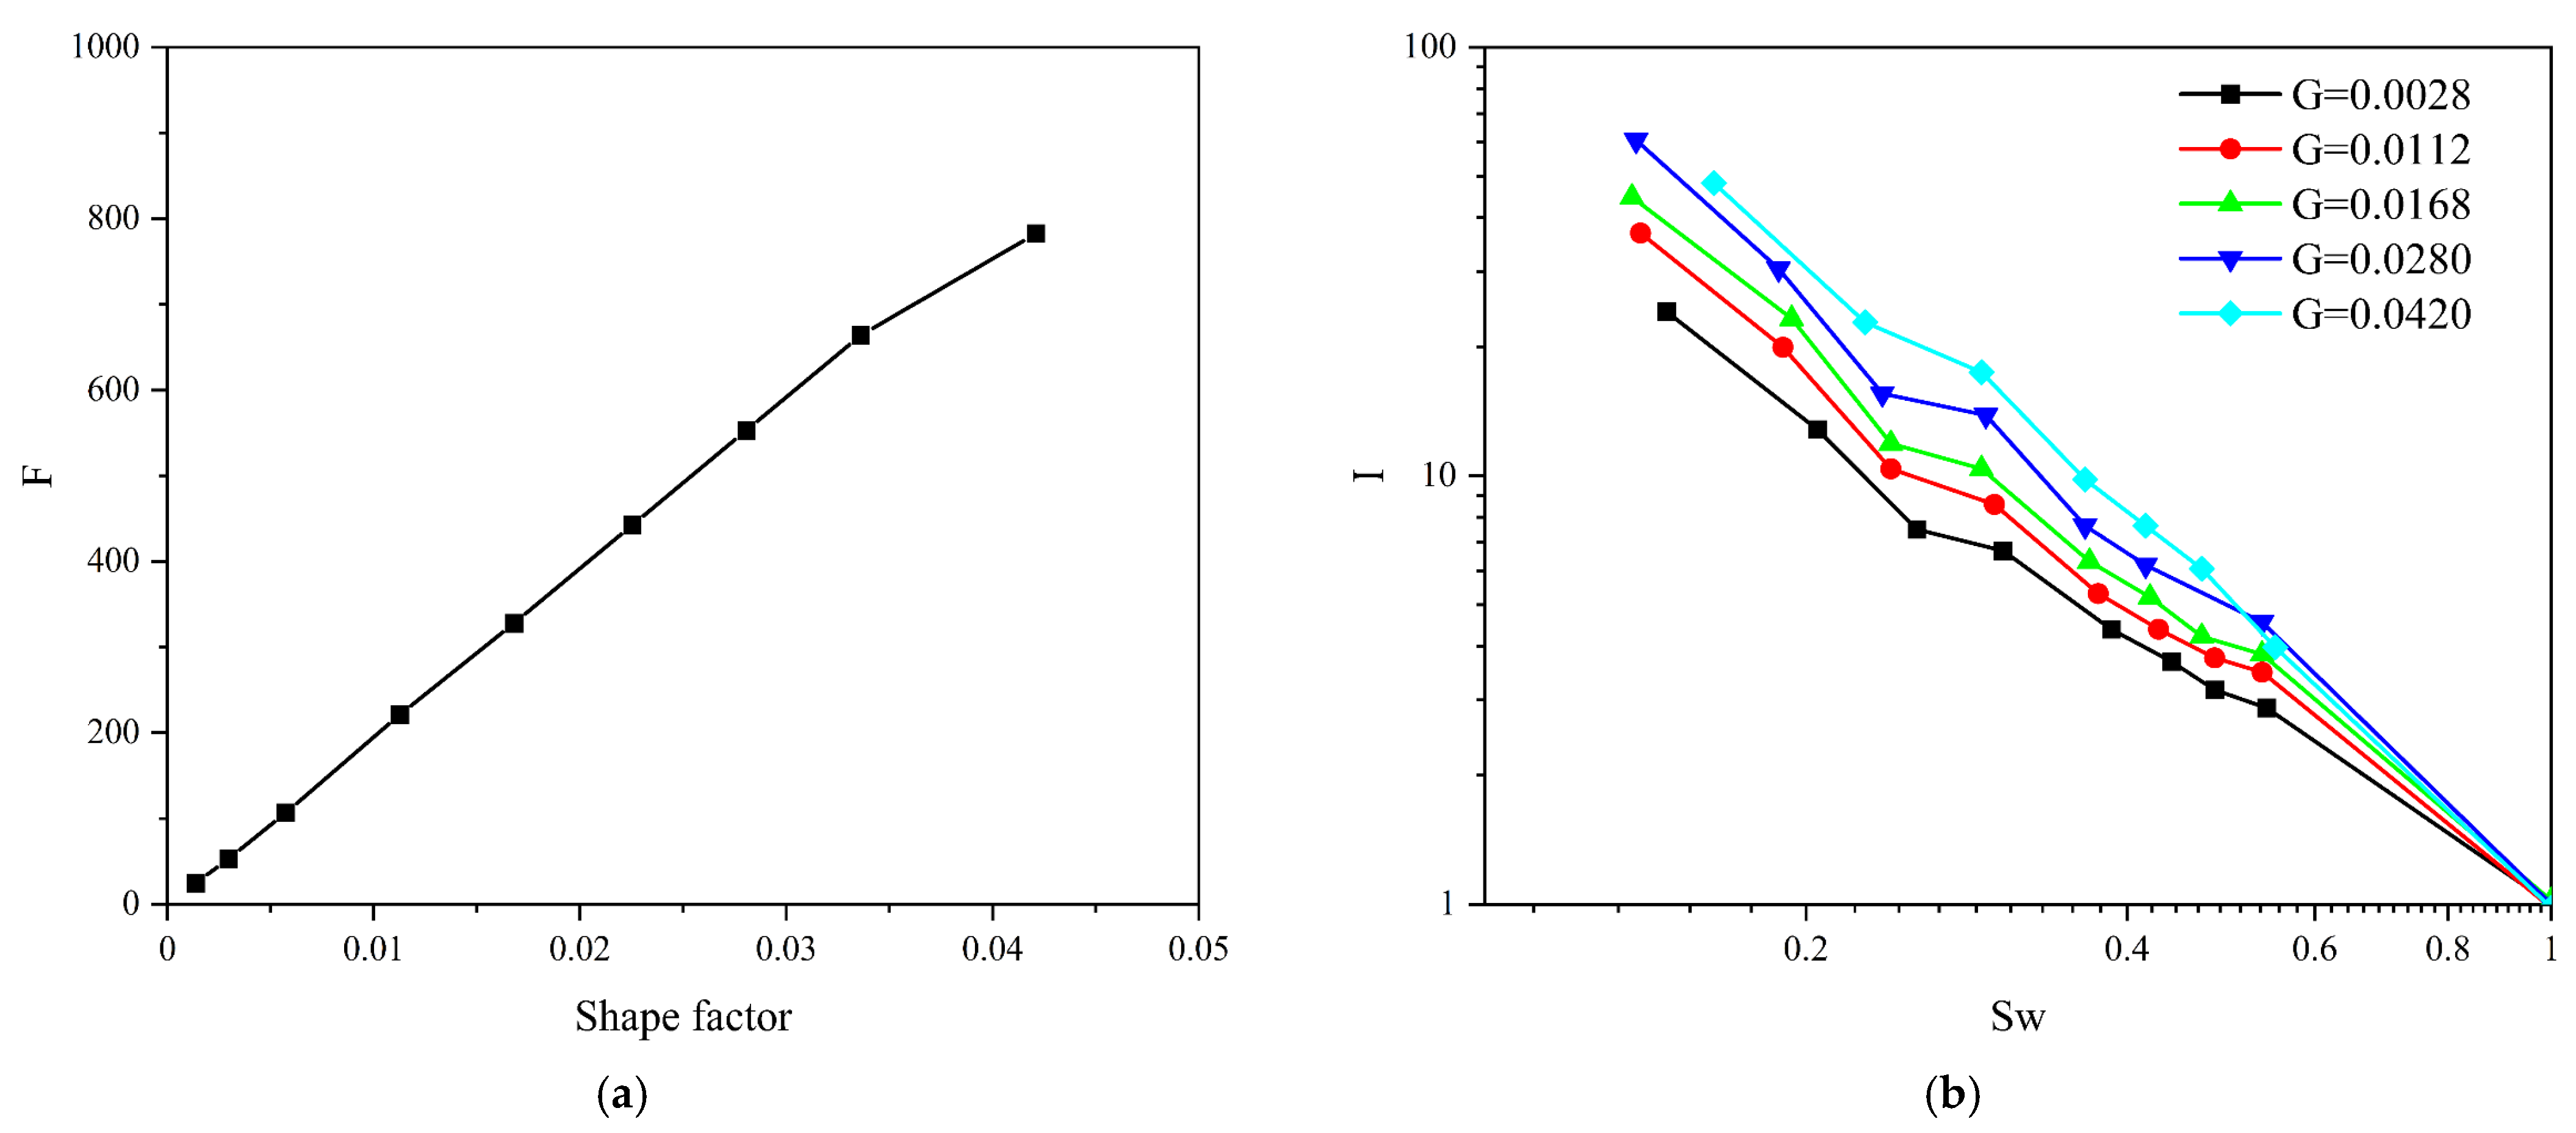
The shape of the pore throat can be characterized by shape factor G. The smaller G is, the more irregular the shape of the pore and throat, and the more obvious the corner. In order to analyze the influence of shape factor on rock electrical properties, the average values of pore shape factor and throat shape factor were calculated based on digital rock, then the average values of both were taken to obtain the average shape factor. It can be seen from
Figure 20a that shape factor has a linear relationship with formation factor. The larger the shape factor, the larger the formation factor. This is because the pore radius of the entire model is fixed, and the shape factor is increased. In other words, the more regular the pore shape is, the smaller the cross-sectional area, the higher the resistivity and the higher the formation factor.
Figure 20b shows the relationship between different water saturations and resistivity indexes under different shape factors. As can be seen from the figure, with an increase in the shape factor, the resistivity index increases under the same water saturation, especially when the water saturation is relatively low, and the influence is relatively weak under high water saturation. This indicates that fluid states distributed in the pores also change with different pore shape combinations, leading to changes in the resistivity index under different water saturations. The more irregular the pores, the rougher the corners in the pores, and the more water remains in the pores; this is especially the case under low water saturation, which is conducive to providing a conduction path for the current so as to reduce rock resistivity, as well as a providing smaller the resistivity index. In the case of high water saturation, the conductive effect of corner water is not obvious, because the pores are mostly filled with water.
5.6. Summary of Influencing Factors of Pore Microstructure on Conductivity
- (1)
The influence of pore microstructure on formation factors
For rocks with certain porosity and lithology, formation factor F is a constant, which mainly depends on the effective porosity of the rock and is related to the pore structure to a certain extent.
The influence of pore size and throat size on formation factors is basically the same. Increasing pore size or throat size will reduce formation factors. This is because the increase in pore size or throat size will increase the volume of conductive fluid, increase the conductivity of rock, reduce R0, and reduce the corresponding formation factor F.
The larger the coordination number, the smaller the formation factor. This is because the better the connectivity between pores, the more the fluid flow channels and parallel path of current flow will increase. Therefore, the resistivity of rock and formation factor F will decrease.
There is a linear relationship between the shape factor and the formation factor. The larger the shape factor, the larger the formation factor. This is because the pore radius of the entire model is fixed and the shape factor is increased, which means that the more regular the pore shape, the smaller the cross-sectional area; in addition, the R0 increases and formation factor F increases.
In the study of the pore structure of tight sandstone in
Section 3.1, the shape factor of tight sandstone is not different from that of other types of sandstone. Therefore, the influence of the micro-pore structure of tight sandstone on formation factors is mainly the size of the pore throat and coordination number. The size of the pore throat can be divided into macro-, meso- and micro-pores. The coordination number determines the connection between pores, that is, the series and parallel connection of three types of pores in the rock.
- (2)
The influence of pore microstructure on resistivity index
In the middle- and high-water saturation section, the pore size increases and the resistivity index increases; when the throat size increases, the resistivity index decreases. That is, the resistivity index increases with an increase in the pore–throat ratio. In the low water saturation section, with the change in throat size, the change in the resistivity index has no obvious law. When the pore throat changes at the same time, the resistivity index is basically unchanged. This indicates that in tight sandstone, the change in pore size affects the distribution of fluid in pores, that is, the resistivity of rocks varies greatly under different water saturations, and the resistivity index also changes.
The larger the coordination number, the smaller the resistivity index. This is because the larger the coordination number, the better the pore connectivity. Under low water saturation, it is easier for water to find the connected channel through the whole core, which reduces the current flow path and the resistivity index.
The larger the shape factor, the greater the resistivity index under the same water saturation. The more irregular the pores, the rougher the corners of the pores, and the more water is trapped in the pores, especially at low water saturation; this is conducive to providing a conduction path for the current, thus reducing the rock resistivity and the resistivity index. In the case of high water saturation, the conductive effect of corner water is not obvious, because the pores are mostly filled with water.
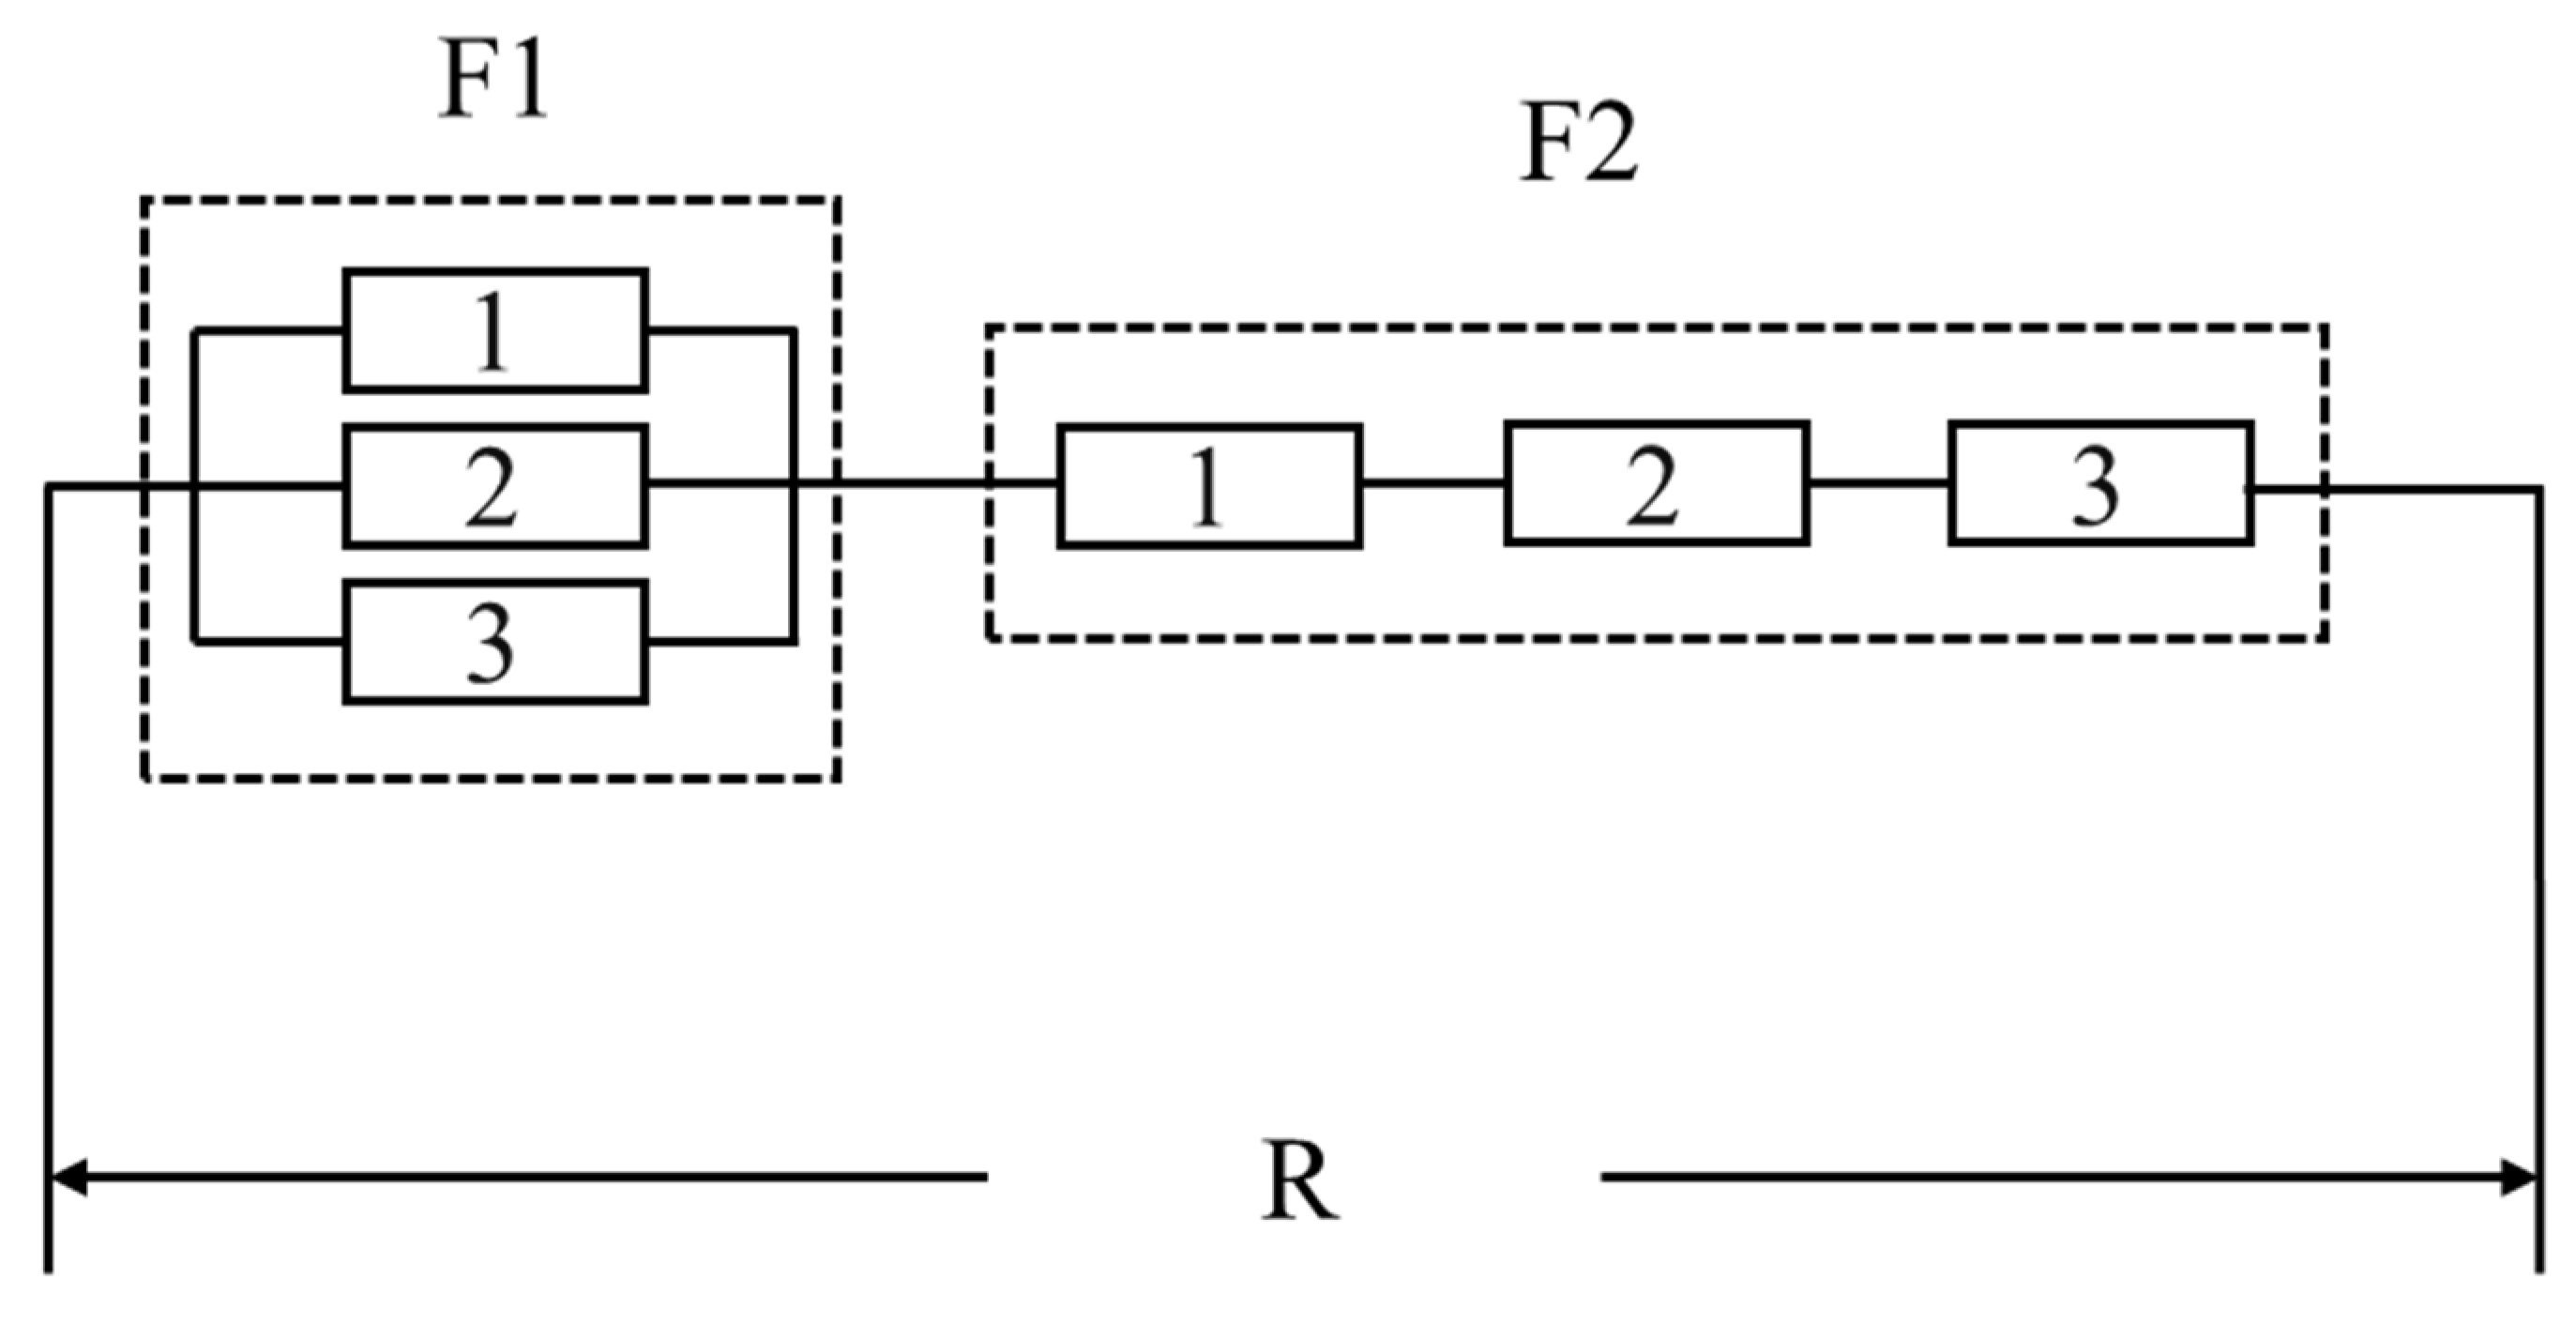
It is noted that pore microstructure mainly affects the distribution of fluid in pores. The complex spatial distribution of macro, meso-, and micro-pores, and the different coordination numbers, have an important impact on the series and parallel connection of pore space, resulting in the complex distribution of fluid in pores and the complex change in the resistivity index.
Therefore, when constructing the saturation model of tight sandstone, it is necessary to consider not only the influence of macro-pores, meso-pores and micro-pores, but also their series and parallel connection.


