1. Introduction
The European legislative framework requires the Member States to take several measures to reduce energy consumption and reduce greenhouse gas emissions. Similar efforts were considered on various levels in other sectors. However, in the building sector, a more detailed analysis is required since it accounts for 43% of the final energy consumption [
1]. It is a well-known fact that people spend most of their time, around 90% of it, indoors [
2]. Consequently, building comfort represents a constant concern. Interior comfort is perceived differently by each individual. From an engineering perspective, comfort should ensure optimal temperature and humidity for the human body, optimal natural and artificial lighting, noise protection, ventilation and efficient filtration of the air in the building all simultaneously. The scientific literature has a well-documented basis for theoretical models and potential applications. However, practical examples concerning data integration and exchange with other third-party apps are still lagging. Nevertheless, the current digital solutions can provide good accuracy levels in assessing and controlling thermal comfort parameters through IoT. As a result, in the residential sector, intelligent buildings have evolved from buildings with automation and control systems [
3] to facilities in which smart, social and environmental aspects are considered. After reviewing several research papers, it was found that most research deals with two main aspects (1) IoT systems for monitoring of environmental, air quality or electric parameters and (2) IoT systems addressing the intelligent control of building systems.
In [
4], the authors have deployed an IoT system composed of ten wireless sensory nodes that monitor temperature, humidity and air pressure. The authors argued that monitoring cloud-based IoT solutions could be used in the control loops without changing the equipment. The importance of IoT solutions has been emphasised in all life cycle phases of the building. Bottaccioli et al. consider that the integration of BIM, IoT and GIS (Geographical Information System) in the design phase enables the development of new energy and predicting models [
5]. In deploying IoT monitoring solutions, choosing communication protocols plays a vital role in structuring the data exchange with the upper layer or communication with third-party apps. Neumann et al. have presented, through experimental research, the performance of LoRaWAN (Long Range, Wide Area Network) in monitoring the indoor environment in 13 locations ranging from 50 m to 60 m within the same building [
6]. Another common protocol used in IoT solutions is Constrained Application Protocol (CoAP), a RESTful (REpresentational State Transfer) web data transfer protocol. The authors in [
7] have emphasised the importance of secured communication, proposing a Datagram Transport Layer Protection (DTLS) protocol with SHA-2 (Secure Hash Algorithm 2). IoT technology has inspired the appearance of other technological terms. One of them is IoE (Internet of Energy), a term that refers to a mix of smart grids and IoT characteristics. In [
8], the authors propose an enhanced conceptual framework for energy use in buildings in which supply and demand are balanced through IoE. The IoT architecture does not have a general blueprint that fits all the possible data workflows. For example, Ramprasad et al. have advanced a centralised building management system in which data are transferred through a publish-subscribe layer, such as Kafka [
9].
Controlling building equipment based on IoT solutions is another topic of interest. In the scientific literature, there are sufficient examples that emphasise the need for IoT controlling policies, especially for Heating, Ventilation and Air Conditioning (HVAC) systems. Li et al. consider that IoT solutions based on wireless sensor nodes are a promising solution in achieving optimal control of distributed systems. The authors propose two novel strategies based on an event-driven multi-agent control strategy for HVAC systems. The authors conclude that the process maintains good building performance. The study was conducted on a TRNSYS-MATLAB software testbed [
10]. Similar research conducted by Su et al. has emphasised that complex optimisation strategies in controlling HVAC systems could be decomposed into small tasks distributed between IoT devices. In addition, the authors have pointed out the advantages of decentralised systems over centralised systems. The study was based on a building HVAC system modelled in TRNSYS [
11].
The reviewed research articles have advanced either a conceptual framework or conducted a series of simulations using software tools. In this context, our research is motivated by the imbalance between theoretical concepts and practical-demonstrative approaches. The present research proposes an updated controlling solution for HVAC systems based on the IoT architecture. The solution is designed to communicate with the IoT monitoring system, which exchanges data with the controlling unit through Message Queuing Telemetry Transport protocol (MQTT) and RESTful API web services. The proposed solution was tested in a residential building located within the campus of the University POLITEHNICA of Bucharest. The building is a duplex that meets the performance criteria of the passive house standard. The structure of this paper is organised as follows: In the
Section 1, a short introduction and the motivation are detailed. In
Section 2, the current regulatory framework is emphasised.
Section 3 consists of an overview of monitoring, data processing and storage solutions.
Section 4 describes the Proportional Integral Derivative (PID) regulator, while the
Section 5 covers the proposed solution for monitoring and controlling the HVAC system. Finally,
Section 6, covers the main findings, conclusions and future research direction.
2. Regulatory Framework
Depending on the activity performed, the body produces a quantity of heat that contributes to establishing the thermal comfort of the individuals. In addition, the thermal variations of the body are also dependent on the thermal insulation of the body. Consequently, clothing is another crucial factor to consider when determining the thermal comfort indices of the building. At the same time, the number of people for whom the building was designed is also essential.
Moreover, thermal comfort is also influenced by the following parameters: indoor air temperature (); average radiation temperature (); air velocity in the room (); indoor air humidity ().
A well-known standard that deals with thermal comfort indices is the standard ISO 7730. Nation-wide, for the conventional methods of calculating the heat demand of the building, the SR 1907/(2)/2014 standard can be consulted. The conventional indoor temperature, depending on the designation of the room, is in the range of 18–22 C. For calculating the energy requirement for cooling, the indoor temperature for residential buildings is between 22 and 27 C.
The air velocity in the building () influences the convective heat loss and is closely related to the HVAC systems in the building. The ISO 7730 standard defines a series of accepted values, depending on the operating temperature, the intensity of the air turbulence and the activity in the building.
Accepted values for sedentary activities (1.2 met = 70 W/m) and indoor temperatures of 20–26 C fall in the 0.1–0.3 m/s range. A quality test for measuring the speed of air in the building is difficult to perform because the airflow is in turbulent mode, which means that the speed changes both in value and direction.
From the energy performance point of view, one of the essential directives is the 2010/31/EU Energy Performance of Buildings Directive (EPBD). The directive specifies that all public buildings built from 2019 and the rest of the buildings from January 2021 must meet the criteria of Nearly Zero Energy Buildings (NZEBs) [
12,
13].
According to Article 2, by definition, NZEBs are those buildings that have a high-energy performance and meet the criteria of Annex 1—the common general framework for calculating the energy performance of buildings. However, given that the EPBD does not specify thresholds or numerical performance ranges for facilities, the Member States may set these performance criteria according to climatic conditions, construction methodologies and primary energy production.
3. Aspects of IoT Based Monitoring and Data Processing
In the current digital transformation stage, the scientific community is orienting towards control and monitoring systems that are based on IoT architecture that can provide facile integration, qualitative data and the acquirement of new knowledge by analysing data sets [
14].
Following this topic, the main objectives of the proposed solution in the design phase were to bridge the monitoring system with intelligent control of the HVAC system. Based on the data provided to the controlling unit, the solution can detect and take action in an unhealthy environment in situations caused by poor air quality or uncomfortable temperatures.
The IoT monitoring solution backbone comprises two databases, which hold the monitoring data, a RESTful API (Representational State Transfer Application Programming Interface), a flow editor, an analytic and interactive visualisation tool and messaging services.
The data-flow path, as shown in
Figure 1, starts with the wireless sensor node, which encapsulates 11 sensors that monitor the following parameters: PM1, PM2.5, PM10, Ozone, Formaldehyde, Carbon Dioxide, Volatile Organic Compounds (VOC), temperature, air humidity, barometric pressure and noise. After configuring wireless settings, the device connects automatically to a web-based environmental monitoring platform where it stores the data with a predefined time step. In addition, the sensor node can transfer the historical information to a third party app through HTTP requests.
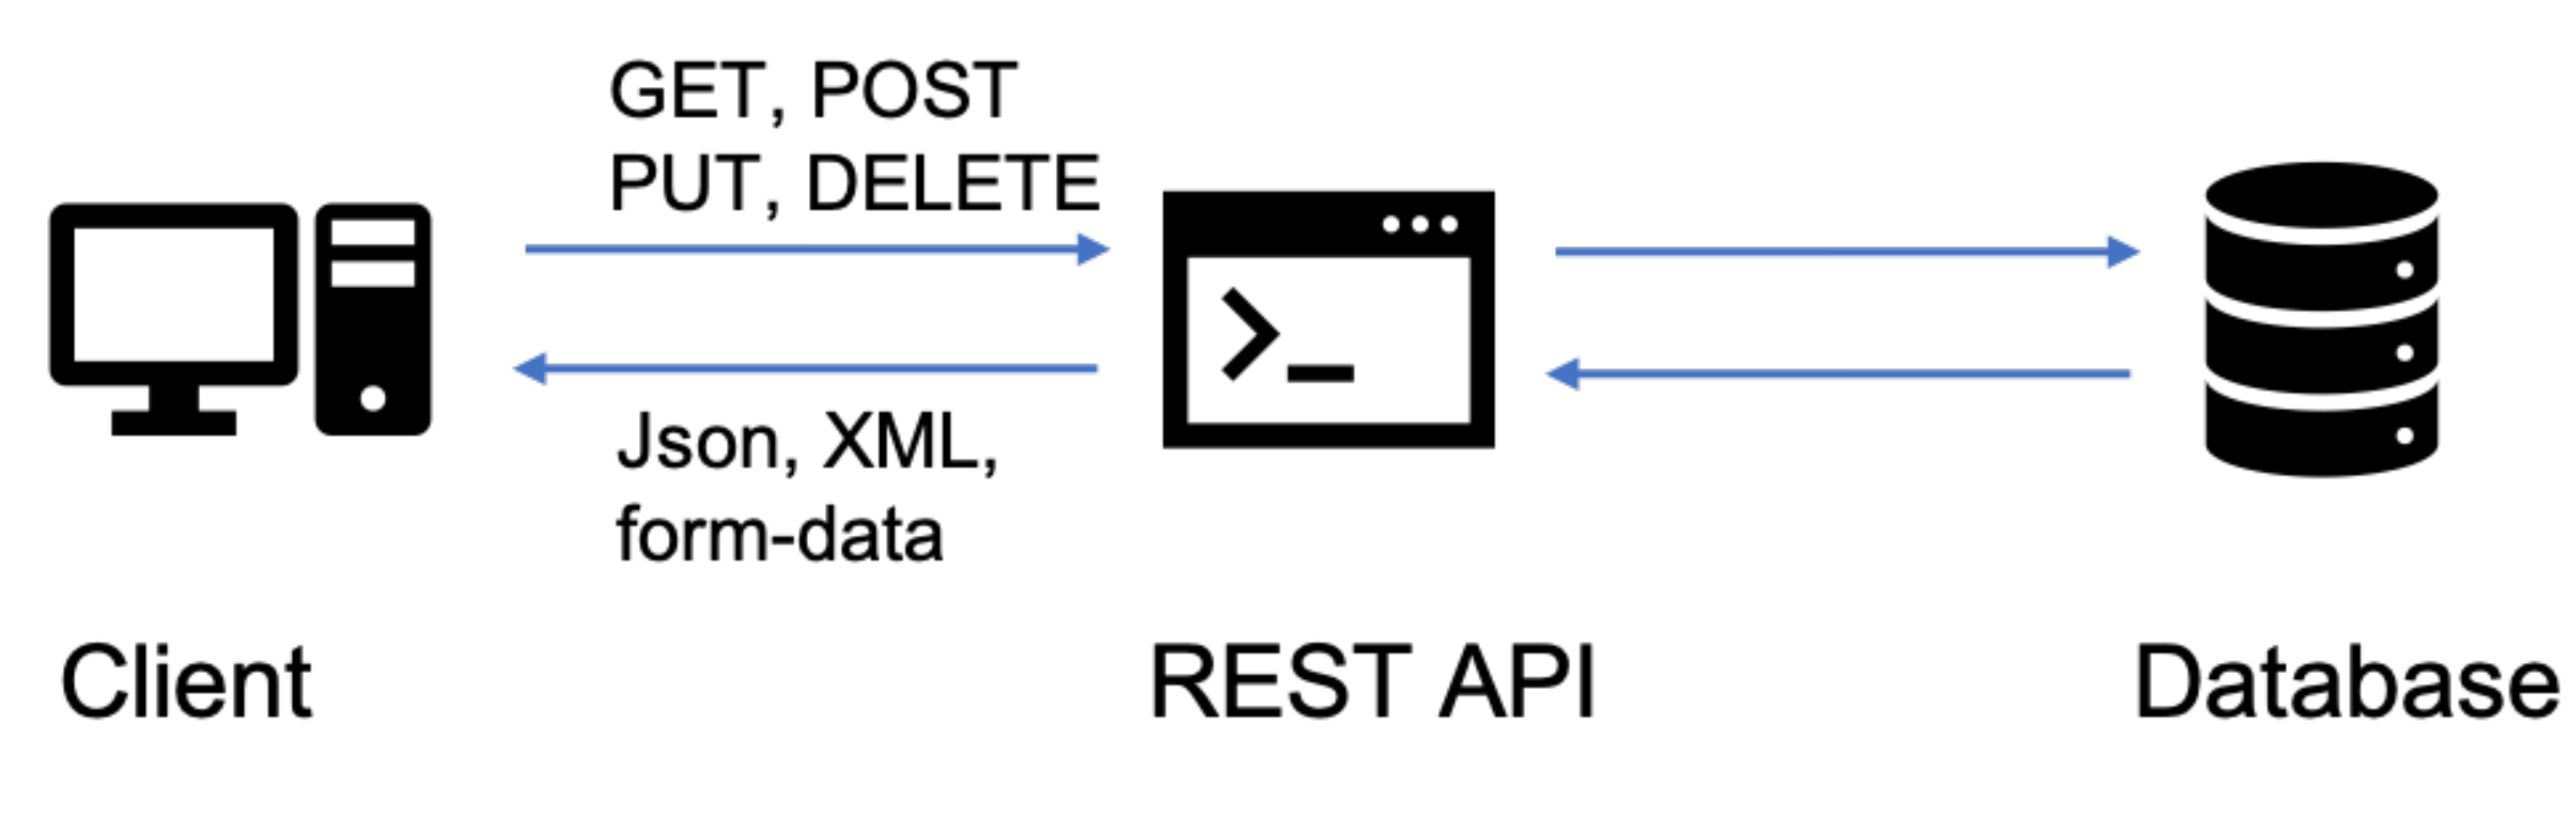
The environmental monitoring platform communicates with third party applications through RESTful APIs web services. RESTful API is a specific type of client-server software application that respects the RESTful architecture’s constraints and allows data exchange through the HTTP stack. More precisely, RESTful API provides interoperability between various applications through web services. The communication concept, as shown in
Figure 2, provides request-response operations for HTTP methods, such as PUT, GET, POST and DELETE. Furthermore, the data are encapsulated in JSON messages. JSON (JavaScript Object Notation) is a lightweight data format that is based on a subset of JavaScript Programming Language Standard [
15]. The syntax uses a hierarchical representation of the “KEY”:“VALUE” pairs. Furthermore, the main advantage of the JSON format is that the messages can be converted to JavaScript objects.
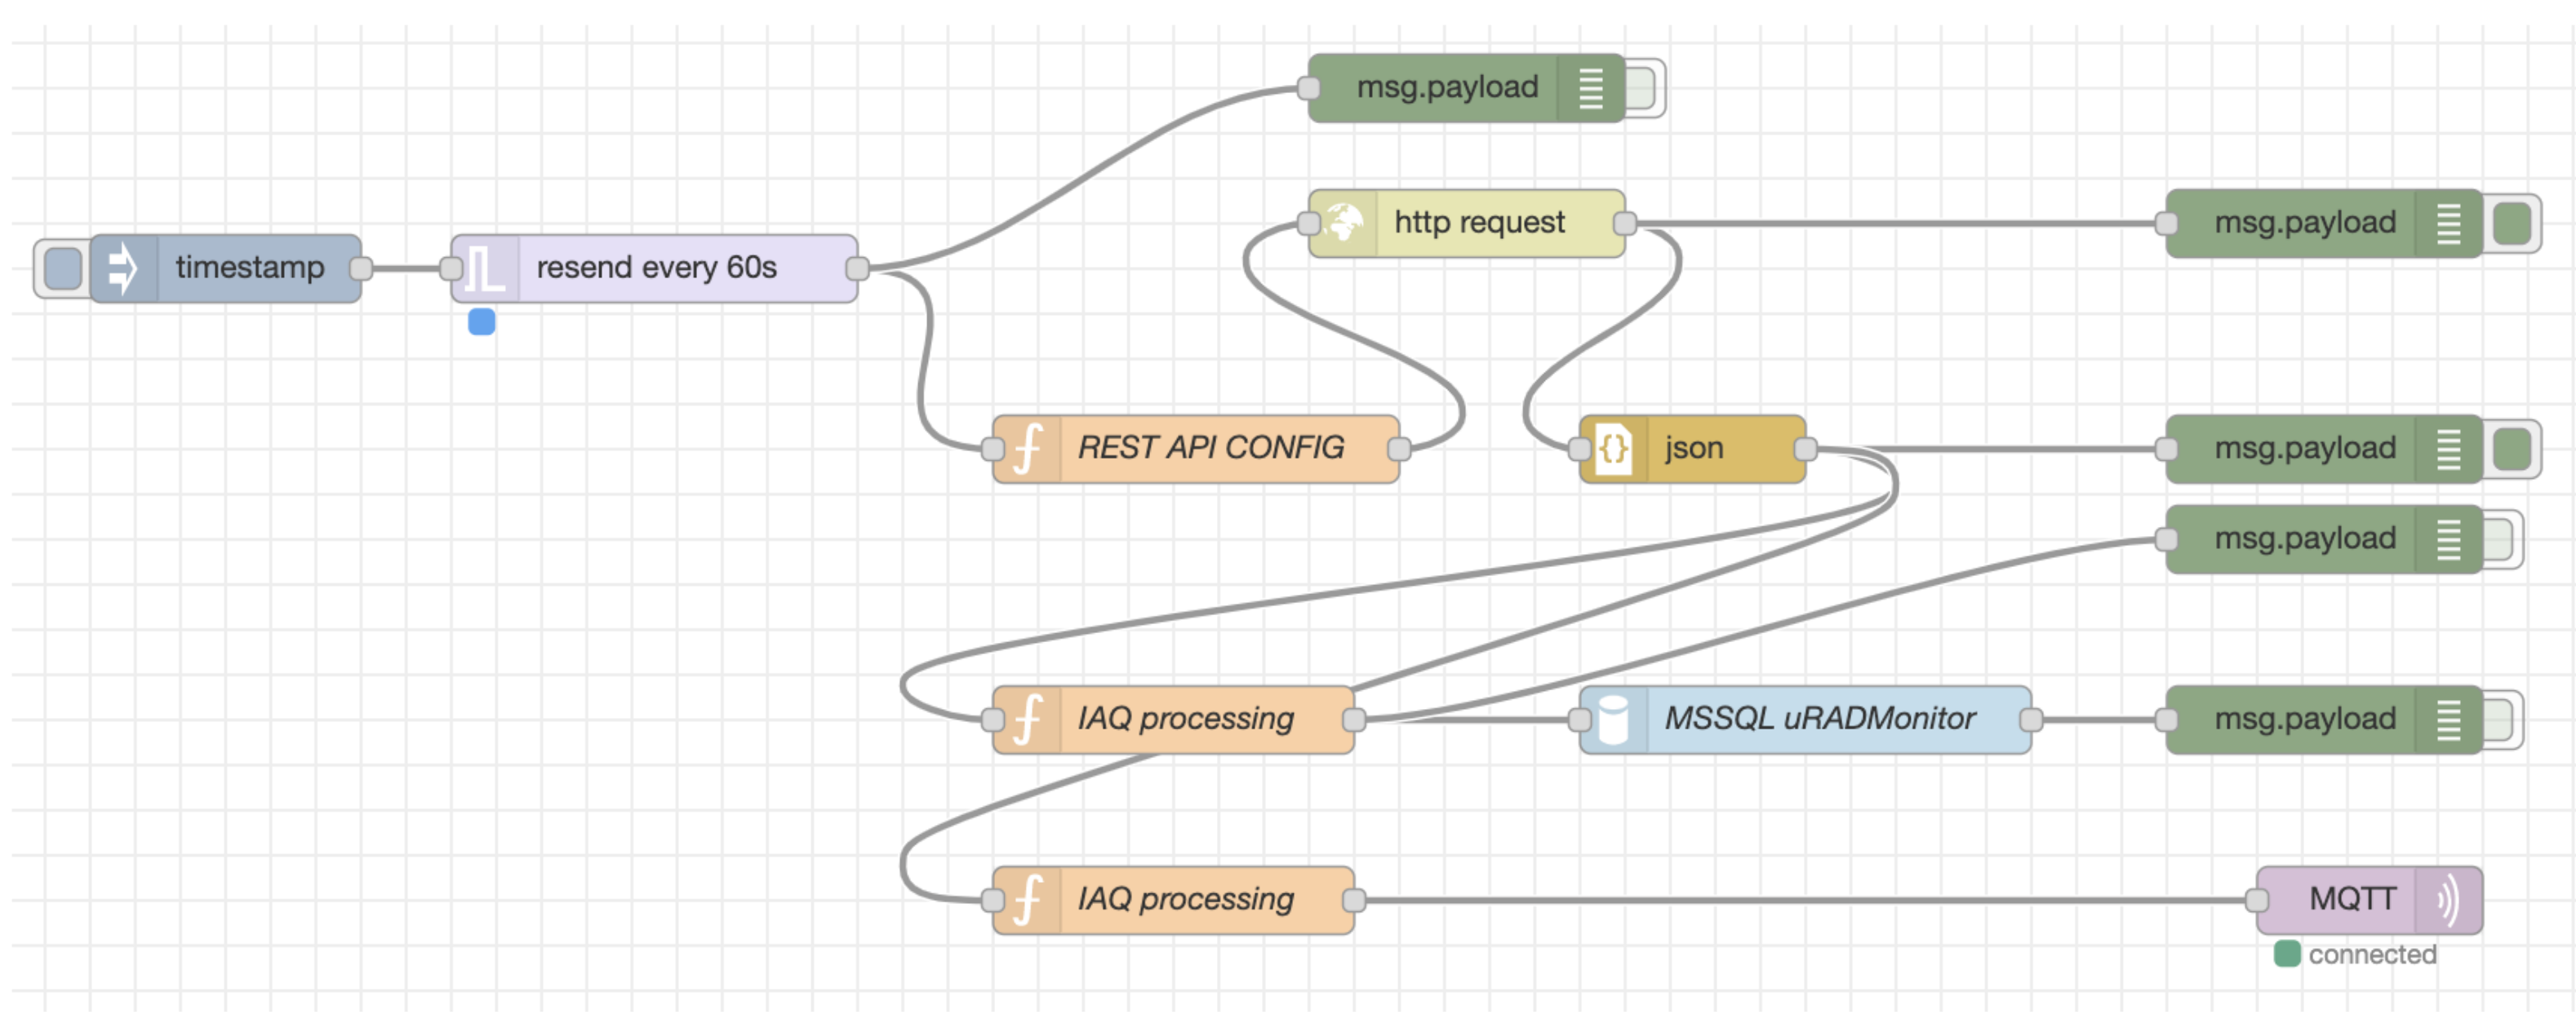
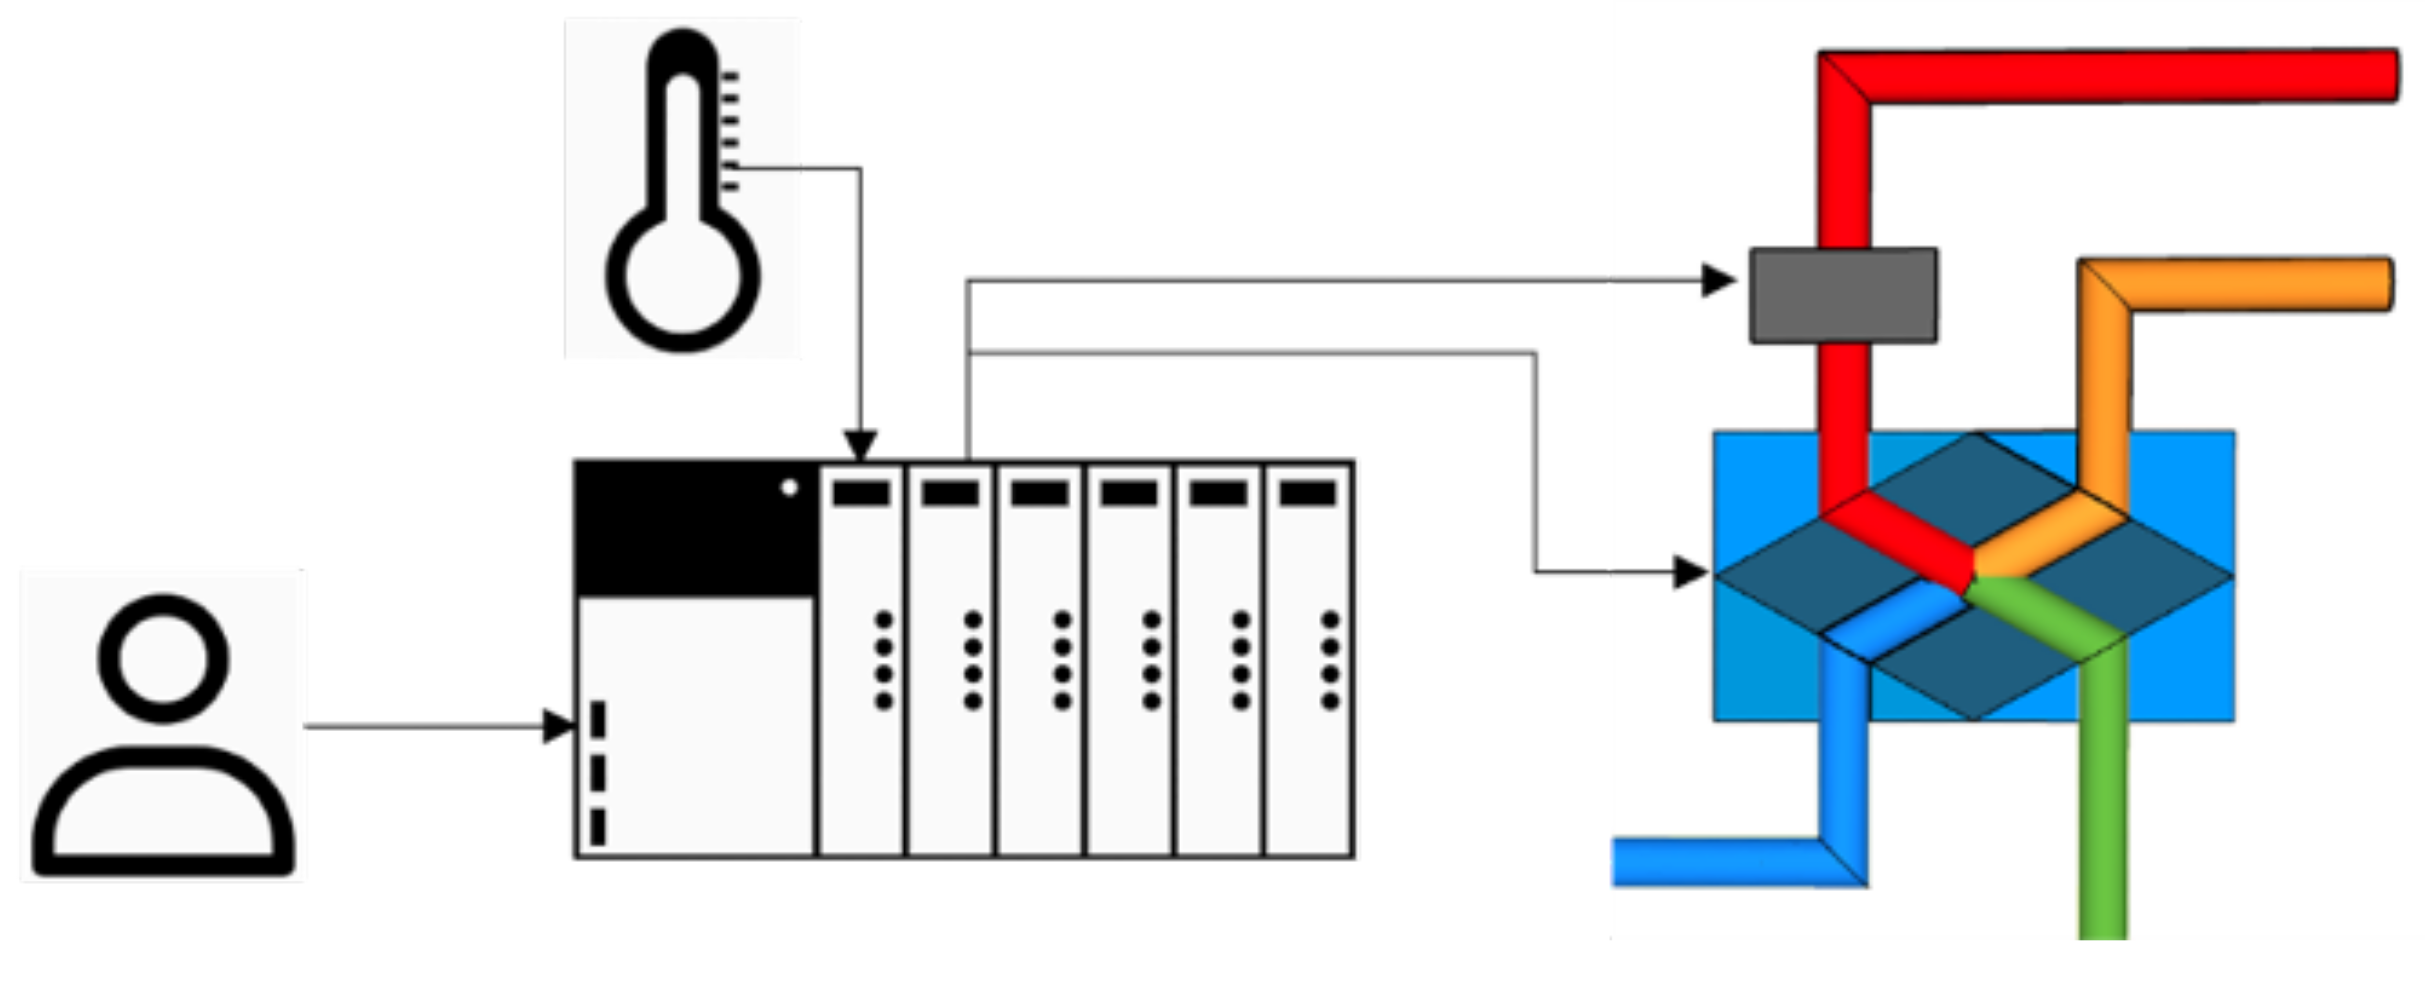
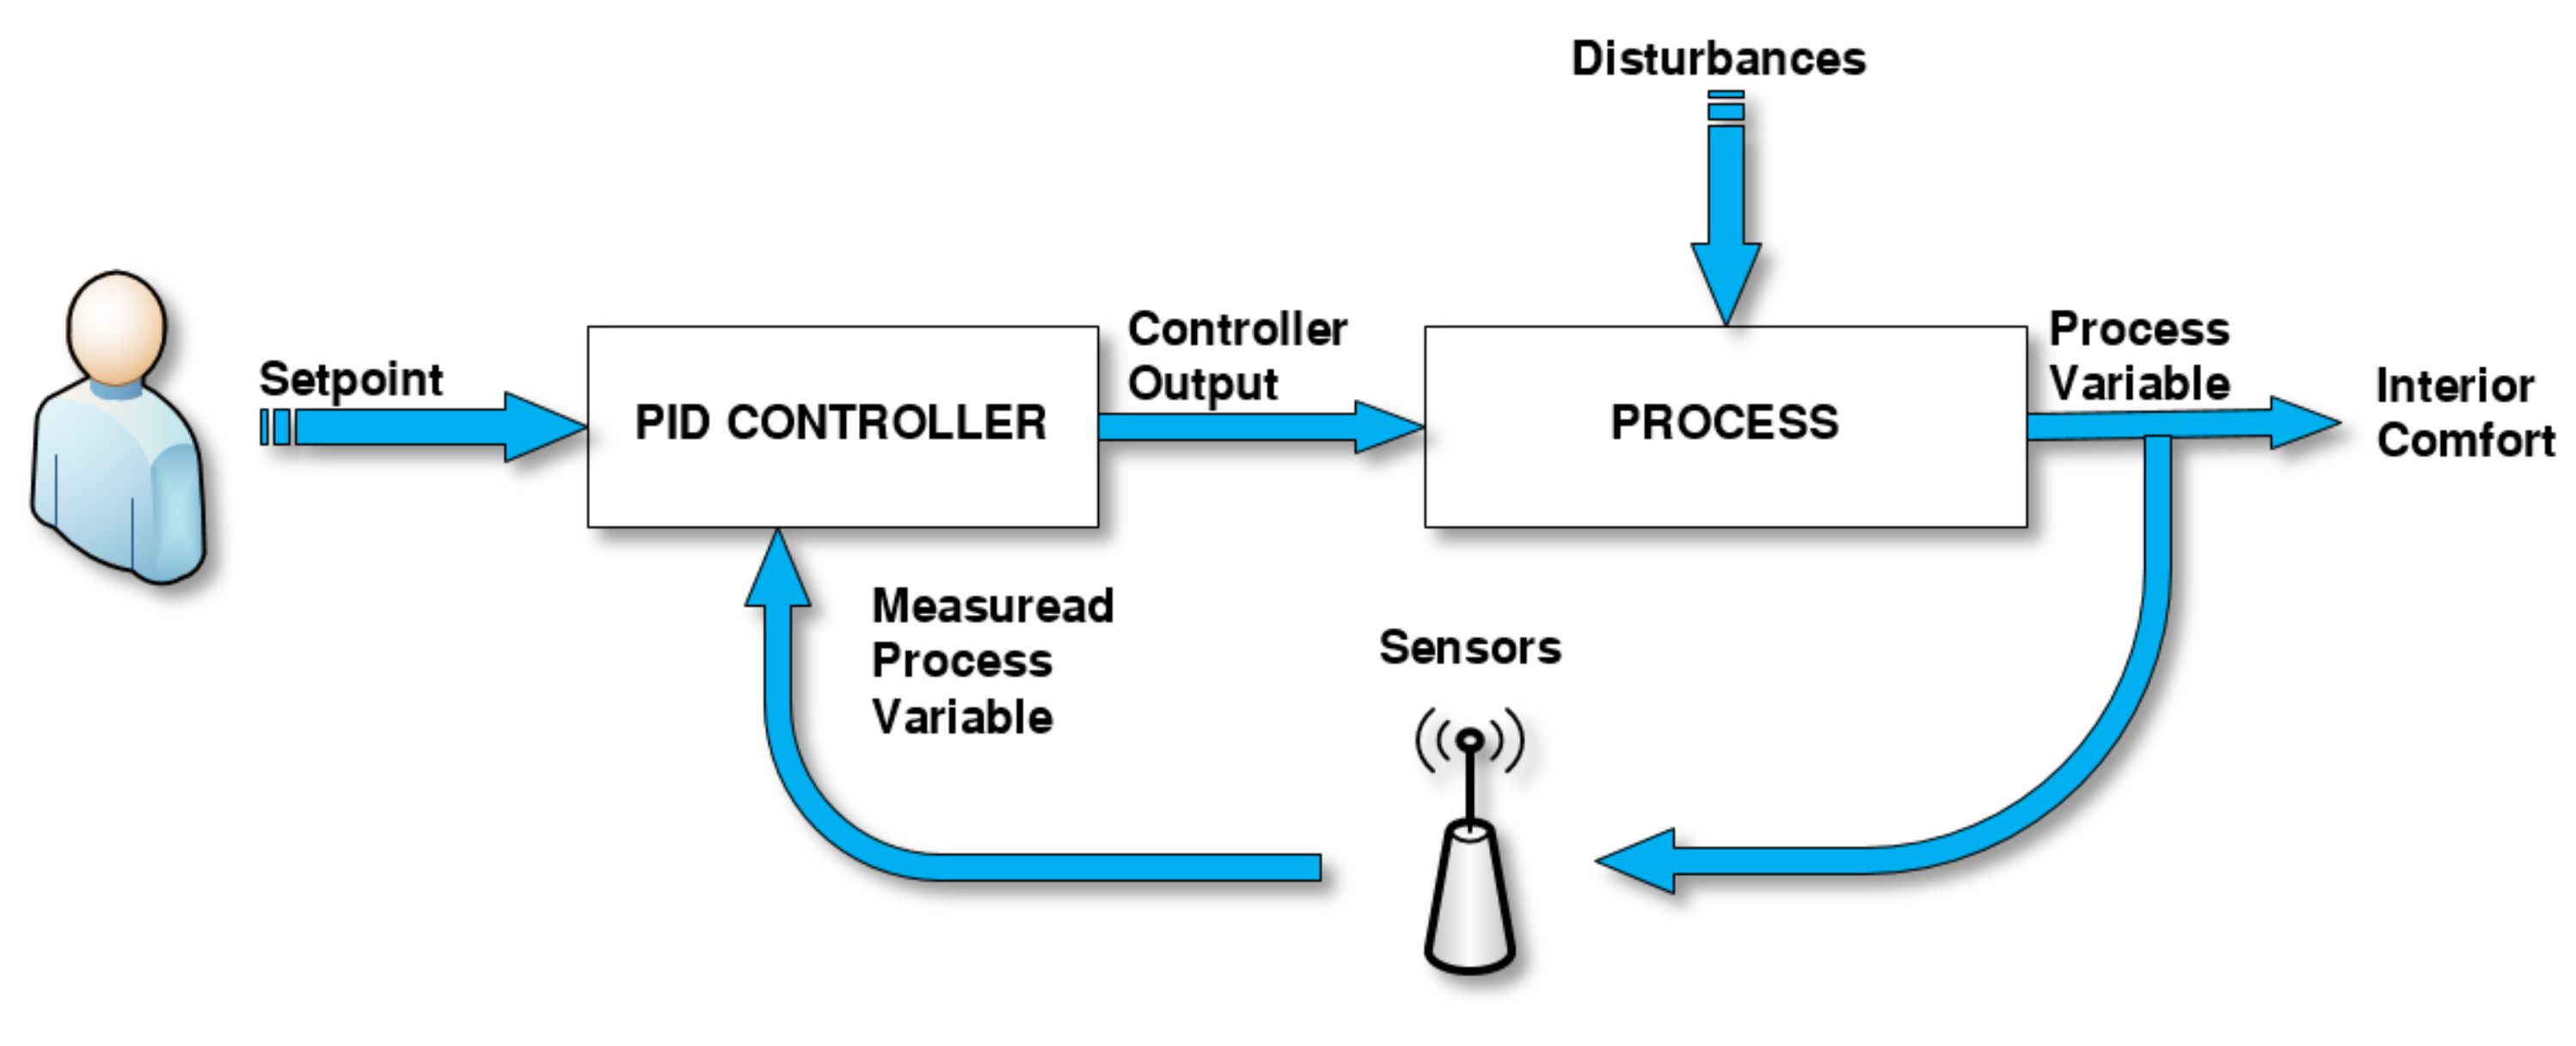
In
Figure 3, the data path of the sensor node is presented. First, the sensor node collects the comfort and air quality parameters via RESTful API, which encapsulates JSON messages. After receiving the sensor information, the data follows two paths: firstly, it is stored in the local database, and secondly, it is transferred to a local PLC via MQTT protocol. The PID controller later uses the temperature values, which adjusts the thermal comfort based on user-specified comfort parameters.
5. Control of the HVAC System through IoT
The case study is a building built within the campus of the University POLITEHNICA of Bucharest. The passive house, shown in
Figure 5, is a duplex with two floors and an N-S orientation. Each Passive House has a usable area of 140 m
, being designed for a family of 3–4 members. The HVAC solutions used in Passive Homes are based on current technologies that promote renewable energy sources.
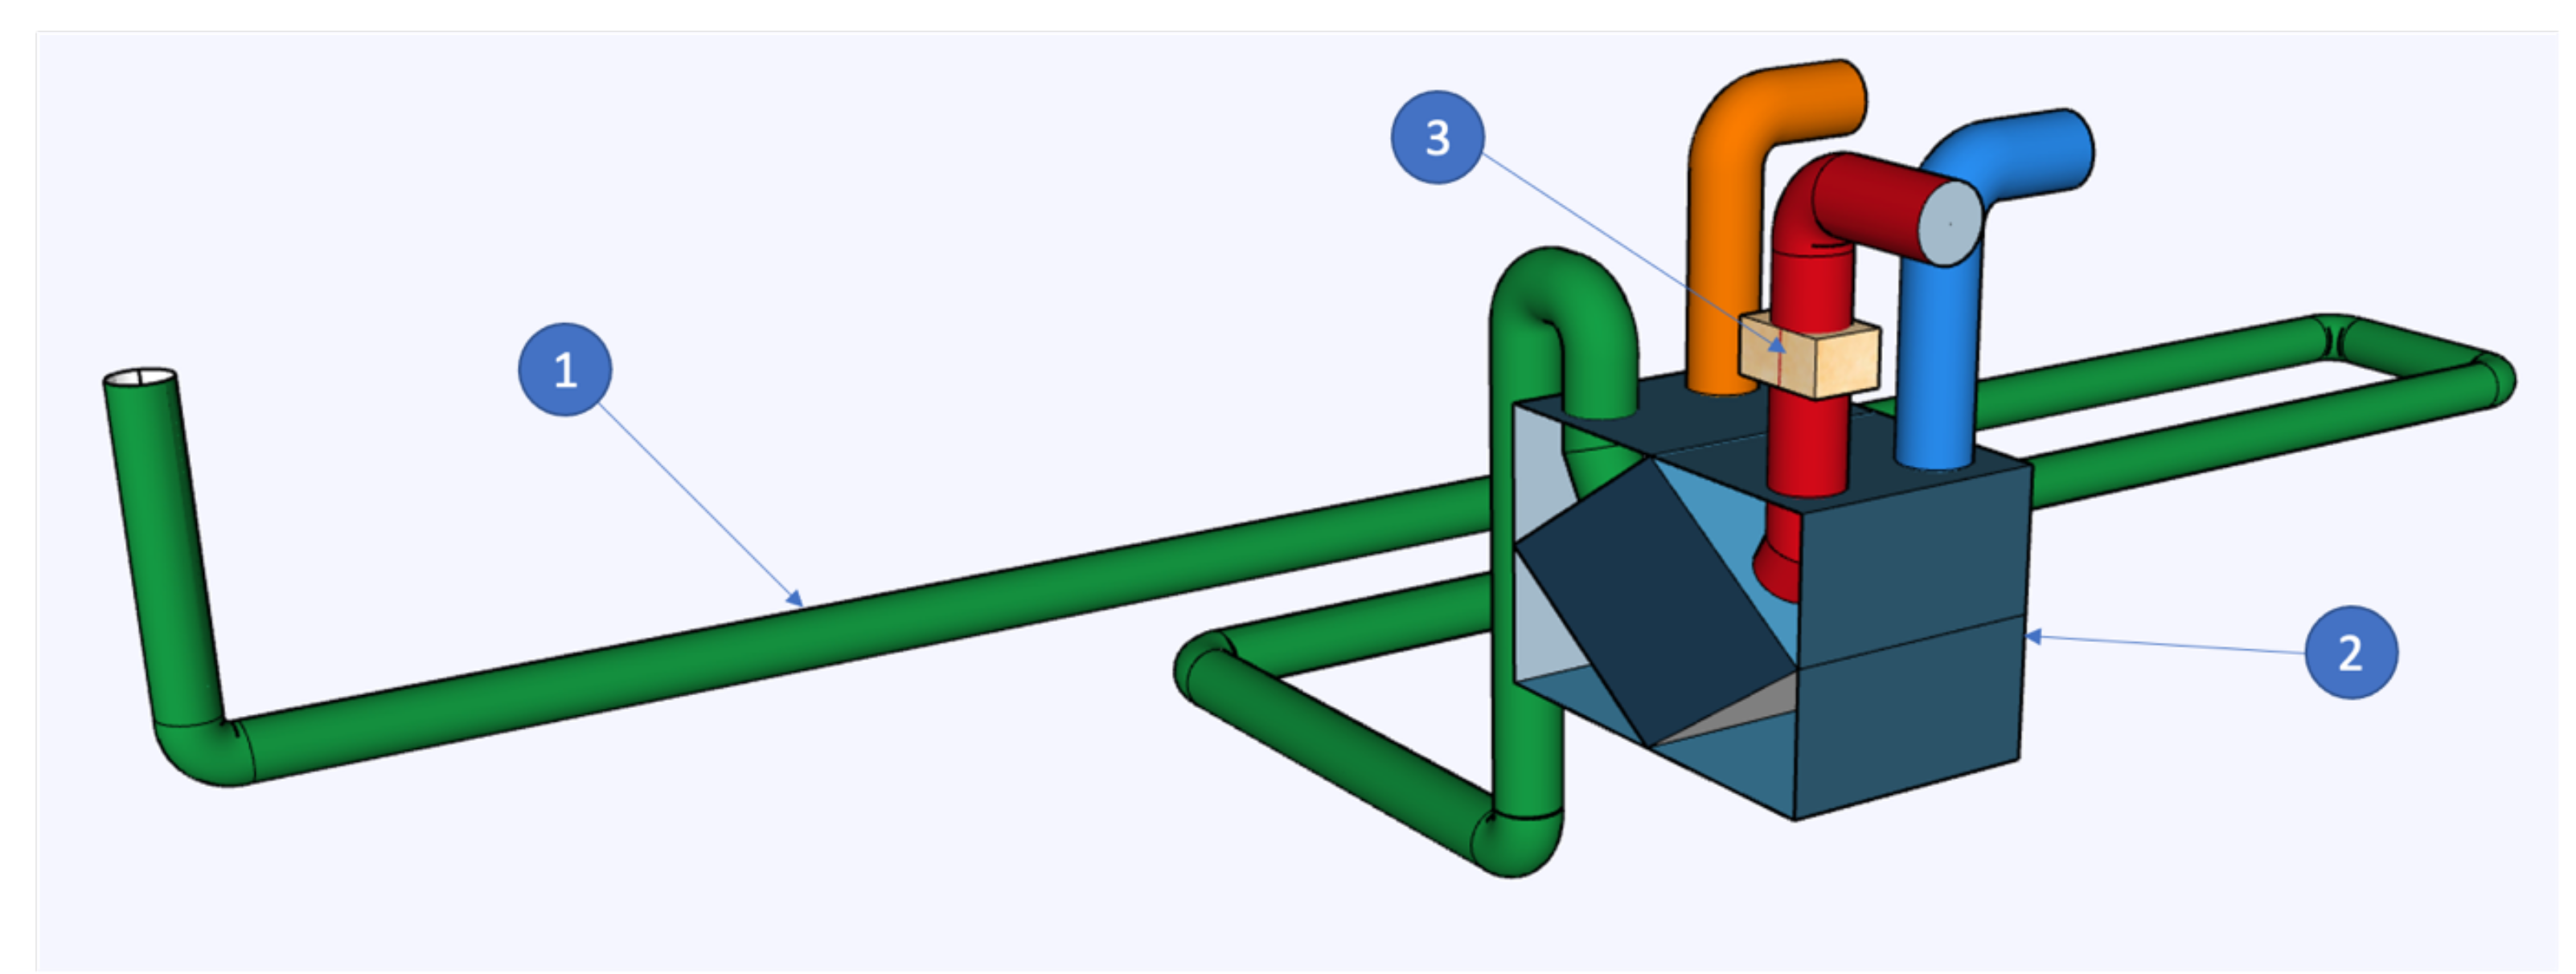
As shown in
Figure 6, the HVAC system of the Passive House consists of an Earth-to-Air Heat Exchanger (EAHE), a Mechanical Ventilation Heat Recovery Unit (MVHRU) and an air duct electric heater. Each component of the HVAC system plays an essential role in ensuring thermal comfort.
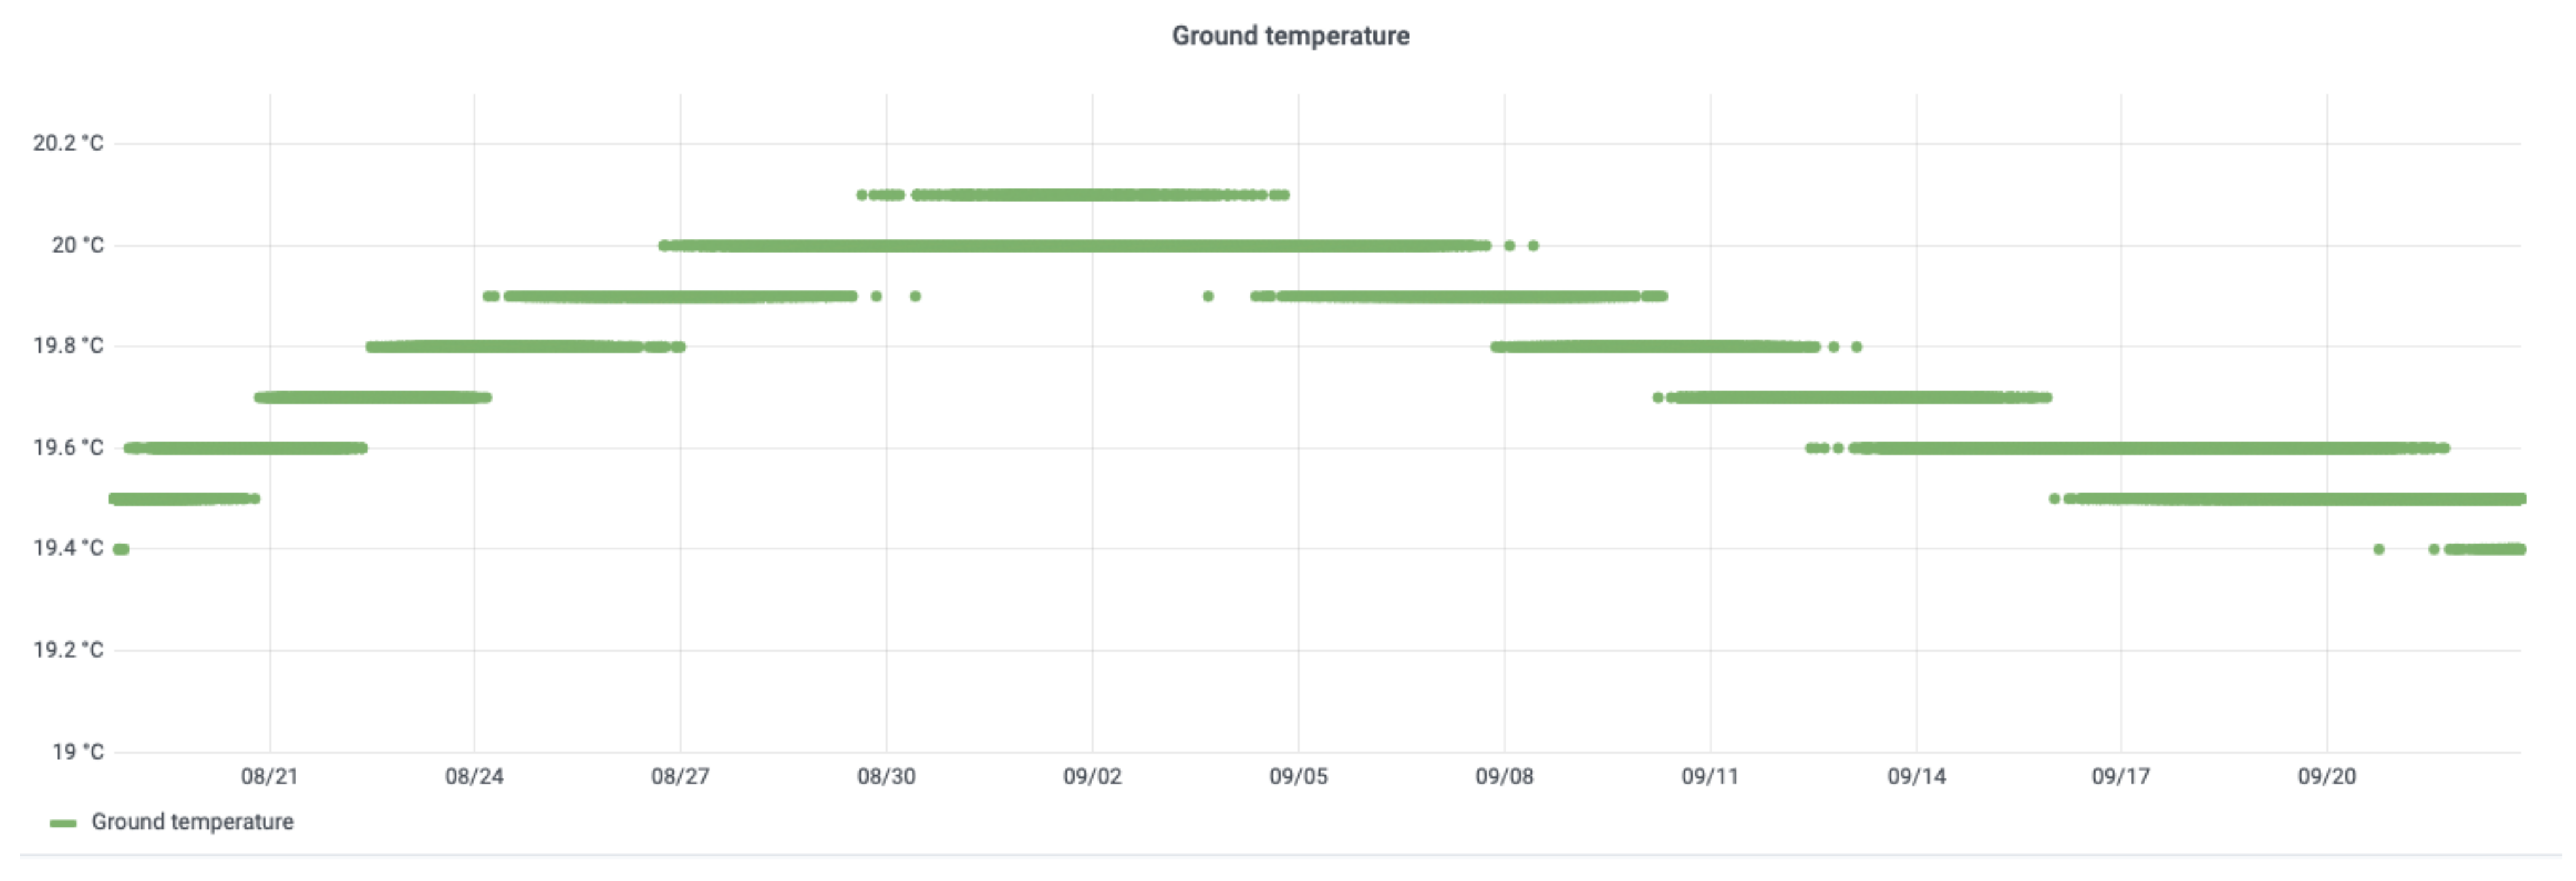
The EAHE uses the natural property of the soil to maintain a quasi-constant temperature throughout the year. It consists of a pipe with a diameter of 200 mm, a total length of approximately 40 m, positioned horizontally, in the shape of the letter U and at a depth of approximately 2 m. As it can be observed in
Figure 7, the ground temperature for 30 days tends to increase during warm seasons and decrease during cold seasons. According to the available data, the soil temperature increases during the warm season, reaching a maximum temperature of about 20.2
C at the beginning of September.
The EAHE is used to preheat the air during the cold months without generating high-energy consumption. During the summer, the air is cooled and introduced into the building. The performance of the EAHE can be calculated using the heat transfer efficiency relation:
where
Toutside is the temperature of the outside air entering the EAHE,
Toutlet is the air temperature at the outlet of the EAHE and
Tground is soil temperature.
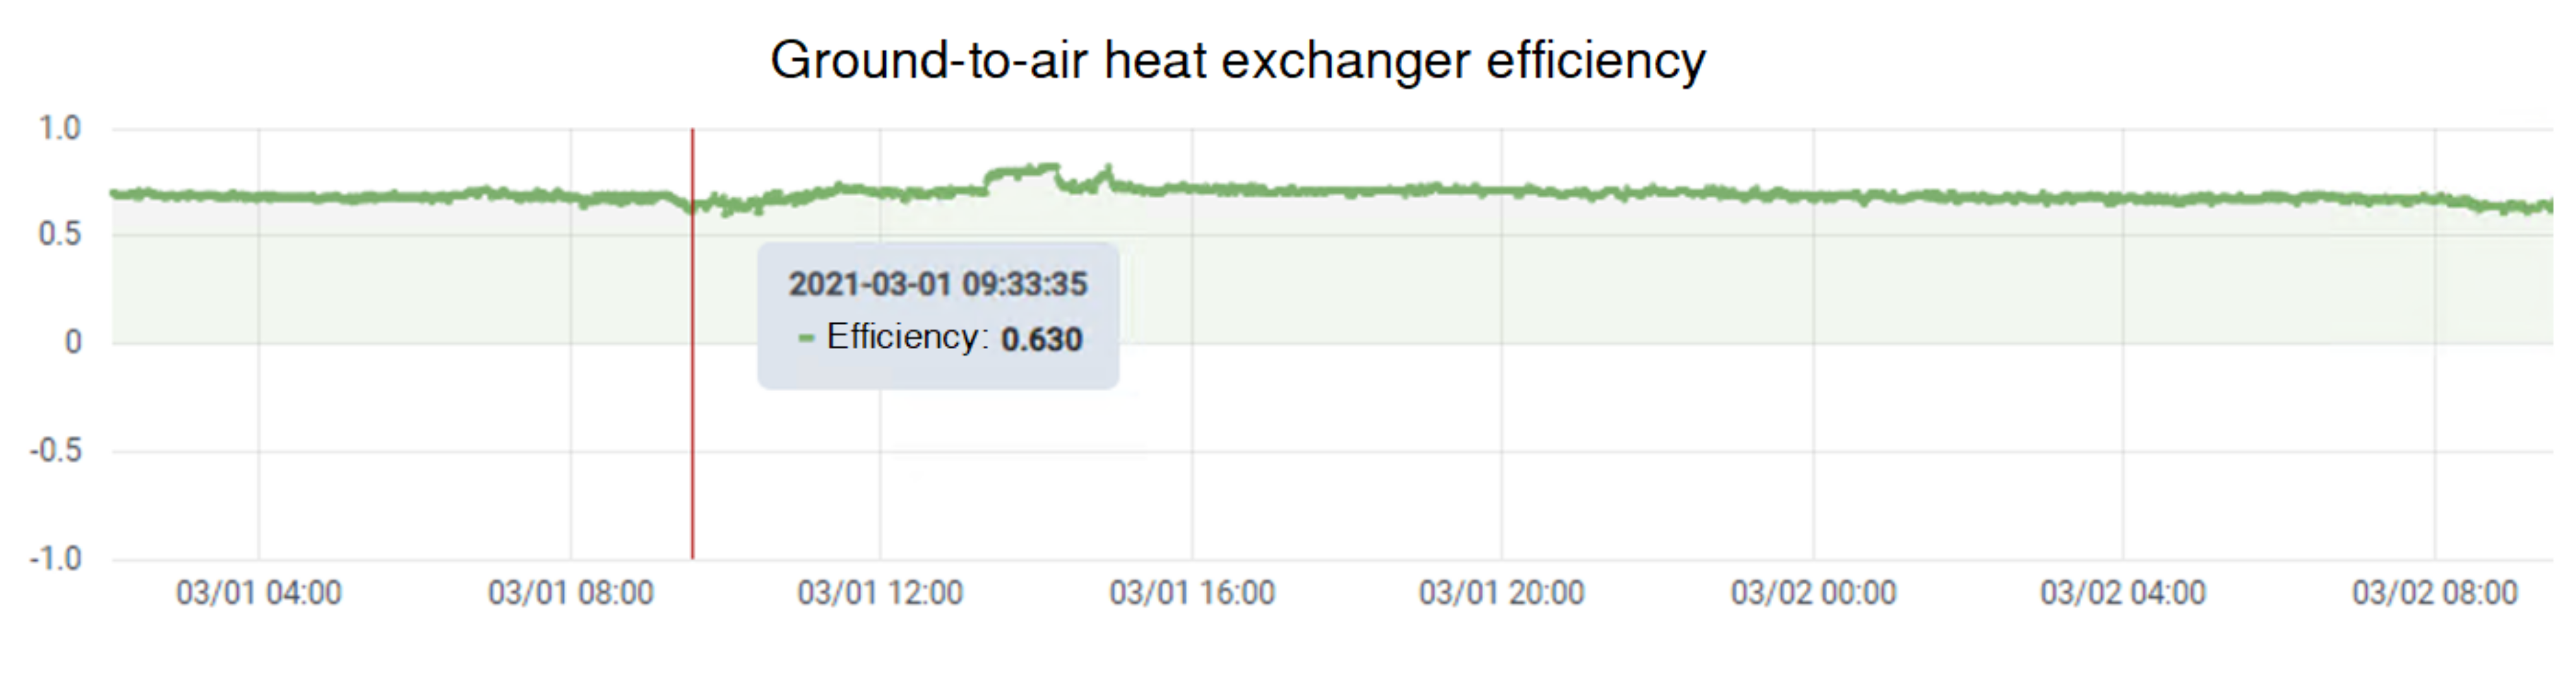
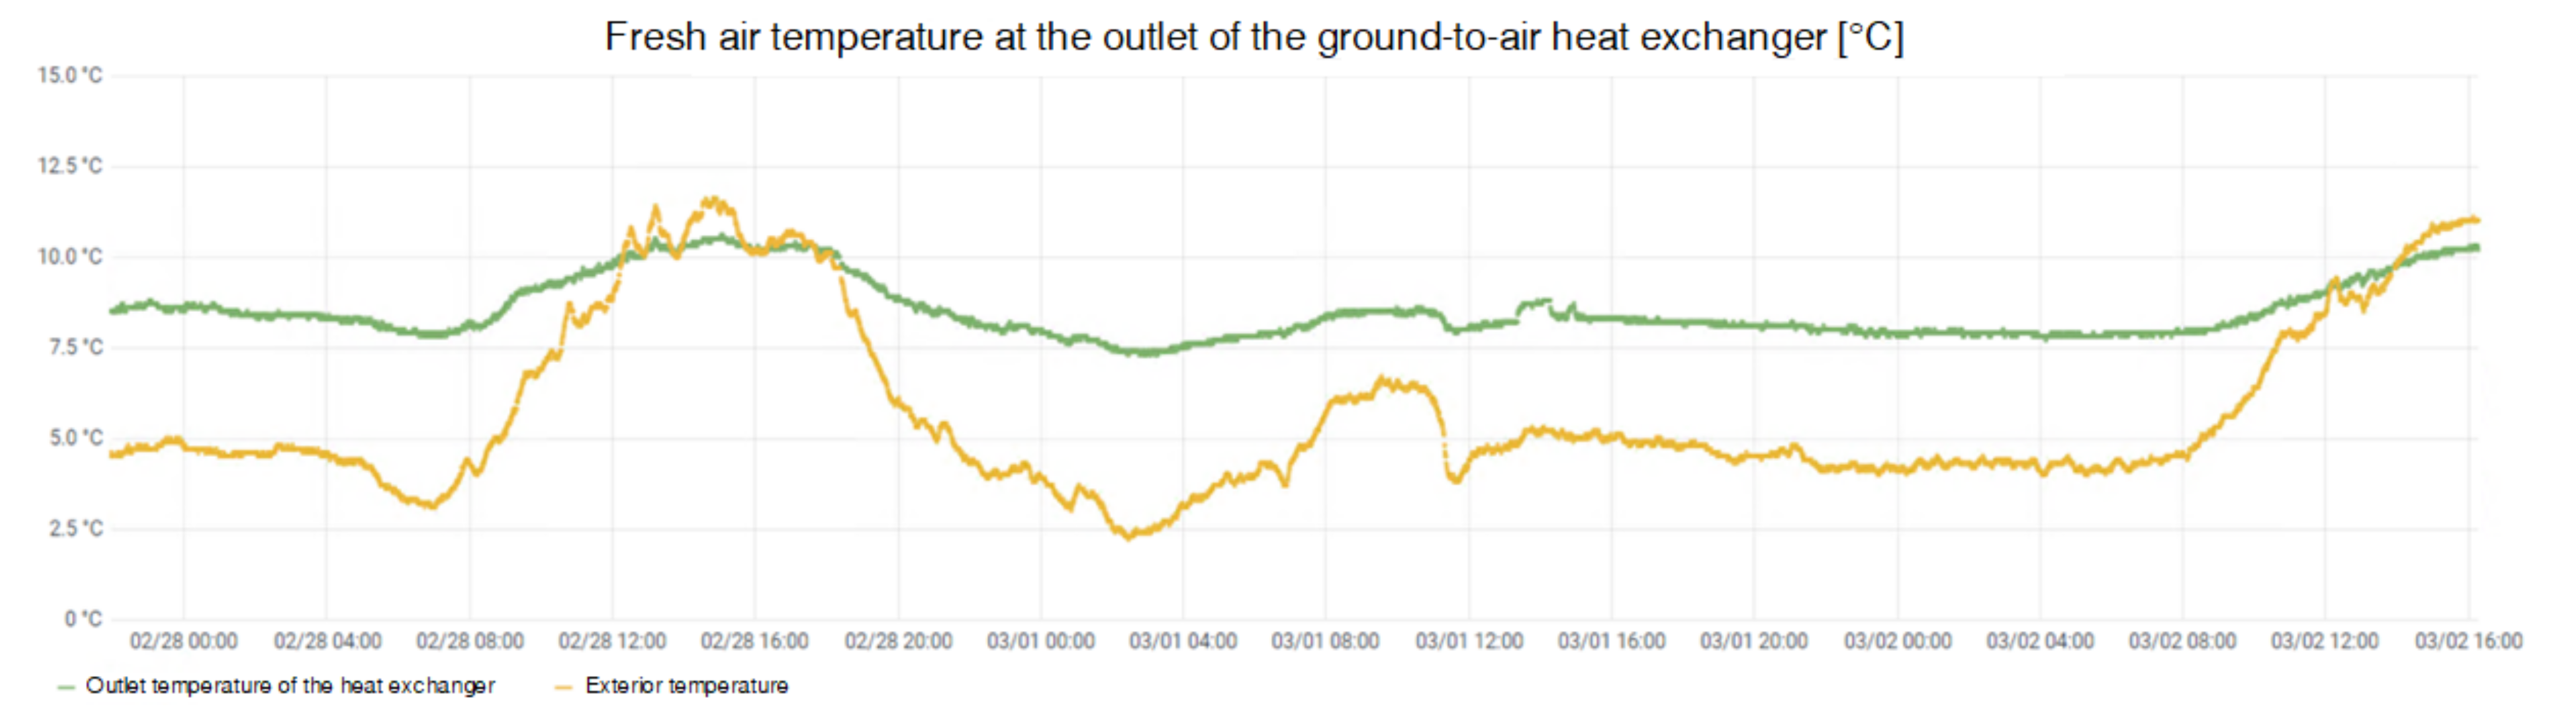
At the same time, the efficiency of the EAHE also depends on the airflow. Therefore, the efficiency of the EAHE is inversely proportional to the airflow. For example, the graph presented in
Figure 8 shows the efficiency of the EAHE over ten days. As it can be observed, the yield varies around the value of 0.6. In addition, as shown in
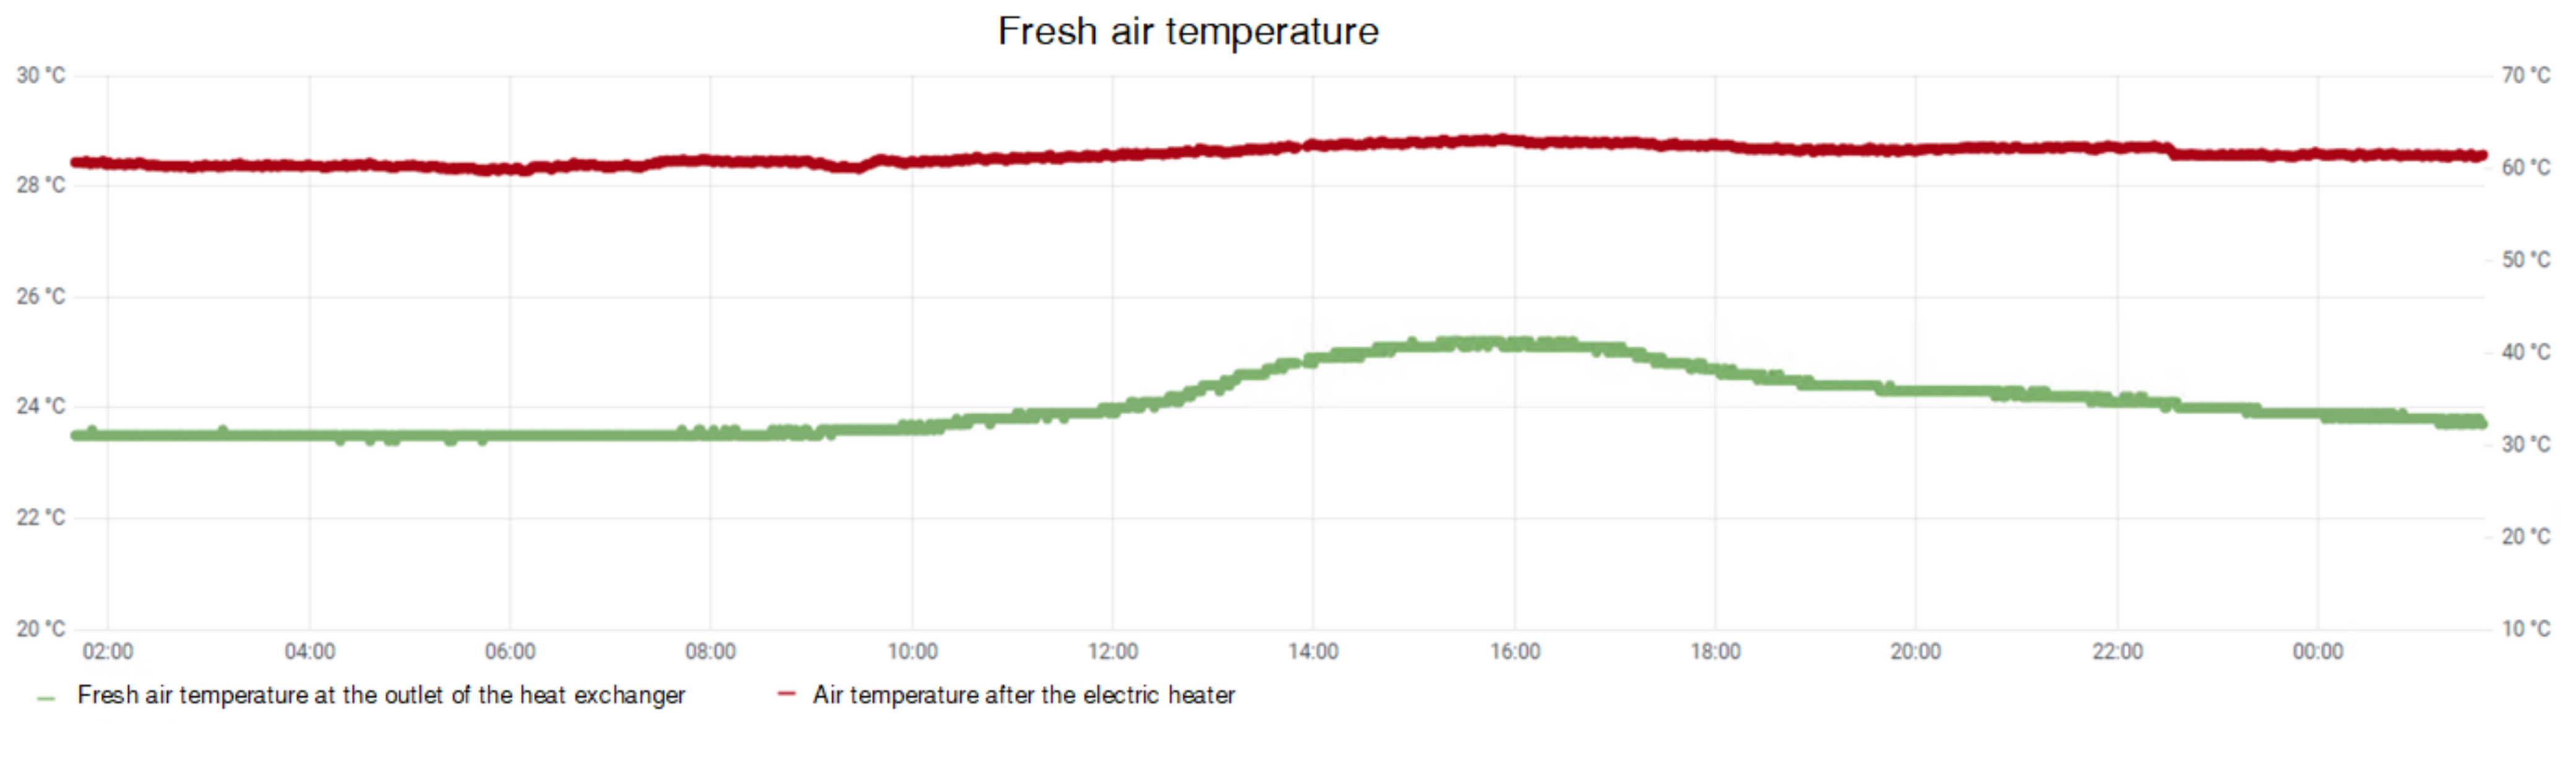
Figure 9, the variation of the fresh air outlet temperature from the EAHE depends mainly on the outside temperature. Based on regional climate conditions, the exclusive use of the EAHE does not make it possible to ensure the minimum temperatures that would provide thermal comfort to the users of the building. Another essential component of the HVAC system is the MVHRU. It consists of two air ducts (160 mm) and a heat exchanger with two radial fans. To increase the conductive and convective heat transfer, the MVHRU uses a crosscurrent heat exchanger in the shape of a chessboard.
In addition, the MVHRU has three ventilation speeds that ensure a fresh airflow of 60–200 m
3/h at 150 Pa. For a flow rate of 135 m
3/h, the exchanger has an electrical efficiency of 0.31 W/m
3/h and a heat recovery rate of 90%. In
Figure 10, the variation of the fresh air outlet temperature of the MVHRU, which varies between 23 and 26
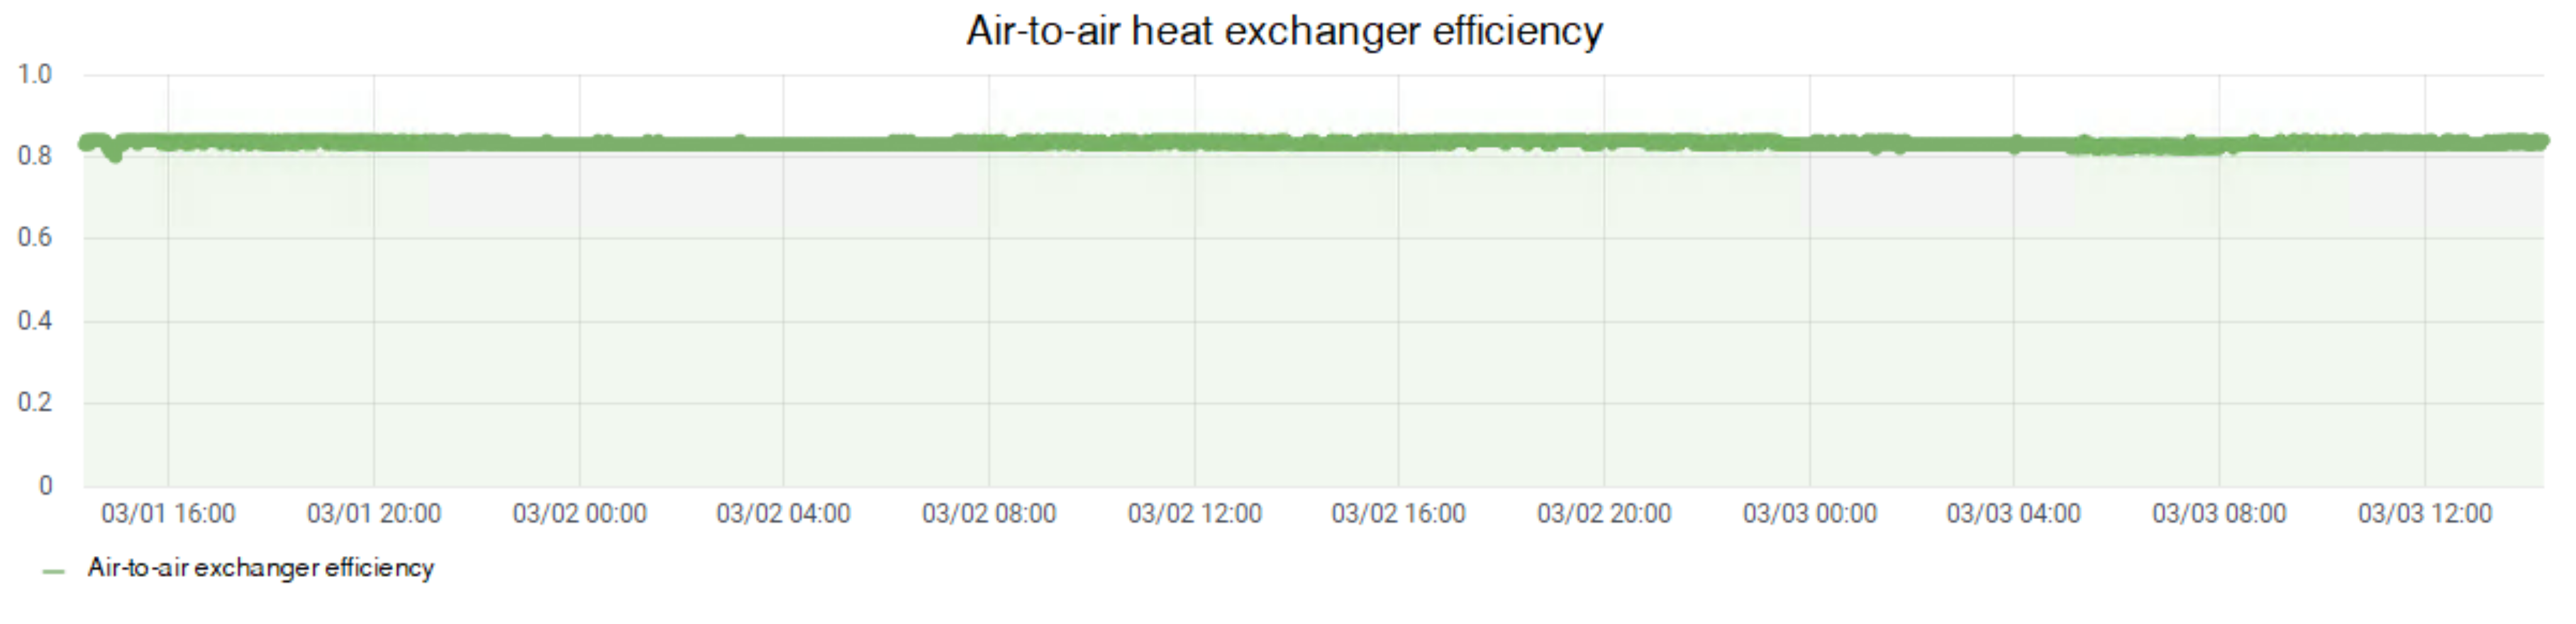
C in a given day, can be noticed. Therefore, to ensure the desired thermal comfort, the air is heated further with the help of a 2.4 kW air duct electric heater. Regarding the thermal efficiency of the MVHRU, it falls within the technical parameters established by the manufacturer. As it can be observed in
Figure 11, the efficiency of the MVHRU varies around 0.85. This value is acceptable because the airflow is higher than the optimum value at which a recovery rate of 90% is reached.
As shown in
Figure 12, to monitor the thermal performances of the HVAC system, the proposed solution is composed of a PLC, which monitors the thermal parameters of the HVAC system and the building, and a wireless sensor node that monitors comfort and air quality parameters. The PID regulator, which is run on local PLC, sets the HVAC ventilation speeds through 0–10 V in the output module. At first, the PID regulator starts with default values that are used in the autotune process. The autotune process outputs the default values of 15% and 25% after 2 min. When the temperature stabilises, the algorithm outputs the PID parameters, as shown in
Figure 13.
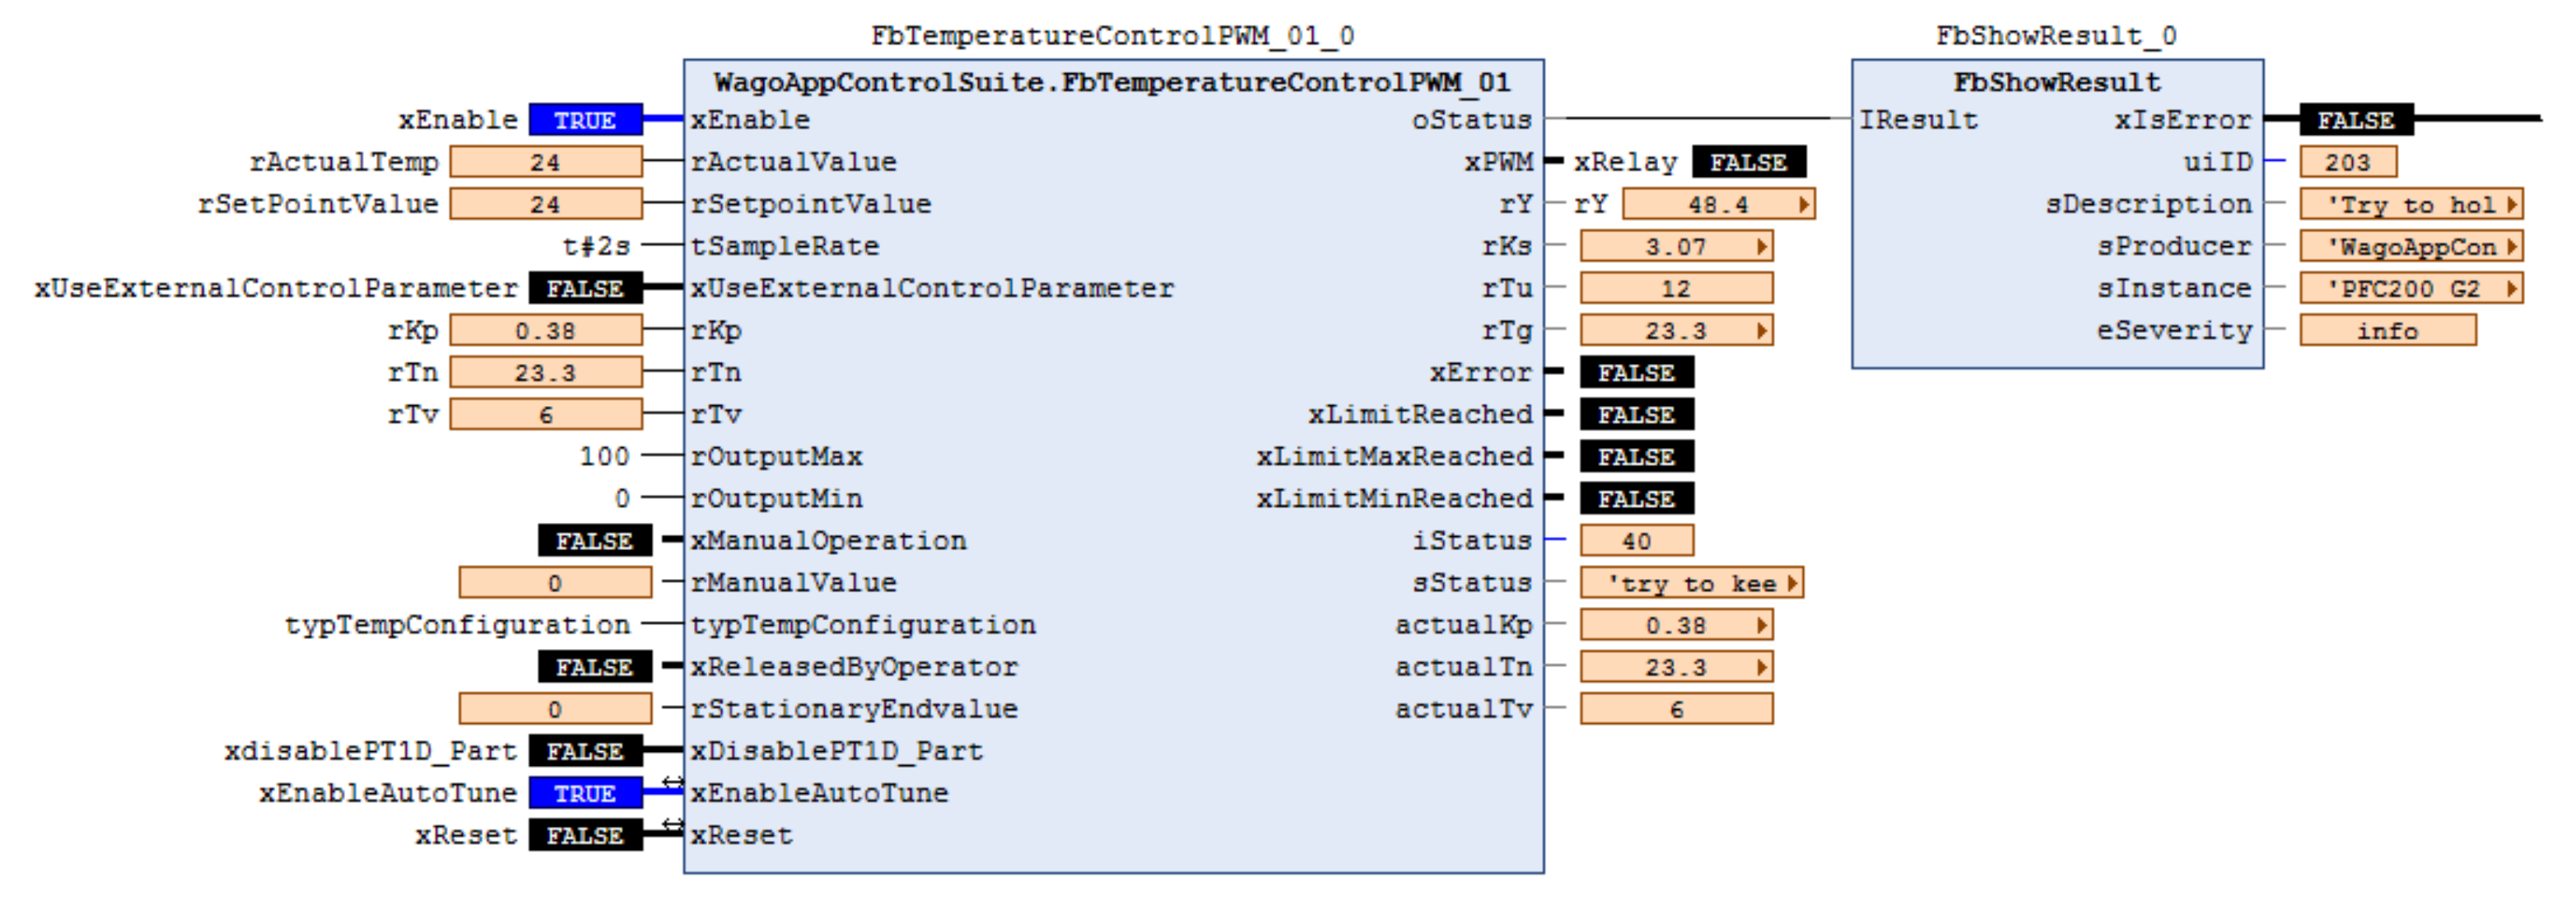
The data flow that sets the comfort temperature starts with the wireless sensor, which sends the data to a local server at a specific time rate. Next, the data are processed by the node-red flow editor application, which obtains the temperature value and sends it via the MQTT protocol to the local PLC. Finally, the value is used as an input for the FbTemperaturControlPWM block, which is configured as follows:
Initially, this block uses a traditional PID controller. Thus, the output “xUseExternalControlParameter” is set to FALSE. The parameter is set to TRUE after the autotune process determines the PID input values.
The controller operates with the input values “rKp” = 0.38, “rTn” = 20.3 and “rTv” = 6, calculated by the algorithm during the autotune process.
Temperature values: In order to test out the PID regulator, the values assigned for the parameter rActualvalue were varied between 18 and 28 C, while the “rSetpointValue” was set at 26 C.
This block internally converts the input temperature and sets the output with a value between 0 and 100. As shown in
Figure 14, during the testing phase, the output stabilises when the optimal temperature is reached.
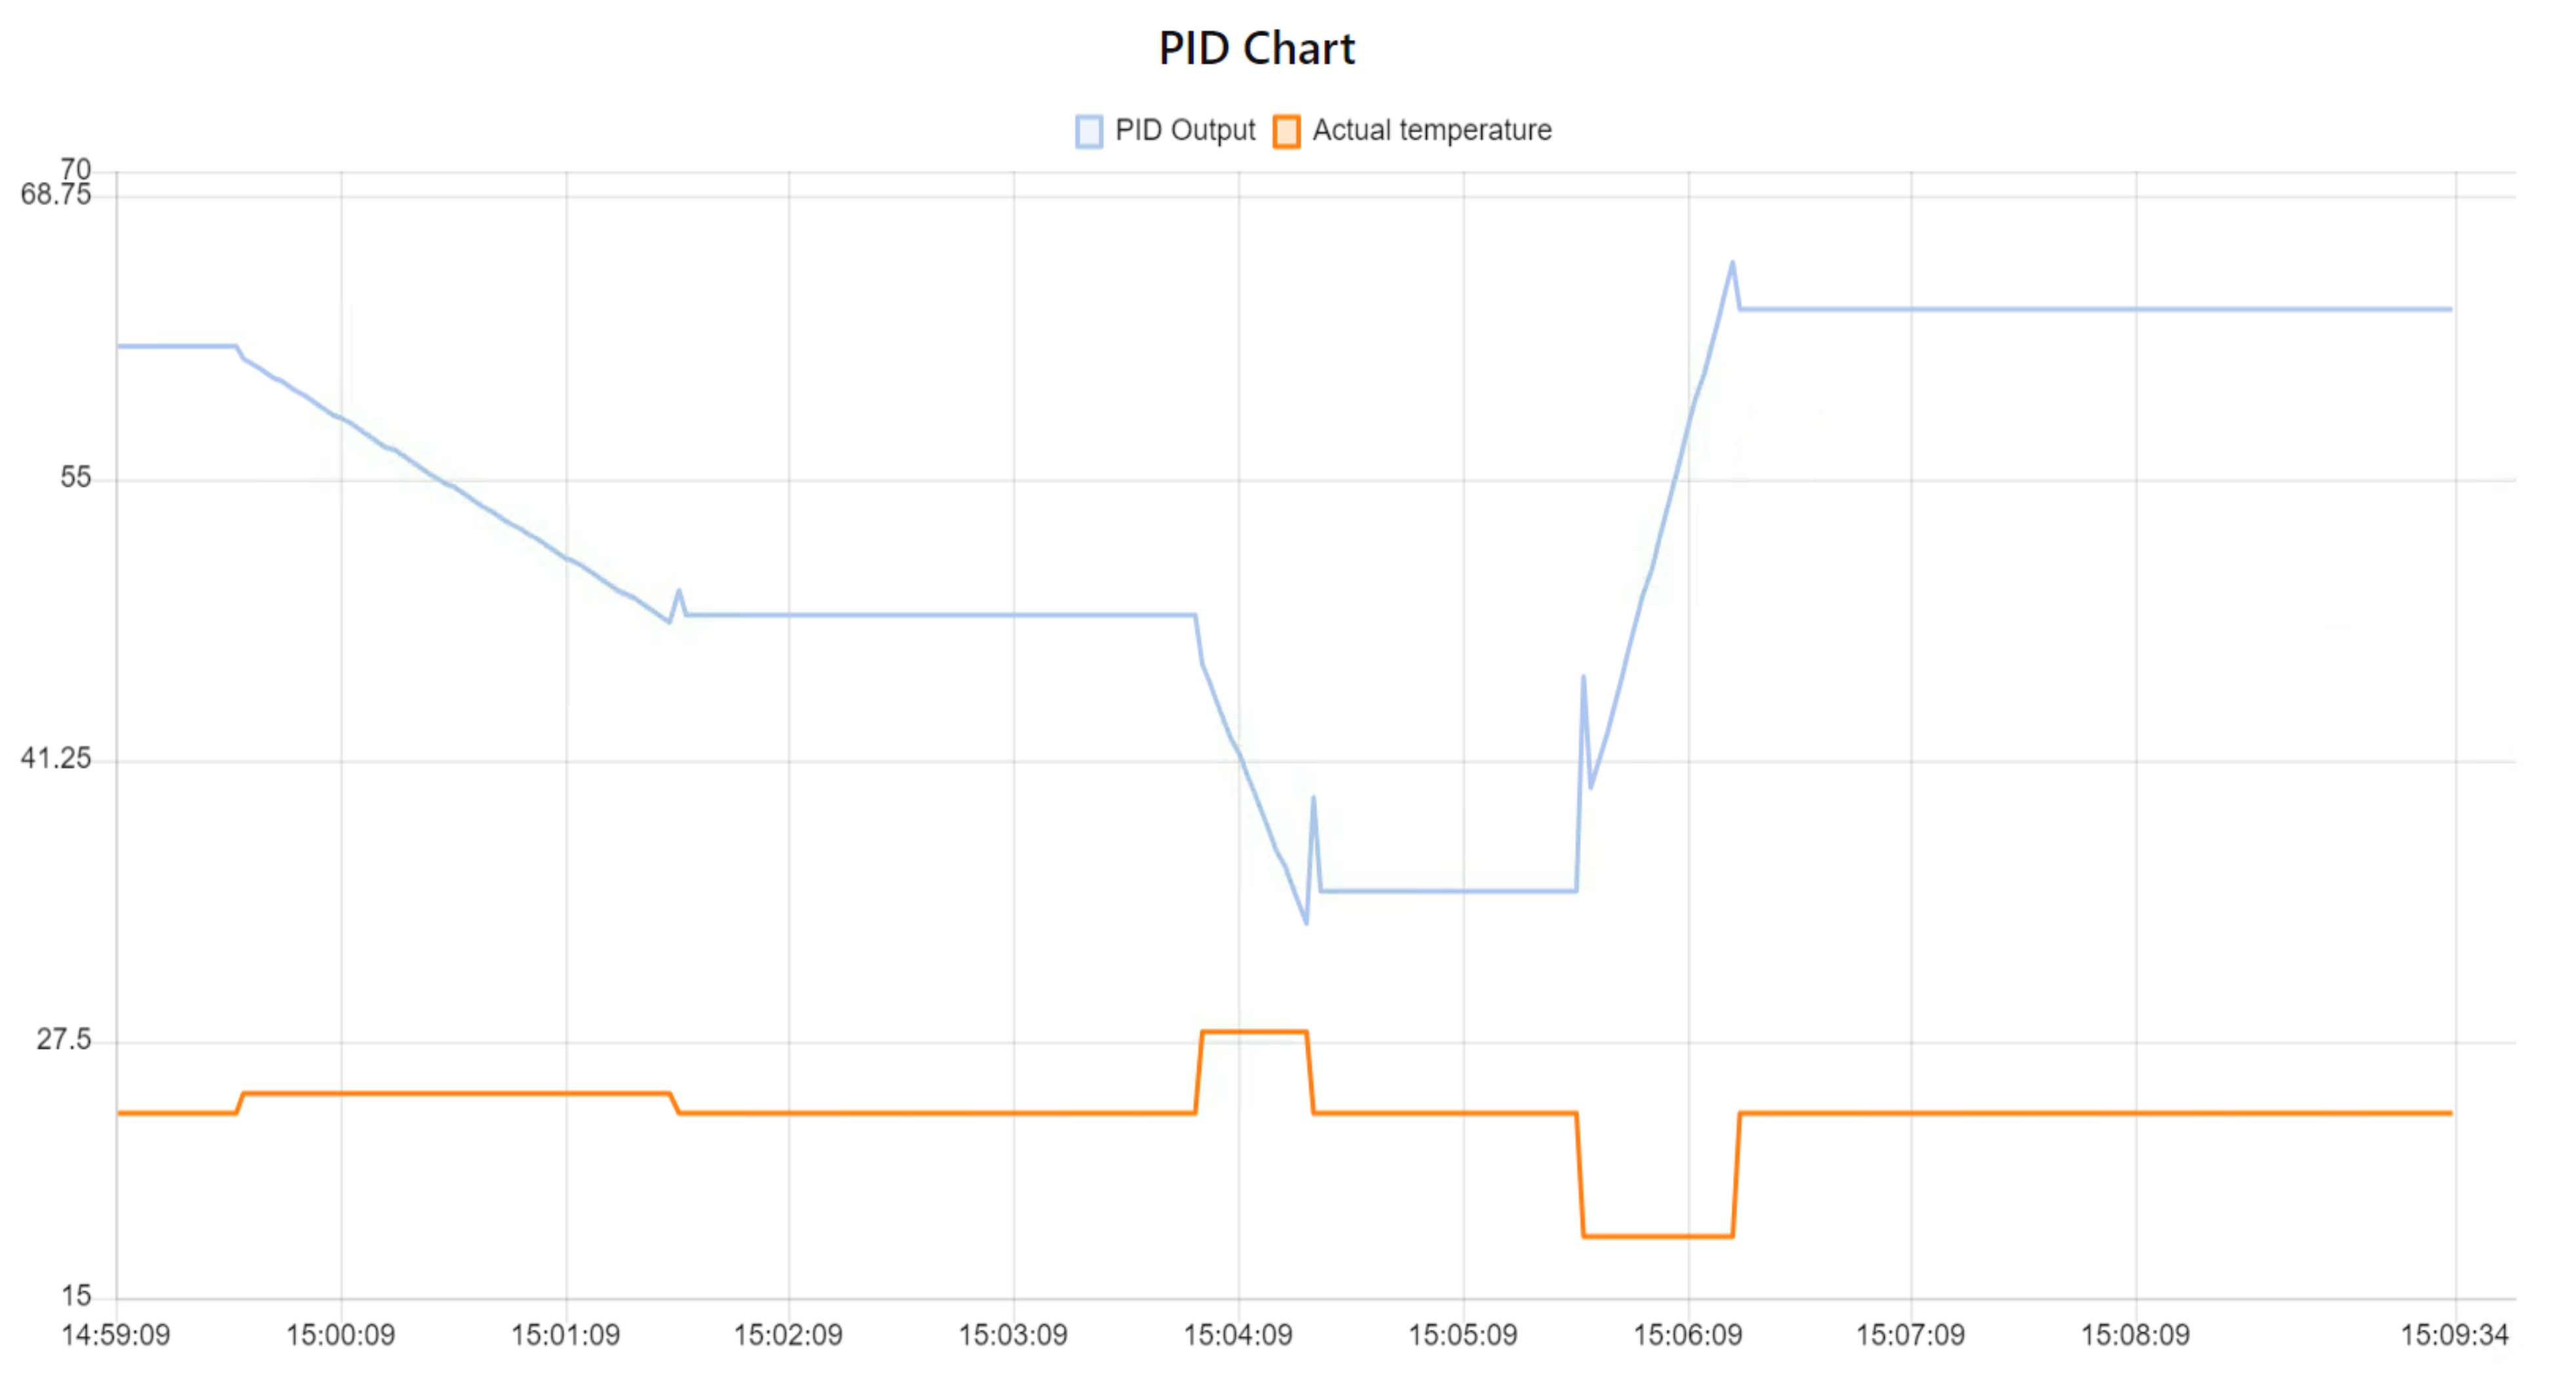
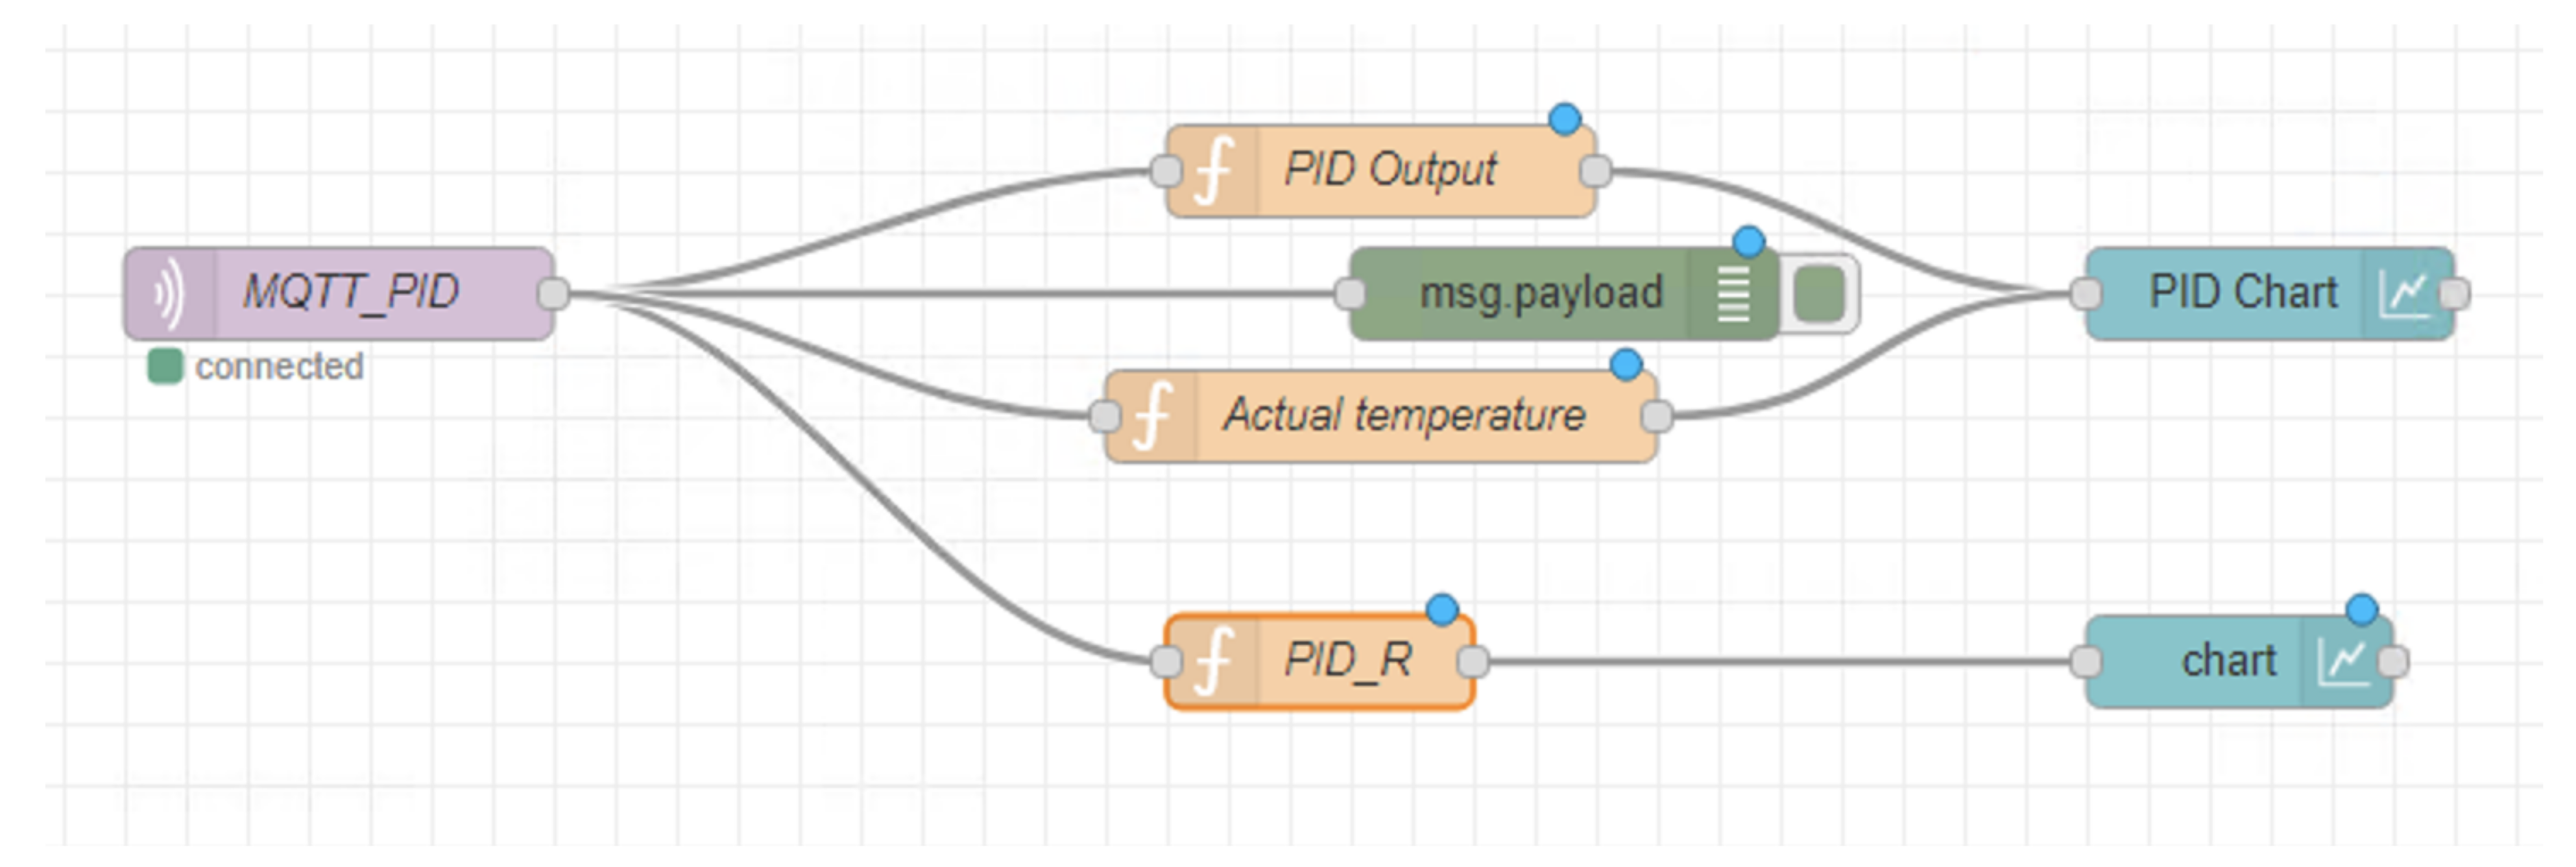
The output values of the PID, together with the temperature value, are sent to the node-red application via MQTT protocol. As shown in
Figure 15, the node-red application processes the values and sends the data to a visualisation application.
In
Figure 16, the variations of exterior and fresh air temperatures supplied by the HVAC system are presented. At the beginning of the experiment, the building is in free-running mode. In this state, the temperature is around 29
C. As it can be observed, the temperature decreases to 24
C, while the outside temperature varies between 18 and 28
C. The experimental results show how IoT control and monitoring solutions can reach a comfortable temperature. Due to building inertia and exterior temperature variation, the interior air temperature slightly decreases during the night and increases during the day.
6. Conclusions
This research has explored novel ways to connect various devices and equipment to monitor and control the HVAC system. The proposed approach shows how IoT-based systems are successfully used in a real case scenario. The intended solution utilises the novelty of MQTT and RESTful APIs as the underlying layers for data exchange, emphasising the ease of integrating various devices. The integration at the software level was achieved through the node-red application, which interconnects multiple flows of data and applications.
Another advantage of the advanced solution is reducing the debugging and deploying time, making the solution flexible and easy to replicate in other fields of interest. To test out our approach, a PID controller was implemented. The data flow starts with the wireless sensor node, which sends the data to a local server where they are processed, stored and sent through MQTT to a local PLC. Next, the PLC supplies the PID controller with the input data provided by the wireless sensor nodes. Finally, the PID outputs a value feeding an analogue output port that controls the HVAC system. Cross-functional integration of various devices, in this particular case, was achieved on a software level. The development prospects of the residential sector with the emphasis on new digital technologies and solutions based on IoT architectures are opening up new opportunities for innovation and energy efficiency. Considering that the HVAC system is a substantial energy consumer in buildings, the discussions concerning indoor comfort are closely related to energy consumption.
In addition, the European legislative framework focuses on measures aimed at reducing energy consumption. Therefore, the interest in interior comfort and energy consumption leads to increased research to develop new digital technologies to monitor and control HVAC systems with higher efficiency levels.

