1. Introduction
The Arctic and Subarctic are important regions for the country’s natural resources exploration economy. Natural and man-made risks for infrastructure facilities increase under conditions of climate change, the variable response of permafrost, and the transformation of geocryological conditions in connection with economic activities [
1]. There are new dangers associated with poorly studied processes of the transformation of saline and gas-containing frozen deposits. These challenges lead to the need to develop a scientific and methodological approach to adapting technical and managerial solutions for implementation in the Arctic territories.
In the context of this work, the expected adaptation of human economic activity to the climate and permafrost dynamics is considered. By this, we mean any corporative activity aimed at reducing the negative consequences of climate change or using the emerging new opportunities for the further socioeconomic development of society and rational nature management [
2,
3].
The selection of adaptation technologies for nature management in the cryolithozone is a purely scientific problem that requires deep knowledge of permafrost transformation as a multifactorial process, an assessment of its environmental and economic consequences, and the development of methodological approaches and compliance with certain requirements for the economic development of these territories.
In the case of planned (standard) adaptation, it is necessary to introduce additional instructions into the guidelines and codes, allowing to foresee the engineering and technological consequences of climate change at the production facilities of the Gazprom Company, to take them into account in the design documentation, standards, and documents regulating the entire life cycle of its production facilities. When performing a current (reactive) adaptation, it is necessary to apply measures based on the assessment of the actual effects of climate change, manifested in the disruption of the normal functioning of structures.
Most of the infrastructure of Gazprom’s production facilities was built over several decades, and was developed using standards based on the idea that the climate characteristics would remain permanent. However, under the changing climate and geocryological conditions, the “safety factor” for many structures became insufficient. To ensure the safe and efficient functioning of such structures, it has become necessary to use special adaptation technologies.
It is very difficult to quantitatively assess and predict the dynamics of permafrost change, and, accordingly, to propose and implement adaptation measures. These dynamics depend on natural and man-made character effects. In these conditions, forecasting and modeling seems to be one of the most important mechanisms for the implementation of adaptation. The task of forecasting is to quantify the dynamics of the climate and permafrost for the next 30–100 years and beyond. Modeling allows us to study the interactions and feedback of components, providing tools for studying the response of the system to changes in external influences that affect each of the components. Based on these data, the state and properties of the rocks of the permafrost zone are calculated, on which the safety and durability of the objects of the technosphere depend.
Due to the high variability and unevenness of climatic changes, as well as the dependence of the distribution of the temperature field on a number of regional factors, the developed models of adaptive nature management are regional. They are based on particular scenarios that not only take into account trends in temperature changes, but also the specific data on the natural conditions of the studied territories, the peculiarities of technogenesis, and the degree of environmental degradation that has already occurred. The nature of the major tasks indicates that the development of an adaptation technology for nature management is an interdisciplinary problem, based on the scientific achievements of a number of basic natural history and management disciplines.
The problems of the climatic and permafrost adaptation of infrastructure facilities have been investigated most thoroughly in Canada [
4]. However, in Canada, the main focus was on the design and construction of new structures. Gazprom has a well-developed infrastructure, and the issue of maintaining the functioning of existing facilities is very important in this study.
Preliminary studies have shown that there are two general approaches to information support for adaptation program development. The first approach involves the use of actual data on the permafrost evolution obtained as a result of geocryological monitoring. Thus, the current trends suggest the prioritization of administrative and engineering activities. The second approach involves the use of permafrost forecast data to determine the territorial and time priorities of adaptation.
2. Monitoring as an Instrument for Characterizing the State and Dynamics of Permafrost
The monitoring of Gazprom’s engineering facilities in Russia is carried out in accordance with the provisions of the currently valid guidelines and regulations:
- -
STO Gazprom 2-3.1-072-2006. “Regulations for geotechnical monitoring of engineering facilities of the gas complex in the permafrost zone”.
- -
RD-153-39.4-056-00. “Rules for the technical operation of oil trunk pipelines”.
- -
“Methodological recommendations on the use of AKM for diagnostics of pipeline GTS and environmental monitoring—1995”.
- -
WFD 39-1.13-081-2003. “System of industrial environmental monitoring at gas industry facilities. Design rules”.
The experience of the IEG RAS in the north of the European part of Russia and in the Transbaikalia region made possible to develop a generalized approach to the compilation of regionally significant indicators of the permafrost state. The approach provides for the substantiation of representative points of fixing the spatial position of areas with a constantly thawed, partially frozen, and permanently frozen state, mapping areas with different ice content, gas content, and salinity of deposits, fixing representative areas for which the penetration depth of seasonal temperature fluctuations and the tendency of this depth change are estimated.
The assessment of permafrost dynamics is not standardized in Russia at the present time. There is no accepted approach that takes climate change into account. In order to correctly use the results from modeling and forecasting the state of the permafrost, it is necessary to use additional indicators that will help investors, economists, and design engineers to make adequate decisions. The indicators used, such as the average annual temperature of rocks at the depth of penetration of seasonal fluctuations, the depth of seasonal thawing, and characteristics of the areal distribution of permafrost are important, but are not widely used in practice. For example, the salinity of soils leads to a significant loss of their bearing capacity when the temperature of the frozen soil rises, although the soil remains formally frozen and has a negative temperature. Another example is the depth of seasonal temperature fluctuations, which changes over time, giving rise to the problem of comparing thermal monitoring data.
The assessment of the activity of hazardous processes is standardized in Russia in the code “SNiP 22-01-95”. However, it assesses the relative area with periglacial phenomena that are not directly related to current processes activity, but often reflect their history. Our proposal is an approach that assesses a hazard (potential or realized) on a large and medium scale, always according to the areas of predicted phenomena, using the results of geocryological forecasts of the temperature regime of rocks.
Thus, it is necessary to develop a methodological approach that helps to form regional indicators of the state and dynamics of permafrost. Such indicators should be objective, comparable, and relatively easy to determine. For example, the indicator “position of the southern boundary of permafrost” is difficult to determine, since it strongly depends on the scale of mapping and is difficult to verify on the ground using field data. Similarly, the use of the average annual temperature of permafrost leads to loss of information about the landscapes in which destructive processes will develop in the first place.
The state of permafrost and the process of the transformation of it will be used for assessing the sustainability of infrastructure facilities separately for background (natural) and infrastructure impact zone (disturbed) conditions [
5,
6]. All monitoring data only provide the local characteristics of the state and dynamics of permafrost conditions. This raises the problem of extrapolating these data to the territory.
All of these considerations can be summarized by a list of indicators of the state of permafrost conditions, applicable for each unit of storage of the initial data (wells, pits, sites), and for larger zoning elements. The list includes the following indicators:
- -
Depth interval within the seasonal temperature fluctuations;
- -
Average annual temperatures of air, surface, and soil at different depths;
- -
Average permafrost temperature within a group of sites, related to the coldest and warmest types of terrain, as well as areas with soils with high ice content;
- -
Depth intervals with partial freezing and thawing (with the establishment of a criterion for the amount of unfrozen water);
- -
Temperature of the beginning of phase transitions at the bottom of the active layer;
- -
Sign and magnitude of the geothermal gradient below the penetration depth of seasonal temperature fluctuations.
According to the listed indicators, it is recommended to build maps of the state and dynamics of the permafrost conditions of the economic development of the territory. The characteristics of the activity of the processes are compared on the map and on the time charts with data on events and trends from the list of factors for each of the processes under consideration. Actual geocryological hazards reflect the recent dynamics of the transformation of geocryological conditions, which determine the background (regional) activity of unfavorable geocryological processes. The dynamics of the soil temperature at a depth of 10–15 m over the past 40–50 years is displayed using the isolines, in fractions of comparison with the rate of the mean annual air temperature.
Events are understood as manifestations of factors, the formation of which is significantly less than the characteristic time of exogenous geological processes. Events are subdivided into natural and man-made. Natural events include abnormal events, such as extremely warm summers, extremely snowy winters, extremely intensive local precipitation, and wild fires. Technogenic events include regulatory and non-regulatory impacts on the environment, the consequences of which affect the activity of exogenous geological processes, e.g., local artificial flooding leads to thermal subsidence of the surface.
Trends are divided into natural and man-made. Natural trends include climate change, successional changes in vegetation cover, and long-term changes in the structure of the water balance. Technogenic trends reflect the evolution of artificial soil structures, for example, the weathering of soil in the embankment, or the gradual compaction of foundation bedding.
3. Method of Geocryological Forecasting
The authors used numerical methods to predict the background geocryological conditions, taking into account climatic changes. However, it is admissible to use analytical approximate solutions [
7,
8,
9].
Heat transfer in soils, taking into account the phase transformations of pore moisture, is described by the quasilinear equation of thermal conductivity, which expresses the law of conservation of energy in an enthalpy formulation. The upper boundary was taken to be the soil surface in the summer and the surface of the snow cover, the thickness of which varied over time. At the upper boundary, a nonlinear boundary condition of the third kind was specified, where the heat flux was determined from the condition of the radiation–heat balance.
At the lower boundary, a geothermal gradient was set with an initial temperature distribution over depth.
The process of heat propagation in the snow cover was modeled using a linear heat conduction equation with a time varying effective thermal conductivity coefficient.
Implicit locally one-dimensional schemes on non-uniform spatial grids were used as a difference scheme [
10]. The method for solving the quasilinear parabolic equations arising in the simulation of the Stefan problem by the end-to-end counting methods is well known, but the method for calculating the derivative of the enthalpy is an original solution.
A significant problem is the choice of representative landscapes for geocryological forecasting. Possible choices in this case are:
- -
The most widespread landscapes by area;
- -
Landscapes that show different and sometimes opposing trends in the context of climate change [
11];
- -
Landscapes on which the construction of infrastructure facilities is most often carried out.
4. Geocryological Hazards Analysis Using Geocryological Forecast
A geocryological hazard is the probability of a change in geocryological conditions that can affect engineering facilities or resources used by humans [
12]. Sources of hidden (undetected or potential) geocryological hazards are ice in the ground, waters of variable salinity, and gases in various forms (free, dissolved, and hydrated), formed as a result of changes in geocryological conditions in the past. The conditions for the realization (manifestation) of potential geocryological hazards are future climatic and landscape changes, aggravated by anthropogenic influences on the conditions of heat transfer through the earth’s surface and/or in soil massifs. The assessment of permafrost hazards is based on two independent groups of characteristics associated with the sources of hazards and the conditions for their implementation. The most common hazards arising from climate change include a decrease in the bearing capacity of soils, heaving and settlement of the surface and buried structures, gravitational displacements of the soil, and icing. The existing or foreseeable danger associated with the vulnerability of the protected values entails an increase in risk [
13,
14].
In these circumstances, the forecast became an important part of the adaptation process.
A comprehensive spatial and temporal analysis of the realized geocryological hazards is based on the identified changes in the state of permafrost and signs of the activity of geocryological processes based on the materials of permafrost survey and predictive geo-temperature modeling, which is calibrated and verified by retrospective calculations using associated data from climatic, ecological, geocryological, and geotechnical types of monitoring. The comparability of local forecasts of the permafrost’s impact on technical objects is based on the use of input data obtained in the regional forecast of changes in background geocryological conditions.
The interpretation of the mechanism and sequence of permafrost transformation makes it possible to assess the possibility of the occurrence of geocryological processes in the future based on a geo-temperature forecast. Geo-temperature forecasting uses climatic scenarios of possible climate changes and demonstrates the ambiguity of the response of permafrost to modern warming.
The technological sequence of operations for the implementation of geocryological forecasting and planning of adaptation measures was performed as follows:
- (1)
Based on the ERA-Interim reanalysis data, an array of spatially linked retrospective data on climatic changes in Russia for 1979–2017 was formed with a monthly average resolution in time and a resolution of 0.75° in space.
- (2)
The selection of climatic models was carried out in accordance with the criteria for the suitability of direct parameterization of heat transfer models in the soil. Selected models are CanESM and MIROC. The prediction of climatic changes in the XXI century for the permafrost zone was carried out on the basis of an ensemble of climatic models.
- (3)
An evaluative analysis was carried out, taking into account the assessment of the spatial-temporal variability of the composition, state, and properties of the permafrost. It included updating the “Geocryological map of the Russian Federation” 1:2,500,000 as an information basis for increasing the efficiency of the design and survey. The activity of cryogenic geological processes in conjunction with engineering problems, assessment of intra-terrestrial heat flow, assessment of the impact of soil salinity and development, cryopegs, and gas content in soils was taken into account.
- (4)
A geocryological forecast was carried out based on the selected climate change scenarios, which is necessary to substantiate the choice and assess the effectiveness of technologies for the adaptation of the Gazprom Company to climate change and geocryological conditions. The calculations were carried out in a one-dimensional setting for undisturbed representative landscapes of the developed territory. The results of the geocryological forecast are presented in the form of graphs that facilitate their direct use by engineers and managers. In particular, the course of average annual soil temperatures at different depths makes it possible to assign a reserve factor for the designed structures in the form of an amendment to the standard value of the temperature of rocks for a given service life of the structure.
- (5)
A schematic map of actual and forecasted permafrost hazards in the area of Gazprom’s operations has been drawn up; an explanatory note has been prepared for the schematic map with recommendations for the use of this adaptation technology in management activities. The developed schematic maps make it possible to substantiate the territorial and temporal priorities of adaptation programs in relation to new and existing facilities for gas production and transportation. The schematic map of the predicted permafrost hazards is based on modern methods of permafrost forecasting and the dynamics of background permafrost conditions.
- (6)
Based on the analysis of the current and future state of the climate and permafrost, a forecast of expected changes in the operating conditions of Gazprom’s facilities is given and recommendations are proposed for adapting the production activities of the Gazprom Company in a changing climate. The developed recommendations allow important management decisions to be made to increase the resilience of Gazprom’s facilities to ongoing and expected climate changes. Such decisions should include the choice of the principle of using permafrost as the foundations of structures; the choice of the planned or operational adaptation, and the time of the beginning of the application of adaptation measures; the selection of adaptation methods and the mode of their application; the organization of integrated monitoring with predictive and control functions; and the improvement of regulatory documents that take into account adaptation measures. Based on the recommendations, a draft adaptation program was proposed for the Gazprom Company.
When setting the tasks of geocryological forecasting, it is necessary to take into account the heterogeneities of the permafrost strata along the section in the case of the presence of phase transition fronts deeper than the penetration of seasonal temperature fluctuations, the presence of fluids transferring heat in the permafrost strata, the presence of temperature field inhomogeneity associated with the history of heat exchange of the permafrost stratum with the host media, or the presence of saline or gaseous rocks in the permafrost strata.
On the territory of the permafrost zone, people are faced with the specifics of the development of natural and man-made processes affecting the infrastructure facilities. A long-term forecast of the activity of such processes is necessary for territorial integrated planning and the assessment of the quality and quantity of natural resources or the characteristics of the state of ecosystems. Medium- and short-term forecasts are prepared to assess the vulnerability of local impact recipients (buildings, roads, pipelines, etc.) and the sustainability of economic activities. A mid-term forecast is also needed to prepare recommendations for optimizing the engineering protection of the territory.
The numerical geo-temperature forecast at the local level is formed separately for three main zones of the natural and technical system: the zone of the predominant influence of technogenic factors of disturbance of heat transfer in the soil, the zone of competitive influence of technogenic and natural factors, and the zone of the predominant impact of natural factors. In the first of the above zones, climate change is not required, and geocryological hazards are caused by the impact of an engineering structure, and in the second and third zones, setting a climate change scenario is mandatory.
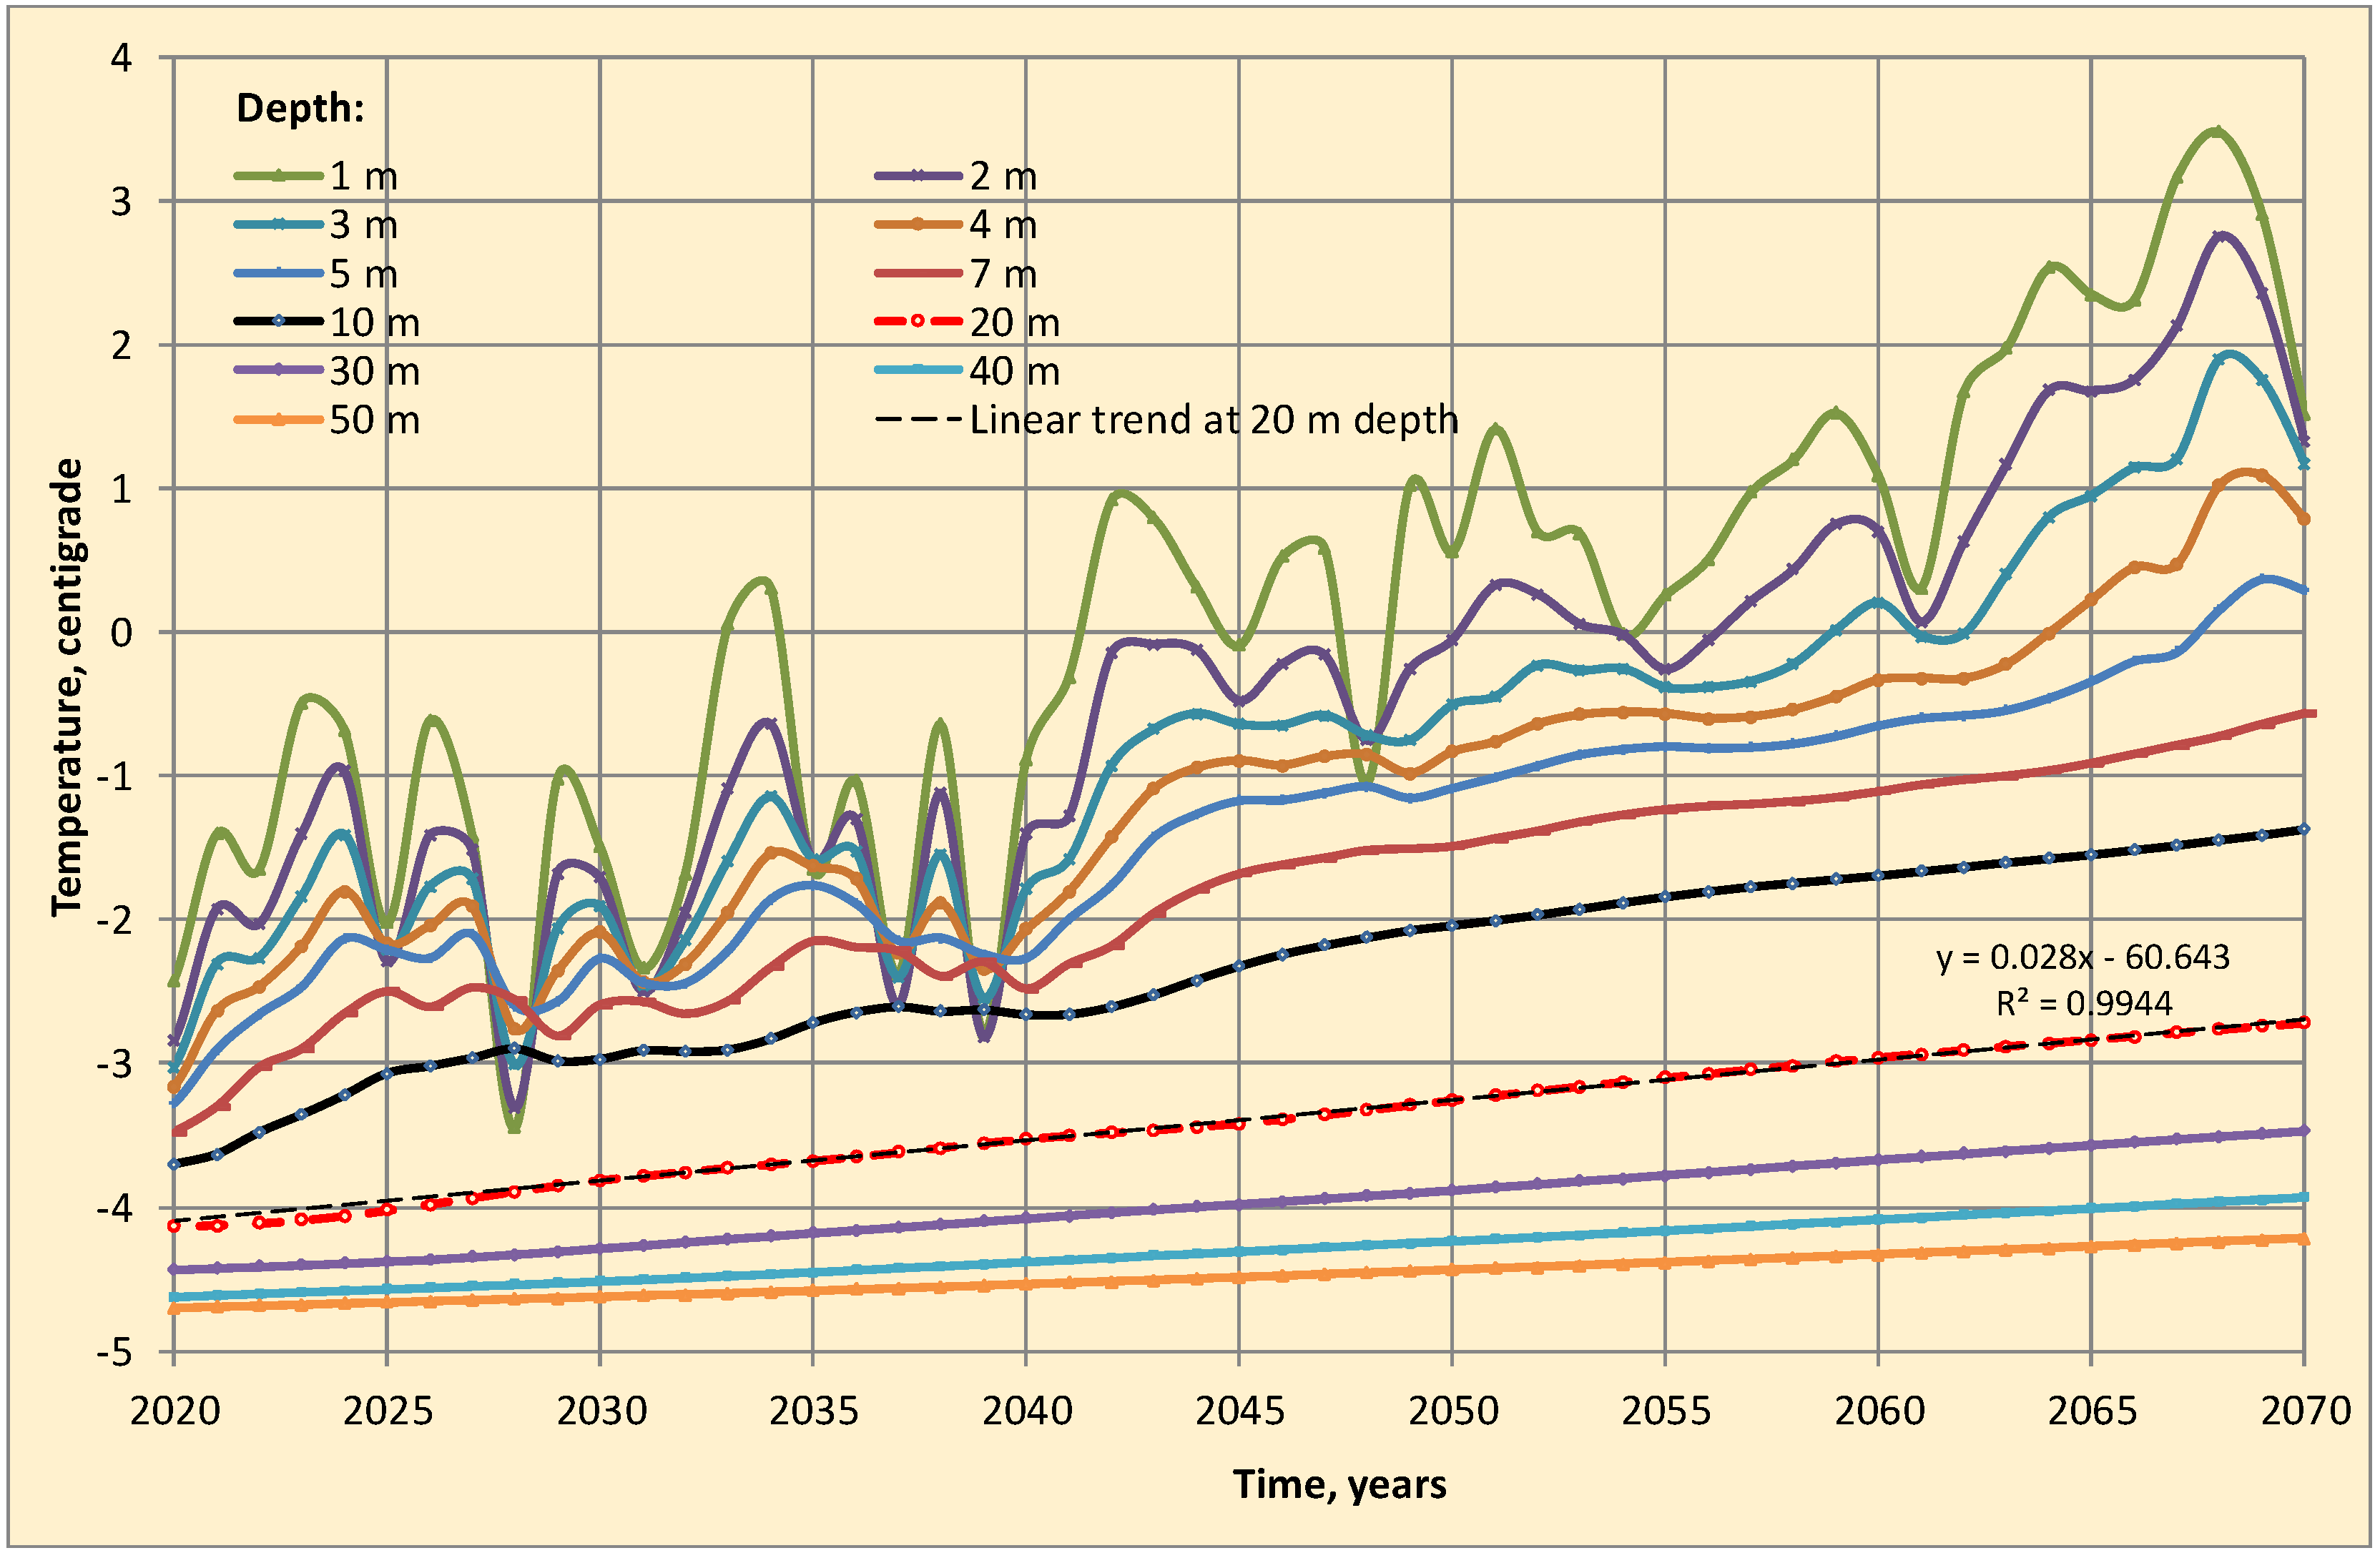
An example of the presentation of the results of a geocryological forecast is shown in
Figure 1. Deep horizons show a gradual increase in permafrost temperature. These data should be used by designers to assign the standard characteristics of the foundations. For example, if the building is to be constructed now for a 50-year life, we must design the foundations for a standard permafrost temperature of −2.8 °C (
Figure 1). The near-surface horizons show oscillations of the average annual ground temperatures. These data are important for predicting the activity of seasonal unfavorable processes, such as heaving, thermal settlement, and ice formation.
The areas of use of the results of the geocryological forecast are, at the same time, the areas of implementation of adaptation approaches and technologies:
- -
Correction of design and construction errors that did not take into account possible climatic changes (capital cost planning);
- -
Development and implementation of new technologies for the monitoring and engineering protection of gas production and transportation facilities (capital expenditure planning);
- -
Forecasting and optimization of costs for the maintenance of infrastructure facilities (planning of operating costs);
- -
Elaboration of criteria for optimal placement and selection of a strategy for engineering protection of new facilities (planning of capital expenditures);
- -
Improvement of the regulatory and methodological base of construction and technological functioning of the industry (improvement of management);
- -
Display and promotion of adaptation results in corporate environmental and economic reporting (improvement of management).
The results of the geocryological forecast allow designers to take into account the limits of variability of the standard indicators necessary for calculating the bearing capacity of the foundation. The problem lies in the absence of regulatory documents legalizing such accounting.
5. Risk Management and Adaptation
Risk management is closely related to technologies for flexible management of the temperature regime of soils and is the main way of adaptation to unfavorable processes [
15,
16]. An example of a flexible solution would be heat pumps in comparison with standard cooling piles.
The data from permafrost monitoring make possible to identify current trends in permafrost conditions and associated hazards [
17]. Territorial heterogeneity and specificity of infrastructure vulnerability serve as the basis for ranking adaptation priorities as a principle of risk management in changing environmental and technological conditions. Ranking assumes the allocation of territorial priorities (trouble zones) and the temporary priorities (implementation sequence) of protective measures for types of business and existing facilities.
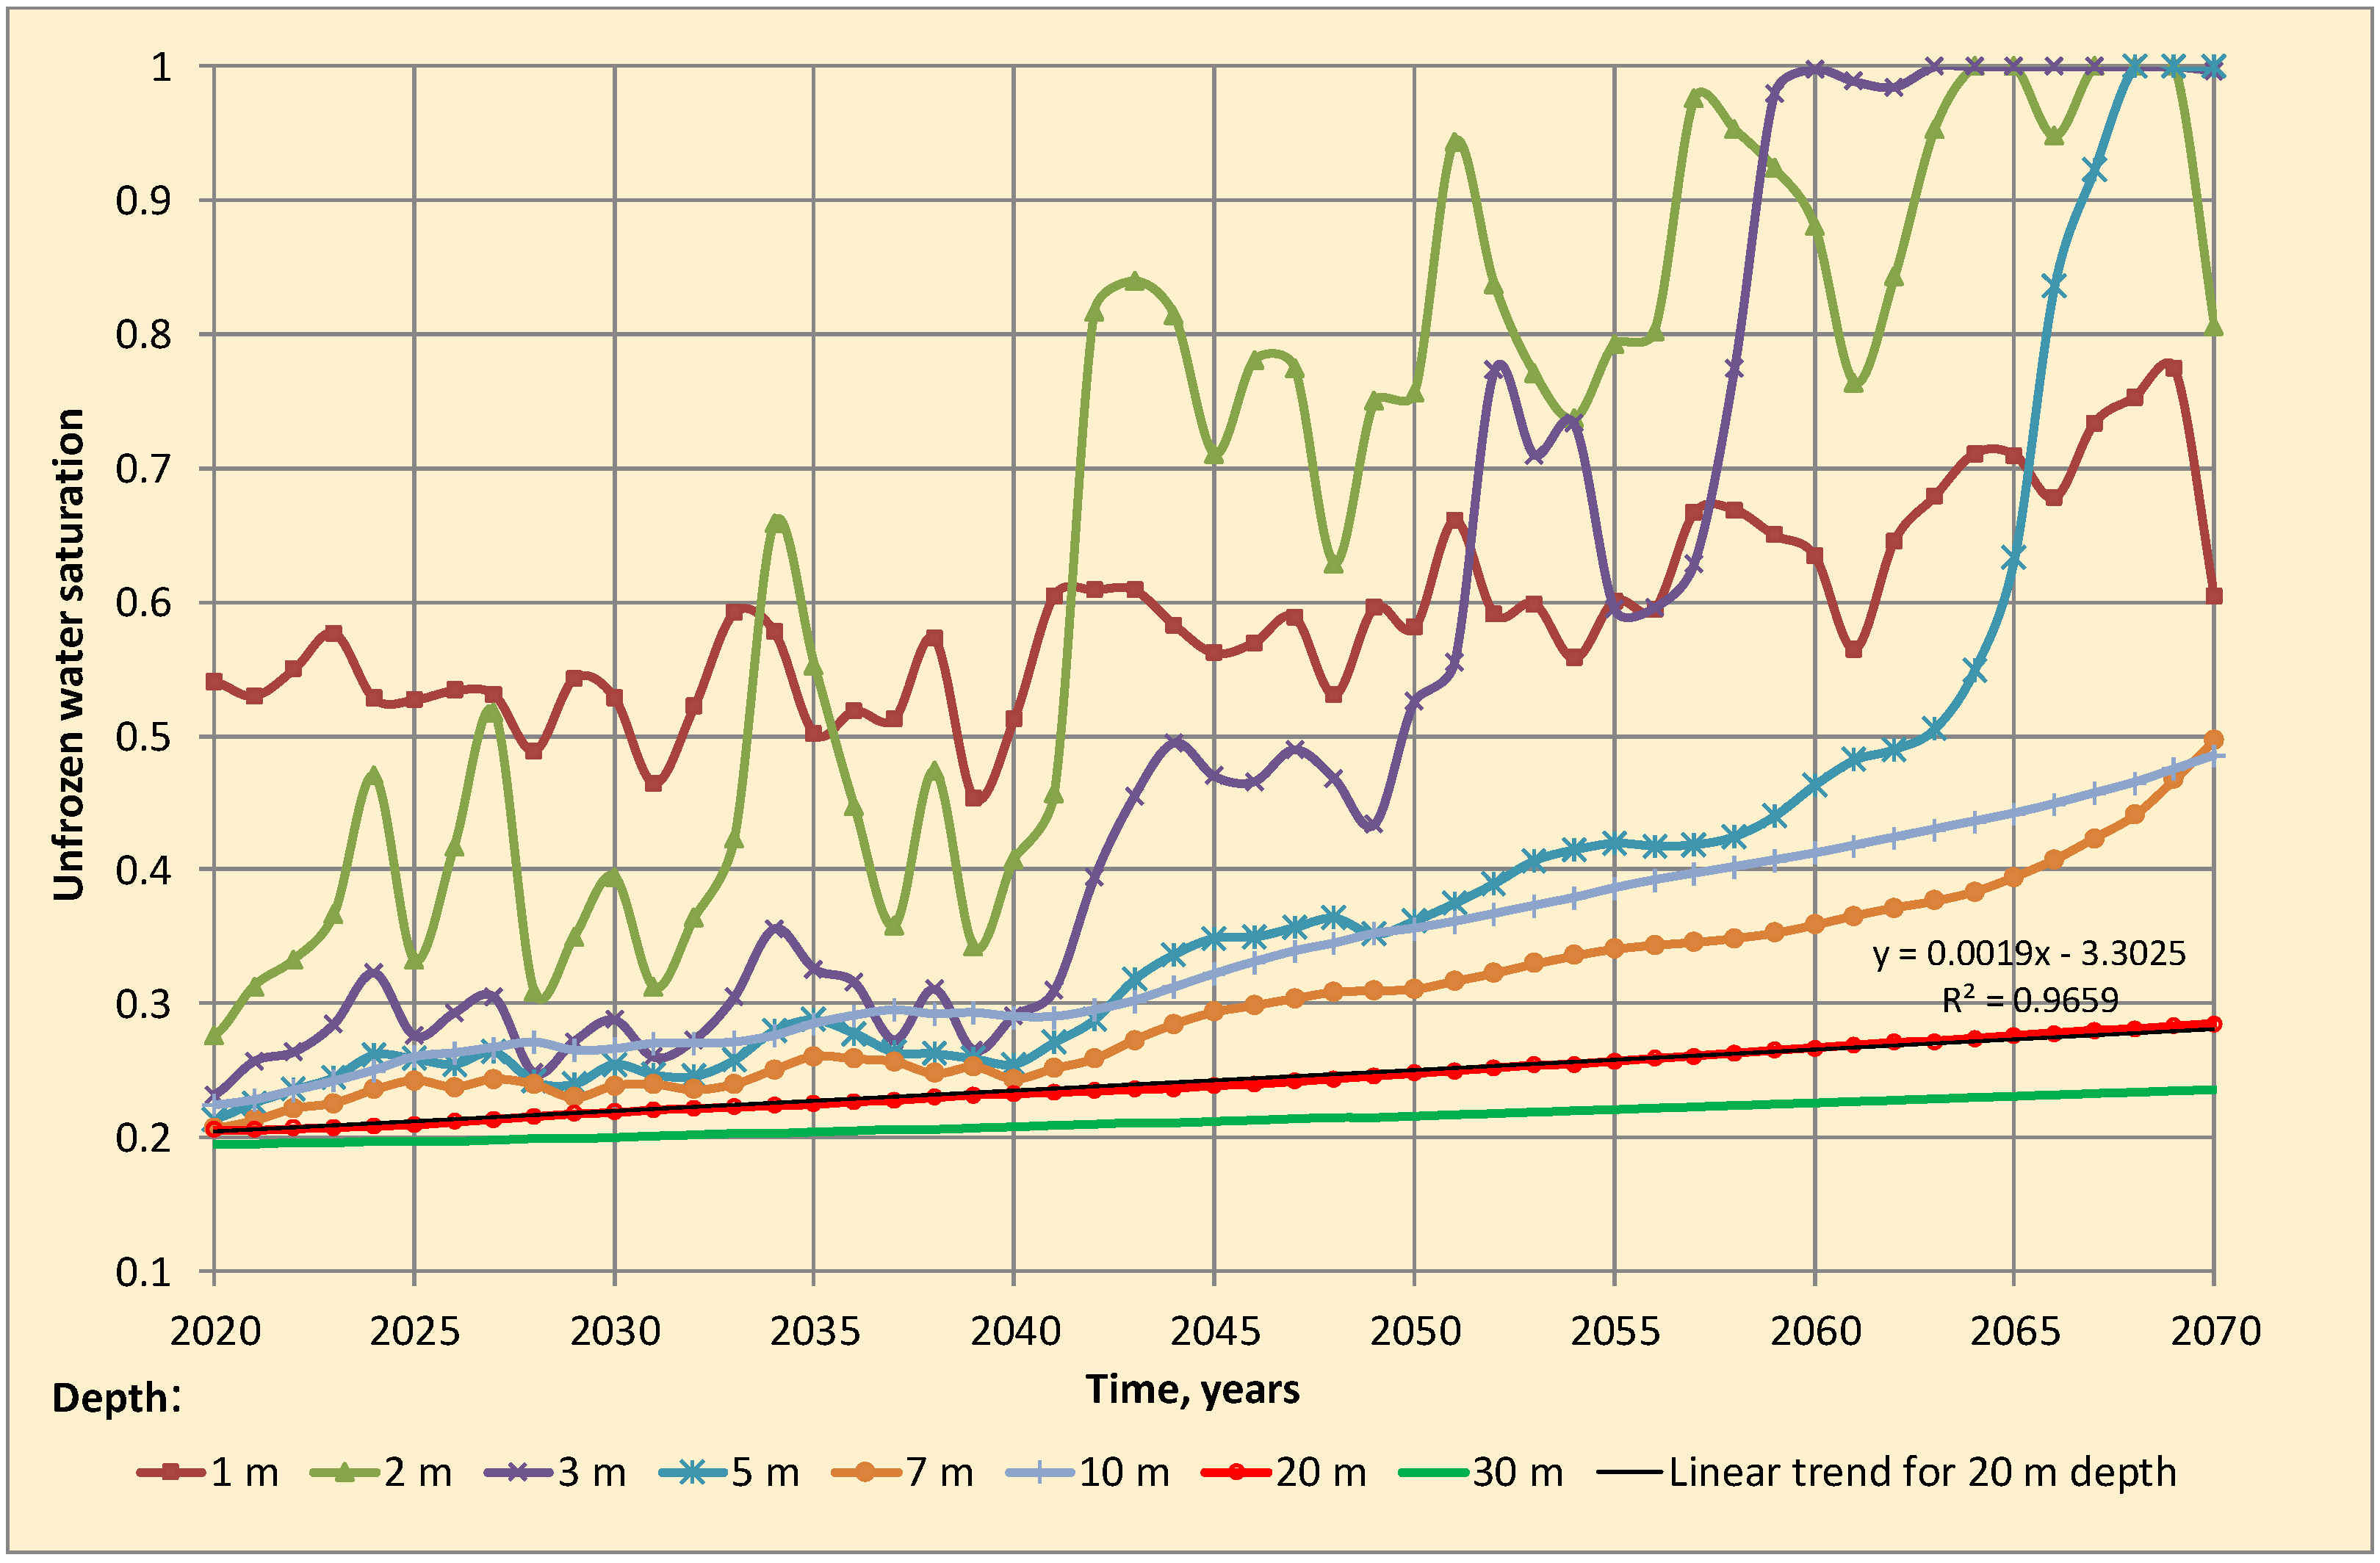
Geocryological forecast results are important for local risk assessment.
Figure 2 shows the results of the same forecast for Western Yamal as illustrated in
Figure 1, but it reflects the dynamics of the unfrozen water saturation in the ground at different depths. The unfrozen water saturation describes the local phase state of the ground water and is very important for the estimation of the bearing capacity. This is evident for the 20 m depth curve (
Figure 1 and
Figure 2 in comparison).
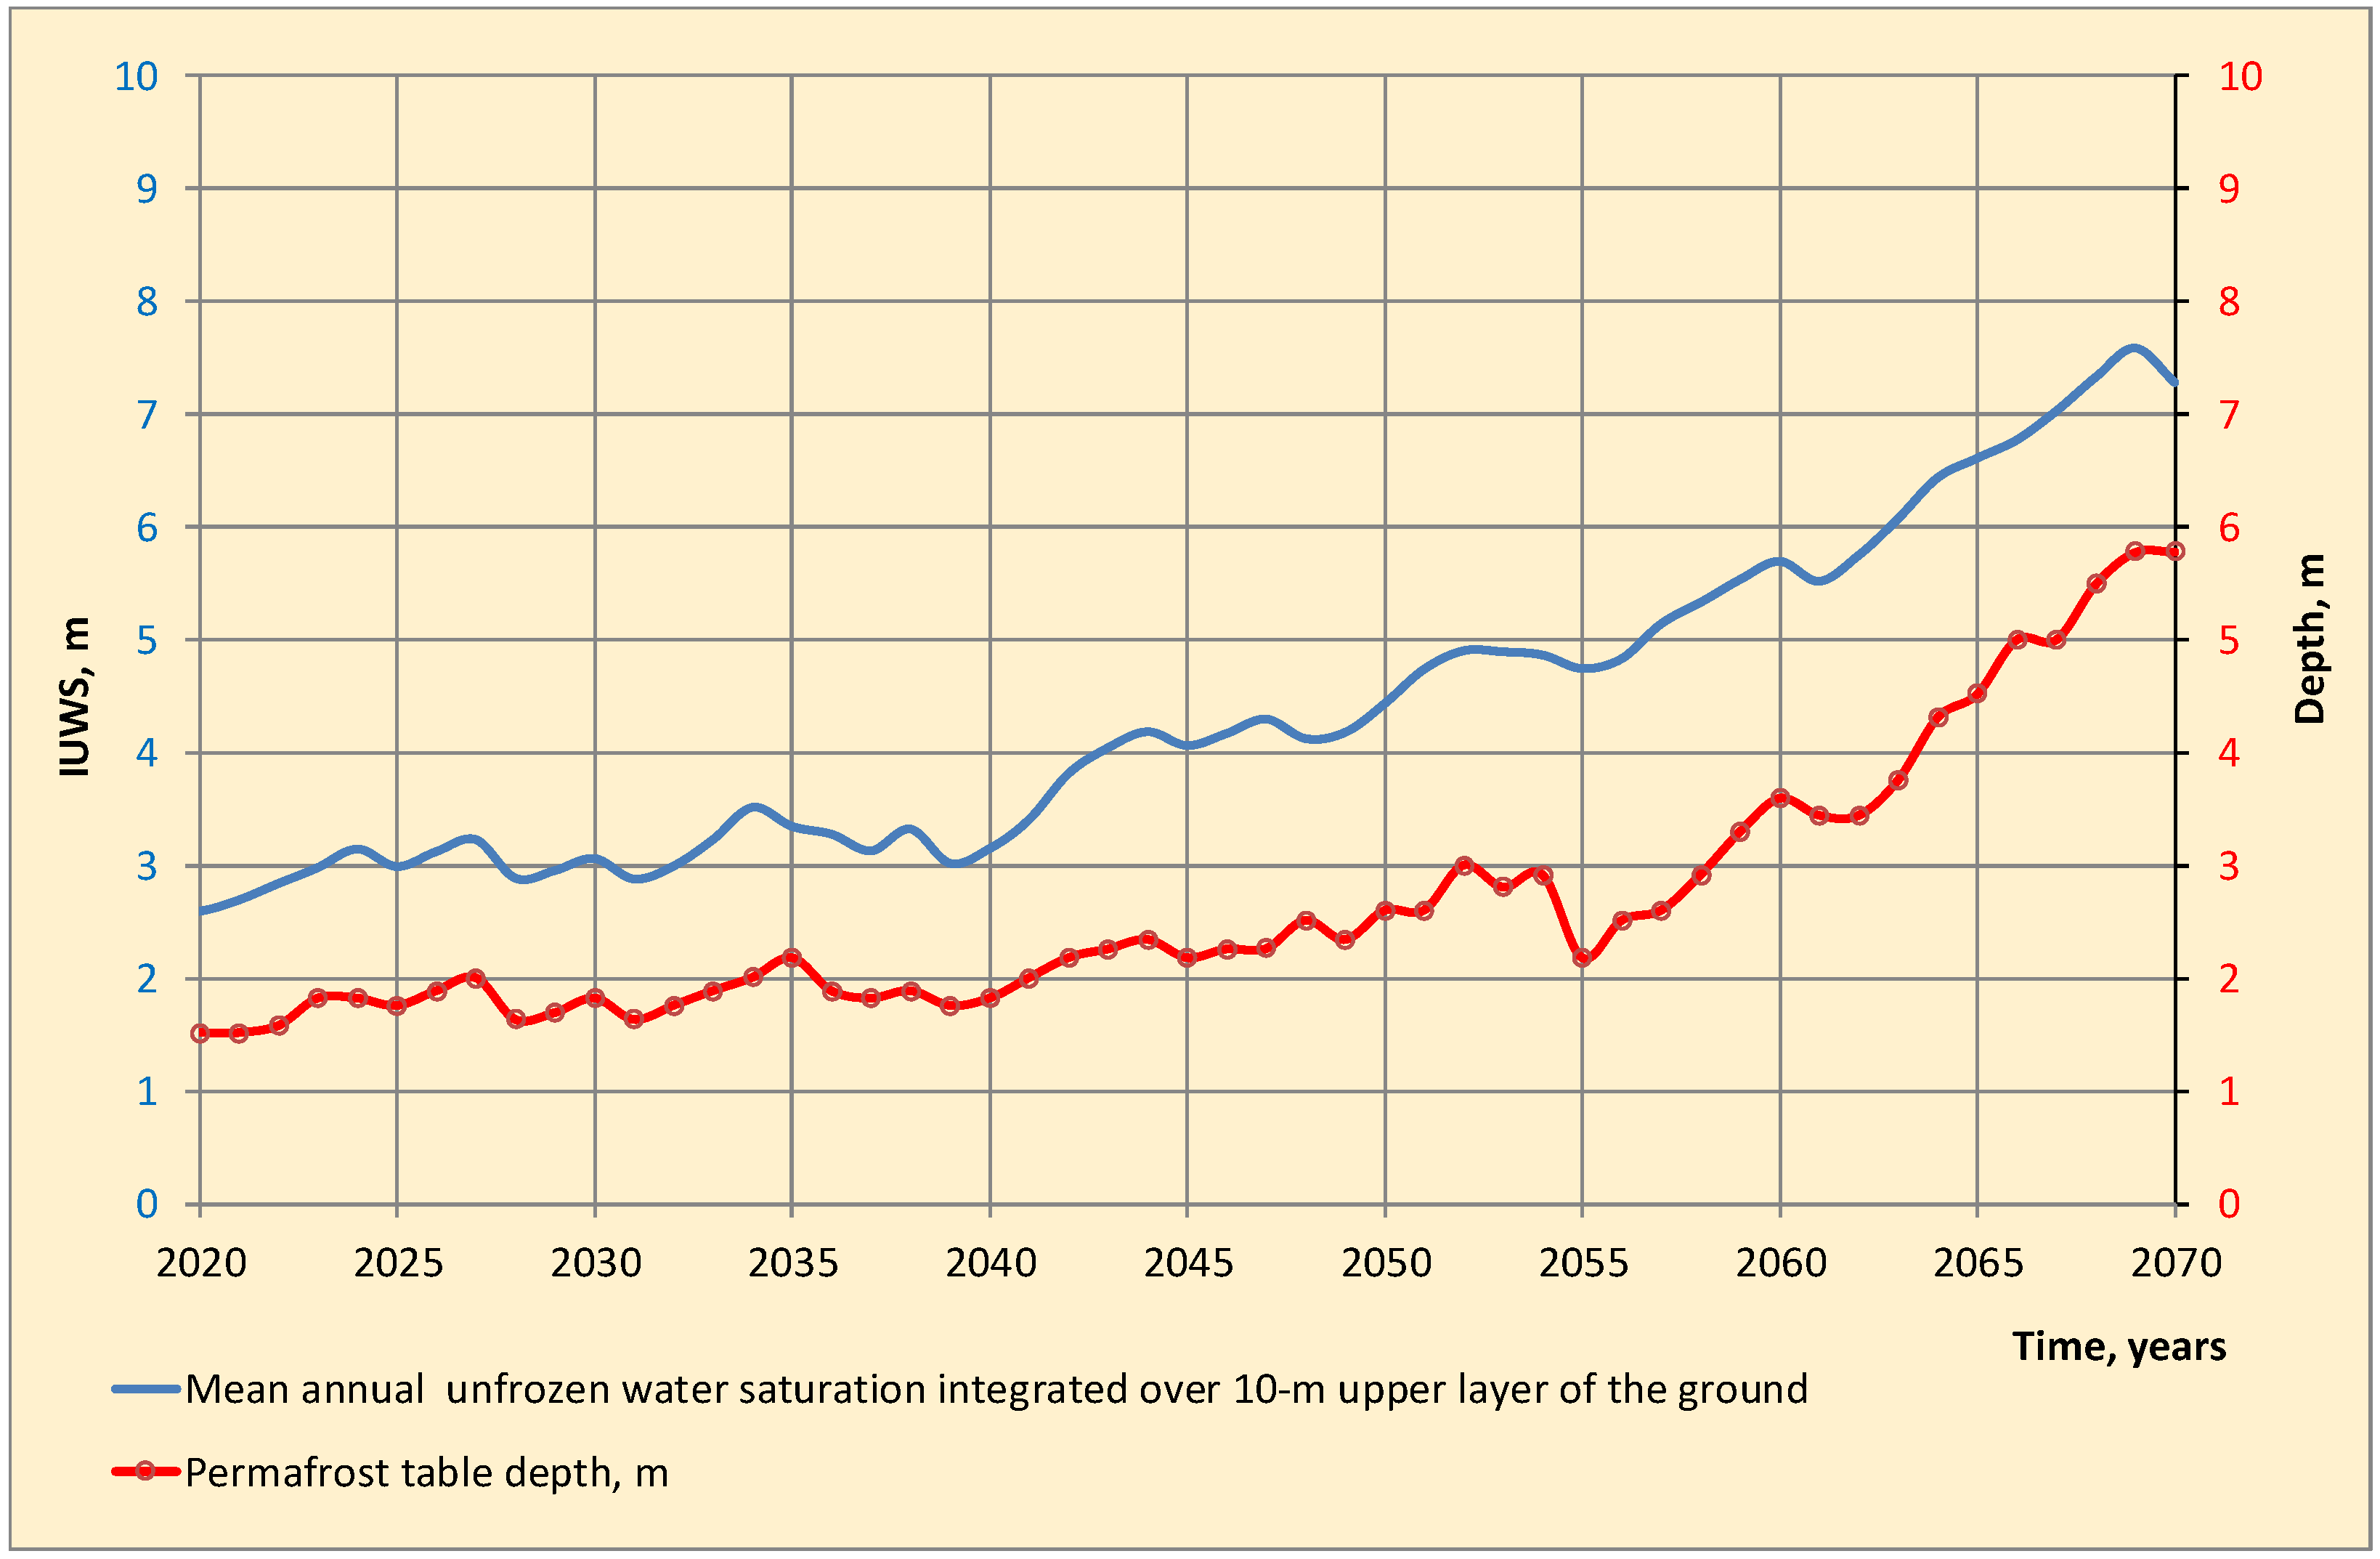
The new integral indicators of the state of the upper layers’ permafrost are the “Depth of permafrost table” in relation to the “Mean annual unfrozen water saturation integrated over 10-m upper layer of the ground”: index of unfrozen water saturation (IUWS). The IUWS serves as a complex characteristic of the seasonal partial freezing–thawing dynamics of the content of unfrozen water in the soil (
Figure 3). The value of IUWS is zero in a completely frozen state without any unfrozen water, reaching 10 in ground that is in a permanently thawed state. The analysis of these dynamics is also important for understanding the variability of the bearing capacity of the soil (
Figure 4).
The technology of territorial zoning is an extremely effective tool for the scientifically grounded planning of the placement of construction projects based on the adaptation principle. Zoning should be carried out at the pre-design stage of construction. This planning stage includes a preliminary assessment of the natural conditions of construction: the geological structure of soil strata and characteristics of their properties, as well as geodynamic, geomorphological, hydrogeological, and other conditions [
18]. On the basis of this, the choice of the optimal variant of the placement of the construction object is carried out.
Actual maps of geocryological zoning in terms of their content do not fully correspond to the concept of nature management in a changing climate. This requires a fundamentally new type of map containing predictive information on a possible change in the state of the permafrost over a refereed period of time. Based on the theory of natural risks, such a map is called a vulnerability map. With its help, possible changes in the state of the permafrost are determined and, on this basis, the most favorable territories (areas) for development are determined, taking into account changes in their state in the future. No less important is that on the basis of such a map, a fundamental decision is made on the method of regulating the temperature regime of the rock mass at the base of the structure and the mode of such current and advance regulation.
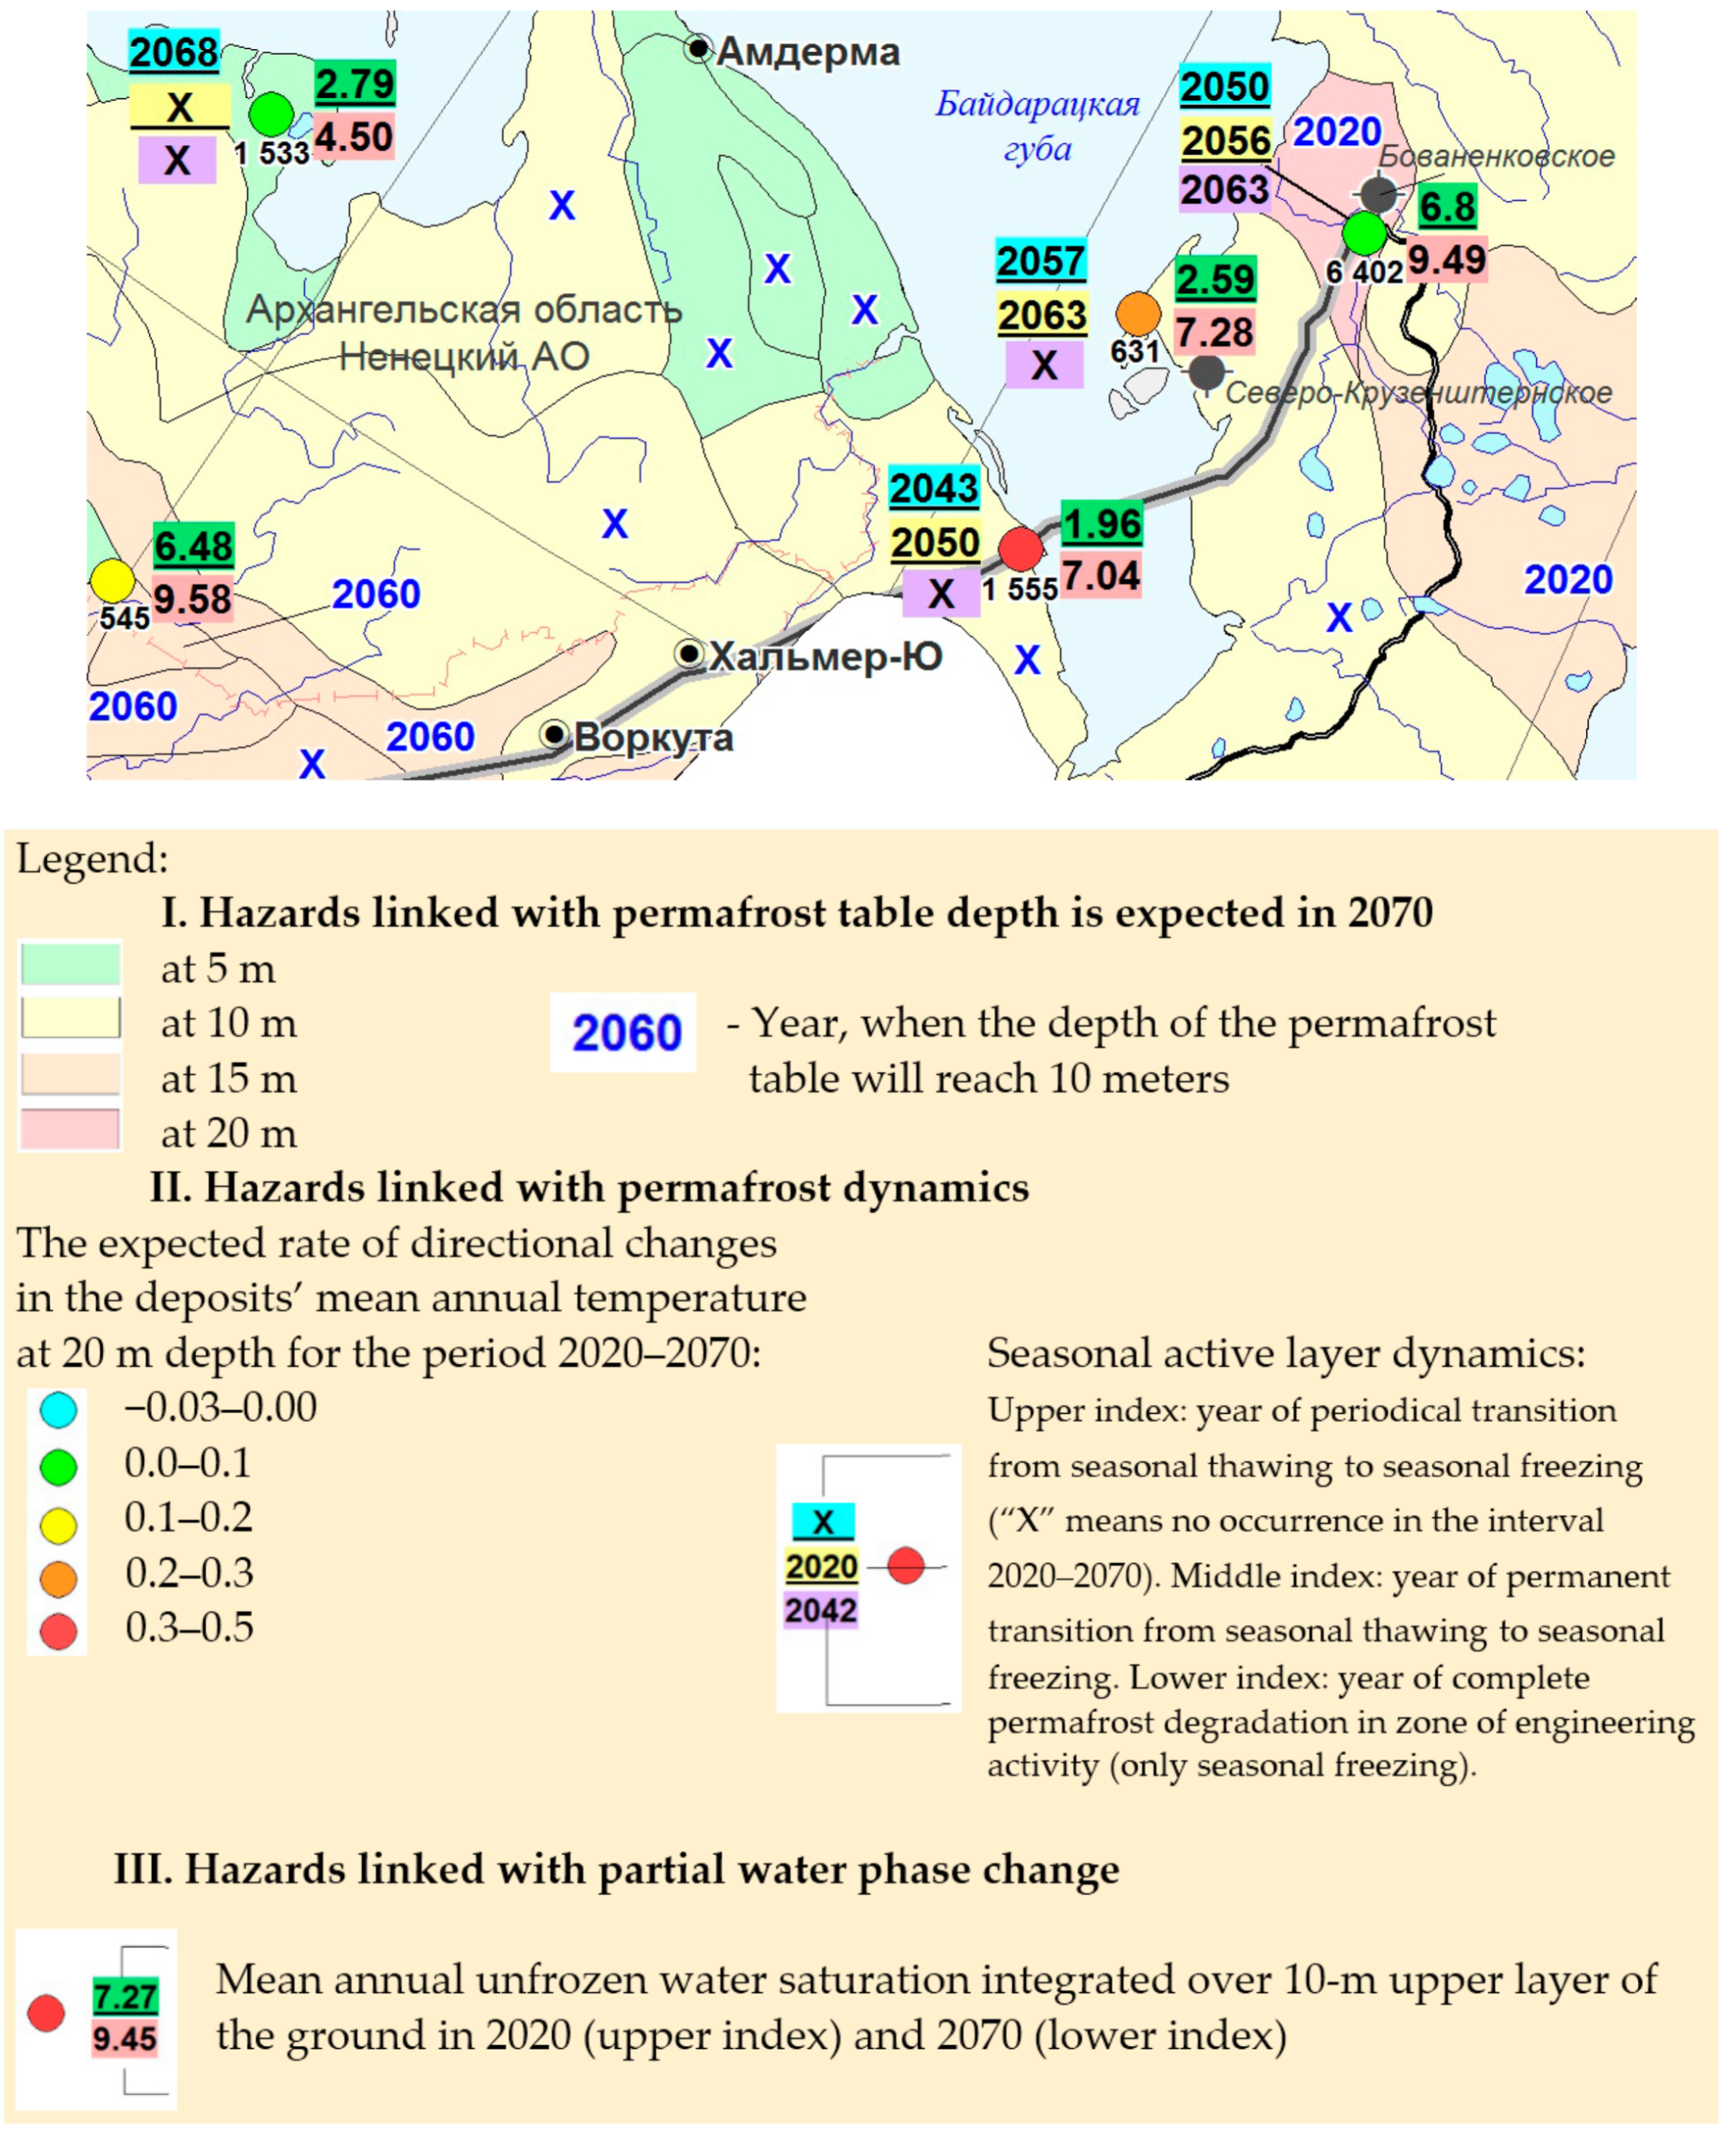
A map of hazards is the result of the assessment of the permafrost change over a period of 50–100 years. Its main difference from the geocryological map is that it is built on the basis of predicting the areas and the time of the climate changes in the study area, and carrying out, on this basis, calculations of changes in the state of the permafrost strata (
Figure 5).
The analysis of the data obtained allows one to judge the bearing capacity of the rocks and the expected deformations of the engineering infrastructure located on these strata. The information received is of fundamental importance for making timely adaptive decisions to prevent the destruction of the structure.
The zoning is based on the identification of three main types of territories according to the state of permafrost: (1) zones with a preserved layer of frozen rocks for the entire refereed period of time, (2) zones with an intermittent (locally eroded) layer of frozen rocks, and (3) zones with a completely thawed layer of rocks in the zone of engineering activity. In accordance with this, the principle of construction and a program for the development of the territory with pre-planned adaptation measures are being developed. In relation to the first type of site, the priority is the first principle of development (preservation of the frozen state of the strata); for the second type, depending on economic considerations, the first or the second type of construction is selected; and for the third type, the principle of construction without preserving the frozen state of the strata will be the most justified.
The first part of the legend of the named schematic map (
Figure 5) is the indicator of the directional change in the depth of the top of the permafrost strata, the position of which is estimated for the period of the given forecast depth. The physical meaning of the indicator is to determine the depth of the rock massif that contains the ice throughout the year. A change in this depth due to climatic changes leads the existing objects to a discrepancy between the design calculations of the foundations of the structures and the actual state of the latter. This indicator also affects the required depth of research for the planned objects.
Thus, the subject of adaptation activities when using this indicator at the regional level is the prioritizing of territories that require the development of adaptation programs at the local level, which is determined by the forecast of the disappearance of permafrost rocks or the degree of displacement of the vertical boundaries of frozen massifs. For example, the analysis of the schematic map of predicted geocryological hazards shows that the priority areas for the preparation of adaptation programs are the central and southern parts of the Bolshezemelskaya tundra, Central and South Yamal, as well as a significant part of the Gydan Peninsula.
The subject of the adaptation activities when using this indicator at the local level is to compare the design and actual positions of the permafrost strata for all capital construction projects of the Gazprom Company in the permafrost zone within its current boundaries (i.e., the boundaries adopted by the company at the present time). The degree of this discrepancy at the local level will make it possible to identify objects to prioritize for the development and implementation of specific protective or compensatory measures.
An important consequence of the use of this indicator is the understanding that areas with a change in the depth of the permafrost table from 5 to 20 m will require the subsidiaries of the Gazprom Company, which produce and/or transport gas in these territories, to form special adaptive programs to take into account the specifics of the degradation of the permafrost in the specific conditions of the designed and operated facilities. This will lead to an increase in the cost of all types of work, and adaptation programs are needed precisely to optimize this increase in cost. The areas where permafrost will disappear completely in 50 years, on the contrary, will be considered favorable in adaptation programs—all enterprises for the preservation of permafrost should be phased out, and the construction of new facilities should be carried out according to the second principle, which will lead to a reduction in the cost of construction.
The second part of the legend of the schematic map of predicted geocryological hazards is the rate of directed changes in the average annual soil temperature at a depth of 20 m. This indicator characterizes long-term changes in seasonal geocryological dynamics. The physical meaning of the indicator is to predict the temperature response of the permafrost to the accepted scenario of climate change. A change in the average annual soil temperature due to climatic changes leads to a discrepancy in the existing objects between the design calculations of the foundations of the structures and the actual state of the latter. The actual dynamics of the average annual soil temperature is oscillatory, therefore, for engineering calculations, it is recommended that linear averaging of the predicted temperatures be used, which is different in different regions, and, in addition, depends on the initial temperature background: in low temperature permafrost conditions, these rates are high, but as we approach the temperature interval with intense phase transitions, these rates decrease, since part of the climatic signal is spent on these phase transitions.
The subject of adaptation activities when using this indicator at the regional level is the identification of the priority of territories requiring the development of adaptation programs at the local level, which is determined by the forecast of changes in the temperature regime of soil strata. The subject of adaptation activities when using this indicator at the local level is the recommendation of adjusting the normative indicator of the background average annual soil temperature used in the design of the capital construction projects of the Gazprom Company on the territory of the permafrost zone within its actual boundaries (i.e., the boundaries currently accepted by the company). Such an adjustment is introduced at the facility level based on the materials of the regional geocryological forecast.
The third part of the legend of the schematic map is the indicator of the year (or decade, in the case of a generalized geocryological forecast) of the transition of the merging permafrost to the periodically or stably thawed zone. This indicator, like the soil temperature, characterizes long-term changes in seasonal geocryological dynamics. Its physical meaning is to determine the moment of radical transformation of the state of permafrost, at which the relative position of the boundaries of seasonal freezing and the permafrost massifs’ geometry changes. If the depth of seasonal freezing is greater than the depth of the permafrost table, then we have classical permafrost conditions with relatively shallow seasonal thawing, for which detailed recommendations on engineering solutions and engineering protection measures have been developed. The appearance of a constantly thawed interlayer between the active layer of seasonal freezing and thawing and constantly frozen soil radically changes the hydrogeological situation, and changes the intensity of seasonal and long-term heaving processes and all other processes dependent on moisture migration. The situation is aggravated by the temporary unevenness of climatic changes, which lead to oscillations of geocryological conditions. In other words, the transition to non-merging permafrost may be temporary, and after a few years the situation may return to its previous state; however, the processes that have passed during this period will change the ice content and the physical and mechanical properties of soils, thus bringing the engineering facility into a non-design state.
The subject of adaptation activities when using this indicator at the regional level is the temporary prioritization of territories requiring the development of adaptation programs at the local level, which is determined by the forecast of a radical transformation of the permafrost state.
The subject of adaptation activity when using this indicator at the local level is the adjustment of programs for local geotechnical and environmental monitoring, taking into account the radical restructuring of geocryological conditions, which will affect the activity of unfavorable processes (heaving, thermokarst, evolution of cryopegs, gas migration, icing).
A significant number of changes occurring in soils due to climatic influences occur gradually. In particular, phase transitions of moisture occur in the temperature spectrum, and the bearing capacity of soils depends on the phase state of the soil system. The physical meaning of the indicator is to determine the average integral fraction of the water content in the liquid phase in a 10-m soil layer during the year. The dynamics of this indicator is related to the temperature indicator in terms of the capabilities of the characteristics of the response of permafrost to climatic changes, but physically more fully characterizes the state of the soil system, which is necessary to predict the bearing capacity of soils.
The subject of adaptation activity when using this indicator at the regional level is the prioritization of territories requiring the development of adaptation programs at the local level, which is determined by the faster rate of increase in the proportion of liquid moisture in the soil system.
The subject of adaptive activity when using this indicator at the local level is the formation of technical specifications for special studies of the bearing properties of soils of specific objects, based on data on the rates of phase transitions calculated from the regional geocryological forecast.
The need to build maps of the vulnerability of territories to climate change during the transition to an adaptation path of development is the sixth recommendation of the corporate level.
The required engineering protection is designed at the recommended sites. Thus, based on the data obtained on the dynamics of the temperature change, the specialists of “Gazprom Dobycha Nadym” made a decision to mitigate the risks associated with the loss of the bearing capacity of the foundation soils. For this purpose, they used modern heat exchange equipment as vapor–liquid heat stabilizers to create ventilated subfields of critical engineering structures. With the help of such equipment, it was possible to create arrays of frozen soils under the foundations with an average annual temperature from −8.0 °C to −6.0 °C, which makes it possible to exclude the negative impact on the thermal regime of the foundations of both global climatic and local technogenic factors, and thereby ensure reliable foundations and foundations of objects in unfavorable permafrost-geological conditions [
18].
The requirements for the content, timing, and depth of analysis of geocryological hazards are different for three main groups of consumers in need of adaptation programs: the state, entrepreneurs, and the population.
6. Conclusions
The approach developed at IEG RAS to assess the state and dynamics of permafrost is based on the use of event indicators of radical restructuring of the heat transfer regime and is aimed at justifying adaptation priorities as the basis for risk management in changing environmental conditions and technogenesis. The requirements for the content, timing, and depth of analysis of geocryological hazards are different for the main groups of consumers in need of adaptation programs.
The main organizational basis for adaptation is a combination of vertical (hierarchical) informing about the current and expected problems of production activities, which determines the adjustment of plans and technical regulations, with the horizontal coordination of planning and expanded information exchange between the subsidiaries of the Gazprom Company in terms of experience and existing adaptation plans. The criteria for determining the need for and indicators of adaptation were proposed in this paper, and the ways of developing the information infrastructure to ensure adaptation were also outlined.
The significance of our research is the fact that this is the first Russian experience in developing the basics of a climate adaptation program among large resource exploring companies.


 ,
, 


