Article

Development of Generalized Distribution Utility Index in Consumer-Driven Logistics

1
Transport Systems and Logistics Department, O. M. Beketov National University of Urban Economy in Kharkiv, 61001 Kharkiv, Ukraine
2
Department of Transportation Engineering, Faculty of Civil Engineering, Slovak University of Technology in Bratislava, 81005 Bratislava, Slovakia
3
Department of Economic and Social Geography, Taras Shevchenko National University of Kyiv, 01601 Kyiv, Ukraine
4
Transport Faculty, Zaporizhzhia Polytechnic National University, 69600 Zaporizhzhia, Ukraine
5
Department of Insurance, Faculty of Economics and Sociology, Institute of Finance, University of Lodz, 90-136 Lodz, Poland
*
Author to whom correspondence should be addressed.
Energies 2022, 15(3), 872; https://doi.org/10.3390/en15030872
Submission received: 23 December 2021 / Revised: 13 January 2022 / Accepted: 20 January 2022 / Published: 25 January 2022
(This article belongs to the Special Issue Sustainable Development: Policies, Challenges, and Further)

Abstract

:
In the current conditions of sharp change in demand and instability of markets, there is a need to develop a method and evaluation criterion that would meet the sustainable scenario of a supplying goods system including the consumer-driven concept. The analysis of goods distribution methods showed that to assess the integrated efficiency between the supply system and its end-consumers, it is advisable to apply integrated criterion efficiency—generalized distribution utility. The developed indicator takes into account the profit of the distribution channel (or its participants) and the generalized costs of end users during shopping activity. Based on the proposed indicator, the feasibility of using vehicle capacity is substantiated, which provides the maximum generalized distribution costs value and corresponds to the optimal sustainable distribution in consumer-driven logistics.

1. Introduction

Market relations are constantly evolving, which greatly contributes to the development of trade services. At the same time, competition between retail chains and their supply systems is growing. The last five years has seen a sharp increase in the number of modern retail chains. The sharp increase in the number of retail chains with different qualities of service and price ranking has led to the fact that logistics systems have to adapt to varying conditions on demand and, based on this, effectively implement the distribution of goods. In addition, the demand is constantly changing, as well as the range of goods in accordance with the variability of end-user demand, due to a number of circumstances. First, needs of distribution of thehouseholds income between saving and purchasing various goods and services that would maximize the utility. Second, needs of increasing the economic value of time and energy of the end-consumers due to the purchasing process. All this presupposes a constant search for new sustainable management methods to meet the needs of consumers on the one hand, while ensuring the maximization of profits of the freight flows distribution system on the other [1,2].
Research in recent years in the distribution of finished products has shown that freight manufacturers and distribution networks make logistics decisions considering the consumption zone, and this approach is called «consumer-driven» [3]. Peculiarities of the application of such approach, at present, are connected with a number of problematic questions arising in the course of freight flows distribution: development of transport service technology, definition of an optimum level of stocks, frequency and volume of deliveries in distribution channels, etc.
An analysis of the scientific works on logistics and its relevant areas allows to conclude that there is a tendency to study the sector features of the finished products distribution including all stakeholders and their interconnectedness [4,5]. Opposite objects of all stakeholders in the logistics channels (i.e., personal profit, reducing negative effects for society, saving the household budget, etc.) encourage the development of a joint evaluation mechanism that would assess any distribution scenario and provide recommendations for integrated efficiency.
In conclusion, it should be noted that the efficiency of business and social sectors is directly related to the development of sustainable management technologies. Simultaneously, the existing methods and frameworks in the freight flows distribution have been limited in assessing end-consumer utility to logistics channel operations. Generalized integrated efficiency assessments of distribution scenario profits and the expenses of its end-consumers due to shopping are required investigations. Therefore, the purpose of such research is to maximize generalized utilization efficiency related to shopping activity and create a goods supply sustainable scenario.
The article consists of the following stages:
(1)
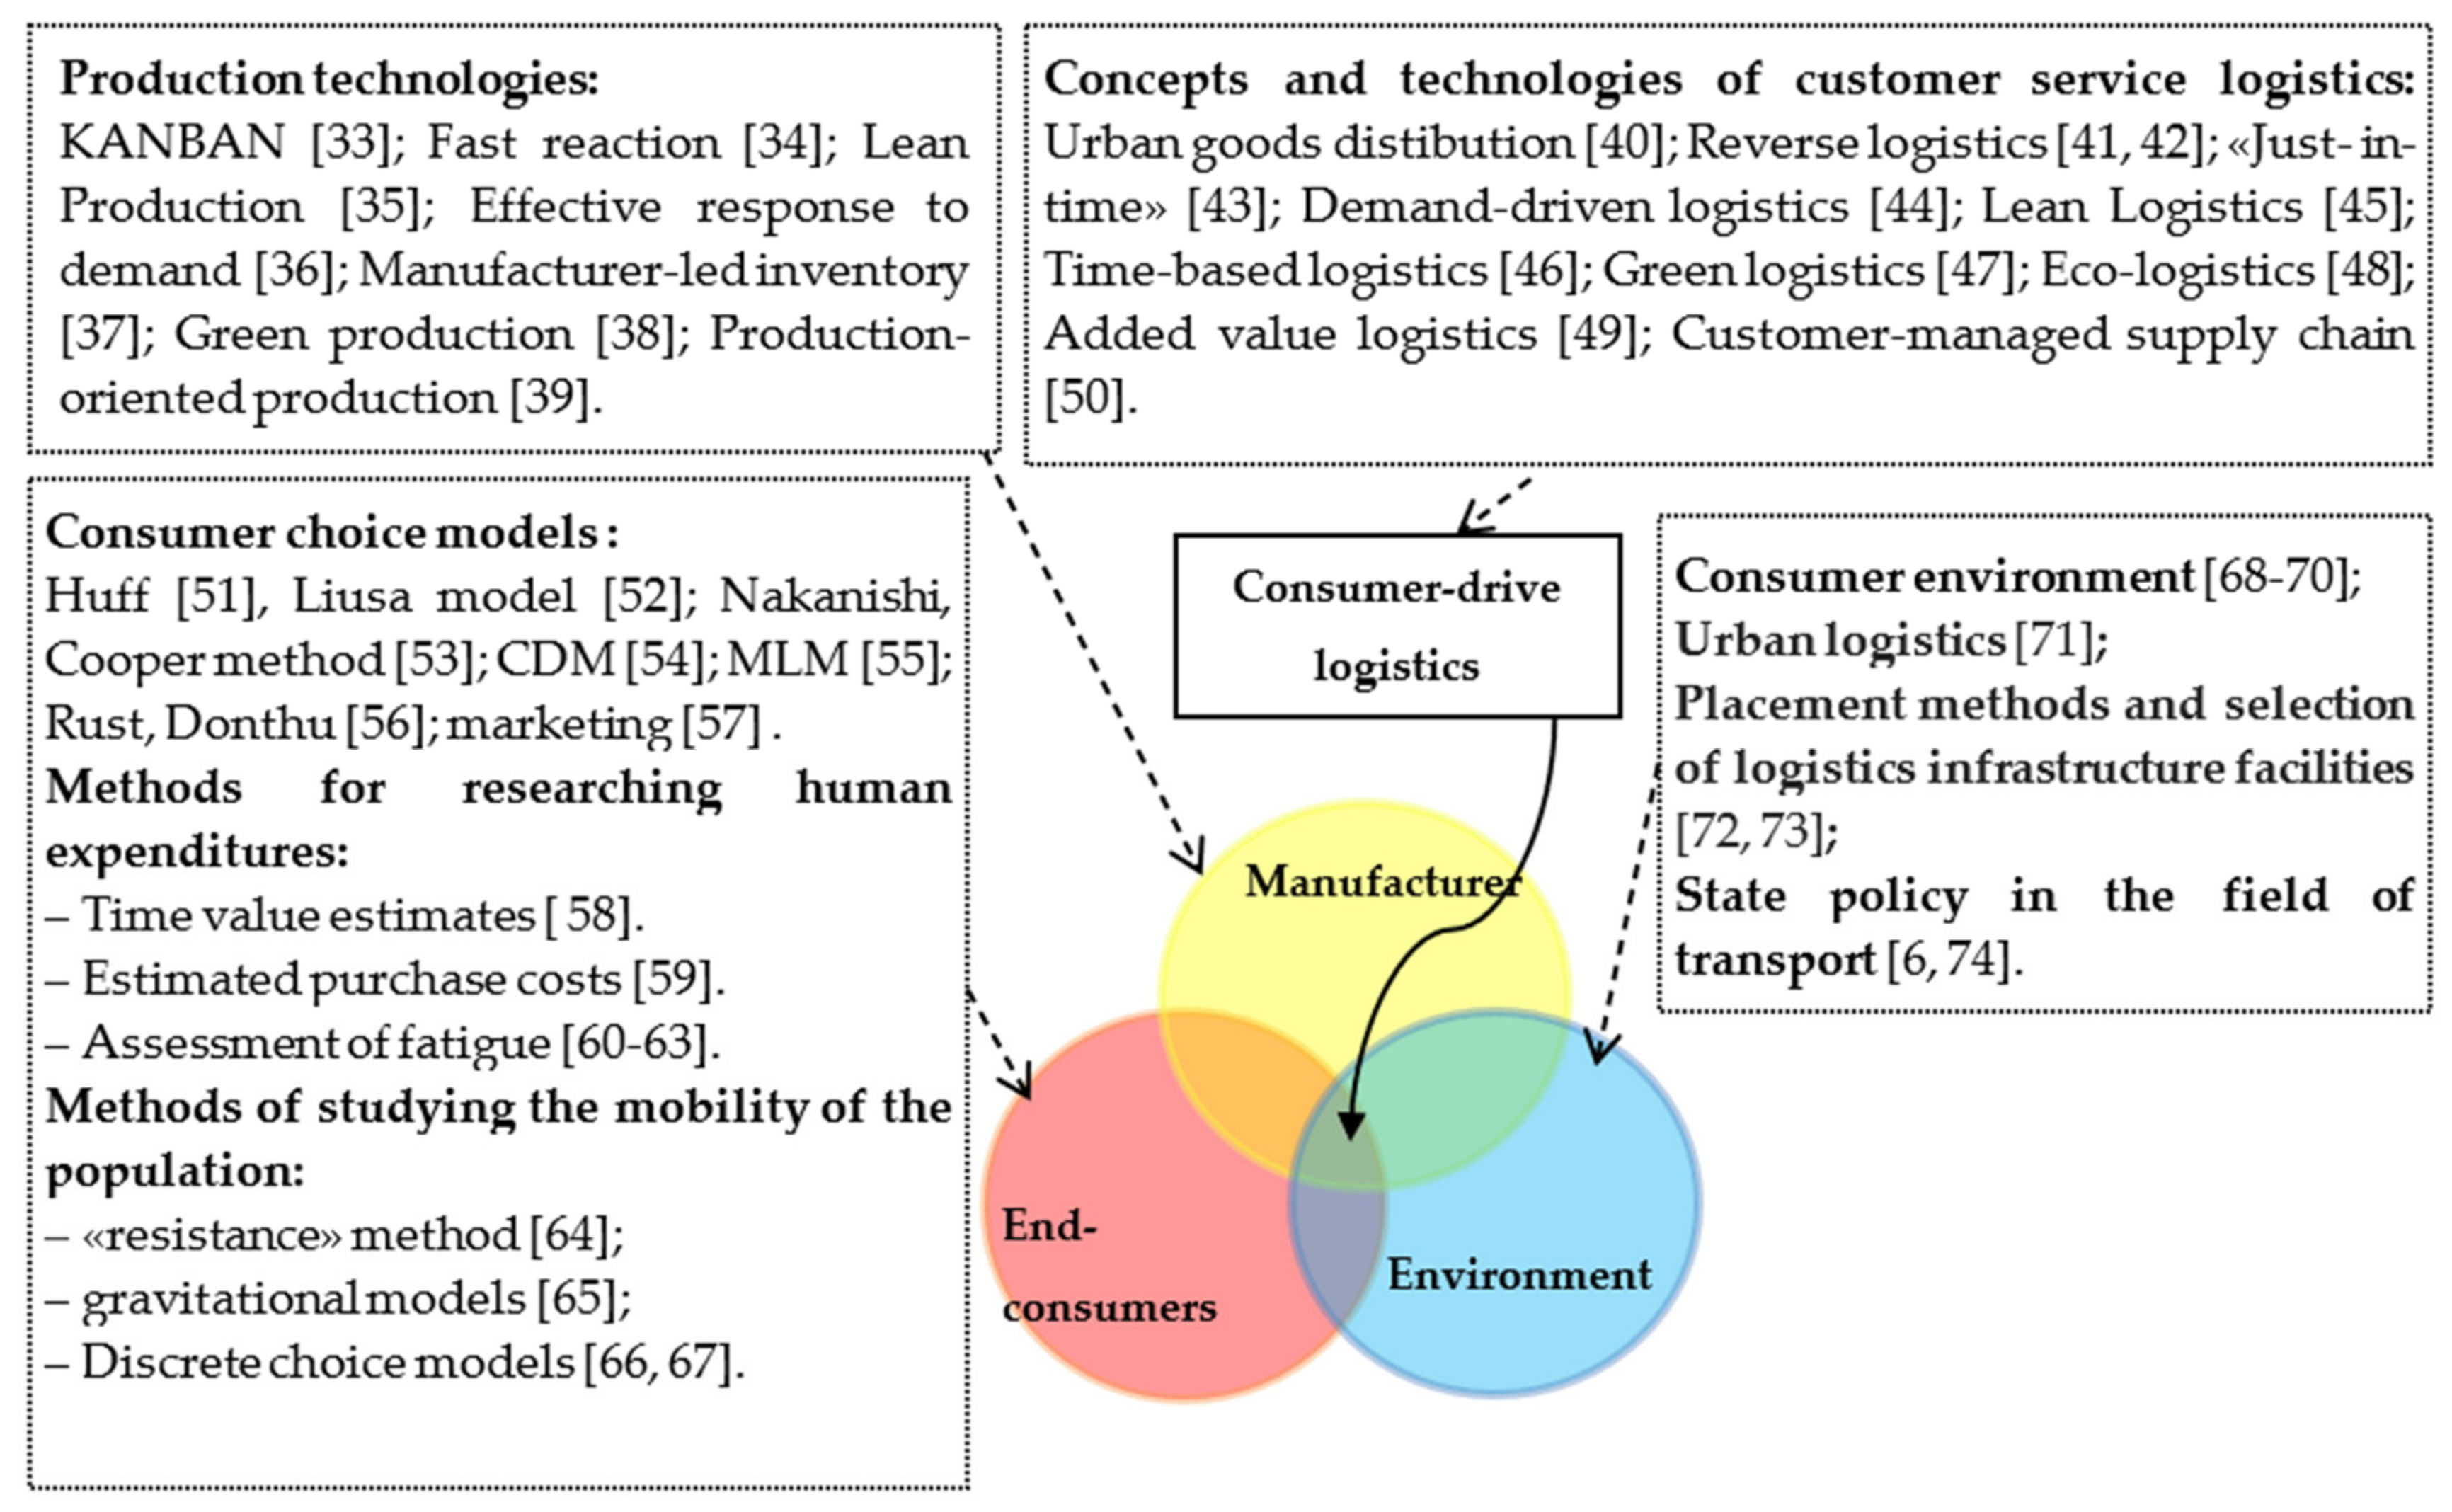
Analysis of the literature in two aspects: assessment of the efficiency of goods supply in urban goods distribution and assessment of shopping mobility costs of end-consumers;
(2)
Formation of the goal and hypothesis;
(3)
Generalized distribution costs in consumer-driven logistics concept;
(4)
Modeling results, which consist of the formation of initial data and the definition of constraints, simulation scenario of distribution, patterns of change in the consumption value of end-consumers when consuming goods, patterns changing the parameters of the delivery of freight flows in urban transport systems;
(5)
Discussion and conclusions.

2. Materials and Methods

2.1. Evaluation of the Goods Supply Efficiency

The issues of assessing the effectiveness of scenarios in the logistics systems modernization and chains are not new to science, as a significant number of works are devoted to their definition [5]. Depending on the scale, goals and objectives of the measures, the effectiveness of their implementation is assessed using different criteria. Today, the criteria that characterize economic efficiency are widely used. Criteria characterizing the technological and organizational components are also widespread (based on [6]). The basic technological indicators of transport service efficiency are [7]: vehicle capacity, vehicle mileage (total, with freight, empty), route length, number of rides, number of tours, delivery time, technical speed, operational speed, freight delivery speed, vehicle performance, and volume transportation. The operational indicator of the efficiency of transport services is energy consumption [8], which characterizes the level of consumption of fuel and energy resources per unit of transport products [9]. More extensive applications as criteria are the technological and organizational characteristics obtained in the development and implementation of a system of balanced characteristics for assessing the effectiveness of logistics activities [10]. These are: the total costs (for the costs of logistics services) [11], order execution time [12], quality of logistics service [13], NPV and other project analysis indicators [14], and efficiency of investments in logistics infrastructure [15].
The use of operational indicators usually involves a multi-criteria assessment (MCA) of measures, while the cost-effectiveness of measures is usually characterized by a single criterion [16]. The use of several criteria that characterize the cost-effectiveness of measures takes place in the application of MAMCA, which has also become widespread in assessing the effectiveness of scenarios in logistics [17]. In many cases, technological and economic indicators are used in combination, for example, in the formation of a system of balanced indicators for assessing the effectiveness of logistics activities, or using one of the groups as criteria, and another as a system of constraints [18]. In addition, the criteria of sustainable development are widely used today, e.g., Logistics Sustainability Index (LSI) [19], logistics performance index (LPI) [20], freight transportation social sustainability index (FTSSI) [21], urban quality-of-life index [22], transportation sustainability index [23], and etc [24]. At the same time, there are a number of shortcomings of existing approaches associated with the variety of possible directions for the implementation of scenarios that provide an increase in the sustainable efficiency of the functioning of logistics chains, differences in goals, scales, restrictions, etc. The constant development of approaches to assessing the effectiveness of their implementation leaves uncertain such issues as the specifics of the application of a particular approach in specific conditions.
The distribution of products in logistics systems is directly related to the impact on the environment. Environmental aspects of logistics include measures to ensure the movement of freight flows in the implementation of any production process, up to its transformation into goods, measures to bring all waste for disposal or safe storage in the environment, as well as collection and sorting of consumer waste [25]. Environmental restrictions are primarily associated with the development of transport and transport communications to reduce their harmful effects on the environment [26]. Social and environmental factors of the logistics environment determine the impact of the social requirements of the population, the demographic situation, changes in the budget of free time, migration of the population, the structure of labor processes and cultural characteristics of certain population groups, as well as the environmental impact of technologies. Such social factors as population migration, the dynamics of the structure of working and leisure time, and the O-D matrix, impose certain restrictions on both the consumer and the city, and its logistics [27].
The growth of competition in the markets indicates that businesses should pay due attention to the research of their customers and the creation of new technologies to promote freight flows, which are based on sustainable indicators of society. Works by the authors [28] describe approaches to planning and organizational process in logistics and analyze more than 130 different performance indicators from different points of view: management, employee, customer and society. The multidirectional nature of performance indicators necessitates further research in this area. This state of affairs indicates that over the past decade there has been a noticeable shift in the attention of the manufacturer towards the buyer. Simultaneously, the existing methodological apparatus used in the sustainable management of freight flows does not provide an effective solution to the indicated challenges. In the conditions, which caused a sharp change in demand, there is a need to develop a method and evaluation criterion that would meet the sustainable scenario of a supplying goods system including a consumer-driven concept. The analysis of goods distribution methods showed that to assess the integrated efficiency of interaction between the supply system and its end-consumers, it is advisable to use an integrated criterion of efficiency—generalized distribution utility.

2.2. Assessment of Consumption Efficiency for End-Consumers

The person in a purchase situation faces various expenses [29]: the purchase of goods, physical strength, time, fatigue, etc. The different ratio and magnitude of these costs can affect the choice of retail object and the number of purchases of retail objects. Analyzing the consumer market and modeling retailer traffic based on all the costs of its customers constitutes one of the forms of improving the efficiency of the retail trade [30]. The analysis shows that women spend more time shopping for non-food items. The distribution of time by age proves the increase of shopping time for people under 30 years of age. According to research data, a person spends an average of 21 min on purchases of non-food items per day, but women spend almost 1.8 times more time shopping for groceries than men. There is a tendency to increase the time for shopping closer to the weekend. The frequency of purchases of goods among men and women varies. For women, whose average is 400 h (16 days) or 301 trips to the store per year, for 63 years of life on average, is 2 years and 10 months of time spent on «shopping». In addition, most time is spent on clothing (30 visits to stores and 100 h 48 min per year) and products (84 visits to stores and 94 h 55 min per year). Buying shoes for women is 40 h and 30 min per year and accessories is 19 h and 31 min per year. This also includes 48 h 30 min a year, during which women simply look at storefronts. Each year, women spend 31 h and 21 min buying books, 17 h and 33 min buying perfumes and cosmetics, and 36 h and 21 min on buying gifts [31]. The mobility indicators can be identified by other methods, such as fully anonymized and aggregated mobile positioning data [32].
Systematization of the analyzed approaches is shown in Figure 1 [33,34,35,36,37,38,39,40,41,42,43,44,45,46,47,48,49,50,51,52,53,54,55,56,57,58,59,60,61,62,63,64,65,66,67,68,69,70,71,72,73,74].
When designing and organizing the operation of the system of supply and consumption of goods it must be considered inseparable from end users. The process of purchasing goods in transport systems under the distribution scenario is accompanied by the costs of the consumption system, expressed in time and energy costs. This approach makes it possible to assess the transport system, also from the standpoint of the consumer, which is consumer-oriented.
The interaction of supply and demand cannot be separated without the participation of the environment, thus there is a need to describe more accurately all the processes that take place in the supply schemes using the system «Manufacturer»—«End-Consumers»—«Environment», in which logistics is central. The analysis shows that today there is no common point of view regarding the composition and structure of compatible estimated indicators of the efficiency of logistics activities in the scientific community. To assess the effectiveness of the interaction of logistics and its end-consumers, it is advisable to determine a joint integrated assessment of the functioning of the systems «End-consumers—Logistics System». The use of integrated efficiency criteria will make it possible to take into account the revenue from the sale of goods, the cost of distribution in the logistics channel, and the value of the costs of end users of freight due to the acquisition process.
Thus, today modern scientific methods and models solve the problems of certain logistics aspects, but do not fully take into account one of the most important aspects of logistics—the end-consumer.
The following is taken as the working hypothesis:
The decision on the choice of the transport operator parameters (e.g., vehicle capacity) should be made on the basis of the analysis of changes in the generalized distribution utility index in consumer-driven logistics. Optimal is the load capacity that provides the maximum value of this criterion.

3. Results

3.1. Generalized Distribution Utility Index in Consumer-Driven Logistics Concept

Research on the functioning of sustainable logistics systems should be carried out with the involvement of its end users and the principles of systems analysis. The analysis of available methods and models made it possible to determine the following approaches to the sustainable distribution scenario in consumer-driven logistics: experimental, statistical analysis, grouping and comparison of data, mathematical modeling, and regression. An integral approach to sustainable distribution in consumer-driven logistics consists of choosing the structure of the basic elements and management functions of the system, organizing the interaction between its elements, and assessing the compliance of the production version of the system with the requirements for determining the feasibility of improvement. This approach allows to build a mathematical model that is a tool for placing and describing the behavior of elements according to the supply scheme of the city and the consumption system [75].
Thus, in accordance with this, the process of goods distribution, taking into consideration possible scenarios for the distribution of demand from end-consumers, is presented in Figure 2.
System (integrated) planning includes the following stages:
(1)
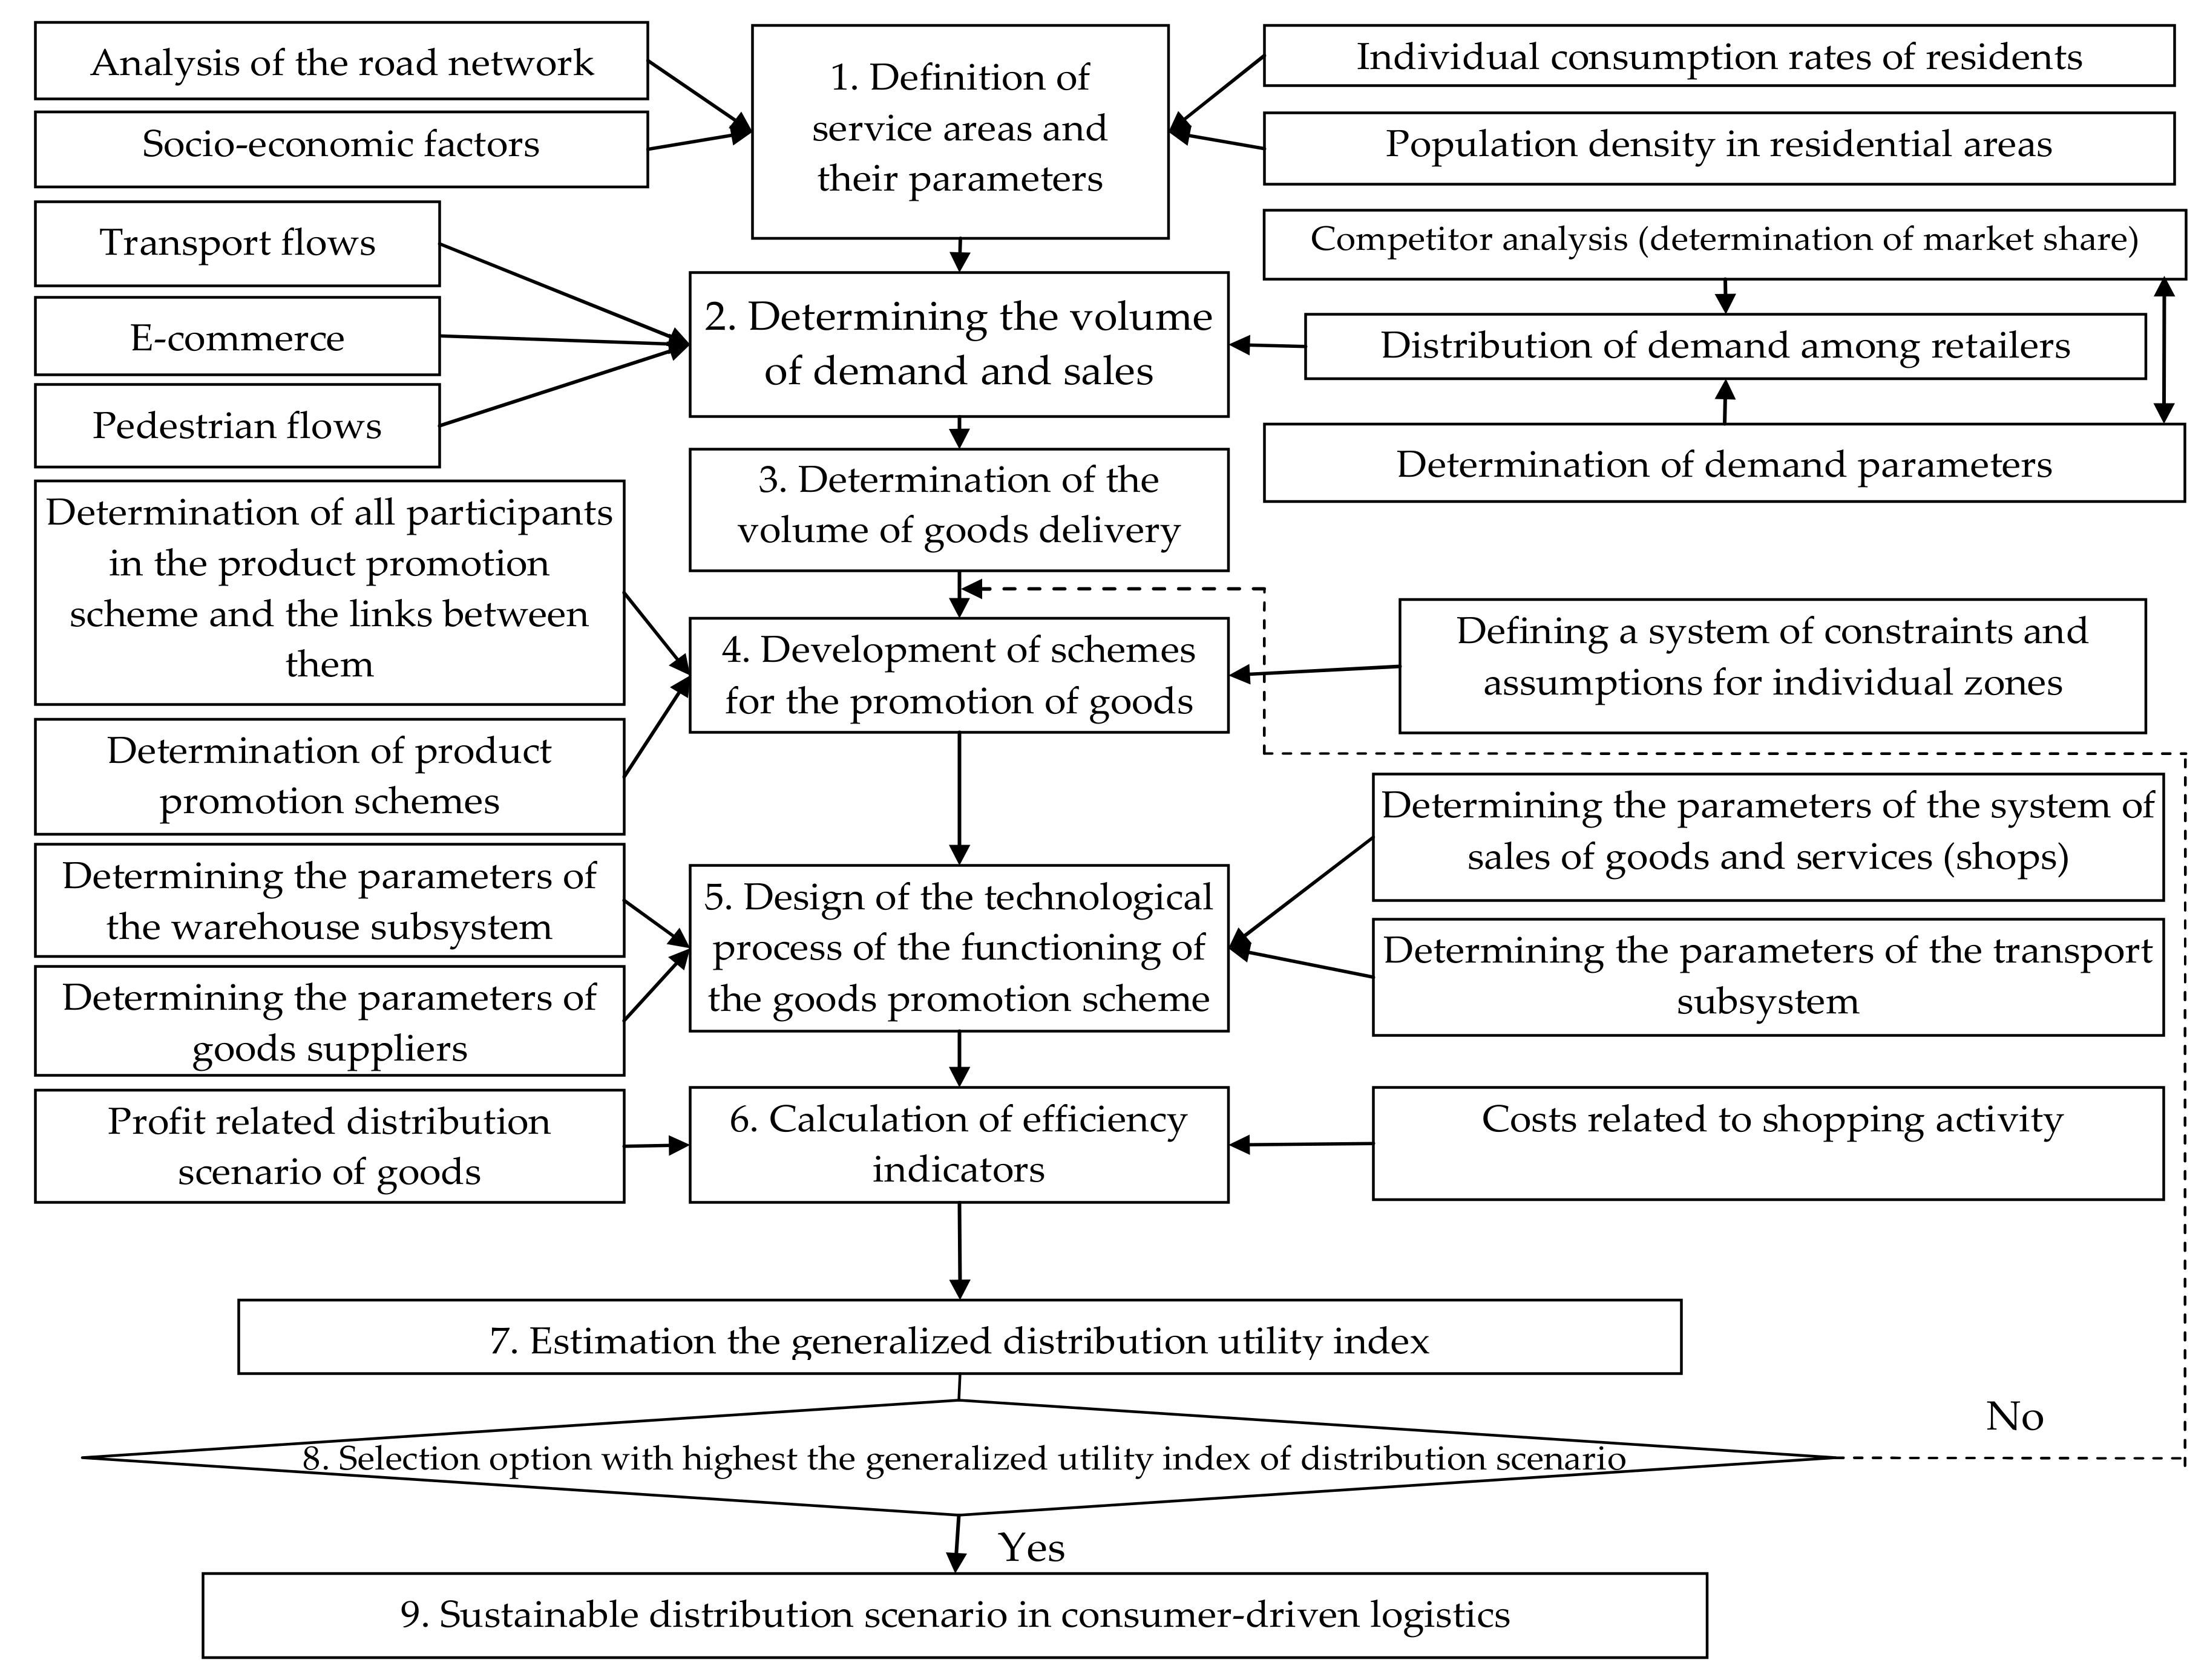
Definition of service areas and their parameters include: (a) an individual consumption rate of residents; (b) population density in residential areas; (c) socio-economic factors; (d) analysis of the road network. These data assess end-consumers’ behavior and constraints of the system in the current zone, as well as economic development, goals, and objectives, establishing links between parts.
(2)
Determining the demand and sales includes: (a) distribution of demand among retailers (competitor analysis (determination of market share) and determination of demand parameters); (b) transport flows; (c) e-commerce; (d) pedestrian flows.
(3)
Determination of the volume of goods delivery. Estimation of amount of goods to deliver including demand and stocks, selection resources and constraints.
(4)
Development of schemes for the promotion of goods includes: (a) defining a system of constraints and assumptions for individual zones; (b) determination of all participants in the product promotion scheme and the links between them; (c) determination of product promotion schemes
(5)
Design of the technological process of the functioning of the goods promotion scheme includes: (a) determining the parameters of the warehouse subsystem; (b) determining the parameters of goods suppliers; (c) determining the parameters of the system of sales of goods and services (shops); (d) determining the parameters of the transport subsystem.
(6)
Calculation of efficiency indicators includes estimation of the profit-related distribution scenario of goods and costs related to shopping activity, as well as the calculation of mathematical and logical models that reflect the system of connections between goals, alternative means of achieving them, and the external environment.
(7)
Estimation of the generalized distribution utility index. Generalized utility index of distribution scenario estimation for each possible option. Calculation of the criterion for choosing the best option that allows to compare the goals and benefits of the consumer-driven logistics.
(8)
Selection of the option with highest generalized utility index of distribution scenario to assess maximum possible options among all possible. A holistic optimization of all the parts of the consumer-driven logistics is made.
(9)
Estimation of sustainable distribution scenario in consumer-driven logistics in the current situation.
The modern goal of transport systems and its participants is to maximize their profits, minimize costs, more efficiently use the resources, etc. [76]. This approach does not reflect the interests of all participants in the process of supplying freight. Its effectiveness should be determined considering end-consumers. This makes it possible to assess the integrated efficiency of distribution with the participation of end-consumers (Figure 3).
To evaluate their operation, it is proposed to use the generalized distribution utility index to find a balance between distribution channel profit and social losses. The development of indicators of the system’s effectiveness will make it possible to find a balance between them. If the distribution channel can control the losses of its customers, it will control the sales and the freight flows and reduce the spending of leisure time on shopping. Different size and ratio of costs could affect consumer’s behavior: choice of product, distribution channel, and more [77].
The complexity of the generalized distribution utility in the consumer-driven logistics concept lies in the fact that it must combine two areas of activity: the demand put forward by the end-consumer and the supply put forward by the manufacturer. They depend on the profit of distribution of goods and the total costs of the end-consumers for the purchase of goods on respective scenario of distribution:
E v m k C Π = Д v m k C Π C v m k C Π Θ v m k C Π max
where Д v m k C Π —income on supplying scenario of goods, UAH; C v m k C Π —expenses on supplying scenario of goods, UAH; Θ v m k C Π —non-monetary costs related to shopping activity in current distribution scenario of goods, UAH; v—supply scenario participant; m—type of goods; k—distribution scenario of goods.
The revenue components are determined by selected distribution scenarios. The amount of system revenue is not constant and is determined by demand. The willingness of end-consumers to pay a price for goods creates a corresponding demand. Reducing the cost of goods for the end-consumer increases demand, and vice versa: the increase reduces demand [78]. If we accept the condition that the production capacity meets the existing demand for 100%, the maximum possible revenues of the distribution scenario will be determined as the product of sales volume at the price formed by demand. The most important thing under these conditions is to maximize income by inventing a rational price for goods. The change in demand is caused by the final cost of goods for end users and is realized through the redistribution of demand between different retailers in the service area. An integral approach makes it possible to distribute the flow of goods by supply systems (Figure 4).
Expenses of buyers for purchase of the m-th goods form incomes from realization under the distribution scenario, which are defined by the formula:
Д v m k C Π = Θ 1 _ z ω j = i = 1 M ( Q v m k Z j m k )
where Z j m k —cost of the m-th goods according to the k-th distribution scenario at the j-th retailer, UAH/kg; Q v m k —freight flow of the v-th participant at k-th distribution scenario of the m-th goods consignment, ton/year.
The volume of sales of the retailer’s goods will be determined on the basis of the probability distribution model of the demand in the service area which is given in the work [29]. The model is based on generalized end-consumers’ costs (monetary and non-monetary costs) via the trip-based method. To determine demand and the movements of end-consumers the method of redistribution of demand in the study areas was used [30,63,79]. Volumes of supply to a certain participant of the retail network are formed on the basis of demand parameters of end-consumers. A certain rational sales technology corresponds to a certain volume of sales, the choice of which can be made according to the indicator generalized distribution utility. A change in the carrying capacity of vehicles leads to a change in the restocking value and volume of storage, and as a consequence the cost of placing the order and the cost of storage through the distribution channel. Such a change in the cost of placing an order affects the cost of goods from the retailer and the probability of demand from that retailer. Changing the probability of distribution of the end-user demand leads to a corresponding change in generalized distribution utility in consumer-driven logistics.
By conducting a study of the acquisition costs when purchasing different goods in different logistics systems, researchers compare the consumption costs of different logistics channels [29,80] and determine generalized costs [81], to compare different transportation options. The problem lies in the heterogeneity and ambiguity of the composition of development costs and the difficulty of bringing them to a single measure [82].
The opposite objects of all participants in the supply chain encourage the development of a method and efficiency criterion, which was evaluated by the generalized distribution utility index in consumer-driven logistics. The components of non-monetary costs of end-consumers as a result of acquisition are those that arise from the moment of demand formation for freight to the beginning of its consumption. The value expression of this parameter in the distribution scenario can be defined as follows:
Θ v m k C Π = Θ 2 _ z ω j + Θ 3 _ z ω j
where Θ 2 _ z ω j —cost estimate of time spent on purchasing from the j-th retailer by residents of the ω-th district of the z-th service zone, UAH.; Θ 3 _ z ω j —cost estimate of the energy costs amount arising from the acquisition of the j-th retailer by residents of the ω-th district of the z-th service zone, UAH.
Monetary expression of the time value due to the development of freight traffic by all end users of the retail network in accordance with [30,63] has the form:
Θ 2 _ z w j = J = 1 J w = 1 W 2 ( 19.6 log δ z w j + 1.679 R z w j + 15.438 L z w j n o в ) + + 0.386 S z j s h o p C z ω h o u r
where δ z w j —slope on the road from the w-th district to the j-th retailer in the z-th service area; R z w j —coefficient of nonlinearity of the connection from the w-th district to the j-th retailer in the z-th service area; L z w j n o в —distance from the w-th district to the j-th retailer in the z-th service area, km; S z j s h o p —size of the j-th retailer, m2.
The monetary expression of the cost of energy due to the freight traffic development by all end-consumers of the retail network according to [29,30] is as follows:
Θ 3 _ z w j = J = 1 J w = 1 W 2 ( 92 . 388 log ( δ w j ) + 8 . 863 R w j + 78 . 092 L w j n o в ) + + 0 . 000232 ( S j s h o p ) 2 C K C a l l c n
In expanded form, the total logistics costs for the distribution of goods can be formalized as follows:
C v m k C Π = k = 1 K j = 1 J M = 1 V ( C v m k M F + C v m k o r d + C v m k T O + C v m k s t o r + C v m k s e l l )
C v m k M F —selling price of goods from the supplier, UAH/t; C v m k o r d —cost of orders for the k-th scenario of distribution of the m-th goods consignment, UAH; C v m k T O —transportation costs according to the k-th scenario of distribution m-th goods consignment, UAH; C v m k s t o r —warehousing costs according to the k-th scenario of distribution m-th goods, UAH; C v m k s e l l —costs associated with the sale of goods, UAH.
The cost of placing orders is calculated according to the method described in the work [83]. The range of data variation and the results of calculations presented in this paper coincide with ours. The models presented in the work [84] were used to calculate the cost of storage and transportation [85]. Generalized distribution utility in consumer-driven logistics (1), taking into account the above methods, can be represented as follows:
E v m k C Π = k = 1 K j = 1 J i = 1 M ( Q m z j Z j m k ) C v m k M F + C v m k o r d + + k = 1 K 0.113 q H v m k 0.339 + 0.067 R v m k 0.092 L v m k T O + + k = 1 K 0.00105 q H v m k 1.41 + 0.789 A v m k 0.026 T v m k T O , Q v m k ( 13.165 2.131 ln Q v m k ) + + S v m k ( 1.85 + 93.35 S v m k 1 P M 0.839 ) + C v m k s e l l + { J = 1 J w = 1 W 2 ( 19.63 log δ z w j + 1.679 R z w j + 15.438 l ¯ z ω j ) + + 0.386 S z j s h o p C z ω h o u r N z w j K C J = 1 J w = 1 W 2 ( 92 . 388 log ( δ w j ) + 8 . 863 R w j + 78 . 092 l ¯ z ω j ) + + 0 . 000232 S j s h o p 2 C K C a l l c n N z w j K C max
where C v m k M F —selling price of goods from the supplier, UAH/t; R v m k —specific fuel consumption of a vehicle according to the k-th distribution scenario, m-th consignment, (l/100 km)/t; A h v m k —number of vehicles of the h-th load capacity according to the k-th distribution scenario, m-th goods, units; T v m k T O —time of transport service according to the k-th distribution scenario of the m-th consignment, hrs; L v m k T O —total mileage of the k-th distribution scenario of the m-th consignment, hrs; where q H v m k —nominal load capacity of the vehicle according to the k-th distribution scenario of the m-th consignment, t; R v m k —specific fuel consumption of the vehicle according to the k-th distribution scenario of the m-th consignment, (l/100 km)/t; where S v m k —warehouse area according to the k-th distribution scenario of the m-th consignment, m2.
Modeling the process of generation of freight demand in the service zones is carried out on the example of separate retailers. To determine the service area, the algorithm in [29] was used.. The paper examines a retailer engaged in the sale of food. The market is in free competition

3.2. Simulation Scenario of Supply

The paper examines 16 networks of the city of Kharkiv, which make up more than 90% of the market. The following parameters were selected for the study: number of shops, time on the route when servicing the Republic of Moldova, coefficient of non-straightness of the Republic of Moldova connection, volume of traffic, average distance between checkpoints, turnover, zero mileage, and number of deliveries. The values of the parameters of logistics chains in Kharkiv, Ukraine were collected, and the limits of their measurement were revealed.
A theoretical study of patterns on the change in indicators of supply of goods was carried out. The resulting parameters were considered: the number of vehicles; the freight flow volume of sales of traffic according to the distribution scenario; the average distance traveled by the consumer to the retail network; the cost of freight traffic from members of the retail network; integrated criterion for assessing the effectiveness of logistics management of freight flows. The parameter load capacity of vehicles was selected as a controlled variable. As a result of studying the parameters of the functioning of real schemes for the delivery of freight flows, the ranges of variation of the controlled variables were established. Thus, the carrying capacity of vehicles was considered in the range from 2 to 22 tons.
The increase in the carrying capacity of vehicles leads to a change in the following indicators of the supplying the goods scheme: the volume of consumption of freight traffic; number of tours; total service time of the retail network according to the selected scenario; total mileage according to the selected scenario; number of vehicles (Figure 5).
Analysis of Figure 5 shows that the reduction in the number of tours leads to an increase in the carrying capacity of vehicles, if the transportation takes place according to the technological scheme of promoting the flow of goods.
The change in service time according to the distribution scenario during the year depending on the load capacity of vehicles (for different number of deliveries per year) is shown in Figure 6.
Analysis of Figure 6 shows that an increase in the carrying capacity of a vehicle decreases the maintenance time of the goods distribution scenario. The nature of the dependence of service time on the movement scheme is presented in Figure 6, and is explained by the reduction of zero mileage on the routes with increasing load capacity of vehicles, but at the same time, it leads to an increase in time for loading and unloading, which in turn affects it. The minimum value of this indicator is reached at a loading capacity of 12 tons.
The change in the total mileage of vehicles according to the distribution scenario from the carrying capacity of vehicles is shown in Figure 7.
Analysis of Figure 7 indicates that increasing the load capacity of the vehicle reduces the total mileage of the traffic flow scheme, by reducing the zero mileage. Varying the values of control parameters in the middle of the supply system allows to influence the price of goods in the retail network, which causes changes in demand and the transformation of the end-consumers matrix of movements.

3.3. Regularities of Change in the Value Expression of the Consumption of End-Consumers When Consuming Goods

An important aspect of logistics management is the determination of the rational carrying capacity of vehicles, which would maximize the selected performance indicator. The results of the influence on the change in the carrying capacity of vehicles on the volume of sales of goods in the retail network and their costs are shown in Figure 8, and the change in the distance traveled by the consumer to the retail network and the volume of freight traffic according to the distribution scenario from the carrying capacity of vehicles is shown in Figure 9.
From the graphs (Figure 8 and Figure 9) we see that the growth of vehicle capacity leads to a change in the following indicators of the distribution scenario: sales volume; average distance covered by end-consumers to the retail network Such a change in indicators is interdependent. Initially, the increase in load capacity from 2 to 12 tons affects the increase of these indicators, and with further growth there is a slight decrease. The connection between the indicators can be explained by the following circumstances. Increasing the carrying capacity of vehicles to a certain level helps to reduce the costs of the transport operator serving the retailer. Transportation costs are considered as a component of the cost of goods to the participant of the retail network. In turn, the decrease in the cost of goods leads to an increase in demand and an increase in the number of consumers visiting the retailer. As a result, the consumption of freight traffic increases (Figure 8). From Figure 9 we see that such changes have a corresponding impact on the average distance traveled by consumers when walking to the retail network participants and the value of their total costs.
The behavior of end-consumers generates the value of their costs due to shopping activity. Thus, it can be claimed that changing the scenario—capacity of vehicles—provides regulation of the value of public expenditures in the process (Figure 10).
Analysis of Figure 10 proves that the increase in the carrying capacity of vehicles initially causes a decrease in the cost of 1 kcal of the end-consumer, the cost of the «consumer basket» for the end-consumer and the total energy consumed. The lowest value of these parameters is achieved by choosing a rational brand of vehicle in the case of a load capacity of 12 tons. Further increase in load capacity leads to an increase in the final cost of freight for the end-consumer and increase the value of energy consumption due to the implementation of freight traffic.
The cost expression of the amount of time consumed due to the activity of acquisition in relation to the load capacity of vehicles is shown in Figure 11.
Analysis of Figure 11 indicates that an increase in the carrying capacity of vehicles initially entails an increase in the time consumed due to the acquisition process, achieved by choosing a rational vehicle brand with a carrying capacity of 12 tons. With a further increase in carrying capacity, there is a decrease in the time spent by the end-consumers for the acquisition process and a decrease in its value in the system.
The change in the value of the total costs of end-consumers depending on the load capacity of vehicles is shown in Figure 12.
Analysis of Figure 12 proves that the first stage of increase in the vehicles’ capacity initially causes a decrease in the value of the amount of energy consumed by a person due to the process of purchasing goods. In addition, the minimum value of this indicator is achieved for a certain load vehicle capacity. In the case of a further increase in load capacity, the value of the amount of energy consumed due to the acquisition process will increase. The most rational scenario that provides the minimum value of the total costs of end-consumers is the technology that uses the vehicles with a capacity of 12 tons.

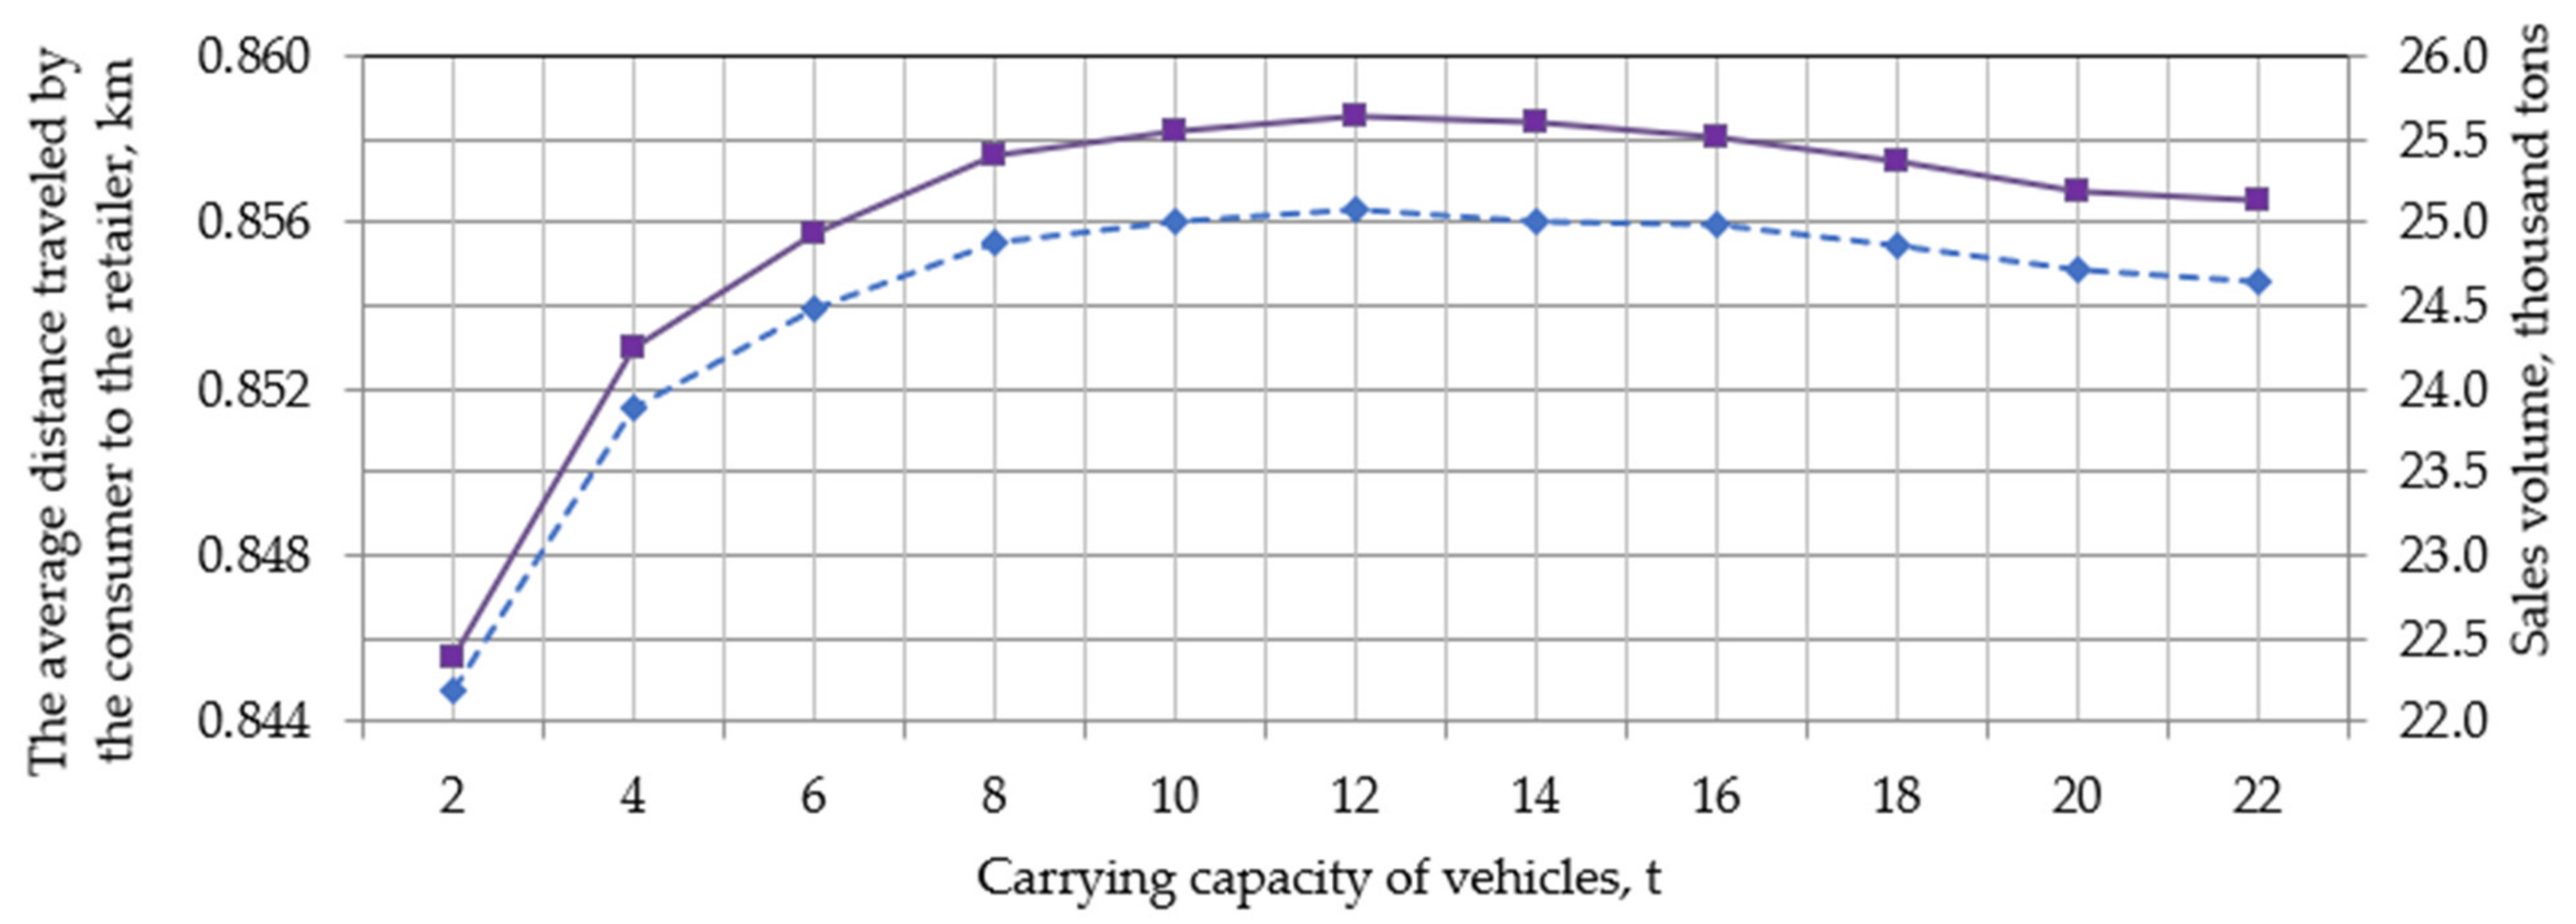
3.4. Patterns of Changing the Parameters of the Supply of Freight Flows in Urban Transport Systems

The final decision on the choice of vehicle capacity is made on the basis of the analysis of changes in the generalized distribution utility index of the sustainable supplying goods scenario (Figure 13). Rational is the load capacity that provides the maximum value of this criterion.
The nature of the dependence presented in Figure 13 shows that increasing the load capacity of vehicles initially leads to an increase in integrated efficiency. Its maximum value is achieved by choosing a rational brand of vehicle with a load capacity of 12 tons. Further increase in load capacity reduces the integrated efficiency of the distribution scenario. Given the parameters of the distribution, it is advisable to use vehicles with a capacity of 12 tons. Thus, we can conclude that there is such an optimal capacity of the vehicle, which provides maximum generalized distribution utility index, profit and selling goods via supplying scheme (H1).

4. Discussion and Conclusions

The concept of sustainable management is a system of views on the rationalization of economic activity by minimizing the impact on the environment. Over the last decade, extensive experience has been gained in improving the general principles and mechanisms of enterprises using logistics. At the same time, existing approaches do not consider the expenses of the end-consumers in the assessment of the sustainable distribution scenario in consumer-driven logistics. It is expedient to design sustainable logistics systems or to increase their efficiency of activity taking into consideration all possible factors of external and internal influence. The study of the generalized distribution utility index in consumer-driven logistics is based on understanding the basic idea of the holistic approach. Its novelty is to change stakeholders’ own priorities in favor of strengthening consumer-driven links for sustainable scenarios of urban supply systems. Marketing and logistics are closely interrelated. Thus, logistics is demand-oriented, and demand depends on end-consumers. The specificity of individual factors of demand can be determined only in stable conditions of the external and internal environment of the enterprise and consumers, which is an ideal case and does not correspond to reality. The degree of variation in the composition, quantity and strength of the factors depends on the changes that occur in the economic and social environment. Demand factors have an effect if the appropriate conditions are created for them. The more significant the changes in the environment, the larger and more radical they are (economic, social reforms), the sharper the dynamics of demand are, the stronger the effect of a large number of basic demand factors is, and the more active are the factors associated with the properties of the consumer operations.
In connection with the ongoing shifts in the structure of the population, it is important to consider the level of economic activity, employment and unemployment, which affect the nature of purchases, the opening hours of trade facilities, their location, transport accessibility, and other factors. Of great importance is the grouping of households by the number of members employed in social production, which, in combination with data on the size of the household, makes it possible to find an important indicator—the coefficient of the economic burden on a working family member (household), which also makes it possible to address the issues of targeting the services offered, maximizing the use of limited resources of households, taking into consideration objective criteria that make it possible to choose between various alternatives.
It is obvious that such a wide variety of households and significant differences in their way of life, traditions, birth rates, and living standards in different regions requires a differentiated approach to the implementation of various programs in the logistics system by market participants based on complex and comprehensive characteristics.
The development of electric vehicles today is at a high pace. The main factors in this development are electric motors with high efficiency, which are environmentally friendly in operation, as well as high-capacity batteries. Due to these factors, modern technology allows to introduce into the field of land transport electric trucks, which in its indicators are dominated by cars with internal combustion engines. Coverage of the current state and trends in the development of electric trucks is important to sustainable distribution in consumer-driven logistics.
The study of urban distribution technologies made it possible to identify the sequence and approaches to managing the technological stages of their distribution. Stages of sustainable distribution in consumer-driven logistics were developed and presented in this paper. The main directions of improving the efficiency of freight flow distribution were identified, but, at the same time, it was found that scientific provisions solve the problems of certain aspects of logistics, but do not fully take into account one of the most important aspects of logistics—the consumer.
The analysis revealed that end-consumers have monetary and non-monetary costs. The role of the last is not clearly investigated in generating probability of demand. The previously proposed method of estimating the total costs of the buyer [29] allowed to measure both monetary and non-monetary expenses during shopping activity. The presented calculations using the developed algorithm for the first time allowed to determine the monetary expression of energy and time costs of end-consumers during shopping activity from the parameters of the sustainable supply scenario. The presented consumer-driven logistics approach solving the problems of the sustainable distribution scenario allows to ensure the minimum value of end-consumers expenses and maximize the generalized distribution utility index. Its value can change depending on the technical and technological indicators of the processes when moving on different scenarios of freight flow and distribution of end-consumer demand. It is established that Increasing the carrying capacity of vehicles in the distribution scenario leads to increasing in the generalized distribution utility index in consumer-driven logistics. The optimal its value achieved by choosing a rational load capacity of the vehicle in scenario.

Author Contributions

Conceptualization, A.G. and T.S.; methodology, A.G.; software, Y.K. (Yuliia Khvesyk); validation, O.K., Y.K. (Yuriy Klapkiv) and G.B.; investigation, Y.K. (Yuliia Khvesyk); resources, G.B.; data curation, O.K.; writing—original draft preparation, A.G.; writing—review and editing, T.S.; visualization, Y.K. (Yuriy Klapkiv); supervision, Y.K. (Yuliia Khvesyk), Y.K. (Yuriy Klapkiv); project administration, O.K. All authors have read and agreed to the published version of the manuscript.

Funding

This research was funded by Slovak technical university in Bratislava.

Institutional Review Board Statement

Not applicable.

Informed Consent Statement

Not applicable.

Data Availability Statement

Not applicable.

Conflicts of Interest

The authors declare no conflict of interest.

References

  1. Sharma, P.; Chen, I.S.; Luk, S.T. Tourist shoppers’ evaluation of retail service: A study of cross-border versus international outshoppers. J. Hosp. Tour. Res. 2018, 42, 392–419. [Google Scholar] [CrossRef] [Green Version]
  2. Zatonatska, T.; Dluhopolskyi, O.; Chyrak, I.; Kotys, N. The internet and e-commerce diffusion in European countries (modeling at the example of Austria, Poland and Ukraine). Innov. Mark. 2019, 15, 66–75. [Google Scholar] [CrossRef] [Green Version]
  3. Beckers, J.R. The logistics sector in a consumer driven society, essays on location and network structure. In The Department of Transport and Regional Economics; The University of Antwerp: Antwerp, Belgium, 2019. [Google Scholar]
  4. Bolesnikov, M.; Stijačić, M.P.; Radišić, M.; Takači, A.; Borocki, J.; Bolesnikov, D.; Bajdor, P.; Dzieńdziora, J. Development of a business model by introducing sustainable and tailor-made value proposition for SME clients. Sustainability 2019, 11, 1157. [Google Scholar] [CrossRef] [Green Version]
  5. Russo, F.; Comi, A. Urban freight transport planning towards green goals: Synthetic environmental evidence from tested results. Sustainability 2016, 8, 381. [Google Scholar] [CrossRef] [Green Version]
  6. Comi, A.; Buttarazzi, B.; Schiraldi, M.M.; Innarella, R.; Varisco, M.; Rosati, L. DynaLOAD: A simulation framework for planning, managing and controlling urban delivery bays. Transp. Res. Procedia 2017, 22, 335–344. [Google Scholar] [CrossRef] [Green Version]
  7. Olkhova, M.; Roslavtsev, D.; Galkin, A. The Comparative Method of Assessing City Logistics Measure. In Decision Support Methods in Modern Transportation Systems and Networks; Springer: Cham, Switzerland, 2021; pp. 163–174. [Google Scholar]
  8. Greene, D.L.; Fan, Y.H. Transportation energy intensity trends: 1972–1992. Transp. Res. Rec. 1995, 1475. [Google Scholar]
  9. Cao, X.; OuYang, S.; Liu, D.; Yang, W. Spatiotemporal Patterns and Decomposition Analysis of CO2 Emissions from Transportation in the Pearl River Delta. Energies 2019, 12, 2171. [Google Scholar] [CrossRef] [Green Version]
  10. Van der Wardt, T.J.; Farid, A.M. A hybrid dynamic system assessment methodology for multi-modal transportation-electrification. Energies 2017, 10, 653. [Google Scholar] [CrossRef] [Green Version]
  11. Kush, Y.; Tonkoshkur, M.; Vakulenko, K.; Davidich, N.; Galkin, A. The rational scope of using direct and multilevel logistics channels for material flow distribution (case study in Ukraine). Indep. J. Manag. Prod. 2020, 11, 2805–2826. [Google Scholar] [CrossRef]
  12. Galkin, A.; Davidich, N.; Melenchuk, T.; Kush, Y.; Davidich, Y.; Lobashov, O. Modelling truck’s transportation speed on the route considering driver’s state. Transp. Res. Procedia 2018, 30, 207–215. [Google Scholar] [CrossRef]
  13. Davidich, Y.; Kush, Y.; Galkin, A.; Davidich, N.; Tkachenko, I. Improving of urban public transportation quality via operator schedule optimization. J. Urban Environ. Eng. 2019, 13, 23–33. [Google Scholar]
  14. Halkin, A.; Skrypin, V.; Kush, E.; Vakulenko, K.; Dolia, V. Invest approach to the transportation services cost formation. Procedia Eng. 2017, 178, 435–442. [Google Scholar] [CrossRef]
  15. Makarova, I.; Khabibullin, R.; Belyaev, E.; Mavrin, V. Increase of city transport system management efficiency with application of modeling methods and data intellectual analysis. In Intelligent Transportation Systems–Problems and Perspectives; Springer: Cham, Switzerland, 2016; pp. 37–80. [Google Scholar] [CrossRef]
  16. Bernardini, A.; Heemeryck, A.; Van Hoeck, E.; van Lier, T.; Macharis, C. Evaluating Climate Impacts of the Aviation Sector: A MCA-Analysis. In Proceedings of the European Transport Conference, Association for European Transport (AET), Lisbon, Portugal, 11–14 July 2010. [Google Scholar]
  17. Macharis, C. Multi-criteria analysis as a tool to include stakeholders in project evaluation: The MAMCA method. In Transport Project Evaluation. Extending the Social Cost–Benefit Approach; Edward Elgar Publishing: Cheltenham, UK, 2007; pp. 115–131. [Google Scholar]
  18. Fredriksson, A.; Janné, M.; Nolz, P.; de Chennevière, P.D.R.; van Lier, T.; Macharis, C. Creating stakeholder awareness in construction logistics by means of the MAMCA. City Environ. Interact 2021, 11, 100067. [Google Scholar] [CrossRef]
  19. Nathanail, E.; Karakikes, I.; Mitropoulos, L.; Adamos, G. A sustainability cross-case assessment of city logistics solutions. Case Stud. Transp. Policy 2021, 9, 219–240. [Google Scholar] [CrossRef]
  20. Ojala, L.; Celebi, D. The World Bank’s Logistics Performance Index (LPI) and drivers of logistics performance. In Proceedings of MAC-EMM, OECD; International Transport Forum: Paris, France, 2015. [Google Scholar]
  21. Kumar, A.; Anbanandam, R. Development of social sustainability index for freight transportation system. J. Clean. Prod. 2019, 210, 77–92. [Google Scholar] [CrossRef]
  22. De Oliveira, L.K.; de Araújo, G.G.F.; de Oliveira, I.K. How to explain the location of logistics warehouses from the urban quality-of-life index and the local supply index? WSB J. Bus. Financ. 2019, 53, 15–21. [Google Scholar] [CrossRef] [Green Version]
  23. Mahdinia, I.; Habibian, M.; Hatamzadeh, Y.; Gudmundsson, H. An indicator-based algorithm to measure transportation sustainability: A case study of the US states. Ecol. Indic. 2018, 89, 738–754. [Google Scholar] [CrossRef]
  24. Comi, A.; Persia, L.; Polimeni, A.; Campagna, A.; Mezzavilla, L. A methodology to design and assess scenarios within SULPS: The case of Bologna. Transp. Res. Procedia 2020, 46, 269–276. [Google Scholar] [CrossRef]
  25. Iwan, S.; Nürnberg, M.; Jedliński, M.; Kijewska, K. Efficiency of light electric vehicles in last mile deliveries–Szczecin case study. Sustain. Cities Soc. 2021, 74, 103167. [Google Scholar] [CrossRef]
  26. Wątróbski, J.; Małecki, K.; Kijewska, K.; Iwan, S.; Karczmarczyk, A.; Thompson, R.G. Multi-criteria analysis of electric vans for city logistics. Sustainability 2017, 9, 1453. [Google Scholar] [CrossRef] [Green Version]
  27. Comi, A.; Buttarazzi, B.; Schiraldi, M.; Innarella, R.; Varisco, M.; Traini, P. An advanced planner for urban freight delivering. Arch. Transp. 2018, 48, 27–40. [Google Scholar] [CrossRef]
  28. Kraus, L.; Proff, H. Sustainable Urban Transportation Criteria and Measurement—A Systematic Literature Review. Sustainability 2021, 13, 7113. [Google Scholar] [CrossRef]
  29. Halkin, A. Assessing the utility of retailer based on generalized costs of end-consumers. Found. Manag. 2020, 12, 31–42. [Google Scholar] [CrossRef] [Green Version]
  30. Galkin, A.; Mykola, K.; Balandina, I.; Anton, R.; Litomin, I.; Davidich, N.; Kumar, C. Assessing the impact of population mobility on consumer expenditures while shopping. Transp. Res. Procedia 2020, 48, 2187–2196. [Google Scholar] [CrossRef]
  31. Vignali, S.; Renko, S.; Dabrowska, A. Consumer behaviour in the market of catering services in selected countries of central–eastern Europe. Br. Food J. 2011, 1, 96–108. [Google Scholar]
  32. Santamaria, C.; Sermi, F.; Spyratos, S.; Iacus, S.M.; Annunziato, A.; Tarchi, D.; Vespe, M. Measuring the impact of COVID-19 confinement measures on human mobility using mobile positioning data. A European regional analysis. Saf. Sci. 2020, 132, 104925. [Google Scholar] [CrossRef] [PubMed]
  33. Borghesi, A. City Logistics: Is Deregulation the Answer? In Financial Environment and Business Development; Springer International Publishing: Cham, Switzerland, 2017; pp. 385–400. [Google Scholar]
  34. Lowson, B.; King, R.; Hunter, A. Quick Response: Managing the Supply Chain to Meet Consumer Demand; Wiley: Hoboken, NJ, USA, 1999. [Google Scholar]
  35. Lamming, R. Squaring lean supply with supply chain management. Int. J. Oper. Prod. Manag. 1996, 16, 183–196. [Google Scholar] [CrossRef]
  36. Reyes, P.M.; Bhutta, K. Efficient consumer response: Literature review. Int. J. Integr. Supply Manag. 2005, 1, 346–386. [Google Scholar] [CrossRef] [Green Version]
  37. Bookbinder, J.H.; Gümüş, M.; Jewkes, E.M. Calculating the benefits of vendor managed inventory in a manufacturer-retailer system. Int. J. Prod. Res. 2010, 48, 5549–5571. [Google Scholar] [CrossRef]
  38. Bajdor, P. Comparison between sustainable development concept and Green Logistics: The literature review. Pol. J. Manag. Stud. 2012, 5, 225–233. [Google Scholar]
  39. Gasser, R.G. Outsourcing Strategies in Manufacturing. Outsourcing Proj. 2002, 1, 450. [Google Scholar]
  40. Cardenas, I.; Borbon-Galvez, Y.; Verlinden, T.; Van de Voorde, E.; Vanelslander, T.; Dewulf, W. City logistics, urban goods distribution and last mile delivery and collection. Compet. Regul. Netw. Ind. 2017, 18, 22–43. [Google Scholar] [CrossRef]
  41. Starostka-Patyk, M. The use of information systems to support the management of reverse logistics processes. Procedia Comput. Sci. 2021, 192, 2586–2595. [Google Scholar] [CrossRef]
  42. Makarova, I.; Shubenkova, K.; Pashkevich, A.; Shepelev, V. The role of reverse logistics in the transition to a circular economy. In Proceedings of the International Conference on Reliability and Statistics in Transportation and Communication, Riga, Latvia, 17–20 October 2018; Springer: Cham, Switzerland, 2018; pp. 363–373. [Google Scholar]
  43. De Andres Gonzalez, O.; Koivisto, H.; Mustonen, J.M.; Keinänen-Toivola, M.M. Digitalization in Just-In-Time Approach as a Sustainable Solution for Maritime Logistics in the Baltic Sea Region. Sustainability 2021, 13, 1173. [Google Scholar] [CrossRef]
  44. Bvuchete, M.; Grobbelaar, S.S.; van Eeden, J. A Network Maturity Mapping Tool for Demand-Driven Supply Chain Management: A Case for the Public Healthcare Sector. Sustainability 2021, 13, 1988. [Google Scholar] [CrossRef]
  45. Lambrechts, W.; Son-Turan, S.; Reis, L.; Semeijn, J. Lean, green and clean? Sustainability reporting in the logistics sector. Logistics 2019, 3, 3. [Google Scholar] [CrossRef] [Green Version]
  46. Muilerman, G.J. Time-Based Logistics: An Analysis of the Relevance, Causes and Impacts. Ph.D. Thesis, Delft University of Technology, Delft, The Netherlands, 2001. [Google Scholar]
  47. Kijewska, K.; Jedliński, M.; Iwan, S. Ecological utility of FQP projects in the stakeholders’ opinion in the light of empirical studies based on the example of the city of Szczecin. Sustain. Cities Soc. 2021, 74, 103171. [Google Scholar] [CrossRef]
  48. Beckers, J.; Cárdenas, I.; Verhetsel, A. Identifying the geography of online shopping adoption in Belgium. J. Retail. Consum. Serv. 2018, 45, 33–41. [Google Scholar] [CrossRef]
  49. Rajagopalan, K.K. Global trends in supply chain management. ZENITH Int. J. Bus. Econ. Manag. Res. 2016, 6, 99–112. [Google Scholar]
  50. Centobelli, P.; Cerchione, R.; Esposito, E. Environmental Sustainability and Energy-Efficient Supply Chain Management: A Review of Research Trends and Proposed Guidelines. Energies 2018, 11, 275. [Google Scholar] [CrossRef] [Green Version]
  51. Huff, D.L. A Probabilistic Analysis of Shopping Center Trade Areas. Land Econ. 1963, 39, 81–90. [Google Scholar] [CrossRef]
  52. Applebaum, W. Can Store Location Be A Science ? Econ. Geogr. 1965, 41, 234–237. [Google Scholar] [CrossRef]
  53. Nakanishi, M.; Cooper, L.G. Parameter estimation for a multiplicative competitive interaction model: Least squares approach. J. Mark. Res. 1974, 303–311. [Google Scholar]
  54. Fotheringham, A.S. Some theoretical aspects of destination choice and their relevance to production-constrained gravity models. Environ. Plan. A 1983, 15, 1121–1132. [Google Scholar] [CrossRef]
  55. McFadden, D. The measurement of urban travel demand. J. Public Econ. 1974, 3, 303–328. [Google Scholar] [CrossRef]
  56. Rust, R.T.; Donthu, N. Capturing geographically localized misspecification error in retail store choice models. J. Mark. Res. 1995, 32, 103–110. [Google Scholar] [CrossRef] [Green Version]
  57. Kniazieva, T.V.; Shevchenko, A.V.; Inshin, M.I.; Yakovlyev, O.A. Current trends in the formation and development of insurance marketing in Ukraine. Risk Manag. Insur. Rev. 2021, 24, 279–292. [Google Scholar] [CrossRef]
  58. Ewing, B.T.; Barron, J.M.; Lynch, G.J. Understanding Macroeconomic Theory; Routledge: London, UK, 2006. [Google Scholar]
  59. Russo, F.; Comi, A. The simulation of shopping trips at urban scale: Attraction macro-model. Procedia Soc. Behav. Sci. 2012, 39, 387–399. [Google Scholar] [CrossRef]
  60. Jorgensen, D.L. Participant Observation: A Methodology for Human Studies; Sage Publications: London, UK, 1989. [Google Scholar]
  61. Halkin, A. Emotional state of consumer in the urban purchase: Processing data. Found. Manag. 2018, 10, 99–112. [Google Scholar] [CrossRef] [Green Version]
  62. Galkin, A.; Popova, Y.; Bodnaruk, O.; Zaika, Y.; Chuprina, E.; Shapovalenko, D.; Kolonataievskyi, O. Attractiveness modeling of retail on emotional fatigue of consumers. South East Eur. J. Econ. Bus. 2019, 14, 106–116. [Google Scholar]
  63. Galkin, A.; Zaytsev, V.; Shyshkin, V.; Obolentseva, L.; Popova, Y. Patterns of the Distribution of the Demand of End-Consumers among Retailers in the Zone of their Residence. Found. Manag. 2021, 13, 145–158. [Google Scholar] [CrossRef]
  64. Efremov, I.S.; Kobozev, V.M.; Yudin, V.A. Teoriya Gorodskih Passazhirskih Perevozok; Vysshaya Shkola: Moscow, Russia, 1980; p. 535. [Google Scholar]
  65. Sheffi, Y. Urban Transportation Networks; Prentice-Hall: Englewood Cliffs, NJ, USA, 1985; Volume 6. [Google Scholar]
  66. Cascetta, E.; Papola, A. Dominance among alternatives in random utility models. Transp. Res. Part A Policy Pract. 2009, 43, 170–179. [Google Scholar] [CrossRef]
  67. Colomé, R.; Lourenço, H.R.; Serra, D. A new chance-constrained maximum capture location problem. Ann. Oper. Res 2003, 122, 121–139. [Google Scholar] [CrossRef]
  68. ReVelle, C. The maximum capture or “sphere of influence” location problem: Hotelling revisited on a network. J. Reg. Sci. 1986, 26, 343–358. [Google Scholar] [CrossRef]
  69. Nakaya, T.; Fotheringham, A.S.; Hanaoka, K.; Clarke, G.; Ballas, D.; Yano, K. Combining microsimulation and spatial interaction models for retail location analysis. J. Geogr. Syst. 2007, 9, 345–369. [Google Scholar] [CrossRef]
  70. Halkin, A.; Bliumska-Danko, K.; Smihunova, O.; Dudnyk, E.; Balandina, I. Investigation influence of store type on emotional state of consumer in the urban purchase. Found. Manag. 2019, 11, 7–22. [Google Scholar] [CrossRef] [Green Version]
  71. Galkin, A.; Schlosser, T.; Galkina, O.; Hodáková, D.; Cápayová, S. Investigating using urban public transport for freight deliveries. Transp. Res. Procedia 2019, 39, 64–73. [Google Scholar] [CrossRef]
  72. Iwan, S.; Kijewska, K.; Lemke, J. Analysis of parcel lockers’ efficiency as the last mile delivery solution–the results of the research in Poland. Transp. Res. Procedia 2016, 12, 644–655. [Google Scholar] [CrossRef] [Green Version]
  73. Iwan, S.; Thompson, R.G.; Macharis, C. Application of genetic algorithms in optimizing the logistics network in an urban bicycle delivery system (No. 15-3043). In Proceedings of the Transportation Research Board 94th Annual Meeting, Washington, DC, USA, 11–15 January 2015. [Google Scholar]
  74. Nuzzolo, A.; Comi, A.; Papa, E. Governance of land-use development and urban freight transport. In Proceedings of the 8th International Conference on City Logistics, Institute for City Logistics, Kyoto, Japan, 13 November 2013; pp. 359–373. [Google Scholar]
  75. Galkin, A.; Obolentseva, L.; Balandina, I.; Kush, E.; Karpenko, V.; Bajdor, P. Last-Mile delivery for consumer driven logistics. Transp. Res. Procedia 2019, 39, 74–83. [Google Scholar] [CrossRef]
  76. Chen TD Larsen, K.; Nichols, B.; Kockelman, K. The Economics of Transportation System: A Reference for Practitioners; University of Texas at Austin: Austin, TX, USA, 2013; 310p. [Google Scholar]
  77. Galkin, A.; Dolia, C.; Davidich, N. The role of consumers in logistics systems. Transp. Res. Procedia 2017, 27, 1187–1194. [Google Scholar] [CrossRef]
  78. Jüttner, U.; Christopher, M.; Baker, S. Demand chain management–integrating marketing and supply chain management. Ind. Mark. Manag. 2007, 36, 377–392. [Google Scholar] [CrossRef] [Green Version]
  79. Galkin, A.; Kumar, C.; Roslavtsev, D.; Lobashov, O.; Schlosser, T. Influence Parameters of Transportation Process on Own/Hired Fleet Selection. Transp. Res. Procedia 2020, 48, 1815–1823. [Google Scholar] [CrossRef]
  80. Galkin, A.; Prasolenko, O.; Chebanyuk, K.; Balandina, I.; Atynian, A.; Obolentseva, L. The Neuromarketing ICT Technique for Assessing Buyer Emotional Fatigue. In Proceedings of the 14th International Conference on ICT in Education Research and Industrial Applications, Kyiv, Ukraine, 14–18 May 2018; pp. 243–253. [Google Scholar]
  81. Ferrari, P. A model of urban transport management. Transp. Res. Part B Methodol. 1999, 33, 43–61. [Google Scholar] [CrossRef]
  82. Oviedo, D.; Guzman, L.A. Revisiting accessibility in a context of sustainable transport: Capabilities and inequalities in Bogotá. Sustainability 2020, 12, 4464. [Google Scholar] [CrossRef]
  83. Galkin, A. Urban environment influence on distribution part of logistics systems. Arch. Transp. 2017, 42, 7–23. [Google Scholar] [CrossRef]
  84. Kush, Y.; Skrypin, V.; Galkin, A.; Dolia, K.; Tkachenko, I.; Davidich, N. Regularities of Change of The Supply Chain Operation Efficiency, Depending on The Parameters of The Transport Process. Transp. Res. Procedia 2018, 30, 216–225. [Google Scholar] [CrossRef]
  85. Galkin, A.; Olkhova, M.; Iwan, S.; Kijewska, K.; Ostashevskyi, S.; Lobashov, O. Planning the Rational Freight Vehicle Fleet Utilization Considering the Season Temperature Factor. Sustainability 2021, 13, 3782. [Google Scholar] [CrossRef]
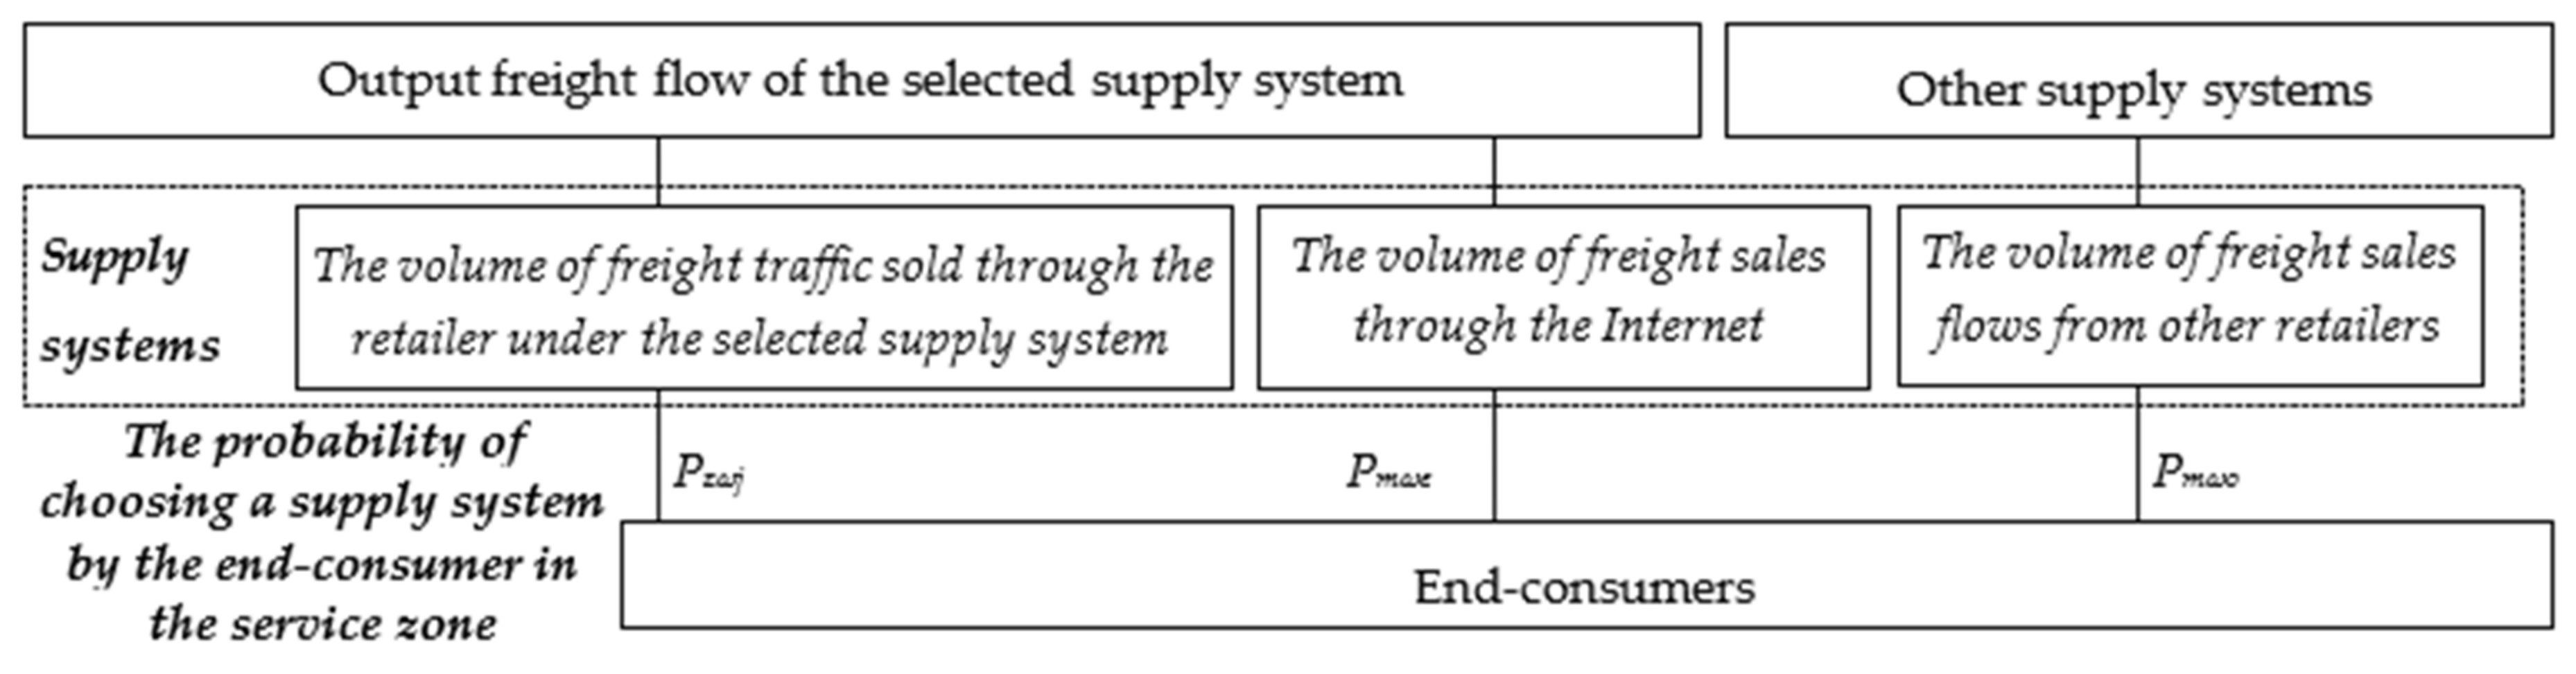
Figure 1. System Consumer driven-logistics for «Manufacturer»—«End consumers»—«Environment» system [33,34,35,36,37,38,39,40,41,42,43,44,45,46,47,48,49,50,51,52,53,54,55,56,57,58,59,60,61,62,63,64,65,66,67,68,69,70,71,72,73,74].
Energies 15 00872 g001
Figure 2. Stages of sustainable distribution in consumer-driven logistics.
Energies 15 00872 g002
Figure 3. Distribution of goods in consumer-driven logistics: Energies 15 00872 i001—retailer; Energies 15 00872 i002—material flow; Energies 15 00872 i003—end-consumers flow; Energies 15 00872 i004—goods flow; Q v m k —quantity of m-th freight flow в material flow v-th participant k-th supplying scenario of goods, t; P z ω j —probability of demand for goods of the j-th retailer by residents of the ω-th district of the z-th service zone; KC—end-consumers; Q z ω j —volume of goods at the link «member of the retail network—household», t.
Energies 15 00872 g003
Figure 4. The probability of supply system choice a by end-consumers in the service zone [63].
Energies 15 00872 g004
Figure 5. Change in the number of tours depending on the carrying capacity of vehicles.
Energies 15 00872 g005
Figure 6. Change of service time according to the distribution scenario during the year depending on the load capacity of vehicles.
Energies 15 00872 g006
Figure 7. Change in the total mileage of vehicles according to the distribution scenario depending on its load capacity.
Energies 15 00872 g007
Figure 8. Patterns of sales volume and its final prize for end-consumer depending on the load capacity of vehicles: Energies 15 00872 i005
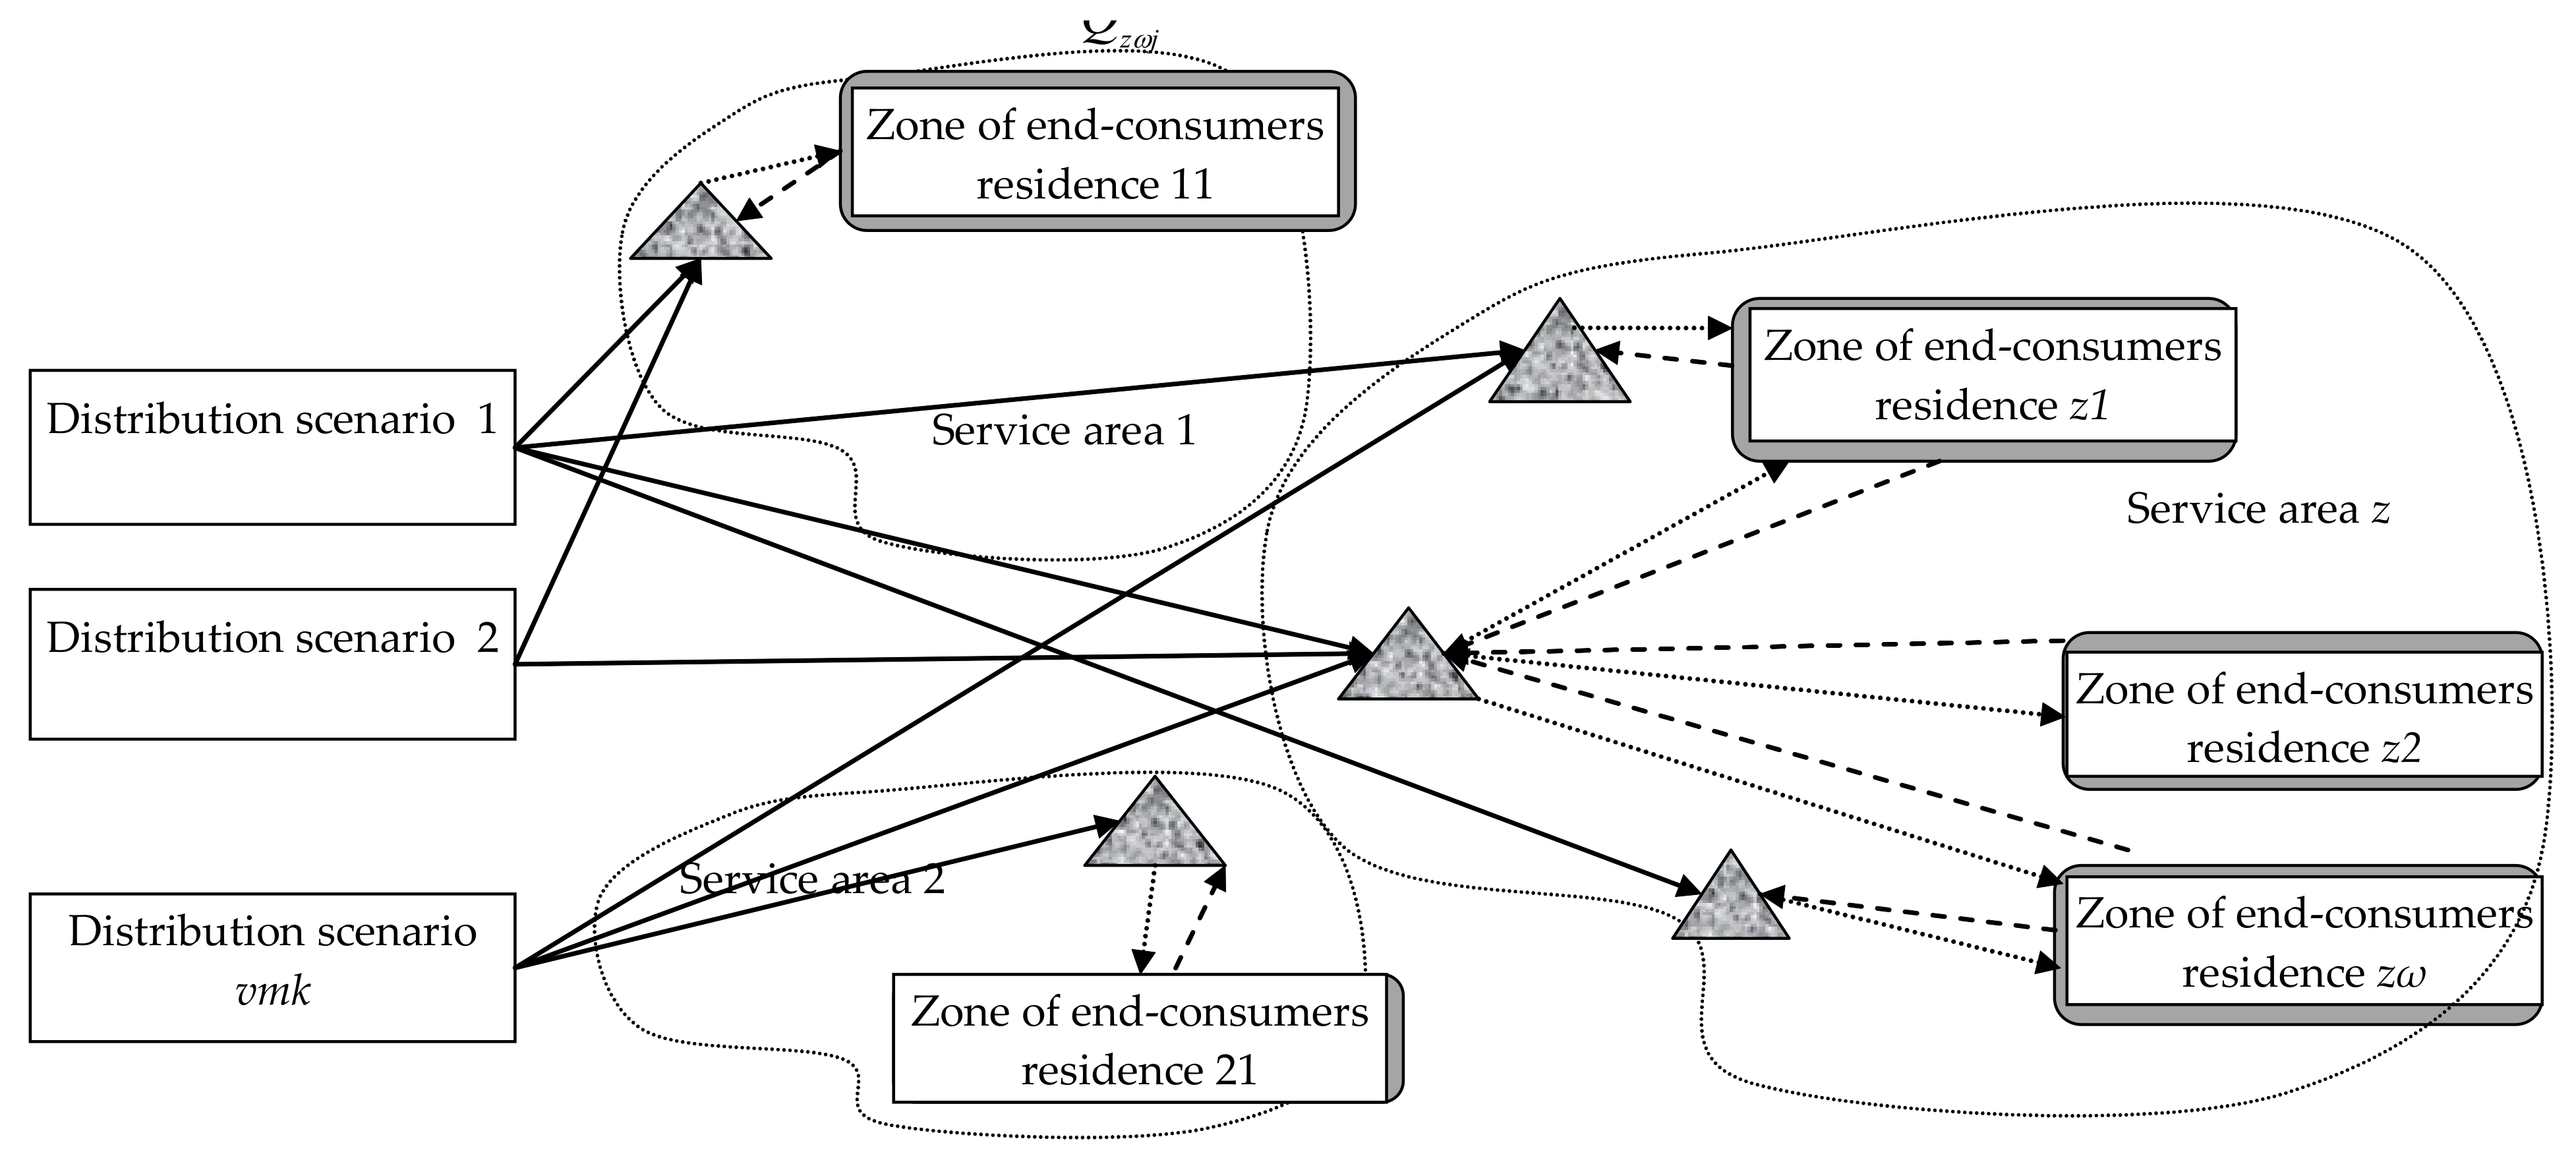
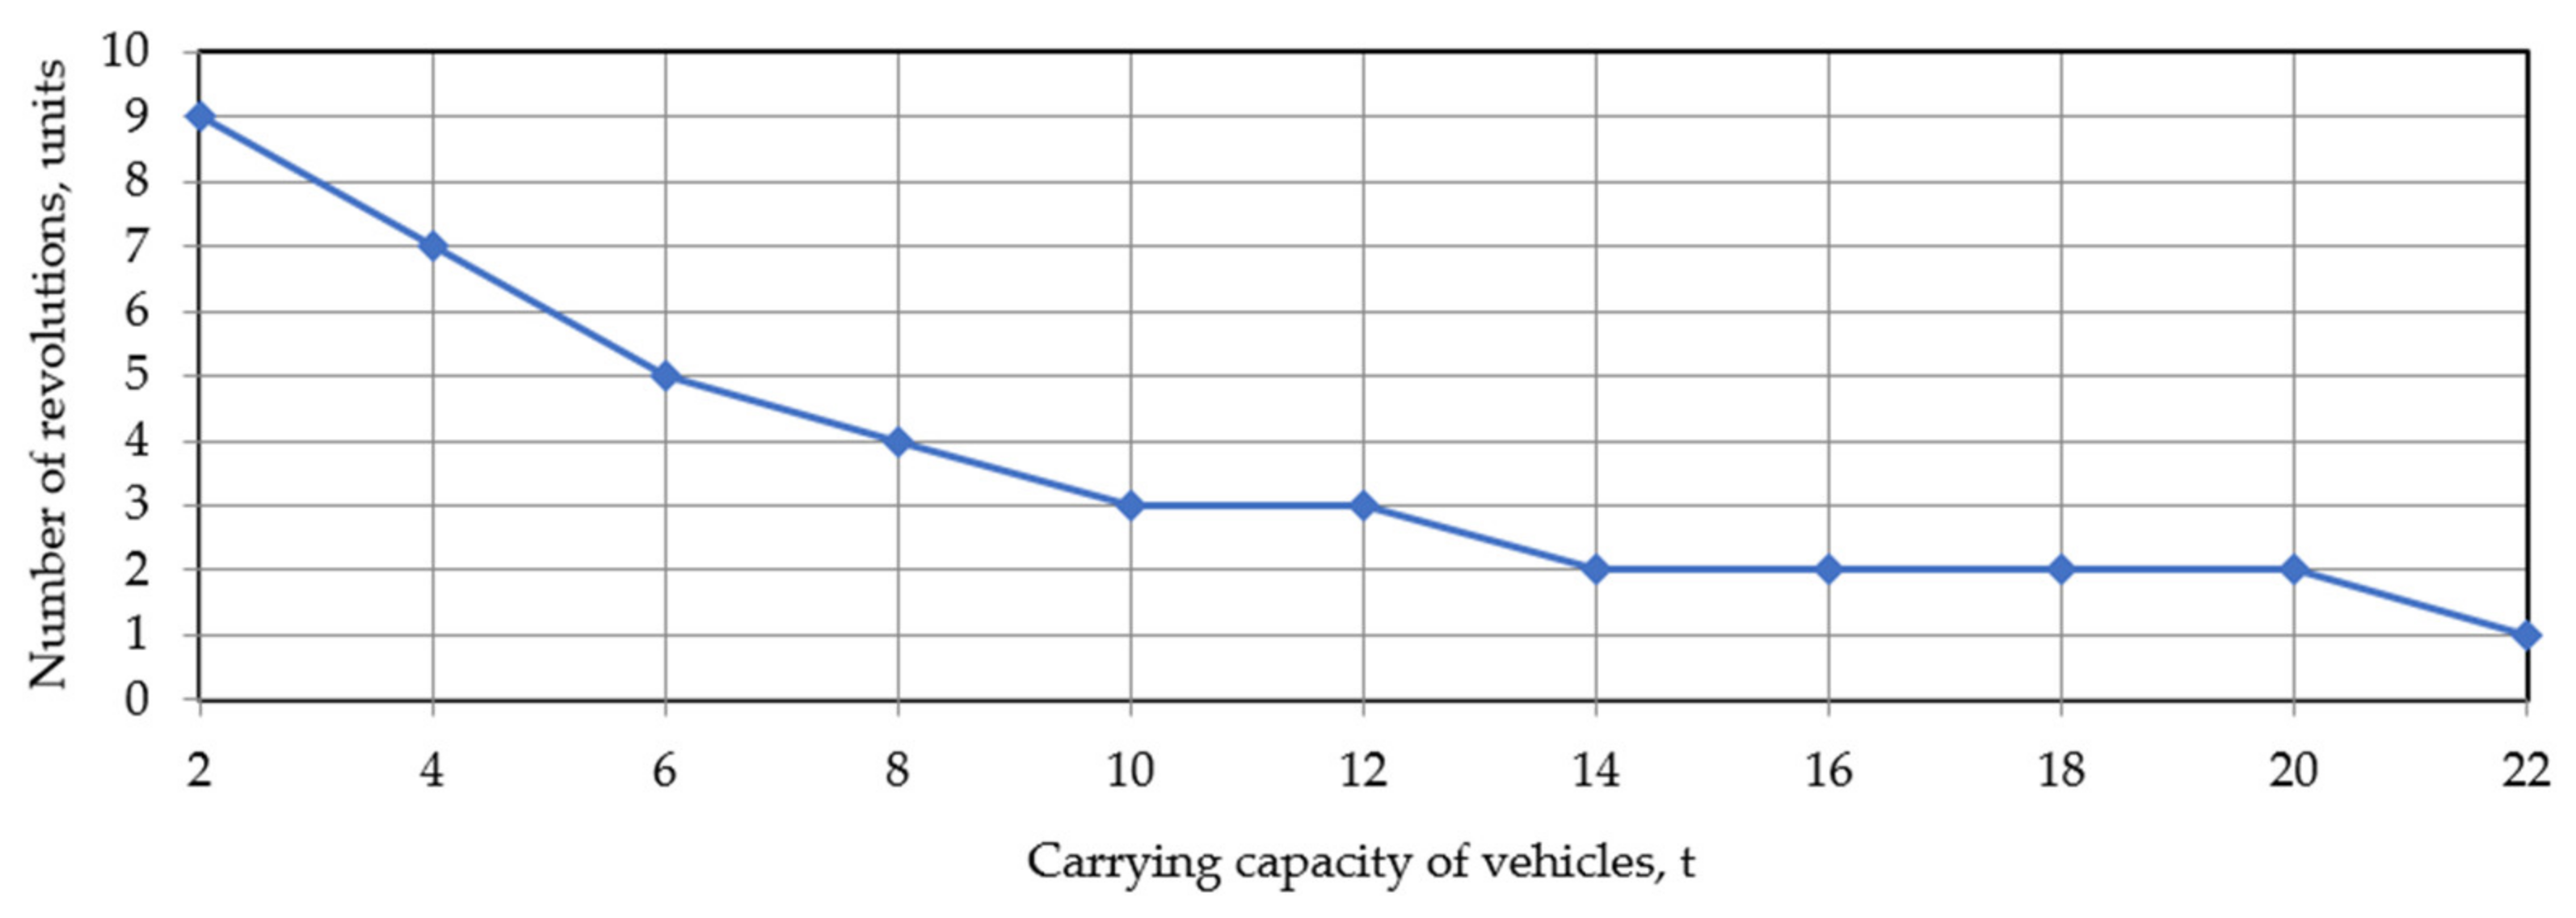
—freight flow according to the scenario of goods distribution, thousand 12 tons; Energies 15 00872 i006—cost of freight flow, UAH/kg; Energies 15 00872 i007—expedient load capacity of vehicles, t.
Energies 15 00872 g008
Figure 9. Patterns of changing the distance covered by the consumer to the retailer and the volume of sales according to the distribution scheme on the load capacity of vehicles: Energies 15 00872 i008
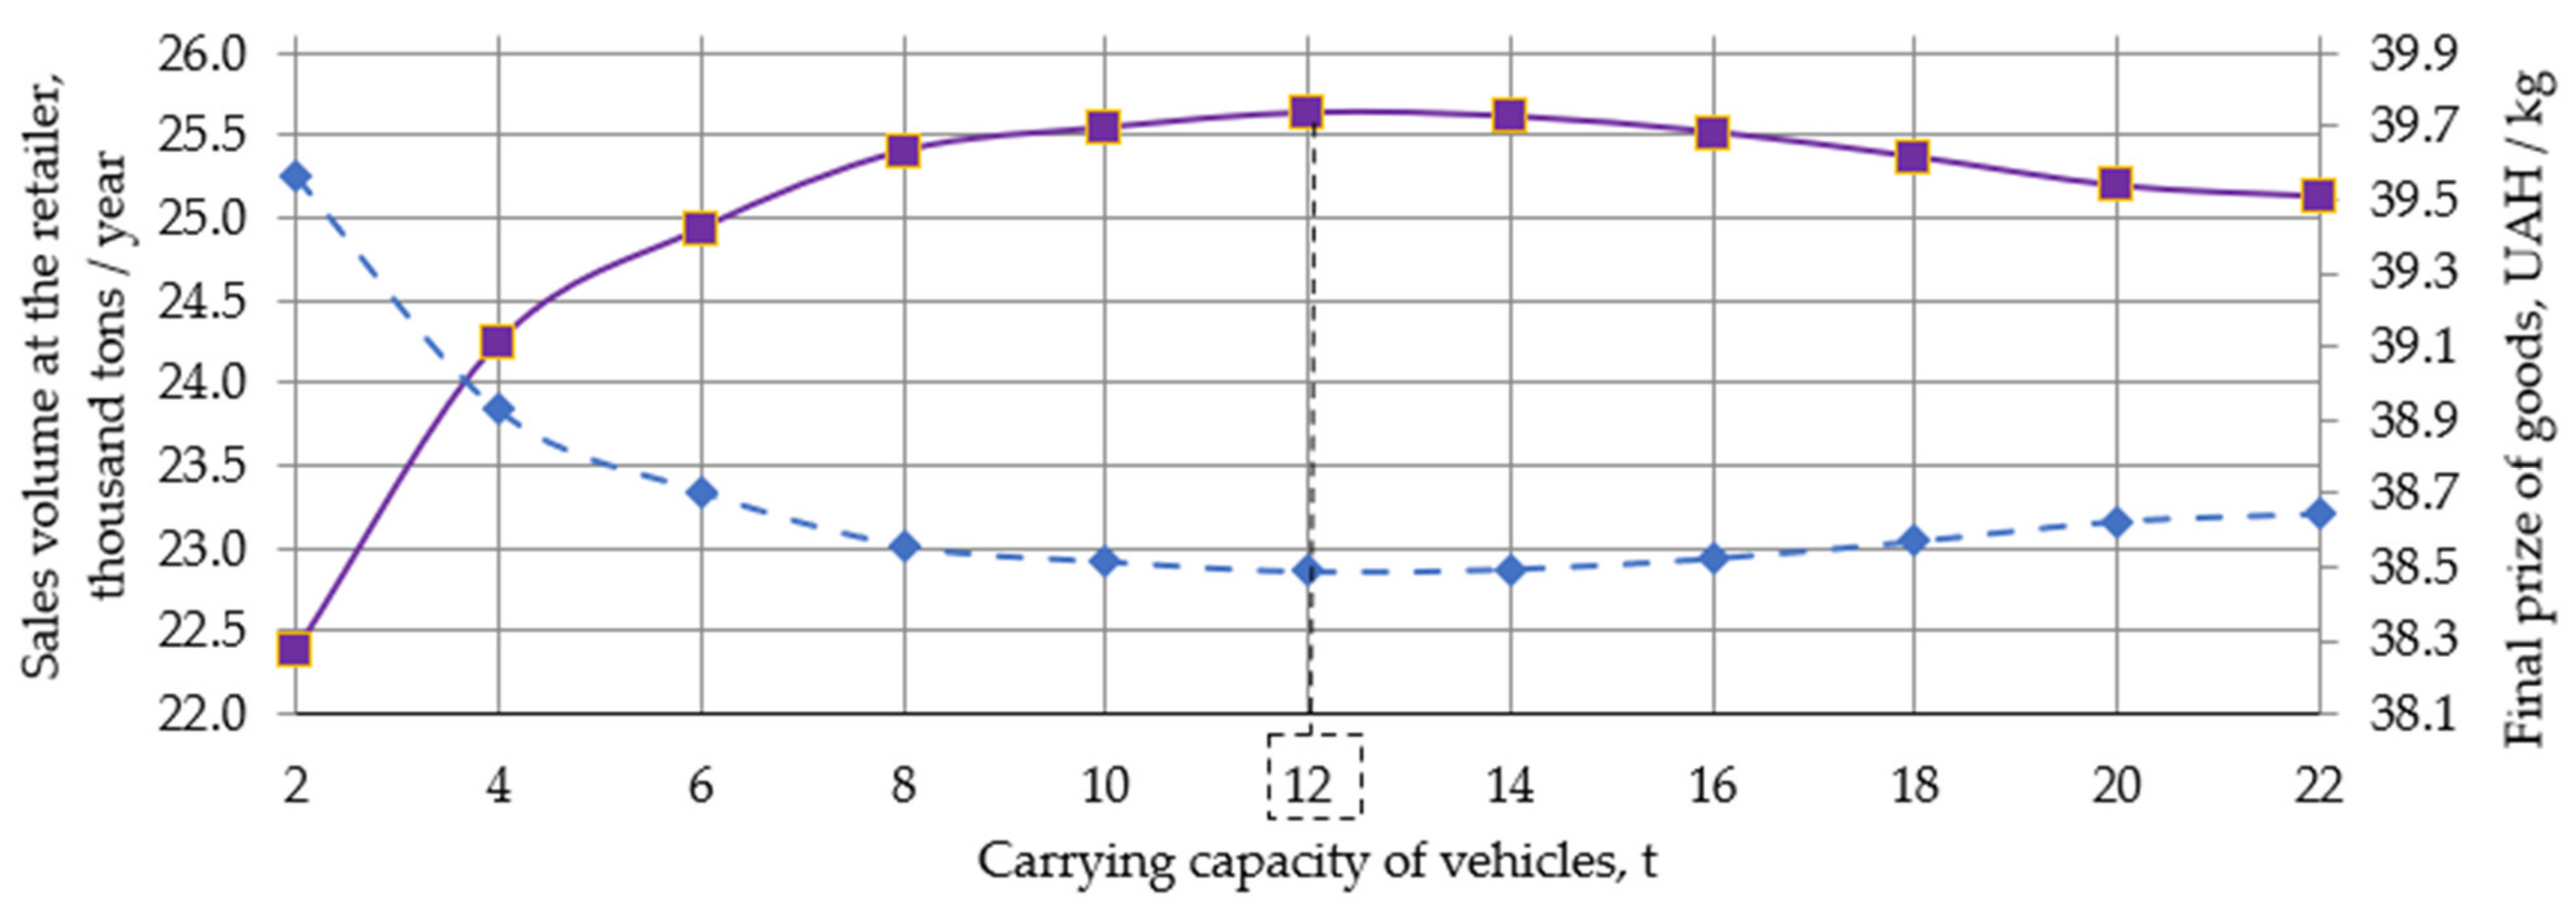
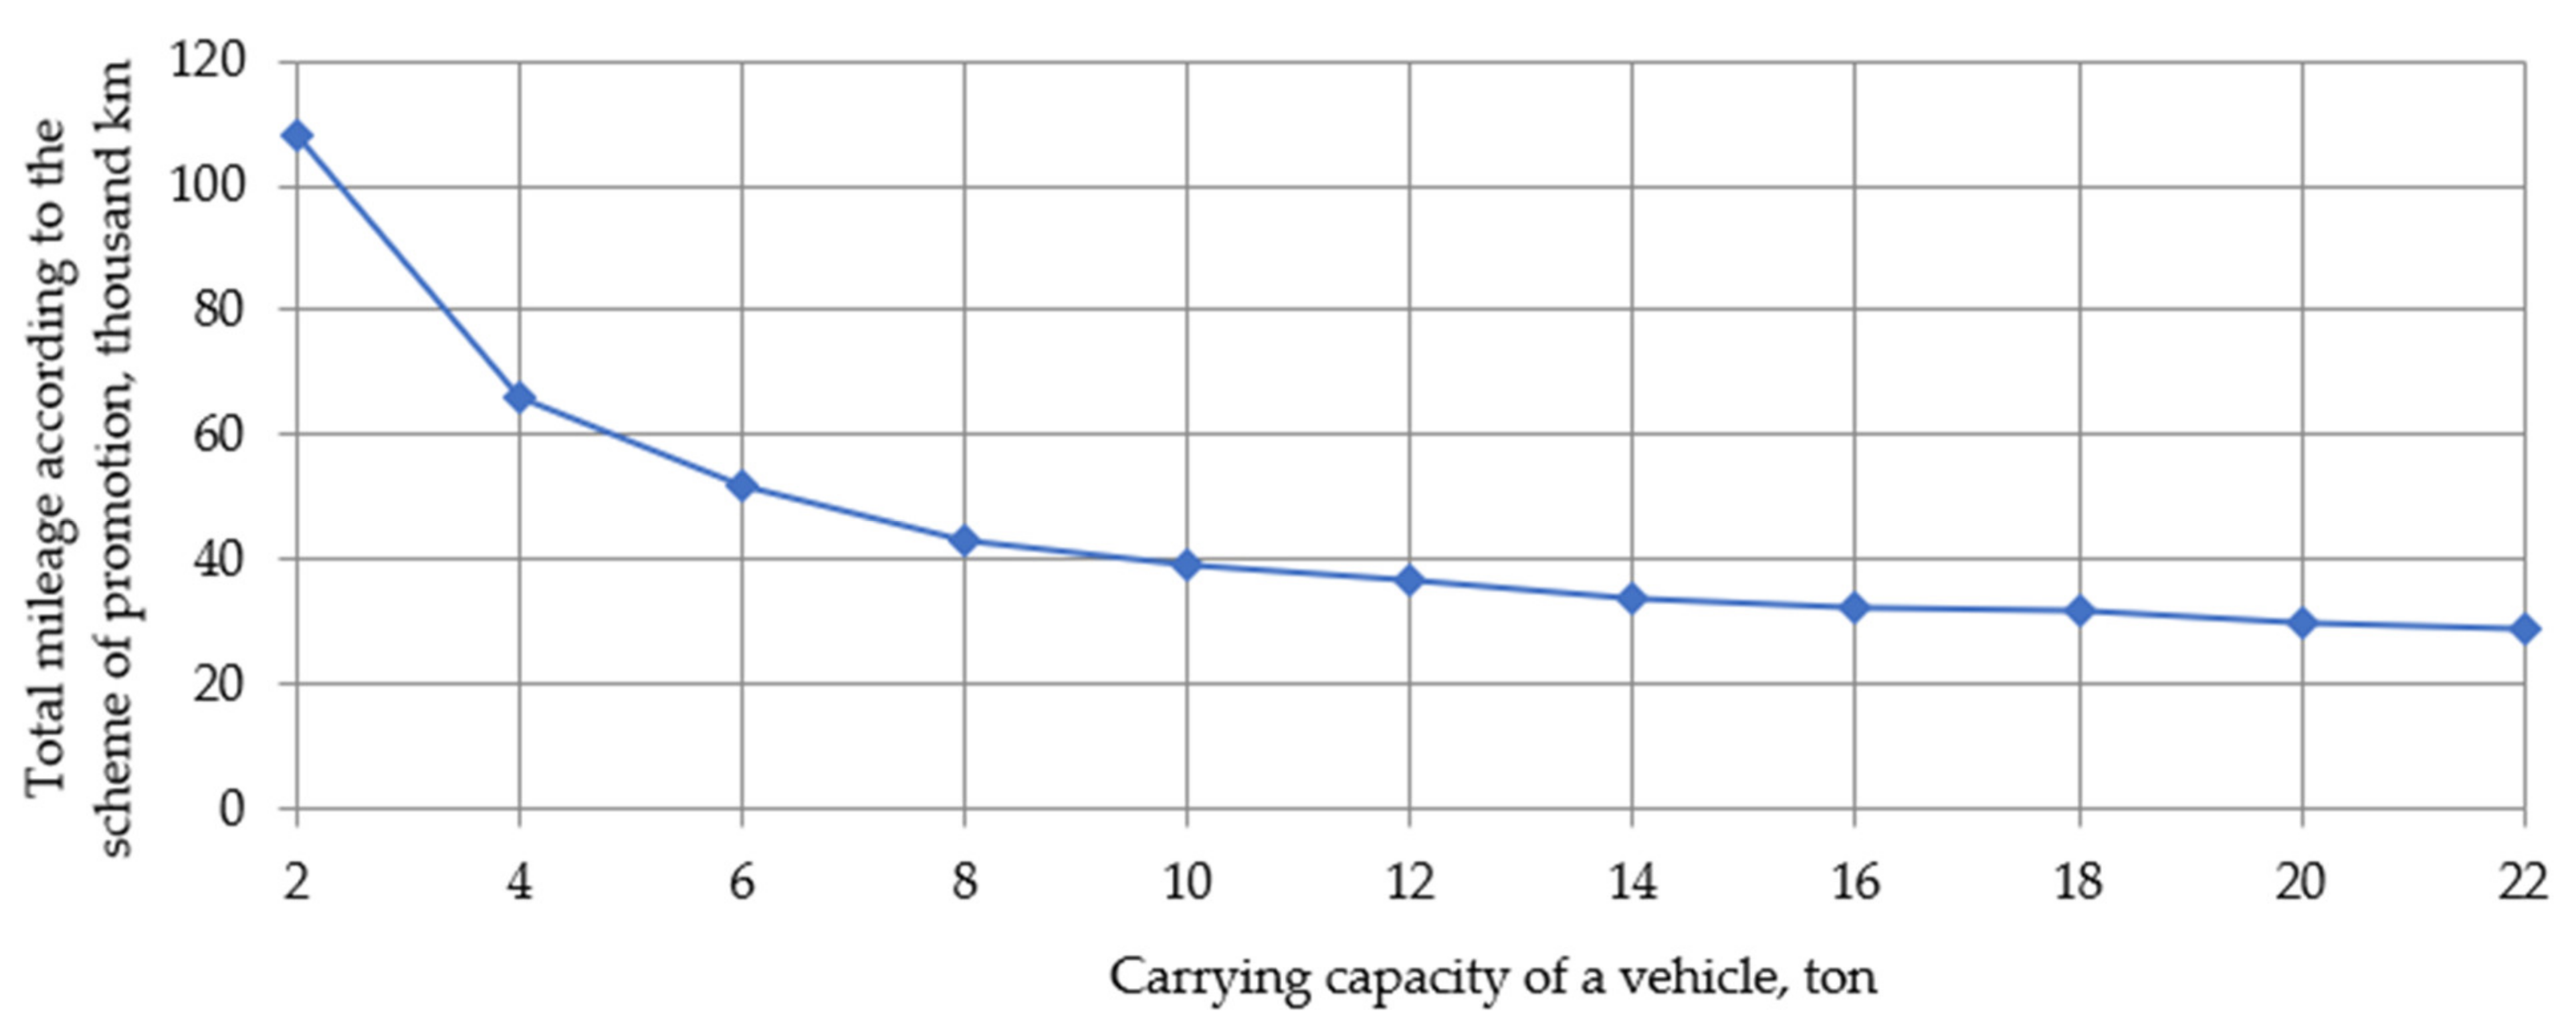
—sales volume under the distribution scenario, thousand tons; Energies 15 00872 i009—average distance covered by end-consumers to the retail network, km; Energies 15 00872 i010—expedient load capacity of vehicles, ton.
Energies 15 00872 g009
Figure 10. Changes in the cost expression of the amount of energy consumed due to the activity of acquisition in relation to the vehicle capacity: Energies 15 00872 i011—freight flow according to the distribution scheme, thousand tons; Energies 15 00872 i012—cost expression of the amount of energy consumed due to the activity of acquisition, UAH.
Energies 15 00872 g010
Figure 11. Changes in the value of time consumed due to the purchase in relation to the vehicles’ capacity: Energies 15 00872 i013
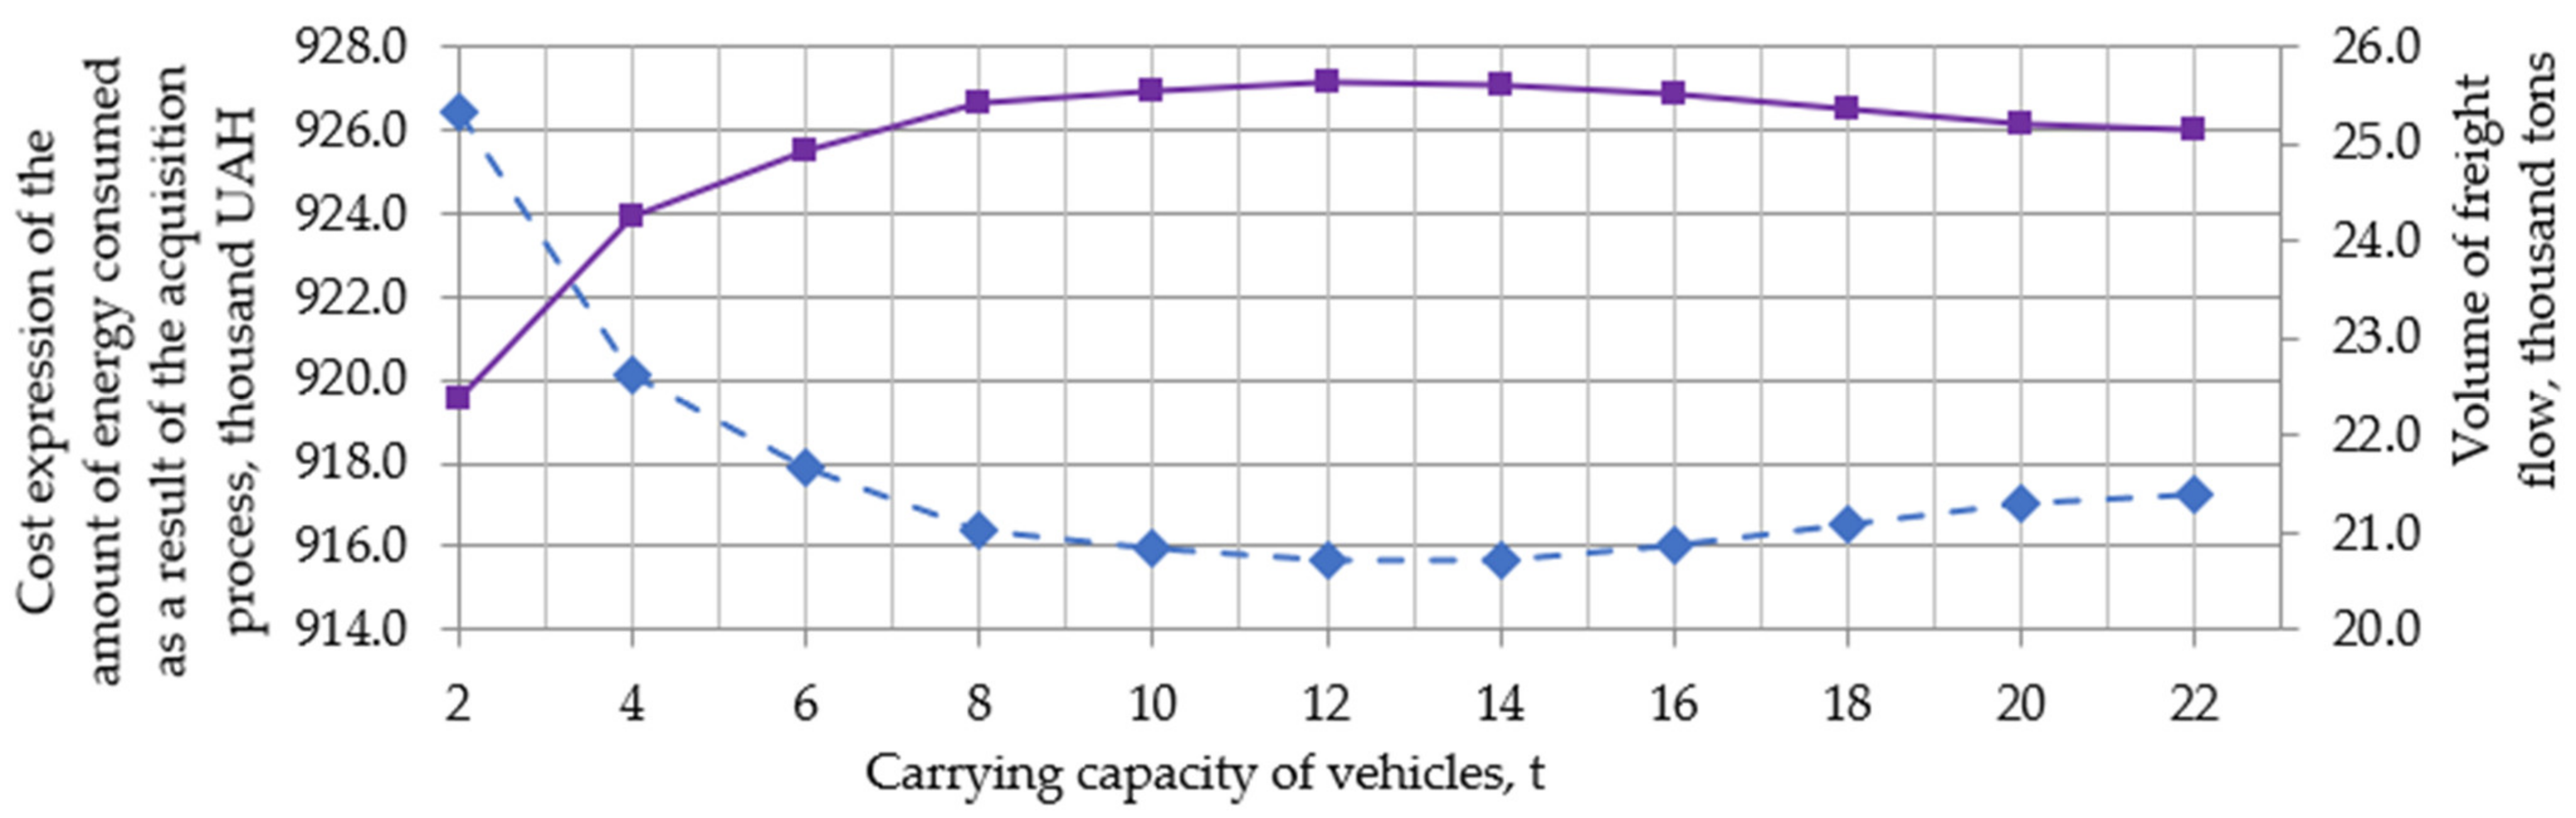
—volume of goods under the distribution scenario, t; Energies 15 00872 i014—cost expression of time consumed due to the activity of acquisition, UAH.
Energies 15 00872 g011
Figure 12. Changing the value of the total costs of end-consumers depending on the load capacity of vehicles.
Energies 15 00872 g012
Figure 13. Change of the generalized distribution utility index, profit and selling goods depending on the carrying capacity of vehicles: Energies 15 00872 i015
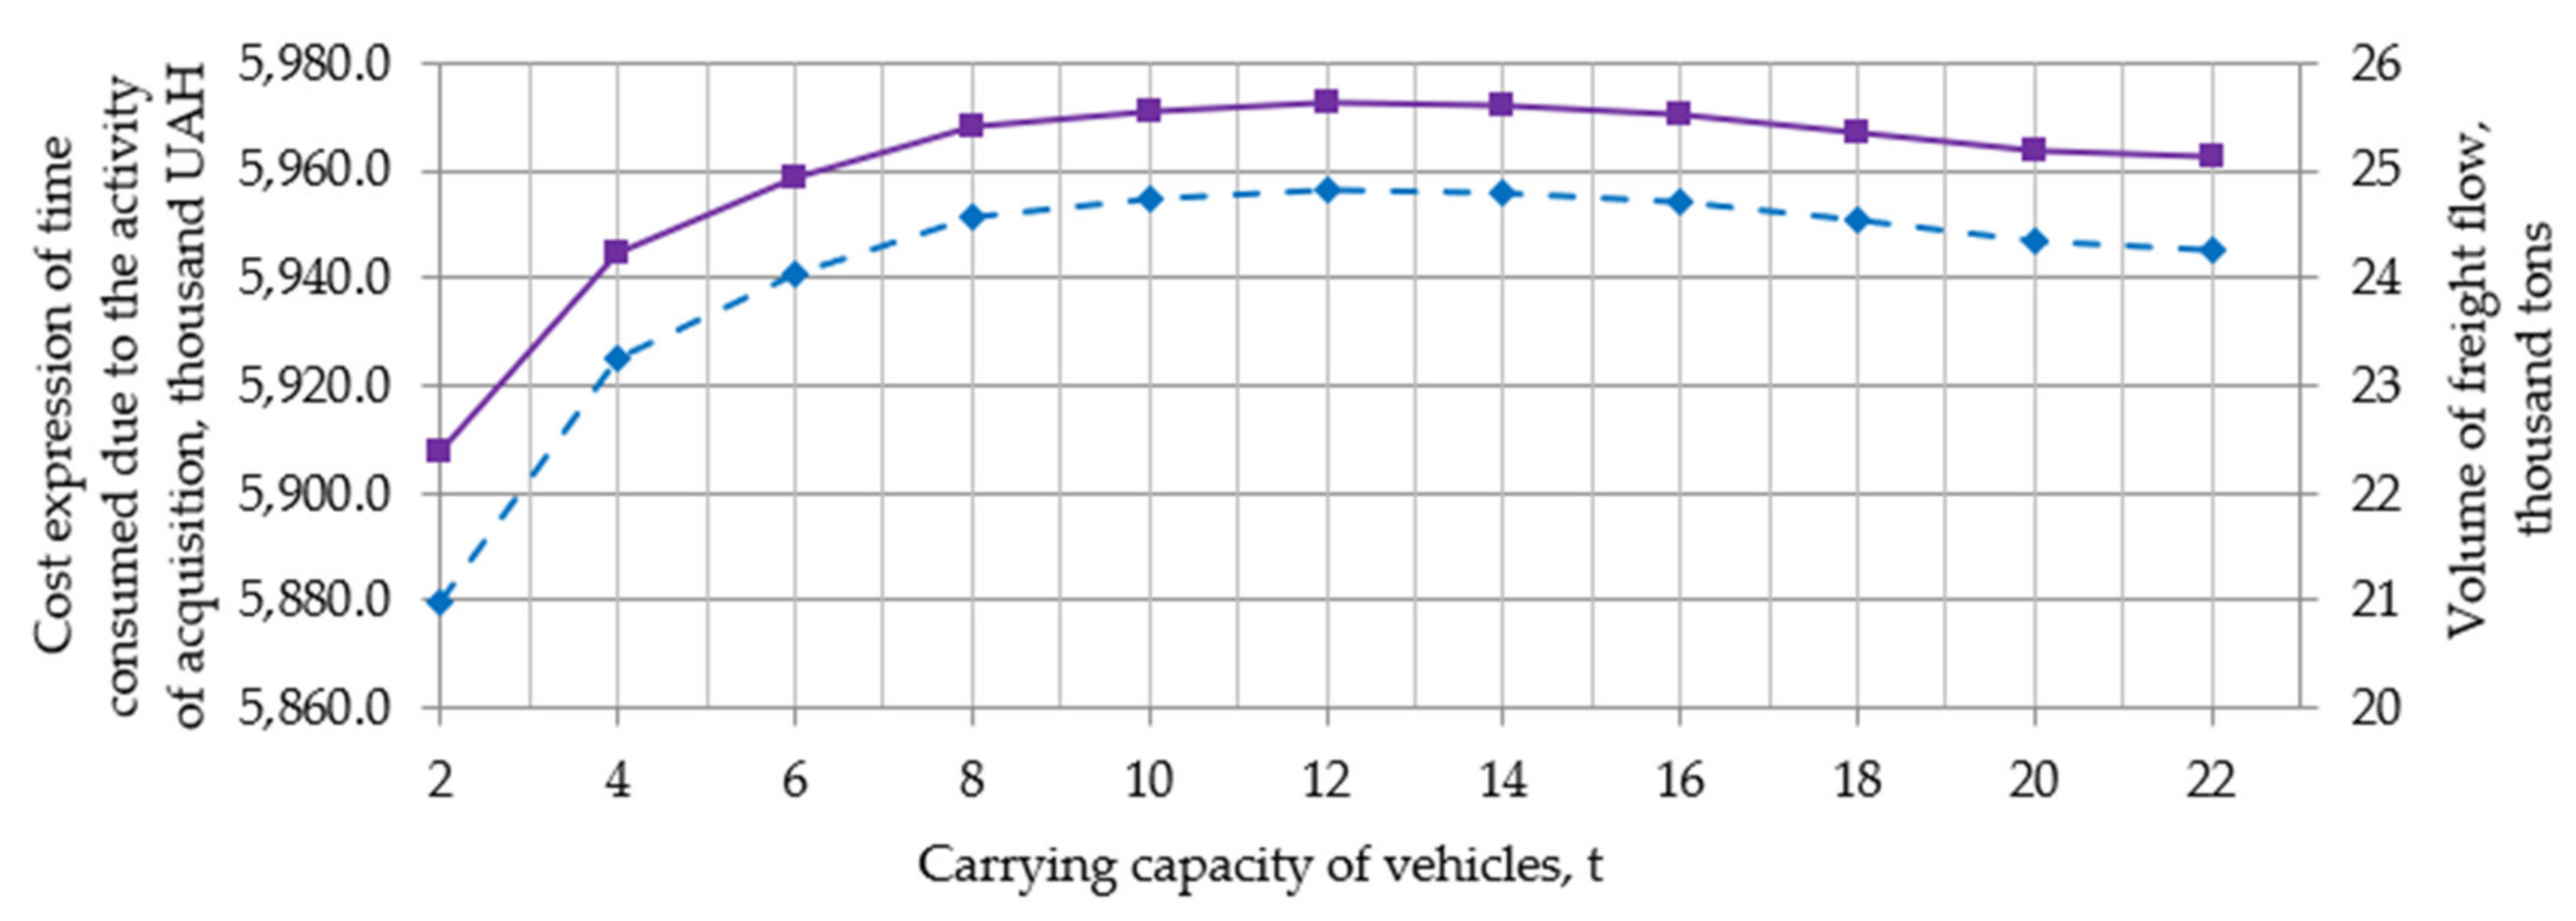
—the generalized distribution utility index in consumer-driven logistics scenario, UAH; Energies 15 00872 i016—selling volume via supply scenario, thousand ton.; Energies 15 00872 i017—profit of supplying scenario, UAH.
Energies 15 00872 g013
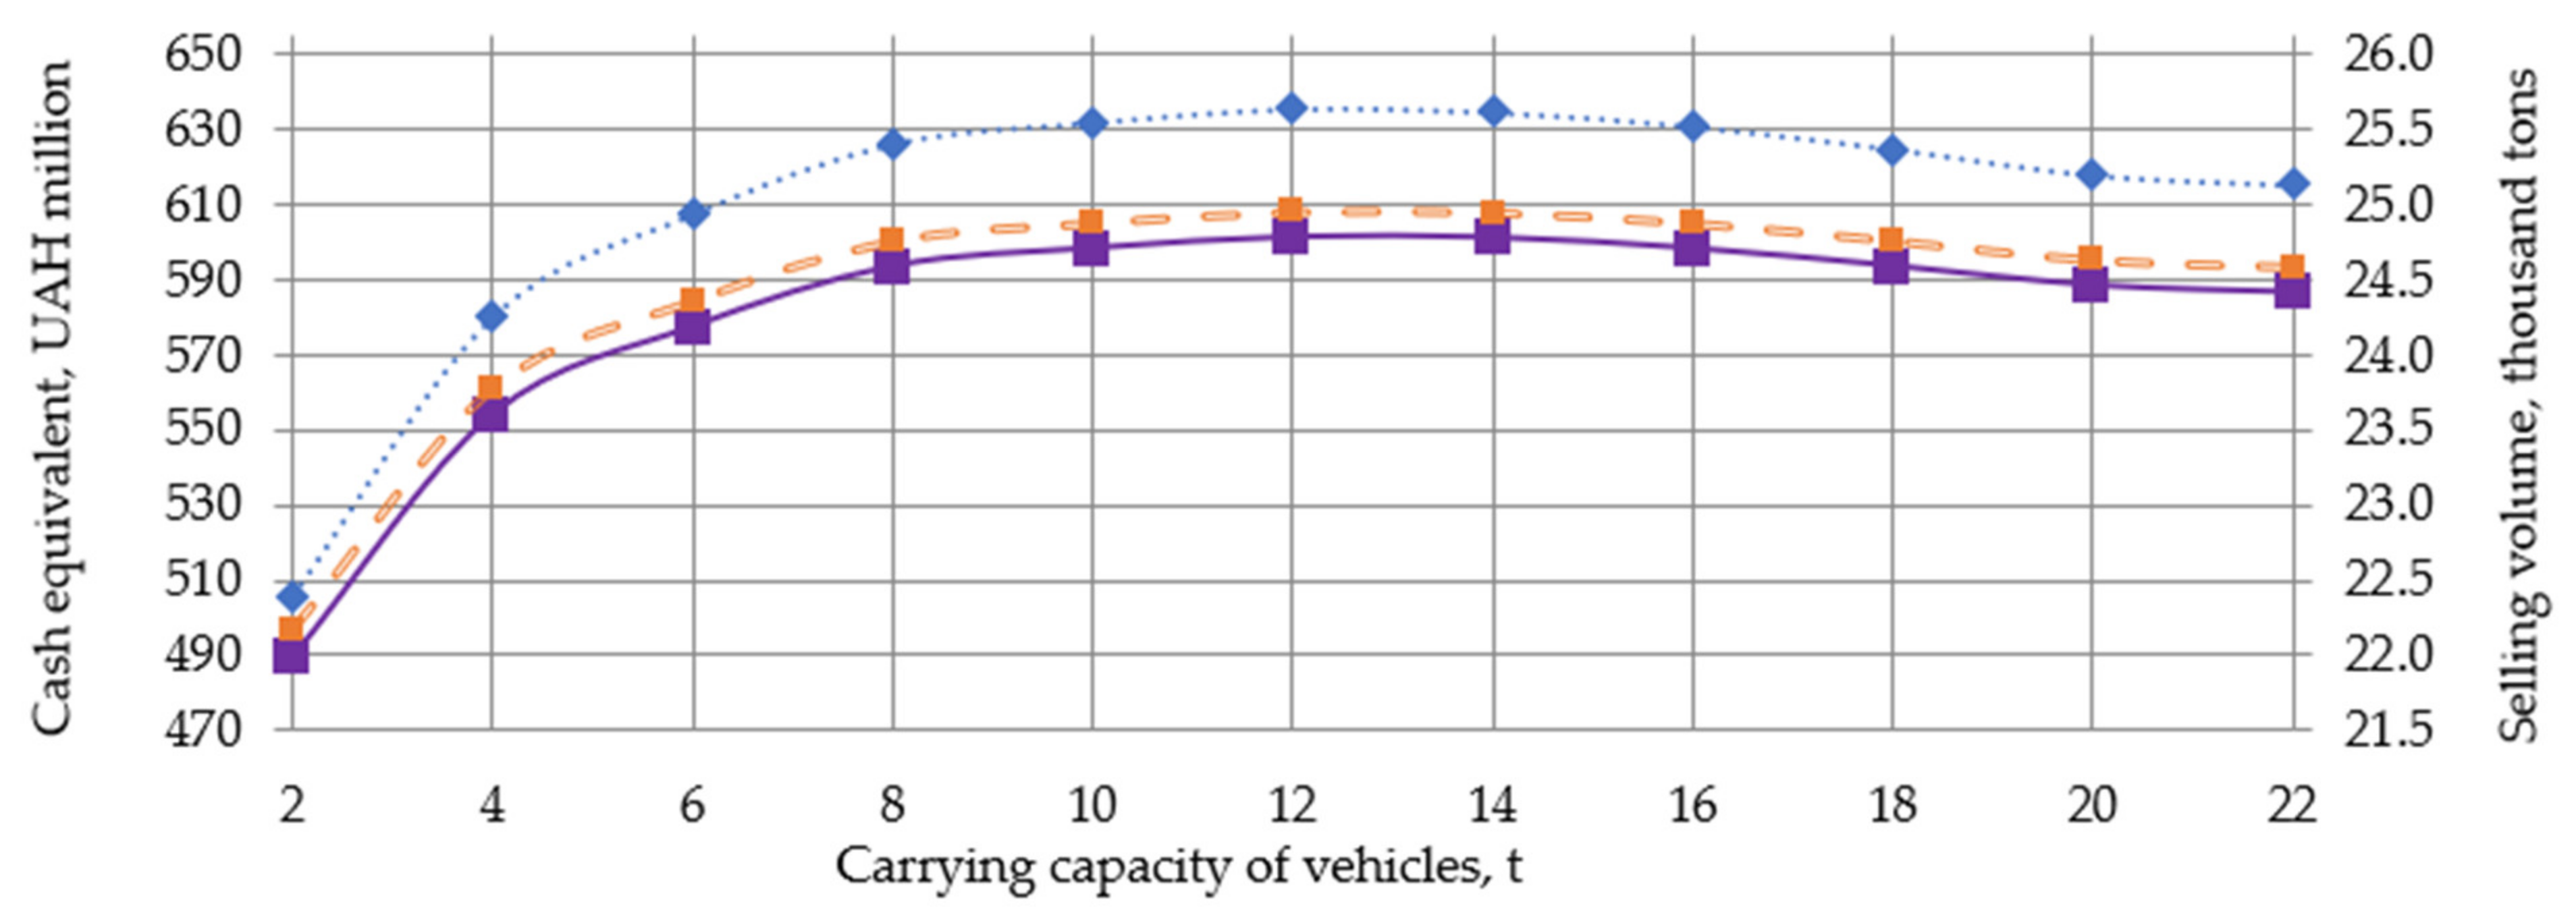
Publisher’s Note: MDPI stays neutral with regard to jurisdictional claims in published maps and institutional affiliations.

