Abstract
Single planar fuel cell elements consisting of metallic interconnectors that are bonded and sealed by a thin glass solder layer form the core of a solid oxide fuel cell. For reliable operation, the bonding layer has to adhere well and must be without voids or foreign material inclusions, which might cause gas leakage, electrical shorts or mechanical weakening and structural failure. Nondestructive testing (NDT) by the high-frequency ultrasound in immersion technique and by air-coupled ultrasound was optimized to find such defects. Another technique was flash light excited thermography for detection of voids. The NDT techniques used are complementary to each other, as they are based on different physical principles. Voids and small steel platelets of different sizes were prepared in the glass solder layer before the high-temperature bonding process and then monitored by the NDT techniques through the interconnector plates. Two selected NDT techniques were then validated in a probability of detection (POD) study. The study resulted in detection limits for the two main types of defects. As a step towards production testing, a demonstrator was built combining testing by air-coupled ultrasound and that by flash thermography. During the testing steps, the cell elements were handled by a collaborative robot.
1. Introduction
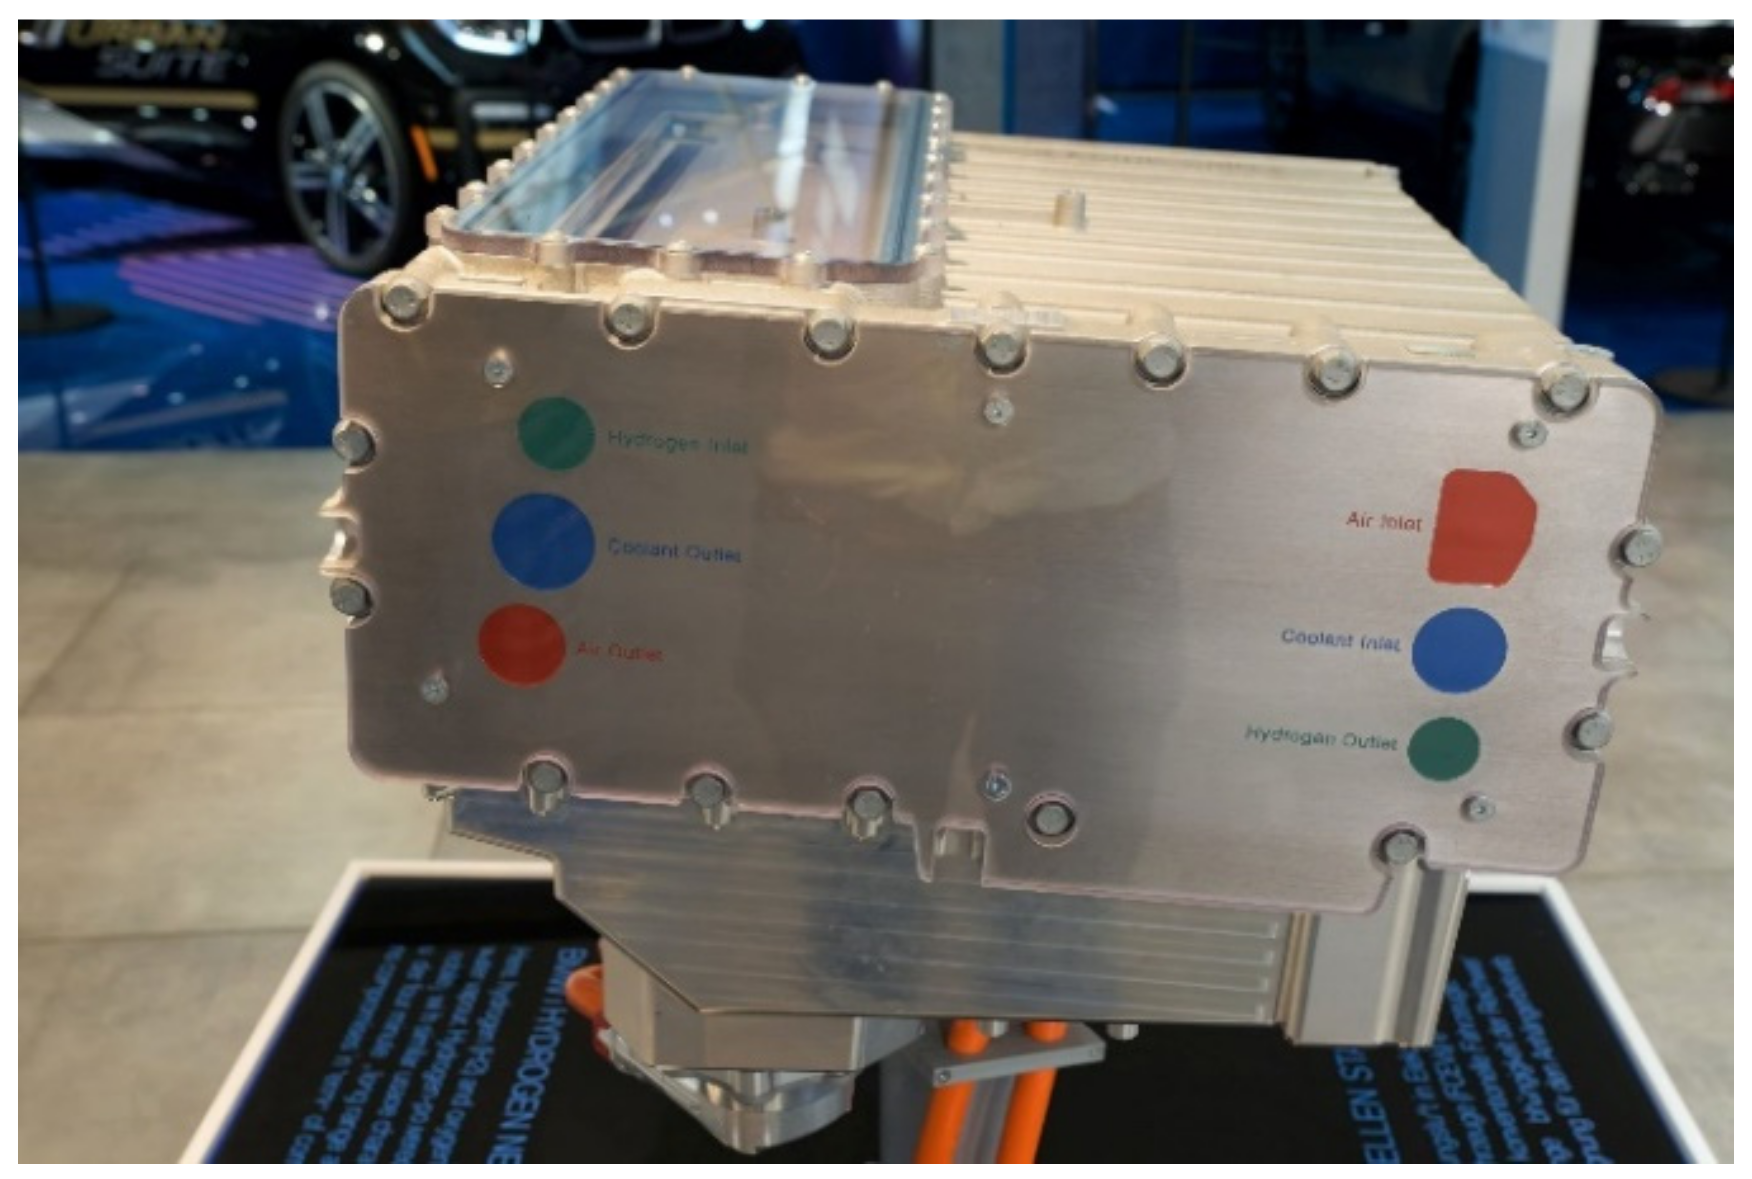
Beside applications in trucks, ships and mobile homes, fuel cells are also in development or already in operation for cars (Figure 1).
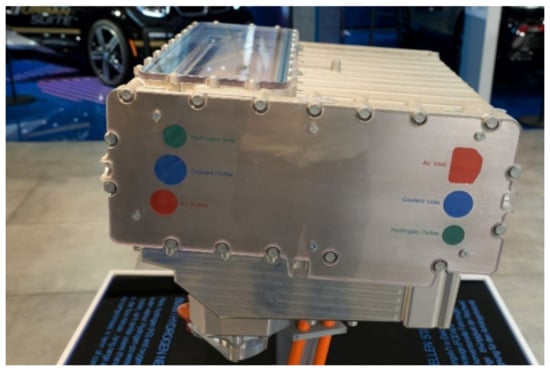
Figure 1.
Prototype of a fuel cell for automotive application.
In this paper, we focus on nondestructive testing (NDT) of solid oxide fuel cells (SOFC). They work at high temperatures of 750 to 1000 °C, which poses significant challenges for materials technology. Within a research consortium consisting of three research institutes and an industrial company, some of the material-related questions, particularly concerning the development of suitable glass solders, were investigated [1]. The task described here was the development and evaluation of nondestructive techniques for 100% testing of the joints between the metal and glass solder. Testing of the many cell elements of an SOFC stack has to be fast and should therefore be automated, if possible—both the testing procedure and the defect recognition. In this study, ultrasound, X-ray and active thermographic techniques were considered.
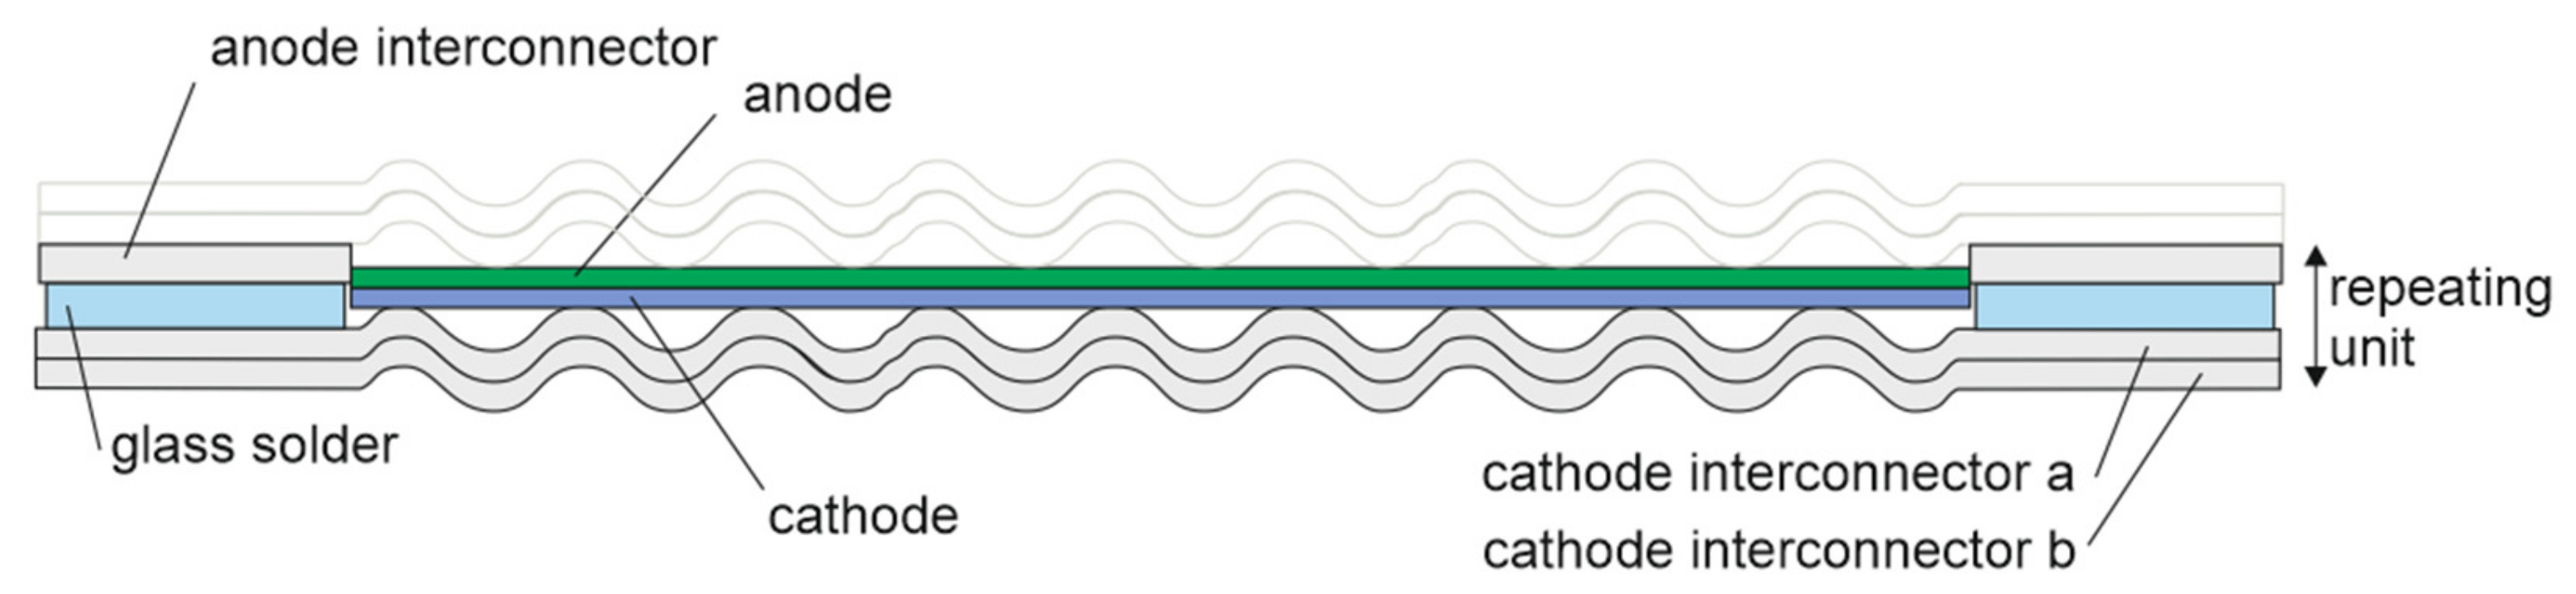
Figure 2 shows a sketch of a cell element as investigated in this study. The sealant between the metallic interconnectors must have good adhesion to the steel. It should be electrically insulating and prevent uncontrolled mixing of the gases involved. Another requirement is stability in the presence of temperature cycles. Single cell elements of this type are later stacked to form the SOFC device.

Figure 2.
Left: Sketch of the structure of a cell element showing the glass solder seals (light blue) between the interconnectors (gray). At the top, the position of the next cell element in the stack is indicated.
2. Test Samples with Different Types of Defects
Figure 3 shows a schematic sketch of the layered structure of a cell element. The lateral size of the cell element is about 13 × 15 cm. The upper metal sheet is the anode interconnector, with a thickness of 0.5 mm. Below this is the glass solder layer. The cathode interconnector is made by two bonded metal sheets. Their total thickness is about 0.6 mm. The reason for the doubled structure is not known to the authors.
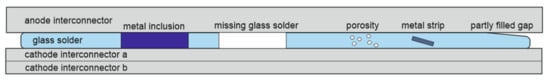
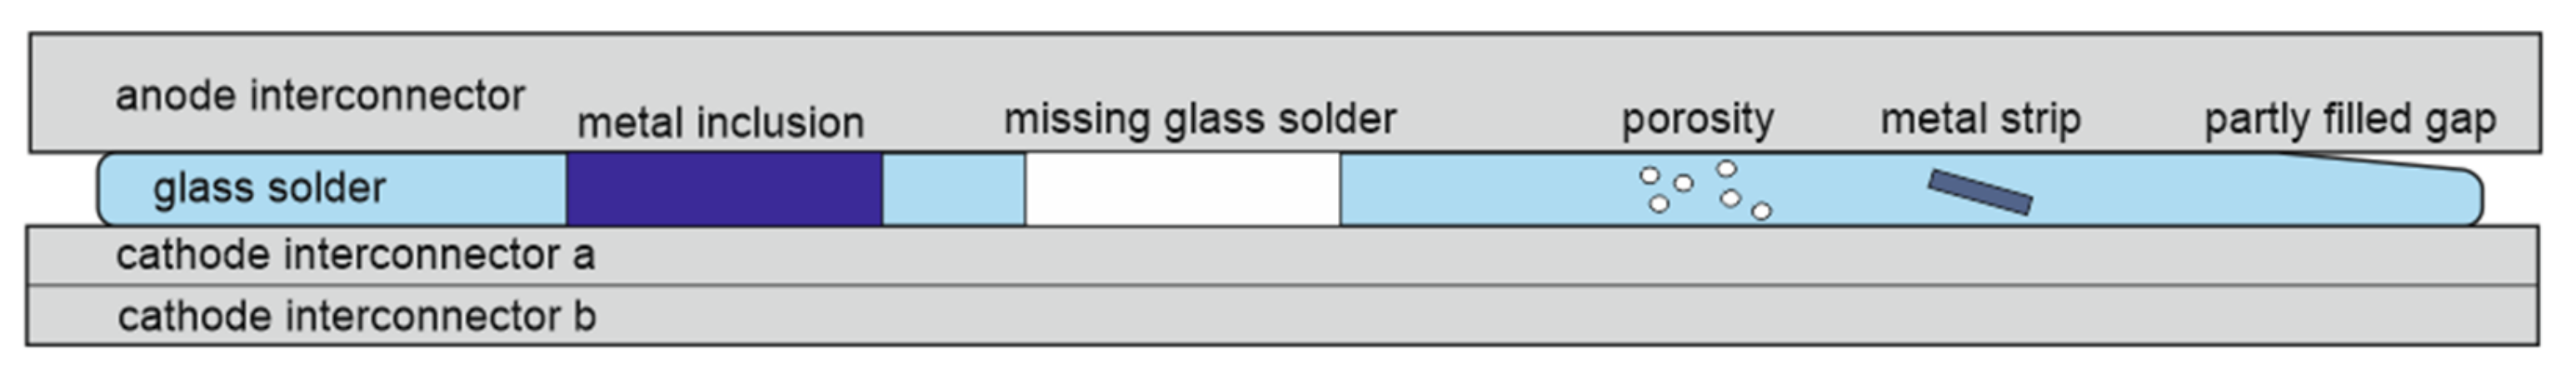
Figure 3.
Cross section of the interconnector–glass solder joining region with some types of defects in the glass solder layer.
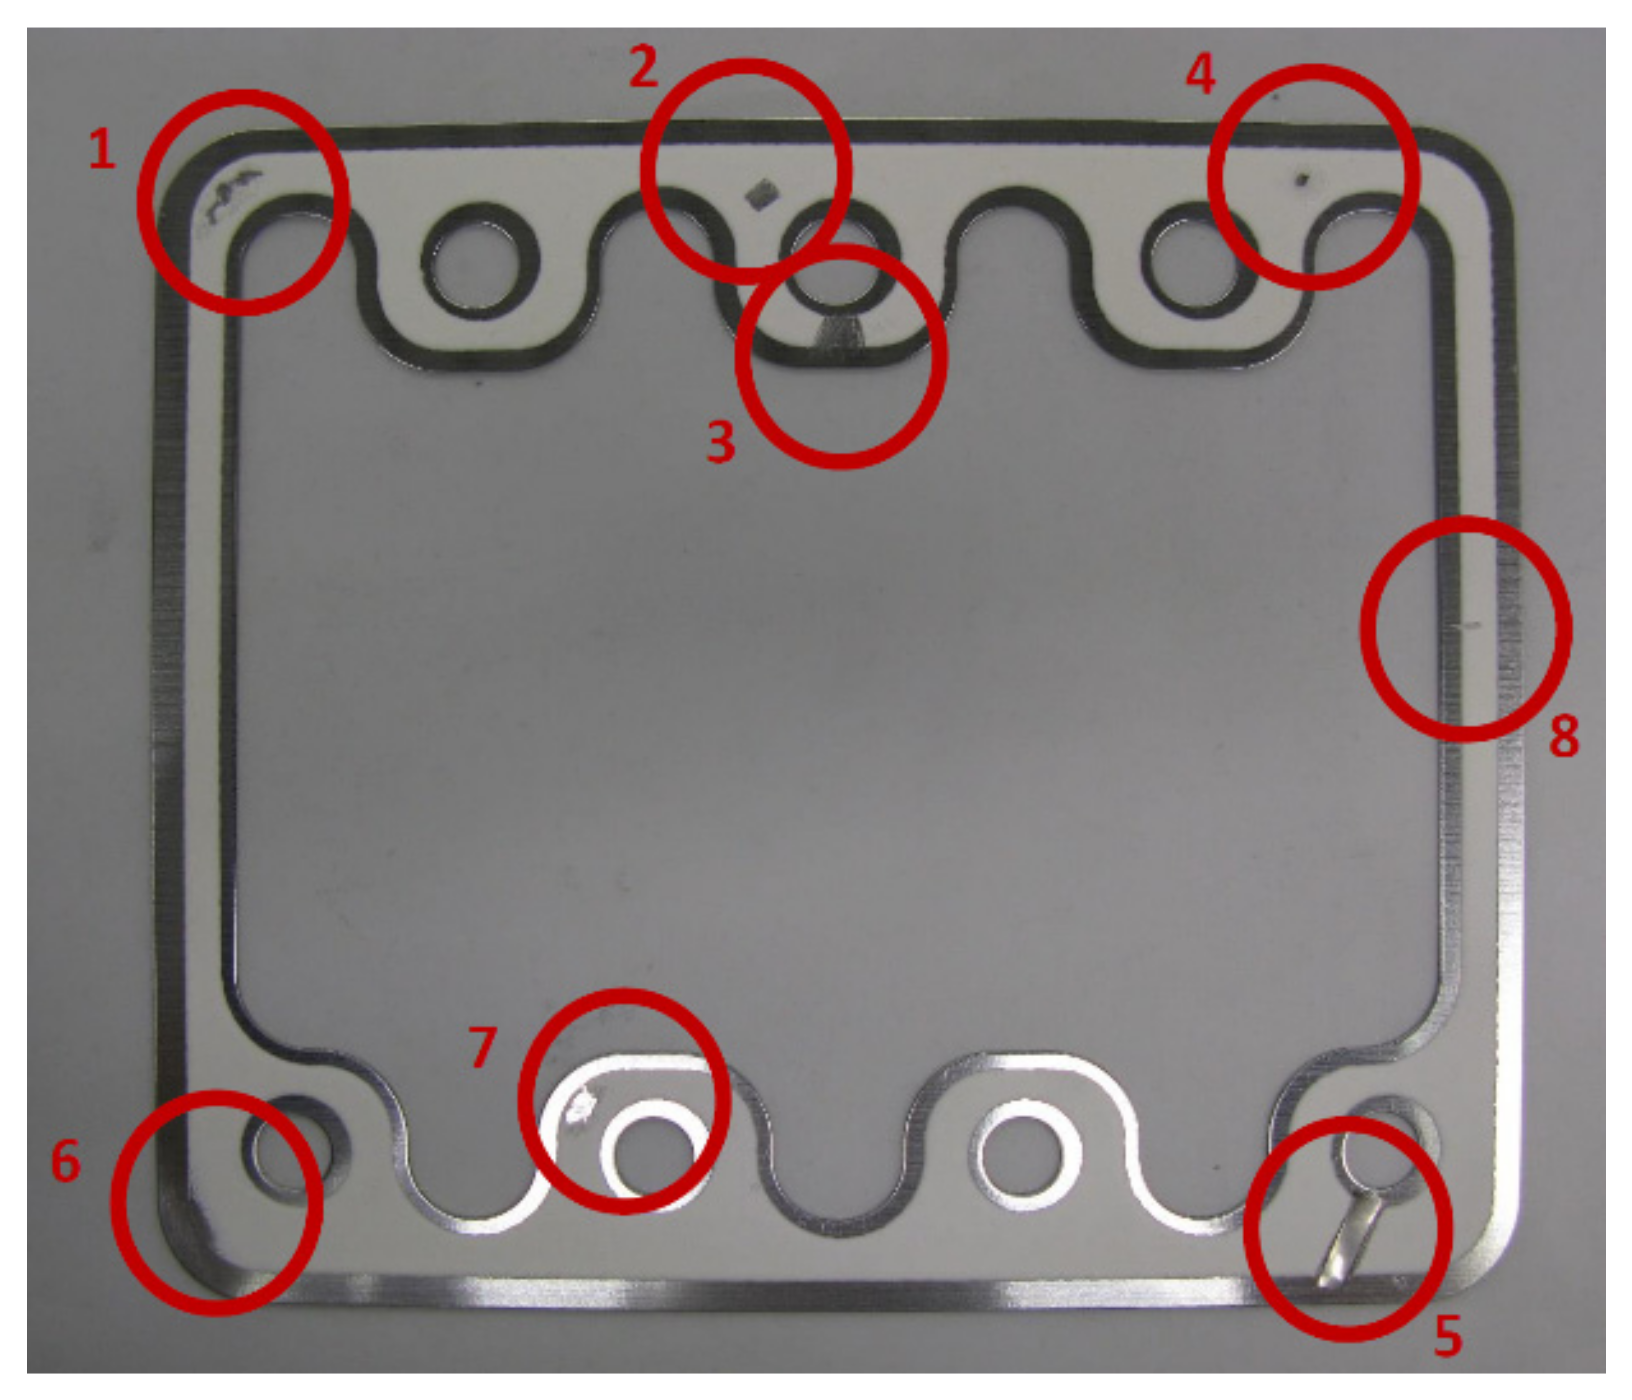
Different types of artificial defects were included in the glass solder layer of the test samples. Metallic inclusions of different sizes were produced by cutting pieces out of a metal sheet or from thin wires. Areas of missing glass solder were generated by scratching out the glass solder locally. Further types of artificial defects were local thinning of the glass solder layer, embedded metal strips and porous glass solder. All these defects were suspected to possibly occur in manufacturing, although in our investigations, nearly no “natural” defects of these types were found. Photos were taken of the interconnector covered with the glass solder before the cell elements were joined at high temperature (Figure 4). Using such samples, the potential of three nondestructive testing techniques was investigated in terms of detectability and their limits.
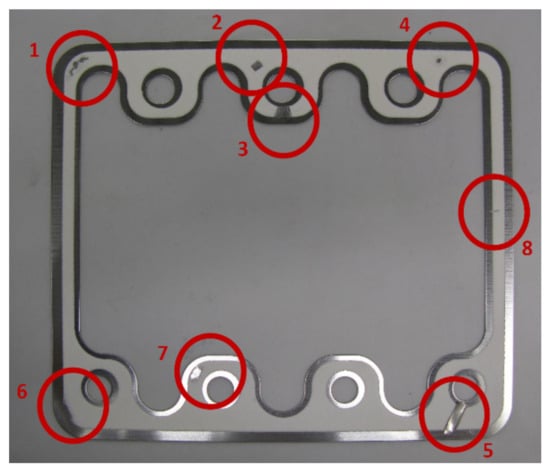
Figure 4.
Photo of the defects prepared in the glass solder layer for evaluation of the NDT techniques before joining the cell element: 1. defective glass solder layer; 2. missing glass solder, about 3 × 3 mm2; 3. missing glass solder, about 6 mm wide; 4. metal flake, about 1 × 1 mm2; 5. strip of metal sheet, 3 mm wide; 6. reduced thickness of glass solder towards the edge; 7. defective glass solder layer; 8. metal flake, about 1 × 3 mm2.
After joining, there is no more visual access to the defects. Figure 5 shows an X-ray microradiography image of the sample from Figure 4 after joining. The X-ray energy was 100 keV, and the measurement time was 180 s. Only metallic inlay nos. 5 and 4 (see Figure 4) are clearly visible. The defects of the missing solder cannot be detected. Therefore, X-ray microradiography is not sensitive enough to detect all relevant defects.
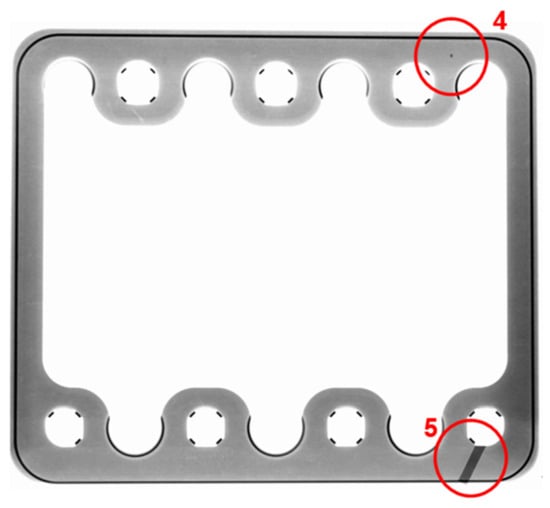
Figure 5.
X-ray microradiography of the cell element. Defects (4) and (5) as defined in Figure 4.
3. Ultrasound Techniques
3.1. Ultrasound in Immersion Technique
This technique has widespread applications in industry and is suitable for automated testing. The sample and ultrasound probe are completely immersed in water, which ensures good acoustic coupling. First, measurements were conducted with the ultrasound transmission technique. However, due to the acoustically loosely coupled double-layer structure of the cathode interconnector, testing in transmission was not possible. Therefore, only pulse-echo measurements from the anode side were performed. The low thickness of the metal and ceramic layers requires high ultrasound frequencies for testing. Ultrasound probes with a 15 to 100 MHz center frequency were employed. A good compromise was found with a broadband probe with a 15 MHz frequency. At these frequencies, well-defined C-scan images of the internal structure can be obtained. However, due to capillary forces, there is water ingress into the gaps between the sheets, which disturbs the measurement. Moreover, additional drying would be required in the process after testing as an additional step. Therefore, the ultrasound in immersion technique was no longer considered.
3.2. Air-Coupled Ultrasound
In contrast to conventional ultrasound testing, air-coupled ultrasound allows contact-free and thereby contamination-free detection of component and joining defects. The transfer and coupling medium for air-coupled ultrasound is air. Testing of the samples was through transmission. The sample was in a space of a few centimeters between a transmitting probe and a receiver probe for ultrasound. The ultrasound signal transmitted through the component was measured. Subsequently, defects on the ultrasound path were revealed (Figure 6).
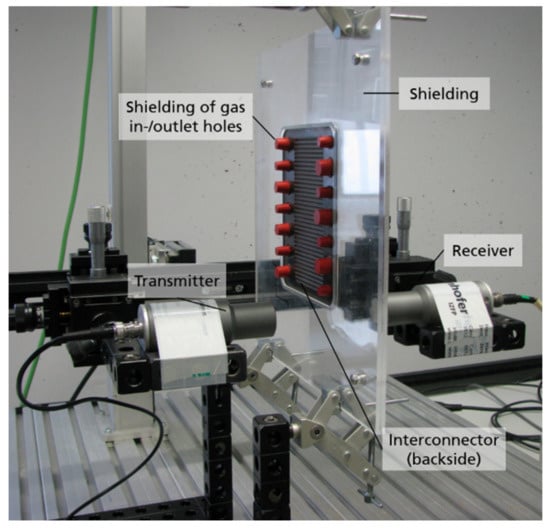
Figure 6.
Setup for air-coupled ultrasound measurements with shielding measures against unwanted sound paths.
This testing technique requires a sophisticated shielding technique in order to avoid sound passing around the sample or through the holes in the cell element. Moreover, optimized transmitter and receiver probes had to be identified. Finally, focal distances of 50 mm and trace offsets of 0.5 mm at a signal gain of 53 dB were used. The gas in-/outlet holes in the cell element were temporarily closed with rubber plugs. The outer rim of the cell element was held tightly by two plates of acrylic glass, which, at the same time, served as a sample holder. The sample was jammed and screwed between the glass plates.
Figure 7 shows a result of the air-coupled ultrasound measurement of one of the numerous test samples with artificial defects.
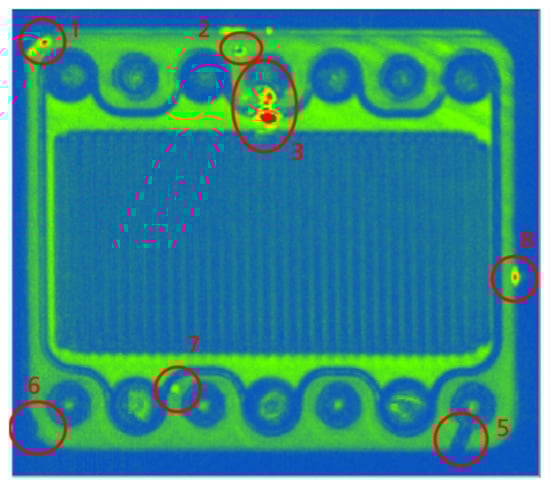
Figure 7.
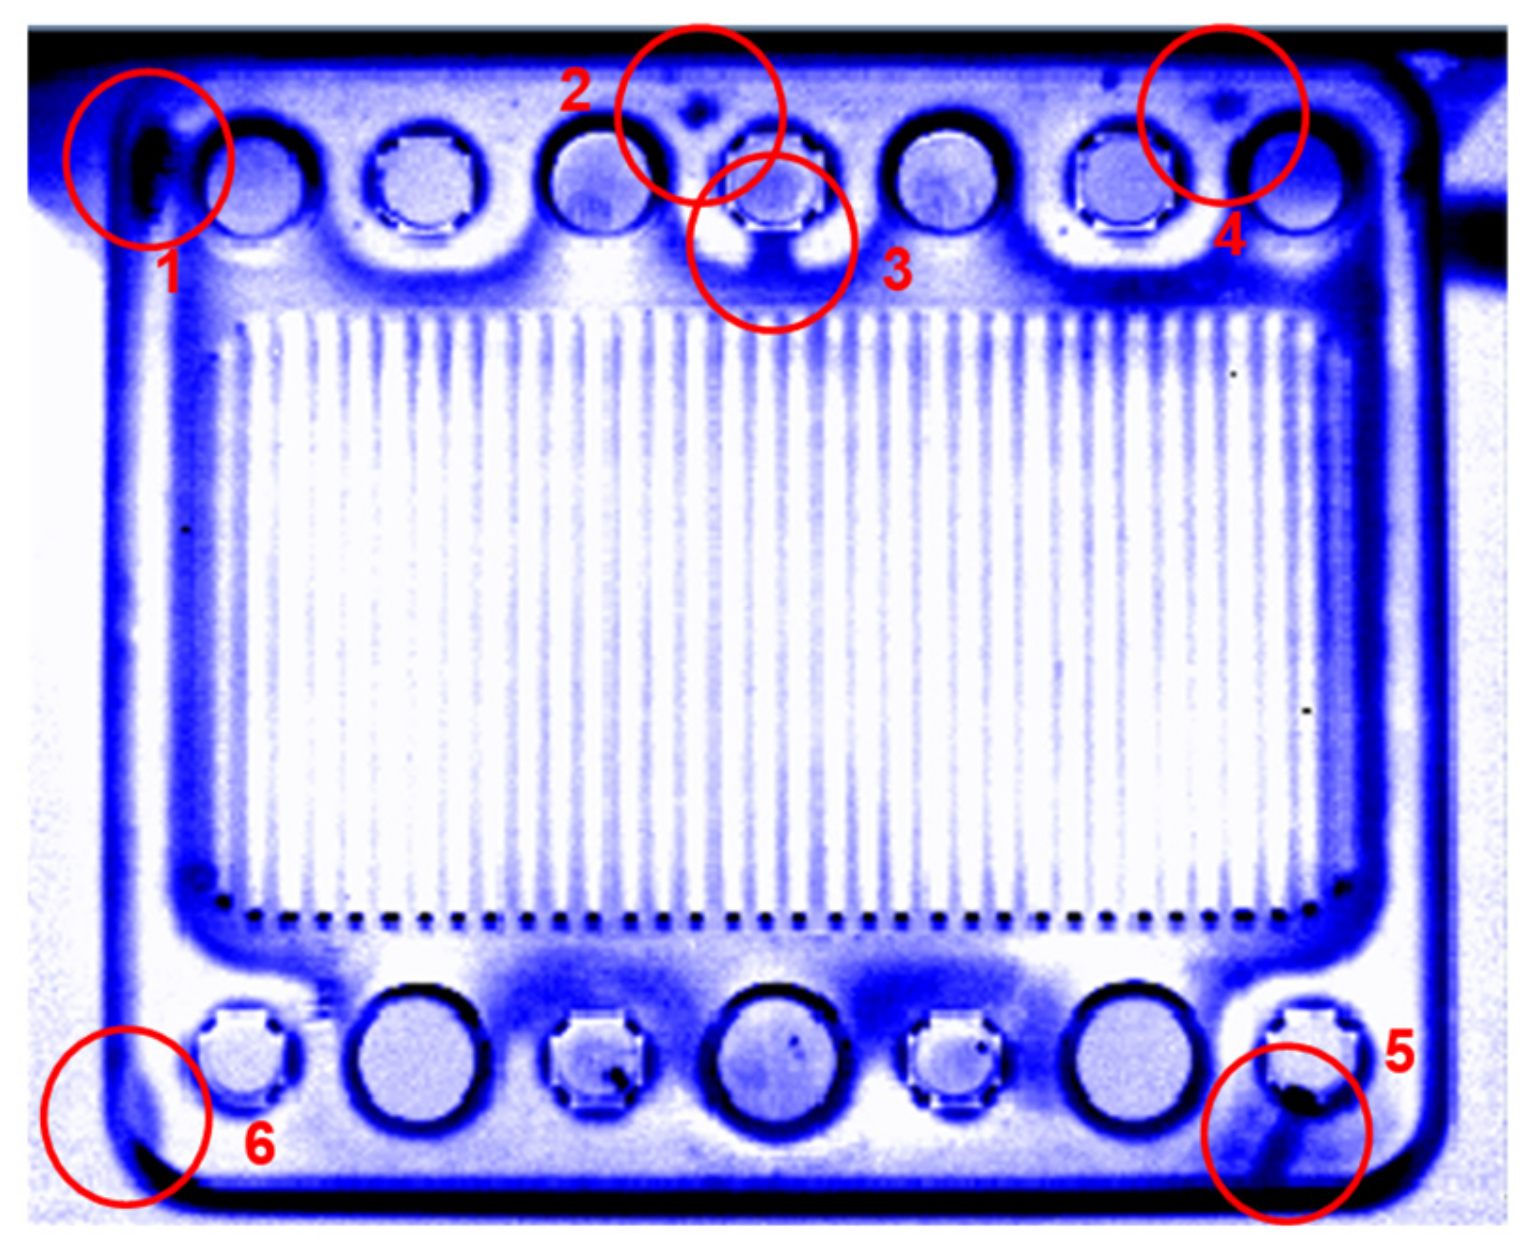
C-scan image of a cell element obtained by air-coupled ultrasound with internal defects as shown in Figure 4.
Compared with the preparation image (Figure 4), the defective glass solder layer (1), areas of missing glass solder (2, 3, 7), one of the metal flakes (5), the area with a decreasing glass solder thickness (6) and the metal flake (8) were clearly detected (note that Figure 4 does not show exactly the same position of defect 8, as not all samples were photographed before joining).
4. Thermographic Techniques
Flash Excited Pulsed Thermography
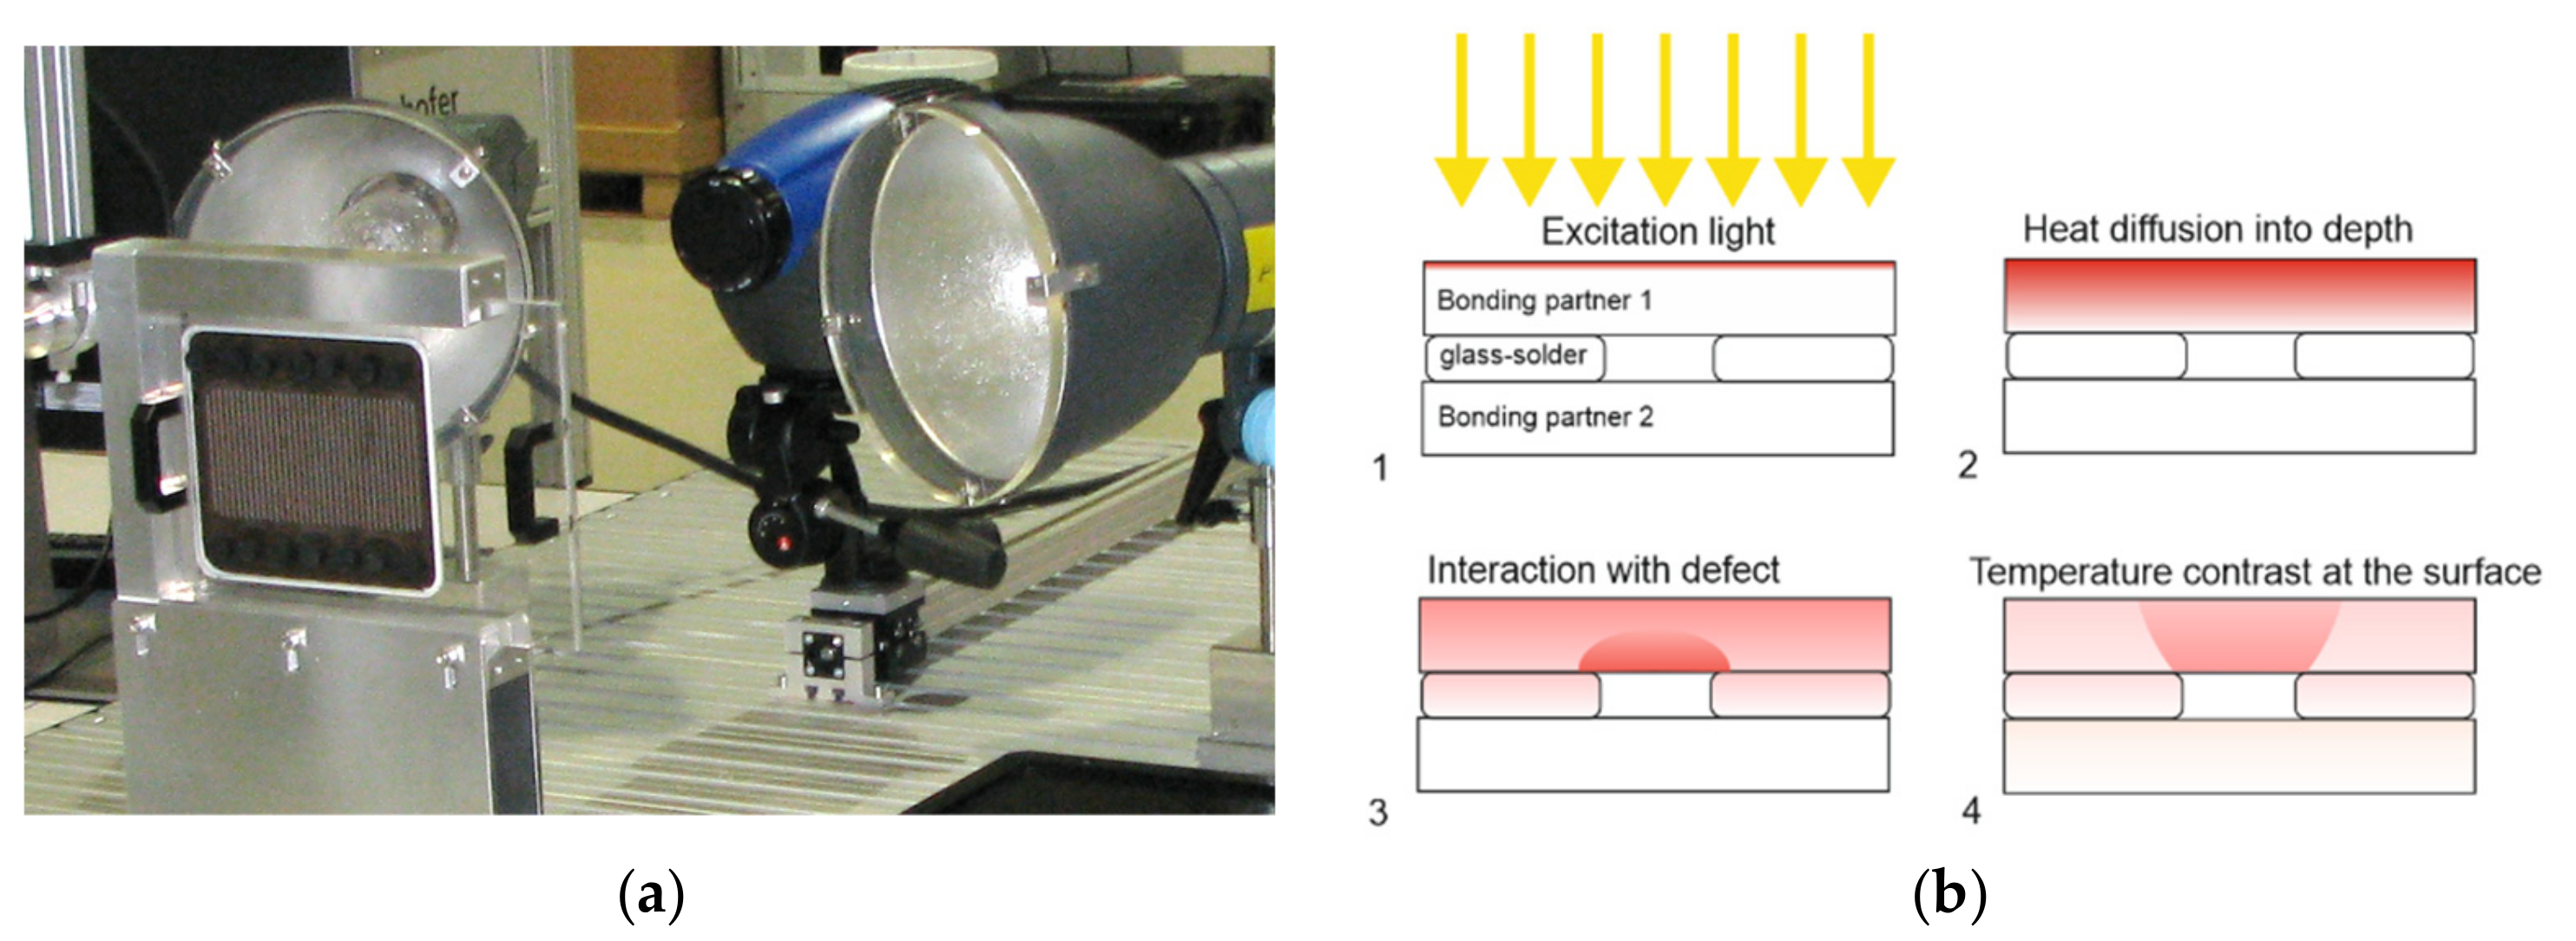
Active thermography relies on thermal excitation of a test sample usually by external heat sources and simultaneous recording of the thermal response over a certain time. A common variant of active thermography is flash excited pulsed thermography [2]. Two strong flash lamps, which each had 6.4 kJ of stored electrical energy, were fired simultaneously and sent a short, intense light pulse to the sample (Figure 8a the sample is visible on the left side of the figure). The measurement was usually performed from one side of the sample in a reflection arrangement. The right part of Figure 8 explains how the light flash is partly absorbed at the outer surface of the sample, which is heated up (1). The heat diffuses into the depth of the sample (2) and interacts with defects (3) such as missing glass solder. After some time, a temperature contrast at the surface reveals the defect for the infrared camera (4).
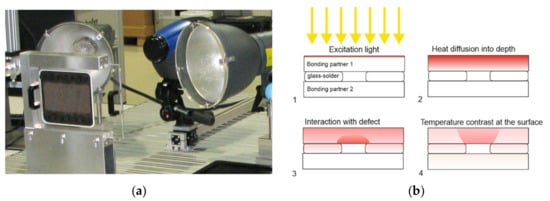
Figure 8.
(a) Photo of the flash thermography setup with a single cell sample; (b) principle of defect detection.
Due to the small thickness of the interconnectors and their comparably high thermal diffusivity, the thermal diffusion times were short. An FLIR SC5200 infrared camera was employed for recording the thermal response over a time of 2 s after the flash at a frame rate of 150 Hz. Measurements were performed both from the anode and the cathode interconnector side of the cell element.
The acquired image frames were then pre-processed by a pulse-phase thermography algorithm, which is a Fourier transformation from the time domain to the frequency domain for each image pixel. The complex-valued frequency domain signal for a selected frequency was then converted into amplitude and phase. A phase image was then built from all phase values. The phase image mainly represents time delays due to thermal diffusion and is insensitive to changes in room temperature, inhomogeneous illumination by the flash lamps and disturbances due to constant radiation from foreign heat sources. Figure 9 shows a thermographic phase image of the same sample that was previously measured by ultrasound, as shown in Figure 7. An analysis frequency of 2 Hz was used. Compared with the preparation image (Figure 4), the defective glass solder layer (1), areas of missing glass solder (2, 3), two of the metal flakes (4, 5) and the area with a decreasing glass solder thickness (6) were clearly detected.
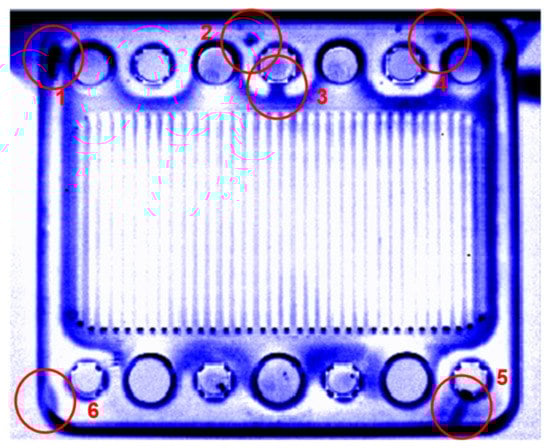
Figure 9.
Thermographic phase image of a cell element obtained by flash excited thermography with internal defects as described in Figure 4.
In Figure 9, the sample was measured from the anode interconnector side. All samples were also measured from the cathode side. It was found that the latter option is less accurate, as the two sheets of the cathode interconnector are not always tightly coupled thermally. Because of this, they often generate artifacts that might be misinterpreted as defects in the glass solder layer.
Another testing task that could be fulfilled by active thermography is the localization of electrical shorts in the cell element. This could be achieved by conduction and induction thermography and has been reported elsewhere [3].
5. Comparison and Discussion
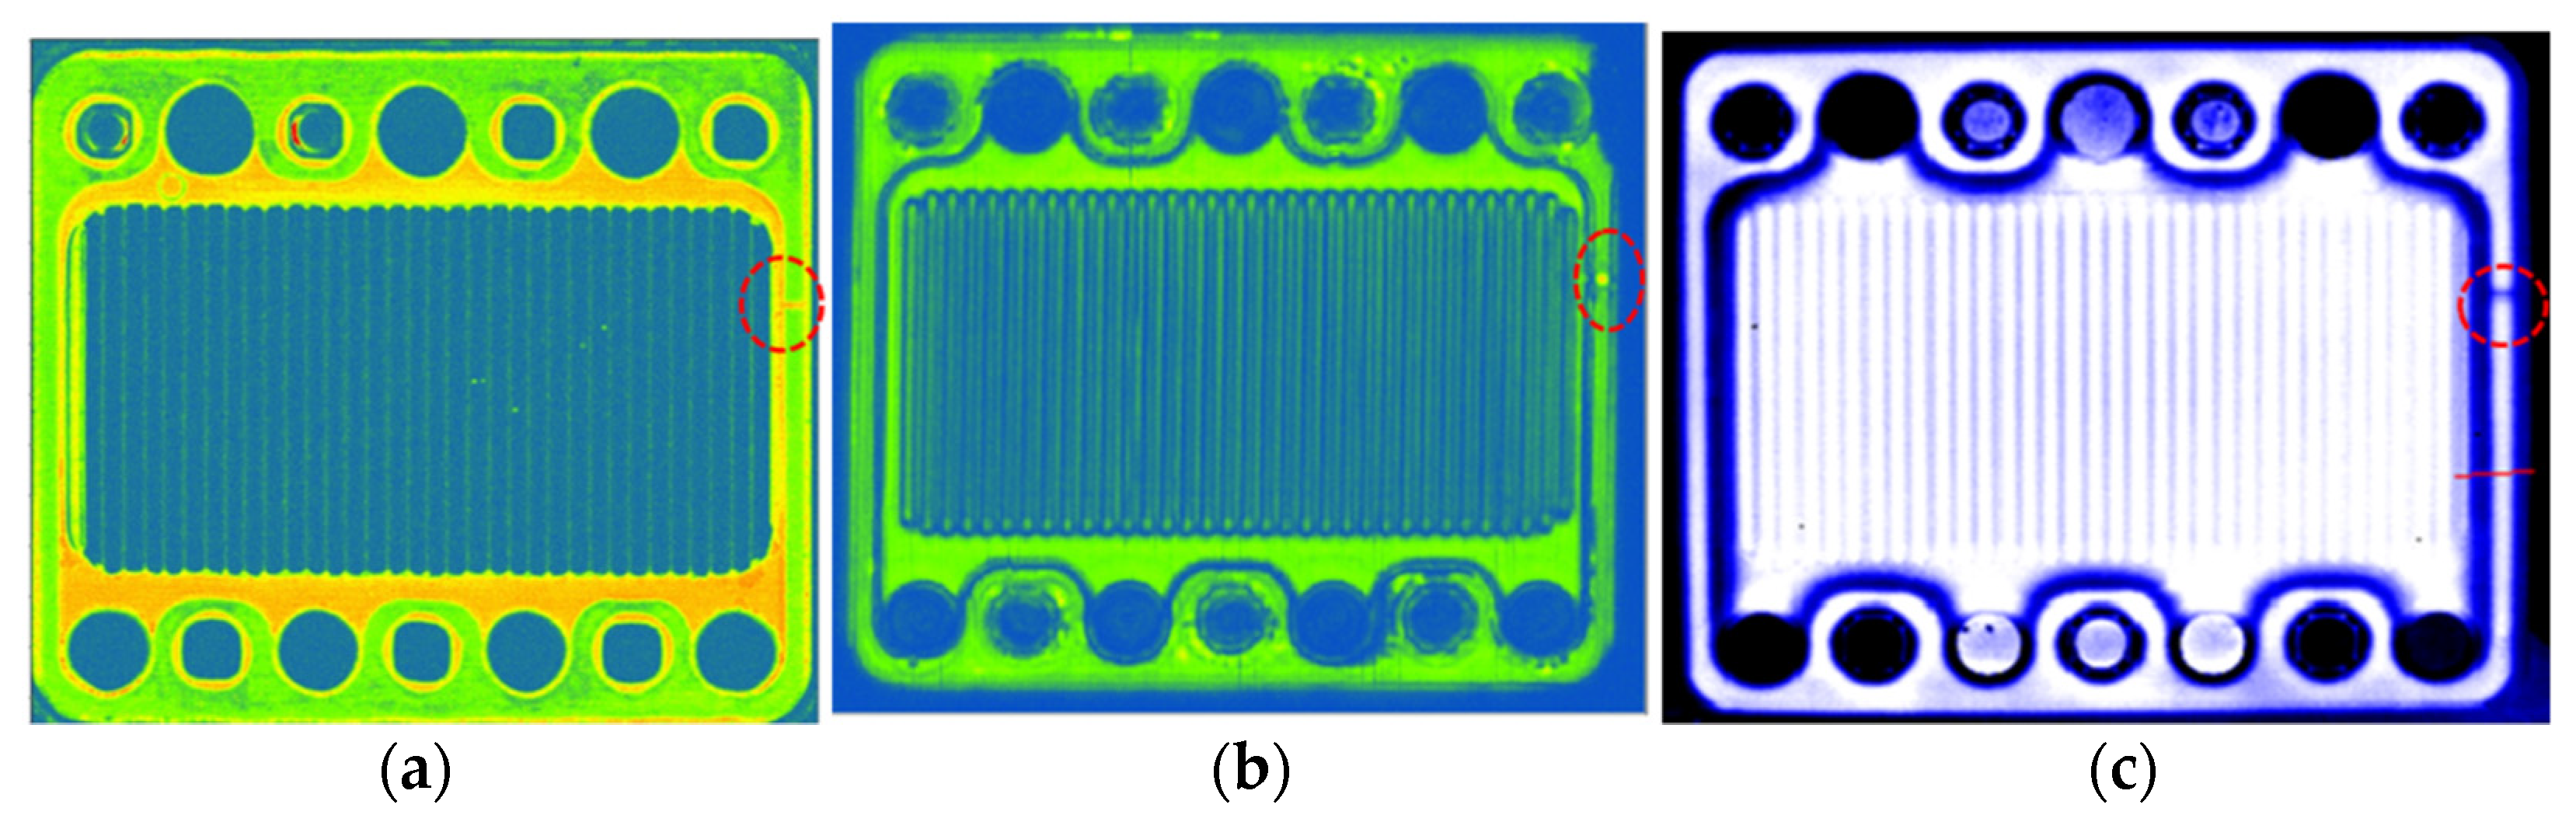
In Figure 10, a comparison of the same sample measured by the ultrasound in immersion technique (Figure 10a), air-coupled ultrasound (Figure 10b) and pulsed flash thermography (Figure 10c) is shown.

Figure 10.
Comparison of the images of the same cell element with a defect of missing glass solder: (a) obtained by the ultrasound in immersion technique; (b) obtained by air-coupled ultrasound; (c) obtained by flash excited thermography.
The defects of the “missing glass solder” type were detected by all techniques. The lateral resolution was highest for the ultrasound measurement in immersion, somewhat lower for air-coupled ultrasound and even lower for thermography. The defect contrast, however, is equally important and was sufficient in all three methodologies.
Table 1 summarizes the results of investigations on some tens of samples with artificial defects, as described in the previous sections.

Table 1.
Detection of artificial defects in cell elements.
Due to the results on the test samples with various artificial defects, and due to application-relevant aspects, air-coupled ultrasound and flash thermography were ultimately selected for further investigations.
6. Validation of the Measurement Techniques
The nondestructive testing techniques air-coupled ultrasound and active thermography were validated in a probability of detection (POD) study. The aim was to determine detectable defect sizes. A number of samples with artificial defects were prepared with metallic inserts and artificial voids. The defects were 0.5 × 0.5 mm2, 1 × 1 mm2, 2 × 2 mm2 and 4 × 4 mm2 in size (Figure 11). Each sample contained three defects with the same size. As 14 samples with metallic inserts and 10 samples with air voids were prepared in this way, the total number of defects with steel inserts of one size was 42, and the total number of defects with air voids was 30. The samples were finally joined in the high-temperature process.
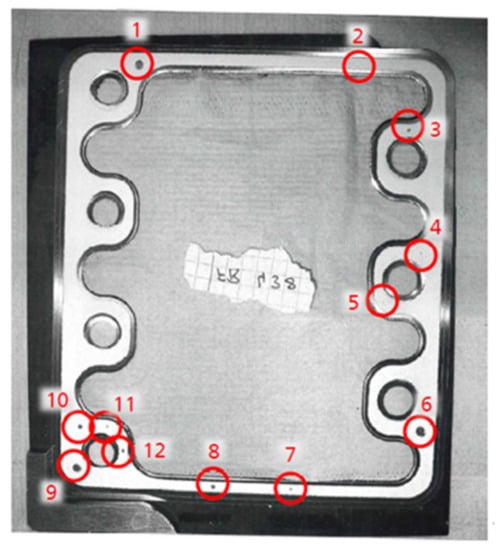
Figure 11.
The sample preparation with artificial defects (voids) in the glass solder before joining. From [3], with permission.
After being joined, the samples were measured by air-coupled ultrasound and thermography using the previously optimized measurement parameters. A software tool allowed the determination of the size of the defect indications in the measured ultrasound images. In the case of thermography, the contrasts in the images are significantly broadened by lateral thermal diffusion. Therefore, an apparent defect size was calculated from the images.
POD analysis based on the â vs. a approach was performed. The details of the analysis are explained in detail in [4]. (The reference is a link to Charles Annis’ homepage containing a link to his mh1823 POD software suite and its documentation.) Usually, the â vs. a part refers to the measured signal amplitudes vs. the “true” signal amplitudes. In our case—as pure signal amplitudes do not necessarily correlate directly with the defect sizes in question—we adapted the method mutatis mutandis to more problem-adequate defect characteristics derived from our image post-processing algorithm.
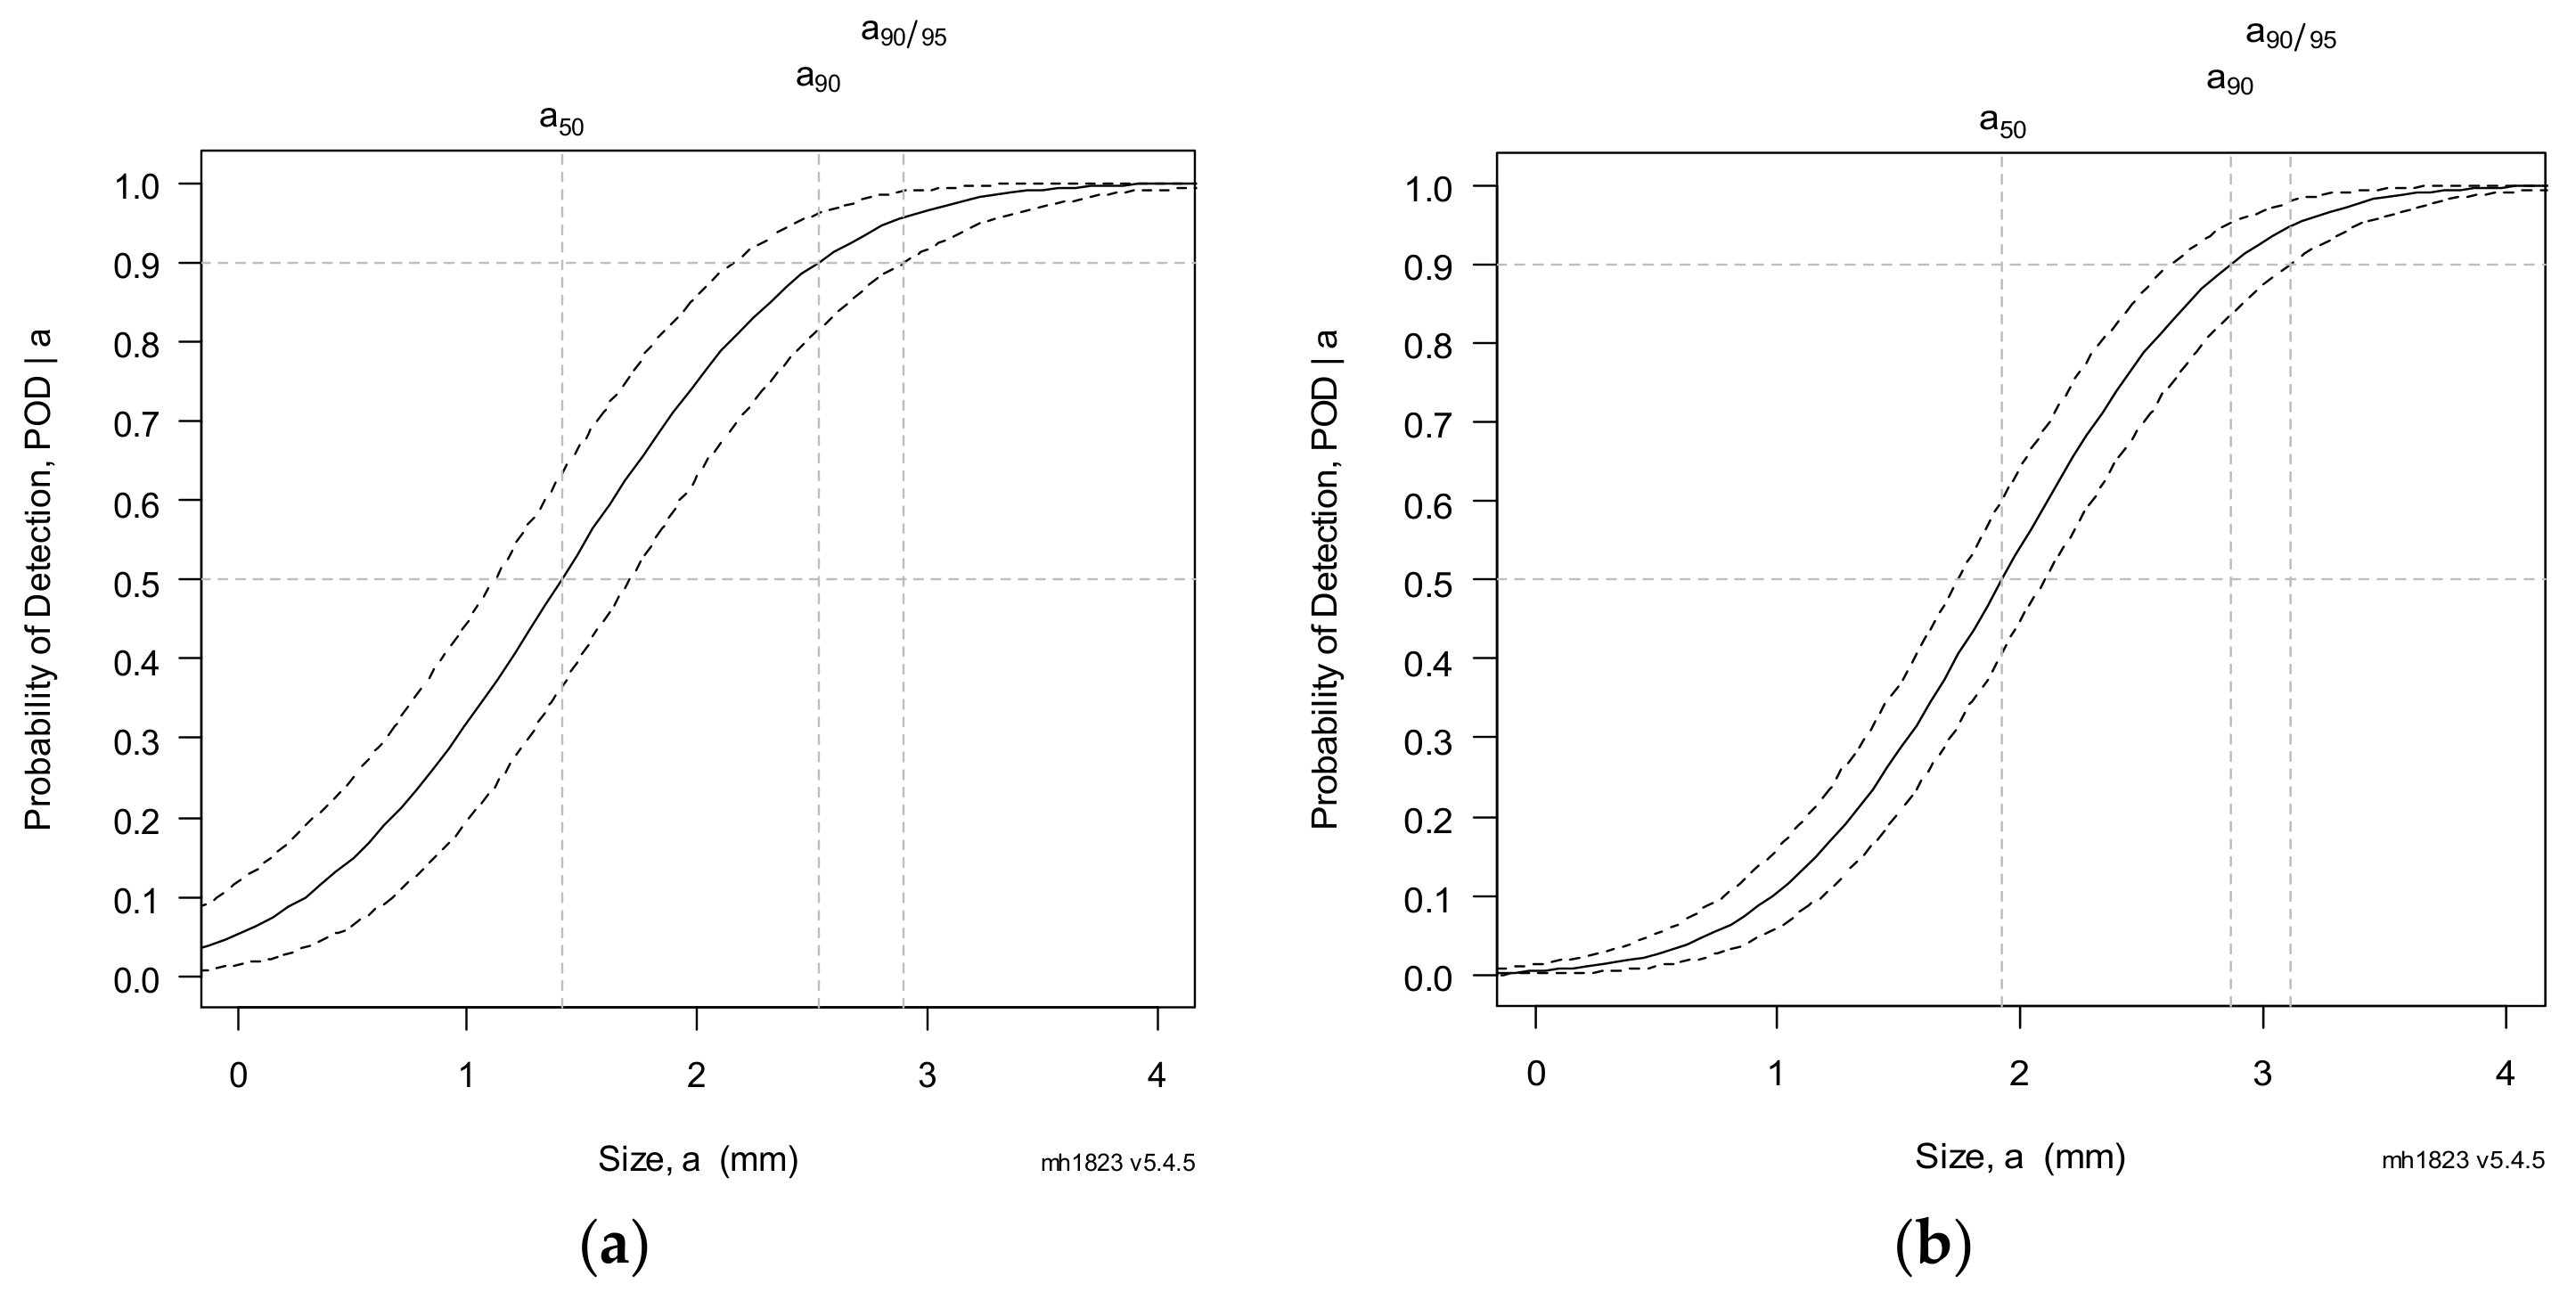
The resulting POD curves for the two NDT techniques are shown in Figure 12 and Figure 13. The thick lines represent the POD curve, and the dotted lines represent its 95% confidence bounds. Two restrictions for application of the software had to be considered. First, the threshold for defect sizes had to be estimated, although it is a critical parameter to obtain the curves. The reason was that a sensible noise analysis was not available from the NDT data. Second, as the specimen had inherent deficiencies, many defect size measurements had to be excluded from the statistical analysis.
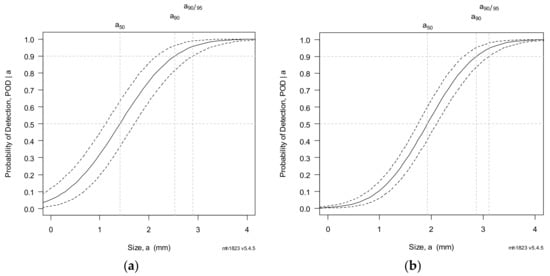
Figure 12.
POD curves for detection of steel inserts (a) and air voids (b) by air-coupled ultrasound.
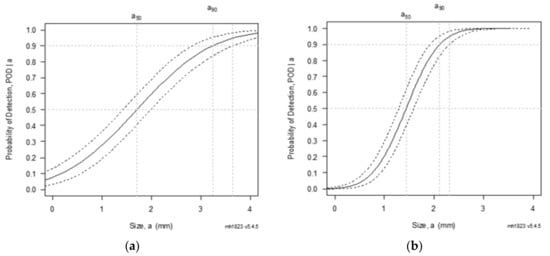
Figure 13.
POD curves for detection of steel inserts (a) and air voids (b) by pulsed thermography. From [3], with permission.
In Table 2, characteristic parameters obtained from the POD curves are compared. The parameter a50 is the size of a defect that is detected with a probability of 50%. Parameter a90/95 is the defect size detected with a probability of 90% within the 95% confidence bounds.
Table 2.
Parameters obtained from the POD curves for air-coupled ultrasound and thermography.
In total, the detection limits for air-coupled ultrasound are generally comparable to those of pulsed thermography. Defects such as porosity in the glass solder were not detectable by thermography, but they were detected by ultrasound. Inserted wire pieces were detected by thermography, but hardly at all by ultrasound. The conclusion is that a combination of both techniques is the optimum.
7. Automated Testing Station
In order to realize the combination of ultrasound and thermography as a multimode NDT technique, a testing station with partly automated data acquisition and subsequent automated defect recognition was created (Figure 14). For this testing demonstrator, a collaborative two-arm robot, “YuMi” from ABB, was employed. The air-coupled ultrasound measurement requires acoustic shielding of the sample edge area and the holes for the gas transfer. Three workstations had to be designed and built. The robot takes a cell element from the transfer station ((1) in Figure 14a) and puts it into the two parts of the sample holder ((2) and (3)). The holder is then moved to the measurement position. After testing using flash thermography (4), the measurement using air-coupled ultrasound (5) is performed. The acoustic probes are mounted on the two-axis scanner and are moved over the sample along a raster path. The measurement results are then transferred to a PC and control unit for further processing and evaluation.
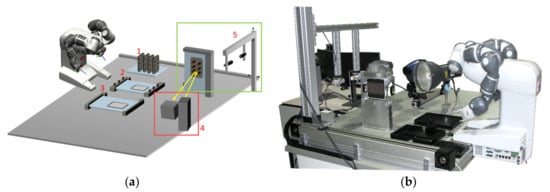
Figure 14.
Testing station setup. (a) Schematic with the ultrasound part marked by a green box and the thermographic part marked by a red box: 1. transfer station; 2. and 3. the parts of the sample holder; 4. thermography set-up; 5. air-coupled ultrasound scanner; (b) photo of the laboratory demonstrator.
Methods for automated data evaluation and data fusion are integrated in the measurement software. Ultrasound and thermography data are read and pre-processed directly after their generation. The results of automated defect detection using neural networks have been presented in [5].
8. Conclusions
The experimental results show that most of the relevant defects in the glass solder bond layer of single cell elements of a solid oxide fuel cell could be detected by air-coupled ultrasound and by pulsed thermography with flash excitation. Both techniques work contact free. Probability of detection analysis showed that the techniques were able to detect voids of down to 2 to 3 mm in size safely. A laboratory demonstrator was successfully built for testing cell elements with a hybrid NDT approach. The NDT techniques described can, in principle, also be used for other types of fuel cells. Aspects such as the material thickness and geometry as well as acoustic and thermal properties will have to be considered in every case.
Author Contributions
Conceptualization, H.N. and T.W.; methodology, A.M., T.W., E.T. and U.N.; validation, D.W.; writing—original draft preparation, U.N.; writing—review and editing, all authors; project administration, H.N.; funding acquisition, H.N. All authors have read and agreed to the published version of the manuscript.
Funding
Financial support was received from the Federal Ministry for Economic Affairs and Energy of Germany (BMWI No. 03ET6112B).
Institutional Review Board Statement
Not applicable.
Informed Consent Statement
Not applicable.
Data Availability Statement
Data can be obtained from the authors on request.
Acknowledgments
We would like to thank our colleagues from Fraunhofer ISC, KIT IAM-KWT and ElringKlinger AG for the collaboration.
Conflicts of Interest
The authors declare no conflict of interest.
References
- Hauber, S.; Dittrich, S.; Walter, T.M.; Durschang, B.; Schell, K.G.; Bucharsky, E.C.; Reitz, E.; Sextl, G.; Hoffmann, M.J. Bilayered Glass-Ceramics as Sealants for SOFCs. J. Mater. Sci. Eng. A 2019, 9, 43–55. [Google Scholar]
- Balageas, D.; Krapez, J.C.; Cielo, P. Pulsed photothermal modeling of layered materials. J. Appl. Phys. 1986, 59, 348. [Google Scholar] [CrossRef]
- Netzelmann, U.; Walte, H.; Weber, D.; Neurohr, H. Fast detection of defects in glass-soldered fuel cell assemblies by active infrared thermography. In Proceedings of the SPIE 11409, Thermosense: Thermal Infrared Applications XLII, Online, 27 April–8 May 2020; SPIE: Bellingham, WA, USA, 2020; p. 114090B. [Google Scholar]
- Annis, C. Statistical Engineering. Available online: https://statistical-engineering.com/ (accessed on 16 December 2021).
- Wei, Z.; Osman, A.; Gross, D.; Netzelmann, U. Artificial Intelligence for Defect Detection in Infrared Images of Solid Oxide Fuel Cells. Infrared Phys. Technol. 2021, 119, 103815. [Google Scholar] [CrossRef]


Publisher’s Note: MDPI stays neutral with regard to jurisdictional claims in published maps and institutional affiliations. |
© 2022 by the authors. Licensee MDPI, Basel, Switzerland. This article is an open access article distributed under the terms and conditions of the Creative Commons Attribution (CC BY) license (https://creativecommons.org/licenses/by/4.0/).