Review

Smart Distribution Network Situation Awareness for High-Quality Operation and Maintenance: A Brief Review

1
School of Electrical and Information Engineering, Tianjin University, Tianjin 300072, China
2
Concordia Institute for Information Systems Engineering, Concordia University, Montreal, QC H3G 1M8, Canada
3
College of Energy and Electrical Engineering, Hohai University, Nanjing 210098, China
*
Author to whom correspondence should be addressed.
Energies 2022, 15(3), 828; https://doi.org/10.3390/en15030828
Submission received: 30 December 2021 / Revised: 16 January 2022 / Accepted: 20 January 2022 / Published: 24 January 2022
(This article belongs to the Special Issue Situation Awareness for Smart Distribution Systems)

Abstract

:
In order to meet the requirements of high-tech enterprises for high power quality, high-quality operation and maintenance (O&M) in smart distribution networks (SDN) is becoming increasingly important. As a significant element in enhancing the high-quality O&M of SDN, situation awareness (SA) began to excite the significant interest of scholars and managers, especially after the integration of intermittent renewable energy into SDN. Specific to high-quality O&M, the paper decomposes SA into three stages: detection, comprehension, and projection. In this paper, the state-of-the-art knowledge of SND SA is discussed, a review of critical technologies is presented, and a five-layer visualization framework of the SDN SA is constructed. SA detection aims to improve the SDN observability, SA comprehension is associated with the SDN operating status, and SA projection pertains to the analysis of the future SDN situation. The paper can provide researchers and utility engineers with insights into the technical achievements, barriers, and future research directions of SDN SA.

1. Introduction

1.1. Motivation

Due to the rapid development of emerging information and communication technologies (ICT) and advanced metering infrastructure (AMI), distribution networks are in an evolvement from passive to active distribution networks (ADN), also called smart distribution networks (SDN) [1]. In addition, with the rapidly increasing penetration of distributed generations (DGs) inspired by the smart grid (SG) concept [2], the SDN integrates multiple renewable energy sources (RES) and focuses on reliable operation [3]. To achieve the environmental objective for gas emission reduction and accommodate the high penetration of DGs, supervisory control and data acquisition (SCADA) systems are employed to monitor the SDN, and distribution management systems (DMS) and energy management systems (EMS) act as decision-support information systems for the coordination of remote SDN equipment. Additionally, the widespread application of devices such as distribution transformer terminal unit (TTU), feeder terminal unit (FTU), remote terminal unit (RTU), and distribution automation terminal (DTU) contributes to the maturity of SDN [4,5].
Operation and maintenance (O&M) cost is an economic factor that the SDN management must consider. Mansor et al. [6] presented operational planning of SDN based on utility planning concepts, considering the cost minimization of O&M, switching, losses, and reliability. Based on the volatilities of wind speed and demand load, ref. [7] presented advanced real-time dispatching strategies to minimize long-run expected cost instead of immediate myopic cost. In addition, the quality of O&M technology directly affects the operating status of SDN. To prevent persistent faults in distribution transformers (DTs), Al Mhdawi et al. [8] proposed a remote condition internet of things (IoT) monitoring and fault prediction system using customized software-defined networking technology. In [9], a multi-status simulation based on event-driven for the SDN O&M was investigated, which can simulate the specific events in the SDN with different time constants within the same simulation framework. To improve the reliability of SDN O&M, Kiaei et al. [10] proposed a hybrid fault location for SDN using available multi-source data, which can precisely calculate the fault location in distribution networks with many sub-laterals. The O&M level of multi-terminal SDN directly connected to each user determines the power quality of end-users. Among multiple O&M technologies, situation awareness (SA) emerges and is gradually integrated into the SDN. Facing a high proportion of RES, adequate monitoring, analysis, and prediction of the SDN operating status are urgent. Therefore, comprehensive SA, which contains detection, comprehension, and projection, becomes a significant guarantee for the optimal operation of SDN [11]. Due to the strong adaptability, SA can dynamically evolve with the future SDN technology development to provide higher quality O&M of SDN.
The concept of SA means to percept elements in the environment within a volume of time and space, comprehend their meaning, and project their future status [12]. In general, the process of SA can be divided into three stages: situation detection, situation comprehension, and situation projection [13]. To visualize the concept of SA, SA can be analogous to human psychology. In psychology, the sensory, perception, and behavioral habits can be expressed as follows:
  • The sensation is the brain’s reflection of various attributes in objective things that directly act on the human sensory organs [14]. Human cognition of objective things starts with sensation. It is the initial detection of complex things and the basis of complex cognitive activities such as perception and behavior. That is similar to the concept of situation detection.
  • Based on sensory information, perception processes multiple sensory information in a specific way, interprets the sensory information on individual experience, and taps the deep meaning of sensory information. That is similar to the concept of situation comprehension.
  • Based on sensory and perception, behavior refers to human activities after receiving internal and external stimuli. The theory of planned behavior [15] can explain human decision-making behaviors from the perspective of perceptual information processing and predict the future behavioral tendency based on the expectation value theory [16]. That is similar to the concept of situation projection.
Therefore, the human collects multiple sensory information and relies on perception to process the sensory information. The following behaviors can be explained and predicted by the theory of planned behavior [17]. The human situation refers to the comprehensive integration of mental activity, physiological state, and environmental information. Similarly, the basic principle of the SA corresponds to the above psychological terms, which represents detecting, comprehending, and projecting various elements with specific spatial–temporal properties [18]. In general, three SA stages can be defined as follows:
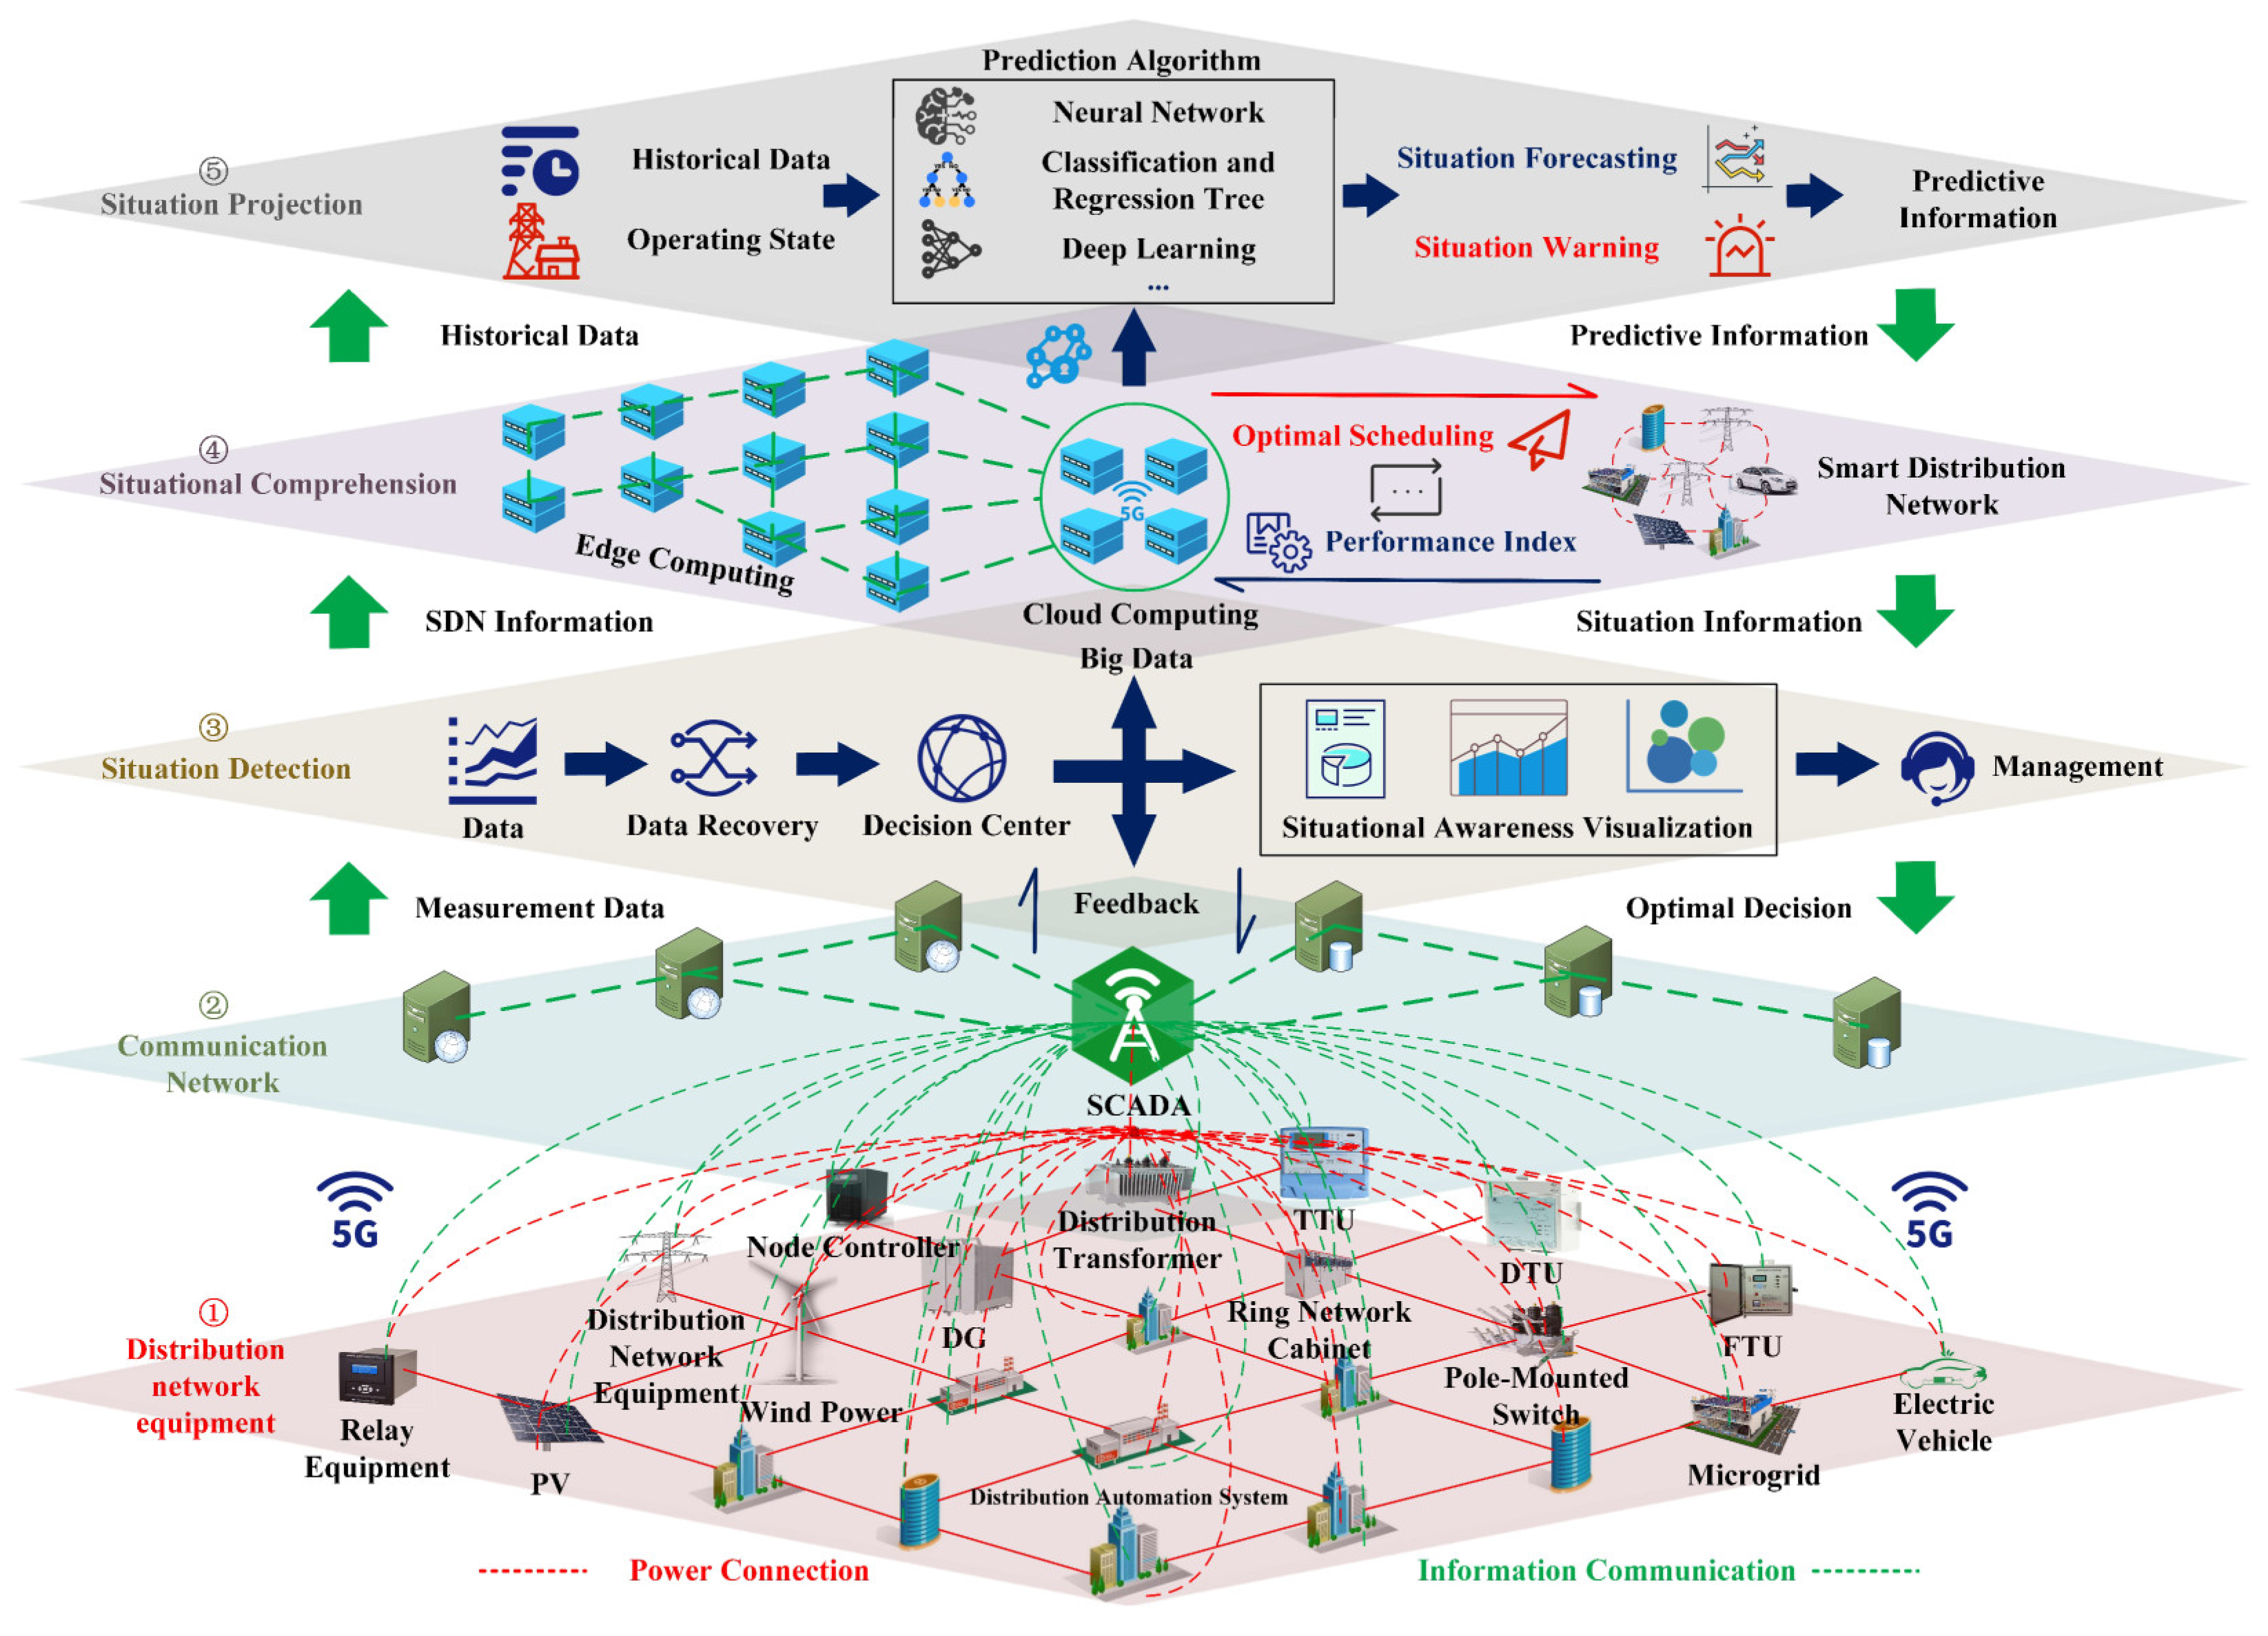
  • Situation detection. The task of the stage is to detect essential features in the environment. Multi-dimensional data can be collected and completed in this stage. In addition, situation detection is the data basis of situation comprehension and projection.
  • Situation comprehension. The essence of the stage is to understand the environment through data analysis. Specifically, the data obtained in the situation detection are integrated, and the connection and potential information between multi-source data are explored.
  • Situation projection. The core of situation projection is to achieve the practical application of SA knowledge. Based on the information gained from situation detection and comprehension, this stage can predict the future environmental situation in time.

1.2. Related Work

Although it initially appeared as a tool in the military [19], SA has been researched across a wide range of domains for individual and team activities. For example, [20] presented the distributed swarm SA of unmanned aerial vehicles based on the representative SA model. A convolutional neural network (NN) has been proposed for road traffic SA in [21]. For telecommunication, network SA becomes a security priority to perceive the network threat globally [22]. For robotics, Anjaria et al. [23] investigated the relationship between the SA theory and cybernetics and adopted this relationship to validate the feasibility of implementing SA-based information security risk management (ISRM) in organizational scenarios. SA has also been identified as a critical skill in maintaining safety in high-risk industries. For example, the influence of some variables on safety performance was investigated, and the mediating effects of SA were examined in [24]. In agriculture, Irwin et al. [25] explored SA among farmers in the United Kingdom when operating heavy agricultural machinery. In navigation, considering existing models of SA and ontology-based approach for maritime SA, seaborne SA was applied to navigation safety control in [26]. For healthcare, SA has been recognized as a critical technology for making effective and quick decisions for emergency response [27].
For the SDN, the situation represents the operating status of the SDN’s equipment, structure, status, security, and environment. SDN SA is also composed of the same three SA stages. In the situation detection stage, the information related to critical elements of the SDN is captured and completed. In the situation comprehension stage, the operating status of SDN and the potential information of the perceived data are analyzed. In the situation projection stage, the future behavior of SDN components based on their operating status and the perceived information is predicted [28]. Compared with the past, the architecture of SDN has undergone tremendous changes. The traditional distribution network is passive where the operation, control, and management modes are all determined by the power of the transmission network. In the developing SDN, AC/DC hybrid [29], multi-energy complementarity [30], energy internet [31], and other distribution network forms emerge. In addition, the higher proportion of RES and the disorderly access of DGs also lead to a significant increase in the SDN uncertainty. For example, the outputs of wind turbines and photovoltaic generators are greatly affected by meteorology rather than produced entirely based on the plan. These changes make SDN have more complex operating conditions and fault types. Moreover, there is a variety of system states that should be monitored for SA detection, which cannot be fully covered by remote measurement devices. Meanwhile, with the increase of regional electrical loads, power electronic devices become diverse, and the requirements for power quality increase. Therefore, it is urgent to explore the SDN SA from the perspective of high-quality O&M.
In the modern SDN, it is challenging to operate SA efficiently as the SDN has diversified characteristics in network topology, equipment types, energy types, and system configurations. Many studies have been trying to tackle the challenge from different aspects. For example, a security SA of the SDN was conducted by the random deletion of network nodes to simulate the network attack, which can meet the requirements of energy internet and is highly compatible with the RES [32]. Facing the power uncertainty brought by a high proportion of RES, a hybrid factor analysis (FA), gray wolf optimization (GWO), and generalized regression neural network (GRNN) was proposed for short-term load forecasting [33]. Due to the lack of definitions of a generic indicator framework that can uniformly characterize the critical operating states of the SDN, limited work has been done to evaluate the effectiveness of the SDN SA. To quantify the SDN SA performance effectively, ref. [18] proposed an improved interval-based analytic hierarchy process-based subjective weighting and a multi-objective programming-based objective weighting. To transfer more knowledge of the real-time SDN situation to the control center operator, [34] proposed two design strategies for SDN SA in real-time distribution operations. One strategy is for the preparation of standardized data acquisition networks. The other is a real-time security analysis for SDN. Diez et al. [35] presented a graphical user interface for a power grid based on SA-oriented design principles, where the control room operators can achieve an appropriate SA level.

1.3. Contributions

Although SA has become a significant element in enhancing the O&M of SDN, there are very few studies about SDN SA. For the early stage of SDN SA, ref. [18] presented a candidate SA framework for SDN, consisting of situation perception, situation comprehension, situation projection, and communication networks over the physical SDN elements. It is a pity that the background and functions of the critical technologies have not been explained in detail. To this end, this paper constructs a five-layer comprehensive framework to introduce the critical technologies of SDN SA, which can be regarded as a solid base for high-quality O&M in SDN. To the best of our knowledge, only [13] initially explored critical technologies of situation perception, comprehension, and projection prospect from the perspective of system access. However, its preliminary exploration of SA for SDN is merely a vision. Modern SDN technology is constantly updated, and high-quality O&M has become the core demand. Traditional SA cannot meet the O&M requirements of the existing SDN. To this end, this paper provides a more detailed and appropriate description of SDN SA from the perspective of O&M. The critical technologies of different SA stages are selected based on their significance to O&M, their relevance to SA, and their practicality to SDN. Based on the presented technical framework of SDN SA, distribution network researchers and utility engineers can be provided with insights into the technical achievements, barriers, and future research directions of SDN SA.
The purpose of this paper is to provide an updated picture of the SDN SA and contribute to the high-quality O&M of SDN. In order to promote the development of SA technology in the power distribution field, the research background and concept of SDN SA are clearly explained in Section 1. The challenges and objectives of future SDN SA are analyzed, which indicate the exploration directions of SDN SA. In addition, a five-layer comprehensive framework is presented to help the researchers understand the SDN SA in Section 3. Specifically, this paper constructs a virtuous circle between SDN and SA to improve the O&M quality of SDN, where SA transmits the SDN situation information to the management team, who formulated measures to guide the SDN to a better situation. To adapt to the evolving SDN, the critical technologies of SA are updated and analyzed based on the O&M requirements. Ultimately, we believe this paper can provide positive guidance for the future research and application of SDN SA.

1.4. Organization

The present paper is structured as follows: an overview of the objectives and challenges of SDN SA is discussed in Section 2. A five-layer comprehensive framework of SDN SA is conducted in Section 3. From the O&M perspective, the analysis of the critical technologies for situation detection, situation comprehension, and situation projection is proposed in Section 4, Section 5 and Section 6, respectively. Finally, the paper is concluded and prospected in Section 7. The brief review aims to address the challenges faced in the deployment of SDN SA and provide helpful information and guidance in selecting suitable technologies for specific SDN applications.

2. Description of Situation Awareness for Smart Distribution Networks

2.1. Objectives of Situation Awareness for Smart Distribution Networks

  • The primary goal is to achieve real-time or quasi-real-time SA for SDN, which can accurately obtain the critical information of SDN, quickly determine the operating status of the distribution networks, and predict the development trend of SDN at the same time [11]. Based on the historical records of SDN data, SA provides a comprehensive SDN situation to ensure high-quality O&M.
  • Observability is a significant technical indicator of SA. High-level SA can provide SDN with a highly visual situation and solve the shortcomings of insufficient measurement devices in the SDN [35].
  • SA has a significant contribution to SDN reliability. Specifically, conduct the SDN self-healing technology, detect potential SDN risks, and predict security situations in advance. Finally, a scientific basis for the SDN active defense can be provided [13].
  • Through continuous innovation of intelligent algorithms, SA is cultivating SDN self-adaptive capabilities [36]. Based on the information obtained by SA, SDN can independently recognize and improve the situation in an informed way.

2.2. Challenges of Situation Awareness for Smart Distribution Networks

Due to SDN’s diverse scenarios with more equipment and complex operating status, traditional SA cannot adapt to the modern SDN environment. The O&M challenges for modern SA are as follows:
  • Situational detection challenges. New measurement technologies such as AMI [37] and phasor measurement units (PMUs) [38] are gradually deployed in SDN. Therefore, the data dimensions collected by SDN scale rapidly, which inevitably increases the computational pressure of SA. Due to the insufficient measurement devices, the collected data are challenging to recognize the poor operating status of the SDN. Therefore, the input data of the SA system are asymmetric, and some missing data are necessary to be accurately completed by calculation. How to comprehensively detect SDN status remains a challenging point in high-quality O&M.
  • Situational comprehension challenges. Large-scale DGs lead the traditional dispatch mode to unsuitable. As a result, the phenomenon of reverse power transmission at the distribution network terminals is prominent, and the risk of voltage fluctuations and power loss increases [39]. In addition, different SDN topologies, operation modes, energy types, and automation levels have higher requirements for the compatibility of situational comprehension in different regions. Traditional situation comprehension technology is challenging to adapt to the current SDN. As the decision center of SDN, situation comprehension should assist the high-quality O&M of multi-form SDN. How to accurately understand the operating situation of the SDN is the focus of research.
  • Situation projection challenges. Unlike passive distribution networks, SDN has a higher proportion of DGs and electric vehicles (EVs) and more diverse operating modes [40]. The uncertain outputs of DGs and EVs lead to an imbalance between power supply and consumption. Although the SDN flexibility is improved, the RES outputs, three-phase unbalanced load, EV charging, inspection schedule, and stability margin are challenging to determine in the situation projection. Additionally, situation projection for complex scenarios requires sufficient mathematical analysis, computational capability, and robustness capability. How to effectively predict the operational trend of SDN needs to be solved urgently.

3. Comprehensive Framework of Situation Awareness

A five-layer comprehensive framework of SDN SA is shown in Figure 1, which includes distribution network equipment, communication network, situation detection, situation comprehension, and situation projection. In addition, SCADA systems [41], 5G communications [42], distribution automation systems [43], distribution network equipment [44], SA systems, and communication networks [45] are integrated into Figure 1. First, the distribution network equipment at the bottom layer transmits measurement information, equipment status, and network topology to the communication network at the second layer. Then, the communication network summarizes the SDN data and transmits it to situation detection at the third layer. After situation detection collects the data, it completes the pre-processing, completion, and visualization of multi-source data through various critical technologies. Meanwhile, the processed information is transmitted to the management team and situation comprehension at the fourth layer. Situation comprehension combines various critical technologies to explore the detected data, analyze the operating status of SDN, and provide information support for the high-quality O&M. An intelligent O&M mode can be realized based on the operating status of SDN. In addition, SDN historical data is transmitted to the situation projection at the top layer. Next, the situation projection combines meteorological, economic, social, resource, and other factors to predict the developing situation of SDN. After experiencing the forward cycle, the predicted information is fed back to the situation comprehension at the fourth layer. Next, situation comprehension can summarize and analyze all the information and then transmit a more comprehensive SDN situation to the management team. As a result, the management team and the SA system can coordinate to operate an optimal SDN based on the exact situation. A virtuous circle of SA is constructed for the high-quality O&M of SDN.

4. Critical Technologies of Situation Detection

Situation detection includes data acquisition, processing, completion, and visualization, which is the prerequisite of situation comprehension and projection [11]. To improve the SDN visibility, the comprehensive perception of the SDN is realized in both breadth and depth, whose implementation framework is shown in Figure 2. First, multi-source SDN data are collected by smart meters, terminal equipment, PMU, TTU, FTU, DTU, and other equipment. Then, the data are preliminarily processed through pre-processing technologies such as data storage, data fusion, and data cleaning. Next, the critical technologies of situation detection are used in data completion and data presentation to improve the observability of SDN, including big data analytics, 5G communication, virtual acquisition, and optimal configuration of measurement. Finally, the completed data are sent to the situation comprehension and projection. To our knowledge, the four critical technologies can synergistically contribute to situation detection effects.
When facing the core O&M goals, enough collected data are significant for situation comprehension to analyze the operating status of SDN. To deal with the uncertainties, it is necessary to have enough data for situation projection to predict the future SDN situation. Otherwise, inaccurate or incomplete SDN data might mislead O&M in a worse direction. Thereby, data construction is the foundation of SDN O&M. With the rapid development of the SDN construction, the power data stored in the SDN enterprise database show explosive growth with the O&M [46]. These data are usually stored in the form of unstructured data, such as images and text, which contain vital information about the operating status of SDN equipment. Through SDN situation detection technology, the O&M data can be collected, mined, and completed, where the data abundance can provide the possibility for high-quality SDN O&M.

4.1. Big Data Analytics

In the data-intensive era of SDN, SA data are large-scale, multi-source, changeable, and heterogeneous. Recently, studies have been looking into SDN situation detection, and big data analytics technology has gradually been applied to SA. Most of the existing methods employ different ways to store different data types, which leads to the inefficiency of data queries and analyses. To this end, Tao et al. proposed a graph database-based hierarchical multi-domain SA data storage to store the situation information, combining multi-dimensional data to improve the SDN visibility after data pre-processing [47]. An innovative data-fusion method was proposed in [48] to detect incipient faults by integrating data collected from multiple sources instead of a single data source. Using the status information of SDN equipment, a defect texts mining model for a secondary device in a smart substation was proposed in [49] to achieve the accurate classification of secondary device defect texts. In addition, power equipment data mining is a rapidly growing area of big data analytics, contributing to more O&M data. As a use case, the H-mine algorithm was adopted in [50] to quickly mine fault data of the secondary system of smart substations.

4.2. 5G Communication

Communication technology is the core factor that affects SDN observability. Wireless communication systems were preferred over wired for various reasons and various applications with reliable costs at lower speeds [51], which expands the infrastructure and provides easily accessible connections even in remote areas. Due to the characteristics of low power consumption, low cost, high capacity, low latency, high bandwidth, and multiple functions, flexible 5G communication technology has begun to be invested in the SCADA system [52]. Basnet et al. [53] simulated the false data injection (FDI) attack and the syn flood distributed denial of services (DDoS) attacks on 5G-enabled remote SCADA systems, which can detect the stealthy cyber-attacks that bypass the cyber layer and go unnoticed in the monitoring system with more than 99.9999% detection accuracy for both training and validation data.
The IoT enables all energy consumption and production components to be connected, improves O&M visibility, and provides real leverage at every stage of energy flow from use to supply and end-user [54]. Due to 5G’s higher data transmission speed and lower transmission delay than the existing 4G networks, 5G would ensure the convergence of widespread broadband, perception, and intelligence and then promote the development of IoT. A comprehensive review of the role of 5G cellular networks in the growth of IoT technology was presented in [51]. For example, the implementation of IoT based on the smart inverters can be achieved such as a solar-charged inverter that employs WiFi technology to engage in two-way communication with the user, informing the user of both the battery voltage of the inverter and run time of the loads which the user chooses to run. The deployment of advanced wireless networks in SDN would allow faster data transmission and processing [55]. 5G communication technology might become the future road of sustainable energy systems paving to state-of-the-art technologies and networks. In [55], 5G was employed to optimize demand-side response management in integrated energy systems. Combining the 5G and measurement equipment, such as PMU and AMI, can enhance the distribution network O&M [56]. Moreover, 5G-based SA provides the possibility of precise load control at the millisecond level [57]. The energy consumption reduction of 5G networks in SDN will become a vital research direction.

4.3. Virtual Acquisition

To improve the completeness of O&M data, SDN virtual acquisition technology is becoming a research hotspot. The technology is independent of the full coverage of the SDN measurement equipment installed, such as sensors, collectors, and concentrators. For areas that cannot be equipped with monitoring systems to collect real-time data, the virtual acquisition uses machine learning techniques based on data from similar areas to generate data for the objective areas [58]. Similar areas and dates can be selected based on data clustering results. By mining the inherent mapping relationship between the objective distribution network and similar areas, the anonymous data can be supplemented by historical data in similar areas and existing real-time data. The data supplement method can be based on machine learning such as NN [59]. Currently, the virtual acquisition technology remains in its infancy. The authors of [58] presented a virtual acquisition of distributed PV data based on the combination of bat algorithm and wavelet NN, which realizes the acquisition of O&M data of nine distributed PV stations when only one station is equipped with complete measurement equipment. In addition, a virtual acquisition based on a mixture of grey relational degree and back-propagation NN was proposed in [60], which can accurately acquire unknown O&M data of distributed PV without complete measurement equipment. In the future, virtual acquisition technology is worthy of research.

4.4. Optimal Configuration of Measurement

SDN SA strongly relies on various digital measurement devices and well-designed monitoring systems. The AMI is a typically configured infrastructure that integrates many technologies to achieve its objective, including meter data management systems, communication networks in different levels of the infrastructure hierarchy, smart meters, and ways to integrate the acquired data into software application platforms and interfaces [61]. To ensure data observability, the AMI adopts measurement equipment configuration optimization, PMU configuration optimization, and data analysis technology. Dua et al. [62] proposed a novel method to detect the configuration of the distribution network by collecting and processing real-time measurement from the optimally placed micro-phasor measurement unit. The authors of [63] presented a data-driven method based on the measurements of micro-phasor measurement units to deal with the optimal hourly configuration of the distribution network in a real-time manner. PV intelligent edge terminal (IET) is one of the notable devices to achieve high-quality O&M with a high proportion of distributed PV [64]. A mathematical model and improved coyote optimization were proposed in [64] to optimize the configuration of PV IETs, which acquires the optimal number, location, and connection way of PV IETs.

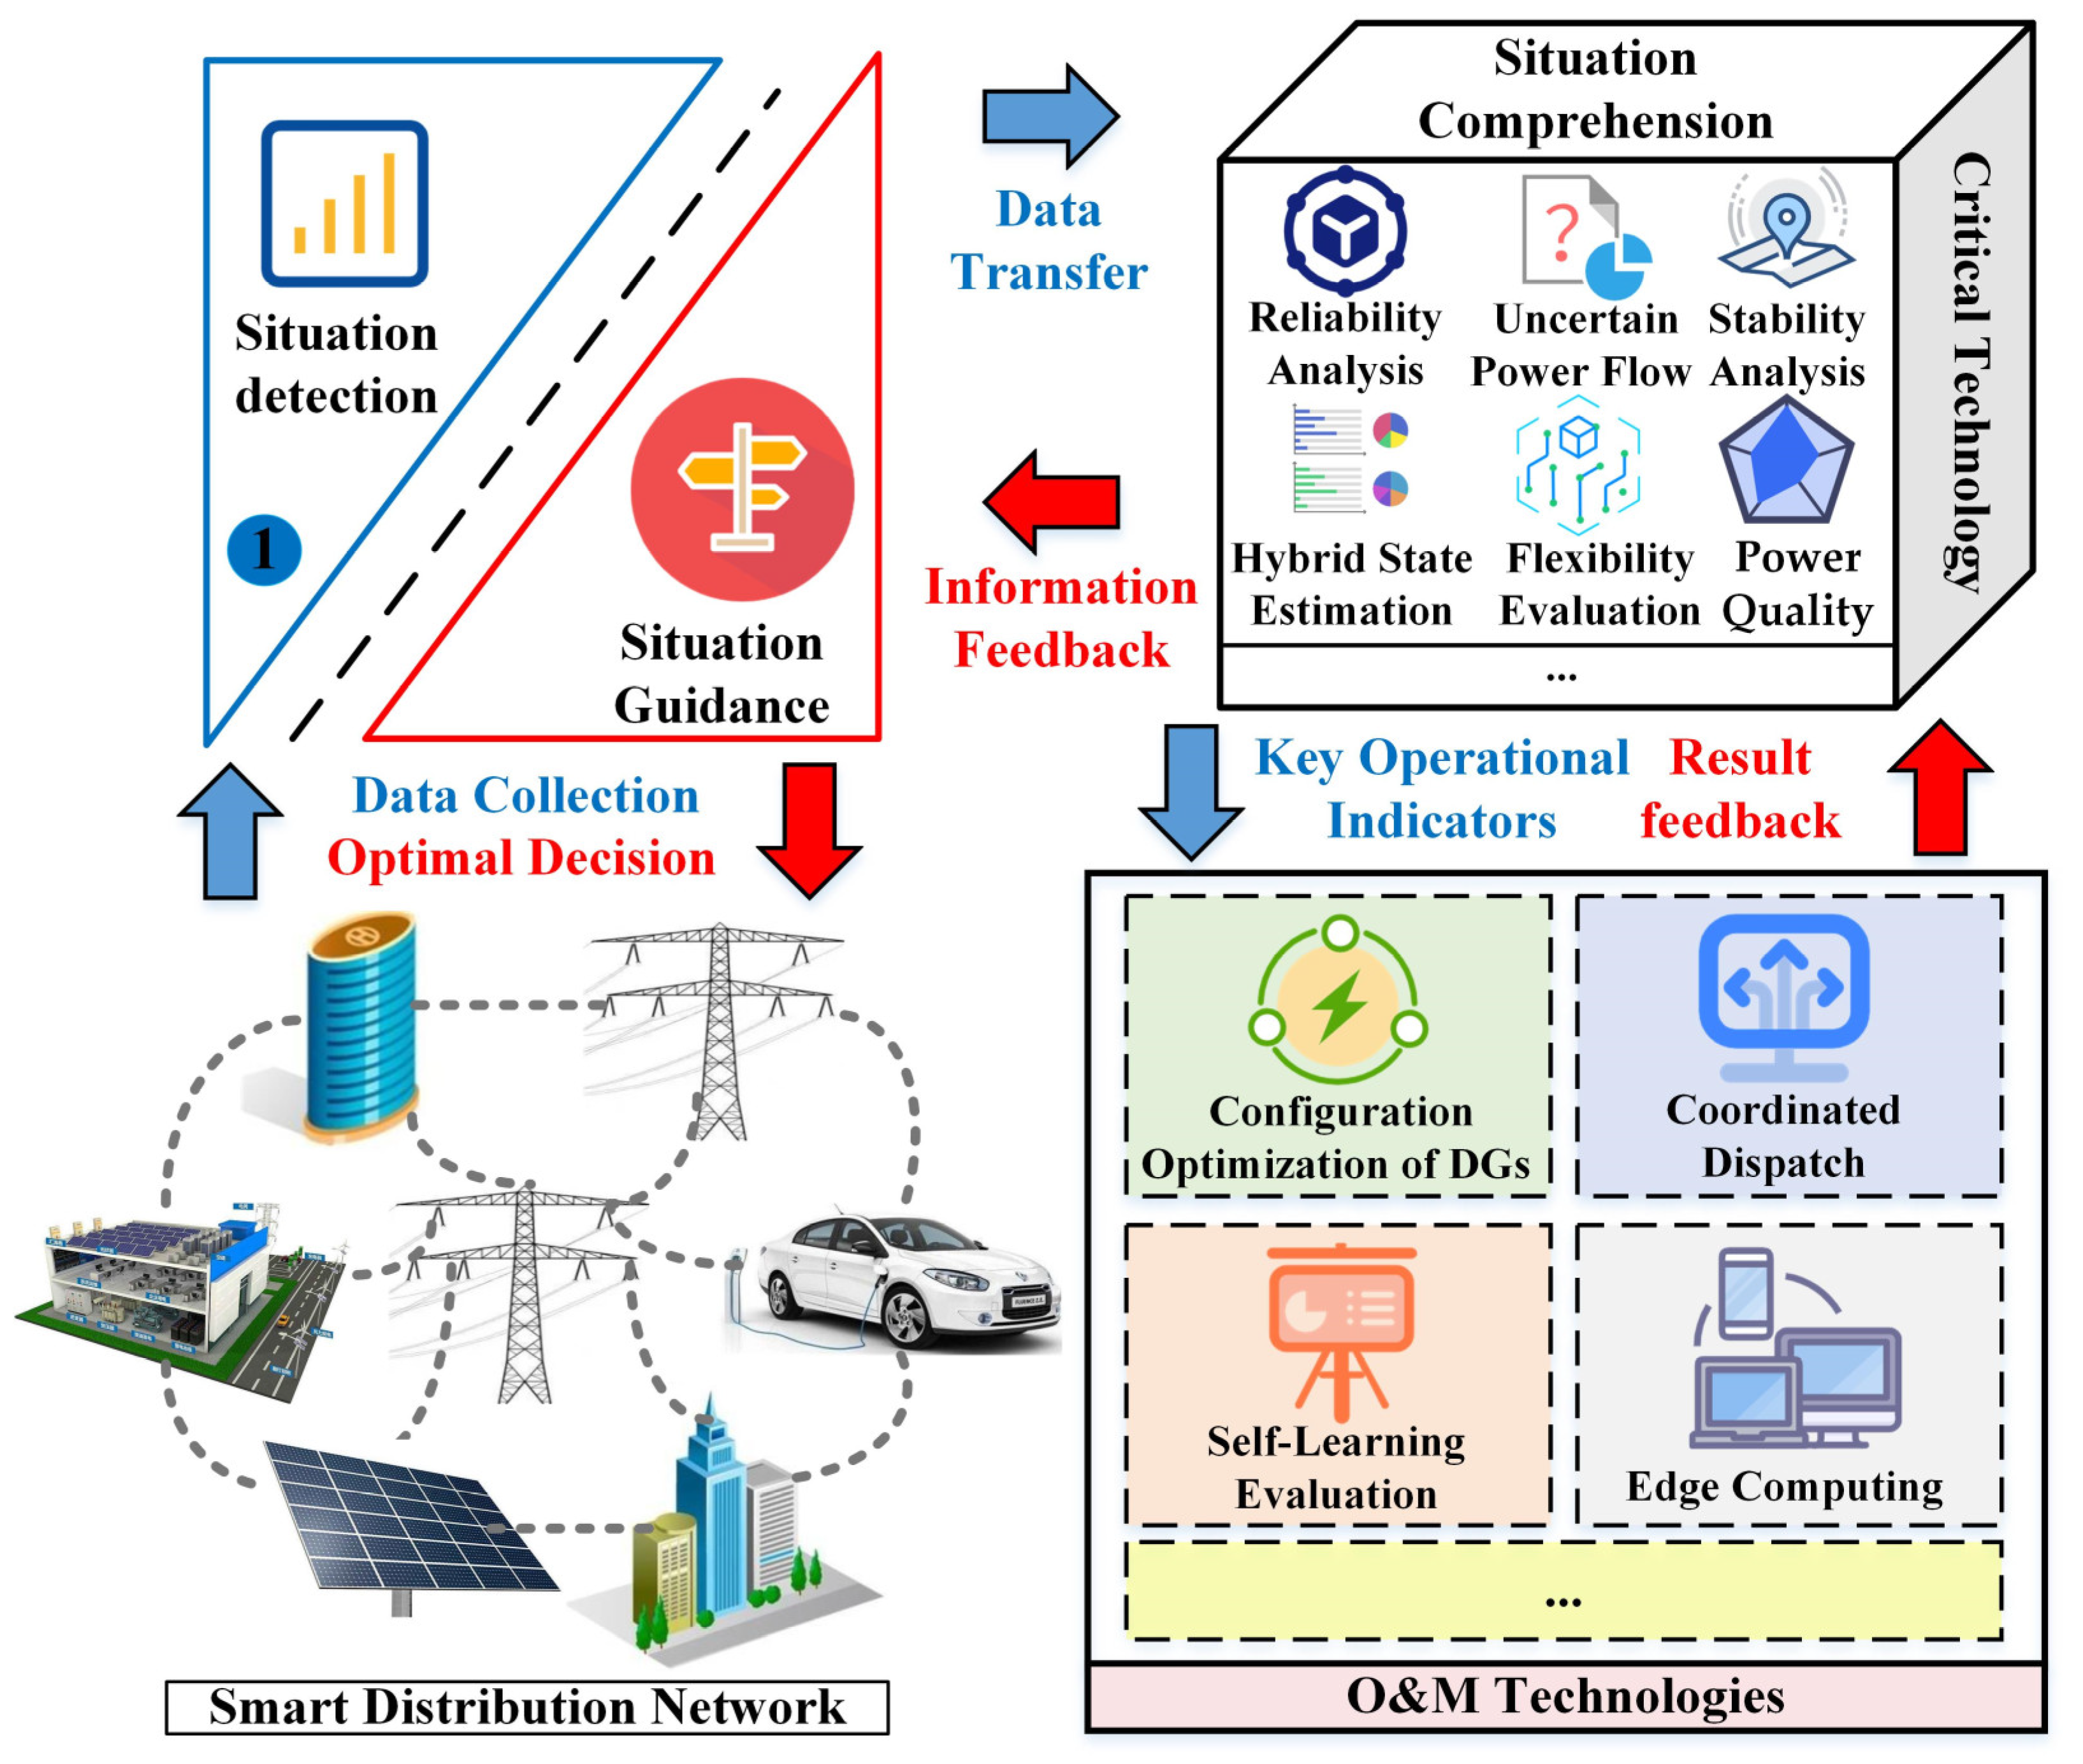
5. Critical Technologies of Situation Comprehension

Situation comprehension is the data analysis stage, which explores the potential information of the data collected in the situation detection. Many key operational performance indicators need to be correctly evaluated in SDN, such as reliability [65], flexibility [66], stability [67], and power quality [68], which are integrated into the analysis of the SDN situation. As the foundation of high-quality O&M, the implementation framework of situation comprehension is shown in Figure 3. First, SDN data are collected and completed by situation detection. Then, the data are transferred to the situation comprehension system to explore potential information. By conducting critical technologies of situation comprehension, many key operational performance indicators can be acquired and used as the data basis for O&M technologies. Then, the technologies contribute to high-quality O&M based on the situation comprehension results and return the calculation results to the situation guidance. Ultimately, the intelligent O&M combined with situation comprehension and management can be realized. The critical technologies of situation comprehension include uncertain power flow calculation, hybrid state estimation (HSE), reliability analysis, voltage stability analysis, flexibility evaluation, and power quality evaluation technology.
Energy equipment such as wind power, photovoltaic, DC electrolysis of water into hydrogen, hydrogen storage, AC ice storage, and water storage equipment has been increasingly connected to SDN. The introduction of various energy equipment increases the need for real-time scalable and reliable monitoring, control, and protection of SDN. Situation comprehension establishes the mathematical model compatible with multiple types of SDN terminal equipment, adopts the SDN information provided by situation detection to evaluate the SDN key operational indicators, and then realizes the flexible correction of SDN operating status. Based on the critical technologies of the situation comprehension above, the management team can take more specific measures to improve the quality of O&M. For example, the configuration optimization of DGs based on the results of situation comprehension can be applied to improve the economy of SDN O&M. Meanwhile, many uncertainties and power data in SDN can be determined through situational understanding to reduce the blindness of O&M decision making. In addition, self-learning evaluation technology can achieve dynamic evaluation and the weight balance of multiple indicators to effectively evaluate the key operational indicators of SDN [69]. To coordinate different DGs and energy storages, coordinated dispatch technology can be adopted to build an integrated energy system based on the results of situation comprehension and contribute to high-quality O&M [70]. In addition, the popularization of electric IoT gives SDN more powerful computing capabilities, which promotes the miniaturization and intellectualization of IoT terminals. As IoT has found its way to SDN, demand-side management can be more efficient in the presence of IoT [71]. Edge computing technology [72] enables flexible collaboration between smart terminals and improves the response speed of SDN O&M. In sum, situation comprehension can provide O&M with richer information through various technologies and help the management team make the optimal decision.

5.1. Uncertain Power Flow Calculation

Uncertain power flow calculation (PFC) technology involves interval PFC [73], fuzzy PFC [74], and probabilistic PFC [75], which estimate the influence of uncertain factors on the SDN. Unlike deterministic PFC, only a single uncertain PFC can provide SDN with more information of power flow within a volume of time and space, reducing the number of repeated PFC caused by uncertain SDN parameter changes. The known and to-be-calculated quantities in deterministic PFC are considered as random variables. The SDN’s uncertain PFC model can be established based on affine arithmetic, fuzzy numbers, or probability statistics theory. Liu et al. [76] presented an interval PFC method for multi-terminal DC distribution networks to deal with the uncertainties of DG output powers and loads. The power flow of DC distribution network in affine arithmetic is explained by the following equation:
P k = U k j = 1 n g k j U j k = 1 , 2 , , n
where Pk is the nodal power of the kth load node in affine form, gkj is the admittance of the positive line from the kth node to the jth node, Uk is the positive voltage of the kth node in affine form, Uj is the positive voltage of the jth node in affine form, and n is the total number of nodes. The interval PFC algorithm provides an essential tool for SDN SA to solve the uncertainties of loads and RES outputs.
Due to the uncertainties of the DGs and loads, Yang et al. [77] presented a random fuzzy PFC model, which adopts cumulant technology in the random stage and the fuzzy simulation in the fuzzy stage. The normal distribution can usually represent the load power, and their random fuzzy models are explained by the following equation:
f ( P Load   ) = 1 2 π ξ σ P exp ( ( P Load   ξ μ P ) 2 2 ξ σ P 2 ) f ( Q Load   ) = 1 2 π ξ σ Q exp ( ( Q Load   ξ μ Q ) 2 2 ξ σ Q 2 )
where PLoad and QLoad are the active and reactive load powers, ξμP and ξμQ are the means of the active power and reactive power, and ξσP and ξσQ are standard deviations of the active power and reactive power.
Liu et al. [78] presented an improved dependent probabilistic sequence algorithm based on the traditional linear PFC to obtain the probability distribution information of power flow, which can achieve more accurate results and computational efficiency of probabilistic PFC. The following equation explains the nth node’s voltage probability distribution:
P { X n = X n 0 + i ( Δ S Δ P ) } = Δ X n ( i )
where ΔP is discrete step length of power, ΔS is discrete step length of sensitivity factor, Xn is nth node’s voltage, Xn0 is reference state of nth node’s voltage, ΔXn(i) is a variety of nth node’s voltage, and i is the number of a corresponding expansion sequence group. Simultaneously, the lth branch flow’s probability distribution can be expressed by the following equation:
P { Z l = Z l 0 + i ( Δ T Δ P ) } = Δ Z l ( i )
where ΔT is discrete step length of sensitivity factor, Zl is lth branch’s power flow, Zl0 is reference state of lth branch’s power flow, and ΔZl(i) is a variety of lth branch’s power flow. Because of the low demand for the sample size, this method is suitable for SA to analyze the power flow uncertainties of SDN with incomplete measurement information.

5.2. Hybrid State Estimation

The current distribution network O&M data mainly come from the SCADA system. To improve the estimation accuracy in the distribution network, PMU with more comprehensive measurement information has gradually become popular in SDN [79]. A PMU delivers time-synchronized values of voltage and current phasors and other system-related quantities [80]. However, the current SDN remains in a state where many traditional and new measurement devices coexist. The main challenge in the HSE is the mismatch of the refresh rates between the SCADA and PMU measurements [81]. Therefore, there is an urgent need for PMU/SCADA HSE technology to improve the accuracy and breadth of SA.
A novel HSE method was presented in [82], which decouples the SCADA and PMU measurements to deal with different accuracy levels between them. The novel HSE model, based on weighted least-squares formulation including both SCADA and PMU measurements, is as:
min x = ( x PMU , x n PMU ) J ( x ) = [ z h ( x ) ] T R 1 [ z h ( x ) ]   s . t .   c ( x ) = 0 : λ x PMU x st - PMU = 0 : μ
where x is the vector of system states including voltage angles and magnitudes, λ is the Lagrange multiplier vector of the equality constraints of zero injection busses, xst-PMU is the PMU states estimated, μ is the Lagrange multiplier vector, xPMU and xn−PMU indicate the PMU and non-PMU states, R is the covariance matrix, z is a vector consisting the system measurements, vector h(x) includes nonlinear functions which relate the states with the measurements through power flow equations, J(x) is the Jacobian matrix, and c(x) is constraint condition. The condition number, as well as the run time of the HSE method, are significantly better than those of conventional state estimation, which can effectively improve the efficiency of the situation comprehension.
Considering the fast applications of intelligent electronic equipment in the SDN, Kong et al. [83] presented an HSE method based on SCADA and PMU measurements, which can help situation comprehension effectively converge and quickly track the system states while ensuring the estimation accuracy. To comprehensively utilize multi-source measurement data, future research should explore suitable data processing methods for the differences between different measurement devices regarding frequency, time scale, structure, and delay.

5.3. Reliability Analysis

As a significant part of the SG, DG penetration in the SDN becomes an ever-increasing problem, and the protection system has significant influences on SDN reliability. Therefore, the comprehensive reliability evaluation of SDN consists of primary distribution networks and a protection system. As the traditional reliability assessment of distribution networks ignores the influence of relay protection and the complex configuration mode of the area-centralized distribution protection system, Xiao et al. [84] proposed an improved failure mode and effect analysis method to evaluate the comprehensive reliability of SDN based on fault location and protection system. Alves et al. [85] presented a reliability assessment methodology to evaluate instantaneous and average measurements of reliability and availability, which is validated in a low-voltage distribution network. Aiming to evaluate the potential rate of exposure to the failure of system components, smart monitoring systems (SMSs) are applied in SG to improve the component reliability. Honarmand et al. [86] presented a new mathematical model to evaluate the reliability of a distribution network equipped with the process-oriented SMSs using the Markov method, which shows SMSs increase the reliability of the distribution network by 90%. The uncertainty of EV charging load challenges the distribution network, especially SDN with a higher proportion of DGs. The objective of [87] is to conduct a comprehensive analysis of spatial–temporal EV charging from the perspective of both system reliability and EV charging service reliability.
The least erroneous knowledge on fault detection and location in SDN helps with the restoration process, expedites maintenance, and reduces power outage duration. Khavari et al. [88] presented a novel framework for fault detection and location for SDN equipped with data loggers, including faulty section identification, area detection, and high impedance fault location. Gilanifar et al. [89] presented a multi-task logistic low-ranked dirty model for fault detection in SDN utilizing the distribution PMU data, which improves the fault detection accuracy by the similarities in the fault data streams among multiple locations across an SDN. Automatic and accurate fault detection and location are critical components of effective situation comprehension. In addition, low voltage direct current (LVDC) distribution systems have recently been considered an alternative to power system infrastructure. Mohanty et al. [90] proposed a fault location based on the offline connection of external discharge equipment using the probe power unit. However, the offline method relies on isolating the faulty section first, while extra operating time is required. To tackle this, Jia et al. [91] presented an online fault location technology for the DC distribution network, which calculates the fault distance based on voltage resonance. Wang et al. [92] proposed a new fault let-through energy-based DC fault location working strategy to facilitate post-fault network maintenance.

5.4. Voltage Stability Analysis

With the development of existing SDN structures, the probability of a voltage collapse in distribution networks has increased. Voltage stability represents the ability to keep node voltages within an acceptable range after a disturbance [93]. A stable SDN can maintain the voltage near an acceptable value after the disturbance occurs. Otherwise, voltage collapse will occur. To prevent potential risk, it is necessary to predict the voltage collapse. The voltage drop caused by overload causes most of the voltage instability problems. Therefore, finding the network nodes prone to voltage collapse becomes a research hotspot.
Sadeghi et al. [93] presented a novel approach for static voltage stability evaluation in distribution networks, introducing a new indicator to assess the voltage stability of distribution networks. The voltage stability indicator VSI is as follows:
V S I = V 1 2 4 ( | V 2 | | V 1 | cos ( δ 1 δ 2 ) | V 2 | 2 )
where V2 is the receiving end bus voltage and V1 is the sending end bus voltage. δ1 and δ2 are voltage angles at the sending and receiving buses, respectively. The voltage stability indicator includes only the bus voltage and voltage angle, which is suitable for SDN SA with high response speed requirements.
The penetration level of DGs is increasing and has a significant impact on voltage stability. Hu et al. [94] presented a relatively available transmission capacity indicator (RATCI) based on the power transfer margin of the power–voltage curve considering the distribution network resistance, which is defined as follows:
R A T C I = ( P cri   P 0 ) / P cri  
where P0 is an initial operational point of the system and Pcri is the critical point of the system. The novel RATCI assesses the voltage stability by combining DGs and the defined reactive power types, helping SA achieve the optimal penetration rate of the RES while still maintaining voltage security.
In some scenarios, voltage stability can be evaluated accurately by separate static modeling of the distribution network. Nevertheless, simultaneous dynamic modeling of distribution networks is needed in other cases [95]. Song et al. [96] proposed a novel voltage stability indicator using the network-load admittance ratio, where simulation results verify that the indicator has satisfactory linearity with load increase and acceptable estimation accuracy of the voltage stability margin.

5.5. Flexibility Evaluation

As a vital operation indicator of situation comprehension, the flexibility evaluation of distribution networks is gradually being paid attention to by scholars with the increasing penetration of RES. Meanwhile, the SDN faces challenges from decentralizing DGs and the electrification of heating and transportation. To this end, Fonteijn et al. [97] proposed four theoretical possibilities for flexibility as a solution for congestion management based on four pilot projects on congestion management in the Netherlands. However, limited attention has been paid to the probabilistic characteristics of uncertain regions. Ge et al. [98] presented a new sequential flexibility assessment based on the feasibility analysis of the uncertain region of PV active power and load demand, which explores the influence of probabilistic characteristics of uncertain variables on flexibility assessment. To tackle random disturbances and improve O&M quality, a large number of power electronic devices such as soft normally open point (SNOP) are integrated into SDN. The authors of [99] presented a new node flexibility assessment model of distribution systems for SNOP integration. As a new variable load, EVs can increase the system flexibility through interactions with the grid and promote RES consumption. Liu [100] proposed a flexibility evaluation method considering the interaction between distribution networks and EVs.

5.6. Power Quality Evaluation

One of the significant purposes of situation comprehension is to analyze the power quality of SDN. With the gradual deployment of sensitive loads in frequency converters and relays, voltage sag has become a significant power quality issue of SDN. To improve the comprehension of voltage sag severity in SDN, Guo et al. [101] proposed a comprehensive weight-based severity evaluation of voltage sag. In most practical distribution networks, there is insufficient information available about harmonic contents of customers for SA. Therefore, Amini et al. [102] proposed a novel assessment model of harmonic distortion level emphasizing the impedance characteristics of the network buses, which can also be employed as a valuable tool in SDN, where harmonic contents of nonlinear loads are not available. The acceptable value of impedance characteristic Zacc is determined based on voltage and current of network buses as follows:
Z acc = V h I h
where Vh and Ih are acceptable harmonic voltage and current of ith buses, respectively. If the impedance characteristic is less than the acceptable value, it can be ensured that harmonic voltage limits will be satisfied if harmonic currents are within the standard range.
Time-varying nonlinear loads in SDN frequently interfere with the judgment of the SA system. To this end, Lamedica et al. [103] presented a novel model of time-varying nonlinear loads in SDN based on demand conditions, which achieves a pre-evaluation of harmonic disturbances under variable conditions using normal and uniform distribution to randomize the electrical values of the nonlinear loads. In addition, Bajaj et al. [104] presented an analytic hierarchy process-based approach for evaluating and benchmarking the power quality performance of grid-integrated renewable energy systems, which includes voltage harmonic distortion, current harmonic distortion, voltage and frequency fluctuations, and voltage imbalances. For example, power quality indicators of voltage and current harmonic distortion [104] can be expressed as follows:
T V H D = 100 × V rms 2 V f - rms 2 V f rms
T C H D = 100 × I rms 2 I f rms 2 I f rms
where TVHD is total voltage harmonic distortion, TCHD is total current harmonic distortion, Vrms is RMS value of overall voltage, Vf_rms is RMS value of fundamental frequency voltage, Irms is RMS value of overall current, and If_rms is RMS value of fundamental frequency current. Power quality indicators of voltage and frequency fluctuations [104] can be expressed as follows:
V S S = 1 ( V a + V b + V c 3 )
F R R = 100 × f m f r f r
where VSS is voltage sag score, FRR is frequency regulation ratio, fm is the measured value of frequency, and fr is the rated frequency. Va, Vb, and Vc are post-sag RMS voltages of phases A, B, and C, respectively. Power quality indicator of voltage imbalance VIF [104] can be expressed as follows:
V I F = 82 V abe 2 + V bce 2 + V cae 2   average   line   voltage  
where Vab, Vbc, and Vca are three-phase imbalanced line voltages. Vabe is the difference between the line voltage Vab and the average line voltage, Vbce is the difference between the line voltage Vbc and the average line voltage, and Vcae is the difference between the line voltage Vca and the average line voltage.

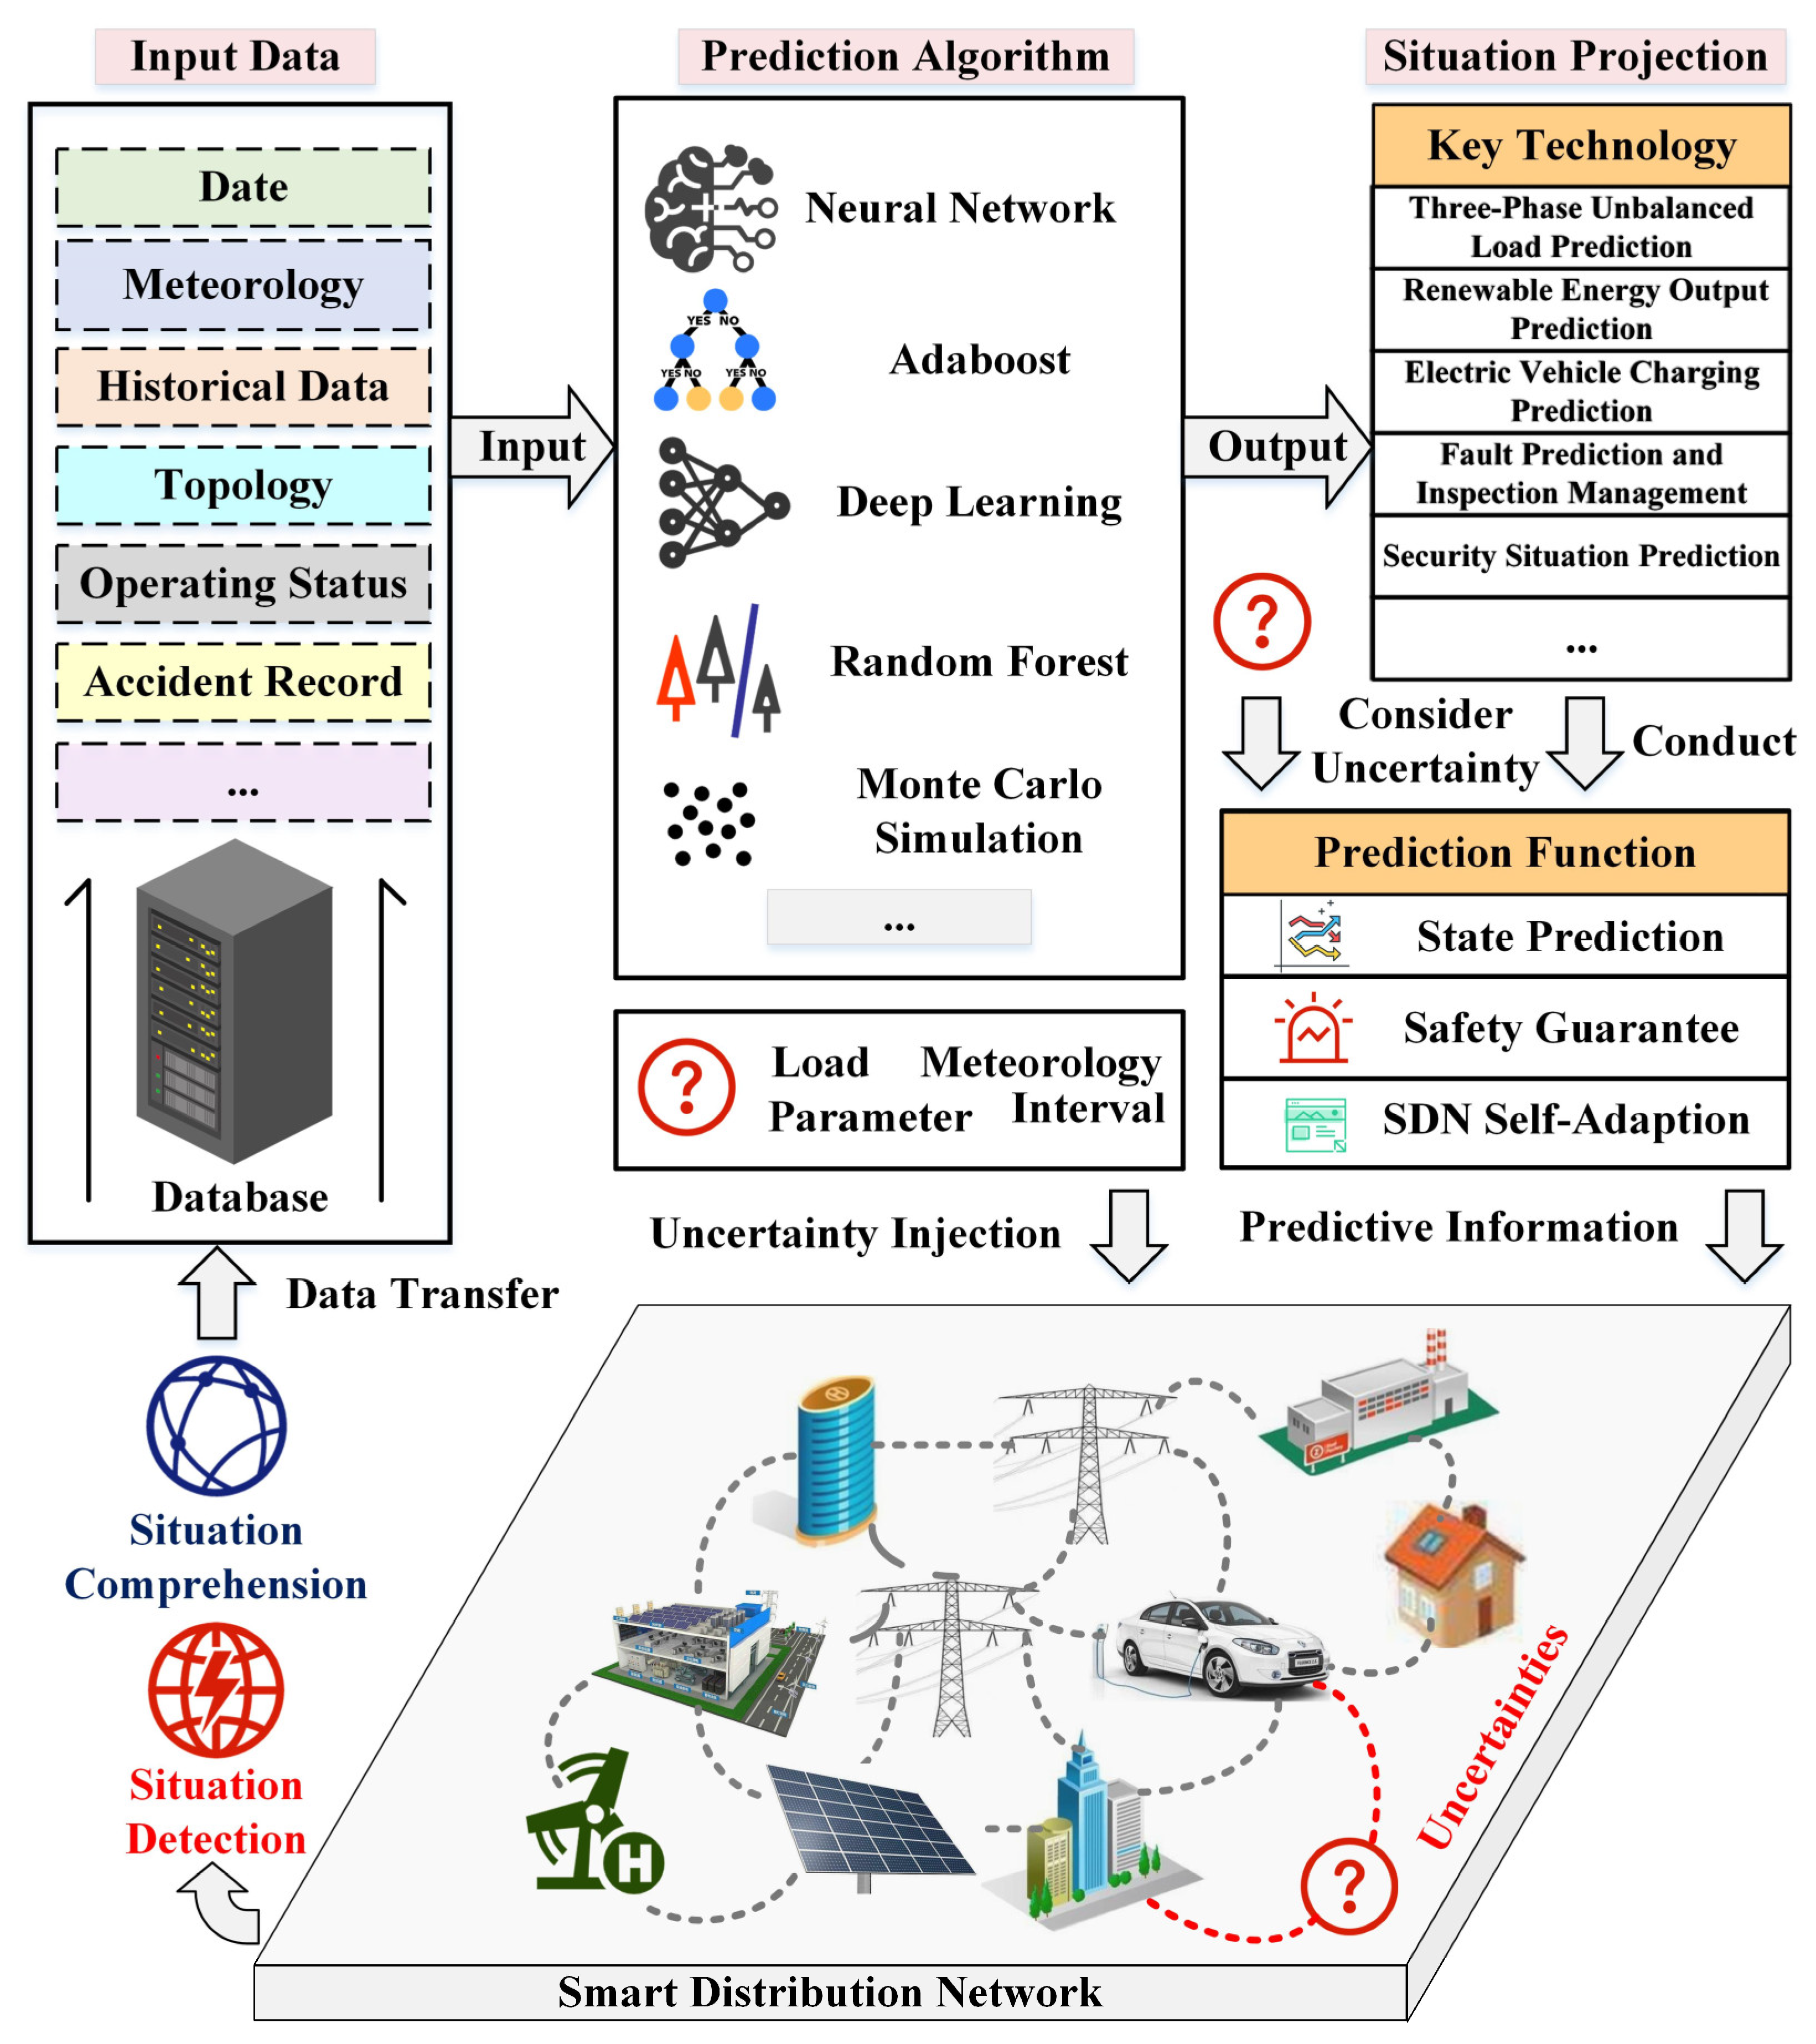
6. Critical Technologies of Situation Projection

Situation projection is the stage of state prediction to predict the SDN development, evaluate the operational risks, and provide predicted information for SDN management. With the intelligent O&M, the self-adaptation of SDN relies on accurate situation projection. The implementation framework of the situation projection is shown in Figure 4. First, a large amount of processed data from situation detection and situation comprehension is transferred to the situation projection system. Then, multiple factors such as meteorology, economy, society, resources, and load are comprehensively considered. In addition, state-of-the-art intelligent algorithms such as deep learning [105] and Adaboost [106] are applied to situation projection. Finally, critical technologies of situation projection are conducted to simulate and predict the SDN developing trend in different aspects. Meanwhile, the predicted information is sent back to SDN to provide theoretical support for optimal decision making. The critical technologies of situation projection include three-phase unbalanced load prediction technology, renewable energy output prediction technology considering uncertainty, state-of-energy estimation technology, fault prediction and inspection management technology, and security situation projection technology.
With the rapid development of new SDN equipment, the O&M of SDN is facing many urgent issues. The integration of high-penetration RES [107] and EVs [108] into the distribution systems increases the uncertainty of SDN operations. In addition, various equipment faults [109] and three-phase unbalance problems [110] can frequently occur in SDN. The security situation is also a vital challenge in establishing secure communication networks for SDN [28]. To this end, situation projection is employed to simulate the behaviors and predict the future development of SDN. The critical technologies of situation projection are related to the security, stability, reliability, and other aspects of the SDN. The goal of situation projection is multifaceted, including reducing the occurrence of three-phase unbalance, assessing the operating risks, evaluating the state-of-energy of EVs, addressing the uncertainty of RES output, assuring information security, providing information support, and guiding SDN management to achieve high-quality O&M [11]. To sum up, situation projection plays a role in SDN in the energy transformation and the upgrade toward future smart cities.

6.1. Three-Phase Unbalanced Load Prediction

Three-phase unbalance means that the amplitude of the three-phase currents or voltage in the power system is inconsistent, and the amplitude difference is beyond the prescribed range [111]. The difference in electricity and electricity usage time between the three phases leads to an unbalanced current [112]. The problem of power three-phase unbalance is closely related to the O&M quality of SDN.
To this end, some studies have investigated three-phase unbalanced predictions. Based on the hierarchical temporal memory, a three-phase unbalanced forecasting model was proposed in [112], where the encoder was adopted for binary coding, the spatial pooler was used for frequency pattern learning, the temporal pooler was employed for pattern sequence learning, and the sparse distributed representations classifier was conducted for unbalance forecasting. Based on the historical data, Han et al. [113] adopted the Elman NN to forecast the daily power consumption of each user and three-phase outlet current in the distribution networks on the day of phase modulation. Therefore, the line loss and three-phase load unbalance can be effectively reduced by changing the access phase sequence of the load. For the unbalanced three-phase SDN, Zhou et al. [114] developed regression analysis for PFC and adopted recurrent NN to predict the load demands. The model that requires fewer distribution-level PMU than nodes is more suitable for existing distribution networks.

6.2. Renewable Energy Output Prediction Considering Uncertainty

Despite the transformation of the SDN energy structure, the intermittency of RES affects the stable operation of SDN. In order to solve the uncertainty issue of RES output, many scholars study the prediction of RES output. The renewable energy output prediction technology quantifies the impact of the RES uncertainty, which can provide a comprehensive RES situation, offer theoretical support for SDN scheduling and configuration, and ensure high-quality O&M. In general, the prediction methods can be divided into (a) physical model prediction and (b) data-driven prediction.
The physical model prediction refers to modeling the physical characteristics of RES [115]. Cui et al. [116] established mathematical models of PV cells and inverters to calculate PV output under different conditions. However, the physical model prediction involves multiple links and has high requirements on the parameters of PV power station components. Therefore, the method may suffer complex modeling, poor robustness, and poor prediction accuracy [117].
Meanwhile, RES output prediction based on the data-driven method mainly considers historical output and meteorological data, which can overcome the shortcomings of the physical model prediction. To deal with the short-term PV output uncertainty characteristics, Ge et al. [118] proposed a PV output prediction technology based on a GRNN. The GWO was adopted to optimize the network parameters of GRNN and achieved a high precision in day-ahead short-term PV output forecasting. In addition, Wang et al. [119] proposed a two-stage attention mechanism prediction model based on long short-term memory (LSTM) for the problem of wind power output prediction.
The above research is deterministic renewable energy forecasting. In recent years, the uncertain method for forecasting RES output has attracted widespread attention from scholars. Algorithms such as probability and statistics laws, interval estimation, and probability theory were employed to predict the RES output [120]. Peng et al. [121] proposed an interval prediction based on the gated recurrent unit for wind power forecasting. Yang et al. [122] proposed a probability prediction for wind power output, which is compatible with SDN areas containing various uncertain parameters.

6.3. State-of-Energy Estimation

The state-of-energy is a vital evaluation index for energy optimization and management of power battery systems in EVs. Unlike the state-of-charge, state-of-energy is the residual energy of the battery in traditional applications, represents the integral result of battery power, and refers to the product of current and terminal voltage. Additionally, the state-of-energy affects the terminal voltage like the state-of-charge. Based on NN, Zhao et al. [123] combined fault and defect diagnosis results with big data statistical regulation to construct a comprehensive EV battery system fault diagnosis. The charging energy of EVs changes based on different actual operating conditions, and the complexity of these changes increases the difficulty of prediction.
To tackle this challenge, Dong et al. [124] presented an online model-based estimation approach against uncertain dynamic load currents and environmental temperatures, which simulates battery dynamics robustly with high accuracy. As a result, the estimates of the dual filters can converge to the real state-of-energy with an error no greater than 4%. To accurately estimate the state-of-charge and state-of-energy for a lithium-ion battery pack, Zhang et al. [125] estimated the battery’s energy state online using an adaptive H infinity filter, which can estimate the battery states in real-time with the higher accuracy compared with an extended Kalman filter and an H-infinity filter.

6.4. Fault Prediction and Inspection Management

With the increasingly complex SDN structure, there are many types of faults in the distribution network. Additionally, the redundancy of influencing factors increases. According to the configuration of maintenance personnel, constructing a dynamic inspection strategy can provide reliable decision support for high-quality O&M and reduce the risk of accidents. The main challenges of inspection management include extracting fault features and decoupling fault location layers [126]. Fu et al. [127] proposed a short-term preventive inspection scheduling for SDN, considering the support potential of the DGs and batteries; the results show that the supporting potential of DGs and batteries in preventive maintenance scheduling contributes to a significant reduction of load losses. Liu et al. [128] established various constraints between lines based on the network topology and proposed an optimization model for the inspection plan of distribution network equipment. The results show that the proposed inspection scheduling effectively reduces outage power loss. Moreover, accurate and fast fault prediction in SDN is significant for increasing reliability, fast restoration, optimal electrical energy consumption, and customer satisfaction [129]. Due to the causal ambiguity of written fault records, [130] demonstrated using natural language processing techniques to disambiguate the free text in maintenance tickets to achieve supervised learning of fault prediction technologies. Tsioumpri et al. [131] demonstrated that localized weather data could support fault prediction on distribution networks, taking evasive behaviors for imminent events over short timescales.

6.5. Security Situation Projection

Existing security measures are insufficient to avert attackers’ infringement into wireless SDN communication networks [132]. The security situation projection becomes significant to build a secure and resilient SDN. It remains challenging to rapidly extract SDN security situation elements and identify abnormal situations [28]. To hide personal power consumption data from the adversary, Shakila et al. [132] presented the concept of time-variant key generation along with lightweight encryption and device verification technique. To address the security issues of the wireless, private time-division long-term evolution (TD-LTE) network in SDN, Chen et al. [133] proposed a systematic security protection architecture. Considering the security of wireless public network access, Liu et al. [134] proposed a wireless public network access control based on the Bayesian classification, which realized the intelligent distribution of communication networks and improved the operating efficiency of SDN. Although the introduction of smart meters improves measurement and control functions of SDN, cyber-attacks such as electricity theft are constantly emerging, where the attackers increase the power consumption record of other users while reducing their own records. To this end, Tao et al. [135] presented a statistical strategy using the information on higher-order statistics of power consumption, which can detect electricity theft attacks and identify the attackers and victims.

7. Conclusions

With the development of distribution network automation, SA has gradually been popularized and applied in SDN. As more SDN operating technologies and energy forms appear, critical technologies of SA need to be adjusted to adapt to the evolving SDN. Consolidating the critical technologies of SDN SA, promoting the organic integration of various technologies, and improving them based on the implementation effect of SA will be the future research directions. To provide technical support for high-quality O&M of SDN, this paper explains the background of SDN SA, introduces the SA concept, establishes a five-layer integrated framework for SA, and finally analyzes the critical technologies of SA. Especially in SDN SA, the situation detection guarantees the SDN observability by completing the information related to critical elements of the SDN, the situation comprehension facilitates the O&M quality by exploring the operating status and the potential information of SDN, and the situation projection assists O&M personnel in decision making by forecasting the future behavior of SDN components based on their operating status and the perceived information.
For the future perspectives in SDN SA, the scope of SA will be extended from SDN to underdeveloped distribution networks. Future studies will focus on the synergetic effect of personnel, equipment, events, and networks. With the advancement of intelligent algorithms, the improvement of SA operational efficiency will be one of the key research directions. Only a fast-response SA can assist in realizing the intelligent O&M of SDN. In addition, the proposed virtuous circle of SA and SDN is a significant element in the high-quality O&M, while proposing a proper SA effect evaluation method can prevent SDN from falling into a vicious circle. The critical techniques of SA will continue to expand as power demands change and SDN technology advances. We believe this paper can support the development and application of the future SDN SA system.

Author Contributions

Conceptualization, L.G. and Y.L. (Yuanliang Li, [email protected]); methodology, L.G. and Y.L. (Yuanliang Li, [email protected]); software, L.G. and J.Y.; validation, Y.S., J.Y. and L.G.; formal analysis, L.G. and Y.L. (Yuanliang Li, [email protected]); investigation, J.Y.; resources, L.G.; data curation, Y.S. and Y.L. (Yuanliang Li, [email protected]); writing—original draft preparation, Y.L. (Yuanliang Li, [email protected]); writing—review and editing, Y.L. (Yuanliang Li, [email protected]) and Y.L. (Yuanliang Li, [email protected]); visualization, L.G.; supervision, J.Y. and Y.L. (Yuanliang Li, [email protected]); project administration, Y.S.; funding acquisition, L.G. All authors have read and agreed to the published version of the manuscript.

Funding

This research was funded by the Science and Technology Project of State Grid Corporation of China, grant number 5100-202155018A-0-0-00, the National Natural Science Foundation of China, grant number 51807134, and the State Key Laboratory of Power System and Generation Equipment, grant number SKLD21KM10.

Institutional Review Board Statement

Not applicable.

Informed Consent Statement

Not applicable.

Data Availability Statement

Not applicable.

Conflicts of Interest

The authors declare no conflict of interest.

Abbreviations

ICTInformation and communication technologies
AMIAdvanced metering infrastructure
ADNActive distribution networks
SDNSmart distribution networks
DGsDistributed generations
SGSmart grid
RESRenewable energy sources
SCADASupervisory control and data acquisition
DMSDistribution management systems
EMSEnergy management systems
TTUTransformer terminal unit
FTUFeeder terminal unit
RTURemote terminal unit
DTUDistribution automation terminal
O&MOperation and maintenance
DTsDistribution transformers
IoTInternet of things
SASituation awareness
NNNeural network
ISRMInformation security risk management
FAFactor analysis
GWOGray wolf optimization
GRNNGeneralized regression neural network
PMUsPhasor measurement units
EVsElectric vehicles
FDIFalse data injection
DDoSDistributed denial of services
IETIntelligent edge terminal
PFCPower flow calculation
HSEHybrid state estimation
SMSsSmart monitoring systems
LVDCLow voltage direct current
RATCIRelatively available transmission capacity indicator
SNOPSoft normally open point
LSTMLong short-term memory
TD-LTETime-division long-term evolution

References

  1. Evangelopoulos, V.A.; Georgilakis, P.S.; Hatziargyriou, N.D. Optimal operation of smart distribution networks: A review of models, methods and future research. Electr. Power Syst. Res. 2016, 140, 95–106. [Google Scholar] [CrossRef]
  2. Gill, S.; Kockar, I.; Ault, G.W. Dynamic Optimal Power Flow for Active Distribution Networks. IEEE Trans. Power Syst. 2014, 29, 121–131. [Google Scholar] [CrossRef] [Green Version]
  3. Antoniadou-Plytaria, K.E.; Kouveliotis-Lysikatos, N.; Georgilakis, P.S.; Hatziargyriou, N.D. Distributed and Decentralized Voltage Control of Smart Distribution Networks: Models, Methods, and Future Research. IEEE Trans. Smart Grid 2017, 8, 2999–3008. [Google Scholar] [CrossRef]
  4. Shicong, M.A.; Bingyin, X.U.; Houlei, G.A.O.; Yongduan, X.U.E.; Jinghua, W. An Earth Fault Locating Method in Feeder Automation System by Examining Correlation of Transient Zero Mode Currents. Autom. Electr. Power Syst. 2008, 32, 48–52. [Google Scholar]
  5. Ruj, S.; Nayak, A. A Decentralized Security Framework for Data Aggregation and Access Control in Smart Grids. IEEE Trans. Smart Grid 2013, 4, 196–205. [Google Scholar] [CrossRef]
  6. Mansor, N.N.; Levi, V. Operational Planning of Distribution Networks Based on Utility Planning Concepts. IEEE Trans. Power Syst. 2019, 34, 2114–2127. [Google Scholar] [CrossRef] [Green Version]
  7. Meng, F.Y.; Bai, Y.; Jin, J.L. An advanced real-time dispatching strategy for a distributed energy system based on the reinforcement learning algorithm. Renew. Energy 2021, 178, 13–24. [Google Scholar] [CrossRef]
  8. Al Mhdawi, A.K.; Al-Raweshidy, H.S. A Smart Optimization of Fault Diagnosis in Electrical Grid Using Distributed Software-Defined IoT System. IEEE Syst. J. 2020, 14, 2780–2790. [Google Scholar] [CrossRef] [Green Version]
  9. Lv, C.; Sheng, W.X.; Liu, K.Y.; Dong, X.Z.; Deng, P. Multi-status modelling and event simulation in smart distribution network based on finite state machine. IET Gener. Transm. Distrib. 2019, 13, 2846–2855. [Google Scholar] [CrossRef]
  10. Kiaei, I.; Lotfifard, S. Fault Section Identification in Smart Distribution Systems Using Multi-Source Data Based on Fuzzy Petri Nets. IEEE Trans. Smart Grid 2020, 11, 74–83. [Google Scholar] [CrossRef]
  11. Ge, L.; Li, Y.; Chen, Y.; Cui, Q.; Ma, C. Key Technologies of Situation Awareness and Implementation Effectiveness Evaluation in Smart Distribution Network. Gaodianya Jishu/High Volt. Eng. 2021, 47, 2269–2280. [Google Scholar]
  12. Yin, J.; Lampert, A.; Cameron, M.; Robinson, B.; Power, R. Using Social Media to Enhance Emergency Situation Awareness. IEEE Intell. Syst. 2012, 27, 52–59. [Google Scholar] [CrossRef]
  13. Wang, S.; Liang, D.; Ge, L. Key Technologies of Situation Awareness and Orientation for Smart Distribution Systems. Autom. Electr. Power Syst. 2016, 40, 2–8. [Google Scholar]
  14. Dundes, A. On the psychology of legend. In American Folk Legend; University of California Press: Oakland, CA, USA, 2020; pp. 21–36. [Google Scholar]
  15. Lim, H.-R.; An, S. Intention to purchase wellbeing food among Korean consumers: An application of the Theory of Planned Behavior. Food Qual. Prefer. 2021, 88, 104101. [Google Scholar] [CrossRef]
  16. Ajzen, I. The theory of planned behavior. Organ. Behav. Hum. Decis. Processes 1991, 50, 179–211. [Google Scholar] [CrossRef]
  17. Luiza Neto, I.; Matsunaga, L.H.; Machado, C.C.; Gunther, H.; Hillesheim, D.; Pimentel, C.E.; Vargas, J.C.; D’Orsi, E. Psychological determinants of walking in a Brazilian sample: An application of the Theory of Planned Behavior. Transp. Res. Part F-Traffic Psychol. Behav. 2020, 73, 391–398. [Google Scholar] [CrossRef]
  18. Ge, L.J.; Li, Y.L.; Li, S.X.; Zhu, J.B.; Yan, J. Evaluation of the situational awareness effects for smart distribution networks under the novel design of indicator framework and hybrid weighting method. Front. Energy 2021, 15, 143–158. [Google Scholar] [CrossRef]
  19. McKeown, C. Designing for Situation Awareness: An Approach to User-Centered Design. Ergonomics 2013, 56, 727–728. [Google Scholar] [CrossRef]
  20. Gao, Y.; Li, D.S.; Cheng, Z.X. UAV Distributed Swarm Situation Awareness Model. J. Electron. Inf. Technol. 2018, 40, 1271–1278. [Google Scholar]
  21. Zhu, Q. Research on Road Traffic Situation Awareness System Based on Image Big Data. IEEE Intell. Syst. 2020, 35, 18–26. [Google Scholar] [CrossRef]
  22. Liu, X.W.; Yu, J.G.; Lv, W.F.; Yu, D.X.; Wang, Y.L.; Wu, Y. Network security situation: From awareness to awareness-control. J. Netw. Comput. Appl. 2019, 139, 15–30. [Google Scholar] [CrossRef]
  23. Anjaria, K.; Mishra, A. Relating Wiener’s cybernetics aspects and a situation awareness model implementation for information security risk management. Kybernetes 2018, 47, 58–79. [Google Scholar] [CrossRef]
  24. Mohammadfam, I.; Mahdinia, M.; Soltanzadeh, A.; Aliabadi, M.M.; Soltanian, A.R. A path analysis model of individual variables predicting safety behavior and human error: The mediating effect of situation awareness. Int. J. Ind. Ergon. 2021, 84, 103144. [Google Scholar] [CrossRef]
  25. Irwin, A.; Caruso, L.; Tone, I. Thinking Ahead of the Tractor: Driver Safety and Situation Awareness. J. Agromed. 2019, 24, 288–297. [Google Scholar] [CrossRef]
  26. Smirnova, O.V. Situation Awareness for Navigation Safety Control. Transnav-Int. J. Mar. Navig. Saf. Sea Transp. 2018, 12, 383–388. [Google Scholar] [CrossRef]
  27. Blandford, A.; Wong, B.L.W. Situation awareness in emergency medical dispatch. Int. J. Hum.-Comput. Stud. 2004, 61, 421–452. [Google Scholar] [CrossRef] [Green Version]
  28. Xiao, J.; Zhang, B.; Luo, F. Distribution Network Security Situation Awareness Method Based on Security Distance. IEEE Access 2019, 7, 37855–37864. [Google Scholar] [CrossRef]
  29. Espina, E.; Cardenas-Dobson, R.; Simpson-Porco, J.W.; Saez, D.; Kazerani, M. A Consensus-Based Secondary Control Strategy for Hybrid AC/DC Microgrids With Experimental Validation. IEEE Trans. Power Electron. 2021, 36, 5971–5984. [Google Scholar] [CrossRef]
  30. Wu, X.; Li, Y.; Tan, Y.; Cao, Y.; Rehtanz, C. Optimal energy management for the residential MES. IET Gener. Transm. Distrib. 2019, 13, 1786–1793. [Google Scholar] [CrossRef]
  31. Lv, Z.; Kong, W.; Zhang, X.; Jiang, D.; Lv, H.; Lu, X. Intelligent Security Planning for Regional Distributed Energy Internet. IEEE Trans. Ind. Inform. 2020, 16, 3540–3547. [Google Scholar] [CrossRef]
  32. Xu, C.; Liang, R.; Cheng, Z.; Xu, D. Security situation awareness of smart distribution grid for future energy internet. Electr. Power Autom. Equip. 2016, 36, 13–18. [Google Scholar]
  33. Ge, L.; Li, Y.; Xian, Y.; Wang, Y.; Liang, D.; Yan, J. A FA-GWO-GRNN Method for Short-Term Photovoltaic Output Prediction. In Proceedings of the 2020 IEEE Power and Energy Society General Meeting (PESGM), Montreal, QC, Canada, 2–6 August 2020. [Google Scholar]
  34. Song, I.K.; Yun, S.Y.; Kwon, S.C.; Kwak, N.H. Design of Smart Distribution Management System for Obtaining Real-Time Security Analysis and Predictive Operation in Korea. IEEE Trans. Smart Grid 2013, 4, 375–382. [Google Scholar] [CrossRef]
  35. Diez, D.; Romero, R.; Tena, S. Designing a Human Supervisory Control System for Smart Grid. IEEE Lat. Am. Trans. 2016, 14, 1899–1905. [Google Scholar] [CrossRef]
  36. Ge, L.; Li, Y.; Yan, J.; Wang, Y.; Zhang, N. Short-term Load Prediction of Integrated Energy System with Wavelet Neural Network Model Based on Improved Particle Swarm Optimization and Chaos Optimization Algorithm. J. Mod. Power Syst. Clean Energy 2021, 9, 1490–1499. [Google Scholar] [CrossRef]
  37. Choi, J.S.; Lee, S.; Chun, S.J. A Queueing Network Analysis of a Hierarchical Communication Architecture for Advanced Metering Infrastructure. IEEE Trans. Smart Grid 2021, 12, 4318–4326. [Google Scholar] [CrossRef]
  38. De Oliveira-De Jesus, P.M.; Rodriguez, N.A.; Celeita, D.F.; Ramos, G.A. PMU-Based System State Estimation for Multigrounded Distribution Systems. IEEE Trans. Power Syst. 2021, 36, 1071–1081. [Google Scholar] [CrossRef]
  39. Zhou, X.; Farivar, M.; Liu, Z.; Chen, L.; Low, S.H. Reverse and Forward Engineering of Local Voltage Control in Distribution Networks. IEEE Trans. Autom. Control 2021, 66, 1116–1128. [Google Scholar] [CrossRef]
  40. Mohammadrezaee, R.; Ghaisari, J.; Yousefi, G.; Kamali, M. Dynamic State Estimation of Smart Distribution Grids Using Compressed Measurements. IEEE Trans. Smart Grid 2021, 12, 4535–4542. [Google Scholar] [CrossRef]
  41. Taylor, Z.; Akhavan-Hejazi, H.; Cortez, E.; Alvarez, L.; Ula, S.; Barth, M.; Mohsenian-Rad, H. Customer-Side SCADA-Assisted Large Battery Operation Optimization for Distribution Feeder Peak Load Shaving. IEEE Trans. Smart Grid 2019, 10, 992–1004. [Google Scholar] [CrossRef] [Green Version]
  42. Ye, J.; Ge, X.; Mao, G.; Zhong, Y. 5G Ultradense Networks With Nonuniform Distributed Users. IEEE Trans. Veh. Technol. 2018, 67, 2660–2670. [Google Scholar] [CrossRef]
  43. Siirto, O.K.; Safdarian, A.; Lehtonen, M.; Fotuhi-Firuzabad, M. Optimal Distribution Network Automation Considering Earth Fault Events. IEEE Trans. Smart Grid 2015, 6, 1010–1018. [Google Scholar] [CrossRef]
  44. Wang, N.; Zhao, F. An Assessment of the Condition of Distribution Network Equipment Based on Large Data Fuzzy Decision-Making. Energies 2020, 13, 197. [Google Scholar] [CrossRef] [Green Version]
  45. Ding, D.; Han, Q.-L.; Ge, X.; Wang, J. Secure State Estimation and Control of Cyber-Physical Systems: A Survey. IEEE Trans. Syst. Man Cybern.-Syst. 2021, 51, 176–190. [Google Scholar] [CrossRef]
  46. Ledva, G.S.; Mathieu, J.L. Separating Feeder Demand Into Components Using Substation, Feeder, and Smart Meter Measurements. IEEE Trans. Smart Grid 2020, 11, 3280–3290. [Google Scholar] [CrossRef]
  47. Tao, X.L.; Liu, Y.; Zhao, F.; Yang, C.S.; Wang, Y. Graph database-based network security situation awareness data storage method. Eurasip J. Wirel. Commun. Netw. 2018, 2018, 294. [Google Scholar] [CrossRef] [Green Version]
  48. Wei, Y.P.; Wu, D.Z.; Terpenny, J. Robust Incipient Fault Detection of Complex Systems Using Data Fusion. IEEE Trans. Instrum. Meas. 2020, 69, 9526–9534. [Google Scholar] [CrossRef]
  49. Chen, K.; Mahfoud, R.J.; Sun, Y.; Nan, D.; Wang, K.; Alhelou, H.H.; Siano, P. Defect Texts Mining of Secondary Device in Smart Substation with GloVe and Attention-Based Bidirectional LSTM. Energies 2020, 13, 4522. [Google Scholar] [CrossRef]
  50. Xu, Y.; Wang, M.; Fan, W. Defect Data Association Analysis of the Secondary System Based on AFWA-H-Mine. Energies 2021, 14, 4228. [Google Scholar] [CrossRef]
  51. Tao, J.S.; Umair, M.; Ali, M.; Zhou, J. The Impact of Internet of Things Supported by Emerging 5G in Power Systems: A Review. CSEE J. Power Energy Syst. 2020, 6, 344–352. [Google Scholar]
  52. Reka, S.S.; Dragicevic, T.; Siano, P.; Prabaharan, S.R.S. Future Generation 5G Wireless Networks for Smart Grid: A Comprehensive Review. Energies 2019, 12, 2140. [Google Scholar]
  53. Basnet, M.; Ali, M.H. Exploring cybersecurity issues in 5G enabled electric vehicle charging station with deep learning. IET Gener. Transm. Distrib. 2021, 15, 3435–3449. [Google Scholar] [CrossRef]
  54. Ahmad, T.; Zhang, D.D. Using the internet of things in smart energy systems and networks. Sustain. Cities Soc. 2021, 68, 102783. [Google Scholar] [CrossRef]
  55. Strielkowski, W.; Dvorak, M.; Rovny, P.; Tarkhanova, E.; Baburina, N. 5G Wireless Networks in the Future Renewable Energy Systems. Front. Energy Res. 2021, 9, 654. [Google Scholar] [CrossRef]
  56. Maksimovic, M.; Forcan, M. 5G New Radio channel coding for messaging in Smart Grid. Sustain. Energy Grids Netw. 2021, 27, 100495. [Google Scholar] [CrossRef]
  57. Premsankar, G.; Piao, G.; Nicholson, P.K.; Di Francesco, M.; Lugones, D. Data-Driven Energy Conservation in Cellular Networks: A Systems Approach. IEEE Trans. Netw. Serv. Manag. 2021, 18, 3567–3582. [Google Scholar] [CrossRef]
  58. Ge, L.; Qin, Y.; Liu, J.; Bai, X. Virtual acquisition method of distributed photovoltaic data based on similarity day and BA-WNN. Electr. Power Autom. Equip. 2021, 41, 8–14. [Google Scholar]
  59. Yin, L.F.; Gao, Q.; Zhao, L.L.; Zhang, B.; Wang, T.; Li, S.Y.; Liu, H. A review of machine learning for new generation smart dispatch in power systems. Eng. Appl. Artif. Intell. 2020, 88, 103372. [Google Scholar] [CrossRef]
  60. Zhang, L.; Zhang, M.; Ji, W.; Fang, L.; Qin, Y.; Ge, L. Virtual Acquisition Method for Operation Data of Distributed PV Applying the Mixture of Grey Relational Theory and BP Neural Work. Electr. Power Constr. 2021, 42, 125–131. [Google Scholar]
  61. Rashed Mohassel, R.; Fung, A.; Mohammadi, F.; Raahemifar, K. A survey on Advanced Metering Infrastructure. Int. J. Electr. Power Energy Syst. 2014, 63, 473–484. [Google Scholar] [CrossRef] [Green Version]
  62. Dua, G.S.; Tyagi, B.; Kumar, V. A Novel Approach for Configuration Identification of Distribution Network Utilizing mu PMU Data. IEEE Trans. Ind. Appl. 2021, 57, 857–868. [Google Scholar] [CrossRef]
  63. Akrami, A.; Doostizadeh, M.; Aminifar, F. Optimal Reconfiguration of Distribution Network Using mu PMU Measurements: A Data-Driven Stochastic Robust Optimization. IEEE Trans. Smart Grid 2020, 11, 420–428. [Google Scholar] [CrossRef]
  64. Liu, J.; Zhang, M.; Ge, L.; Ji, W.; Wang, B.; Fang, L.; Zhang, W. Optimal Configuration Method of Photovoltaic Intelligent Edge Terminal Based on Improved Coyote Optimization Algorithm. Trans. China Electrotech. Soc. 2021, 36, 1368–1379. [Google Scholar]
  65. Yang, X.; Gu, C.; Yan, X.; Li, F. Reliability-Based Probabilistic Network Pricing With Demand Uncertainty. IEEE Trans. Power Syst. 2020, 35, 3342–3352. [Google Scholar] [CrossRef]
  66. Chen, S.; Li, P.; Ji, H.; Yu, H.; Yan, J.; Wu, J.; Wang, C. Operational flexibility of active distribution networks with the potential from data centers. Appl. Energy 2021, 293, 116935. [Google Scholar] [CrossRef]
  67. Huang, W.; Zheng, W.; Hill, D.J. Distribution Network Reconfiguration for Short-Term Voltage Stability Enhancement: An Efficient Deep Learning Approach. IEEE Trans. Smart Grid 2021, 12, 5385–5395. [Google Scholar] [CrossRef]
  68. DE Vasconcelos, F.M.; Santos Rocha, C.H.; Meschini Almeida, C.F.; Pereira, D.d.S.; Leite Rosa, L.H.; Kagan, N. Methodology for Inspection Scheduling in Power Distribution Networks Based on Power Quality Indexes. IEEE Trans. Power Deliv. 2021, 36, 1211–1221. [Google Scholar] [CrossRef]
  69. Ge, L.; Li, Y.; Zhu, X.; Zhou, Y.; Wang, T.; Yan, J. An Evaluation System for HVDC Protection Systems by a Novel Indicator Framework and a Self-Learning Combination Method. IEEE Access 2020, 8, 152053–152070. [Google Scholar] [CrossRef]
  70. Torbaghan, S.S.; Suryanarayana, G.; Hoschle, H.; D’Hulst, R.; Geth, F.; Caerts, C.; Van Hertem, D. Optimal Flexibility Dispatch Problem Using Second-Order Cone Relaxation of AC Power Flows. IEEE Trans. Power Syst. 2020, 35, 98–108. [Google Scholar] [CrossRef]
  71. Mohseni, M.; Joorabian, M.; Ara, A.L. Distribution system reconfiguration in presence of Internet of things. IET Gener. Transm. Distrib. 2021, 15, 1290–1303. [Google Scholar] [CrossRef]
  72. Gong, C.; Lin, F.; Gong, X.; Lu, Y. Intelligent Cooperative Edge Computing in Internet of Things. IEEE Internet Things J. 2020, 7, 9372–9382. [Google Scholar] [CrossRef]
  73. Liu, B.; Huang, Q.; Zhao, J.; Hu, W. A Computational Attractive Interval Power Flow Approach With Correlated Uncertain Power Injections. IEEE Trans. Power Syst. 2020, 35, 825–828. [Google Scholar] [CrossRef]
  74. Aghili, S.J.; Saghafi, H.; Hajian-Hoseinabadi, H. Uncertainty Analysis Using Fuzzy Transformation Method: An Application in Power-Flow Studies. IEEE Trans. Power Syst. 2020, 35, 42–52. [Google Scholar] [CrossRef]
  75. Wang, Z.W.; Shen, C.; Liu, F.; Gao, F. Analytical Expressions for Joint Distributions in Probabilistic Load Flow. IEEE Trans. Power Syst. 2017, 32, 2473–2474. [Google Scholar] [CrossRef]
  76. Liu, Q.; Wang, S.X.; Zhao, Q.Y.; Wang, K. Interval power flow calculation algorithm for multi-terminal dc distribution networks considering distributed generation output uncertainties. IET Gener. Transm. Distrib. 2021, 15, 986–996. [Google Scholar] [CrossRef]
  77. Yang, G.K.; Dong, P.; Liu, M.B.; Wu, H.Y. Research on random fuzzy power flow calculation of AC/DC hybrid distribution network based on unified iterative method. IET Renew. Power Gener. 2021, 15, 731–745. [Google Scholar] [CrossRef]
  78. Liu, H.; Tang, C.; Han, J.; Li, T.; Li, J.; Zhang, K. Probabilistic load flow analysis of active distribution network adopting improved sequence operation methodology. IET Gener. Transm. Distrib. 2017, 11, 2147–2153. [Google Scholar] [CrossRef]
  79. Dobakhshari, A.S.; Abdolmaleki, M.; Terzija, V.; Azizi, S. Robust Hybrid Linear State Estimator Utilizing SCADA and PMU Measurements. IEEE Trans. Power Syst. 2021, 36, 1264–1273. [Google Scholar] [CrossRef]
  80. Ruiz, S.; Ahmadi, H.; Gardašević, G.; Haddad, Y.; Katzis, K.; Grazioso, P.; Petrini, V.; Reichman, A.; Ozdemir, M.K.; Velez, F.; et al. Chapter 6—5G and beyond networks. In Inclusive Radio Communications for 5G and Beyond; Oestges, C., Quitin, F., Eds.; Academic Press: Salt Lake City, UT, USA, 2021; pp. 141–186. [Google Scholar]
  81. Ozsoy, B.; Gol, M. A Hybrid State Estimation Strategy with Optimal Use of Pseudo-Measurements. In Proceedings of the IEEE PES Innovative Smart Grid Technologies Conference Europe (ISGT-Europe), Sarajevo, Bosnia and Herzegovina, 21–25 October 2018. [Google Scholar]
  82. Kabiri, M.; Amjady, N. A New Hybrid State Estimation Considering Different Accuracy Levels of PMU and SCADA Measurements. IEEE Trans. Instrum. Meas. 2019, 68, 3078–3089. [Google Scholar] [CrossRef]
  83. Kong, X.Y.; Chen, Y.; Xu, T.; Wang, C.S.; Yong, C.S.; Li, P.; Yu, L. A Hybrid State Estimator Based on SCADA and PMU Measurements for Medium Voltage Distribution System. Appl. Sci. 2018, 8, 1527. [Google Scholar] [CrossRef] [Green Version]
  84. Xiao, F.; Xia, Y.J.; Zhou, Y.B.; Zhou, K.P.; Zhang, Z.; Yin, X.G. Comprehensive reliability assessment of smart distribution networks considering centralized distribution protection system. IEEJ Trans. Electr. Electron. Eng. 2020, 15, 40–50. [Google Scholar] [CrossRef]
  85. Alves, G.; Marques, D.; Silva, I.; Guedes, L.A.; da Silva, M.D. A Methodology for Dependability Evaluation of Smart Grids. Energies 2019, 12, 1817. [Google Scholar] [CrossRef] [Green Version]
  86. Honarmand, M.E.; Ghazizadeh, M.S.; Hosseinnezhad, V.; Siano, P. Reliability modeling of process-oriented smart monitoring in the distribution systems. Int. J. Electr. Power Energy Syst. 2019, 109, 20–28. [Google Scholar] [CrossRef]
  87. Xue, P.; Xiang, Y.; Gou, J.; Xu, W.T.; Sun, W.; Jiang, Z.Z.; Jawad, S.; Zhao, H.J.; Liu, J.Y. Impact of Large-Scale Mobile Electric Vehicle Charging in Smart Grids: A Reliability Perspective. Front. Energy Res. 2021, 9, 241. [Google Scholar] [CrossRef]
  88. Khavari, S.; Dashti, R.; Shaker, H.R.; Santos, A. High Impedance Fault Detection and Location in Combined Overhead Line and Underground Cable Distribution Networks Equipped with Data Loggers. Energies 2020, 13, 2331. [Google Scholar] [CrossRef]
  89. Gilanifar, M.; Cordova, J.; Wang, H.; Stifter, M.; Ozguven, E.E.; Strasser, T.I.; Arghandeh, R. Multi-Task Logistic Low-Ranked Dirty Model for Fault Detection in Power Distribution System. IEEE Trans. Smart Grid 2020, 11, 786–796. [Google Scholar] [CrossRef]
  90. Mohanty, R.; Balaji, U.S.M.; Pradhan, A.K. An Accurate Noniterative Fault-Location Technique for Low-Voltage DC Microgrid. IEEE Trans. Power Deliv. 2016, 31, 475–481. [Google Scholar] [CrossRef]
  91. Jia, K.; Li, M.; Bi, T.; Yang, Q. A voltage resonance-based single-ended online fault location algorithm for DC distribution networks. Sci. China-Technol. Sci. 2016, 59, 721–729. [Google Scholar] [CrossRef]
  92. Wang, D.; Psaras, V.; Emhemed, A.A.S.; Burt, G.M. A Novel Fault Let-Through Energy Based Fault Location for LVDC Distribution Networks. IEEE Trans. Power Deliv. 2021, 36, 966–974. [Google Scholar] [CrossRef]
  93. Sadeghi, S.E.; Foroud, A.A. A new approach for static voltage stability assessment in distribution networks. Int. Trans. Electr. Energy Syst. 2020, 30, e12203. [Google Scholar] [CrossRef]
  94. Hu, S.; Xiang, Y.; Zhang, X.; Liu, J.Y.; Wang, R.; Hong, B.W. Reactive power operability of distributed energy resources for voltage stability of distribution networks. J. Mod. Power Syst. Clean Energy 2019, 7, 851–861. [Google Scholar] [CrossRef] [Green Version]
  95. Abbasi, S.M.; Karbalaei, F.; Badri, A. The Effect of Suitable Network Modeling in Voltage Stability Assessment. IEEE Trans. Power Syst. 2019, 34, 1650–1652. [Google Scholar] [CrossRef]
  96. Song, Y.; Hill, D.J.; Liu, T. Static Voltage Stability Analysis of Distribution Systems Based on Network-Load Admittance Ratio. IEEE Trans. Power Syst. 2019, 34, 2270–2280. [Google Scholar] [CrossRef]
  97. Fonteijn, R.; van Amstel, M.; Nguyen, P.; Morren, J.; Bonnema, G.M.; Slootweg, H. Evaluating flexibility values for congestion management in distribution networks within Dutch pilots. J. Eng. -Joe 2019, 2019, 5158–5162. [Google Scholar] [CrossRef]
  98. Ge, S.Y.; Xu, Z.Y.; Liu, H.; Gu, C.H.; Li, F.R. Flexibility evaluation of active distribution networks considering probabilistic characteristics of uncertain variables. IET Gener. Transm. Distrib. 2019, 13, 3148–3157. [Google Scholar] [CrossRef]
  99. Chen, Y.W.; Sun, J.J.; Zha, X.M.; Yang, Y.H.; Xu, F. A Novel Node Flexibility Evaluation Method of Active Distribution Network for SNOP Integration. IEEE J. Emerg. Sel. Top. Circuits Syst. 2021, 11, 188–198. [Google Scholar] [CrossRef]
  100. Liu, X.O. Research on Flexibility Evaluation Method of Distribution System Based on Renewable Energy and Electric Vehicles. IEEE Access 2020, 8, 109249–109265. [Google Scholar] [CrossRef]
  101. Guo, X.H.; Li, Y.; Wang, S.Y.; Cao, Y.J.; Zhang, M.M.; Zhou, Y.C.; Yosuke, N. A Comprehensive Weight-Based Severity Evaluation Method of Voltage Sag in Distribution Networks. Energies 2021, 14, 6434. [Google Scholar] [CrossRef]
  102. Amini, M.; Jalilian, A.; Behbahani, M.R.P. A new method for evaluation of harmonic distortion in reconfiguration of distribution network. Int. Trans. Electr. Energy Syst. 2020, 30, e12370. [Google Scholar] [CrossRef]
  103. Lamedica, R.; Ruvio, A.; Ribeiro, P.F.; Regoli, M. A Simulink model to assess harmonic distortion in MV/LV distribution networks with time-varying non linear loads. Simul. Model. Pract. Theory 2019, 90, 64–80. [Google Scholar] [CrossRef]
  104. Bajaj, M.; Singh, A.K. An analytic hierarchy process-based novel approach for benchmarking the power quality performance of grid-integrated renewable energy systems. Electr. Eng. 2020, 102, 1153–1173. [Google Scholar] [CrossRef]
  105. Du, S.; Li, T.; Yang, Y.; Horng, S.-J. Deep Air Quality Forecasting Using Hybrid Deep Learning Framework. IEEE Trans. Knowl. Data Eng. 2021, 33, 2412–2424. [Google Scholar] [CrossRef] [Green Version]
  106. Chen, L.; Li, M.; Su, W.; Wu, M.; Hirota, K.; Pedrycz, W. Adaptive Feature Selection-Based AdaBoost-KNN With Direct Optimization for Dynamic Emotion Recognition in HumanRobot Interaction. IEEE Trans. Emerg. Top. Comput. Intell. 2021, 5, 205–213. [Google Scholar] [CrossRef]
  107. Azizivahed, A.; Arefi, A.; Ghavidel, S.; Shafie-khah, M.; Li, L.; Zhang, J.; Catalao, J.P.S. Energy Management Strategy in Dynamic Distribution Network Reconfiguration Considering Renewable Energy Resources and Storage. IEEE Trans. Sustain. Energy 2020, 11, 662–673. [Google Scholar] [CrossRef]
  108. Viet Thang, T.; Islam, M.R.; Muttaqi, K.M.; Sutanto, D. An Efficient Energy Management Approach for a Solar-Powered EV Battery Charging Facility to Support Distribution Grids. IEEE Trans. Ind. Appl. 2019, 55, 6517–6526. [Google Scholar]
  109. Liang, J.; Jing, T.; Niu, H.; Wang, J. Two-Terminal Fault Location Method of Distribution Network Based on Adaptive Convolution Neural Network. IEEE Access 2020, 8, 54035–54043. [Google Scholar] [CrossRef]
  110. Kong, W.; Ma, K.; Wu, Q. Three-Phase Power Imbalance Decomposition Into Systematic Imbalance and Random Imbalance. IEEE Trans. Power Syst. 2018, 33, 3001–3012. [Google Scholar] [CrossRef] [Green Version]
  111. Sun, M.; Demirtas, S.; Sahinoglu, Z. Joint Voltage and Phase Unbalance Detector for Three Phase Power Systems. IEEE Signal Processing Lett. 2013, 20, 11–14. [Google Scholar] [CrossRef]
  112. Li, H.; Shi, C.; Liu, X.; Wulamu, A.; Yang, A. Three-Phase Unbalance Prediction of Electric Power Based on Hierarchical Temporal Memory. Cmc-Comput. Mater. Contin. 2020, 64, 987–1004. [Google Scholar] [CrossRef]
  113. Han, P.; Pan, W.; Zhang, N.; Wu, H.; Qiu, R.; Zhang, Z. Optimization Method for Artificial Phase Sequence Based on Load Forecasting and Non -dominated Sorting Genetic Algorithm. Autom. Electr. Power Syst. 2020, 44, 71–80. [Google Scholar]
  114. Zhou, W.; Ardakanian, O.; Zhang, H.T.; Yuan, Y. Bayesian Learning-Based Harmonic State Estimation in Distribution Systems With Smart Meter and DPMU Data. IEEE Trans. Smart Grid 2020, 11, 832–845. [Google Scholar] [CrossRef]
  115. Wang, K.; Qi, X.; Liu, H. A comparison of day-ahead photovoltaic power forecasting models based on deep learning neural network. Appl. Energy 2019, 251, 113315. [Google Scholar] [CrossRef]
  116. Cui, C.; Zou, Y.; Wei, L.; Wang, Y. Evaluating combination models of solar irradiance on inclined surfaces and forecasting photovoltaic power generation. IET Smart Grid 2019, 2, 123–130. [Google Scholar] [CrossRef]
  117. Ogliari, E.; Dolara, A.; Manzolini, G.; Leva, S. Physical and hybrid methods comparison for the day ahead PV output power forecast. Renew. Energy 2017, 113, 11–21. [Google Scholar] [CrossRef]
  118. Ge, L.; Xian, Y.; Yan, J.; Wang, B.; Wang, Z. A Hybrid Model for Short-term PV Output Forecasting Based on PCA-GWO-GRNN. J. Mod. Power Syst. Clean Energy 2020, 8, 1268–1275. [Google Scholar] [CrossRef]
  119. Wang, X.; Li, P.; Yang, J. Short-term wind power forecasting based on two-stage attention mechanism. IET Renew. Power Gener. 2020, 14, 297–304. [Google Scholar]
  120. Chen, Y.; Li, T.; Zhao, C.; Wei, W. Decentralized Provision of Renewable Predictions Within a Virtual Power Plant. IEEE Trans. Power Syst. 2021, 36, 2652–2662. [Google Scholar] [CrossRef]
  121. Peng, X.; Xu, Q.; Wang, H.; Lang, J.; Li, W.; Cai, T.; Duan, S.; Xie, Y.; Li, C. A Novel Efficient DLUBE Model Constructed by Error Interval Coefficients for Clustered Wind Power Prediction. IEEE Access 2021, 9, 61739–61751. [Google Scholar] [CrossRef]
  122. Yang, M.; Lin, Y.; Han, X. Probabilistic Wind Generation Forecast Based on Sparse Bayesian Classification and Dempster-Shafer Theory. IEEE Trans. Ind. Appl. 2016, 52, 1998–2005. [Google Scholar] [CrossRef]
  123. Zhao, Y.; Liu, P.; Wang, Z.; Zhang, L.; Hong, J. Fault and defect diagnosis of battery for electric vehicles based on big data analysis methods. Appl. Energy 2017, 207, 354–362. [Google Scholar] [CrossRef]
  124. Dong, G.; Chen, Z.; Wei, J.; Zhang, C.; Wang, P. An online model-based method for state of energy estimation of lithium-ion batteries using dual filters. J. Power Sources 2016, 301, 277–286. [Google Scholar] [CrossRef]
  125. Zhang, Y.; Xiong, R.; He, H.; Shen, W. Lithium-Ion Battery Pack State of Charge and State of Energy Estimation Algorithms Using a Hardware-in-the-Loop Validation. IEEE Trans. Power Electron. 2017, 32, 4421–4431. [Google Scholar] [CrossRef]
  126. Mao, T.; Yao, J.; Xin, J.; Kang, T.; Deng, D.; Zhao, J. Intelligent Overhaul and Safety Check Management System of 110 kV Distribution Network. Autom. Electr. Power Syst. 2013, 37, 125–129. [Google Scholar]
  127. Fu, J.; Nunez, A.; De Schutter, B. A Short-Term Preventive Maintenance Scheduling Method for Distribution Networks With Distributed Generators and Batteries. IEEE Trans. Power Syst. 2021, 36, 2516–2531. [Google Scholar] [CrossRef]
  128. Yongmei, L.I.U.; Wanxing, S. Optimization Model for Distribution Equipment Maintenance Scheduling Based on Network Topology and Genetic Algorithm. Power Syst. Technol. 2007, 31, 11–15. [Google Scholar]
  129. Dashti, R.; Daisy, M.; Mirshekali, H.; Shaker, H.R.; Aliabadi, M.H. A survey of fault prediction and location methods in electrical energy distribution networks. Measurement 2021, 184, 109947. [Google Scholar] [CrossRef]
  130. Stephen, B.; Jiang, X.; McArthur, S.D.J. Extracting Distribution Network Fault Semantic Labels From Free Text Incident Tickets. IEEE Trans. Power Deliv. 2020, 35, 1610–1613. [Google Scholar] [CrossRef] [Green Version]
  131. Tsioumpri, E.; Stephen, B.; McArthur, S.D.J. Weather Related Fault Prediction in Minimally Monitored Distribution Networks. Energies 2021, 14, 2053. [Google Scholar] [CrossRef]
  132. Shakila, B.; Tuithung, T. Security Enhancement in Smart Distribution Grid with Light-Weight Dynamic Key Encryption. J. Sci. Ind. Res. 2019, 78, 847–851. [Google Scholar]
  133. Chen, L.; Dong, X.; Wu, Z.; Liu, Z.; Chen, B. Security Analysis and Access Protection of Power Distribution Wireless Private TD-LTE Network. In Proceedings of the China International Conference on Electricity Distribution (CICED), Xi’an, China, 10–13 August 2016. [Google Scholar]
  134. Yajing, L.; Fengjie, S.; Shengjin, L.; Fang, L. Research on security isolation method for wireless public network oriented to smart power distribution service. In Proceedings of the 4th IEEE International Conference on Computer and Communications (ICCC), Chengdu, China, 7–10 December 2018; Institute of Electrical and Electronics Engineers Inc.: Chengdu, China, 2018; pp. 1160–1165. [Google Scholar]
  135. Tao, J.; Michailidis, G. A Statistical Framework for Detecting Electricity Theft Activities in Smart Grid Distribution Networks. IEEE J. Sel. Areas Commun. 2020, 38, 205–216. [Google Scholar] [CrossRef]
Figure 1. A 5-layer comprehensive framework of SDN SA.
Energies 15 00828 g001
Figure 2. The implementation framework of situation detection.
Energies 15 00828 g002
Figure 3. The implementation framework of situation comprehension.
Energies 15 00828 g003
Figure 4. The implementation framework of situation projection.
Energies 15 00828 g004
Publisher’s Note: MDPI stays neutral with regard to jurisdictional claims in published maps and institutional affiliations.

