
Evaluating the Effect of New Gas Solubility and Bubble Point Pressure Models on PVT Parameters and Optimizing Injected Gas Rate in Gas-Lift Dual Gradient Drilling


Abstract
:
1. Introduction
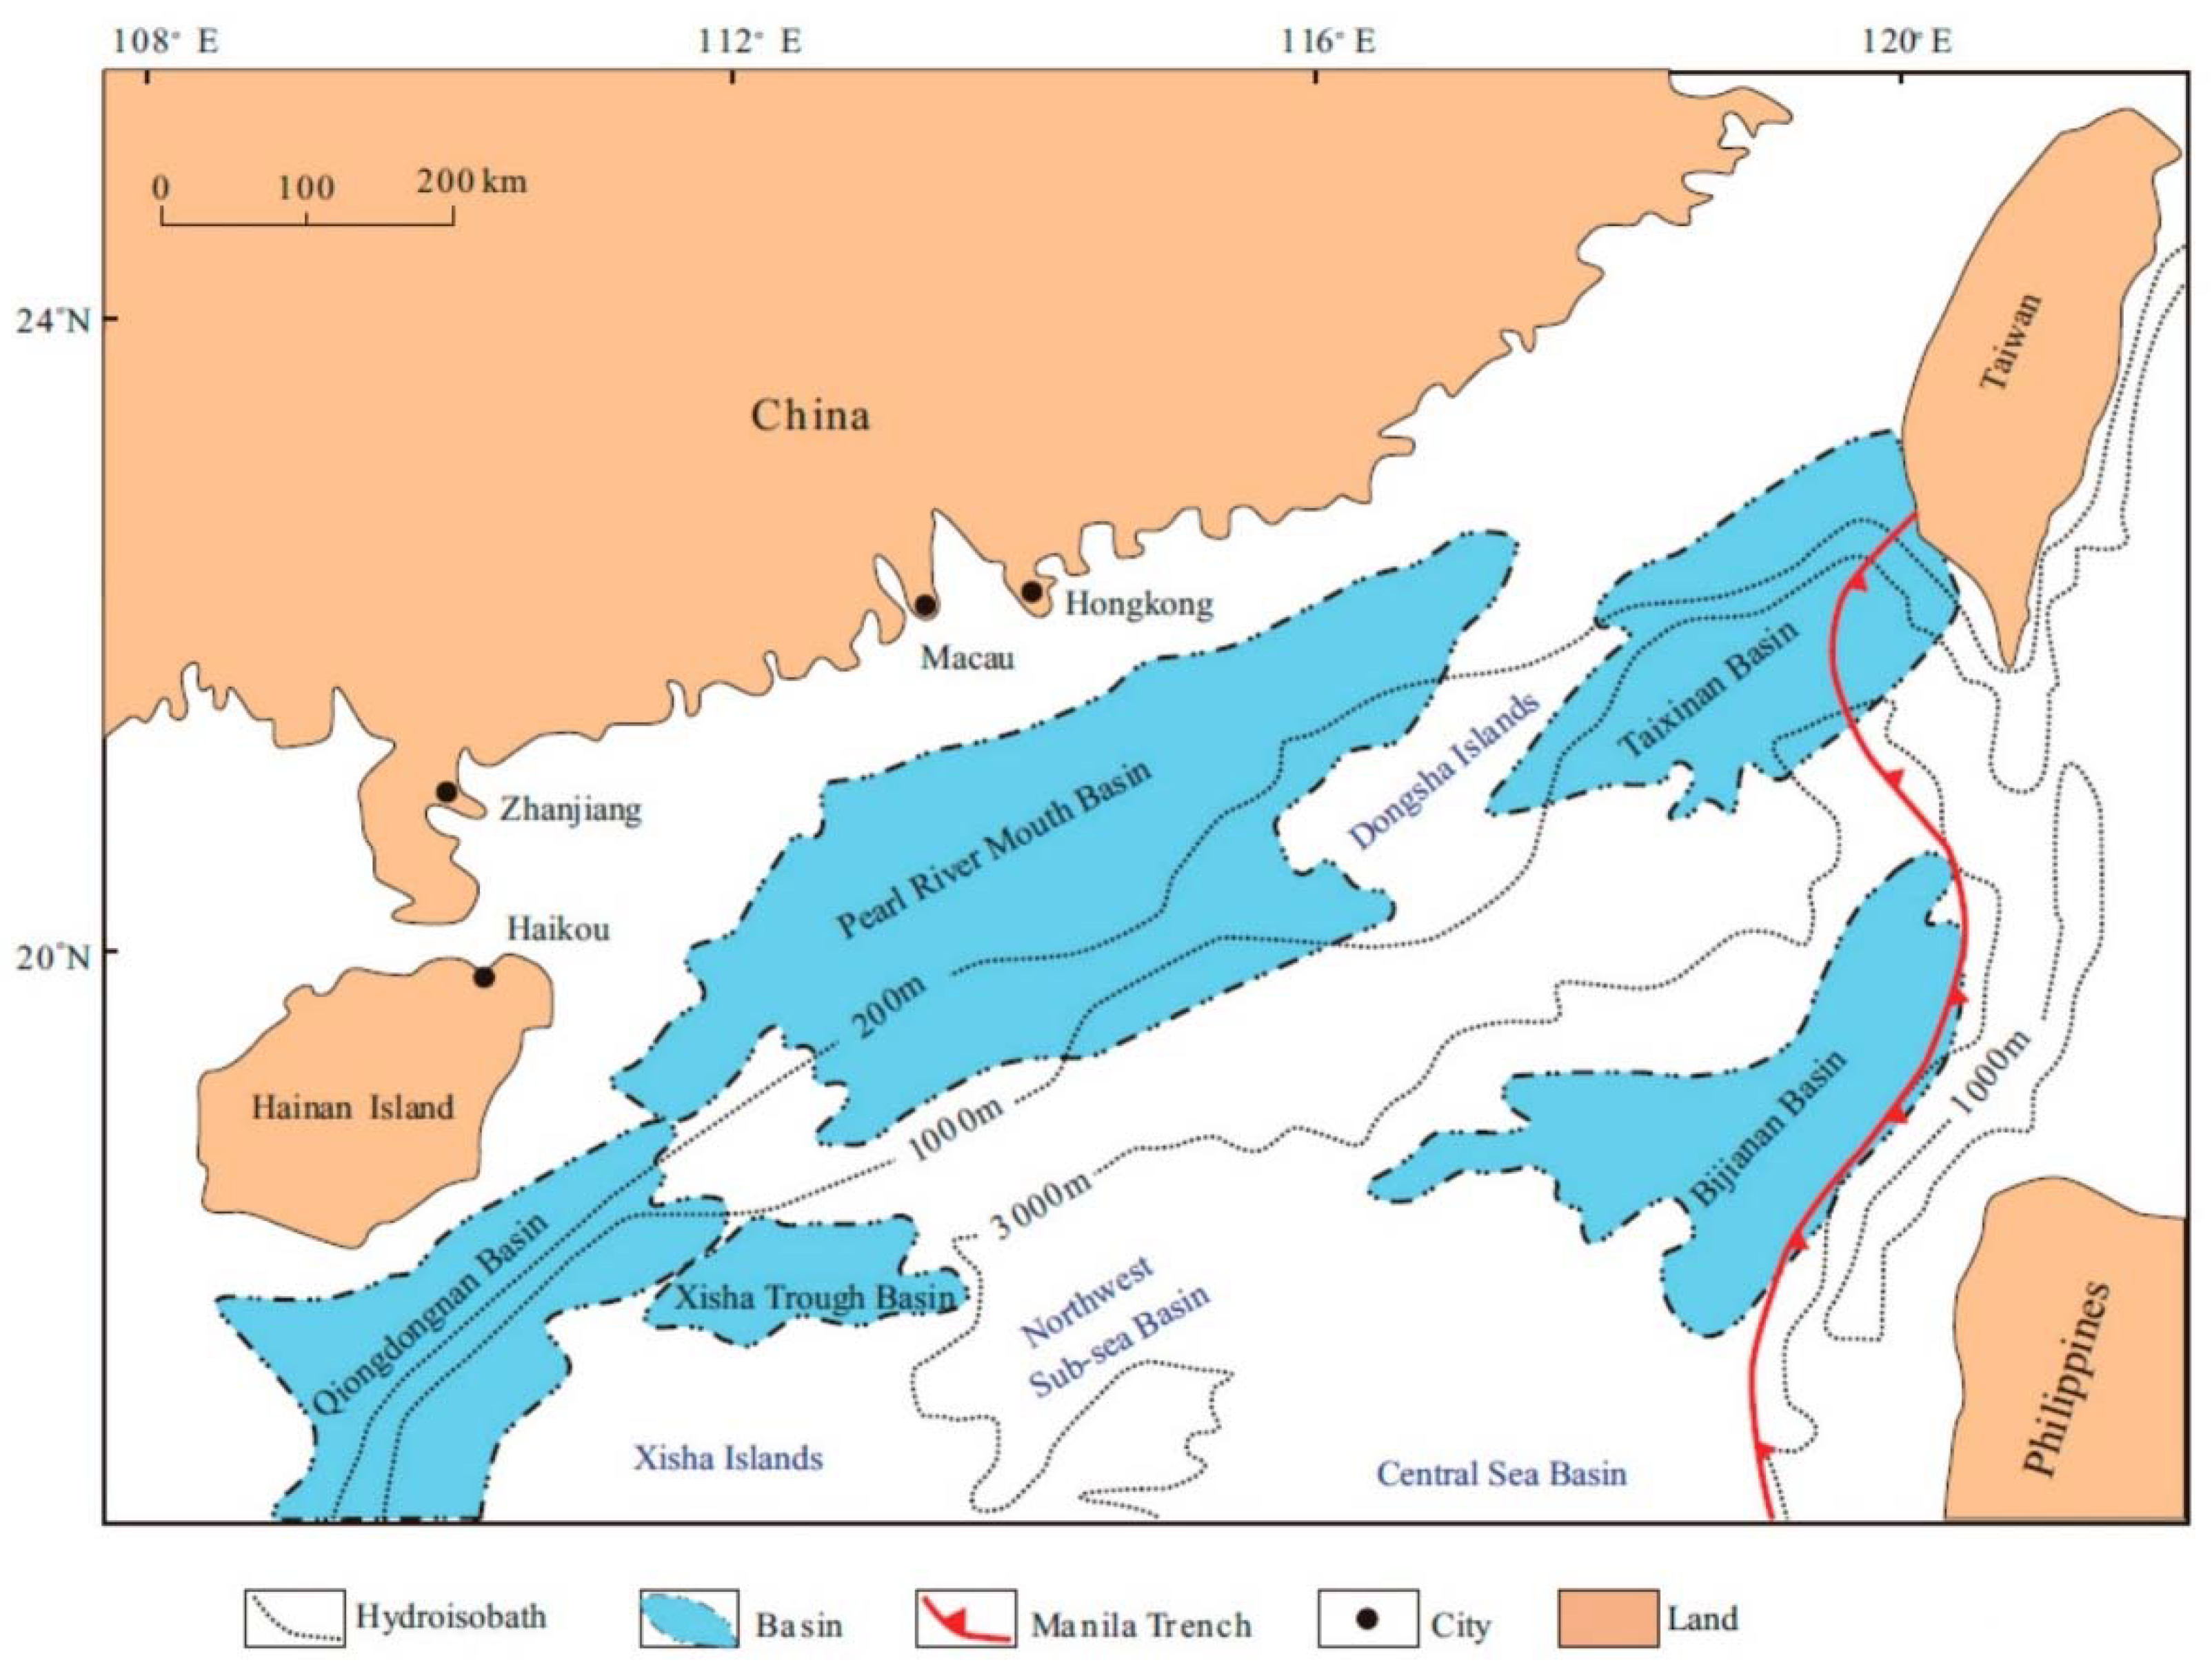
2. Study Area
3. Materials and Methods: PVT of Two-Phase Flow
3.1. Two-Phase Flow Pressure
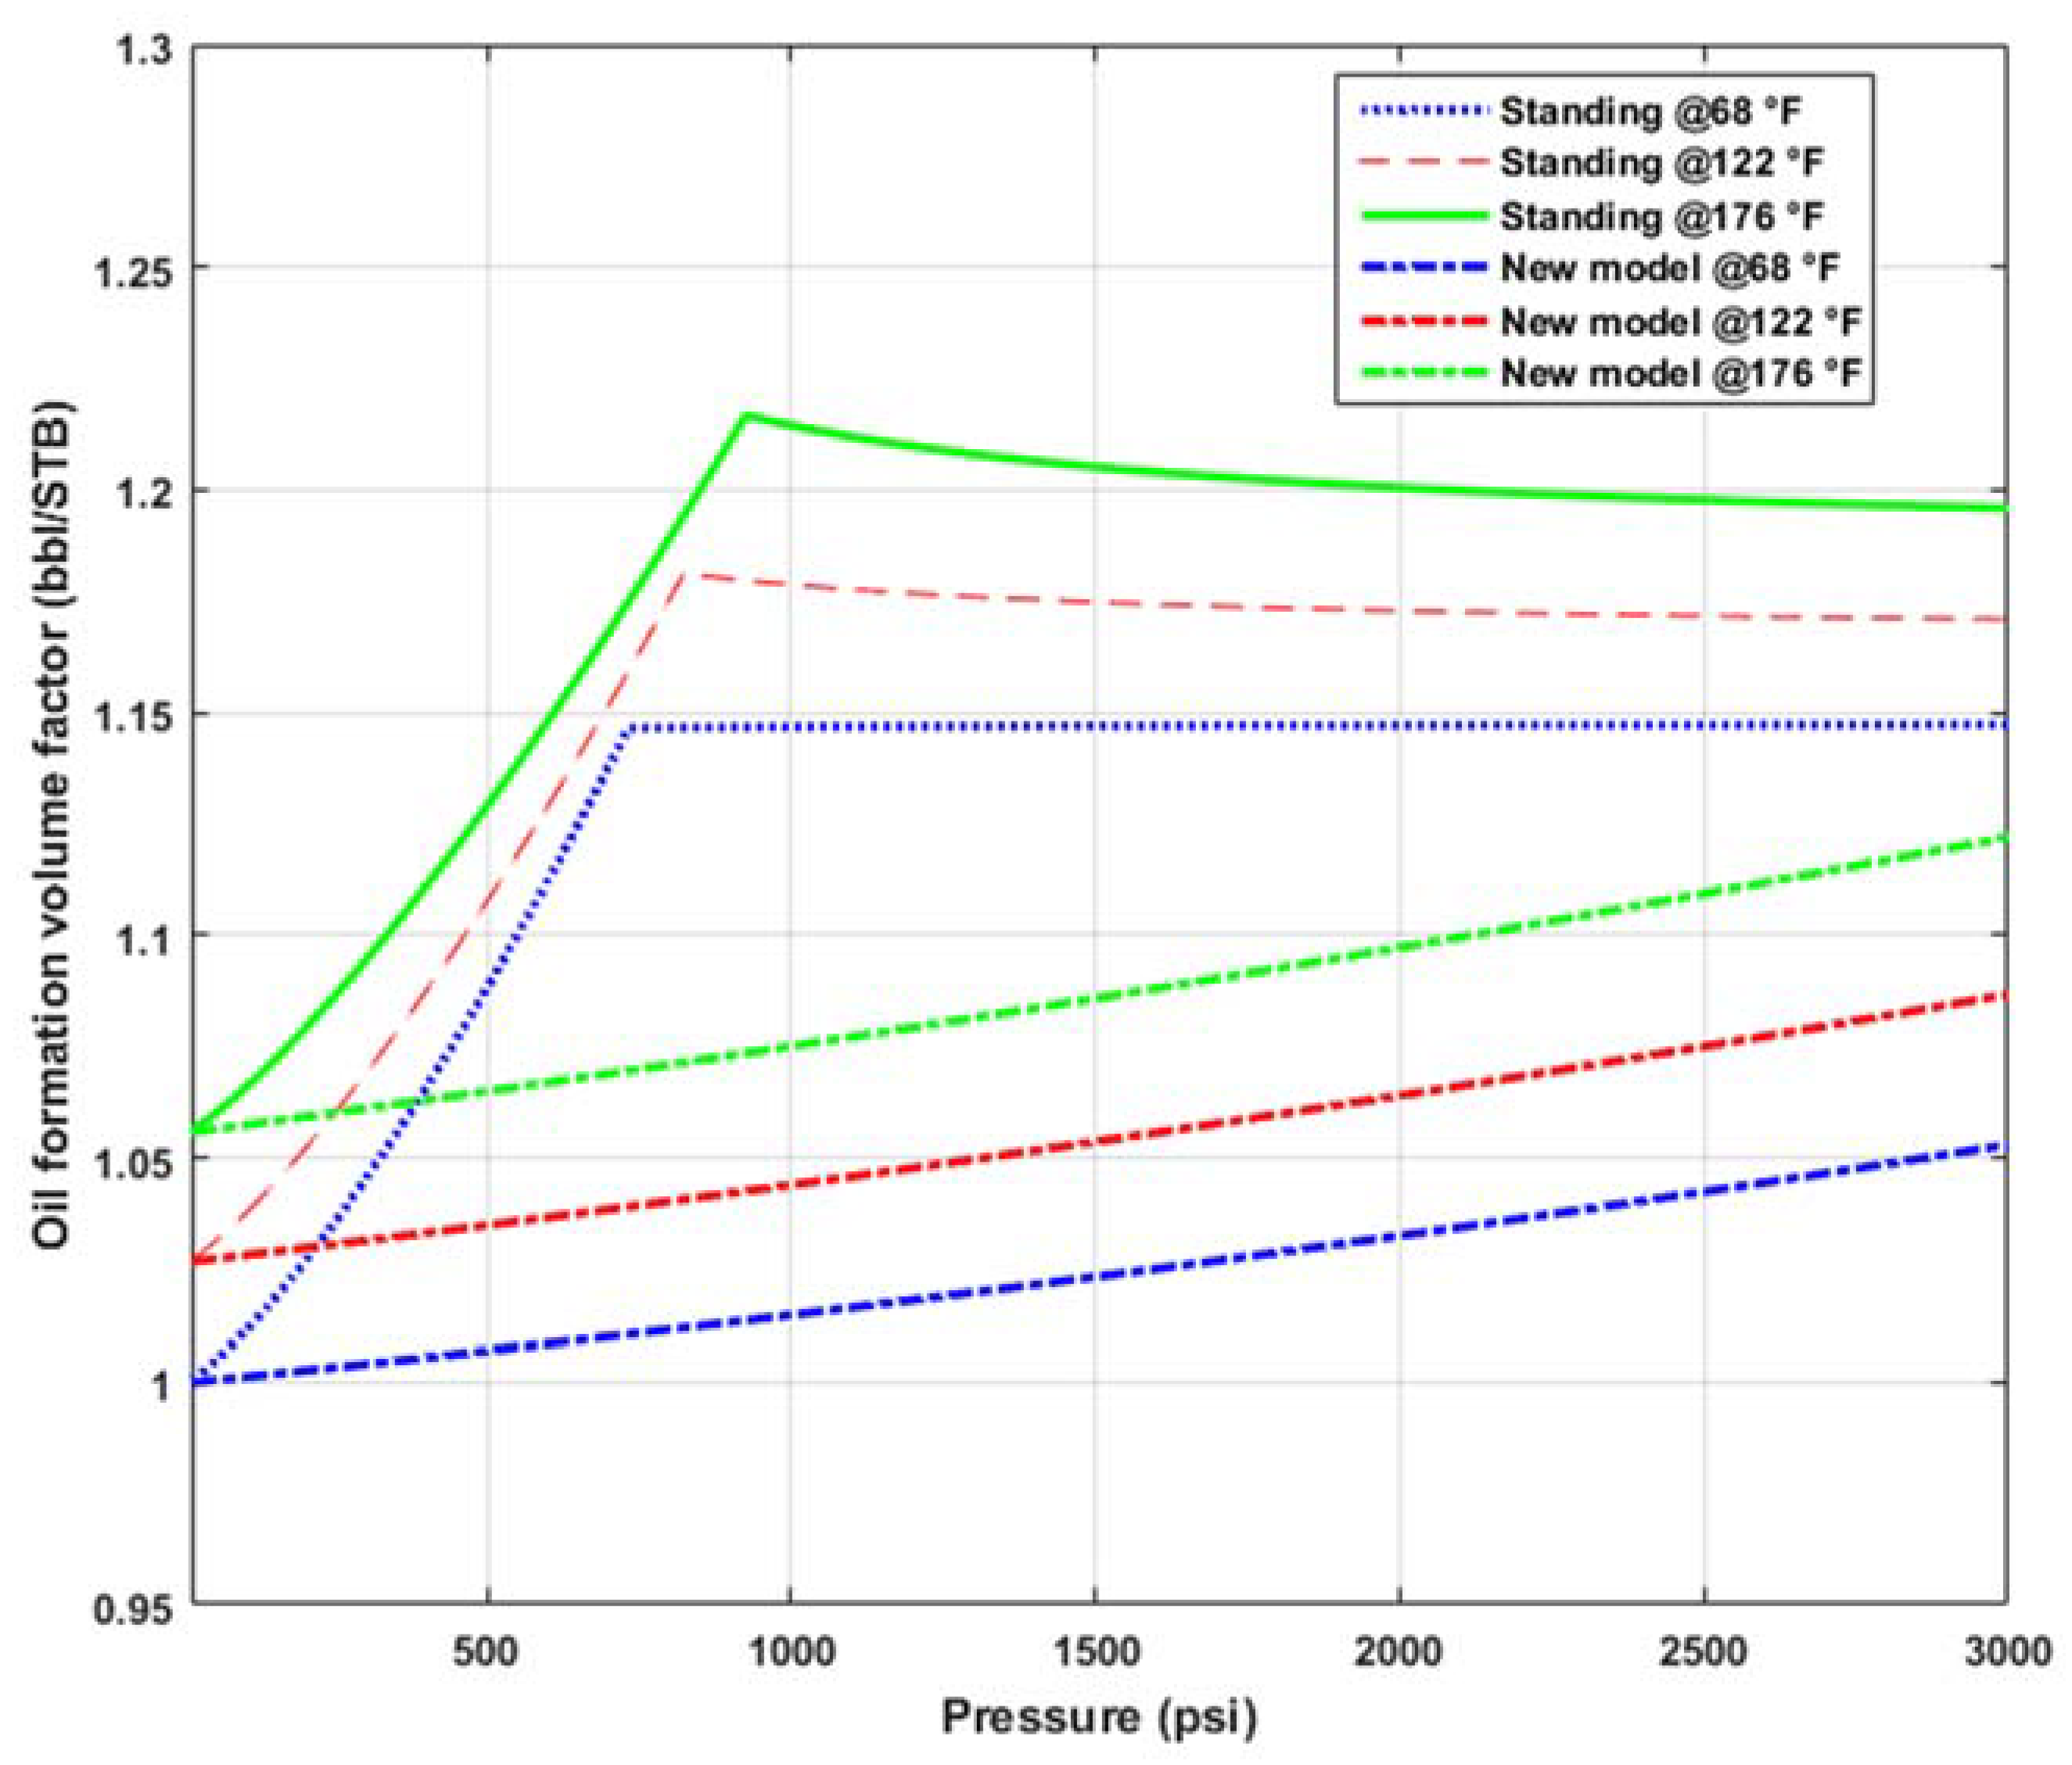
3.2. Determination of Formation Volume Factor (FVF)
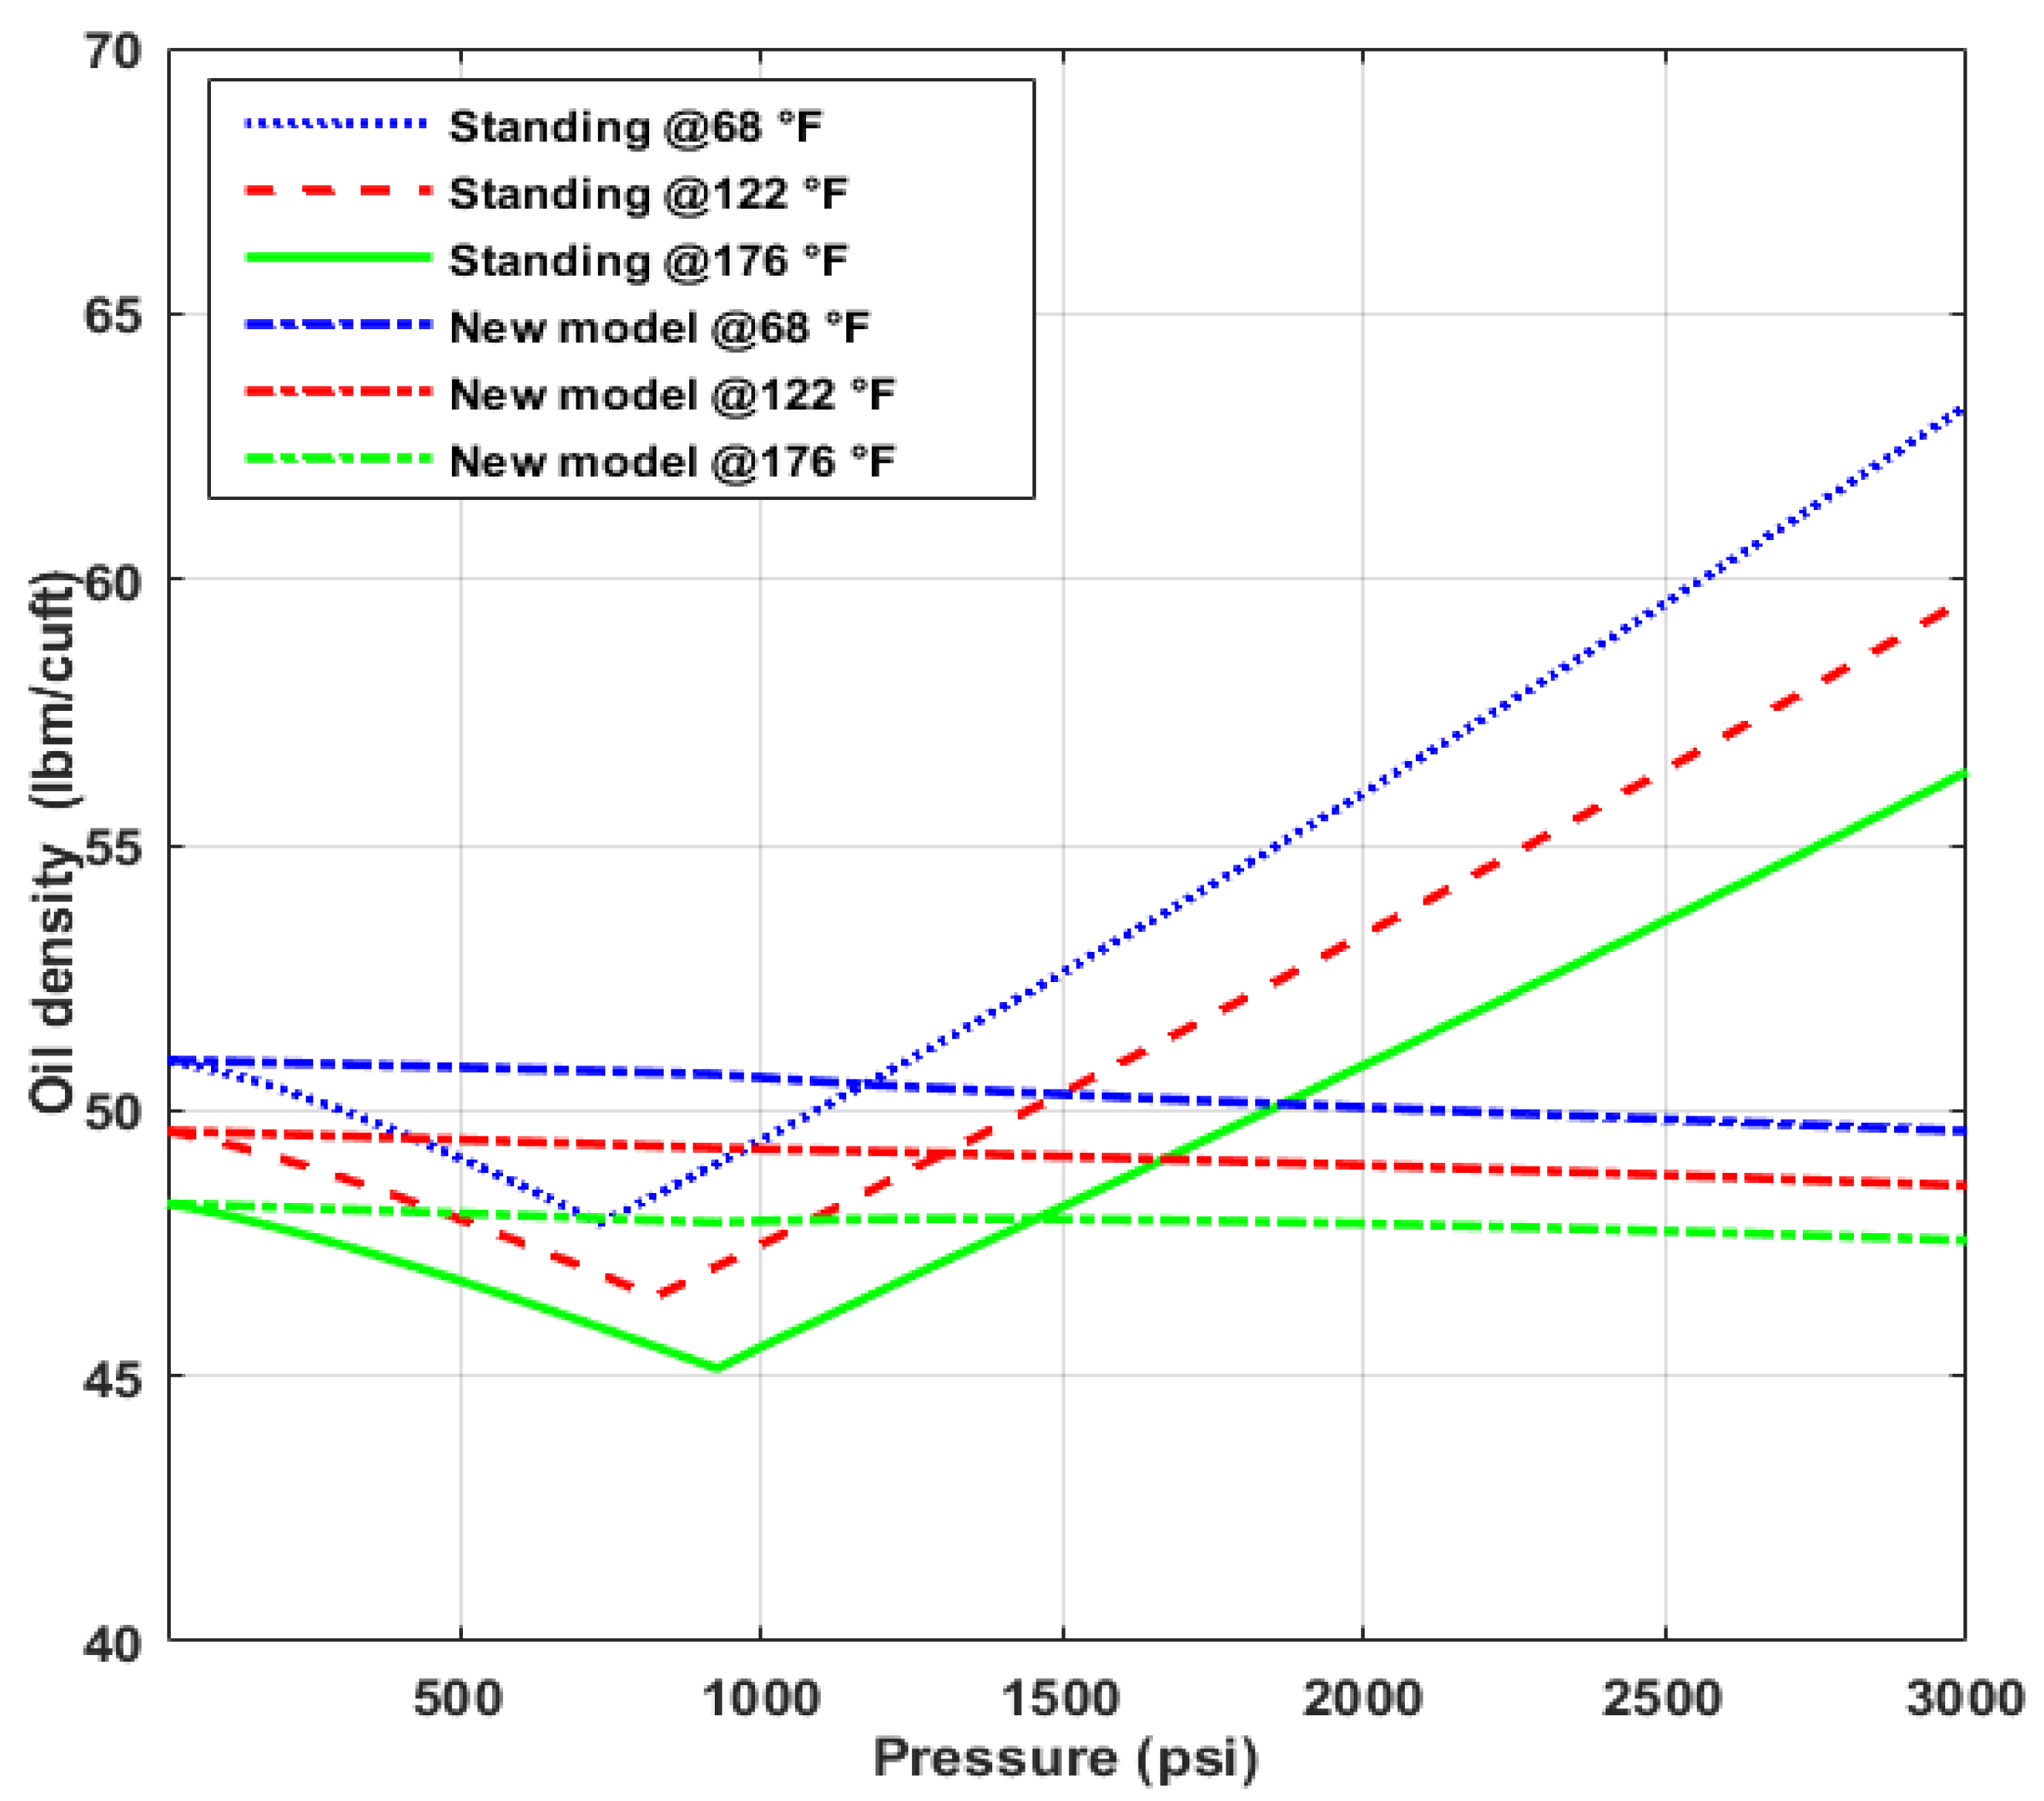
3.3. Determination of Mixture Density
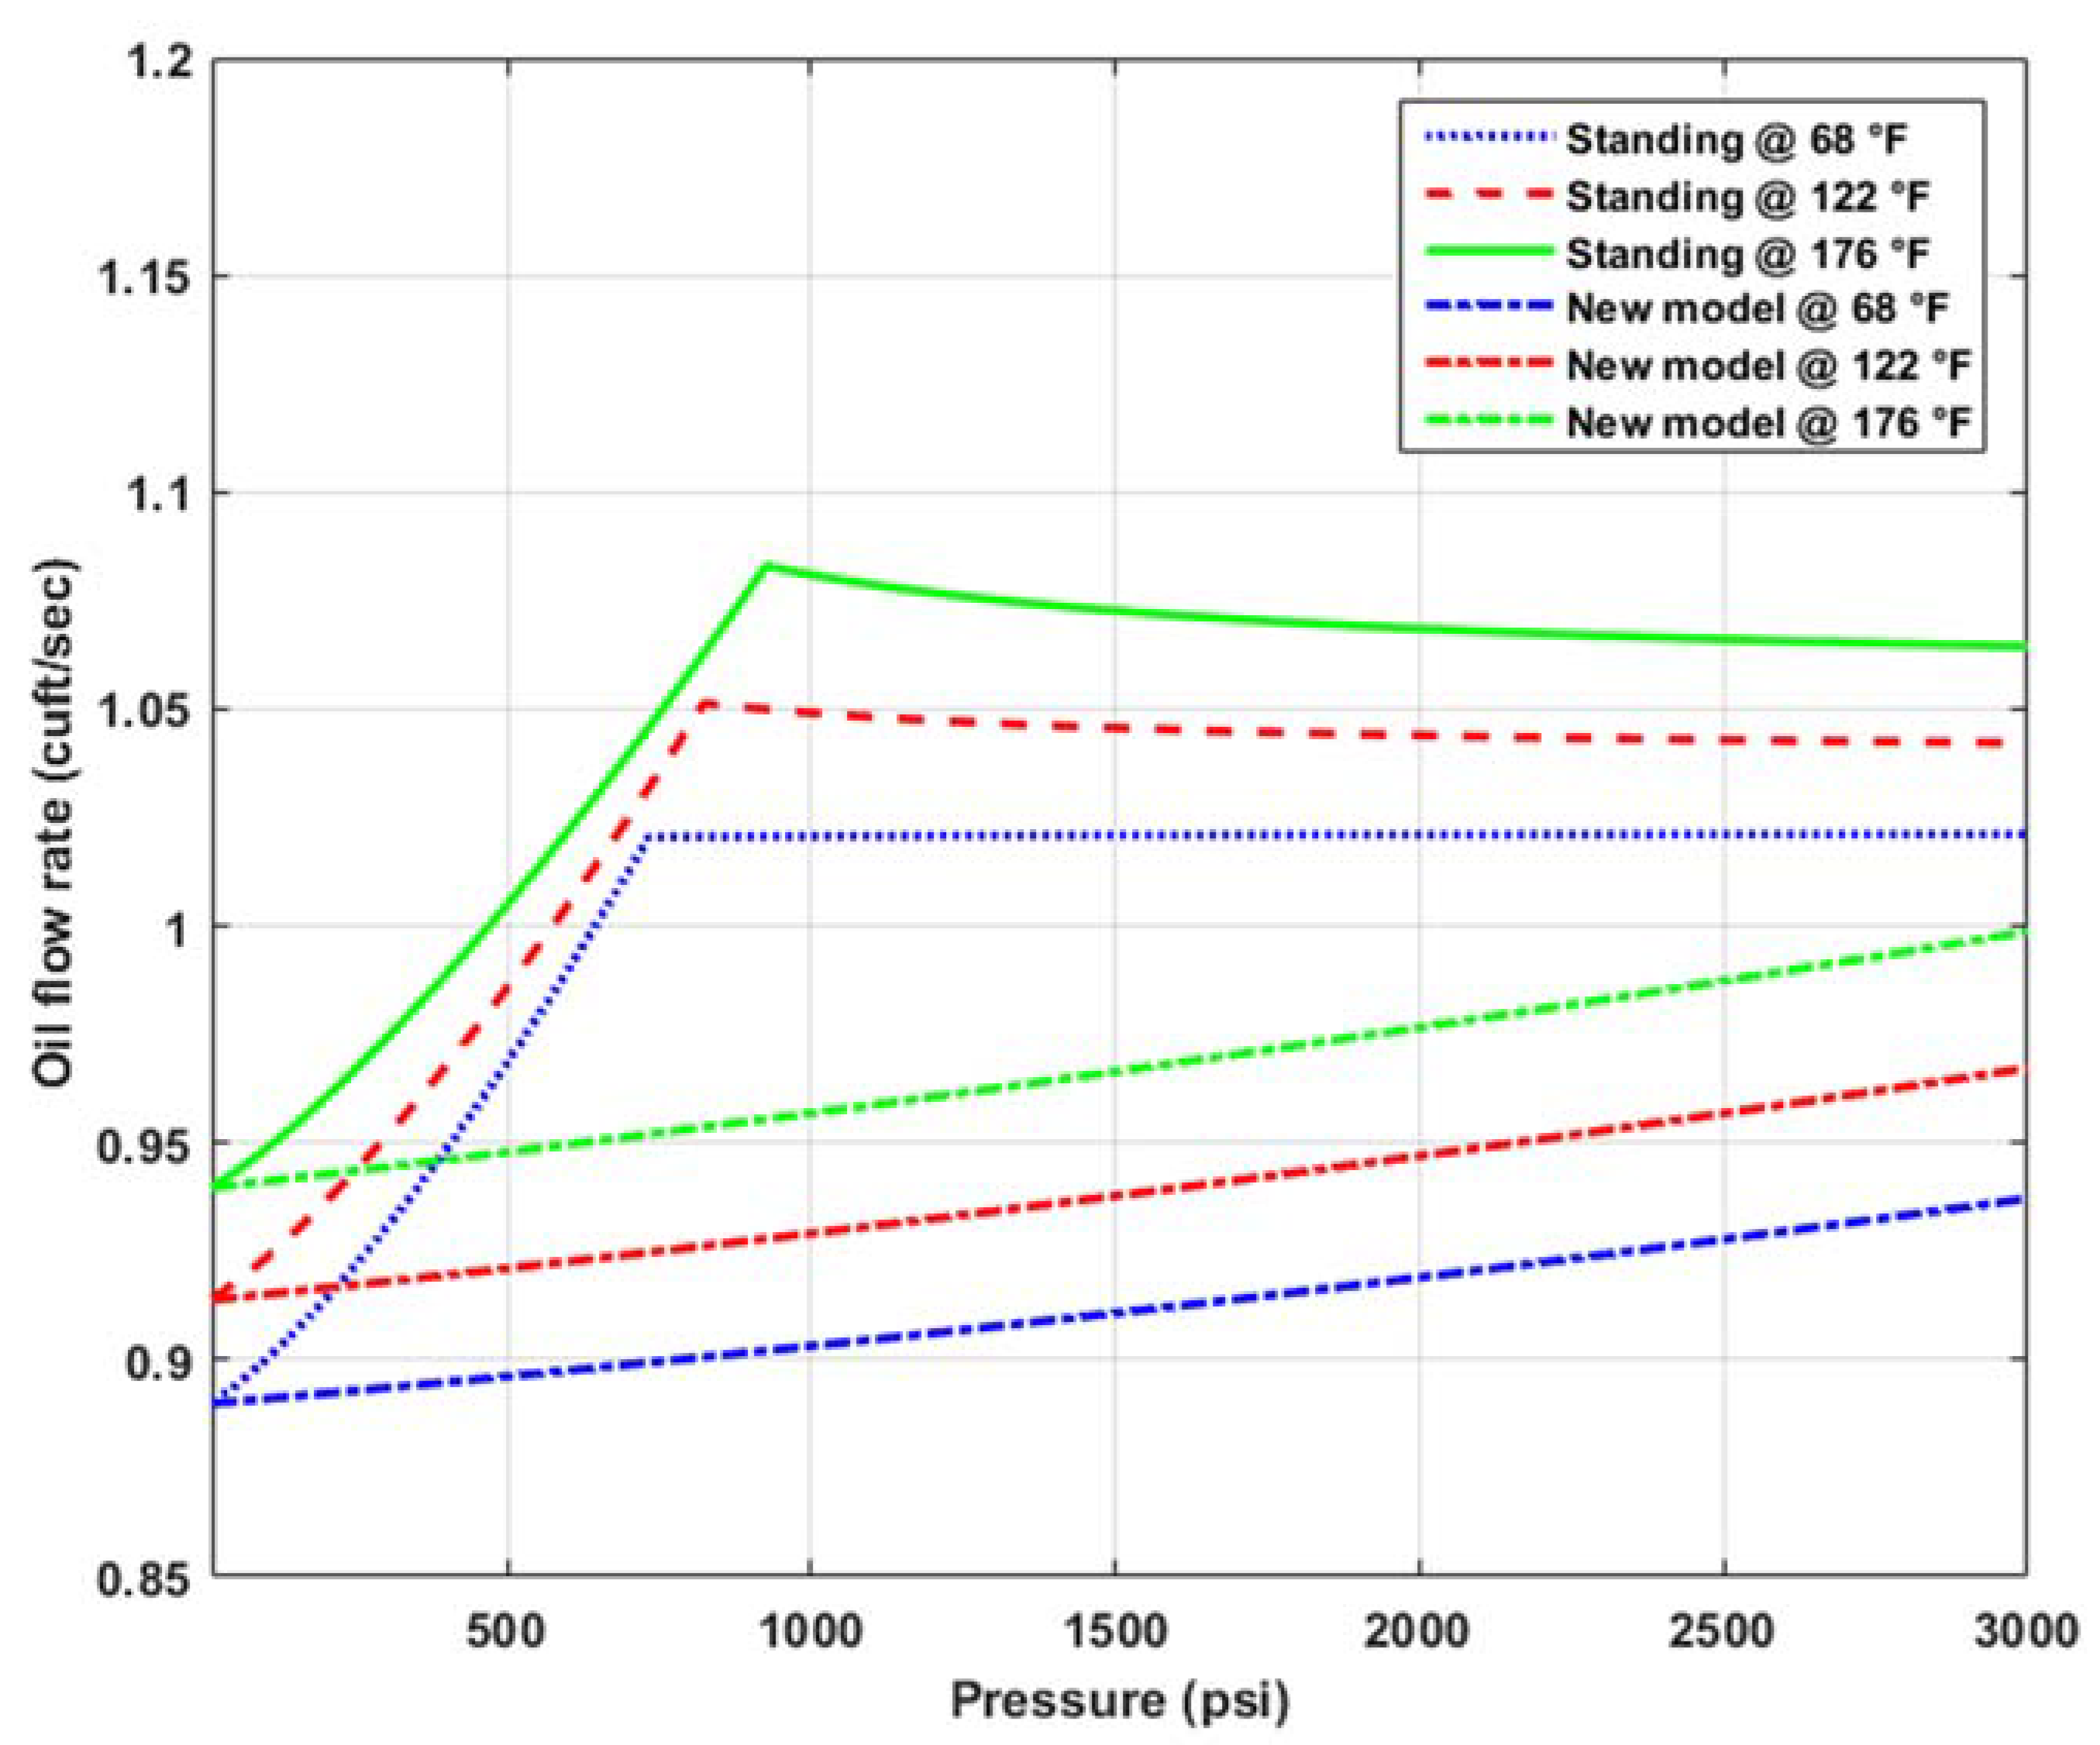
3.4. Determination of Volumetric Flow Rate
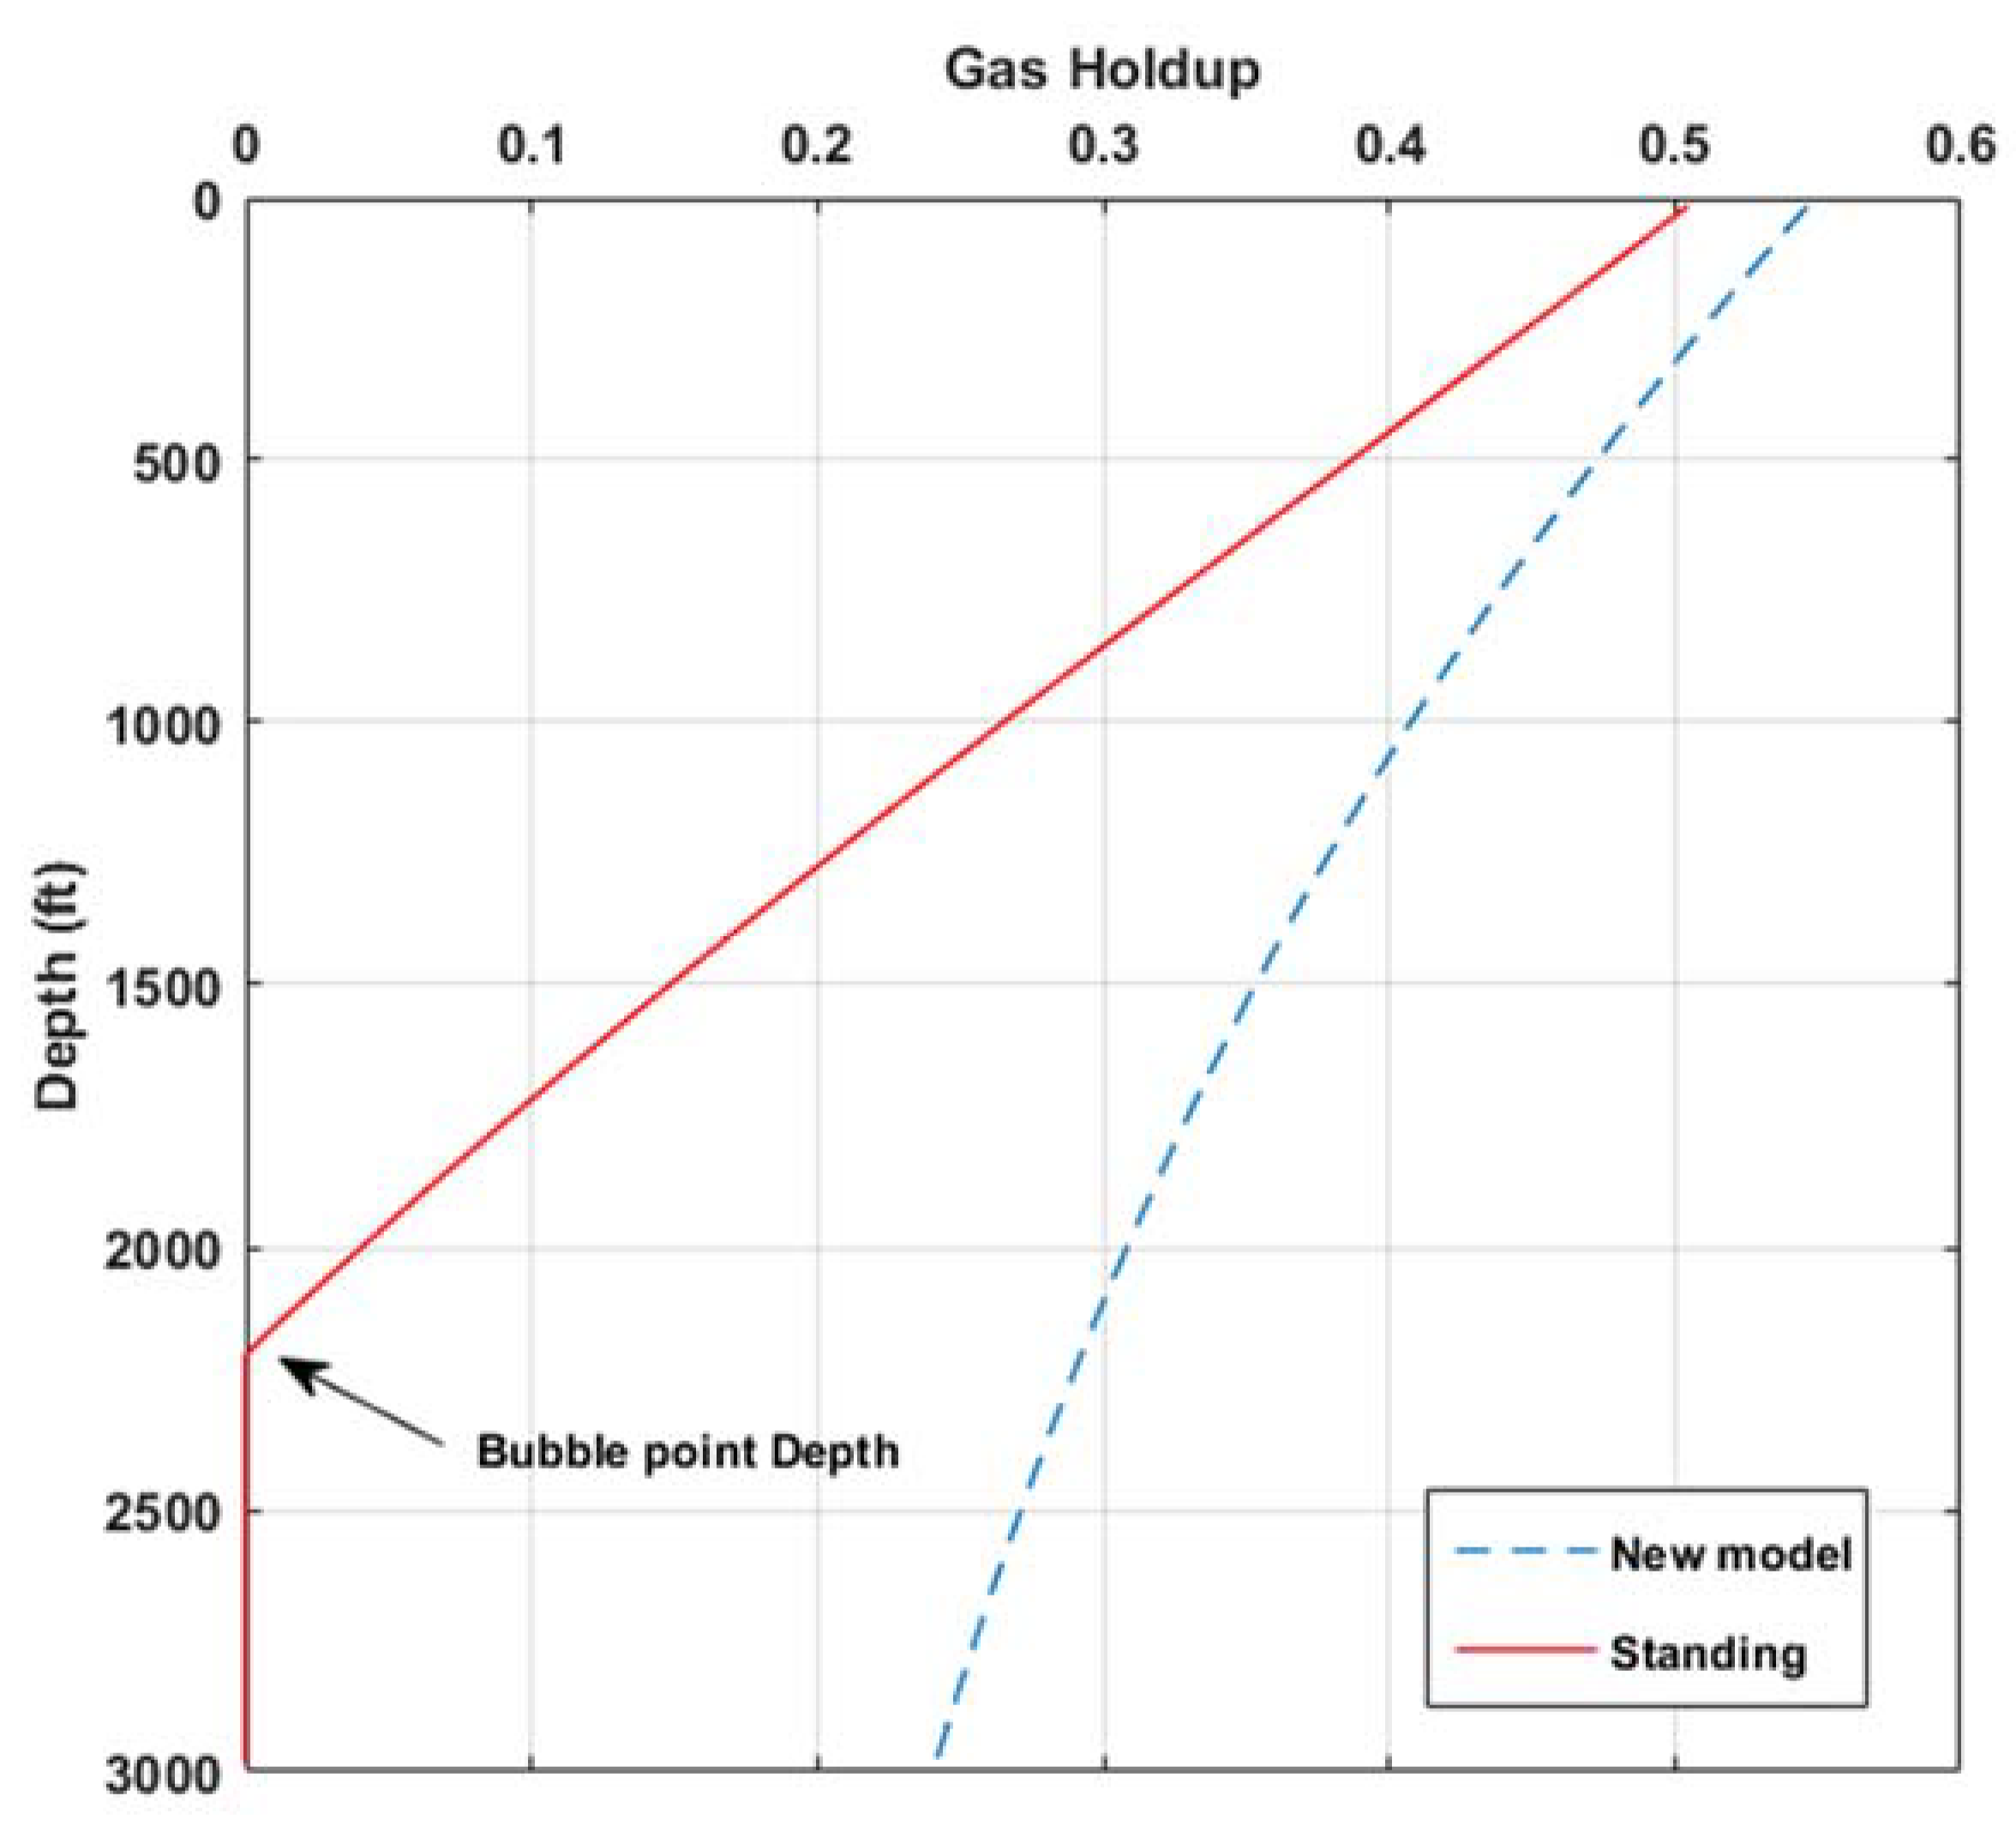
3.5. Determination of Mixture Velocity and Void Fraction
3.6. Determination of Mixture Viscosity
3.7. Determination of Mixture Friction Factor
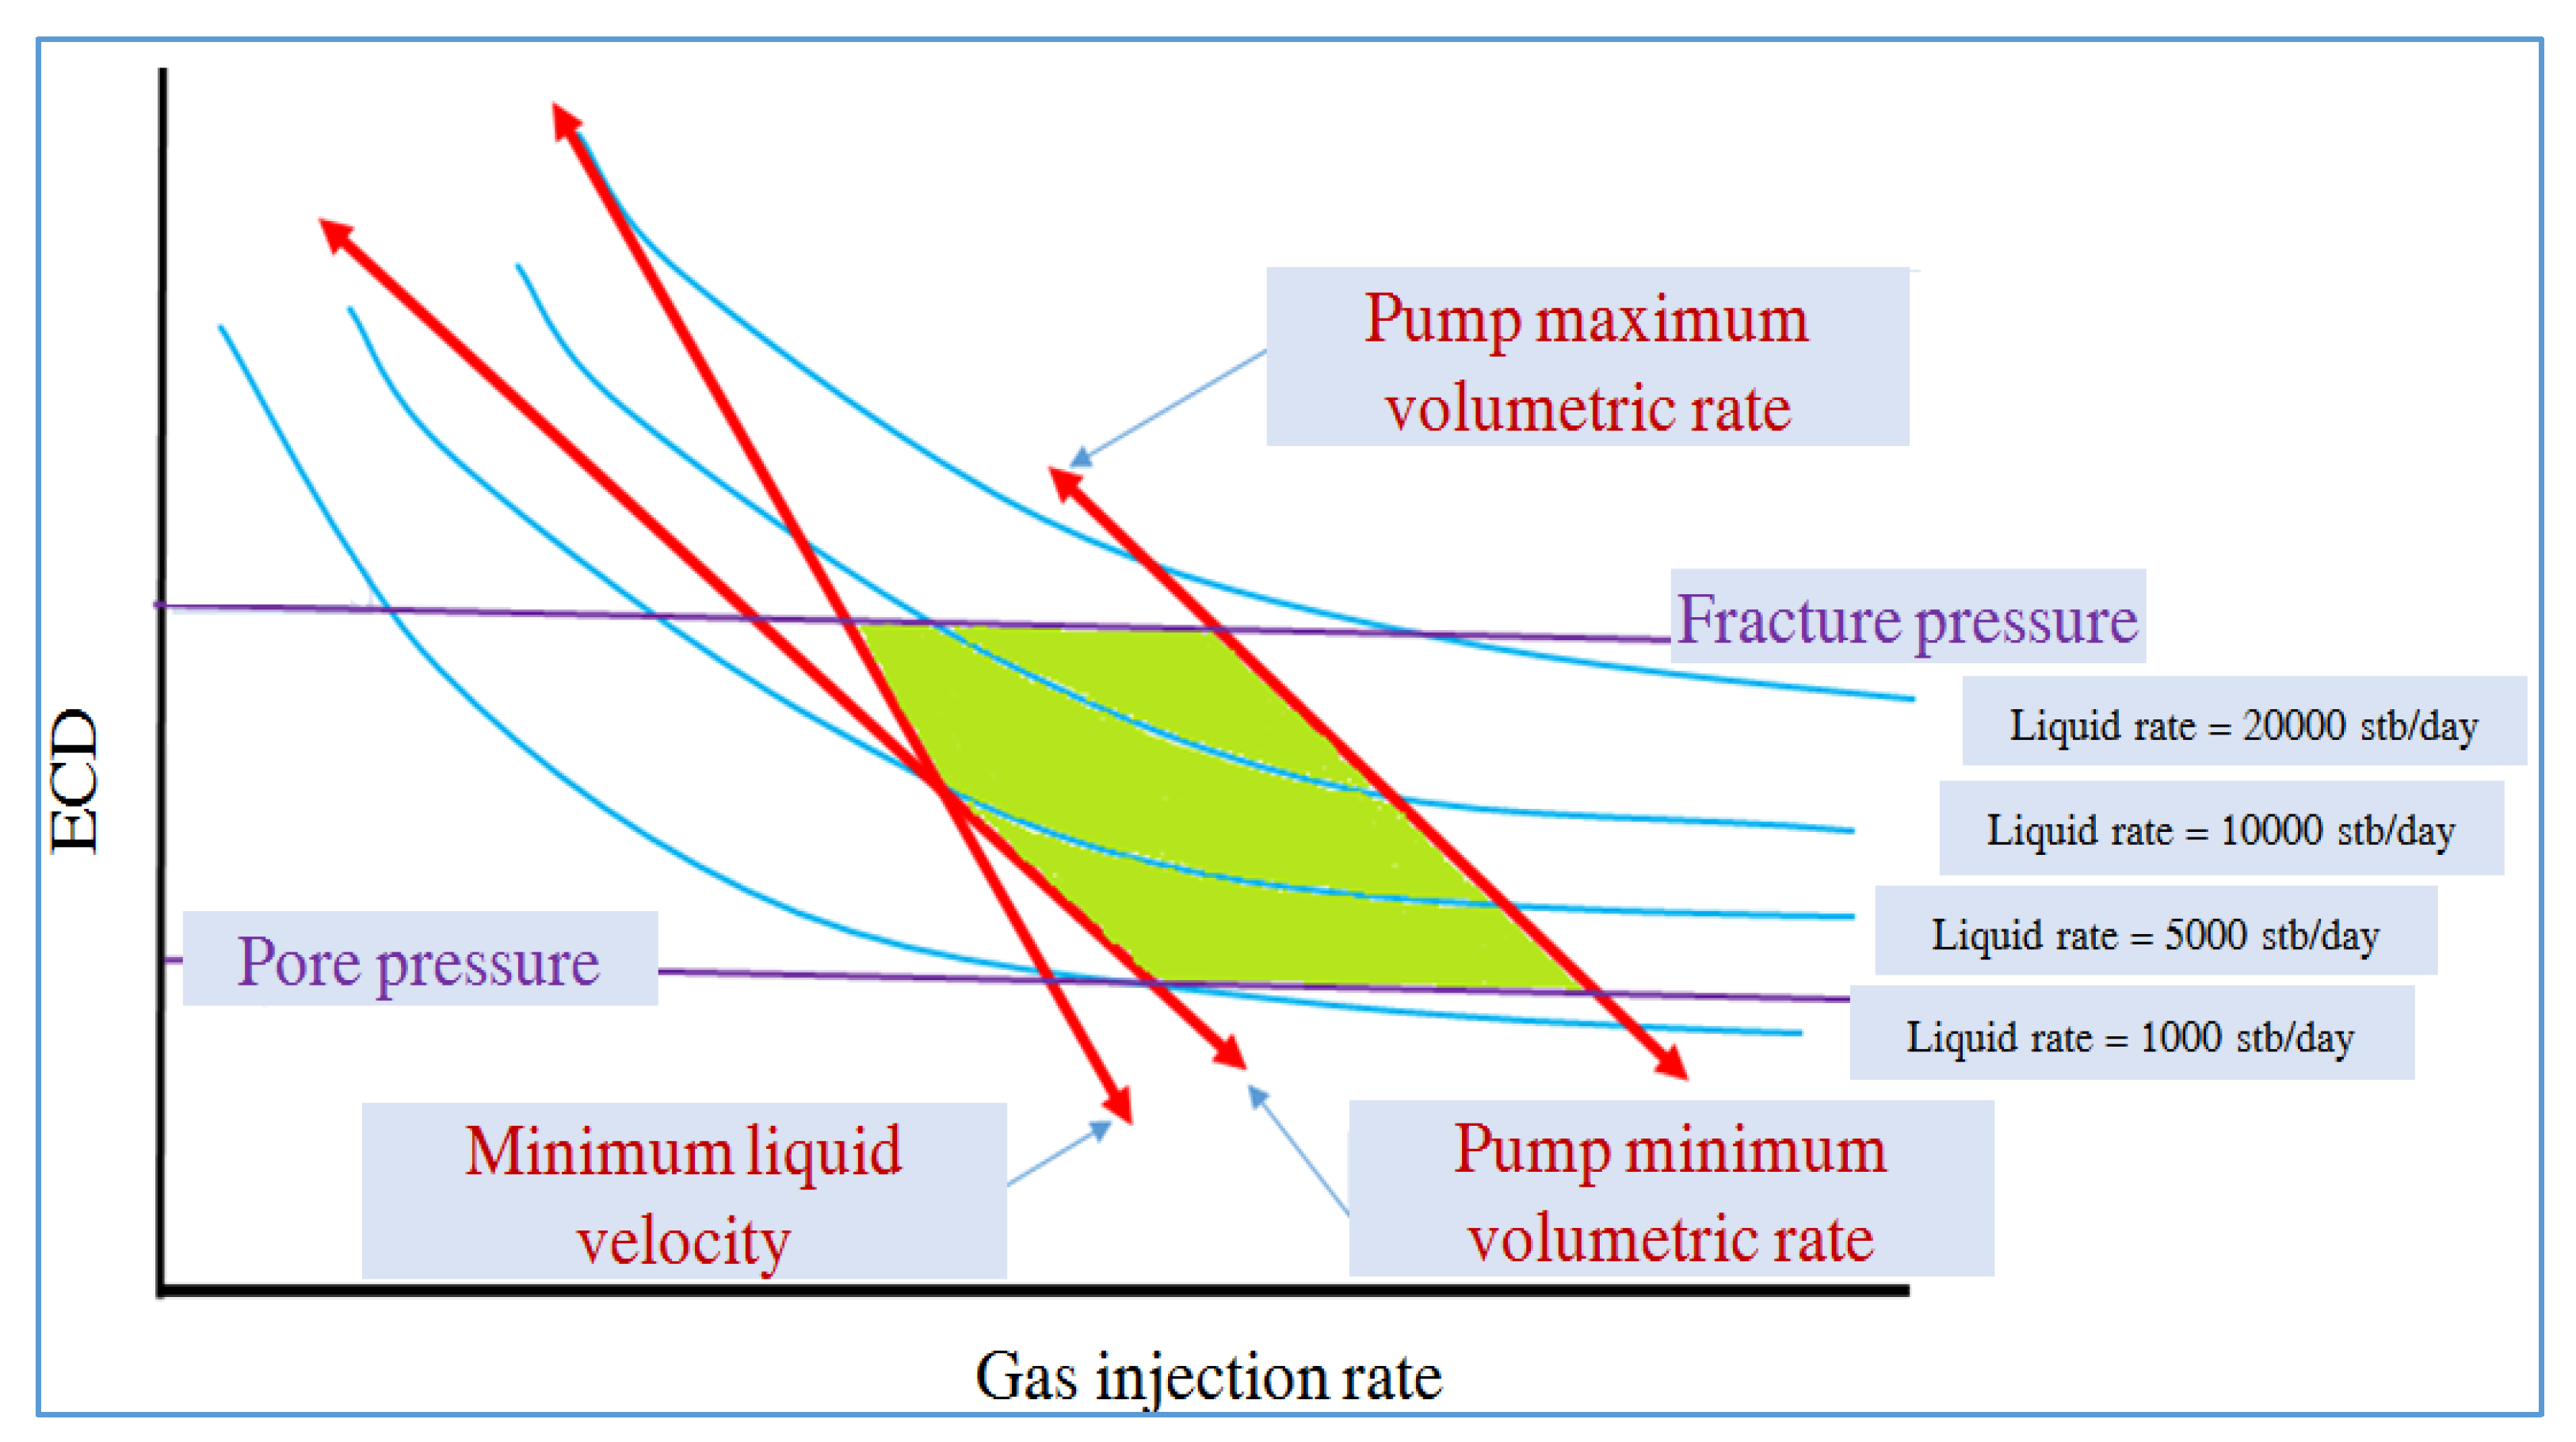
3.8. Optimizing Flow Rate of Injected Gas
4. Discussion
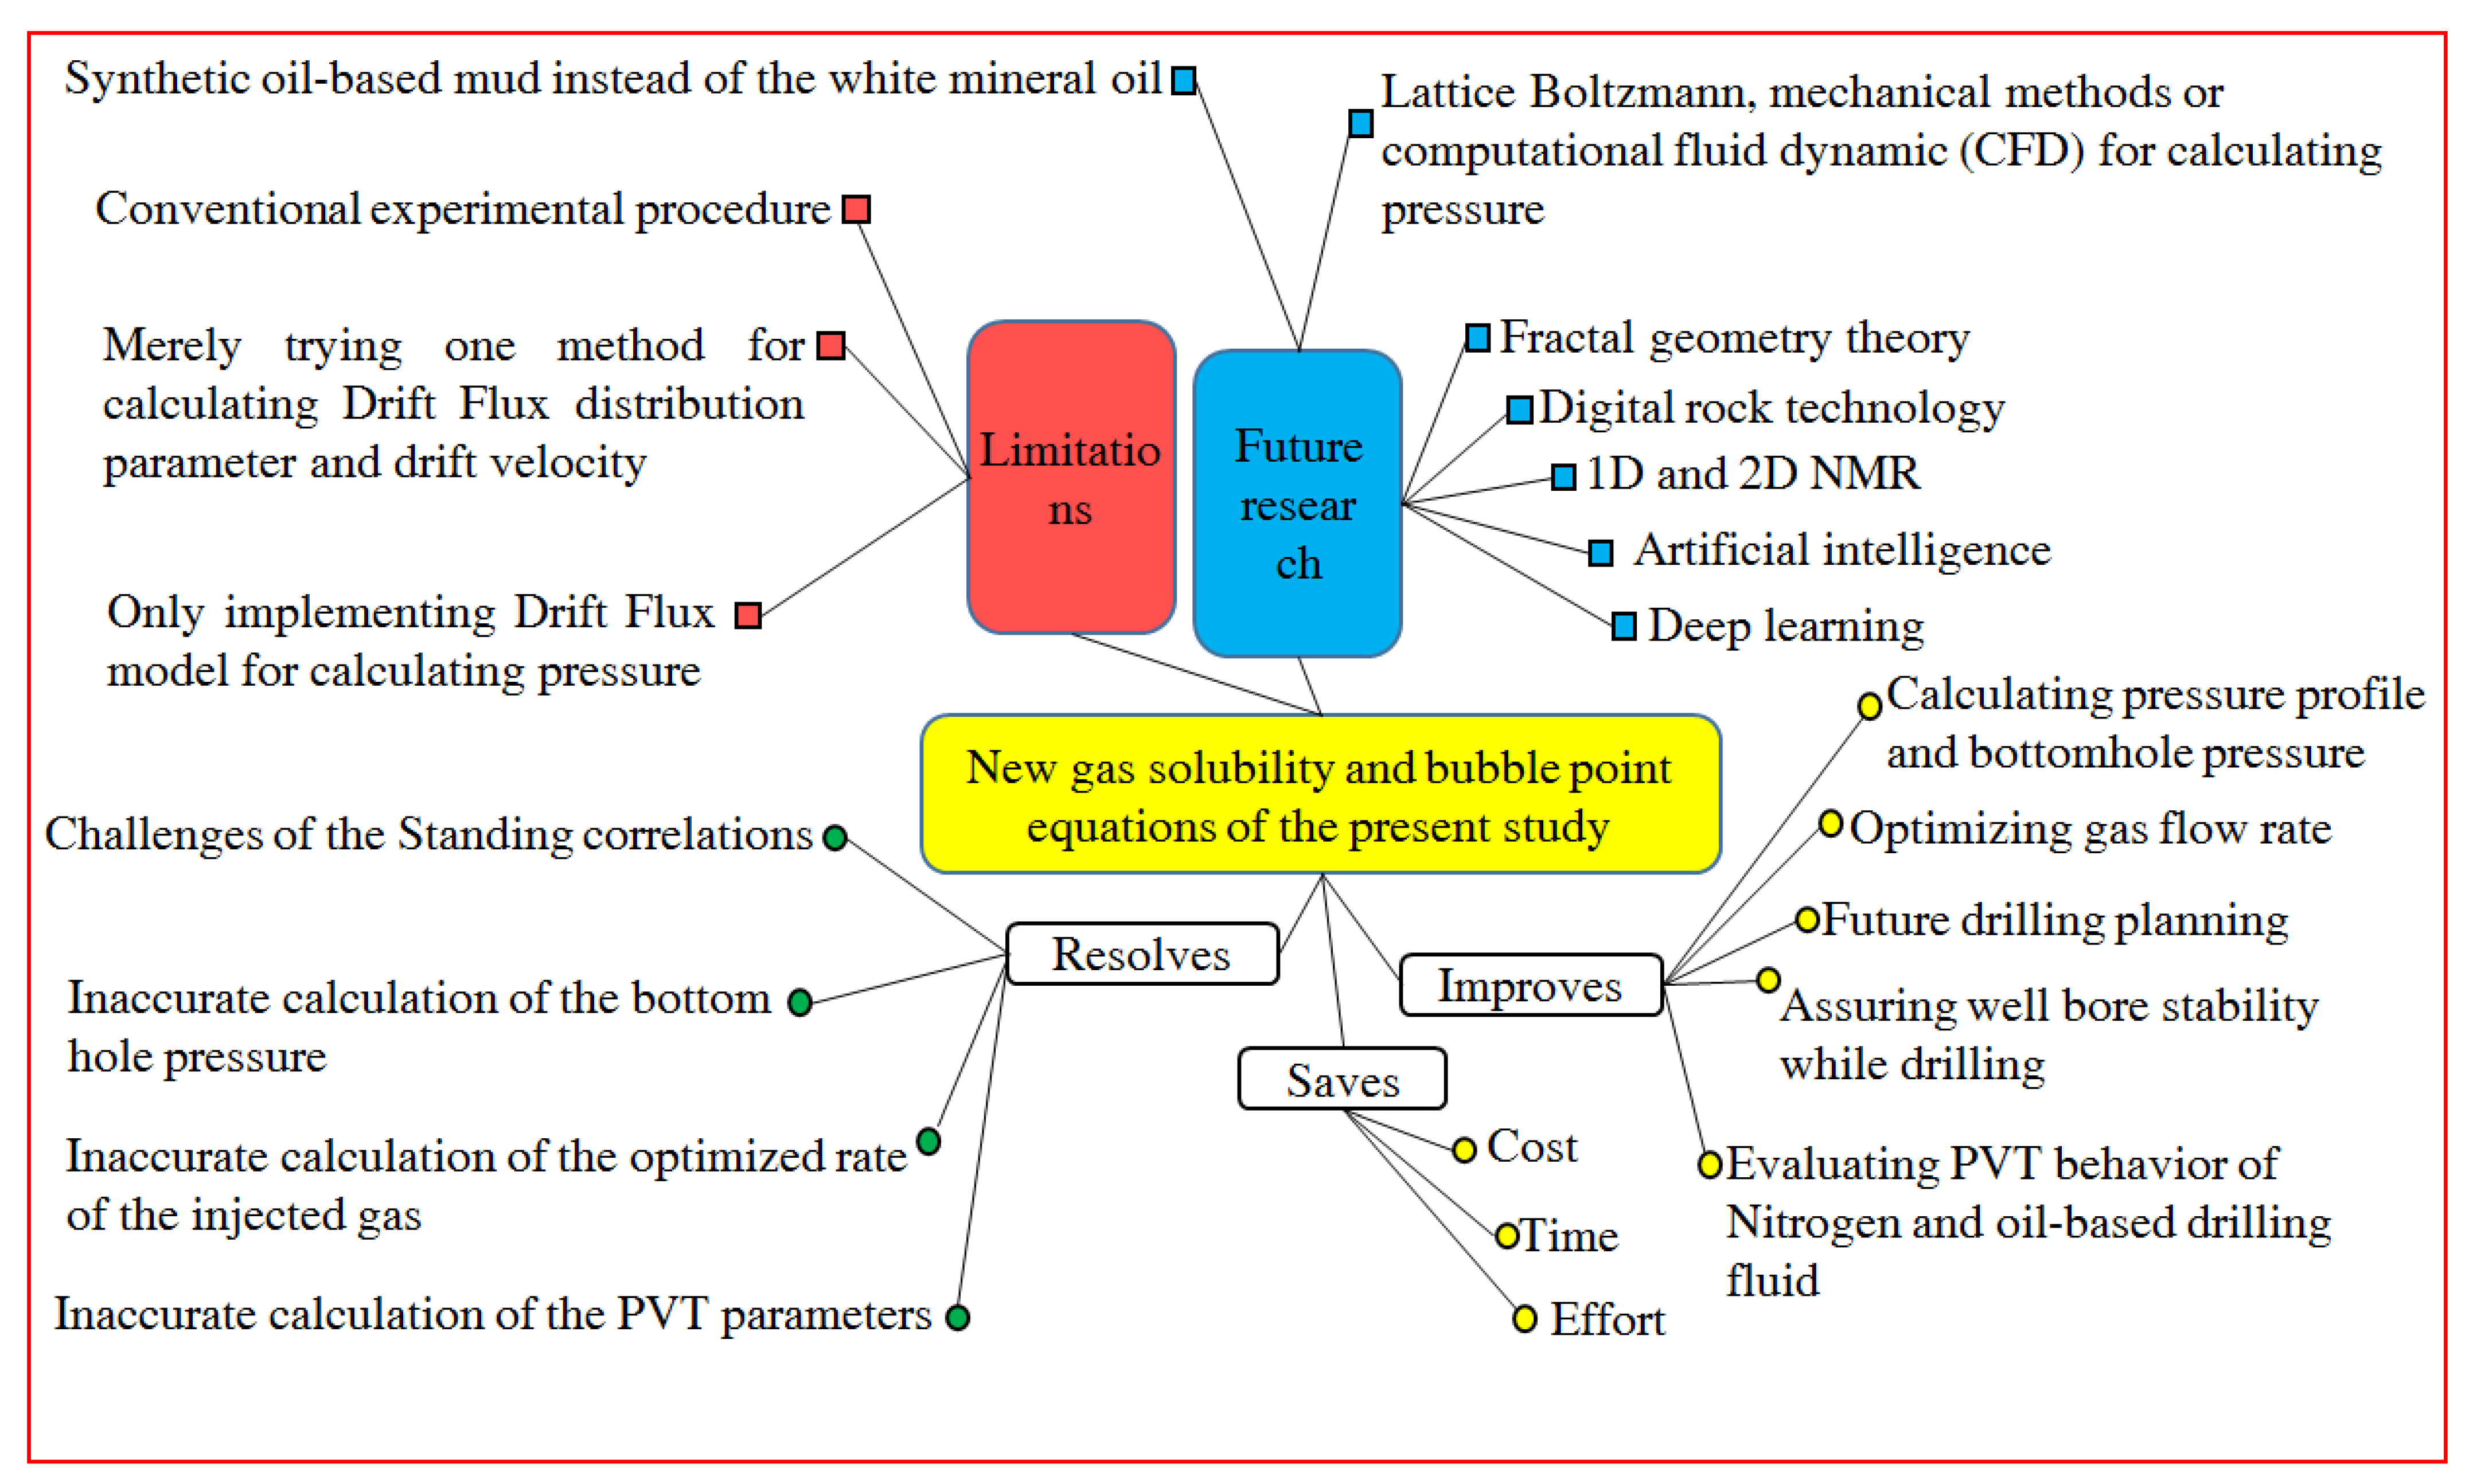
5. Limitations and Future Extensions
6. Conclusions
Author Contributions
Funding
Data Availability Statement
Conflicts of Interest
Nomenclature
| Rs | Solution gas–oil ratio | scf/STB |
| P | Pressure | Psi |
| T | Temperature | °F |
| Pb | Bubble point pressure | Psi |
| Standard temperature | oR | |
| z | Distance | ft |
| Mixture density | lbm/ft3 | |
| Mixture friction factor | - | |
| Mixture velocity | ft/s | |
| Hydraulic diameter | ft | |
| g | Gravitational acceleration constant | ft/s2 |
| No-slip density | lbm/ft3 | |
| f | Friction factor | - |
| FVF | Formation volume factor | ft3/scf & bbl/STB |
| Z | Gas compressibility factor | |
| Gas formation volume factor | ft3/scf | |
| Bw | Water formation volume factor | bbl/STB |
| Bo | Oil formation volume factor | bbl/STB |
| Oil formation volume factor at bubble point pressure | bbl/STB | |
| Liquid-holdup | - | |
| CO | Oil compressibility | psi−1 |
| Specific gravity of the oil | - | |
| Specific gravity of the solution gas | - | |
| Liquid density | lbm/ft3 | |
| Gas density | lbm/ft3 | |
| Oil density | lbm/ft3 | |
| Water density | lbm/ft3 | |
| fo | Oil volume fraction | - |
| fw | Water volume fraction | - |
| GOR | Gas-oil ratio | scf/STB |
| Specific gravity of oil at standard condition | - | |
| Specific gravity of the solution gas at standard condition | - | |
| Specific gravity of water at standard condition | - | |
| Distribution parameter | - | |
| Drift velocity | ft/s | |
| Well internal diameter | in | |
| Drill-string outer diameter | in | |
| Void fraction | - | |
| Gas superficial velocity | ft/s | |
| Liquid superficial velocity | ft/s | |
| Mixture velocity | ft/s | |
| Oil viscosity | cp | |
| Water viscosity | cp | |
| Liquid viscosity | cp | |
| Viscosity | cp | |
| Slip viscosity | cp | |
| No-slip viscosity | cp | |
| Gas holdup | - | |
| No-slip holdup | - | |
| No-slip liquid holdup | - | |
| No-slip gas holdup | - | |
| Gas flow rate at standard condition | scf/s | |
| Oil flow rate at standard condition | scf/s | |
| Water flow rate at standard condition | scf/s | |
| In situ water flow rate | ft3/s | |
| In situ gas flow rate | ft3/s | |
| In situ liquid flow rate | ft3/s | |
| In situ oil flow rate | - | |
| A | Cross-sectional area of the flow | ft2 |
Appendix A. Further Experimental Details

| Component | Weight % |
|---|---|
| <nC13 | 00.51 |
| nC13 | 00.81 |
| vIso paraffin nC13-nC14 | 20.75 |
| nC14 | 13.60 |
| Iso paraffin nC14-nC15 | 32.72 |
| nC15 | 15.30 |
| Iso paraffin nC15-nC16 | 14.82 |
| nC16 < | 01.05 |
| The Designed Liquid and Gas Volume | Final Results of PVT Experiment | ||||||
|---|---|---|---|---|---|---|---|
| Test | Gas Volume (mL) at Standard Condition | Gas Mole Fraction in Mixture | Temperature (oF) | Nitrogen Mole Fraction | Rs (scf/stb) | T (°F) | Pb (psi) |
| 1 | 540 | 0.024 | 68 | 0.024 | 14.80 | 68 | 406.11 |
| 2 | 975 | 0.043 | 68 | 0.043 | 26.73 | 68 | 725.19 |
| 3 | 1900 | 0.081 | 68 | 0.081 | 52.09 | 68 | 1406.87 |
| 4 | 2530 | 0.105 | 68 | 0.105 | 69.36 | 68 | 1812.97 |
| 5 | 2805 | 0.116 | 68 | 0.116 | 76.90 | 68 | 2005.87 |
| 6 | 3415 | 0.137 | 68 | 0.137 | 93.62 | 68 | 2436.63 |
| 7 | 540 | 0.024 | 122 | 0.024 | 14.80 | 122 | 394.50 |
| 8 | 975 | 0.043 | 122 | 0.043 | 26.73 | 122 | 671.52 |
| 9 | 1900 | 0.081 | 122 | 0.081 | 52.09 | 122 | 1359.00 |
| 10 | 2530 | 0.105 | 122 | 0.105 | 69.36 | 122 | 1740.45 |
| 11 | 2805 | 0.116 | 122 | 0.116 | 76.90 | 122 | 1929.00 |
| 12 | 3415 | 0.137 | 122 | 0.137 | 93.62 | 122 | 2291.60 |
| 13 | 540 | 0.024 | 176 | 0.024 | 14.80 | 176 | 364.04 |
| 14 | 975 | 0.043 | 176 | 0.043 | 26.73 | 176 | 646.87 |
| 15 | 1900 | 0.081 | 176 | 0.081 | 52.09 | 176 | 1292.29 |
| 16 | 2530 | 0.105 | 176 | 0.105 | 69.36 | 176 | 1667.93 |
| 17 | 2805 | 0.116 | 176 | 0.116 | 76.90 | 176 | 1841.98 |
| 18 | 3415 | 0.137 | 176 | 0.137 | 93.62 | 176 | 2190.07 |
References
- Bakhshi, E.; Golsanami, N.; Chen, L. Numerical modeling and lattice method for characterizing hydraulic fracture propagation: A review of the numerical, experimental, and field studies. Arch. Comput. Methods Eng. 2020, 28, 3329–3360. [Google Scholar] [CrossRef]
- Golsanami, N.; Bakhshi, E.; Yan, W.; Dong, H.; Barzgar, E.; Zhang, G.; Mahbaz, S. Relationships between the geomechanical parameters and Archie’s coefficients of fractured carbonate reservoirs: A new insight. Energy Sour. Part A Recover. Util. Environ. Eff. 2020, 1–25. [Google Scholar] [CrossRef]
- Hammer, W.L.; Walker, J.A. Evaluation of aerated drilling fluids used at the Nevada test site. In Proceedings of the SPE Annual Technical Conference and Exhibition, Las Vegas, NV, USA, 23–26 September 1979. [Google Scholar] [CrossRef]
- Rizo, T.M.; Cuenca, A.P. Aerated fluid drilling observations in geothermal operation in Luzon, Philippines. In Proceedings of the Society of Petroleum Engineers—Southeast Asia Show, SEA, Singapore, 21–24 February 1984; pp. 1481–1496. [Google Scholar] [CrossRef]
- Guo, B.; Hareland, G.; Rajtar, J. Computer simulation predicts unfavorable mud rate and optimum air injection rate for aerated mud drilling. SPE Drill. Complet. 1996, 11, 61–66. [Google Scholar] [CrossRef]
- Lopes, C.A.; Bourgoyne, A.T. The dual density riser solution. In Proceedings of the SPE/IADC Drilling Conference, Amsterdam, The Netherlands, 4–6 March 1997. [Google Scholar] [CrossRef]
- Nakagawa, E.Y.; Santos, H.; Cunha, J.C.; Shayegi, S. Planning of deepwater drilling operations with aerated fluids. In Proceedings of the SPE Asia Pacific Oil and Gas Conference and Exhibition, Jakarta, Indonesia, 20–22 April 1999. [Google Scholar] [CrossRef]
- Nakagawa, E.Y.; Silva, V.; Boas, M.B.V.; Silva, P.R.C.; Shayegi, S. Comparison of aerated fluids/foam drilling hydraulics simulators against field data. In Proceedings of the Society of Petroleum Engineers—SPE Asia Pacific Oil and Gas Conference and Exhibition, Jakarta, Indonesia, 20–22 April 1999. [Google Scholar] [CrossRef]
- Herrmann, R.P.; Shaughnessy, J.M. Two methods for achieving a dual gradient in deepwater. In Proceedings of the Drilling Conference, Amsterdam, The Netherlands, 27 February–1 March 2001; pp. 412–429. [Google Scholar] [CrossRef]
- Perez-Tellez, C.; Smith, J.R.; Edwards, J.K. A new comprehensive, mechanistic model for underbalanced drilling improves wellbore pressure predictions. In Proceedings of the SPE International Petroleum Conference and Exhibition in Mexico, Villahermosa, Mexico, 1–12 February 2002; pp. 1–13. [Google Scholar] [CrossRef]
- Stanislawek, M.; Smith, J.R. Analysis of alternative well-control methods for dual-density deepwater drilling. In Proceedings of the IADC/SPE Drilling Conference, Miami, FL, USA, 21–23 February 2006. [Google Scholar] [CrossRef]
- Smith, J.R.; Stanislawek, M.; Shelton, J. Literature Review Summary for Comparative Analysis of Dual Density Drilling Systems to Reduce Deepwater Drilling Costs; Research Partnership to Secure Energy for America: Houston, TX, USA, 2003. [Google Scholar]
- Lopes, C.A. Feasibility Study on the Reduction of Hydrostatic Pressure in a Deep-Water Riser Using a Gas-Lift Method. Ph.D. Thesis, Louisiana State University and Agricultural and Mechanical College, Baton Rouge, LA, USA, 1997. [Google Scholar]
- Dilchert, G.; Kuss, E. The experimental determination of gas solubility in mineral-oils and the viscosity-pressure behavior of the gas/oil solution up to 1 Kbar. In Proceedings of the 9025-MS SPE, London, UK, October 1980. [Google Scholar]
- Rommetveit, R.; Olsen, T.L. Gas kick experiments in oil-based drilling muds in a full-scale, inclined research well. In Proceedings of the SPE Annual Technical Conference and Exhibition, San Antonio, TX, USA, 8–11 October 1989. [Google Scholar] [CrossRef]
- Rommetveit, R.; Vefring, E.H. Comparison of results from an advanced gas kick simulator with surface and downhole data from full scale gas kick experiments in an inclined well. In Proceedings of the SPE Annual Technical Conference and Exhibition, Dallas, TX, USA, 6–9 October 1991. [Google Scholar] [CrossRef]
- Bassani, R.; Piccigallo, B. Hydrostatic Lubrication: Theory and Practice; Elsevier: Amsterdam, The Netherlands, 1992. [Google Scholar]
- Tong, J.; Gao, W.; Robinson, R.L.; Gasem, K.A.M. Solubilities of nitrogen in heavy normal paraffins from 323 to 423 K at pressures to 18.0 MPa. J. Chem. Eng. Data 1999, 44, 784–787. [Google Scholar] [CrossRef]
- O’Bryan, P.L. The Experimental and Theoretical Study of Methane Solubility in an Oil-Base Drilling Fluid. Louisiana State University: Baton Rouge, LA, USA, 1985. [Google Scholar]
- Thomas, D.C.; Lea, J.F.J.; Turek, E. Gas Solubility in oil-based drilling fluids: Effects on kick detection. J. Pet. Technol. 1984, 36, 959–968. [Google Scholar] [CrossRef]
- Standing, M.B. A Pressure-Volume-Temperature Correlation for Mixtures of California Oils and Gases; American Petroleum Institute: Washington, DC, USA, 1947; pp. 275–287. [Google Scholar]
- Glaso, O. Generalized pressure-volume-temperature correlations. J. Pet. Technol. 1980, 32, 785–795. [Google Scholar] [CrossRef]
- Negahban, S.; Ruihe, W.; Baojiang, S. Experimental measurement and modeling of the solubility and bubble pressure of nitrogen in white mineral oil. Pet. Sci. Technol. 2016, 34, 1818–1825. [Google Scholar] [CrossRef]
- Golsanami, N. Evaluating the Effect of New Gas Solubility and Bubble Point Models on PVT Parameters and Optimizing Injected Gas Rate in Gas-Lift Dual Gradient Drilling, Mendeley Data, V1, 2021. Available online: https://data.mendeley.com/datasets/rzf53yzvm3/1 (accessed on 23 October 2021). [CrossRef]
- Li, X.; Gao, D.; Zhou, Y.; Zhang, H. A model for extended-reach limit analysis in offshore horizontal drilling based on formation fracture pressure. J. Pet. Sci. Eng. 2016, 146, 400–408. [Google Scholar] [CrossRef]
- Li, J.; Zhang, H.; Li, X.; Ding, S.; Tao, Q. Dual-gradient drilling of deepwater in south china sea: What is the well’s maximum measured depth and how to improve it. In Proceedings of the SPE/IADC Managed Pressure Drilling and Underbalanced Operations Conference and Exhibition, New Orleans, LA, USA, 17–18 April 2018. [Google Scholar]
- Shen, P.; Li, G.; Liu, J.; Li, X.; Zhang, J. Gas permeability and production potential of marine hydrate deposits in South China sea. Energies 2019, 12, 4117. [Google Scholar] [CrossRef] [Green Version]
- Kumar, D. Managed Pressure Drilling: Experimental and Modeling Based Investigation. Master’s Thesis, Pandit Deendayal Petroleum University, Gandhinagar, India, 2010. [Google Scholar]
- Geo Drilling Fluids Inc. Technical Services Newsletter, Managed Pressure Drilling; Geo Drilling Fluids Inc.: Bakersfield, CA, USA, 2004; Volume 8, p. 3. [Google Scholar]
- Guo, B.; Liu, G. Applied Drilling Circulation Systems: Hydraulics, Calculations, and Models; Gulf Professional Publishing: Houston, TX, USA, 2011; ISBN 978-0123819574. [Google Scholar]
- Elieff, B.A.M. Top Hole Drilling with Dual Gradient Technology to Control Shallow Hazards. Master’s Thesis, Texas A&M University, College Station, TX, USA, 2006. [Google Scholar]
- Hannegan, D.; Todd, R.J.; Pritchard, D.M.; Jonasson, B. MPD—Uniquely applicable to methane hydrate drilling. In Proceedings of the SPE/IADC Underbalanced Technology Conference and Exhibition, Houston, TX, USA, 11–12 October 2004. [Google Scholar]
- Fossil, B.; Sangesland, S. Managed pressure drilling for subsea applications; well control challenges in deep waters. In Proceedings of the SPE/IADC Underbalanced Technology Conference and Exhibition, Houston, TX, USA, 11–12 October 2004. [Google Scholar]
- Brill, J.P. Multiphase flow in wells. J. Pet. Technol. 1987, 39, 15–21. [Google Scholar] [CrossRef]
- Dranchuk, P.; Abou-Kassem, H. Calculation of Z Factors for Natural Gases Using Equations of State. J. Can. Pet. Technol. 1975, 14, 34–36. [Google Scholar] [CrossRef]
- McCain, W.D., Jr. The Properties of Petroleum Fluids. Available online: https://www.researchgate.net/publication/261652188_The_Properties_of_Petroleum_Fluids (accessed on 23 October 2021).
- Elsharkawy, A.M.; Alikhan, A.A. Models for predicting the viscosity of middle east crude oils. Fuel 1999, 78, 891–903. [Google Scholar] [CrossRef]
- James, P.; Brill, H.D.B.; James, P.; Brill, H. Dale Beggs—Two-Phase Flow in Pipes-Tulsa University Press. Available online: https://www.scribd.com/document/481871050/James-P-Brill-H-Dale-Beggs-Two-Phase-Flow-in-Pipes-Tulsa-University-Press-1991-compressed (accessed on 23 October 2021).
- Zuber, N.; Findlay, J.A. Average volumetric concentration in two-phase flow systems. J. Heat Transf. 1965, 87, 453–468. [Google Scholar] [CrossRef]
- Hasan, A.R.; Kabir, C.S. Predicting multiphase flow behavior in a deviated well. SPE Prod. Eng. 1988, 3, 474–482. [Google Scholar] [CrossRef]
- Lee, A.L.; Gonzalez, M.H.; Eakin, B.E. The viscosity of natural gases. J. Pet. Technol. 1966, 18, 997–1000. [Google Scholar] [CrossRef]
- Beggs, H.D.; Robinson, J.R. Estimating the viscosity of crude oil systems. J. Pet. Technol. 1975, 27, 1140–1141. [Google Scholar] [CrossRef]
- Vasquez, M.; Beggs, H.D. Correlations for fluid physical property prediction. J. Pet. Technol. 1980, 32, 968–970. [Google Scholar] [CrossRef]
- Beggs, H.D.; Brill, J.R. Study of two-phase flow in inclined pipes. J. Pet. Technol. 1973, 25, 607–617. [Google Scholar] [CrossRef]
- Golsanami, N.; Jayasuriya, M.N.; Yan, W.; Fernando, S.G.; Liu, X.; Cui, L.; Zhang, X.; Yasin, Q.; Dong, H.; Dong, X. Characterizing clay textures and their impact on the reservoir using deep learning and lattice-boltzmann simulation applied to SEM images. Energy 2022, 240, 122599. [Google Scholar] [CrossRef]
- Al-Shammasi, A.A. A review of bubblepoint pressure and oil formation volume factor correlations. SPE Reserv. Eval. Eng. 2001, 4, 146–160. [Google Scholar] [CrossRef]
- Khamehchi, E.; Rashidi, F.; Rasouli, H.; Ebrahimian, A. Novel empirical correlations for estimation of bubble point pressure, saturated viscosity and gas solubility of crude oils. Pet. Sci. 2009, 6, 86–90. [Google Scholar] [CrossRef] [Green Version]
- Elmabrouk, S.; Zekri, A.; Shirif, E. Prediction of bubblepoint pressure and bubblepoint oil formation volume factor in the absence of pvt analysis. In Proceedings of the SPE Latin American and Caribbean Petroleum Engineering Conference Proceedings, Lima, Peru, 1–3 December 2010; Volume 1, pp. 217–225. [Google Scholar]
- Ahmadi, M.A.; Pournik, M.; Shadizadeh, S.R. Toward connectionist model for predicting bubble point pressure of crude oils: Application of artificial intelligence. Petroleum 2015, 1, 307–317. [Google Scholar] [CrossRef] [Green Version]
- Baarimah, S.O.; Gawish, A.A.; BinMerdhah, A.B. Artificial intelligence techniques for predicting the reservoir fluid properties of crude oil systems. Int. Res. J. Eng. Technol. 2015, 2, 373–382. [Google Scholar]
- Alatefi, S.; Almeshal, A.M. A new model for estimation of bubble point pressure using a bayesian optimized least square gradient boosting ensemble. Energies 2021, 14, 2653. [Google Scholar] [CrossRef]
- Han, B.; Lu, G.; Cao, H.; Zhang, L. Fractal features of the microstructure of the drilling fluid used into the hydrate-bearing sediments under the shearing action. Environ. Earth Sci. 2017, 76, 1–13. [Google Scholar] [CrossRef]
- Golsanami, N.; Fernando, S.G.; Jayasuriya, M.N.; Yan, W.; Dong, H.; Cui, L.; Dong, X.; Barzgar, E. Fractal properties of various clay minerals obtained from SEM images. Geofluids 2021, 2021, 1–18. [Google Scholar] [CrossRef]
- Dong, H.; Sun, J.; Golsanami, N.; Cui, L.; Jiang, L.; Yan, G.; Yan, W.; Li, Y. A method to construct high-precision complex pore digital rock. J. Geophys. Eng. 2018, 15, 2695–2703. [Google Scholar] [CrossRef] [Green Version]
- Dong, H.; Sun, J.; Cui, L.; Golsanami, N.; Yan, W.; Huaimin, D.; Jianmeng, S.; Likai, C.; Naser, G.; Weichao, Y. Characteristics of the pore structure of natural gas hydrate reservoir in the Qilian mountain permafrost, Northwest China. J. Appl. Geophys. 2019, 164, 153–159. [Google Scholar] [CrossRef]
- Sun, J.; Dong, H.; Arif, M.; Yu, L.; Zhang, Y.; Golsanami, N.; Yan, W. Influence of pore structural properties on gas hydrate saturation and permeability: A coupled pore-scale modelling and X-ray computed tomography method. J. Nat. Gas Sci. Eng. 2021, 88, 103805. [Google Scholar] [CrossRef]
- Dong, H.; Cui, L.; Yu, L.; Song, L.; Sun, J.; Golsanami, N.; Liu, X. New hybrid method for gas-hydrate digital rock reconstruction and its accuracy evaluation. J. Energy Eng. 2021, 147, 4021050. [Google Scholar] [CrossRef]
- Liu, X.; Dong, H.; Yan, W.; Arif, M.; Zhang, Y.; Golsanami, N. Influence of gas hydrate saturation and pore habits on gas relative permeability in gas hydrate-bearing sediments: Theory, experiment and case study. J. Nat. Gas Sci. Eng. 2021, 95, 104171. [Google Scholar] [CrossRef]
- Liu, X.; Dong, X.; Golsanami, N.; Liu, B.; Shen, L.W.; Shi, Y.; Guo, Z.; Cui, L.; Sun, Y.; Du, Y.; et al. NMR characterization of fluid mobility in tight sand: Analysis on the pore capillaries with the nine-grid model. J. Nat. Gas Sci. Eng. 2021, 94, 104069. [Google Scholar] [CrossRef]
- Golsanami, N.; Zhang, X.; Yan, W.; Yu, L.; Dong, H.; Dong, X.; Cui, L.; Jayasuriya, M.N.; Fernando, S.G.; Barzgar, E. NMR-based study of the pore types’ contribution to the elastic response of the reservoir rock. Energies 2021, 14, 1513. [Google Scholar] [CrossRef]
- Dong, X.; Shen, L.W.; Golsanami, N.; Liu, X.; Sun, Y.; Wang, F.; Shi, Y.; Sun, J. How N2 injection improves the hydrocarbon recovery of CO2 HnP: An NMR study on the fluid displacement mechanisms. Fuel 2020, 278, 118286. [Google Scholar] [CrossRef]
- Golsanami, N.; Sun, J.; Liu, Y.; Yan, W.; Lianjun, C.; Jiang, L.; Dong, H.; Zong, C.; Wang, H. Distinguishing fractures from matrix pores based on the practical application of rock physics inversion and NMR data: A case study from an unconventional coal reservoir in China. J. Nat. Gas Sci. Eng. 2019, 65, 145–167. [Google Scholar] [CrossRef]
- Horkowitz, J.; Crary, S.; Ganesan, K.; Heidler, R.; Luong, B.; Morley, J.; Petricola, M.; Prusiecki, C.; Poitzsch, M.; Scheibal, J.R.; et al. Applications of a new magnetic resonance logging-while-drilling tool in a Gulf of Mexico deepwater development project. In Proceedings of the SPWLA 43rd Annual Logging Symposium, Oiso, Japan, 2–5 June 2002. [Google Scholar]
- Yan, W.; Sun, F.; Sun, J.; Golsanami, N. Distribution model of fluid components and quantitative calculation of movable oil in inter-salt shale using 2D NMR. Energies 2021, 14, 2447. [Google Scholar] [CrossRef]
- Gao, X.; Zheng, H.; Zhang, Y.; Golsanami, N. Tax policy, environmental concern and level of emission reduction. Sustainability 2019, 11, 1047. [Google Scholar] [CrossRef] [Green Version]
- Zhang, X.; Jiang, Y.; Chen, L.; Wang, X.; Golsanami, N.; Zhou, L. Anti-plane seismic performance of a shallow-buried tunnel with imperfect interface in anisotropic half-space. Tunn. Undergr. Space Technol. 2021, 112, 103906. [Google Scholar] [CrossRef]
- Dong, X.; Shen, L.; Zhao, J.; Liu, X.; Sun, Y.; Golsanami, N.; Wang, F.; Bi, H.; Zitha, P. A novel method to evaluate cleaning quality of oil in shale using pyrolysis pyrogram. Energy Sci. Eng. 2020, 8, 1693–1704. [Google Scholar] [CrossRef]
- Ahmed, A.; Elkatatny, S.; Ali, A.; Abughaban, M.; Abdulraheem, A. Application of artificial intelligence techniques in predicting the lost circulation zones using drilling sensors. J. Sensors 2020, 2020, 1–18. [Google Scholar] [CrossRef]
- Agwu, O.E.; Akpabio, J.U.; Alabi, S.B.; Dosunmu, A. Artificial intelligence techniques and their applications in drilling fluid engineering: A review. J. Pet. Sci. Eng. 2018, 167, 300–315. [Google Scholar] [CrossRef]
- Golsanami, N.; Kadkhodaie-Ilkhchi, A.; Erfani, A. Synthesis of capillary pressure curves from post-stack seismic data with the use of intelligent estimators: A case study from the Iranian part of the South Pars gas field, Persian Gulf Basin. J. Appl. Geophys. 2015, 112, 215–225. [Google Scholar] [CrossRef]
- Golsanami, N.; Sun, J. Developing a new technique for estimating NMR T1 and T2 relaxations. In Proceedings of the 79th EAGE Conference and Exhibition, Paris, France, 12–15 June 2017. [Google Scholar]
- Qiang, Z.; Yasin, Q.; Golsanami, N.; Du, Q. Prediction of reservoir quality from log-core and seismic inversion analysis with an artificial neural network: A case study from the Sawan Gas Field, Pakistan. Energies 2020, 13, 486. [Google Scholar] [CrossRef] [Green Version]
- Jiang, L.; Zhao, Y.; Golsanami, N.; Chen, L.; Yan, W. A novel type of neural networks for feature engineering of geological data: Case studies of coal and gas hydrate-bearing sediments. Geosci. Front. 2020, 11, 1511–1531. [Google Scholar] [CrossRef]
- Zhao, S.; Shadabfar, M.; Zhang, D.; Chen, J.; Huang, H. Deep learning-based classification and instance segmentation of leakage-area and scaling images of shield tunnel linings. Struct. Control Health Monit. 2021, 28, e2732. [Google Scholar] [CrossRef]
- Yasin, Q.; Ding, Y.; Baklouti, S.; Boateng, C.D.; Du, Q.; Golsanami, N. An integrated fracture parameter prediction and characterization method in deeply-buried carbonate reservoirs based on deep neural network. J. Pet. Sci. Eng. 2022, 208, 109346. [Google Scholar] [CrossRef]


| Input Parameter | Value |
|---|---|
| Riser depth | 6000 ft |
| Surface temperature | 68 (°F) |
| Temperature gradient | 1.6 (°F/100 ft) |
| Surface (back) pressure | 200 (psi) |
| Base oil density | 41 (API) |
| Base oil viscosity | 5.34 (MPa.s) |
| Producing gas-liquid ratio | 300 (scf/stb) |
| Water cut | 20 (%) |
| Drill-string outer diameter | 5.5 (inch) |
| Riser inner diameter | 17.5 (inch) |
| Liquid flow rate at standard condition | 500 gpm |
| Oil flow rate at standard condition | gpm |
| Gravitational acceleration constant | 32.17 ft/s2 |
Publisher’s Note: MDPI stays neutral with regard to jurisdictional claims in published maps and institutional affiliations. |
© 2022 by the authors. Licensee MDPI, Basel, Switzerland. This article is an open access article distributed under the terms and conditions of the Creative Commons Attribution (CC BY) license (https://creativecommons.org/licenses/by/4.0/).
Share and Cite
Golsanami, N.; Gong, B.; Negahban, S. Evaluating the Effect of New Gas Solubility and Bubble Point Pressure Models on PVT Parameters and Optimizing Injected Gas Rate in Gas-Lift Dual Gradient Drilling. Energies 2022, 15, 1212. https://doi.org/10.3390/en15031212
Golsanami N, Gong B, Negahban S. Evaluating the Effect of New Gas Solubility and Bubble Point Pressure Models on PVT Parameters and Optimizing Injected Gas Rate in Gas-Lift Dual Gradient Drilling. Energies. 2022; 15(3):1212. https://doi.org/10.3390/en15031212
Chicago/Turabian StyleGolsanami, Naser, Bin Gong, and Sajjad Negahban. 2022. "Evaluating the Effect of New Gas Solubility and Bubble Point Pressure Models on PVT Parameters and Optimizing Injected Gas Rate in Gas-Lift Dual Gradient Drilling" Energies 15, no. 3: 1212. https://doi.org/10.3390/en15031212
APA StyleGolsanami, N., Gong, B., & Negahban, S. (2022). Evaluating the Effect of New Gas Solubility and Bubble Point Pressure Models on PVT Parameters and Optimizing Injected Gas Rate in Gas-Lift Dual Gradient Drilling. Energies, 15(3), 1212. https://doi.org/10.3390/en15031212