Article

Piecewise Causality Study between Power Load and Vibration in Hydro-Turbine Generator Unit for a Low-Carbon Era

1
China Institute of Water Resources and Hydropower Research, Beijing 100038, China
2
Beijing IWHR Technology Co., Ltd., Beijing 100038, China
3
CREC Cloud Net Information Technology Co., Ltd., Beijing 100039, China
*
Author to whom correspondence should be addressed.
Energies 2022, 15(3), 1207; https://doi.org/10.3390/en15031207
Submission received: 3 January 2022 / Revised: 30 January 2022 / Accepted: 3 February 2022 / Published: 7 February 2022

Abstract

:
With the rapid development of wind and photovoltaic power generation, hydro-turbine generator units have to operate in a challenging way, resulting in obvious vibration problems. Because of the significant impact of vibration on safety and economical operation, it is of great significance to study the causal relationship between vibration and other variables. The complexity of the hydro-turbine generator unit makes it difficult to analyze the causality of the mechanism. This paper studied the correlation based on a data-driven method, then transformed the correlation into causality based on the mechanism. In terms of correlation, traditional research only judges whether there is a correlation between all data. When the data with correlation are interfered with by the data without correlation, the traditional methods cannot accurately identify the correlation. A piecewise correlation method based on change point detection was proposed to fill this research gap. The proposed method segmented time series pairs, then analyzed the correlation between subsequences. The causality between power load and vibration of a hydro-turbine generator unit was further analyzed. It indicated that when the power load is less than 200 MW, the causality is weak, and when the power load is greater than 375 MW, the causality is strong. The results show that the causality between vibration and power load is not fixed but piecewise. Furthermore, the piecewise correlation method compensated for the limitation of high variance of the maximum information coefficient.

1. Introduction

Under the guidance of carbon peak and carbon neutralization, many renewable energy sources such as wind power and photovoltaic have grown rapidly in recent years [1,2]. As renewable energy is easily affected by the natural environment, power load often fluctuates [3]. This requires the power grid to have reliable peak and frequency regulation capabilities [4]. The hydro-turbine generator units (HTGUs) are essential equipment for peak and frequency regulation [5,6]. Moreover, hydropower accounts for a large proportion in Southwest China [7,8].
In this context, HTGUs have to operate in a challenging way, which is in contradiction with the goal of safe and stable operation. Under the challenging operation mode, the vibration of HTGUs is a problem worthy of study. Approximately 90% of the failures are reflected in vibration [9,10]. Vibration may cause an unstable rotation speed of the HTGUs and unbalanced flow channel pressure, which eventually causes the unit to fail to operate safely and stably [11]. In addition, vibration also affects the efficiency of HTGUs [12]. Therefore, there is an urgent need to study vibration.
In general, HTGUs can be divided into three subsystems: hydraulic, mechanical, and electrical subsystem. The three subsystems are coupled together, forming a complex nonlinear system [13,14]. The vibration of this kind of complex system has induced scholars to carry out a lot of research, most of which studies vibration from the view of dynamic models.
Xu et al. proposed a finite element dynamic model to simulate vibration [15]. Zeng et al. established a generalized Hamiltonian system including the lateral vibration equation of the shaft system and the generator equation [16]. Li et al. constructed the stator pack structural model and the electrical model of the generator and used the finite element method for electrical simulation. The source of abnormal vibration can be found by comparing the generated vibration data with real data. [17]. Li et al. constructed a nonlinear dynamic model considering the gyroscopic effect [18]. Zhao et al. proposed a condition indicator called artificial damage index based on dynamic analysis, which can be used to detect the vibration of Pelton turbines [1]. Xu et al. used nonlinear modal methods to analyze the interaction between subsystems [13]. Sun et al. proposed a method to study the overall nonlinear dynamics of the generator-shaft-foundation coupling system and studied the influence of the foundation system and related parameters on vibration [19]. Shi et al. proposed a mathematical model of HTGU unbalanced rotor bending-torsional coupling vibration considering the arcuate whirl of the shafting [20].
The above studies explained the mechanism of vibration from the view of dynamic models. However, building a comprehensive model is complex and difficult [11]; for example, draft tube pressure pulsation is difficult to model [21]. The data-driven approach is a new direction. Bi et al. used data-driven methods to analyze the correlation between vibration and other variables, and used highly correlated variables and historical vibration data to predict vibration [22]. However, correlation does not imply causation. In addition, the operation and maintenance personnel of the power plant are more concerned about the main factors causing the vibration and the time series causality between the vibration and other variables. Recently, studies on causality have been very fruitful. So, studying the cause of vibration from the perspective of causality can ascertain the cause of vibration and lay the foundation for anomaly detection.
Many studies on time series causality have been conducted. Granger introduced time flow into the study of causality and proposed a method to evaluate causality in a two-variable time series [23]. On this basis, a number of Granger-like causality detection methods have been developed [24,25,26,27]. Schreiber first introduced transfer entropy in information theory into the study of causality [28]. On this basis, a number of causality detection methods based on information theory have been developed [29,30]. Sugihara et al. proposed a convergent cross map suitable for detecting nonlinear causality [31]. However, none of the above methods were designed for vibration research. Granger causality studied the causality in the economic field, and convergence cross-mapping studied the causality between the prey and the predator.
In general, the more data, the better, but this is not necessarily the case in actual situations. The state of HTGUs is changeable. Here, three reasons behind the change are analyzed. First, an installation error occurs when installing the shaft [32]. Second, when the power load changes, the deformation of the shaft [33] also changes. Third, with the accumulation of operation time, the parameters of HTGUs may change [34,35]. The above reasons lead to the fact that the causality between vibration and other variables is not fixed but presents piecewise characteristics. A piecewise causality analysis method is proposed to study this complex causality. It should be noted that this paper only studies the causal relationship between vibration and a single variable, but does not study the causal relationship between vibration and multiple variables.
This paper has three main innovations compared with previous studies:
  • A kind of piecewise causality was proposed. According to the mechanism of HTGU, piecewise correlation was used to replace piecewise causality.
  • A piecewise correlation analysis method based on change point detection and correlation analysis was proposed. The interference of data without correlation was effectively avoided.
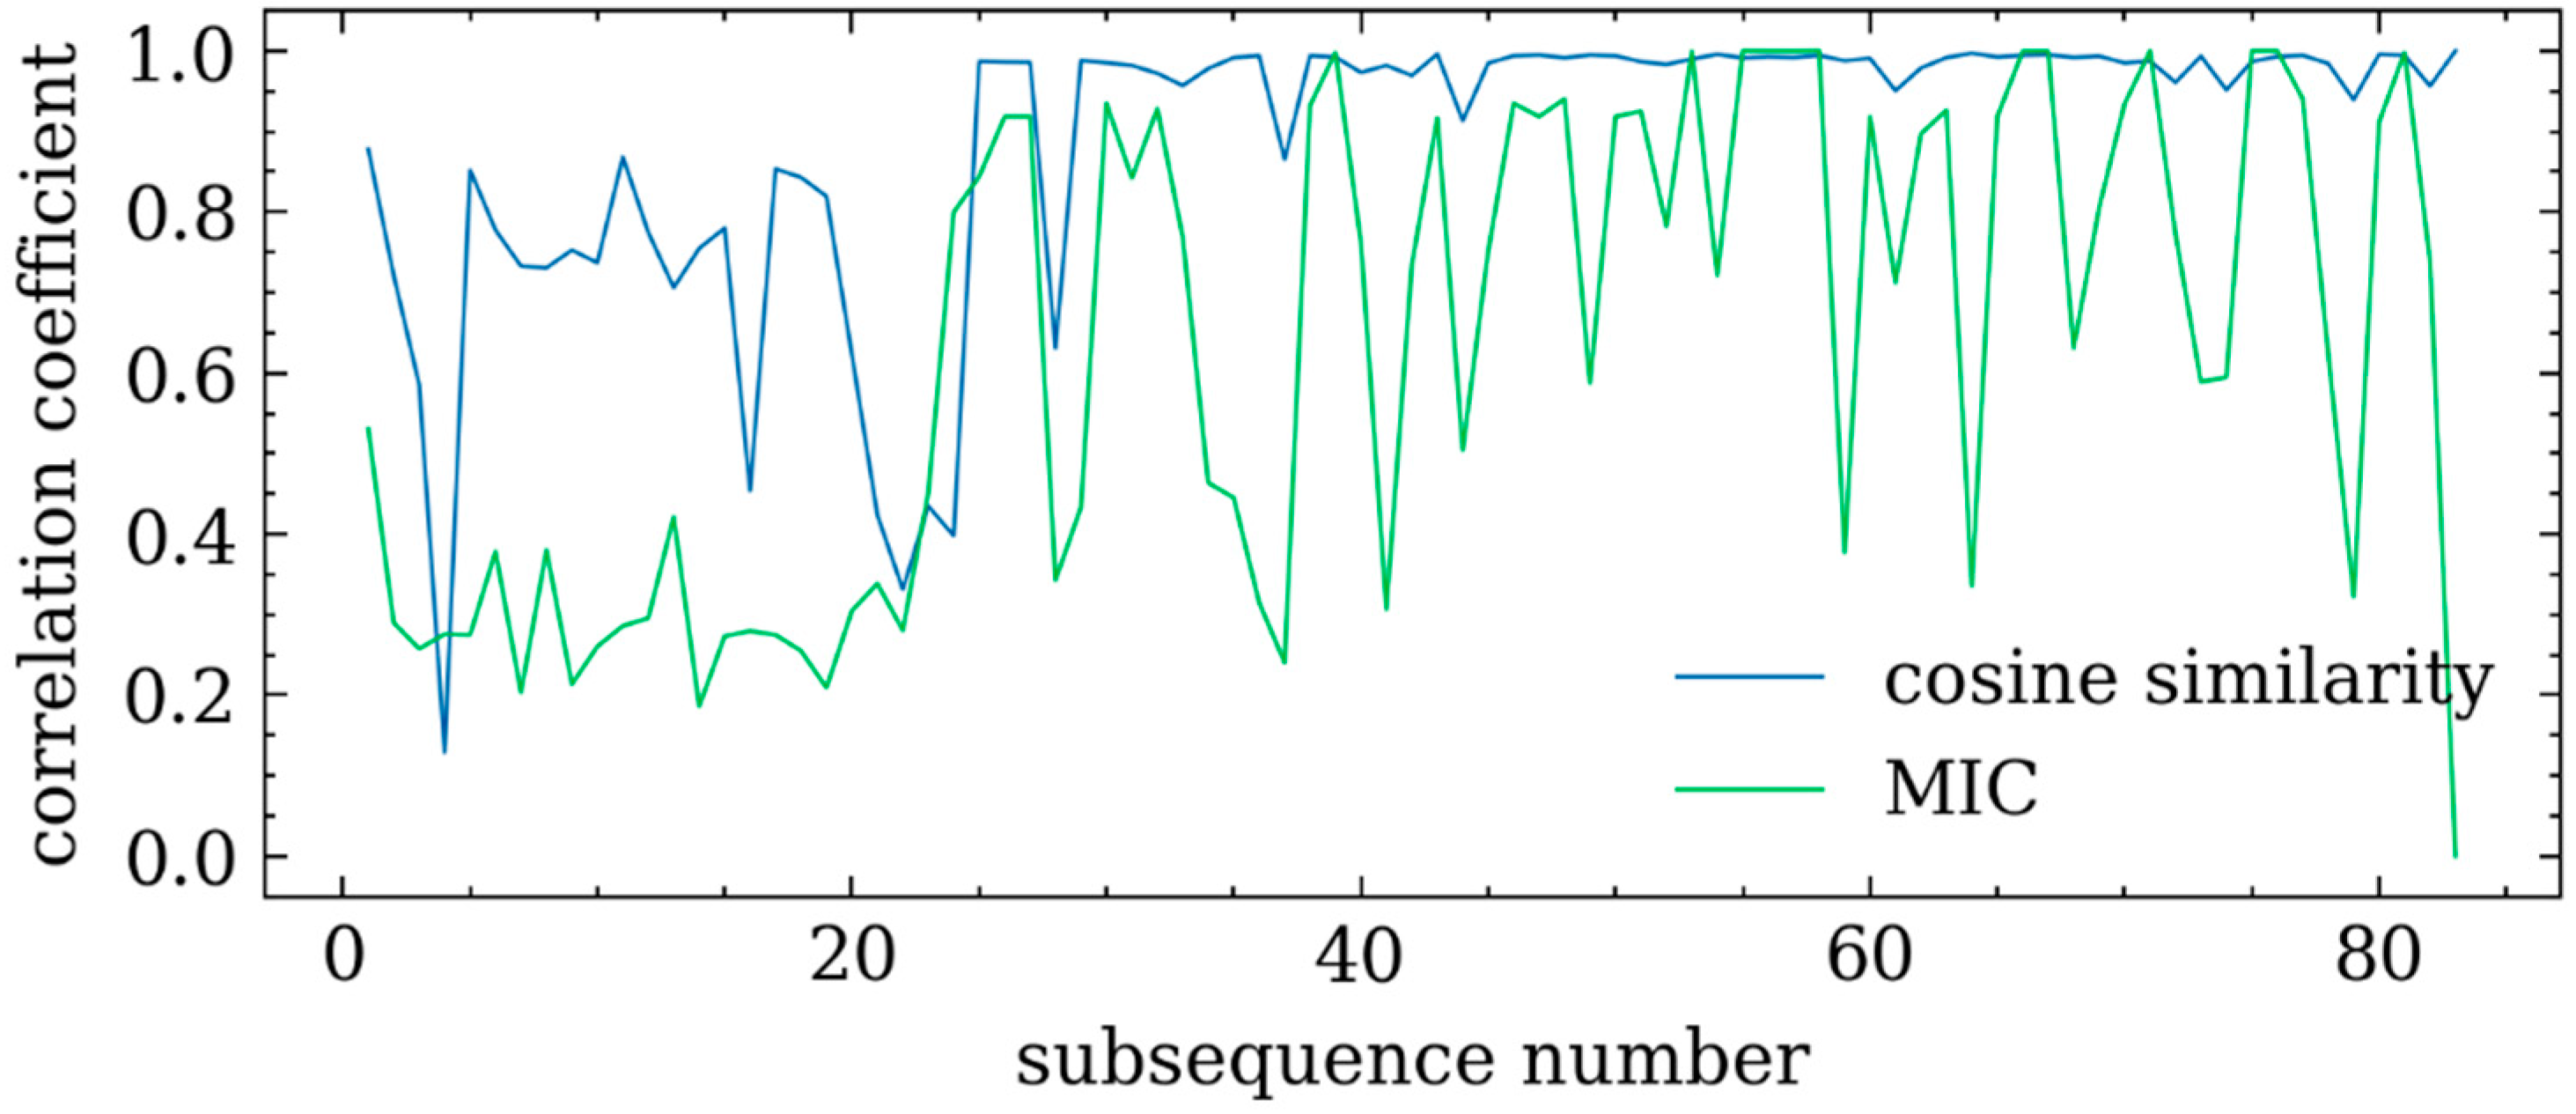
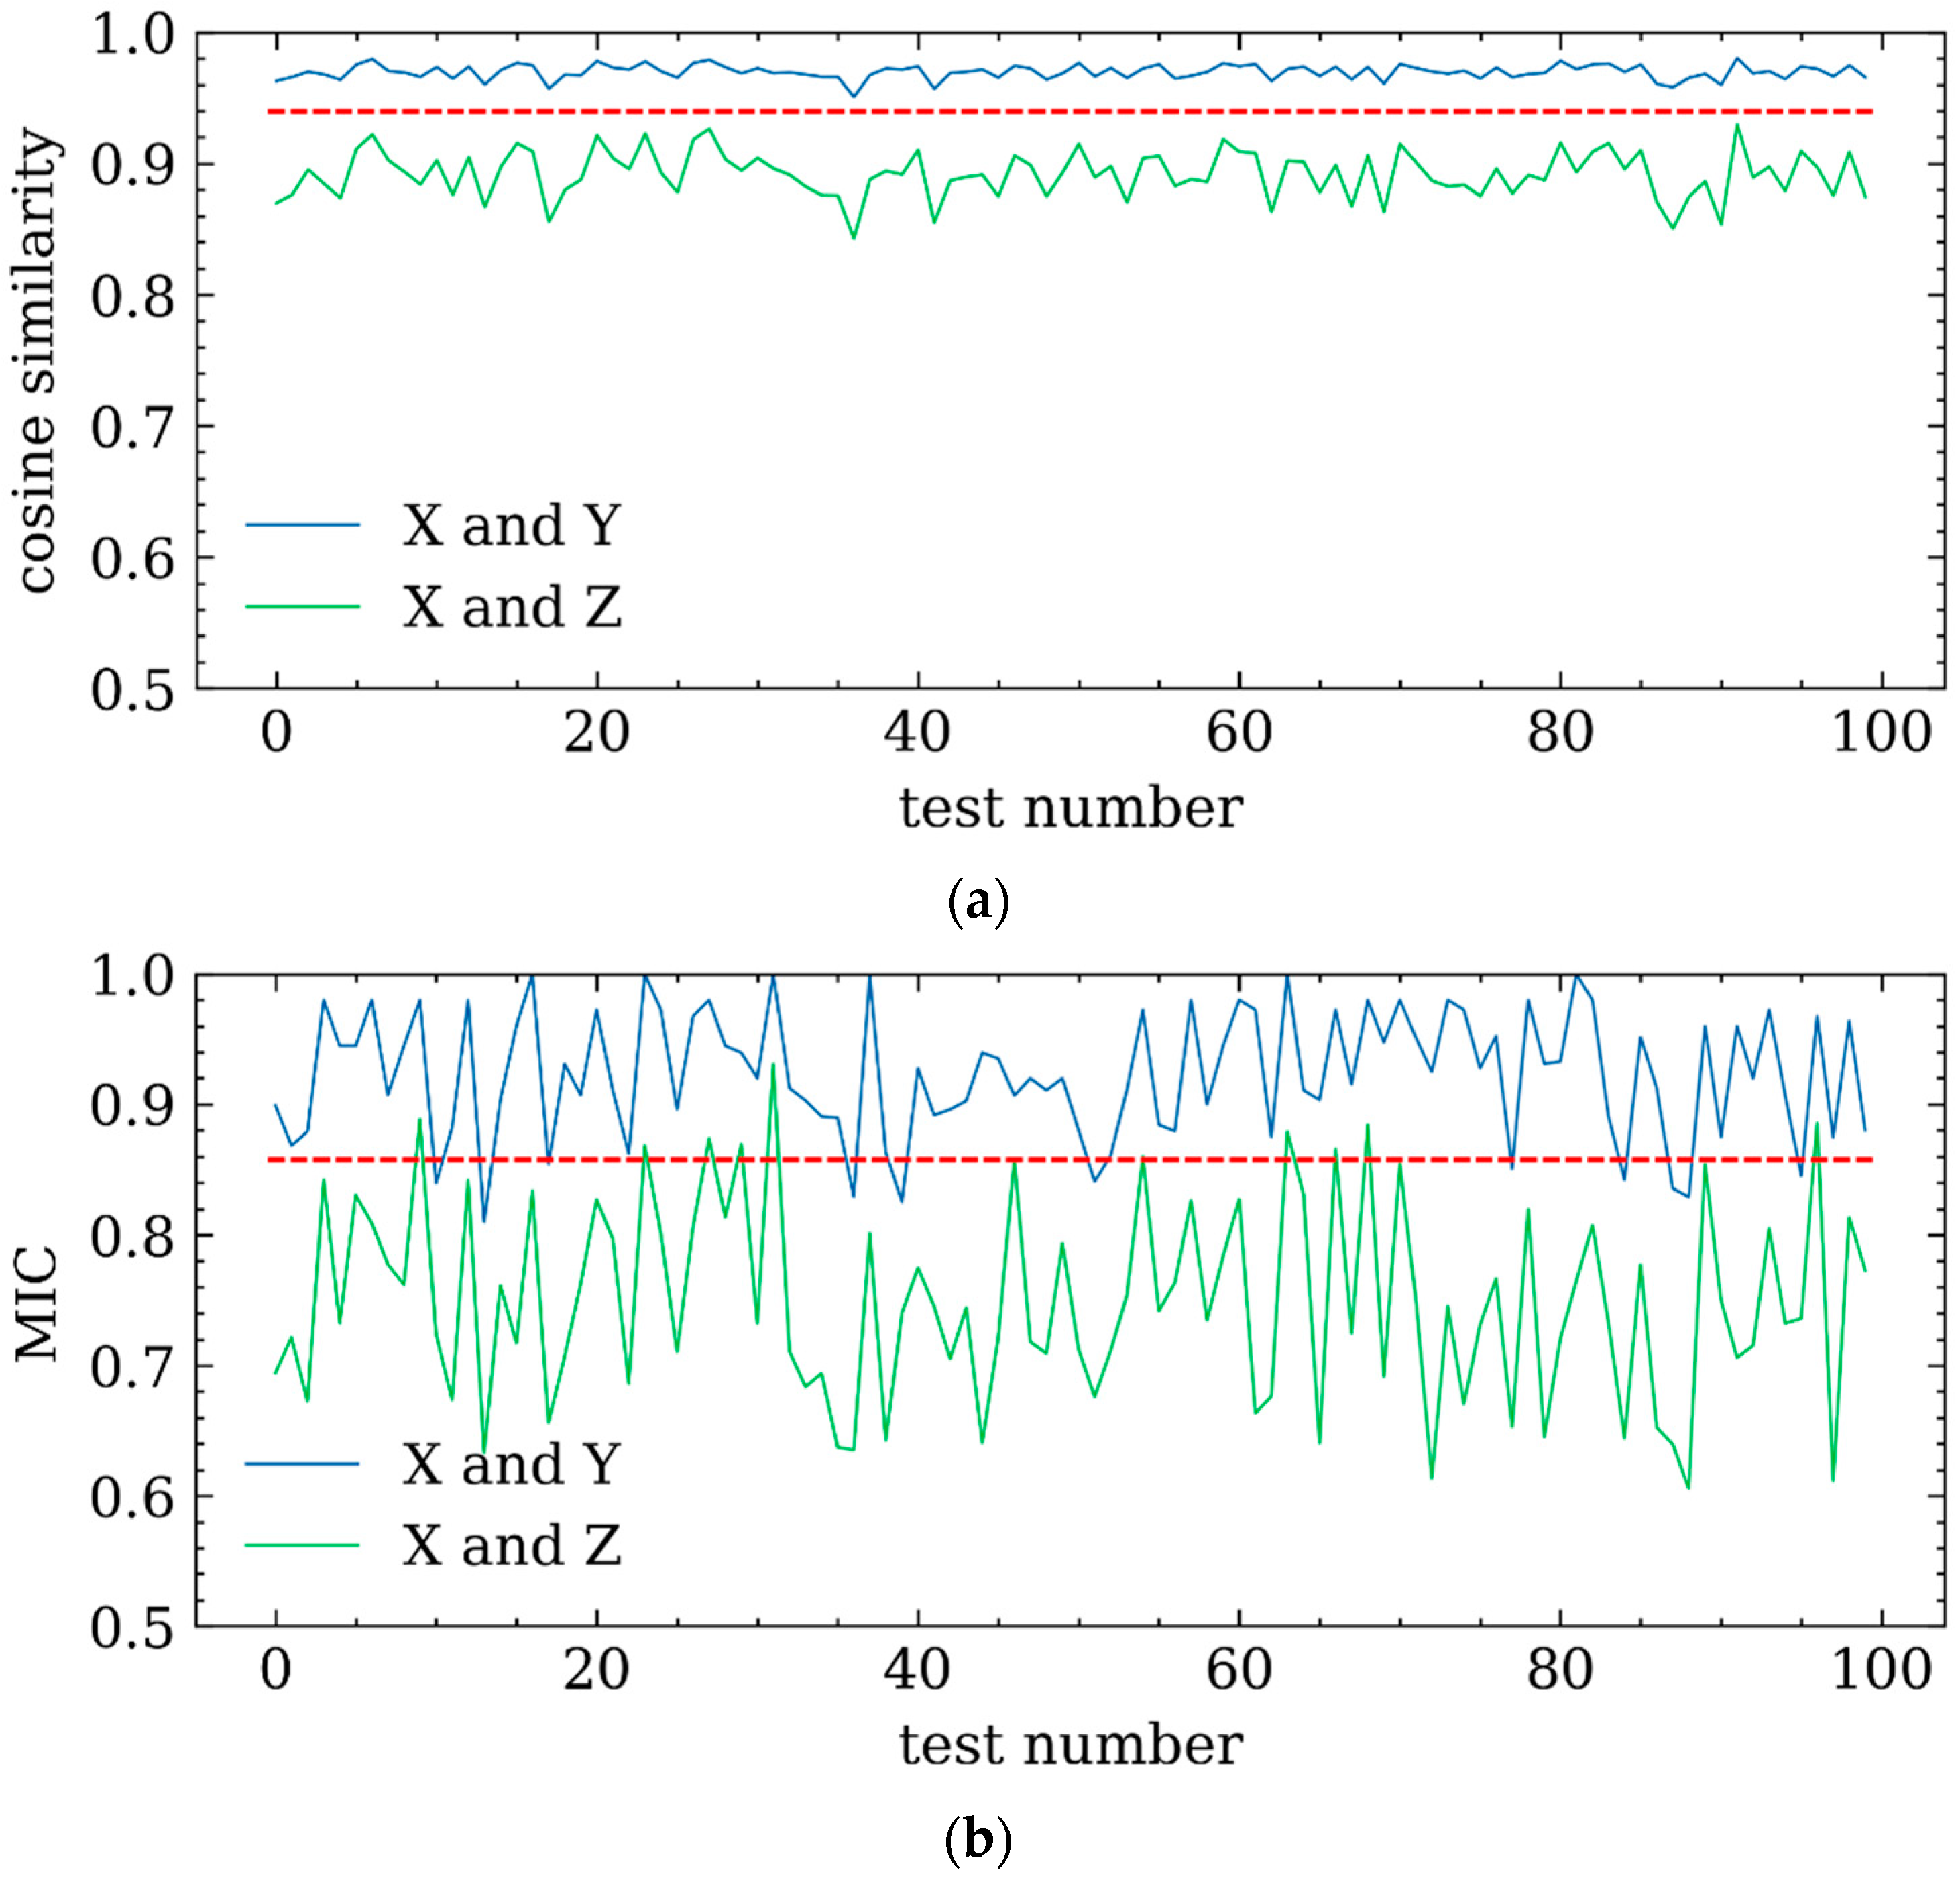
  • It was found that MIC has the problem of high variance. This paper used cosine similarity instead of MIC to avoid high variance.

2. Methods

This paper studies causality piecewise by utilizing piecewise correlation. The difference between the correlation and causality of the two variables is that the latter has directional information, which reveals whether the variable is cause or consequence. The piecewise causality can be obtained based on piecewise correlation and directional information. Section 2.1 gets the directional information from the mechanism, and Section 2.2 investigates the piecewise correlation quantitatively.

2.1. Mechanism Analysis

From the perspective of unbalanced forces, three kinds of unbalanced forces: unbalanced hydraulic force, unbalanced electrical force, and unbalanced mechanical force, act together to cause the vibration of the HTGU [36]. The unbalanced hydraulic force refers to the disturbing force generated by the water flow to the flow parts of the turbine. The hydraulic unbalance is mainly caused by cavitation occurring on the draft tube and runner. Cavitation is closely related to power load [12,37,38]. In other words, the power load affects the hydraulic imbalance.
The unbalanced mechanical force refers to the inertia and friction of the mechanical part. The unbalanced mechanical force is mainly caused by the misalignment of the rotor shaft system and insufficient shaft system rigidity. After the installation of the HTGU is completed, the degree of shafting misalignment can be considered unchanged when the HTGU is at a standstill. However, when the HTGU is rotating, the shaft system will be deformed [33]. Moreover, as the power load becomes larger, the shafting force becomes larger, resulting in greater bearing deformation and further aggravation of shaft misalignment, leading to greater unbalanced mechanical force [39].
The unbalanced electrical force refers to the radial unbalanced magnetic force caused by the uneven air gap of the generator. The uneven air gap is mainly caused by the misalignment of the shafting, and the misalignment of the shafting is closely related to the power load [39]. In addition, as the excitation current increases, the unbalanced electrical force becomes larger. The excitation current mainly depends on the change of power load and reactive power [40].
From the analysis of the above three types of unbalanced forces, the power load affects the three kinds of unbalanced force simultaneously, and finally affects the vibration of the HTGU. The power load has made the main contribution to the unbalanced force, so the paper studies the influence of the power load on the vibration.

2.2. Piecewise Causality Based on Change Point Detection

This paper proposes a combined algorithm (CPDC) based on change point detection [41] and correlation analysis. The change point detection acts as a segmenter, and the correlation analysis acts as a comparator. CPDC is used to explore the piecewise causality between power load and vibration. The exploration process can be divided into four steps: change point detection, change point matching, correlation analysis, and causality detection.
To clearly illustrate the proposed CPDC method, change point detection is briefly introduced first. Change point detection assumes piecewise stationary to segment the time series. A series of change points divide the time series into a subseries, in which the data in each subseries have similar statistical characteristics. In this paper, the number of change points in time series is uncertain. The change point detection used in this paper is an optimization problem with constraints. Linear penalty function and kernel-based loss function are used to construct the objective function to deal with constrained optimization problems. Fortunately, this objective function can be optimized by the PELT algorithm, which has linear complexity [41].
  • Change point detection. Change points can be obtained by change point detection. The change point detection method based on the Gaussian kernel is selected for the unknown number of change points in the time series of interest and the unclear probability distribution. Taking the active power time series as an example, the number of active power changes is uncertain and random [14,42]. The specific change point detection algorithm can be found in Ref. [41].
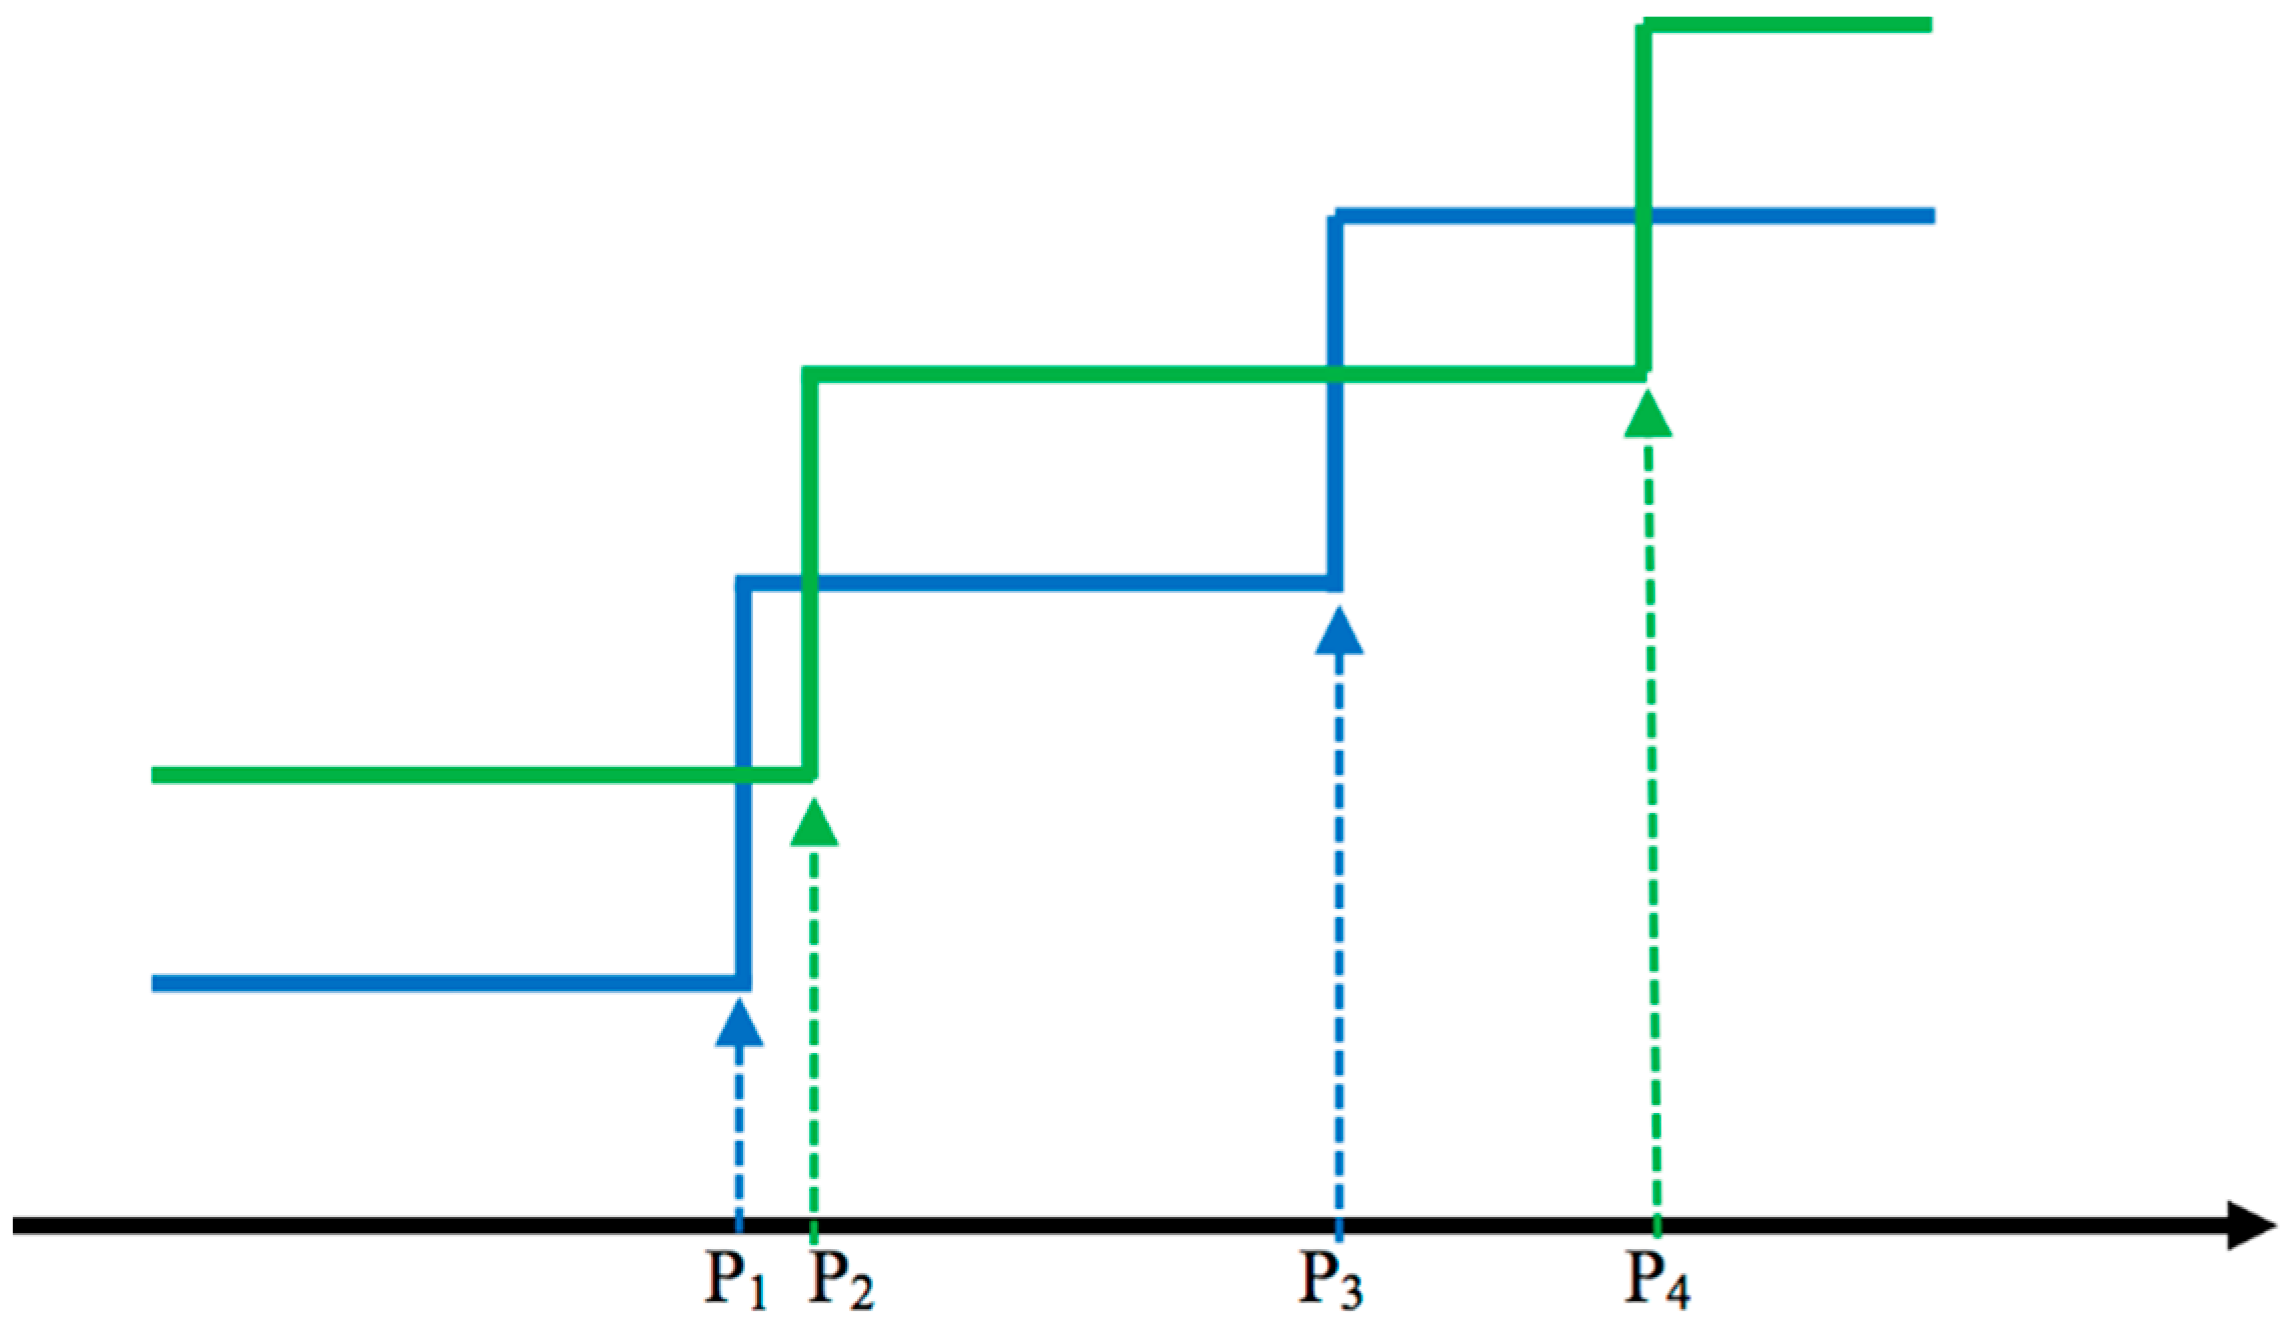
  • Change point matching. When the difference between the two change points from the two-variable time series does not exceed the threshold, the two change points are said to match each other. Change points that cannot match each other often appear in actual situations. The augmented change point is proposed to divide the two-variable time series into subsequences aligned. When the change points can match each other, the larger change point is taken as the augmented change point; when the change points cannot match, the two change points are both used as the augmented change points. All augmented change points are arranged in ascending order to form an augmented change point sequence. As shown in Figure 1, the first change points of two lines P1 and P2 are relatively close and can match each other. Therefore, P2 can replace P1 and P2 as the augmented change point. The second change points of two lines P3 and P4 are far apart and cannot match each other. Therefore, both P3 and P4 are kept as augmented change points. The augmented change point sequence formed by the change points in Figure 1 is { P 2 , P 3 , P 4 } .
  • Correlation analysis. The augmented change point sequence obtained above can extract subsequences from the time series. According to a time range, two subsequences are extracted from the time series x and y. The time range of the subsequence xi and yi corresponding to the augmented change point Pi is Pi−1 to Pi+1. Then, xi and yi are normalized by MinMaxScaler, respectively. Finally, cosine similarity si between xi and yi is calculated by formulation:
    s i = x i y i x i y i
    forming the cosine similarity sequence s.
  • Causality detection. It is considered that the causality between the subsequences is weak when the cosine similarity is less than the set threshold. On the contrary, it is believed that the causality is strong.
Although only CPCD mentioned in Section 2.2 is used in calculating piecewise causality, the mechanism analysis in Section 2.1 is the basis of CPCD, which builds a bridge between correlation and causality. This will be explained in detail in Section 4.2. In general, a data-driven approach based on domain knowledge is proposed, which is different from the model-based approach.
The proposed method obtains directional information from domain knowledge and piecewise correlations from the data, and fuses the two to obtain piecewise causality. This fusion is an effective use of domain knowledge and data. Significantly, the proposed piecewise correlations effectively solve the problems of traditional correlations. Figure 2 is a simple example that cannot be analyzed by the traditional correlation method. There is no correlation between the two curves in the left half, but there is a correlation between the two curves in the right half. The traditional method arbitrarily considers that there is no correlation between these two curves or that there is a correlation between these two curves. This problem can be handled well using the piecewise correlation method.
Figure 1. Schematic diagram of augmented change point.
Energies 15 01207 g001
Figure 2. Schematic diagram of augmented change point.
Energies 15 01207 g002

3. Results

The measured data came from an HTGU, consisting of a Francis turbine and a vertical-shaft semi-umbrella generator, with a rated speed of 125 r/min and a rated power of 600 MW.
We used active power (P) and the peak-to-peak value of vibration in the X direction of the upper guide bearing (Vugx) to quantify power load and vibration, respectively, and then studied the piecewise causality between power load and vibration based on these two variables. The following explains why these two variables were used for research.
For an HTGU, under a specific water head, both the turbine’s flow rate and the generator’s P can be used to measure the power load. However, since the relative error of P is less than that of the flow rate, and the water head is often time changing, P is selected to measure the power load.
There are two main types of vibration: radial vibration and axial vibration. This paper focuses on radial vibration, including upper guide swing, lower guide swing, and water guide swing. Figure 3 is used to explain why the upper guide was chosen for the study. It shows that the peak-to-peak value of the upper guide is almost twice as large as that of the lower guide and water guide. In addition, the sensors for measuring the three X-direction vibrations are with the same measurement accuracy. Vugx was chosen to measure the vibration, considering that the relative error of Vugx is the smallest.
We collected P and Vugx time series data with a time length of 1400 and a sampling interval of 1 min. The collected data are shown in Figure 4a,b, which shows that the relationship between Vugx and P is complex. The following content analyzes this complex relationship in detail.
In the change point detection step, the kernel change point detection (kernelCPD) in the Python package ruptures was used to segment the time series [41]. The specific parameter selection is shown in Table 1.
The change point difference threshold is 5 in the change point matching step. The correlation threshold is 0.95 in the causal detection step.
The results of segmenting P and Vugx are shown in Figure 5a,b, respectively. They show that the change points of P are very different from those of Vugx in the first 509 data.
Figure 5a,b present the intermediate results of the piecewise causality analysis. They show that the number of change points of P is much more than that of Vugx. Firstly, the fluctuation of P is relatively small, which makes the change points of P easier to find. Secondly, the change of P does not necessarily cause the change of Vugx.
P and Vugx are segmented according to the same change point sequence by change point matching. Then, the cosine similarities between the subsequences of P and the Vugx are calculated, as shown in Figure 6. The larger the correlation coefficient, the stronger the causality between the subsequence of P and that of Vugx.
Figure 6 also implements the MIC [43] method to calculate the correlation between the two sequences for comparison. Judging from the line graph of cosine similarity, the first 24 pieces of data are within correlation threshold 0.95, and most of the later data exceed it. From the value of MIC, a similar conclusion can hardly be drawn because the fluctuation of the MIC line graph is greater than the cosine similarity. This will be discussed in detail in Section 4.2.
Figure 6 shows that the causality between P and Vugx is weak in the time range corresponding to 1–24 subsequences, and the causality between P and Vugx is strong in the time range corresponding to 25–83 subsequences. To observe this rule intuitively, the broken line diagrams of 1–23 subsequences, 25–83 subsequences, and 24 subsequences of P and Vugx are presented in Figure 7a–c, respectively.
Figure 7a–c visually reveal when the causality is stronger and when it is weaker. Figure 7a,b show that P corresponding to 1~472 min is smaller, and P corresponding to 509–1400 min is larger. The influence of power load on vibration obtained in Section 2.1 plays a fundamental role here. There is weak causality between P and Vugx when P < 200 MW. There is strong causality between P and Vugx, and it reveals that Vugx is predominantly affected by P when P > 375 MW. In addition, Figure 7c shows that the causality between P and Vugx is weak when P changes from a small value to a large value.
For comparison, we calculated the correlation coefficients between P and Vugx in the three time periods, and the results are shown in Table 2. Observing by row, it is easy to find that the value gradually increases. This implies that if the segmentation processing is not used, it is likely to be mistaken for simple causality between P and Vugx. P and Vugx only have strong causality during 509–1400 min.
From the last row of Table 2, it is easy to mistakenly believe that there is no causality between P and Vugx if segmentation is not carried out. In fact, P and Vugx have piecewise causality. The proposed method is a useful supplement to the MIC method.
Finally, it shows that the relationship between power load and the vibration is not a simple causality but a complex piecewise causality.

4. Discussion

4.1. Compare the Difference of MIC and Cosine Similarity Based on Variance

Both MIC [43] and cosine similarity can measure the degree of correlation between the two sets of data, but from Figure 5, the value of MIC fluctuates far more than the cosine similarity. This kind of fluctuation brings great difficulties to the analysis of piecewise causality.
We used simulated data to evaluate the variance of MIC and cosine similarity. Take three random variables x, y, and z, where y = 2x + 0.5ε, z = 2x + ε, and x and ε both obey the standard normal distribution. Randomly generate x, y, and z samples { x 1 , x 2 , x n } , { y 1 , y 2 , y n } , and { z 1 , z 2 , z n } , where n is the sample size. Here, we set n = 100. Normalize the three sets of samples by MaxMinScaler, respectively. Calculate the MIC and cosine similarity. Repeat the test 100 times, and the results are shown in Figure 8.
Figure 8a,b can intuitively reveal why cosine similarity is better than MIC. In Figure 8a, the blue line represents the cosine similarity between X and Y obtained in 100 trials, and the green line represents the cosine similarity between X and Z obtained in 100 trials. In Figure 8b, the blue line represents the MIC between X and Y obtained in 100 trials, and the green line represents the MIC between X and Z obtained in 100 trials. The dotted line in Figure 8a can distinguish the blue line and the green line well, but the dotted line in Figure 8b cannot. This implies that the cosine similarity is more capable of distinguishing the strength of the correlation relationship than the MIC. The blue and green lines in Figure 8b fluctuate greatly and are intertwined together, which makes it impossible to distinguish well. The fluctuation of the line can be measured by variance. Next, from the perspective of variance, further, we analyze the difference between MIC and cosine similarity.
The following only considers the correlation coefficient between X and Z. The variance of the MIC and cosine similarity calculation results are calculated under different sample sizes to further study fluctuation. Table 3 shows that the larger the sample size n, the smaller the variance. When the sample size n is the same, the variance of the cosine similarity is smaller than that of MIC. It shows that cosine similarity can more stably measure the correlation than MIC. For this paper, where the amount of data is small, cosine similarity is more appropriate.

4.2. Correlation and Causality

Cosine similarity is an uncentralized Pearson correlation coefficient [44]. Correlation is one of the main methods to quantify causality but loses the causal relationship’s directional information [45]. For example, there is a strong correlation between M and N. Still, from the strong correlation alone, it cannot be concluded that M leads to N or N leads to M. Section 2.1 clarifies how power load affects vibration by qualitatively studying the causality between power load and vibration. With the directional information provided by a qualitative study, correlations can reveal causality to a certain extent.

4.3. Piecewise Causality

Figure 5, Figure 6 and Figure 7 show that the causality between P and Vugx is strong when P is large. In addition, the causality between P and Vugx is weak when P is small. This seems to be somewhat contradictory to the analysis in Section 2.1, but this is normal. This is because when P is small, the HTGU is in an unstable zone. This leads to large fluctuations of Vugx, and Vugx does not change with P.
The above complex causality is piecewise causality. This segmented operation is necessary and meaningful in the changeable industrial environment.

4.4. Advantages and Limitations

Bi et al. [22] believe that there is a strong correlation between P and Vugx. However, the results show that the relationship between P and Vugx is not stable but has a piecewise causality. In other words, the causality is strong in one section and weak in another section. The stable relationship between P and Vugx is the basis for predicting Vugx based on data such as P. This instability will affect some data processing tasks and deserves attention.
CPDC is suitable for analyzing piecewise causality. In addition, CPDC focuses on the data around the change point instead of the entire data, which reduces the amount of data that needs to be processed. The limitation of CPDC is that the change point detection method assumes that the data is piecewise stationary, and further research is needed for situations that do not meet this assumption.

5. Conclusions

Based on the domain knowledge and data-driven method of HTGUs, this paper proposed CPDC to study the piecewise causal relationship between vibration and power load. In this paper, the active power and vibration peak value of the upper guide bearing of HTGU were selected as the typical observation of power load and vibration, respectively. The piecewise correlation between vibration and power load was quantitatively studied by change point detection and correlation analysis methods. Further, based on the domain knowledge of HTGUs, the piecewise causal relationship between vibration and power load was clarified. The traditional correlation method cannot handle the case of segmentation of correlation, and the proposed piecewise correlation method solved this problem well. Three main conclusions are drawn. Firstly, from the qualitative analysis of mechanical, electrical, and hydraulic aspects, there is a causal relationship between power load and vibration. Among them, the power load is the cause, and the vibration is the result. Secondly, for a specific HTGU, the causal relationship between power load and the vibration is piecewise. Specifically, when the power load is small, the causal relationship between power load and the vibration is weak. When the power load is large, the causal relationship between the two is vital. Thirdly, from the perspective of statistical calculation, the variance of cosine similarity estimated by samples is less than that of MIC. The CPDC method proposed can find the piecewise correlation without being disturbed by the part without correlation. CPDC has value in studying the complex causality between vibration and other variables, and may also be applied to similar complex correlation studies.

Author Contributions

Conceptualization, L.D.; funding acquisition, G.W., C.H., and W.Z.; methodology, L.D.; project administration, D.W., X.L., and C.W.; validation, L.D.; visualization, C.C.; writing—original draft, L.D.; writing—review and editing, D.W., C.W., X.L., and Z.C. All authors have read and agreed to the published version of the manuscript.

Funding

This research was funded by the IWHR Research & Development Support Program of China under grant AU0145B022021 and AU0145B032021.

Institutional Review Board Statement

Not applicable.

Informed Consent Statement

Not applicable.

Data Availability Statement

Not applicable.

Conflicts of Interest

The authors declare no conflict of interest.

Nomenclature

CPDCchange point detection and correlation analysis
HTGUhydro-turbine generator units
kernelCPDkernel change point detection
MICmaximum information coefficient
Pactive power
Vlgxpeak-to-peak value of vibration in X direction of the lower guide bearing
Vugxpeak-to-peak value of vibration in X direction of the upper guide bearing
Vwgxpeak-to-peak value of vibration in X direction of the water guide bearing

References

  1. Zhao, W.; Egusquiza, M.; Estevez, A.; Presas, A.; Valero, C.; Valentín, D.; Egusquiza, E. Improved damage detection in Pelton turbines using optimized condition indicators and data-driven techniques. Struct. Health Monit. 2021, 20, 3239–3251. [Google Scholar] [CrossRef]
  2. Yang, Z.; Sun, G.; Behrens, P.; Østergaard, P.A.; Egusquiza, M.; Egusquiza, E.; Xu, B.; Chen, D.; Patelli, E. The potential for photovoltaic-powered pumped-hydro systems to reduce emissions, costs, and energy insecurity in rural China. Energy Convers. Manag. X 2021, 11, 100108. [Google Scholar] [CrossRef]
  3. Saeed, A.; Li, C.; Gan, Z.; Xie, Y.; Liu, F. A simple approach for short-term wind speed interval prediction based on independently recurrent neural networks and error probability distribution. Energy 2022, 238, 122012. [Google Scholar] [CrossRef]
  4. Feng, C.; Zheng, Y.; Li, C.; Mai, Z.; Wu, W.; Chen, H. Cost advantage of adjustable-speed pumped storage unit for daily operation in distributed hybrid system. Renew. Energy 2021, 176, 1–10. [Google Scholar] [CrossRef]
  5. Zhao, W.; Egusquiza, M.; Valero, C.; Valentín, D.; Presas, A.; Egusquiza, E. On the use of artificial neural networks for condition monitoring of pump-turbines with extended operation. Measurement 2020, 163, 107952. [Google Scholar] [CrossRef]
  6. Xiong, H.; Egusquiza, M.; Alberg Østergaard, P.; Pérez-Díaz, J.I.; Sun, G.; Egusquiza, E.; Patelli, E.; Xu, B.; Duan, H.; Chen, D.; et al. Multi-objective optimization of a hydro-wind-photovoltaic power complementary plant with a vibration avoidance strategy. Appl. Energy 2021, 301, 117459. [Google Scholar] [CrossRef]
  7. Wang, C.; Wang, D.; Zhang, J. Experimental Study on the Optimal Strategy for Power Regulation of Governing System of Hydropower Station. Water 2021, 13, 421. [Google Scholar] [CrossRef]
  8. Wang, C.; Wang, D.; Zhang, J. Experimental study on isolated operation of hydro-turbine governing system of Lunzua hydropower station in Zambia. Renew. Energy 2021, 180, 1237–1247. [Google Scholar] [CrossRef]
  9. Kahraman, G.; Ozdemir, O. Mathematical modeling of vibration failure caused by balancing effect in hydraulic turbines. Mech. Based Des. Struct. Mach. 2021. [Google Scholar] [CrossRef]
  10. Luo, J.; Wang, X.; Xu, Y. Vibration fault diagnosis for hydroelectric generating unit based on generalized S-transform and QPSO-SVM. In Proceedings of the 2019 IEEE Sustainable Power and Energy Conference (iSPEC), Beijing, China, 21–23 November 2019; pp. 2133–2137. [Google Scholar] [CrossRef]
  11. Xu, B.; Zhang, J.; Egusquiza, M.; Chen, D.; Li, F.; Behrens, P.; Egusquiza, E. A review of dynamic models and stability analysis for a hydro-turbine governing system. Renew. Sustain. Energy Rev. 2021, 144, 110880. [Google Scholar] [CrossRef]
  12. Celebioglu, K.; Altintas, B.; Aradag, S.; Tascioglu, Y. Numerical research of cavitation on Francis turbine runners. Int. J. Hydrog. Energy 2017, 42, 17771–17781. [Google Scholar] [CrossRef]
  13. Xu, B.; Luo, X.; Egusquiza, M.; Ye, W.; Liu, J.; Egusquiza, E.; Chen, D.; Guo, P. Nonlinear modal interaction analysis and vibration characteristics of a francis hydro-turbine generator unit. Renew. Energy 2021, 168, 854–864. [Google Scholar] [CrossRef]
  14. Zhang, H.; Chen, D.; Xu, B.; Patelli, E.; Tolo, S. Dynamic analysis of a pumped-storage hydropower plant with random power load. Mech. Syst. Signal Process. 2018, 100, 524–533. [Google Scholar] [CrossRef] [Green Version]
  15. Xu, Y.; Li, Z.; Lai, X. Dynamic Model for Hydro-Turbine Generator Units Based on a Database Method for Guide Bearings. Shock Vib. 2013, 20, 426849. [Google Scholar] [CrossRef]
  16. Zeng, Y.; Zhang, L.; Guo, Y.; Qian, J.; Zhang, C. The generalized Hamiltonian model for the shafting transient analysis of the hydro turbine generating sets. Nonlinear Dynam. 2014, 76, 1921–1933. [Google Scholar] [CrossRef] [Green Version]
  17. Li, R.; Li, C.; Peng, X.; Wei, W. Electromagnetic Vibration Simulation of a 250-MW Large Hydropower Generator with Rotor Eccentricity and Rotor Deformation. Energies 2017, 10, 2155. [Google Scholar] [CrossRef] [Green Version]
  18. Li, J.; Chen, D.; Liu, G.; Gao, X.; Miao, K.; Li, Y.; Xu, B. Analysis of the gyroscopic effect on the hydro-turbine generator unit. Mech. Syst. Signal Process. 2019, 132, 138–152. [Google Scholar] [CrossRef]
  19. Sun, W.; Guo, Z. Mathematical modeling and nonlinear vibration analysis of a coupled hydro-generator shaft-foundation system. Commun. Nonlinear Sci. Numer. Simul. 2021, 98, 105776. [Google Scholar] [CrossRef]
  20. Shi, Y.; Zhou, J.; Lai, X.; Xu, Y.; Guo, W.; Liu, B. Stability and sensitivity analysis of the bending-torsional coupled vibration with the arcuate whirl of hydro-turbine generator unit. Mech. Syst. Signal Process. 2021, 149, 107306. [Google Scholar] [CrossRef]
  21. Zhang, L.; Wu, Q.; Ma, Z.; Wang, X. Transient vibration analysis of unit-plant structure for hydropower station in sudden load increasing process. Mech. Syst. Signal Process. 2019, 120, 486–504. [Google Scholar] [CrossRef]
  22. Bi, Y.; Zheng, B.; Zhang, Y.; Zhu, X.; Jiang, Y.; Li, C. Vibration trend prediction of hydroelectric generating unit based on MIC and BiGRU. J. Hydraul. Eng. 2021, 52, 612–621, 632. [Google Scholar] [CrossRef]
  23. Granger, C. Investigating Causal Relations by Econometric Models and Cross-Spectral Methods. Econometrica 1969, 37, 424–438. [Google Scholar] [CrossRef]
  24. Hu, M.; Liang, H. A copula approach to assessing Granger causality. Neuroimage 2014, 100, 125–134. [Google Scholar] [CrossRef]
  25. Montalto, A.; Stramaglia, S.; Faes, L.; Tessitore, G.; Prevete, R.; Marinazzo, D. Neural networks with non-uniform embedding and explicit validation phase to assess Granger causality. Neural Netw. 2015, 71, 159–171. [Google Scholar] [CrossRef] [PubMed] [Green Version]
  26. Siggiridou, E.; Kugiumtzis, D. Granger Causality in Multivariate Time Series Using a Time-Ordered Restricted Vector Autoregressive Model. IEEE T. Signal Process. 2016, 64, 1759–1773. [Google Scholar] [CrossRef]
  27. Yang, G.; Wang, L.; Wang, X. Reconstruction of Complex Directional Networks with Group Lasso Nonlinear Conditional Granger Causality. Sci. Rep. 2017, 7, 2991. [Google Scholar] [CrossRef] [PubMed] [Green Version]
  28. Thomas, S. Measuring Information Transfer. Phys. Rev. Lett. 2000, 85, 461–464. [Google Scholar] [CrossRef] [Green Version]
  29. Kugiumtzis, D. Direct-coupling information measure from nonuniform embedding. Phys. Rev. E 2013, 87, 062918. [Google Scholar] [CrossRef] [Green Version]
  30. Kugiumtzis, D. Partial transfer entropy on rank vectors. Eur. Phys. J. Spec. Top. 2013, 222, 401–420. [Google Scholar] [CrossRef] [Green Version]
  31. Sugihara, G.; May, R.; Ye, H.; Hsieh, C.h.; Deyle, E.; Fogarty, M.; Munch, S. Detecting Causality in Complex Ecosystems. Science 2012, 338, 496–500. [Google Scholar] [CrossRef]
  32. An, X. Vibration Characteristics and Fault Diagnosis for Hydraulic Generator Units; Huazhong University of Science & Technology: Wuhan, China, 2009. [Google Scholar]
  33. Pennacchi, P.; Borghesani, P.; Chatterton, S. A cyclostationary multi-domain analysis of fluid instability in Kaplan turbines. Mech. Syst. Signal Process. 2015, 60–61, 375–390. [Google Scholar] [CrossRef]
  34. Xu, B.; Chen, D.; Li, H.; Yan, D. Effects of parameter variation on a Pelton hydropower station system’s shafting vibration. J. Vib. Shock 2019, 38, 10–18. [Google Scholar] [CrossRef]
  35. Xu, B.; Chen, D.; Zhang, H.; Li, C.; Zhou, J. Shaft mis-alignment induced vibration of a hydraulic turbine generating system considering parametric uncertainties. J. Sound Vib. 2018, 435, 74–90. [Google Scholar] [CrossRef]
  36. Yan, D.; Chen, Q.; Zheng, Y.; Liu, W. Parameter sensitivity and dynamic characteristic analysis of bulb hydro generating unit with shaft crack fault. Mech. Syst. Signal Process. 2021, 158, 107732. [Google Scholar] [CrossRef]
  37. Pereira, J.G., Jr.; Favrel, A.; Andolfatto, L.; Landry, C.; Alligné, S.; Nicolet, C.; Avellan, F. Procedure for predicting part load resonance in Francis turbine hydropower units based on swirl number and local cavitation coefficient similitude. Mech. Syst. Signal Process. 2019, 132, 84–101. [Google Scholar] [CrossRef]
  38. Yu, Z.F.; Wang, W.Q.; Yan, Y.; Liu, X.S. Energy loss evaluation in a Francis turbine under overall operating conditions using entropy production method. Renew. Energy 2021, 169, 982–999. [Google Scholar] [CrossRef]
  39. Guo, B.; Xu, B.; Chen, D.; Ye, W.; Li, H. Vibration Characteristics of a Hydroelectric Generating System During the Load Rejection Process. J. Comput. Nonlinear Dyn. 2019, 14, 071006. [Google Scholar] [CrossRef]
  40. Yan, Z.A.; Cui, X.; Su, S. Electrical Machinery, 2nd ed.; Xi’an Jiaotong University Press: Xi’an, China, 2006. [Google Scholar]
  41. Truong, C.; Oudre, L.; Vayatis, N. Selective review of offline change point detection methods. Signal Process. 2020, 167, 107299. [Google Scholar] [CrossRef] [Green Version]
  42. Xu, B.; Chen, D.; Zhang, H.; Li, H. Stability of a hydro-turbine governing system under stochastic fluctuating speed. J. Vib. Shock 2018, 37, 226–231. [Google Scholar] [CrossRef]
  43. Reshef, D.N.; Reshef, Y.A.; Finucane, H.K.; Grossman, S.R.; McVean, G.; Turnbaugh, P.J.; Lander, E.S.; Mitzenmacher, M.; Sabeti, P.C. Detecting Novel Associations in Large Data Sets. Science 2011, 334, 1518–1524. [Google Scholar] [CrossRef] [Green Version]
  44. Liang, J.; Feng, C.; Song, P. A Survey on Correlation Analysis of Big Data. Chin. J. Comput. 2016, 39, 1–18. [Google Scholar] [CrossRef]
  45. Wang, T. Causality in big data and its philosophical connotation. Soc. Sci. China 2016, 05, 22–42. [Google Scholar]
Figure 3. The peak-to-peak value of the swing of the three guide bearings.
Energies 15 01207 g003
Figure 4. (a) Line graph of P. (b) Line graph of Vugx. Although there is a spike in the figure, a single abnormal point has almost no effect on the change point detection and correlation calculation. Therefore, no special treatment is required for this spike.
Energies 15 01207 g004
Figure 5. (a) The result obtained by segmenting P. (Different background colors for different segments.) (b) The result obtained by segmenting Vugx. (Different background colors are used to distinguish different segments).
Energies 15 01207 g005
Figure 6. The correlation coefficient between P and Vugx subsequence.
Energies 15 01207 g006
Figure 7. (a) P and Vugx corresponding to subsequences 1–23. (b) P and Vugx corresponding to subsequences 25–83. (c) P and Vugx corresponding to the 24th subsequence.
Energies 15 01207 g007aEnergies 15 01207 g007b
Figure 8. (a) Cosine similarity calculated by simulation test. (b) MIC calculated by simulation test.
Energies 15 01207 g008
Table 1. Key parameters in change point detection.
ItemParameter
kernel function k ( x , y ) = e x p ( γ x y 2 )
kernel parameter γ0.1
minimum segment length10
penalty value3
Table 2. The correlation coefficients between P and Vugx in the three time periods.
1–472 min1–1400 min509–1400 min
cosine0.8670.8920.999
MIC0.2270.6110.886
Table 3. The variance of cosine similarity and MIC calculated from the samples.
Variancen = 10n = 100n = 1000
cosine7.89 × 1033.77 × 1044.565 × 105
MIC4.94 × 1024.83 × 1036.48 × 10−4
Publisher’s Note: MDPI stays neutral with regard to jurisdictional claims in published maps and institutional affiliations.

