Article

Integrating System and Operator Perspectives for the Evaluation of Power-to-Gas Plants in the Future German Energy System

1
Gas-und Wärme-Institut Essen e.V. (GWI), 45356 Essen, Germany
2
German Aerospace Center (DLR), Institute of Networked Energy Systems, 70563 Stuttgart, Germany
3
Fraunhofer Institute for Manufacturing Technology and Advanced Materials IFAM, 28359 Bremen, Germany
*
Authors to whom correspondence should be addressed.
Energies 2022, 15(3), 1174; https://doi.org/10.3390/en15031174
Submission received: 21 December 2021 / Revised: 31 January 2022 / Accepted: 2 February 2022 / Published: 5 February 2022
(This article belongs to the Special Issue Progress in Power-to-Gas Energy Systems)

Abstract

:
In which way, and in which sectors, will renewable energy be integrated in the German Energy System by 2030, 2040, and 2050? How can the resulting energy system be characterised following a −95% greenhouse gas emission reduction scenario? Which role will hydrogen play? To address these research questions, techno-economic energy system modelling was performed. Evaluation of the resulting operation of energy technologies was carried out from a system and a business point of view. Special consideration of gas technologies, such as hydrogen production, transport, and storage, was taken as a large-scale and long-term energy storage option and key enabler for the decarbonisation of the non-electric sectors. The broad set of results gives insight into the entangled interactions of the future energy technology portfolio and its operation within a coupled energy system. Amongst other energy demands, CO2 emissions, hydrogen production, and future power plant capacities are presented. One main conclusion is that integrating the first elements of a large-scale hydrogen infrastructure into the German energy system, already, by 2030 is necessary for ensuring the supply of upscaling demands across all sectors. Within the regulatory regime of 2020, it seems that this decision may come too late, which jeopardises the achievement of transition targets within the horizon 2050.

1. Introduction

1.1. Background

The energy transition towards a renewable energy system that serves the demands of the electricity, gas, heat, and transport sectors is one of the most complex societal projects of our time. The green transformation of all energy-dependent activities touches all individuals, all economic activities, and administrations worldwide. While the first steps have been taken, the local, regional, and national roadmaps for the future energy system, e.g., in 2050, remain a constant challenge and need permanent scientific assessments, course corrections, and refinements.

1.2. State of Research

High temporal and spatial resolution energy system models have been limited to the electricity sector in previous analyses. These focused, for example, on the grid, storage, and power plant capacities needed to balance electricity generation from variable renewable energy (VRE) [1,2]. Continuous development has successively added coupling to other sectors, such as heating and electric mobility, to these analyses [3,4]. In parallel, models of the gas market and the gas system have been further developed to analyse future scenarios [5,6]. Against the background of the political goals of reducing CO2 emissions, the integration of power-to-gas plants for the generation of synthetic gas also received increasing attention [7]. Recently, the energy science community has made strong progress in integrating electricity system focused models with natural gas system focused models [8]. This significantly improves the capability to analyse energy systems that are integrated across different sectors [9,10].
One continuing challenge in interdisciplinary energy system research is the coupling of models [11]. Additionally, the identification of business models for power-to-gas plant operators remains challenging [9,12,13]. Besides these aspects, in many studies, the techno-economical level of detail during optimisation of energy systems remains shallow, as the representation of gas infrastructures, for example, suffers strong simplifications, and the decision-making by individual stakeholders, such as plant operators, is not integrated.

1.3. Contribution of This Paper

This analysis is dedicated to cost-minimising strategies for the construction and operation of power-to-gas plants along the transformation of the German energy system to a climate-neutral supply. This is done from two perspectives: that of the macro-economic planner and that of the plant operator. The focus is on the incorporation of power-to-gas into an energy system that is integrated across all sectors. In addition to the electricity sector and the heating sector, the interfaces to the transport sector, via electro mobility and hydrogen vehicles, are considered. This allows the evaluation of the contribution of flexible operation of power-to-gas plants, as well as other electrical equipment in the gas system, to balance the fluctuating power generation from VRE. In addition, the regional distribution of gas and hydrogen infrastructures in Germany is considered. The methodological basis is the adequate representation of the gas system in two energy system models and their coupling via a data interface. This coupling makes it possible to analyse which adjustments to the regulatory framework are needed to make power-to-gas plants economically attractive.

2. Materials and Methods

The study relies on the enhancement and application of two models providing different perspectives on the energy system. While the plant capacities and their hourly dispatch in the REMix model (Section 2.1.1) result from the minimisation of economic costs on a macro-economic scale, MuGriFlex (Section 2.1.2) aims at the profit maximisation of the operator of one or more individual plants. These models are parametrised and applied in a harmonised and partially coupled manner (Section 2.1.3). The case study, presented here, analyses the future energy system in Germany and its neighbouring countries (Section 2.2). It relies on a detailed normative scenario for the achievement of emission reduction goals (Section 2.3). Furthermore, it is based on extensive data research of the plant inventory and possible technology development paths, especially in the gas sector (Section 2.4), as well as the other sectors (Section 2.5). Finally, we present the regulatory framework in Germany that we considered in the modelling (Section 2.6). For clarity, structure of this work is depicted in the graphical abstract Figure 1. Assumptions have been published online [14].

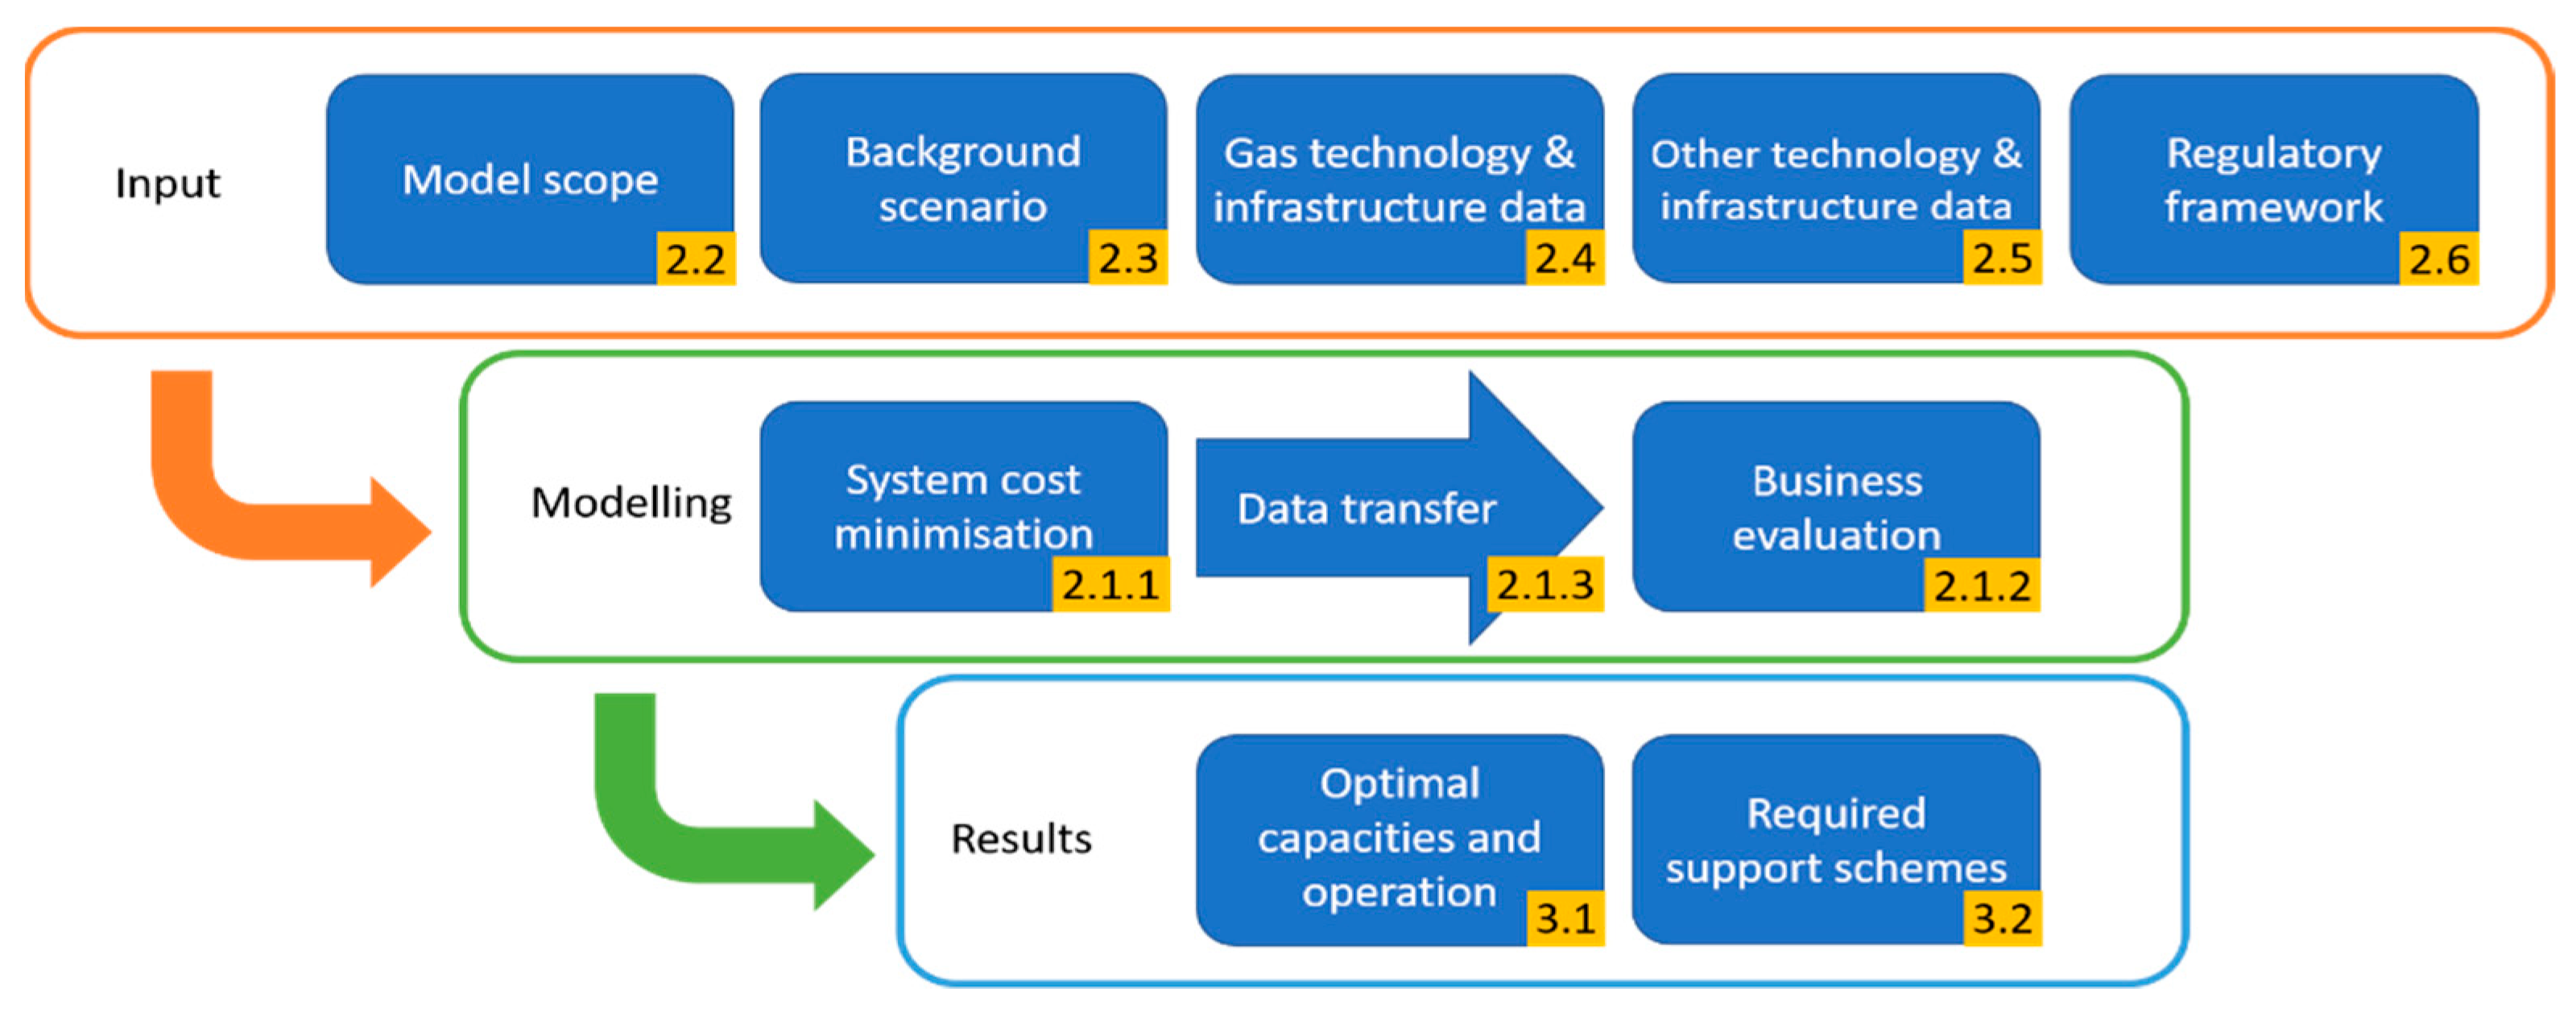
2.1. Modelling Approach
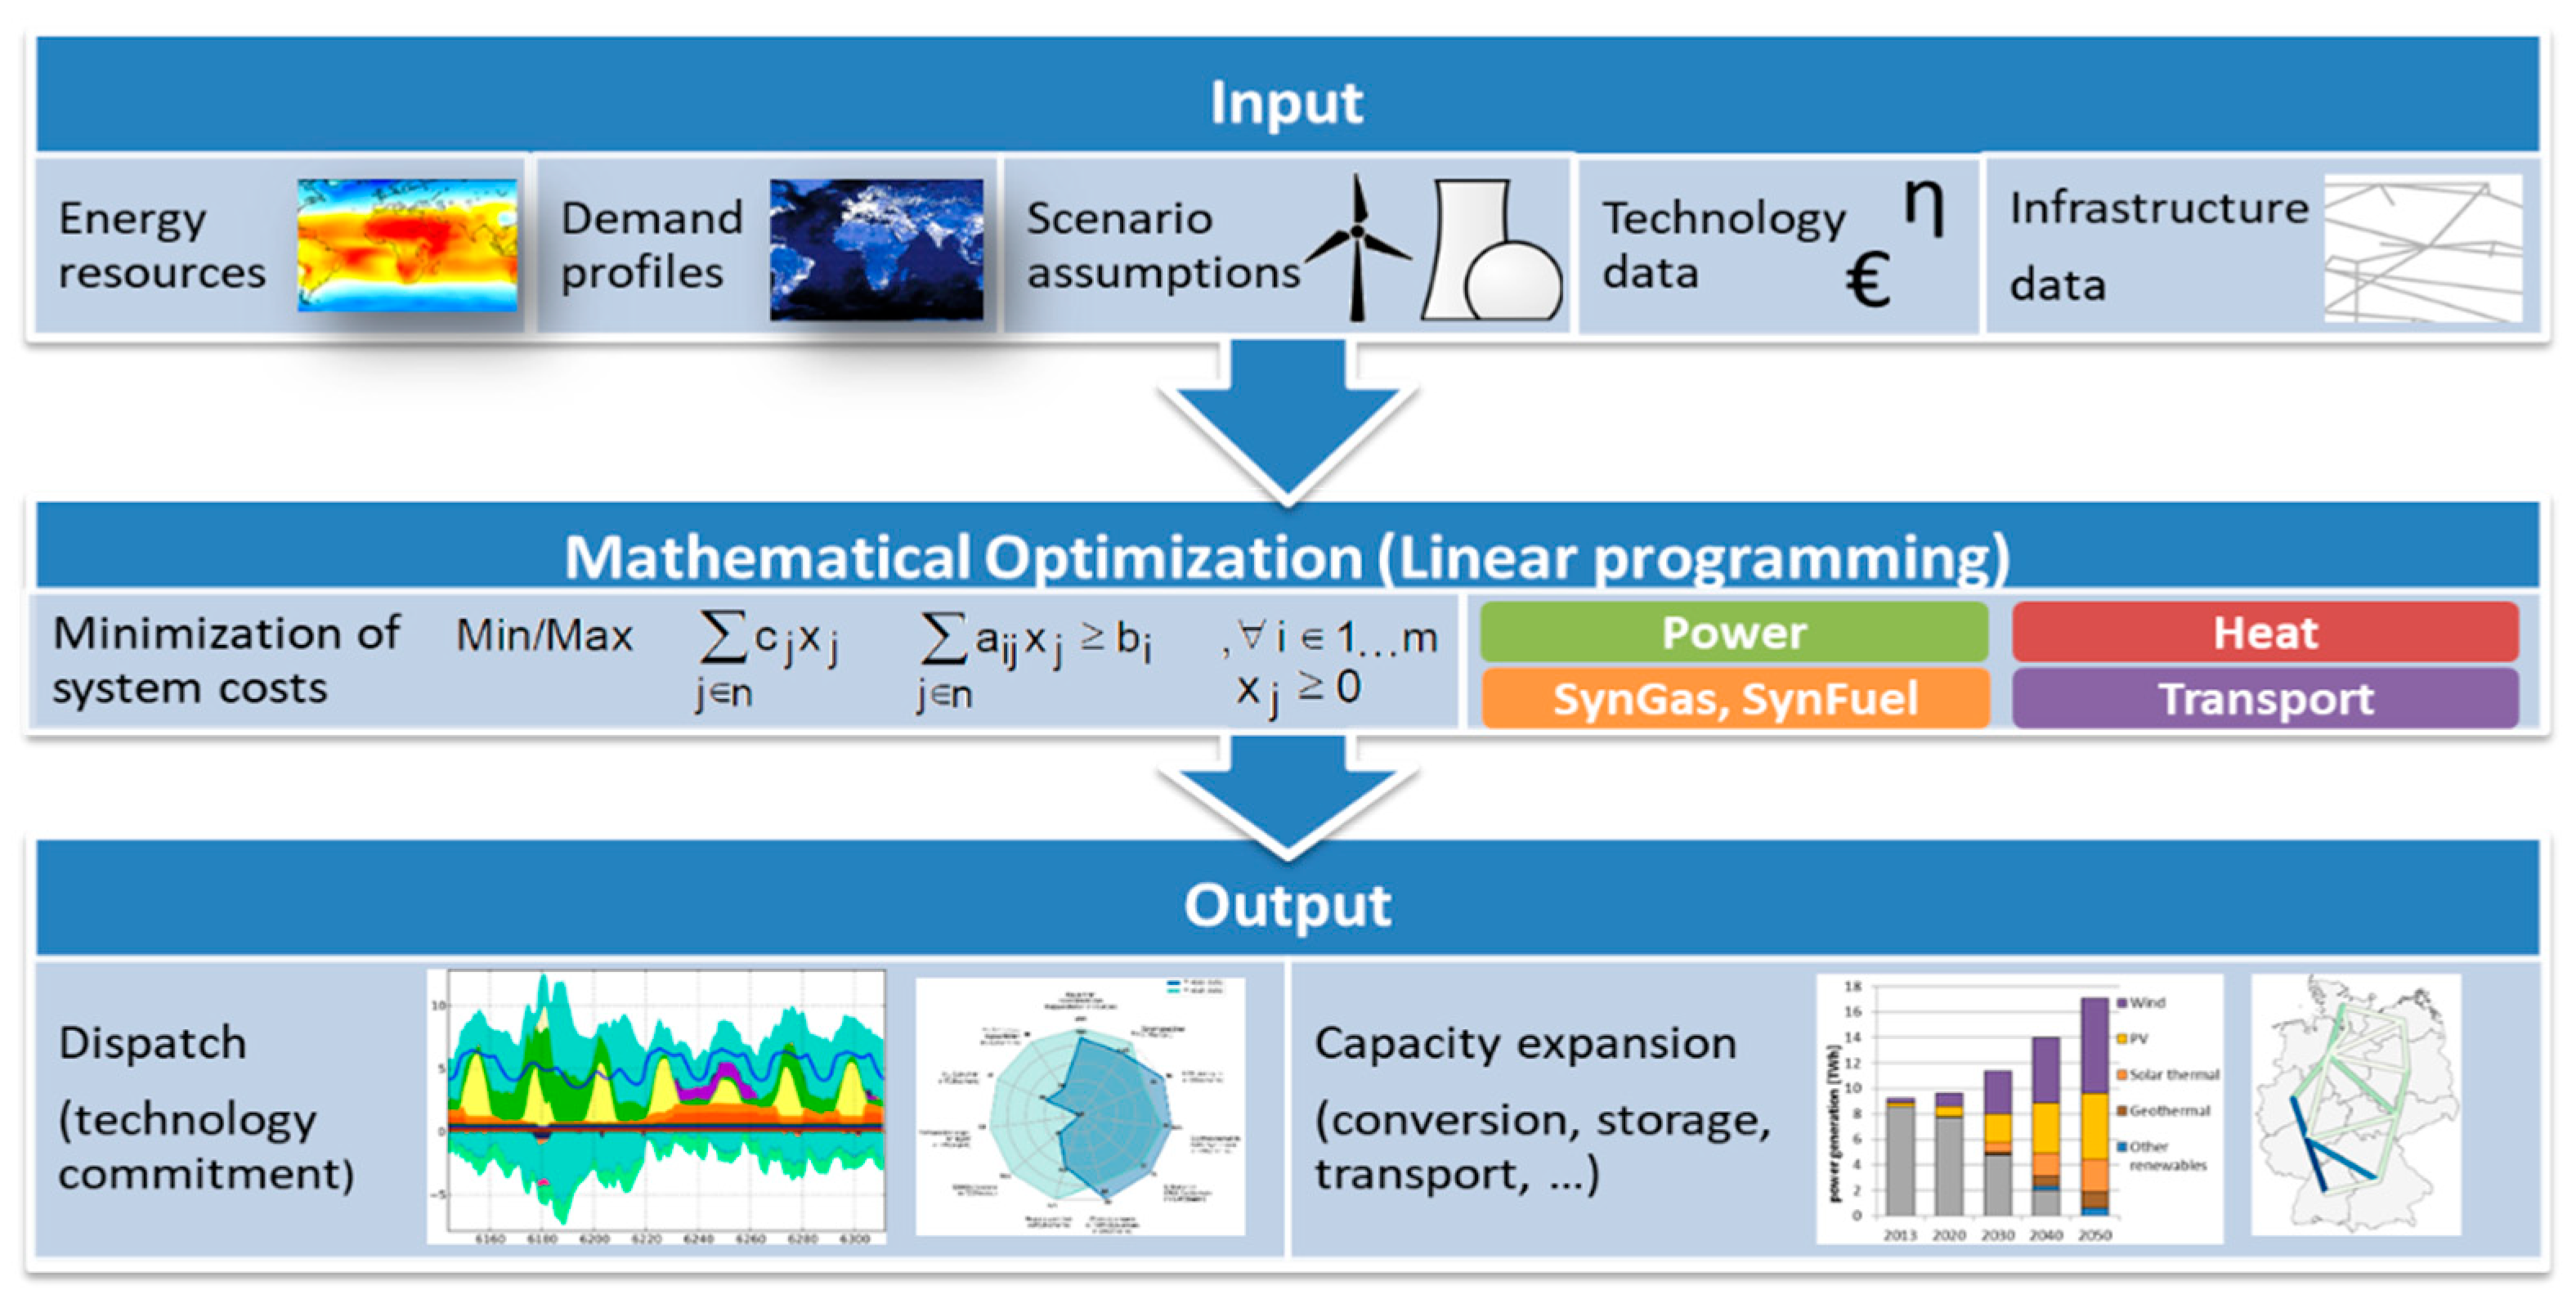
The analysis relies on the combined application of the energy system models REMix and MuGriFlex, which are introduced in the following.

2.1.1. REMix

The optimisation framework REMix was designed for the analysis of future integrated energy systems in high spatial and temporal resolution [15]. It relies on a linear programming approach, which is typically used to minimise costs, from a central system operator’s perspective, under multiple technological and economic boundary conditions. Originally limited to the power sector, it has been continuously enhanced to also include electric mobility [16], the heating sector [17], as well as hydrogen production, storage, and consumption [18]. For the case study presented here, it has been further enhanced to include the gas sector [19]. The model is designed to optimise capacities and hourly operation of all technologies in a multi-node approach and with perfect foresight over one year. Depending on the use case, many hundreds of nodes, or up to one hundred technologies, can be considered. In addition to the objective function of the system costs to be minimised, the energy carrier-specific balances are the central equations of the model. These ensure that the demand and supply of energy are balanced for each region and hour. This is achieved by using different technologies for the conversion, storage, and transport of energy, depending on the scope of the model. These technologies are limited in their use by the sum of exogenously given and, if applicable, endogenously added capacities. The mathematical framework of the model has been documented in [15,16,17,18,19], Figure 2 provides an overview of the framework. Details on the model scope and utilized input data considered here are provided in Section 2.2, Section 2.3, Section 2.4 and Section 2.5.

2.1.2. MuGriFlex

The MuGriFlex model serves to analyse individual energy systems for profitability, optimal investment, and operation of the systems’ components. It considers interrelated technical assets, generating, using, and storing electricity, heat, and gas, their cost, and the relevant regulatory framework [20,21]. Thereby, it adds a business perspective on the feasibility of the scenarios modelled with REMix [22]. Based on plant parameters, time series for energy demand, weather, and energy prices, as well as surcharges and tariffs, MuGriFlex simulates the operation of a combination of technical assets in hourly resolution. Thereby, it enables the assessment of the economic feasibility for defined individual energy systems, or it optimises the design and dimensioning of such energy systems within a specified regulatory framework.

2.1.3. Model Coupling

For an integrated analysis, the overall optimised energy system is looked at from the business perspective within the given regulatory framework. Hourly time series for plant operation and electricity cost, as well as the optimal gas mix per year, are central to the coupling between the two models. Outputs of REMix are fed into MuGriFlex in order to determine whether the regulatory framework is suitable to implement the desirable overall system development and its operation.
These outputs include the following values:
  • Plant sizes (expressed as rated thermal output relative to peak requirement of the local energy system) for combined heat and power (CHP) plants, gas- and electric boilers, heat pumps (HP), thermal energy storage, etc.
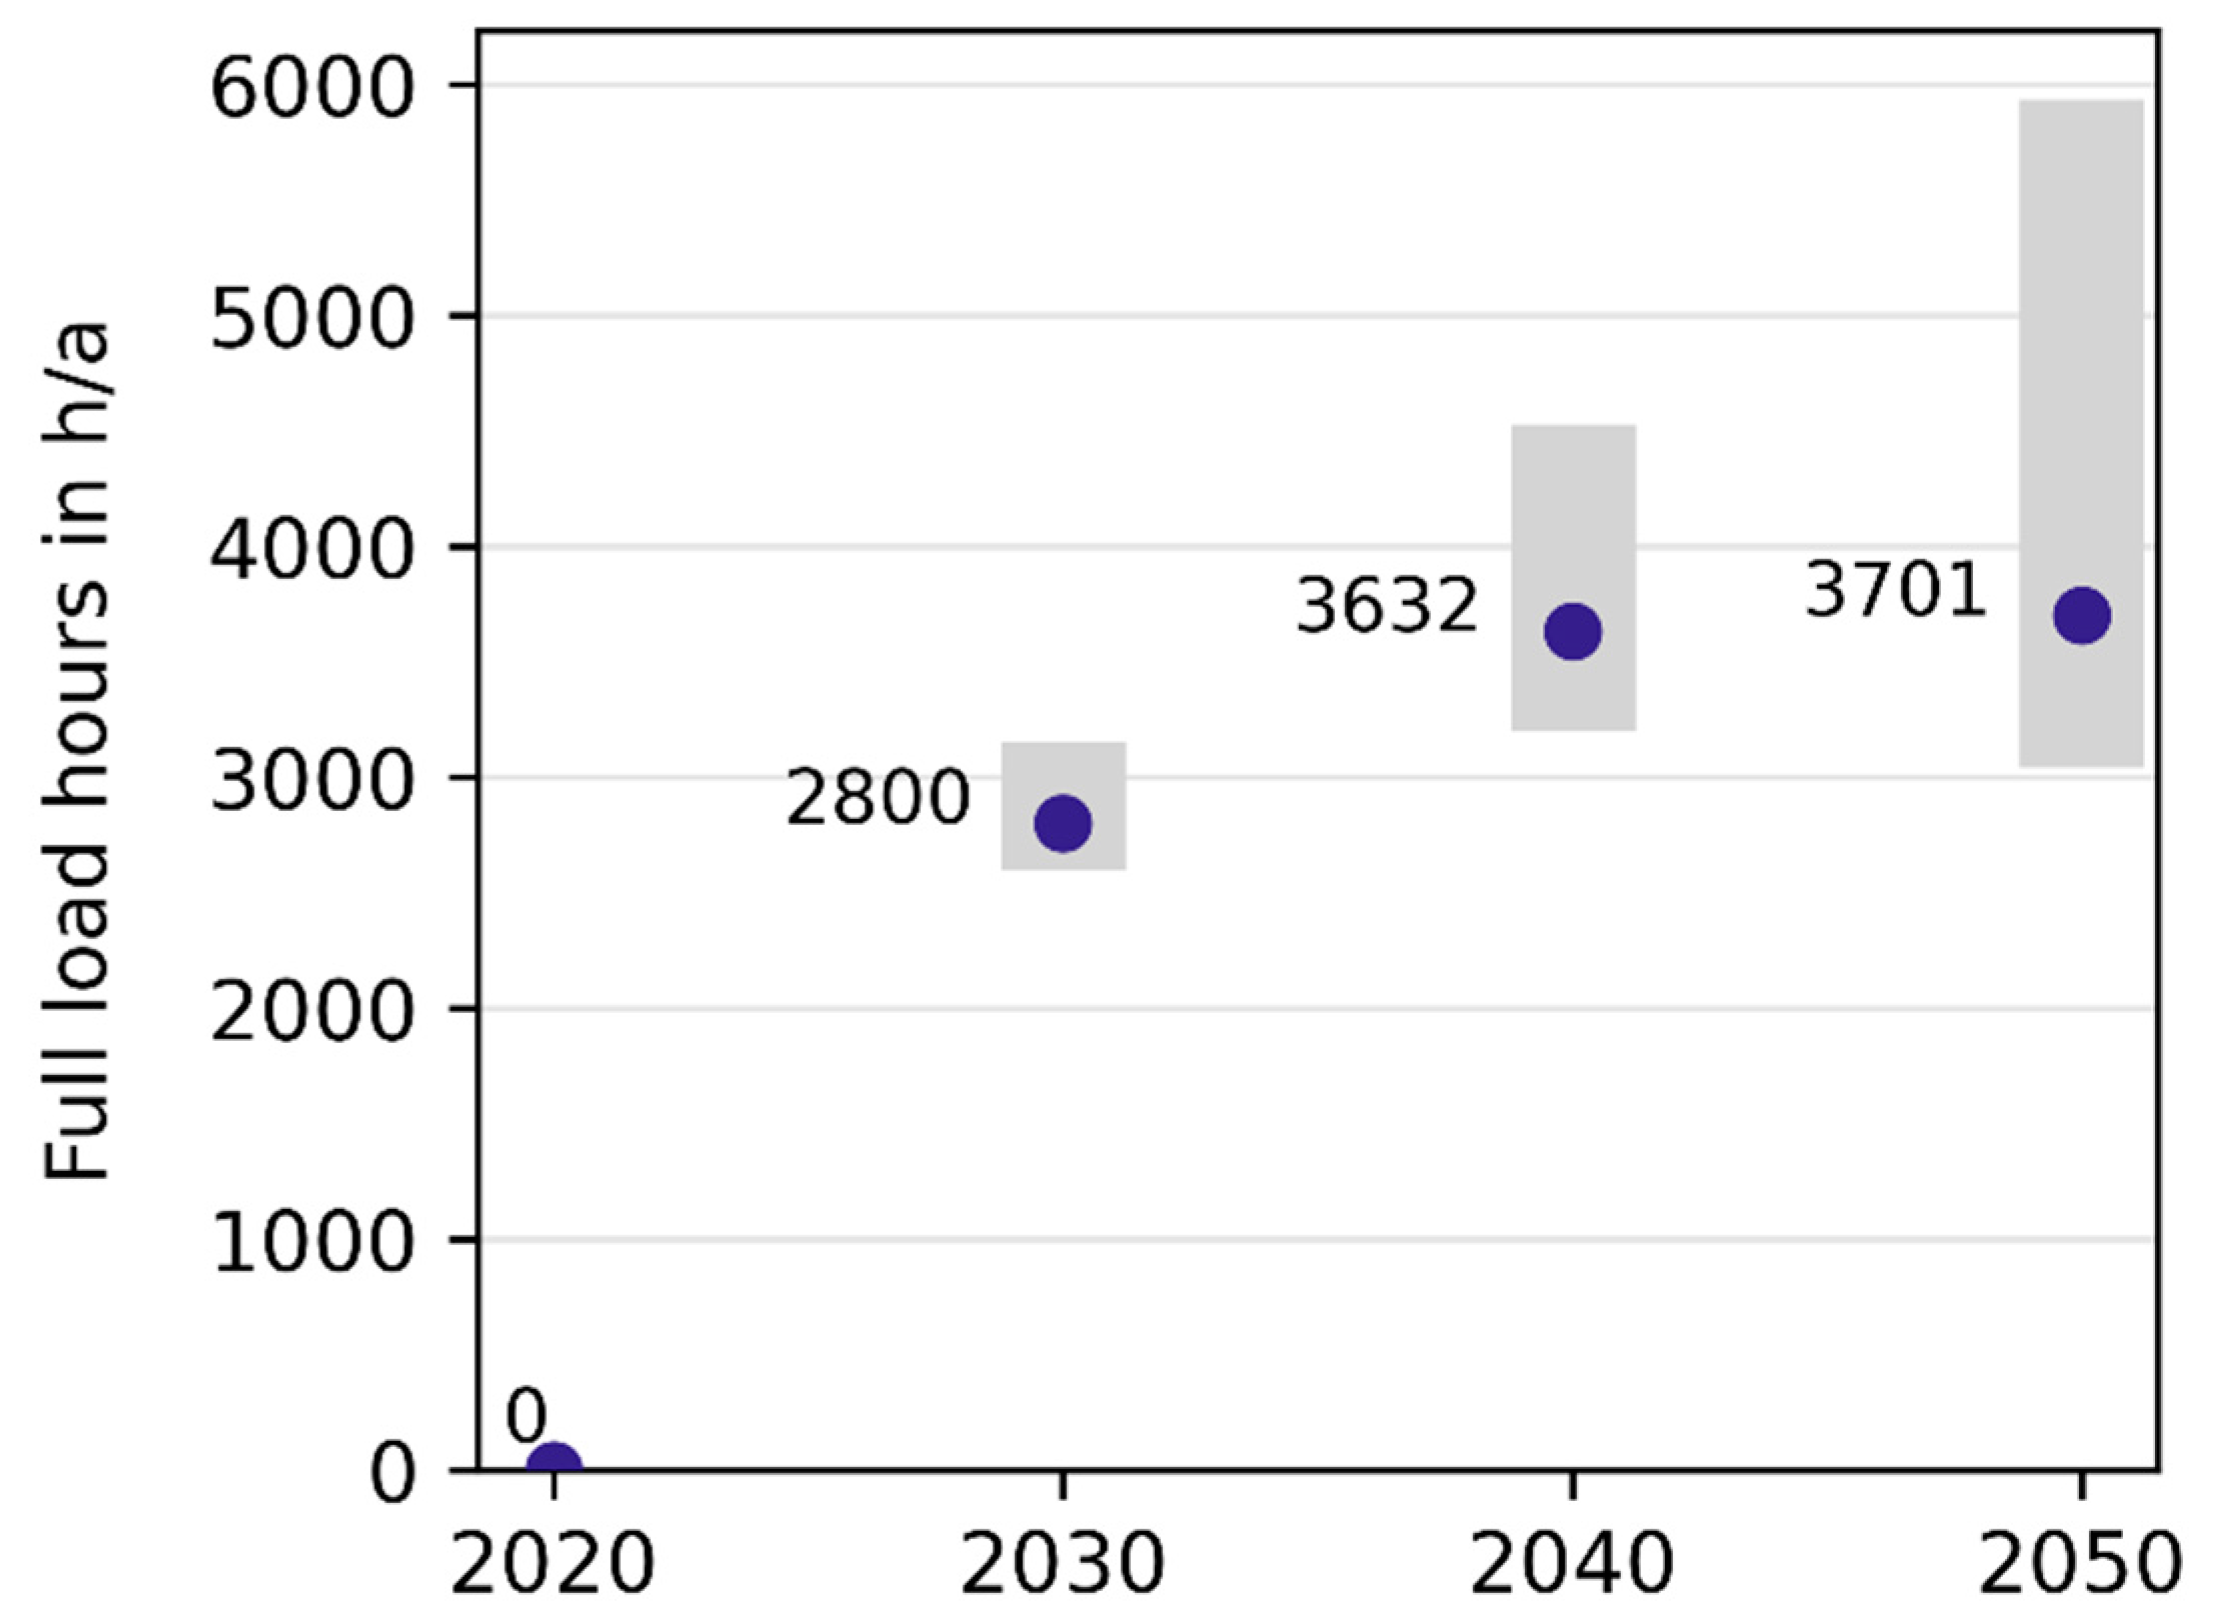
  • Operation of plants: full load hours per year
  • Hourly time-series of power generation costs: These are assumed to be the electricity cost of the power plant running at the margin. To receive electricity prices, the surcharges, to be paid by the respective use case, are added.
  • Time-series of produced synthetic gas to establish the gas production costs, taking into account the electricity cost at the given time
If a given framework promotes investment and operation of plants that deviates from the techno-economic optimum, MuGriFlex enables the exploration of alternative frameworks (see Section 3.2).

2.2. Set-Up of the Case Study

The transformation of the German energy system is the focus of this analysis. To consider the balancing effects of the European power grid, the neighbouring countries, as well as Italy, Sweden, and Norway, are also modelled in REMix. However, a detailed analysis of the flexible sector coupling and the gas transport is carried out only for Germany. To be able to show regional effects and to evaluate the expansion of electricity and hydrogen grid capacities, Germany is divided into 10 regions in the model. These result from partial aggregation of the federal states, according to Figure 3. To be able to describe the transformation path of the system, the scenario years 2020, 2030, 2040, and 2050 are modelled in REMix. The model is applied myopically, i.e., the investment decisions are carried over into the later years until the plant lifetime is reached.
To evaluate the interaction of power-to-gas plants in an integrated overall system, REMix includes a wide range of technologies, especially with regard to flexible sector coupling. For Germany, the model includes almost 100 technologies in the electricity, heat, gas and transport sectors. In particular, the electricity and heat supply are modelled with a high degree of granularity. Photovoltaics (PV), concentrating solar power (CSP), reservoir and run-of-the-river hydro power, onshore and offshore wind, geothermal, and biomass are being considered for electricity generation from renewable sources. An endogenous capacity expansion is considered for wind, solar, and biomass power plants. Furthermore, it is assumed that the existing wind, PV, and hydro power plants will be replaced at the end of their service life. This prevents extreme characteristics in the spatial distribution of the plants.
Conventional power generation is possible with nuclear, coal, oil, and gas power plants. The existing power plant fleet will be successively decommissioned. The exogenously assumed plant capacities and their future development are listed in [14]. While coal and nuclear power plants cannot be replaced at the end of their service life, an endogenous addition of gas-fired power plants is possible. This applies throughout the study area and equally to condensing power plants and CHP plants. For cogeneration of electricity and heat in CHP systems, 15 technologies are considered, which differ in heat consumers, plant size, and fuel. All CHP plants also have a peak load boiler, and some can be supplemented by the model with thermal storage, electric boilers, heat pumps, and solar thermal systems. Energy transport can be realised via direct current (DC) and alternating current (AC) power lines, gas pipelines, and hydrogen pipelines. For power and gas pipelines, the existing capacities, as well as the planned expansion, are taken into account. An endogenous expansion of power lines is possible from 2040, but it is limited to 5 GW per line and decade. Hydrogen pipelines within Germany can be built from the scenario year 2030. Other energy storage in the system includes underground gas storage, hydrogen cavern and tank storage, stationary battery storage, and pumped storage. Battery storage and hydrogen storage are optimised in their capacity. Flexibility can also be provided by battery electric vehicles (BEV) with bidirectional charging, decentralised heat pumps with thermal storage, and load management in industry and commerce. As described below, the production of hydrogen and methane is also optimised endogenously in the model.
In other European countries, flexible sector coupling is only considered to a very limited extent. For example, consideration of the heat sector is limited to electric heat generation, which is inflexible, as is BEV charging. The decentralised generation of hydrogen, on the other hand, is partially made more flexible via the consideration of tank storage. Pipelines and underground storage facilities for hydrogen and natural gas are only considered for Germany. While natural gas can be imported without limit at national borders, hydrogen must be produced domestically. Net electricity import, on the other hand, are possible, but limited to 20% of demand, including system losses.

2.3. Main Assumptions about the Energy Future

For the parameterization of the models and the consistency of the model coupling, quantitative scenario frameworks are an essential basis. There is also the need to document the overall energy future considered, for which the calculated results and conclusions derived from them are valid.

2.3.1. General Assumptions

The framework scenario was defined exogenously, from which further assumptions were made regarding the technology paths for the model parameterization. It is based on a socio-economic context framework similar to [23] that follows the narratives of a long-term decrease in the population in Germany from 81 to below 75 million, moderate economic growth at 1.2% per year, a further slight increase in heated building areas and vehicles in passenger transport (with 10% lower mileage by 2050), and a continuous increase in freight transport of about 1% per year. For the European countries, similar socio-economic paths are assumed according to the European project e-Highway 2050 [24], for which a decrease in the European population by 10% was assumed in the scenario variant “Small & Local”, as well as a similarly moderate economic growth, with a 1.3% increase in gross domestic product (GDP) per year.
The scenario assumes a slight increase in fossil fuel prices in the future based on the national transformation scenario of [23] (Table 1). The prices for solid biomass and biogas, on the other hand, are assumed to remain constant, as biomass is only used to a limited extent in the scenario within the limits of sustainable potentials. The incineration of waste, as well as the use of geothermal heat, is not associated with any energy carrier costs. Nevertheless, it is associated with variable costs of plant operation.
In the scenario, it is also assumed that the emission of CO2 is subject to costs via certificate trading. The values assumed for this were assumed to increase sharply, in line with the targets. The values used there were adjusted to the base year of the cost data (2015), taking inflation into account (see Table 2).

2.3.2. Energy Demand Scenario for Germany and Europe

The scenario was developed with the aim of illustrating an exemplary development path for Germany, with regard to the large reduction in CO2 emissions in the energy system and the resulting demand for electricity and green synthetic gas, while remaining within the range of possibilities that seem plausible from today’s perspective for transformation processes in the sectors. The scenario (called THG95) implements the goal of climate neutrality of the energy system and maximum shares of renewable energies, in line with the goal of a 95% reduction in total greenhouse gas (GHG) emissions by 2050. Strong efficiency developments, in all sectors, are envisaged according to the goals of the German government’s 2010 energy concept [25]. This leads to a strong use of electricity for the direct electrification of heat generation and vehicles in transport, with complementary use of hydrogen via fuel cell vehicles and, if necessary, for the storage and reconversion of hydrogen in the future energy system. The complete substitution of fossil energy carriers, including gas for backup power plants, results in a high demand for synthetic energy carriers with corresponding conversion losses.
For the neighbouring countries the developments are based on the 100% Renewable Energy Scenario (RES) of the European e-Highway 2050 project [24]. The increase in the total electricity demand in the neighbouring countries is lower compared to Germany, especially for H2 generation, which plays a smaller role in the e-Highway 2050 scenarios. Deviating from this, the developments for electric mobility were projected in the same way in all countries to increase comparability. The resulting assumptions for the exogenously specified electricity demand are shown in the following Table 3. Further information can be found in [22].

2.4. Fundamentals and Modelling Assumptions for the Natural Gas and Hydrogen Sector

The complementary consideration of the gas system in REMix requires extensive parameterization with infrastructure inventory data and techno-economic parameters. The procedure and data sources used for this are presented in the following.

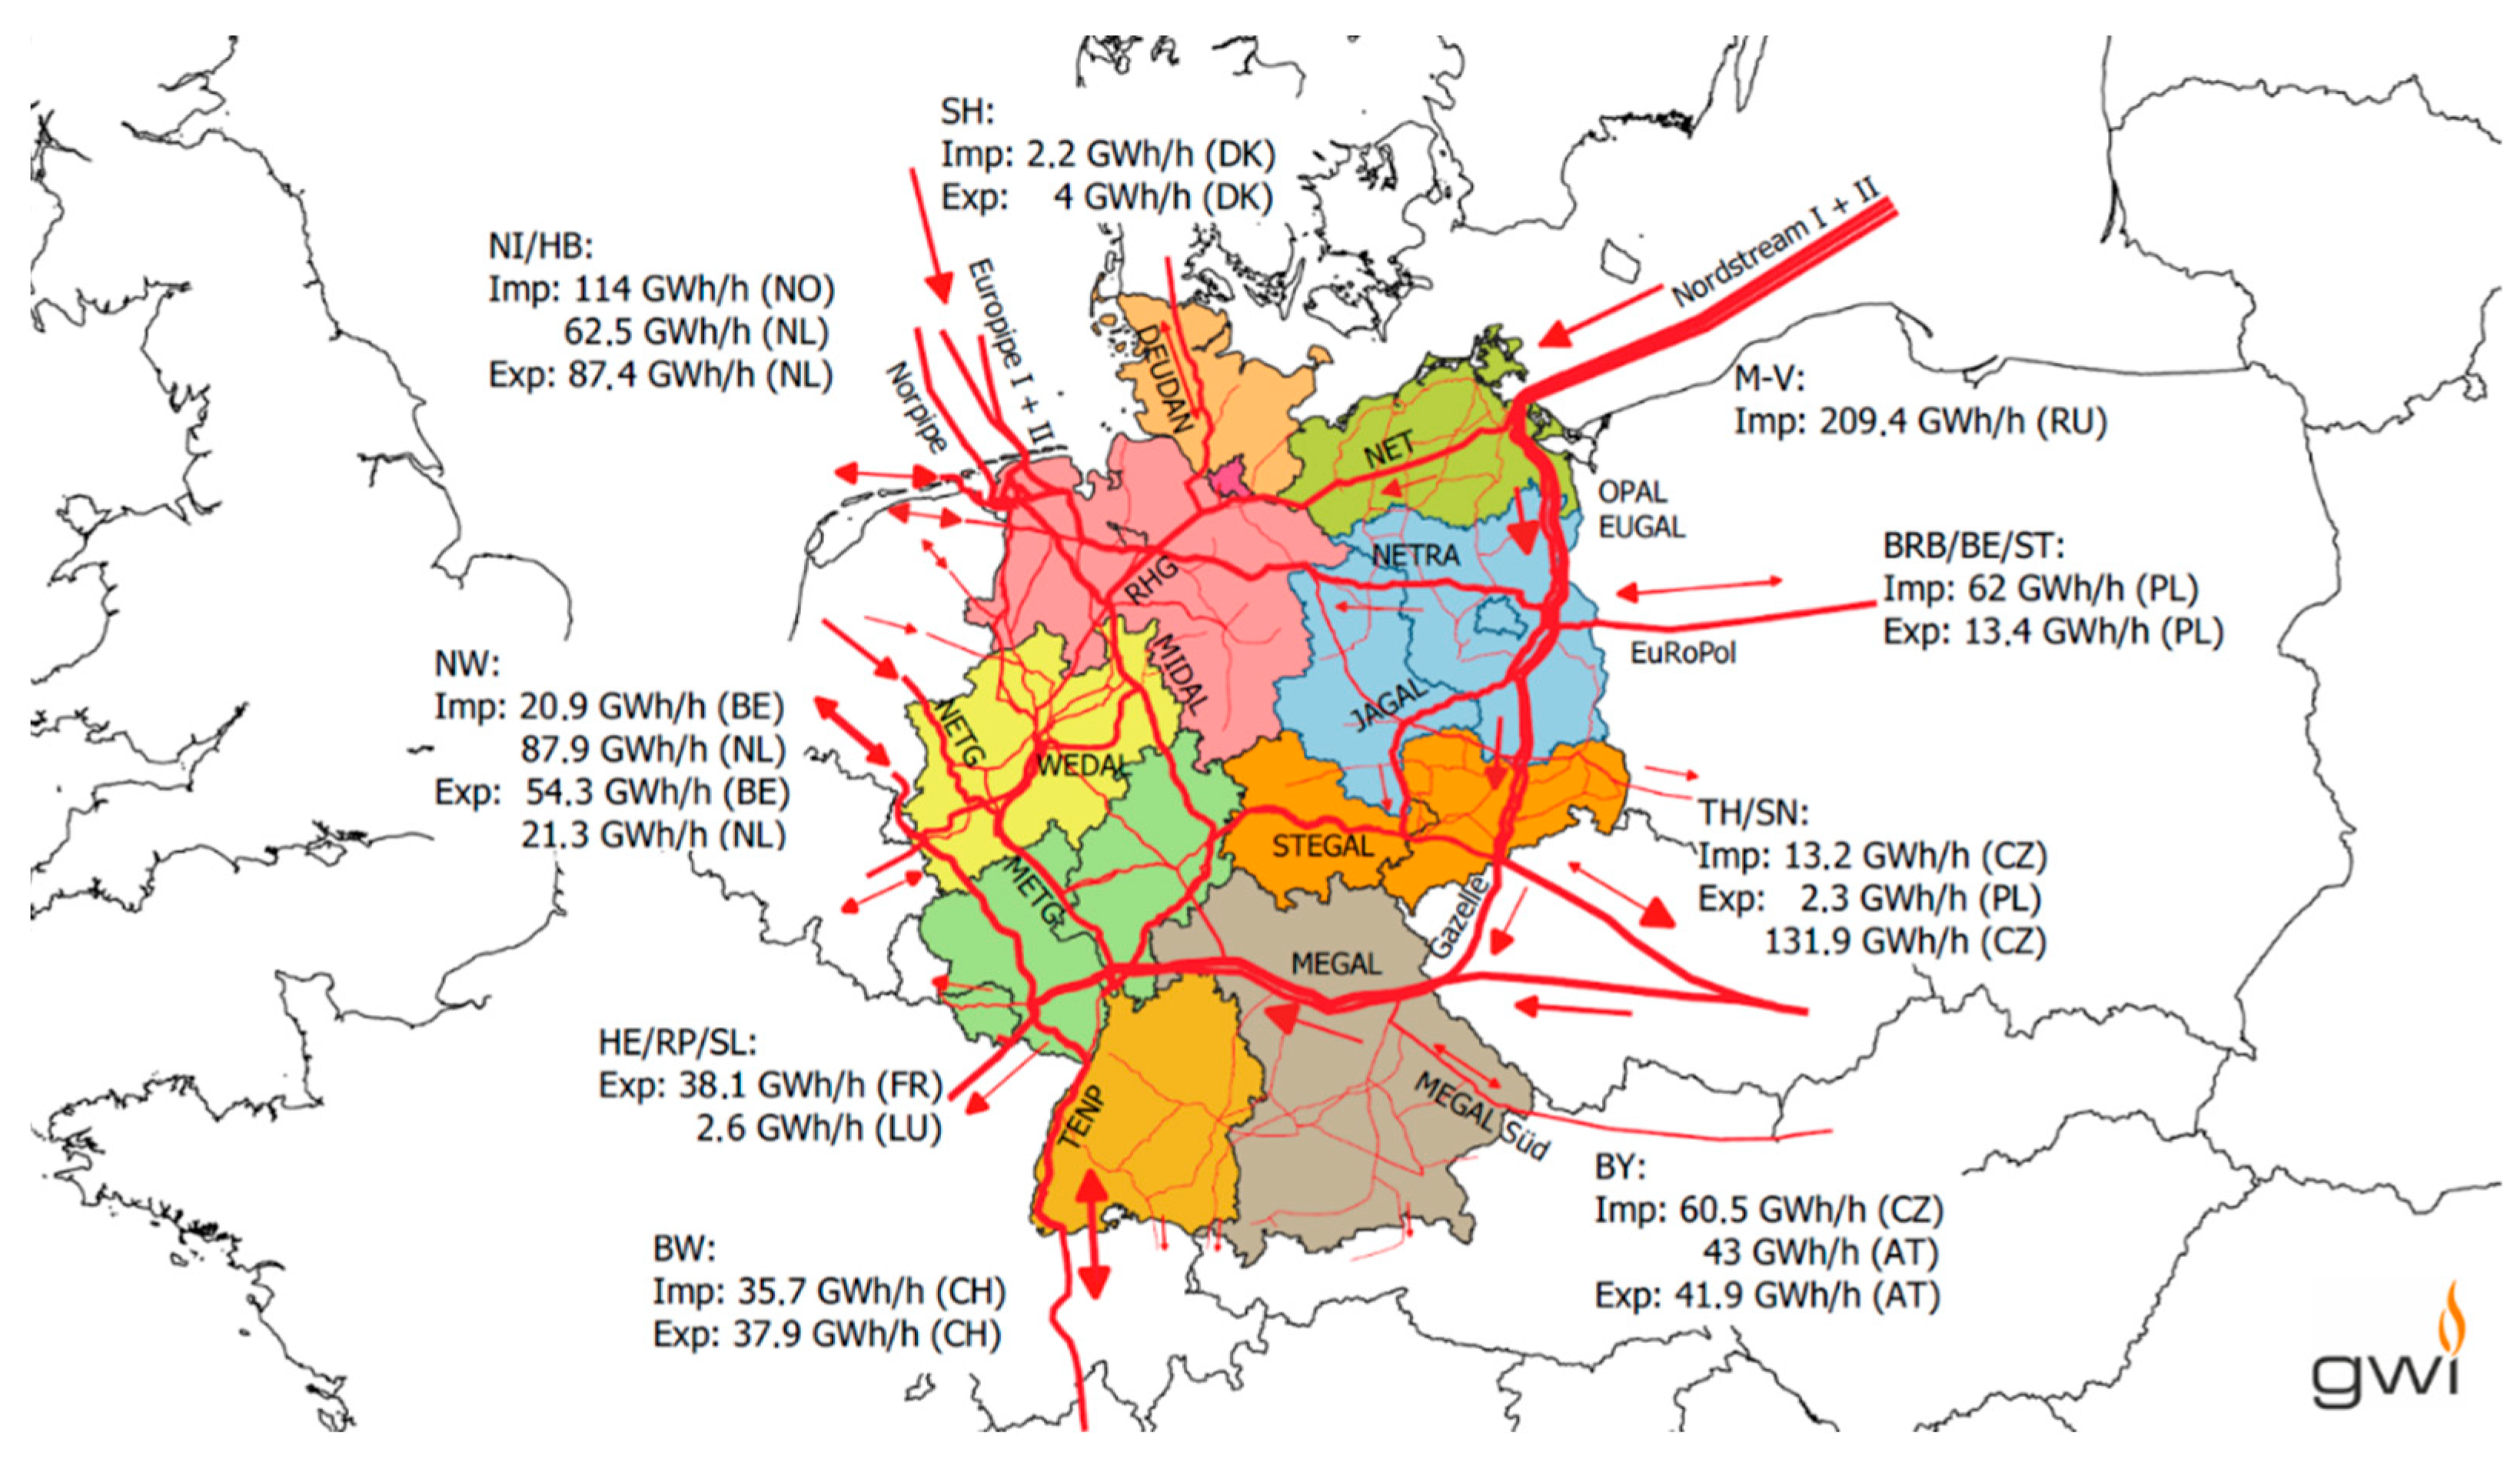
2.4.1. Natural Gas Transportation Grids and Hydrogen Transport Option

The natural gas networks can be classified into the long-distance transport system and the finer-meshed distribution system. Within this project, the distribution level is not modelled. Instead, an ideal distribution within a model region is assumed. The intra-regional transport, via the transport system, is represented by a balance-sheet approach that is based on the physical cross-border pipeline interconnections represented in Figure 3. Following the trend of increasingly fluctuating gas flows, and anticipating a trend towards technical retrofitting for bidirectional gas flow, we allow the model to expand to all pipelines in the scenario years, in both directions, at zero additional investment cost. As a further simplification, we assume that only one natural gas quality is distributed, anticipating the discontinuation of Dutch low calorific natural gas exports to Germany planned for 2029 [26]. The model was allowed to expand the gas transport networks at a cost of 1.880 M€/km, a value which was deduced from the national natural gas grid expansion plan 2016 [27].
Gas transport capacities per hour were deduced for each border between neighbouring model regions using the above mentioned simplifications. Publicly available information from the European Network of Transmission System Operators for Gas (ENTSOG) [28] were used. It was assumed that the hourly maximum of transmission capacity is 60% higher than the reported daily capacity. Additional pipelines, which were under construction in the ENTSOG data (e.g., Nord Stream 2) were taken into account as well.
For the future scenario years, REMix was allowed to build an additional infrastructure, dedicated for hydrogen transport, at an estimated investment cost of 2.162 M€/km, i.e., at 15% higher cost compared to the natural gas infrastructure.
Import options other than pipeline-bound gas imports were not modelled. Liquefied imports of natural gas or hydrogen were not allowed for the REMix model.

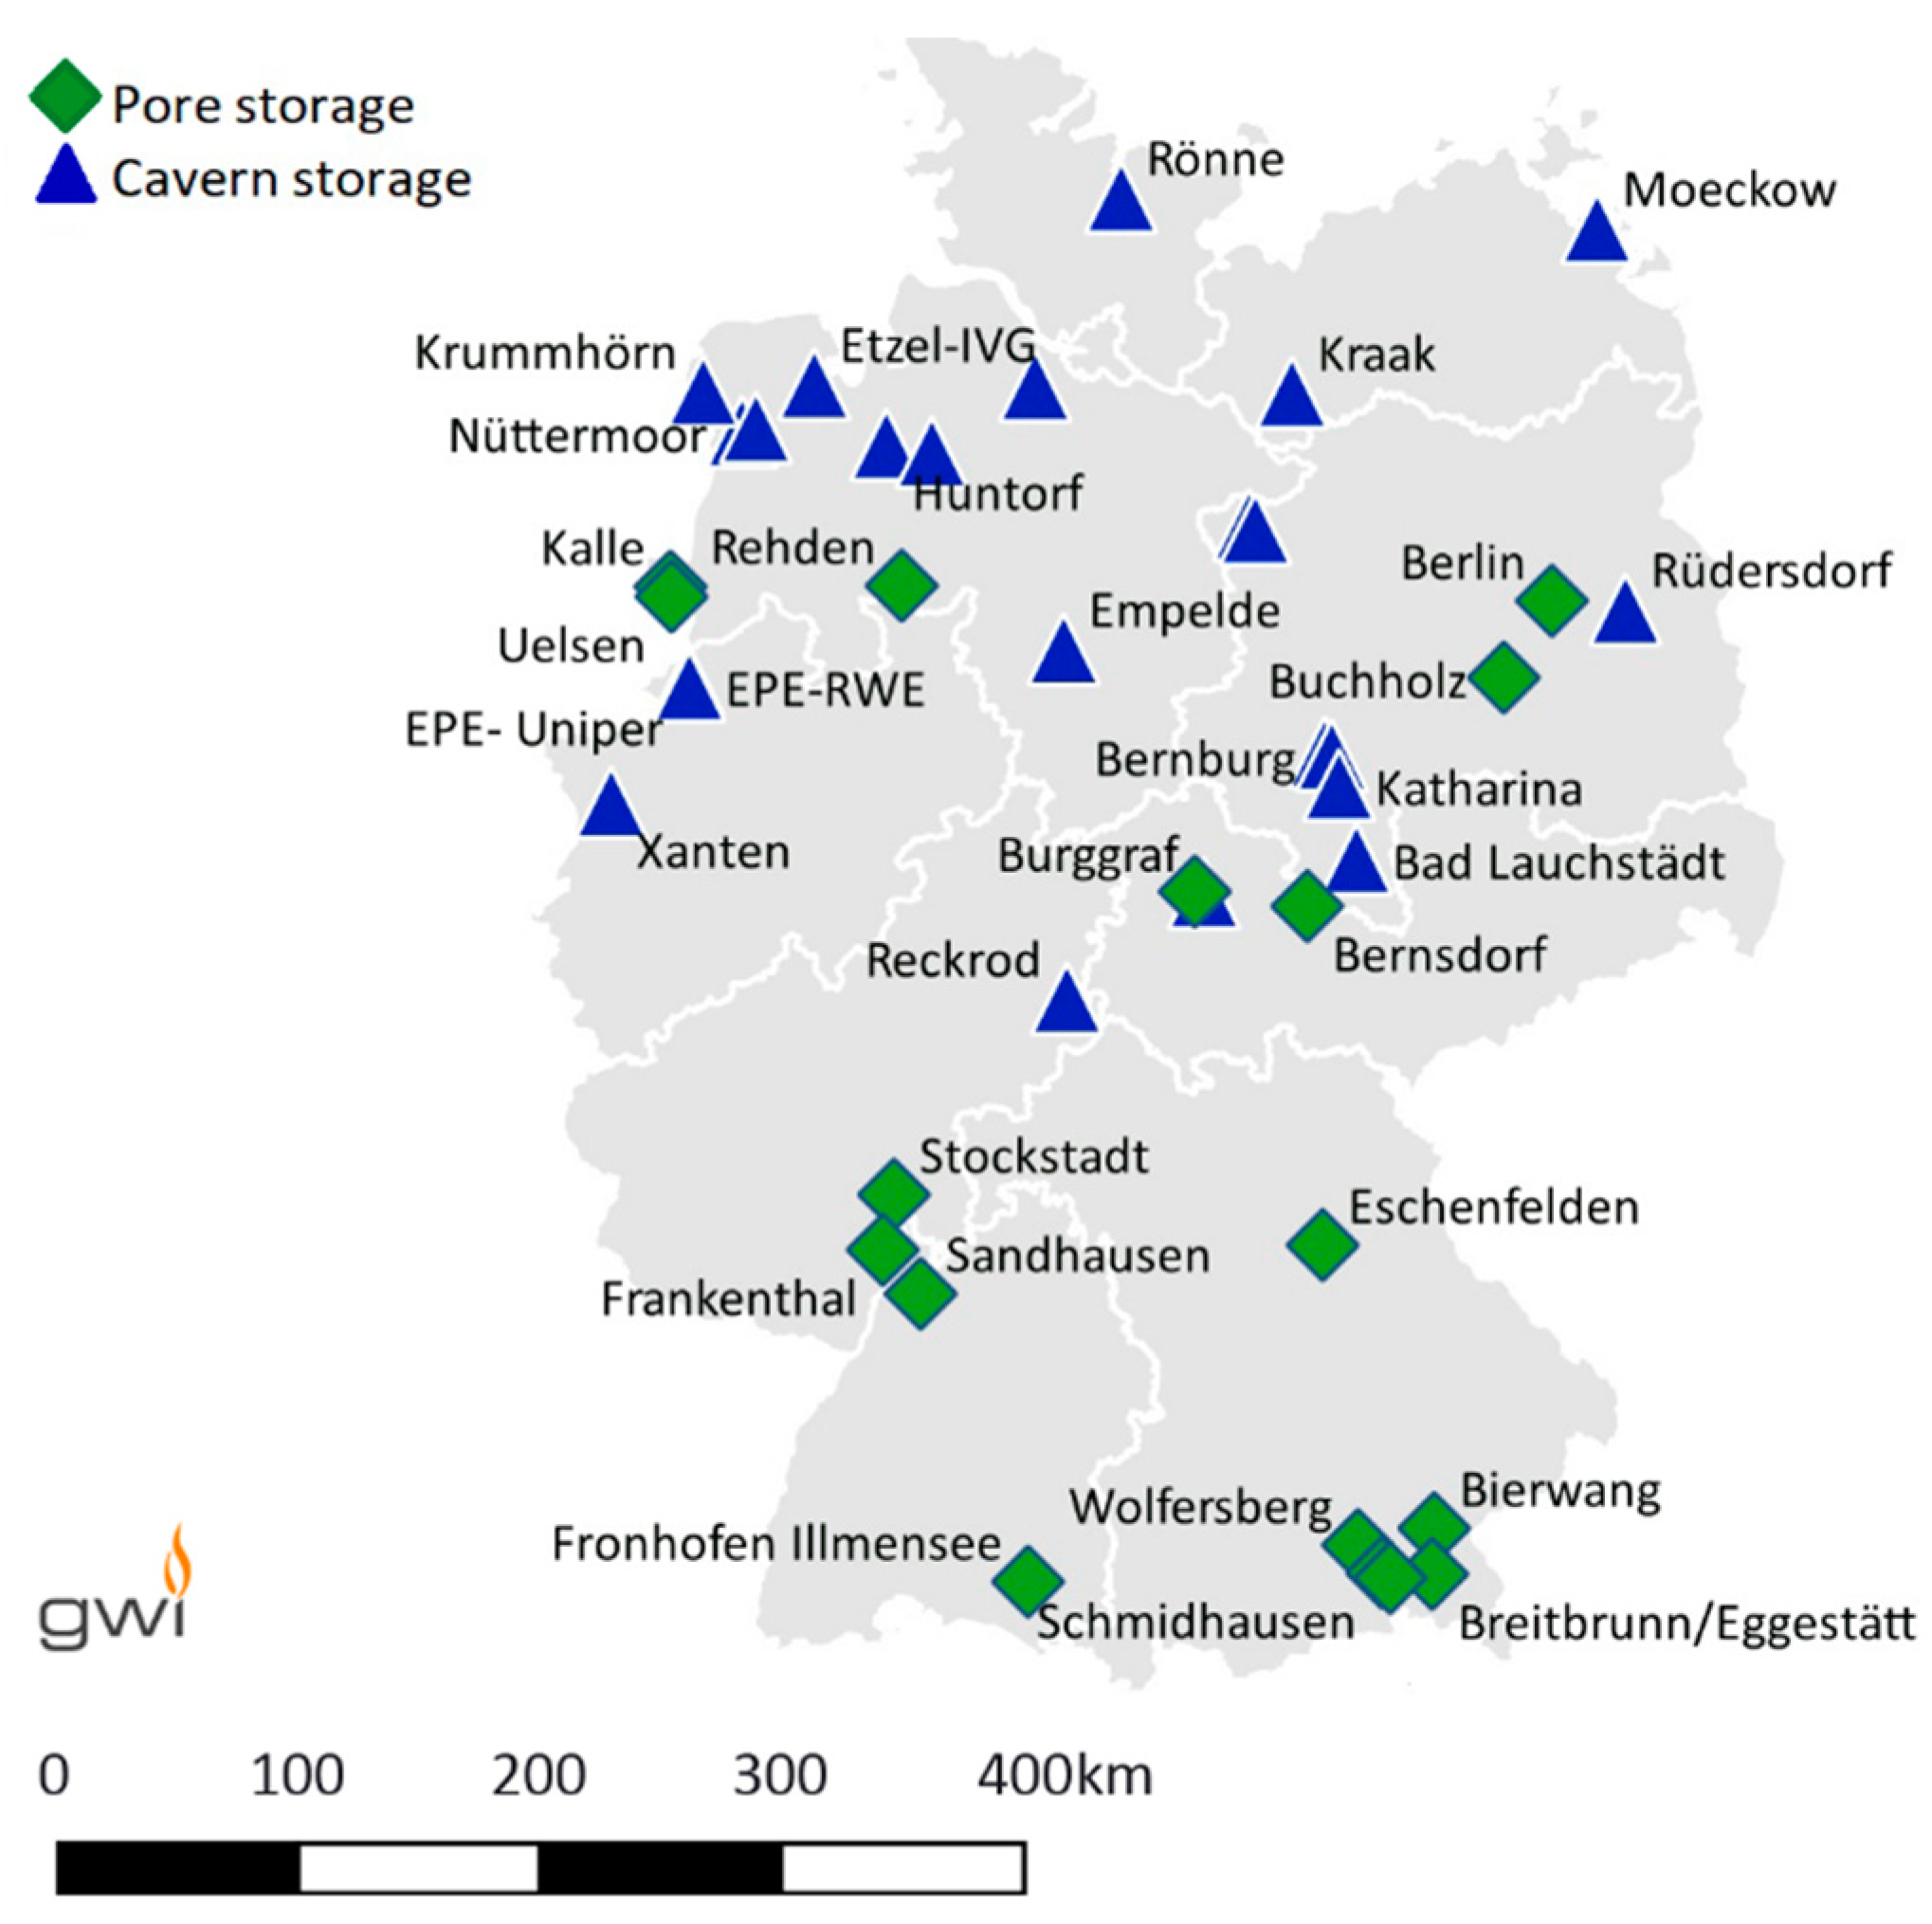
2.4.2. Natural Gas Storage and Hydrogen Storage Option

An essential technical element of the German energy system is the availability of large underground gas storage facilities (Figure 4), which allow a temporal decoupling of purchase and sale of natural gas. With regard to renewable hydrogen, the storage capacities offer the temporal decoupling of production and use.
In general, hydrogen can be stored in analogy to the existing natural gas storage facilities. However, two main storage categories have to be distinguished.
Cavern storage facilities are man-made structures washed out from geological salt deposits. The salt deposit surrounding the resulting salt dome reliably seals the cavern. Due to the necessary geological structures, cavern storage facilities can only be found in certain regions. Within Germany, cavern storage potentials are found in the northern part of the territory, while in the southern part, pore storages are operated (Figure 4). In Europe, and in Germany specifically, extraordinary cavern storage potentials exist, exceeding today’s storage capacities by far [29]. Salt cavern storage is suitable for hydrogen storage. For porous rock storage (depleted oil or gas fields or aquifers) the same is thought to be true in general [30,31]. However, due to uncertainties concerning underground microbiological processes and ongoing research [31], porous rock hydrogen storage was excluded for the case study presented here.
The cavern storage facilities were assigned to the respective model regions, and for the future scenario years, the model was allowed to build hydrogen caverns at an assumed cost of 220 €/MWh of hydrogen (LHV) within the same model regions, which already exhibited one or more storage facilities in 2019. The assumption implies that several additional caverns can be added to the existing cavern fields, taking advantage of the existing infrastructures. At the same time, model regions that lack cavern storage options due to disadvantageous geological conditions cannot be chosen for newly-built caverns by REMix.

2.4.3. Renewable Gas Production: Electrolysis and Methanation

From the portfolio of power-to-gas technologies [32], one exemplary electrolysis and one methanation technology were chosen for energy system modelling: the proton exchange membrane electrolysis (PEM) and the technical methanation.
The PEM electrolysis is assumed to operate at an efficiency of 69.1% in 2020, referring to the higher heating value of hydrogen and including grid injection (73.7% in 2030, 77.4% in 2040, and 80.4% in 2050). Investment costs of 900 €/kW electrical capacity are assumed for 2020 (550 €/kW in 2030, 450 €/kW in 2040, 350 €/kW in 2050). Fixed operating costs are estimated as 2% of the investment costs per year, and variable operating costs are estimated 0.001 €/kWh of consumed electricity.
The technical methanation is parametrised with efficiencies of 74.6% in 2020 (79.6% in 2030, 84.6% in 2040, 89.6% in 2050) including grid injection. The investment costs are assumed to be 1500 €/kWh, with respect to the higher heating value of methane in 2020 (1000 €/kWh, 900 €/kWh, 800 €/kWh). Fixed operating costs are estimated as 2.5% of the investment costs per year, variable operating costs are estimated 0.001 €/kWh of consumed electricity, and additional costs for load change of 0.001 €/kW_CH4 were applied.
The thermal coupling of methanation (exothermal reaction) and the electrolysis process [33], as well as reversible electrolysers/fuel cells, biological methanation, and other carbon capture and usage technologies, were not taken into account.

2.4.4. Injection of Hydrogen and Biomethane into the Existing Natural Gas Grids

The injection of hydrogen to existing gas grids is one technical option for the integration of hydrogen into existing energy supply systems. Today, hydrogen is already being fed in at the gas transmission network level and at the gas distribution network level—but, to date, only on a small scale, typically at demonstration plants.
Due to modelling constraints, the admixture of hydrogen is only considered at the distribution grid level. For the scenario years, a continuous increase in the permitted maximum volumetric share of hydrogen in the natural gas infrastructure is considered, starting from 10% in 2020 to 15% in 2030, 20% in 2040, and 25% in 2050. The gradual introduction of higher hydrogen concentrations ensures that the hydrogen tolerance of the natural gas infrastructure, with all of its downstream end-use technologies, can be achieved.
The injection of biogas into the natural gas grids is modelled on the premise that the fuel quality has been upgraded to that of natural gas (biomethane) through previous processing. This corresponds to the state of the art for biomethane feed-in plants in Germany. In REMix, biomethane is, therefore, treated equivalently to natural gas, and blending is not limited. However, a maximum potential is specified. The domestic biomethane production potential was assumed to be 32 TWh, based on the medium scenario for manure and sewage sludge from [34].
The potentials for the specific countries and model regions considered are available in [14].

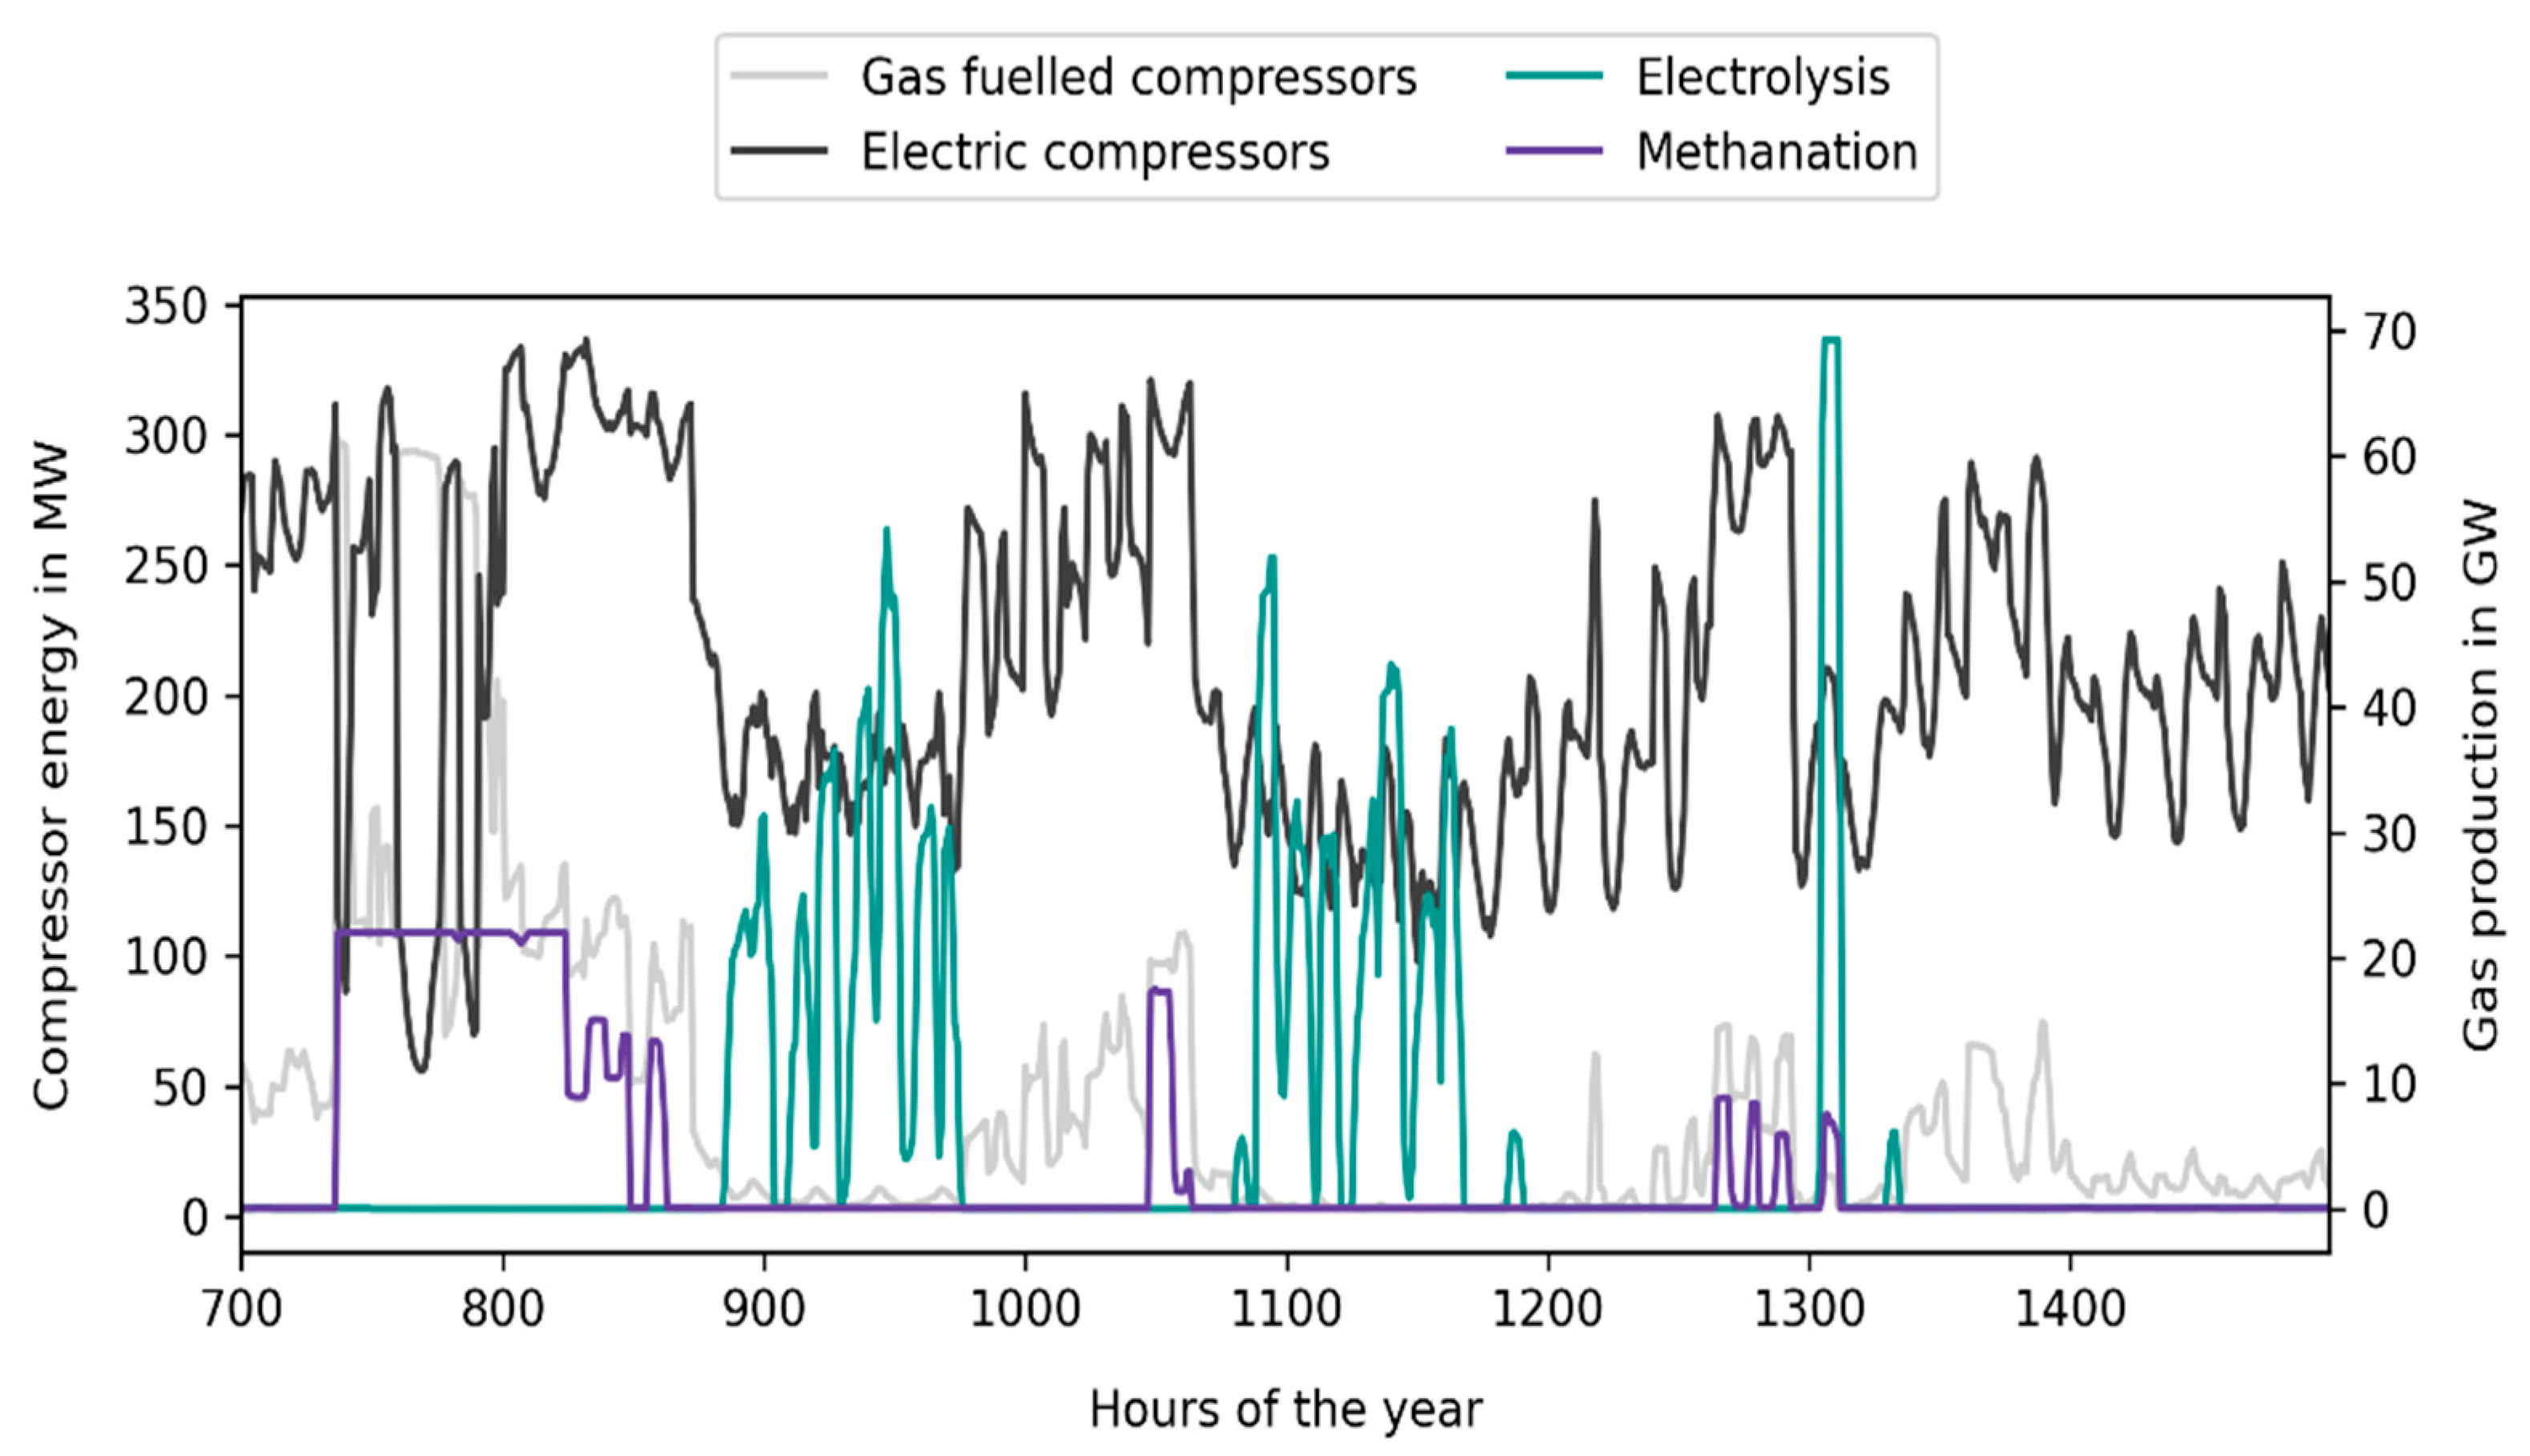
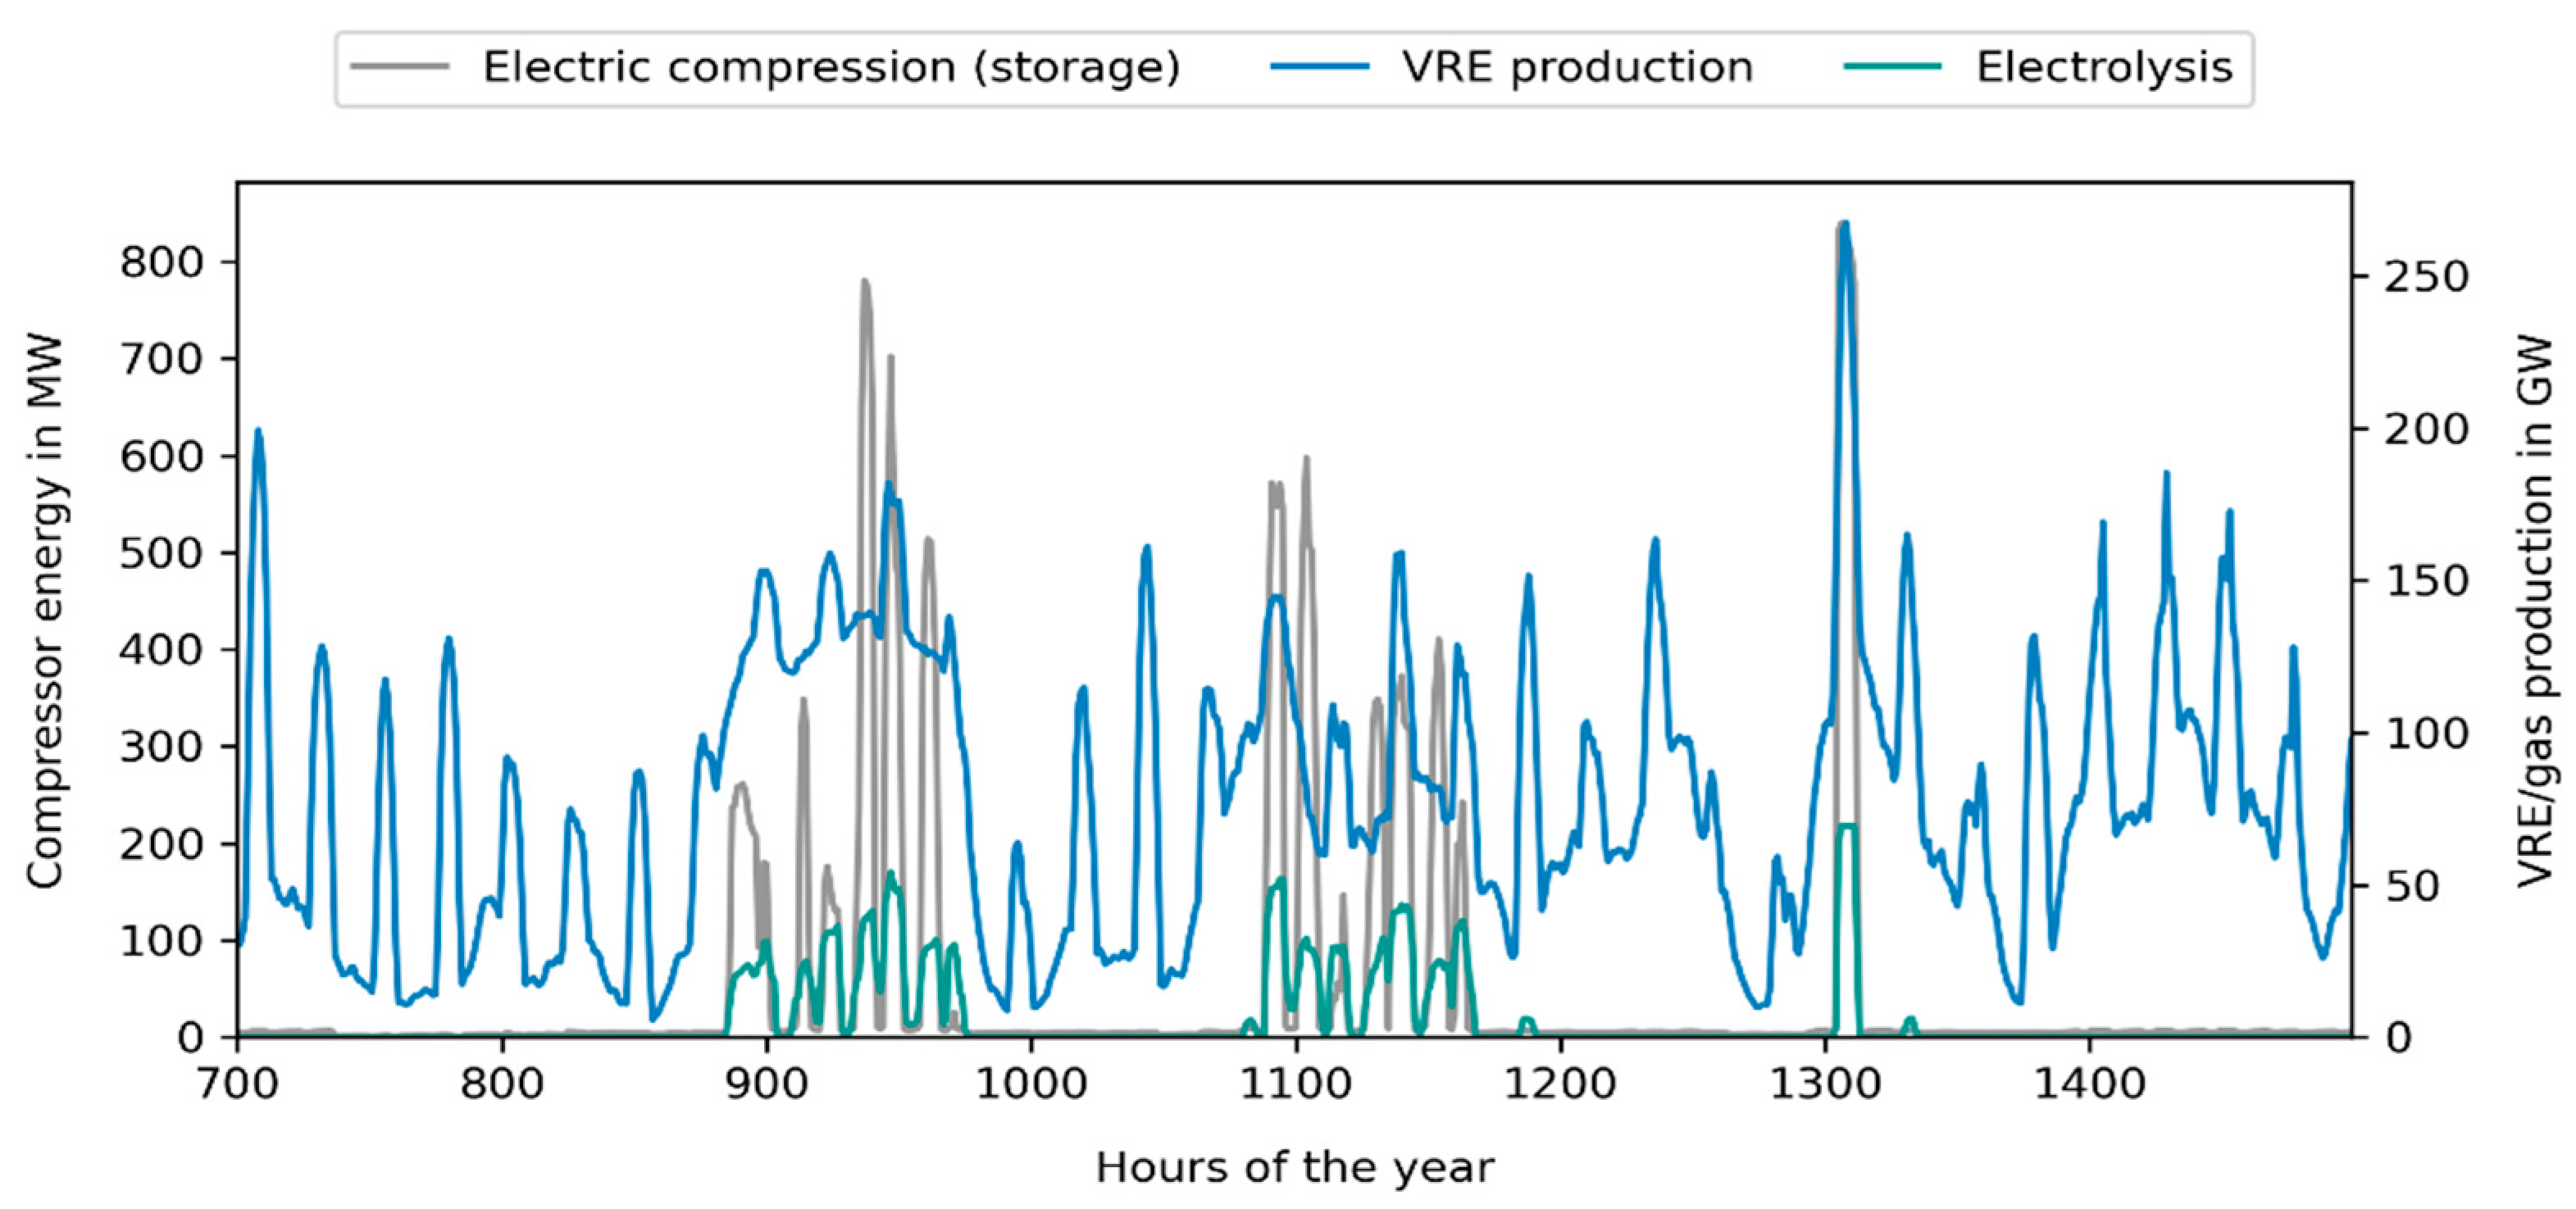
2.4.5. Gas Compression

In REMix, electric, as well as gas-powered, gas compressor units are considered for the transport and storage of gas. The existing compressor stations in Germany are considered as a model input, and in addition, an endogenous expansion is made possible in the model. Typical turbo compressors are assumed, for which electrification of the drive is made possible. Waste heat losses are not taken into account.
In the case of an endogenously built hydrogen infrastructure, the compression demand for transport of pure hydrogen is only covered by electric driven compressor units. Assumptions are published in [14].

2.4.6. Pre-Heating of Natural Gas for Decompression

For its distribution to the end customers, natural gas is transferred from the transport network, which is operated at high pressure, to the regional distribution networks at pressure regulation stations. In the distribution networks, it is first transported under high or medium pressure and then expanded into the low-pressure range (≤100 mbar) for the purpose of fine-mesh distribution. With each expansion, natural gas cools down due to the Joule–Thomson effect. In order to avoid condensation inside pipelines and in the pressure regulation stations and ice formation that might render the armatures inoperable, gas preheating is necessary before the gas is expanded. The heat demand for gas preheating in Germany is taken into account as a model heat sink that can be equipped with bivalent technology. The choice of technologies is the result of optimization. The model can use electric boilers, gas condensing boilers, heat storage, and gas-fired CHP plants. In order to minimise the number of model variables for the small heat demand compared to the industrial or household sector, a regional breakdown of the gas preheating demand in REMix was dispensed with, and the demand for gas preheating in the gas grids was aggregated and assigned to the model region North Rhine–Westphalia. For this purpose, the total demand for thermal energy is distributed over the hours of the year, using a representative demand profile for gas preheating. The annual heat demand of preheating amounts to 253 GWh in 2020, 179 GWh in 2030, 104 GWh in 2040, and 38 GWh in 2050.

2.5. Further Model Input Assumptions

Like the technologies in the gas sector, those in the other sectors are described by extensive techno-economic data sets. These include, in particular, the investment and operating costs of the plants, as well as their efficiencies and other technical parameters. The model assumptions are available in [14]. Of particular importance, to the desired transformation of the energy system, is the assumed CO2 price that accrues system-wide on all emissions (Table 2). In Germany, no CO2 emissions, at all, will be permitted in 2050, meaning that only renewable gases can be used in the model.
For spatially and temporally resolved modelling, the demand data, as well as the VRE potentials, must be disaggregated accordingly. For the latter, results of the EnDAT model [35] are used, and historical data of the weather year 2006 are applied. The procedure for the spatial distribution of the demands and the determination of the load profiles is described in detail in [19].

2.6. Legal and Regulatory Framework in Germany

The electricity sector is highly regulated, and hence, the cost of electricity consumption is at the centre of regulatory influence on investment decisions and feasibility. In Germany in 2020, for small industrial customers (50 MWh/a), cost per kWh was comprised by roughly one quarter of actual energy cost, by 15% of network charges, and by 40% of a surcharge for renewable energy support [36]. The rest were other taxes and levies. For the consumer categories most relevant to this analysis, there are exemptions and rebates. A representative power-to-heat application, like any small industry customer, is able to purchase electricity at lower cost than household customers. In contrast to other industries and power-to-heat, power-to-gas plants are additionally exempted from electricity tax of roughly 0.02 €/kWh [37]. In the meantime, since the modelling took place in 2020, an exemption from the renewable energy surcharge was granted as well, albeit just under certain conditions.
Projections on future electricity cost, as they enter into the evaluation of economic feasibility of the required investments with MuGriFlex, are based on a number of assumptions. Hourly electricity costs are an output of techno-economic modelling with REMix in the respective scenario as presented above. In line with political decisions and current discussions in Germany, we assume that the renewable energy surcharge will phase out, as future investments into wind and solar power will receive less and eventually no support and past subsidy commitments are already phasing out. Network charges, on the other hand, are likely to rise with grid expansion to integrate renewable electricity. In line with projected investments in the electricity grid, network charges, and other levies and surcharges, drop from roughly 0.12 €/kWh to around roughly 0.08 €/kWh in 2050.
Given the limited economic feasibility, additional support policies are in place or under consideration for certain relevant technologies. By and large, support occurs in the form of investment support or operational subsidies. In 2020, investment support was administered to district heating pipes and thermal energy storage, as well as, under specific circumstances, to electric boilers and to power-to-gas demonstration plants. Operational subsidies for a representative CHP plant were between 0.03 and up to 0.11 €/kWh [36,38]. Operational support of electrolysis happens only in the form of reduced taxes and surcharges, as discussed above. The scale of additional support that might be needed to achieve the investment levels and operation schedules, found optimal in the overall system modelling, is discussed in Section 3.2.

3. Results

3.1. Results of the Energy System Optimisation

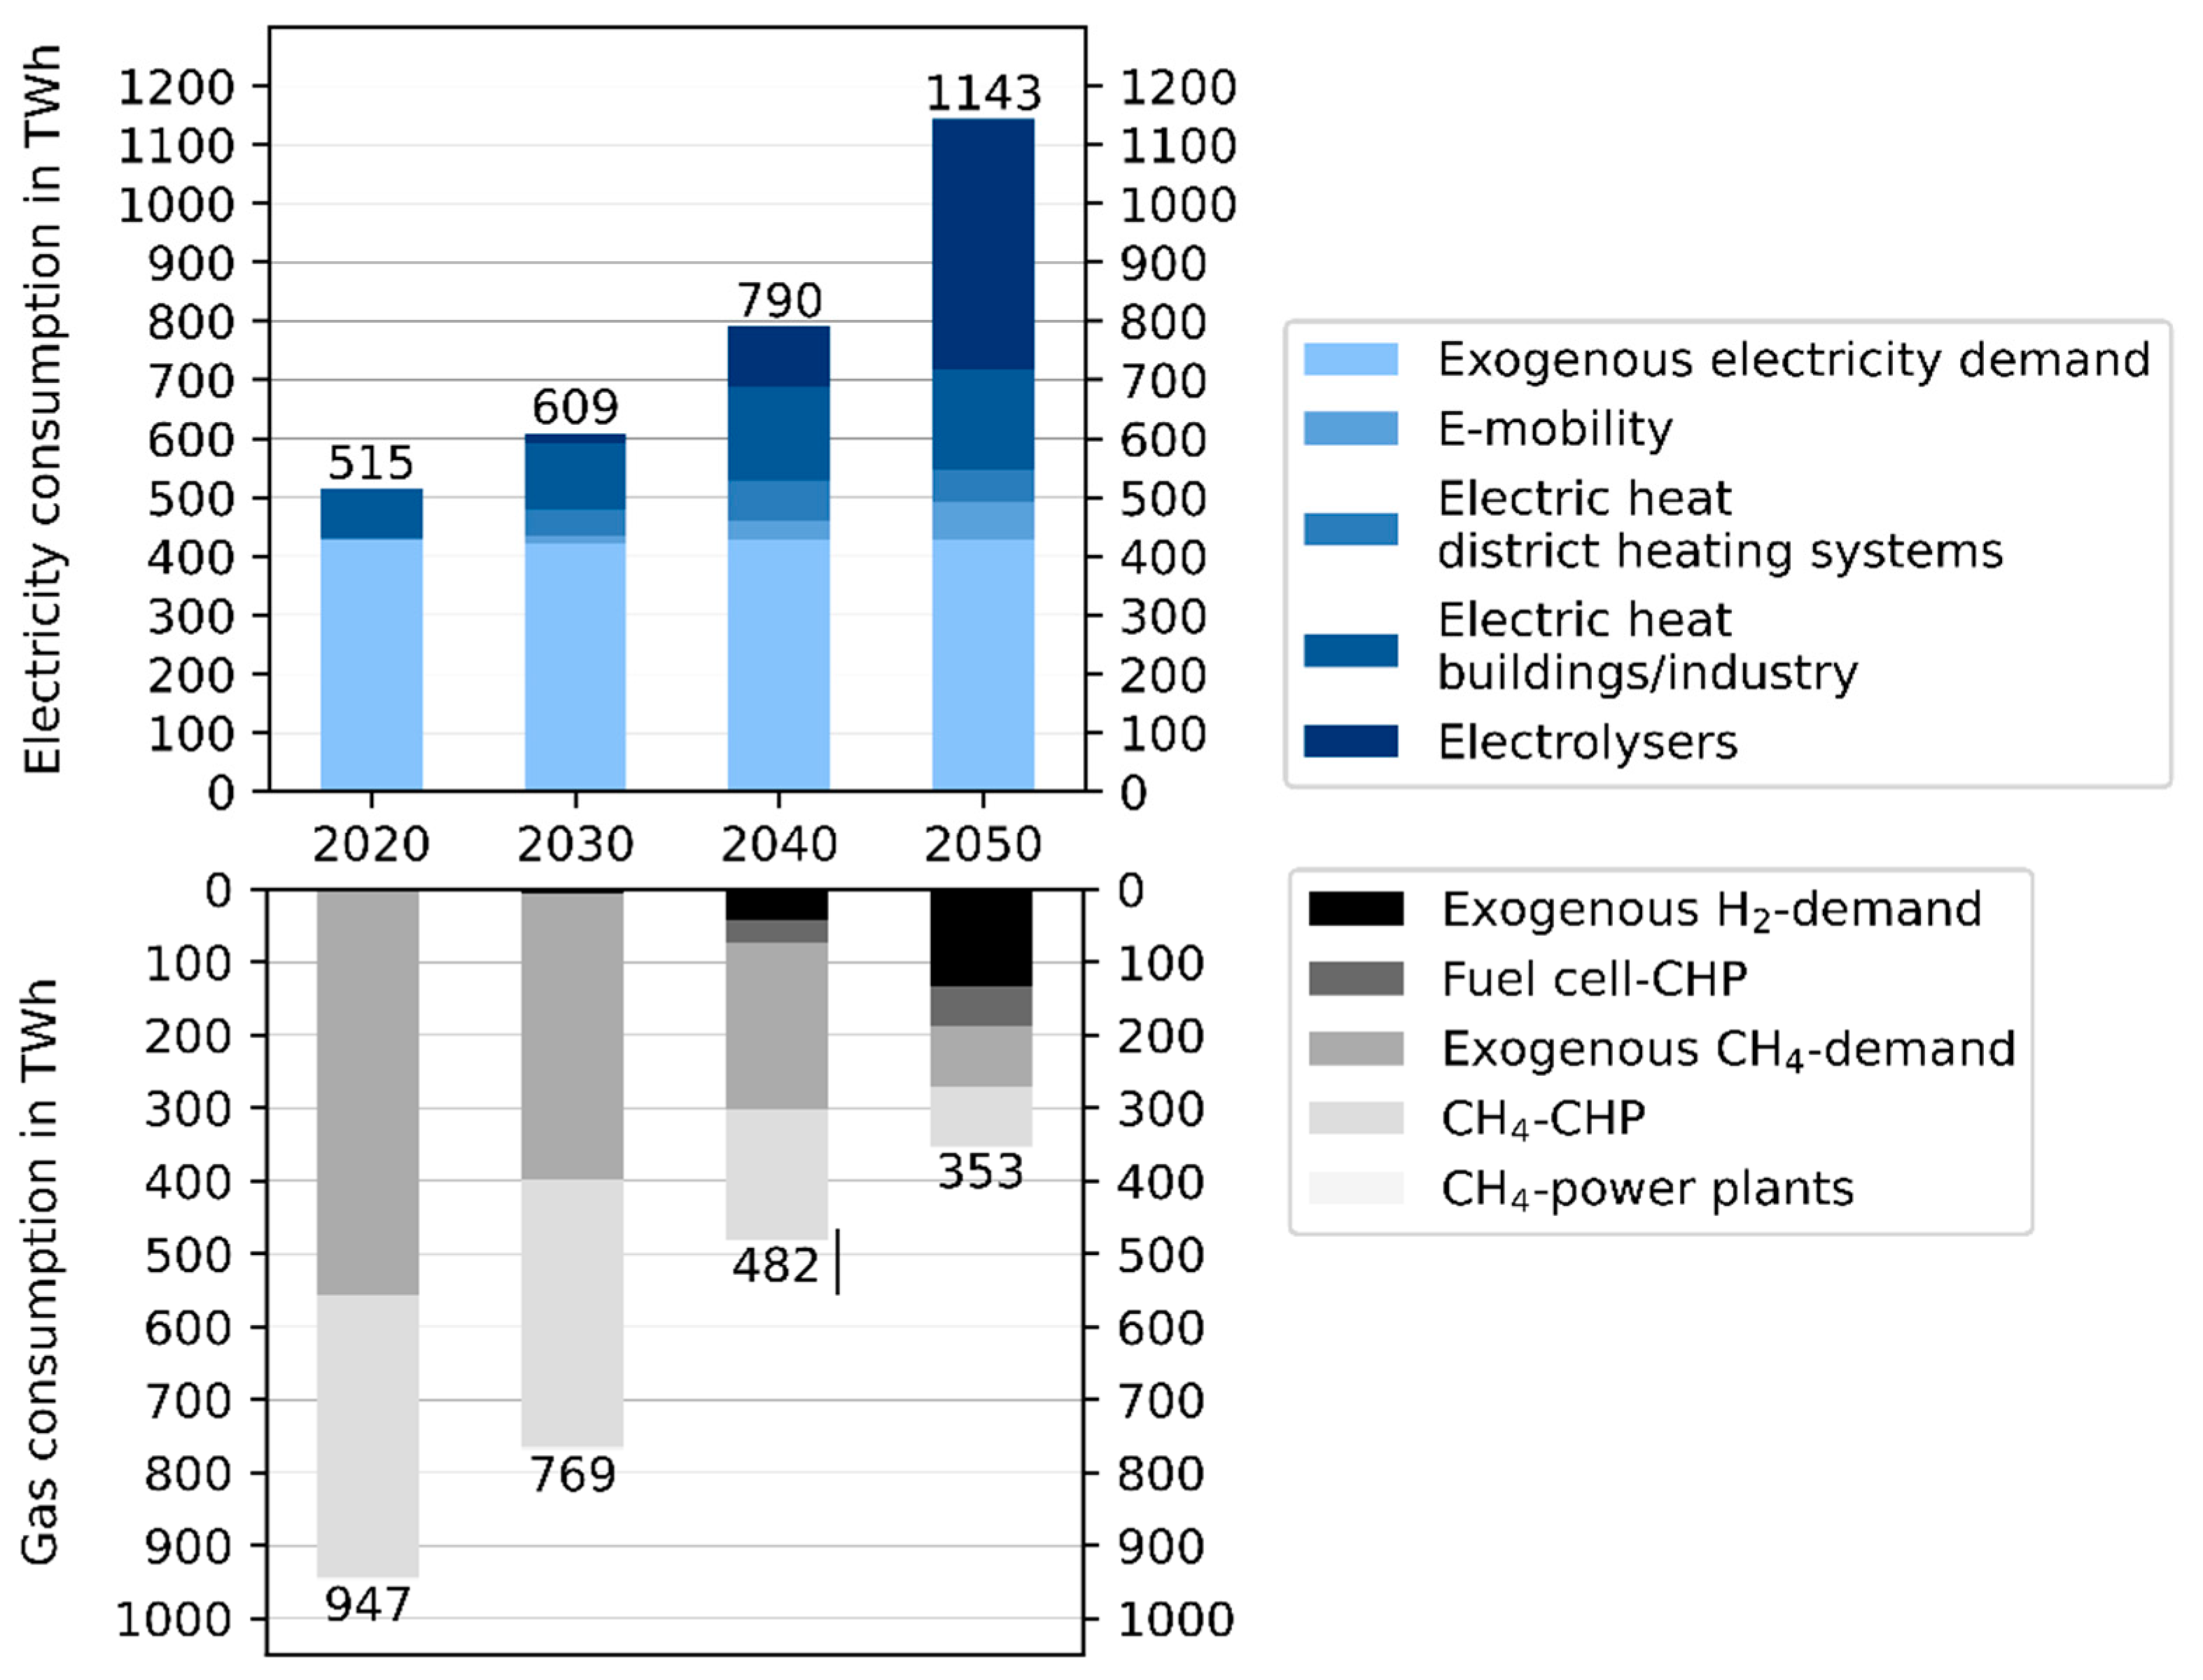
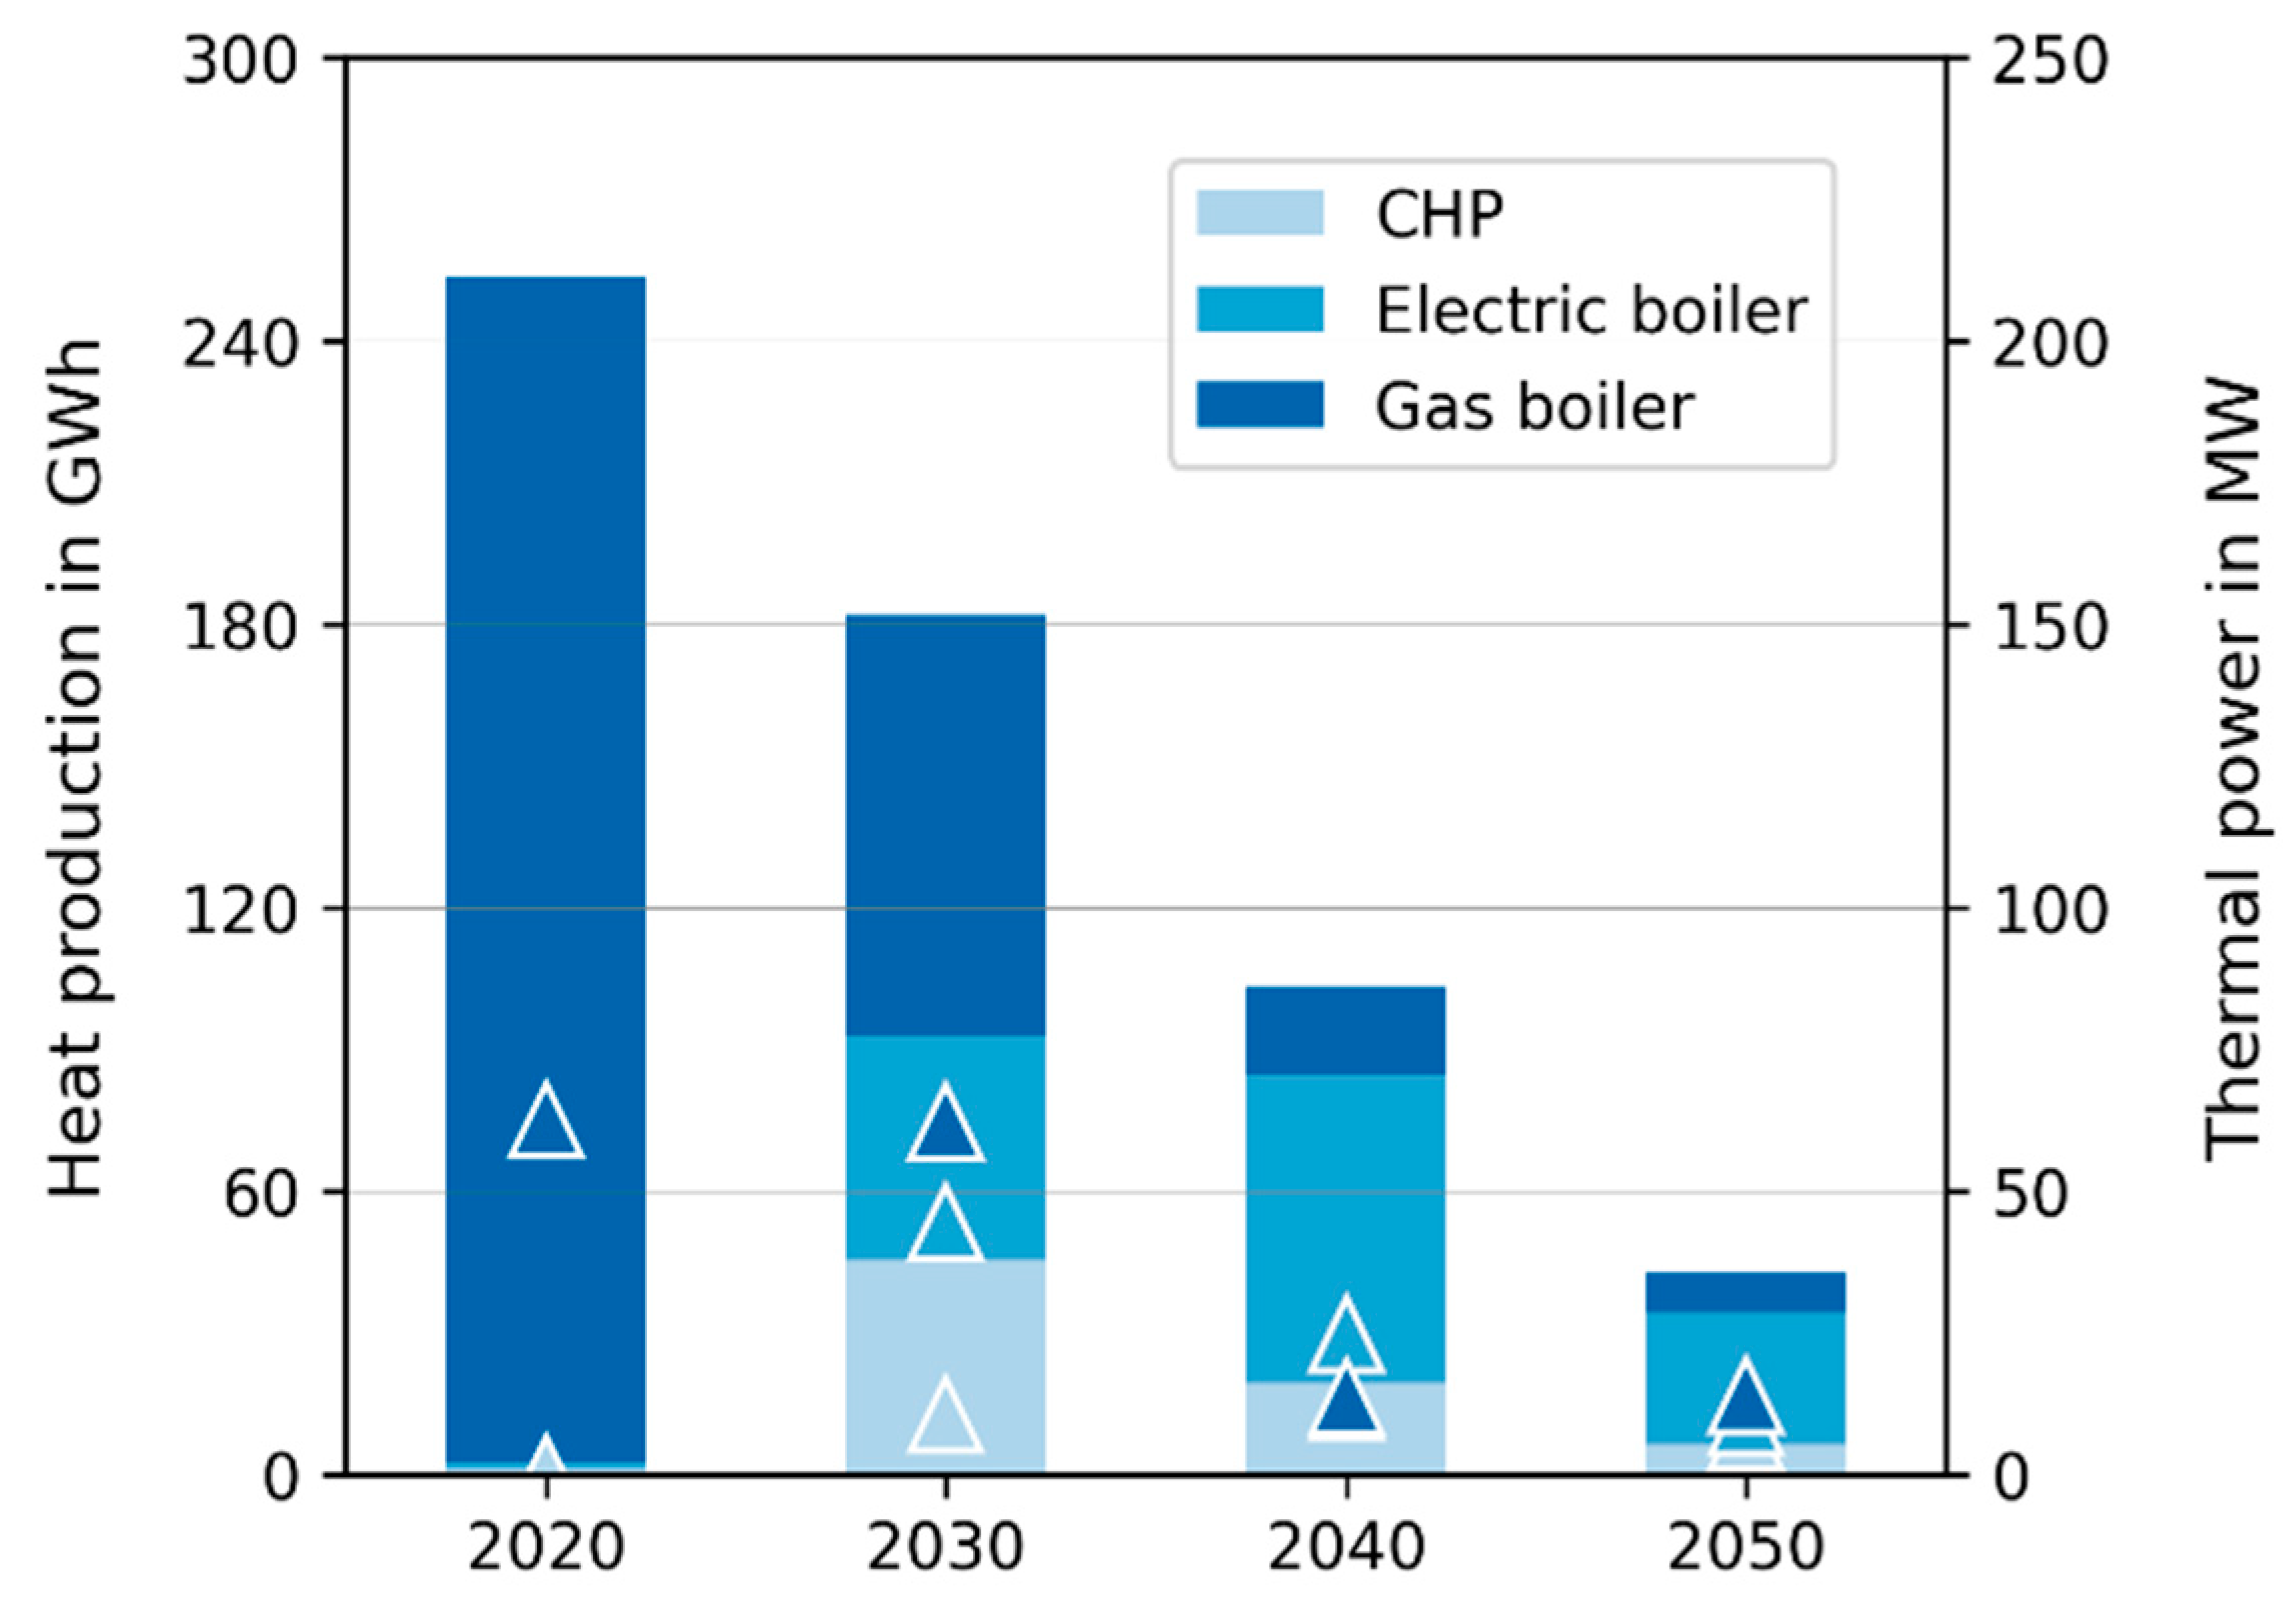
3.1.1. Development of Energy Demand

The goal of a drastic CO2 emission reduction requires a fundamental shift in energy demand driven by sector coupling. For the system considered in REMix, this mostly concerns a significant decrease in gas demand and a strong increase in power demand (Figure 5). These demands are partially exogenously defined, and partially model output. The endogenous power demand includes, most dominantly, the electrolytic production of hydrogen and the usage of electrical heat generation in district heating systems, as well as industry. Regarding the gas demand, including both hydrogen and pipeline gas, the usage in power plants and boilers are a model output.

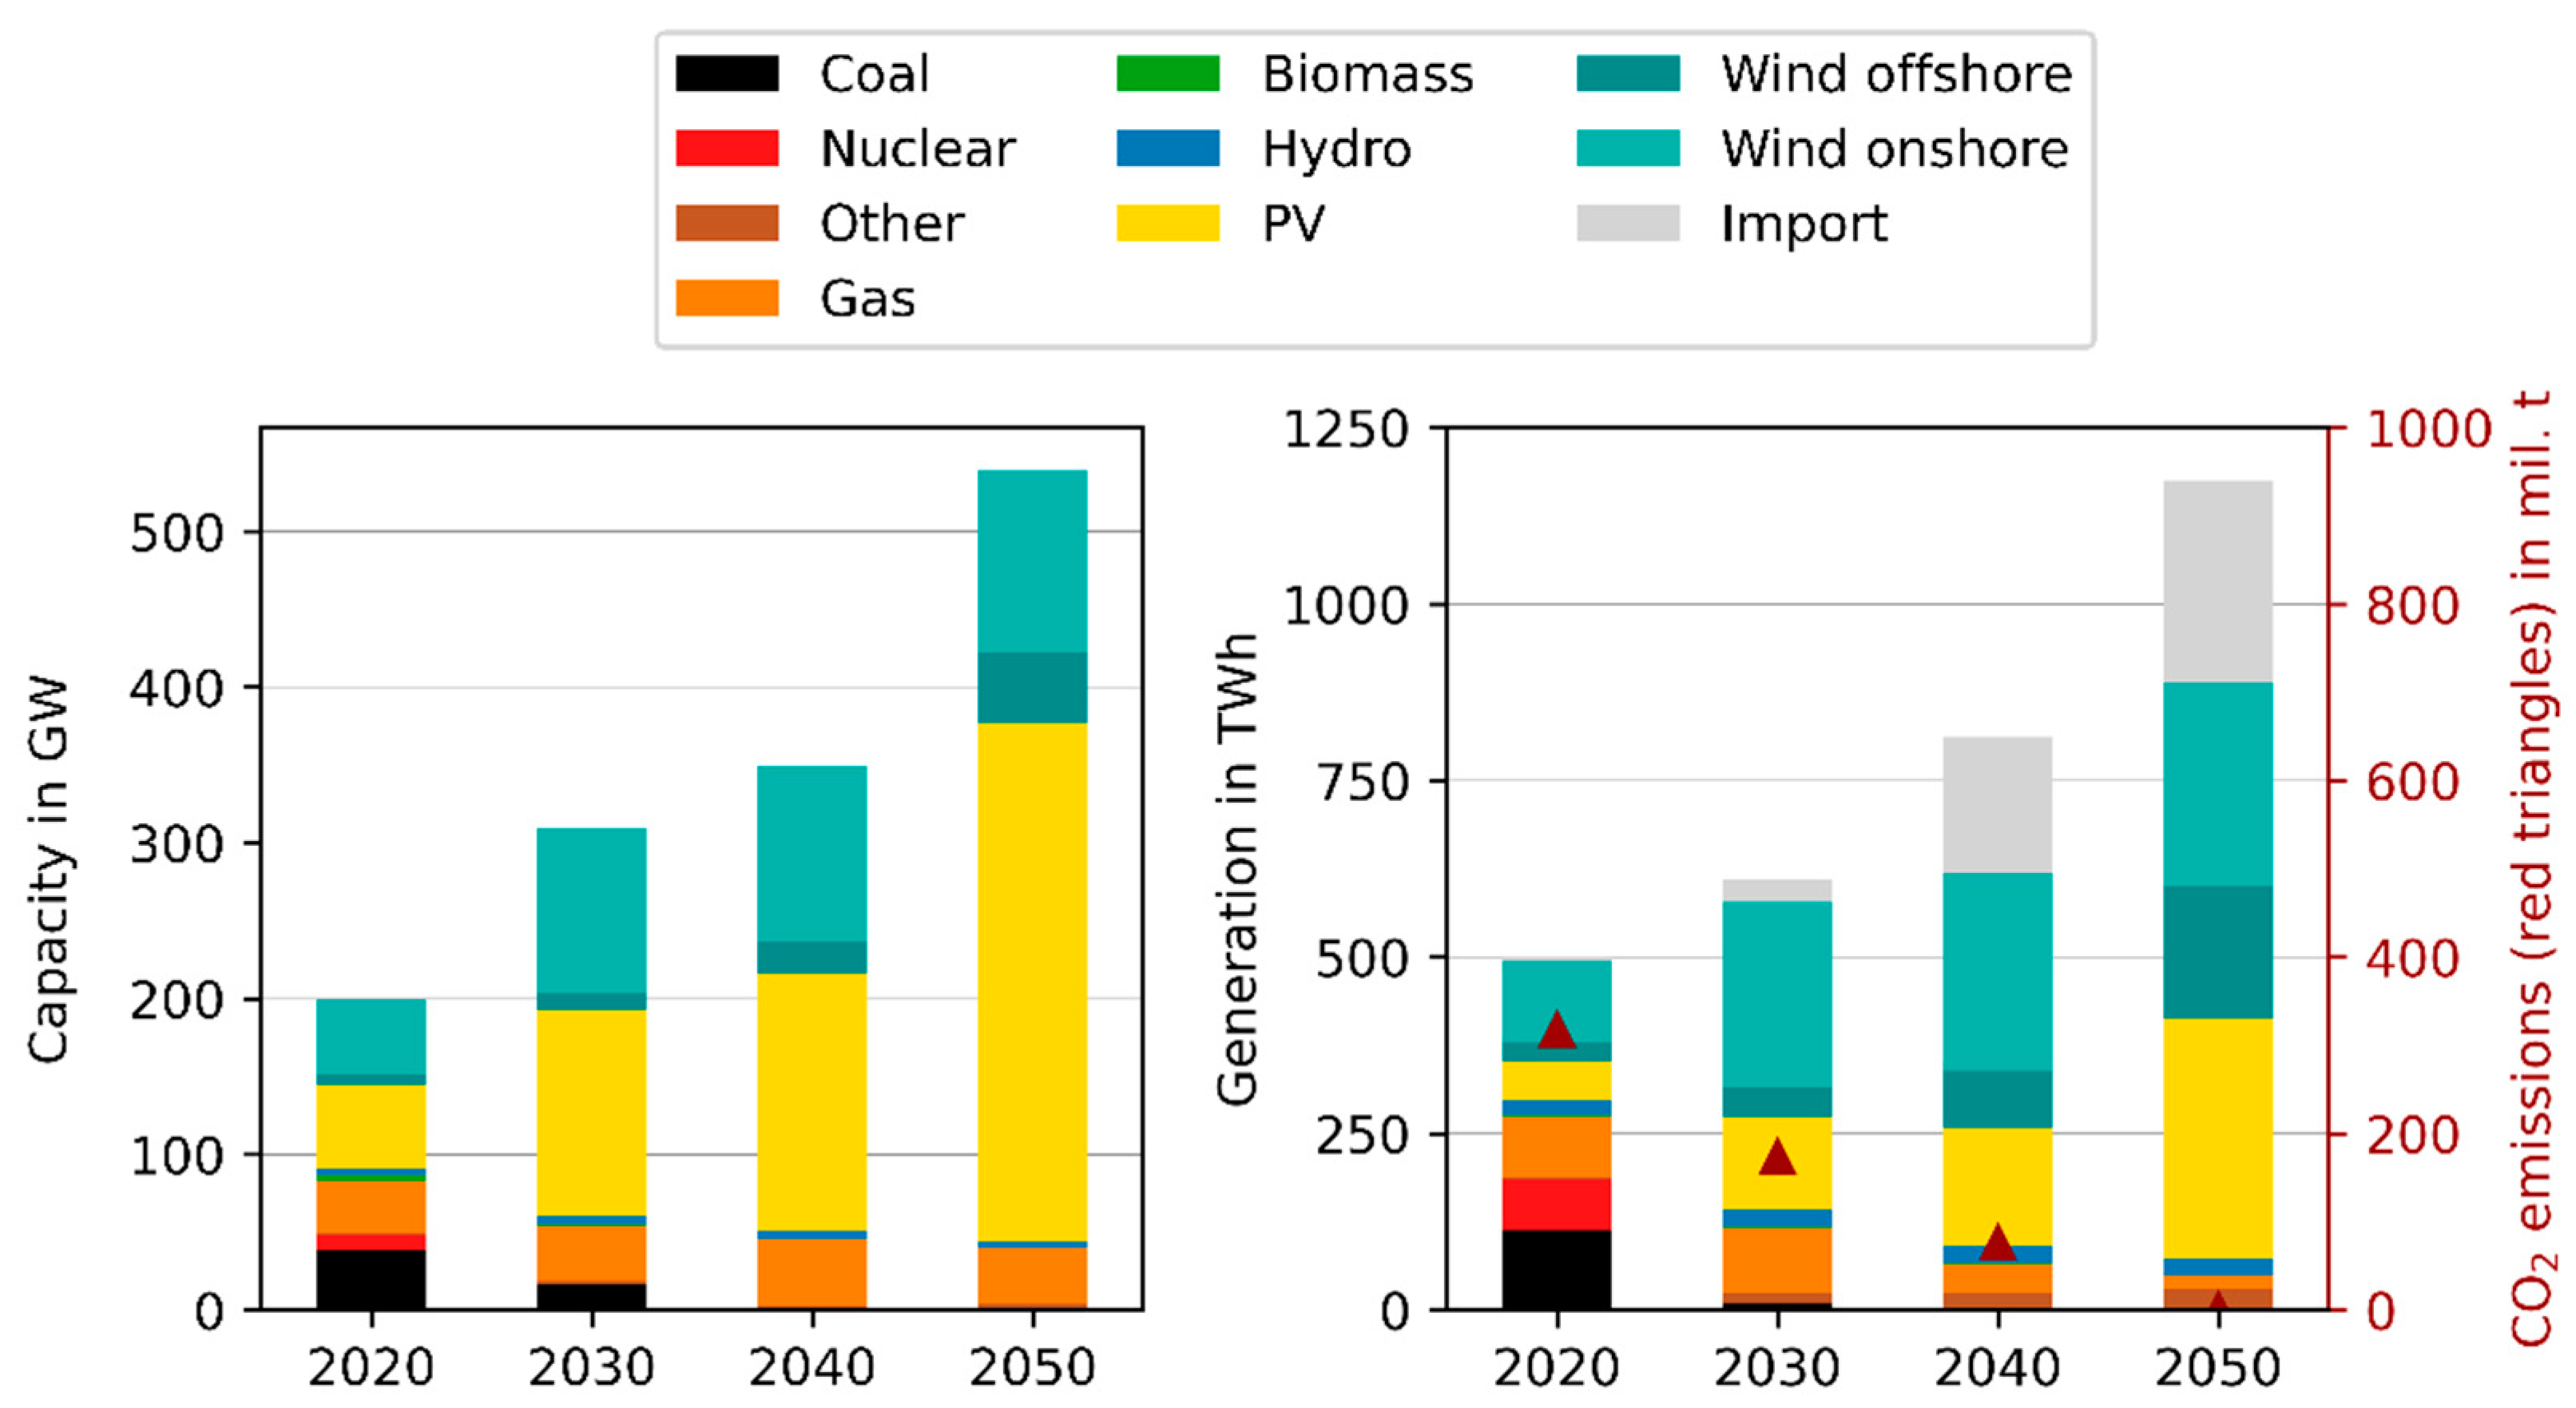
3.1.2. Development of Power Supply and Flexibility Provision

The supply of the increasing power demand, and the substitution of the conventional power plant park, requires a substantial increase in the installed renewable power generation capacity (Figure 6). Already, until 2030, PV and wind capacities are more than doubled, compared to 2020, to enable the phase-out of nuclear and coal power plants. Further capacity installations are required along the transformation towards an integrated energy system. The sharp increase in hydrogen production between 2040 and 2050, especially, drives the installation of additional offshore wind turbines and PV systems. To ensure security of supply, dispatchable generation capacities will be required until 2050. For that, REMix mostly chooses gas CHP units in district heating systems, which also contribute to the heat supply. While these are, at first, operated using natural gas, they only have biomethane and synthetic methane available in 2050. Based on these installations, the power generation structure sees a major shift to emission-free technologies. Driven by the CO2 price assumed, coal power plants are almost not used anymore already in 2030. Instead, onshore wind power provides almost half of the power supply. In 2040, also gas power plants are reduced to a minor share in power supply, whereas additional electricity imports become significant. In the zero-emission system of 2050, PV takes over the role as the most important source of electricity, followed by onshore and offshore wind power. Other technologies contribute less than 10% of the overall supply, while the imports reach the exogenously defined limit of 20%.
The strong increase in renewable electricity generation is accompanied by an increase in the required flexibility demand. This is covered by numerous technologies, the suitable combination of which makes it possible to limit the share of VRE curtailment to less than 1.5% of potential electricity generation. At 0.7%, the maximum value achieved in Germany is even lower. Due to the change in energy demand and the power plant fleet, the use of the various flexibility options shows different trends over the course of the scenario years (Figure 7). Thus, the power generation in controllable power plants already decreases significantly until 2030. In contrast, there is an increase in the use of all types of energy storage. In addition to electricity storage, these also include heat storage, which serves to make CHP plants and heat pumps more flexible, as well as hydrogen storage. The latter allow electrolyser operation to be adapted to VRE availability. Stationary energy storage is complemented by flexible and bidirectional charging of battery vehicles and demand response in industry and commerce. Extensive shifts in the use of transportation networks for energy are also evident over the course of the transformation. For example, due to the decline in demand, the volume of gas transported across regional borders in Germany falls from just under 700 TWh in 2020 to about 200 TWh in 2050. This is partially compensated for by the construction and use of a hydrogen network, which, in 2050, will transport an energy volume of about 200 TWh across regional borders. The power grid also shows an increase in transported energy, from just under 90 TWh in 2020 to 200 TWh in 2050. The investments required for the transformation of the gas sector are described in more detail below, and technology-specific values are provided in [19].

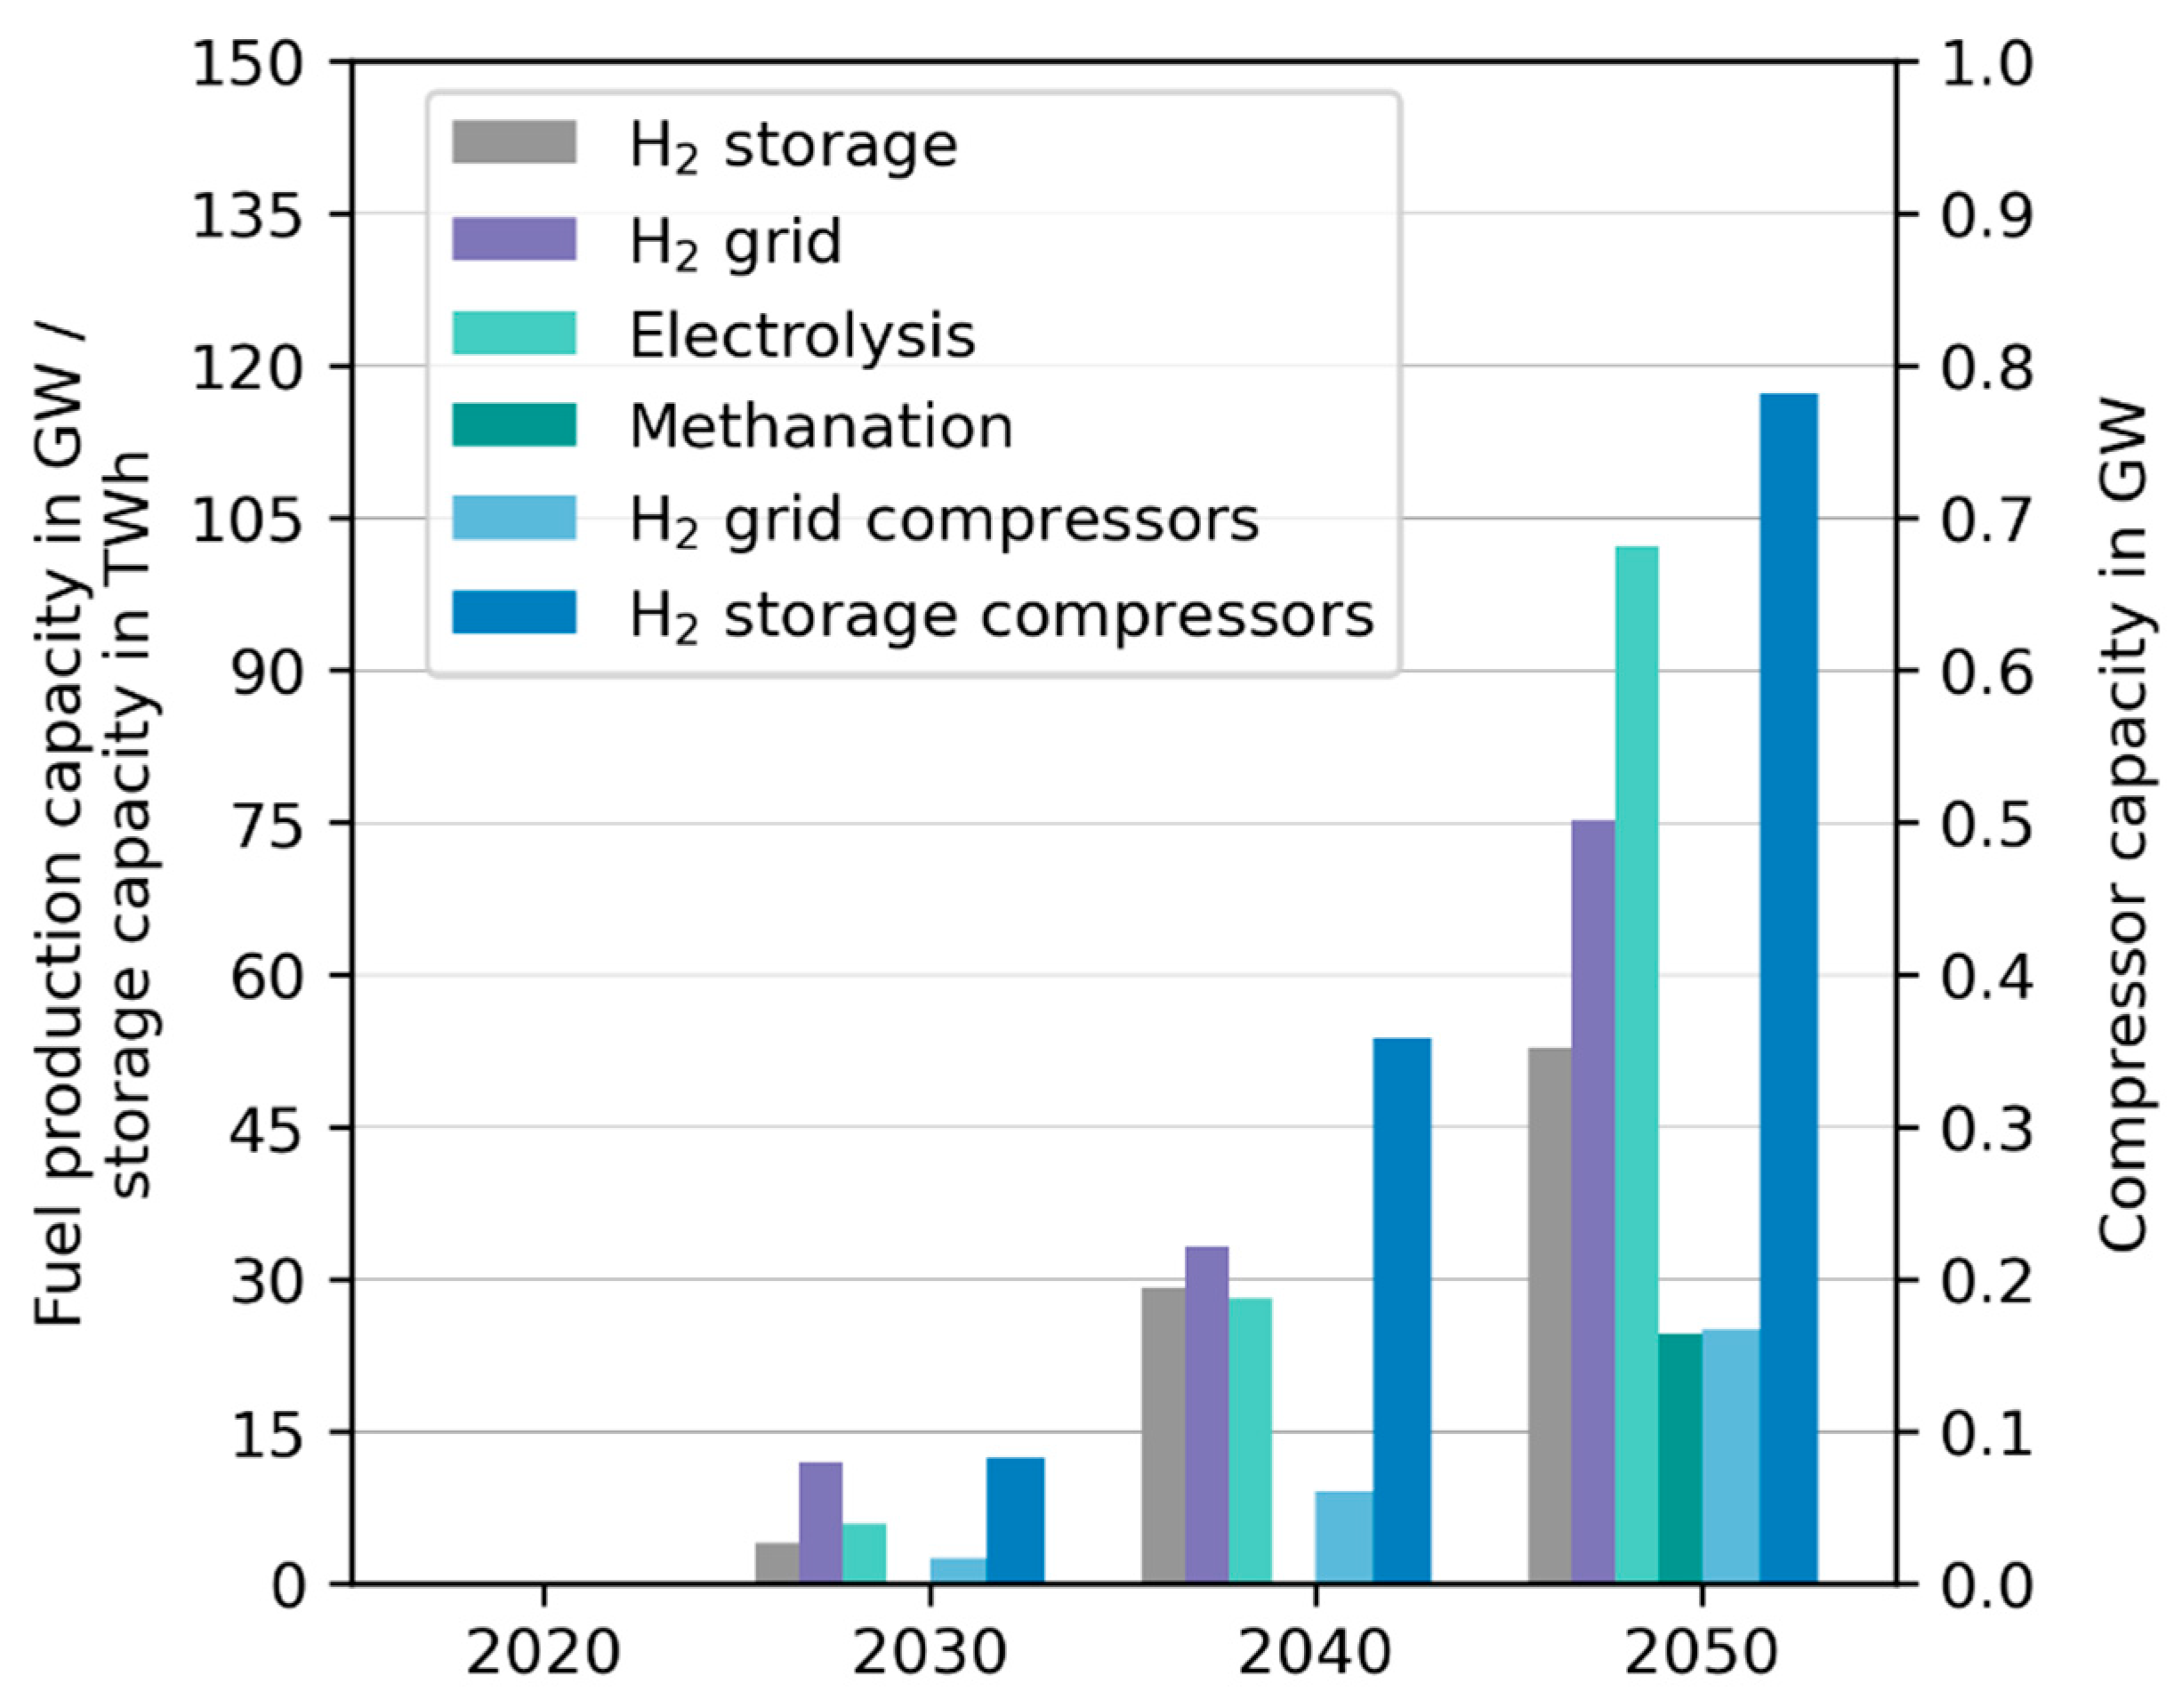
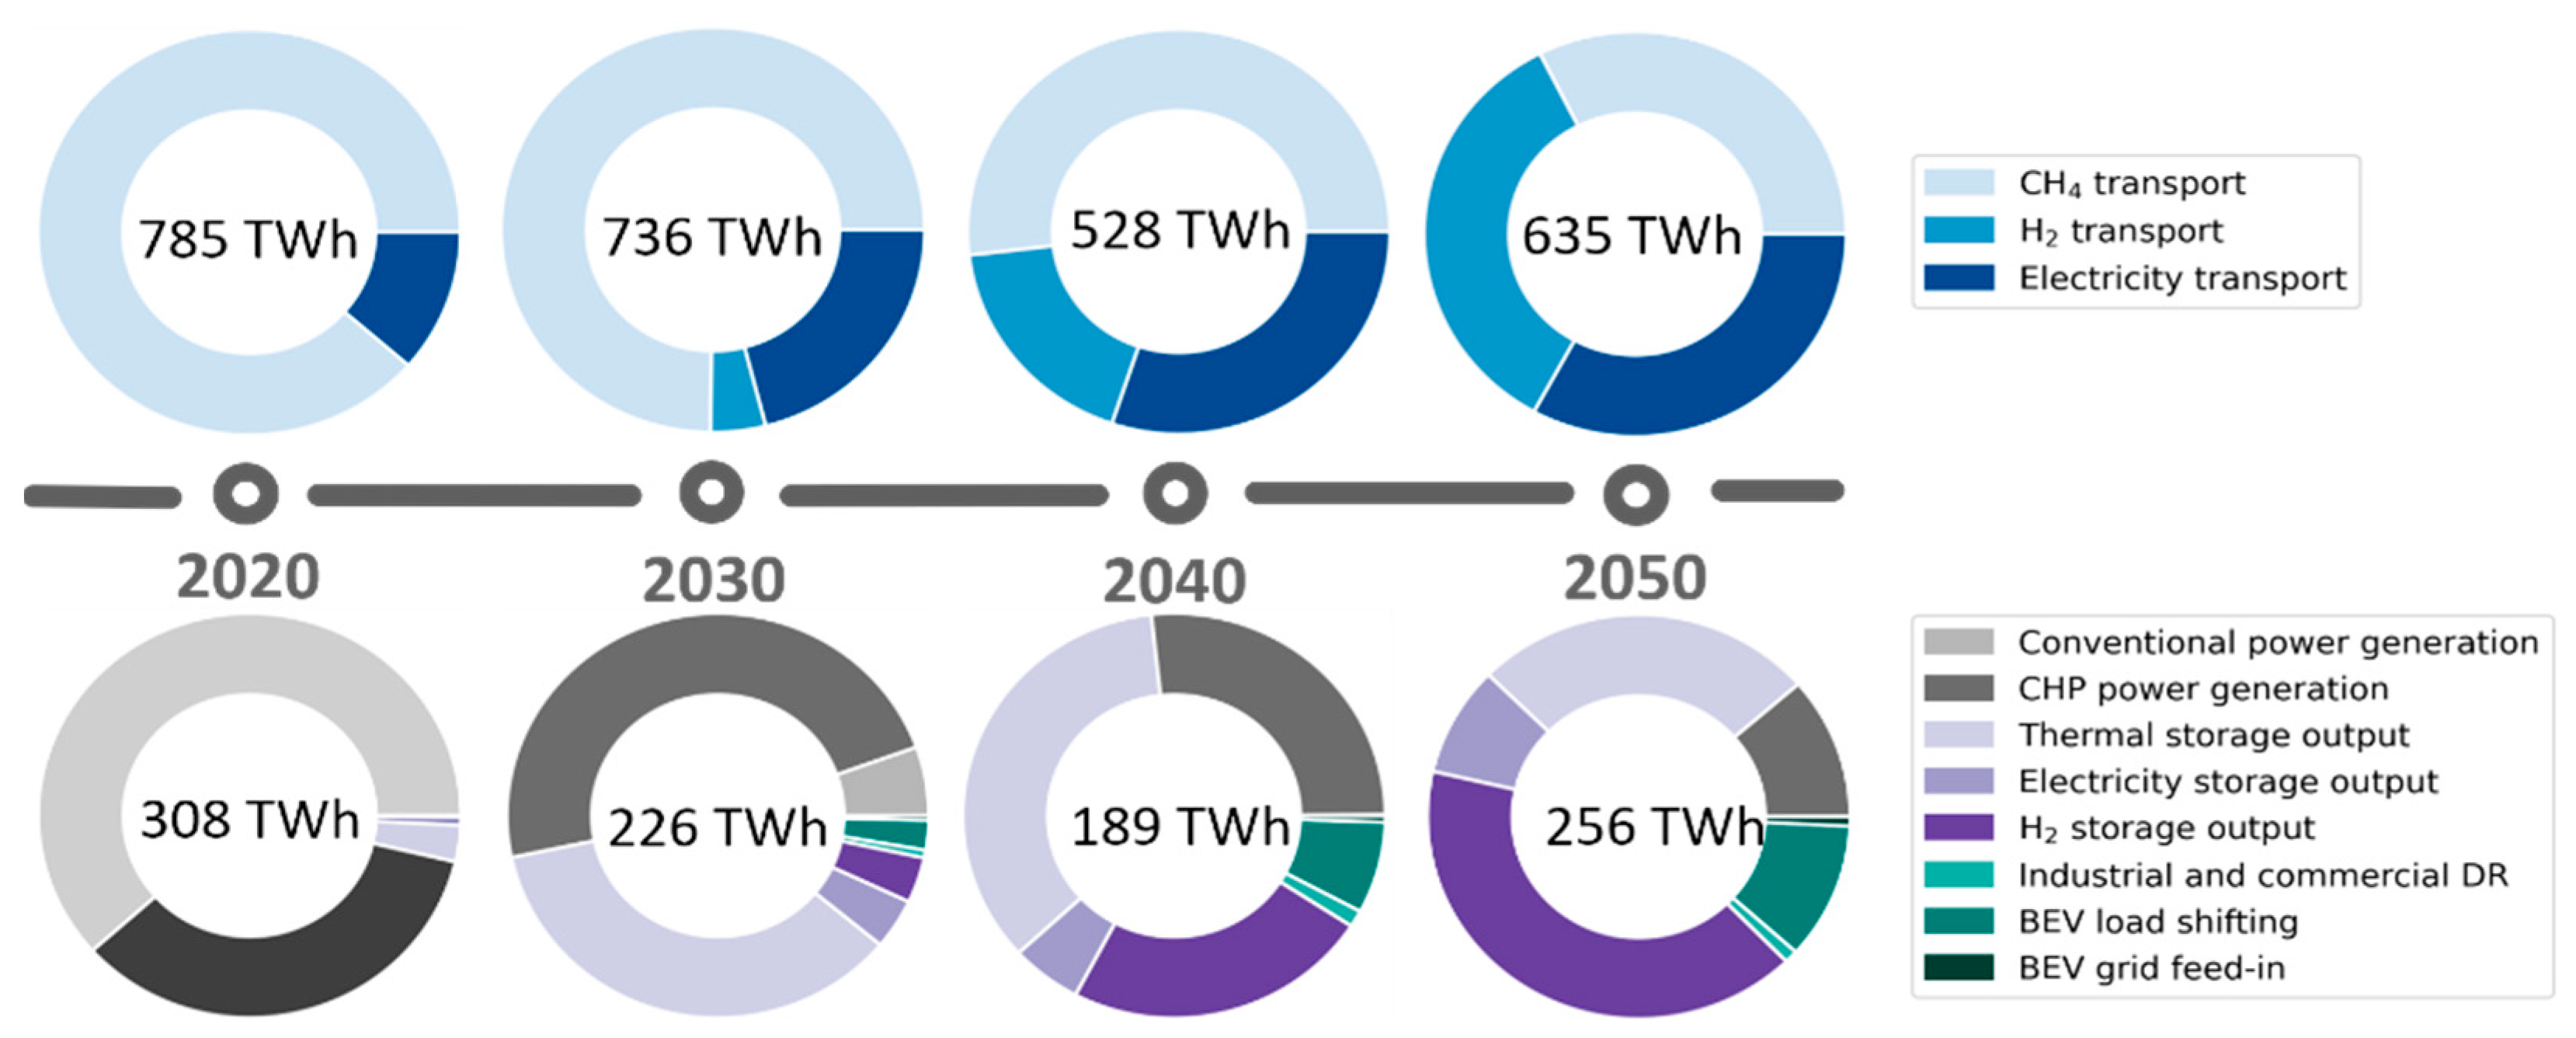
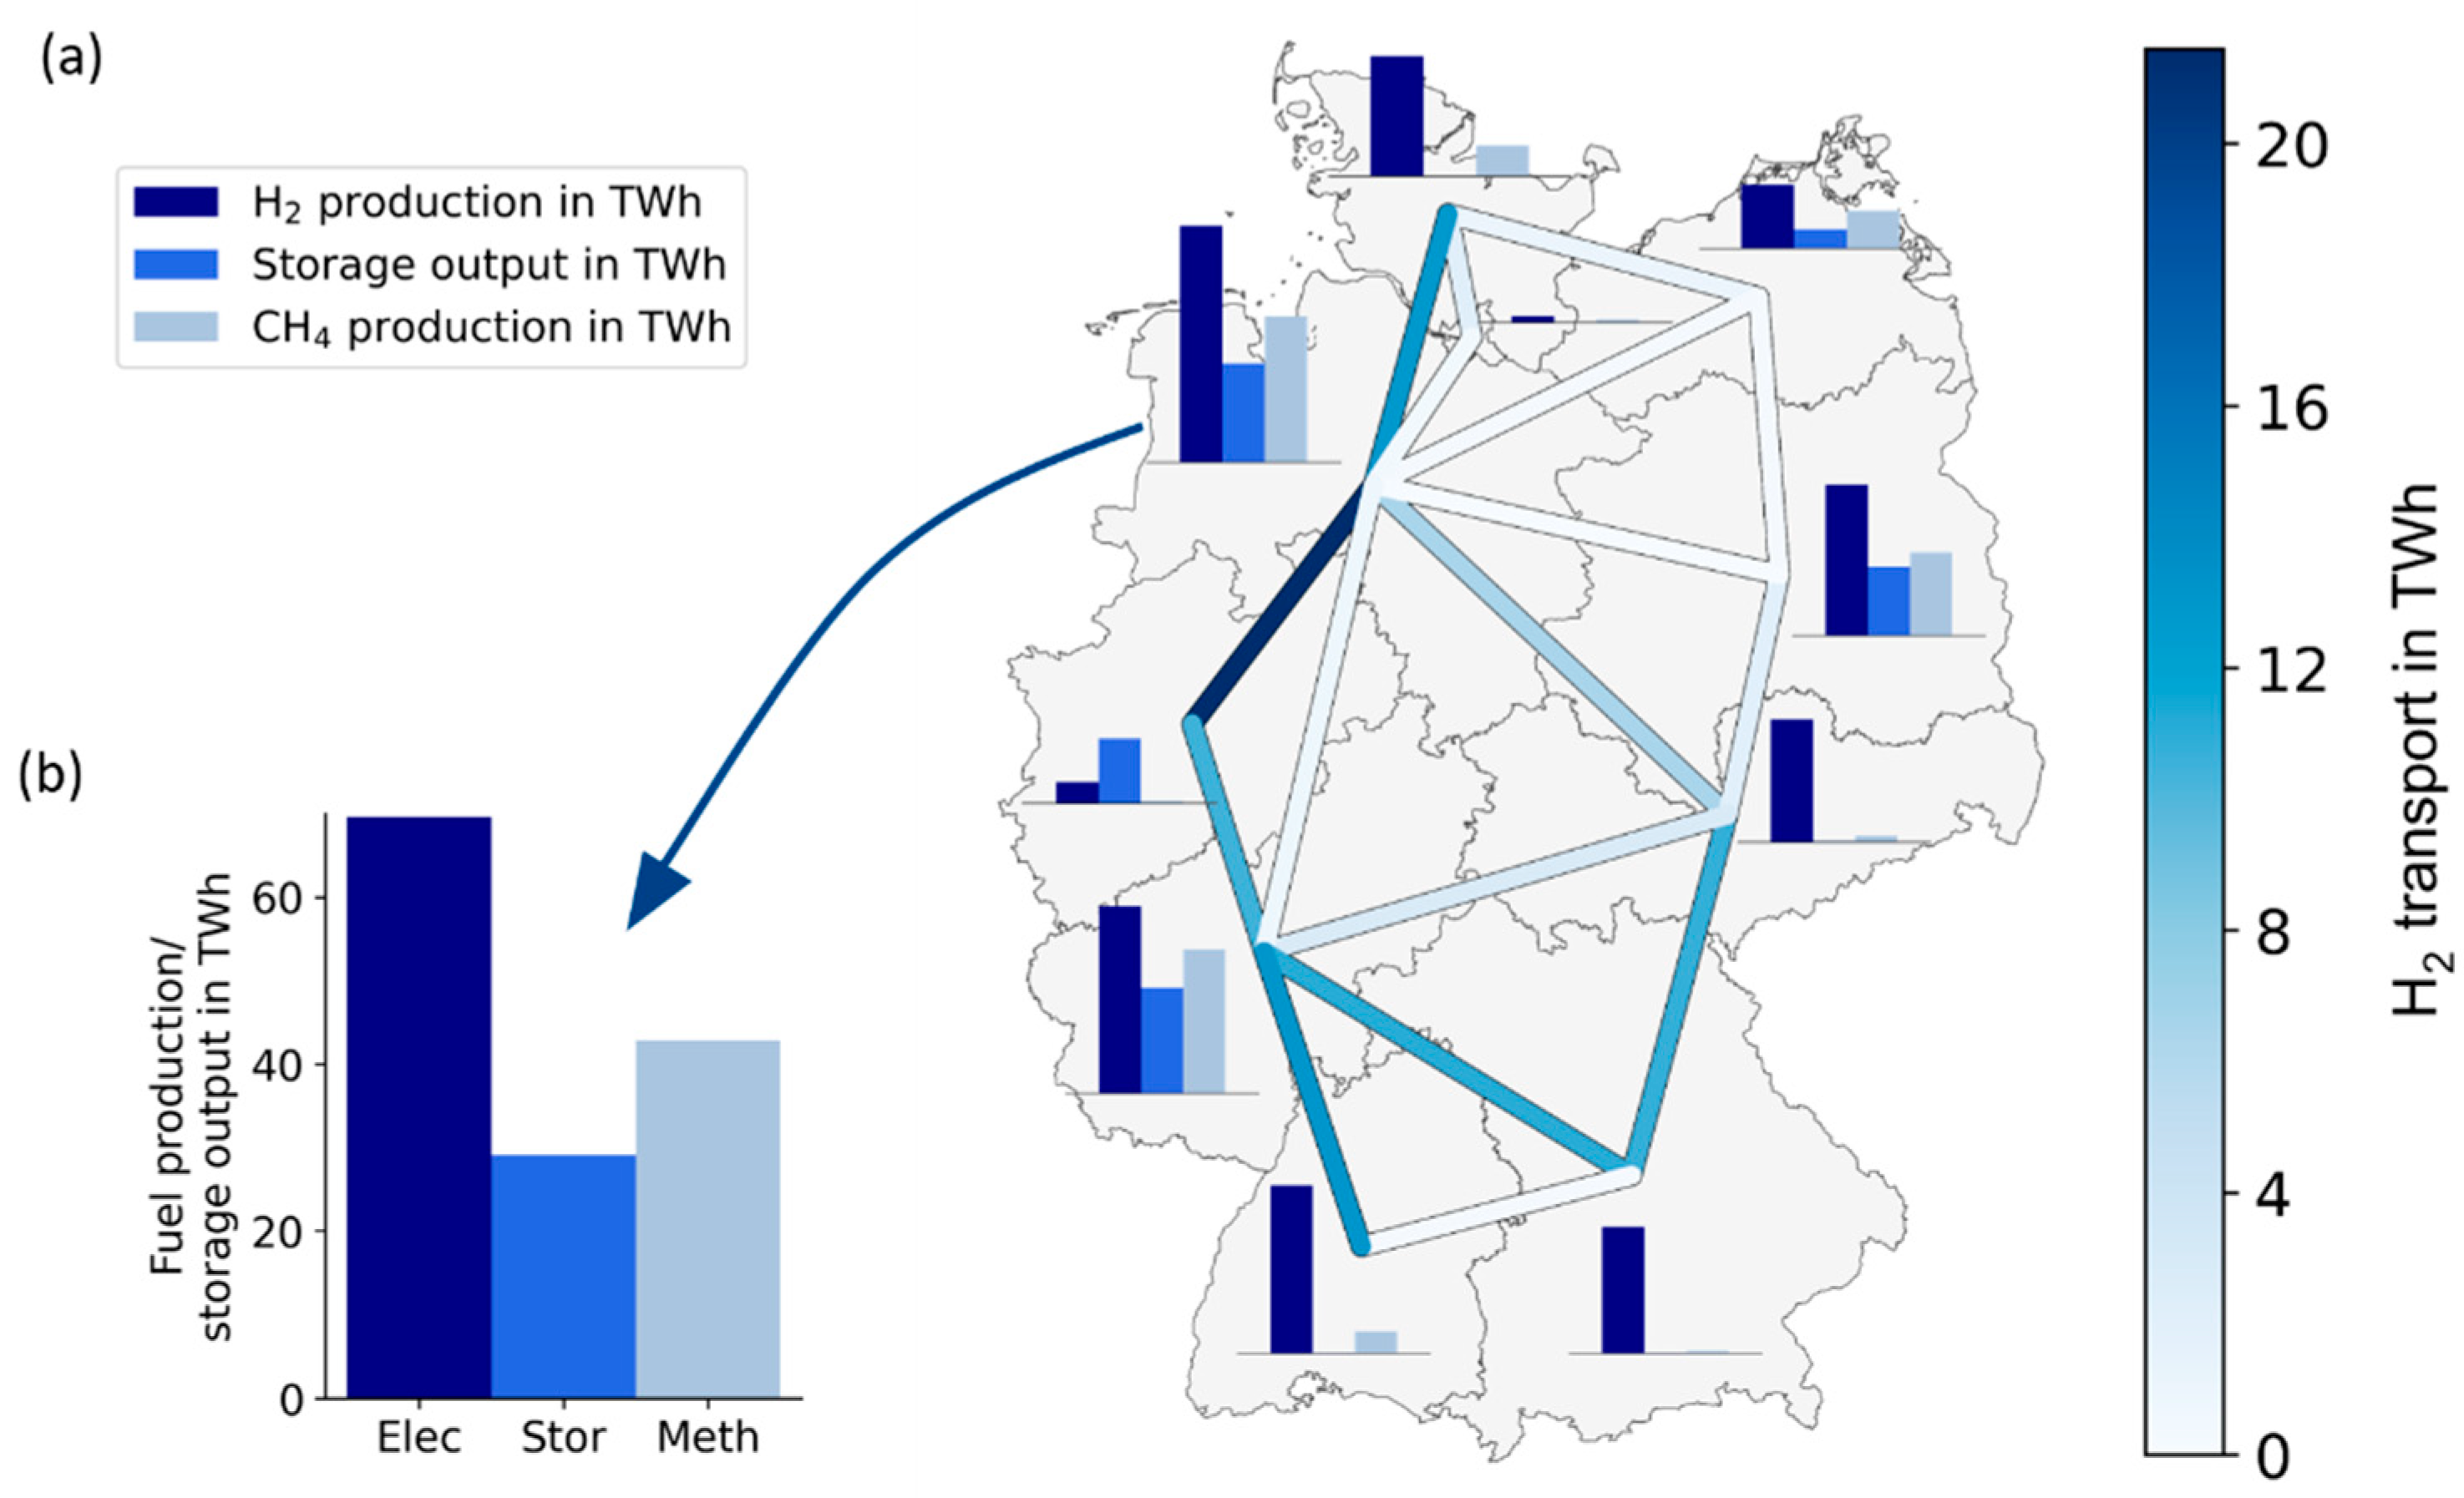
3.1.3. Deployment and Operation of Gas Infrastructures in Germany

REMix features an aggregated, but explicit, consideration of the infrastructures in the gas system. This allows for an analysis of the capacities and operation of this equipment and its development along the transformation process. In the course of implementing sector coupling, the expansion of hydrogen infrastructures plays a central role. Thus, with the increase in demand, there is a continuous growth in the capacities of gas generation plants, storage facilities, transport pipelines, and compressors (Figure 8). Compression for gas transport and storage is assumed to be electricity-based only for hydrogen, but both gas- and electricity-based for natural gas and synthetic methane. Based on the compressor capacities available today, REMix can invest endogenously in both technologies. The results show that, in the case of gas storage, the only investment is in electric compressors, and these also do all the compression work. It follows that storage injection of hydrogen and natural gas/methane occurs especially at times of high VRE generation. In the gas grid, on the other hand, a mixture of both technologies is used, mainly using the compressor capacities already available today. However, the share of compression work provided by gas-based compressors decreases from 55% in 2020 to 15% in 2050.
In its final state in 2050, the hydrogen transport infrastructure, added endogenously by REMix, connects the west of the country with the northwest and the south. Due to the underground caverns only available there (Figure 4), hydrogen storage facilities will be built especially in the north of the country. For the methanation plants, installation close to the storage facilities is preferred. Instead, the electrolysers are distributed evenly across the country. This is reflected in the quantities of hydrogen produced, stored, and transported (Figure 9).
To evaluate the use of flexibility in the gas system, for integrating VRE generation, analysis of hourly plant dispatch is helpful. The hourly dispatch shows that the compressors respond to the VRE availability and thus, contribute to load balancing (Figure 10). This mainly concerns phases of very low VRE generation in winter, as can be seen, e.g., in the area of hour 770. There, it can also be seen that the demand for compression energy in the gas grid is mainly driven by the operation of the methanation plants. These operate at different times than the electrolysers, at least in winter, and are driven by methane demand, which is particularly high during periods of low VRE power generation. Compression for gas storage correlates, primarily, with the times of electrolysis operation, which generally coincides with high VRE generation (Figure 11).
The annual electricity demand for compression in gas transport is about 1 TWh regardless of the scenario year, with the share of the hydrogen network exceeding that of the natural gas network only in 2050. While the electricity demand of compression in gas storage facilities is significantly lower than that of transmission pipelines in the early years of the scenario, it exceeds it in 2050 due to the strong increase in the use of hydrogen storage facilities, whose annual electricity demand in 2050 rises to 3.5 TWh. Due to these orders of magnitude, even the flexible compression of gas does not make a significant contribution to VRE integration, as the comparison of Figure 10 and Figure 11 shows. At least in the case of compressors in gas storage, there is a clear correlation of operation with VRE generation, which is mainly caused by the simultaneous electrolysis operation.
The model results show that gas preheating is increasingly electrified in the course of the scenario years (see Figure 12). The share of gas boilers in demand coverage decreases from the assumed 100% in 2020 to 50% in 2030 and about 20% in subsequent years. CHP plants are added endogenously in 2030, and then supply a quarter of the required heat; however, thereafter, their supply share drops to 14% and 9%, respectively. In turn, the share of heat generated by electric boilers increases from about a quarter in 2030 to above 70% in 2050. To make the CHP plants and electric boilers more flexible, heat storage facilities are added in 2030 that can absorb about 3 h of the aggregated thermal generation capacity. However, as this is only about 100 MW in total, and it drops to less than 30 MW by 2050, these plants do not contribute substantially to the integration of VRE generation in Germany. This is also reflected in the magnitude of the heat generated, which decreases from 265 GWh to 150 GWh over the course of the scenario years.

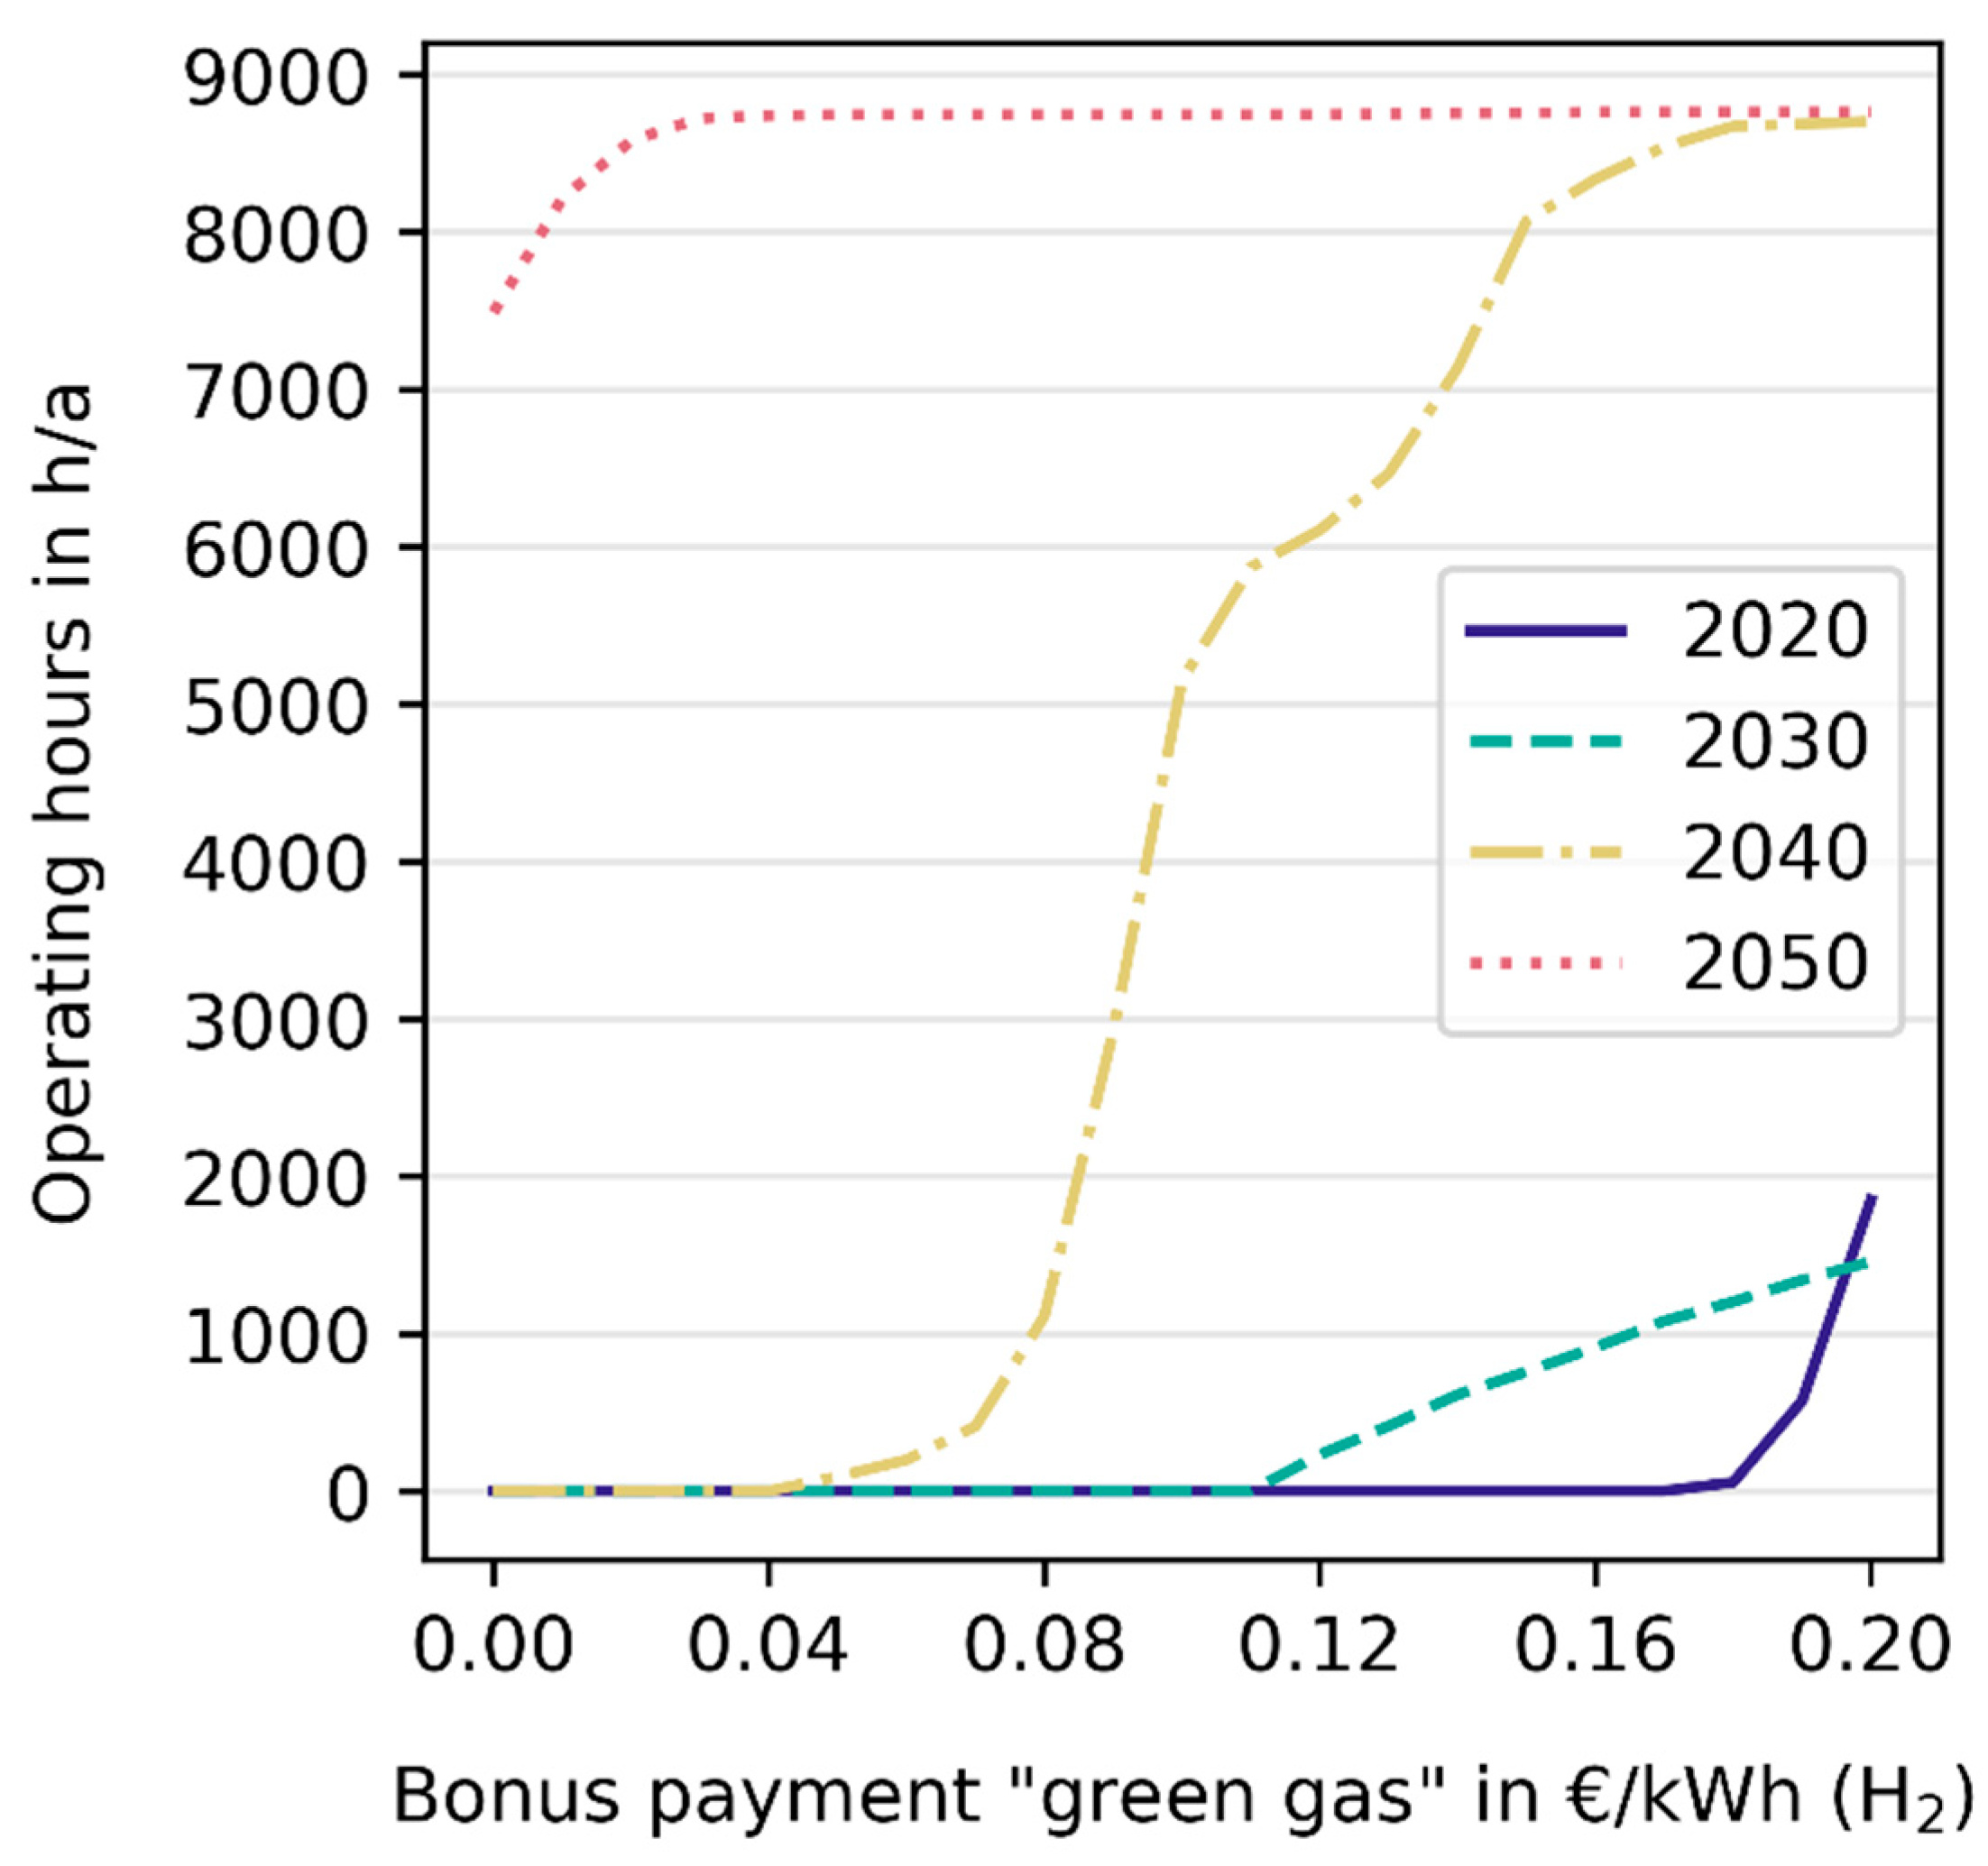
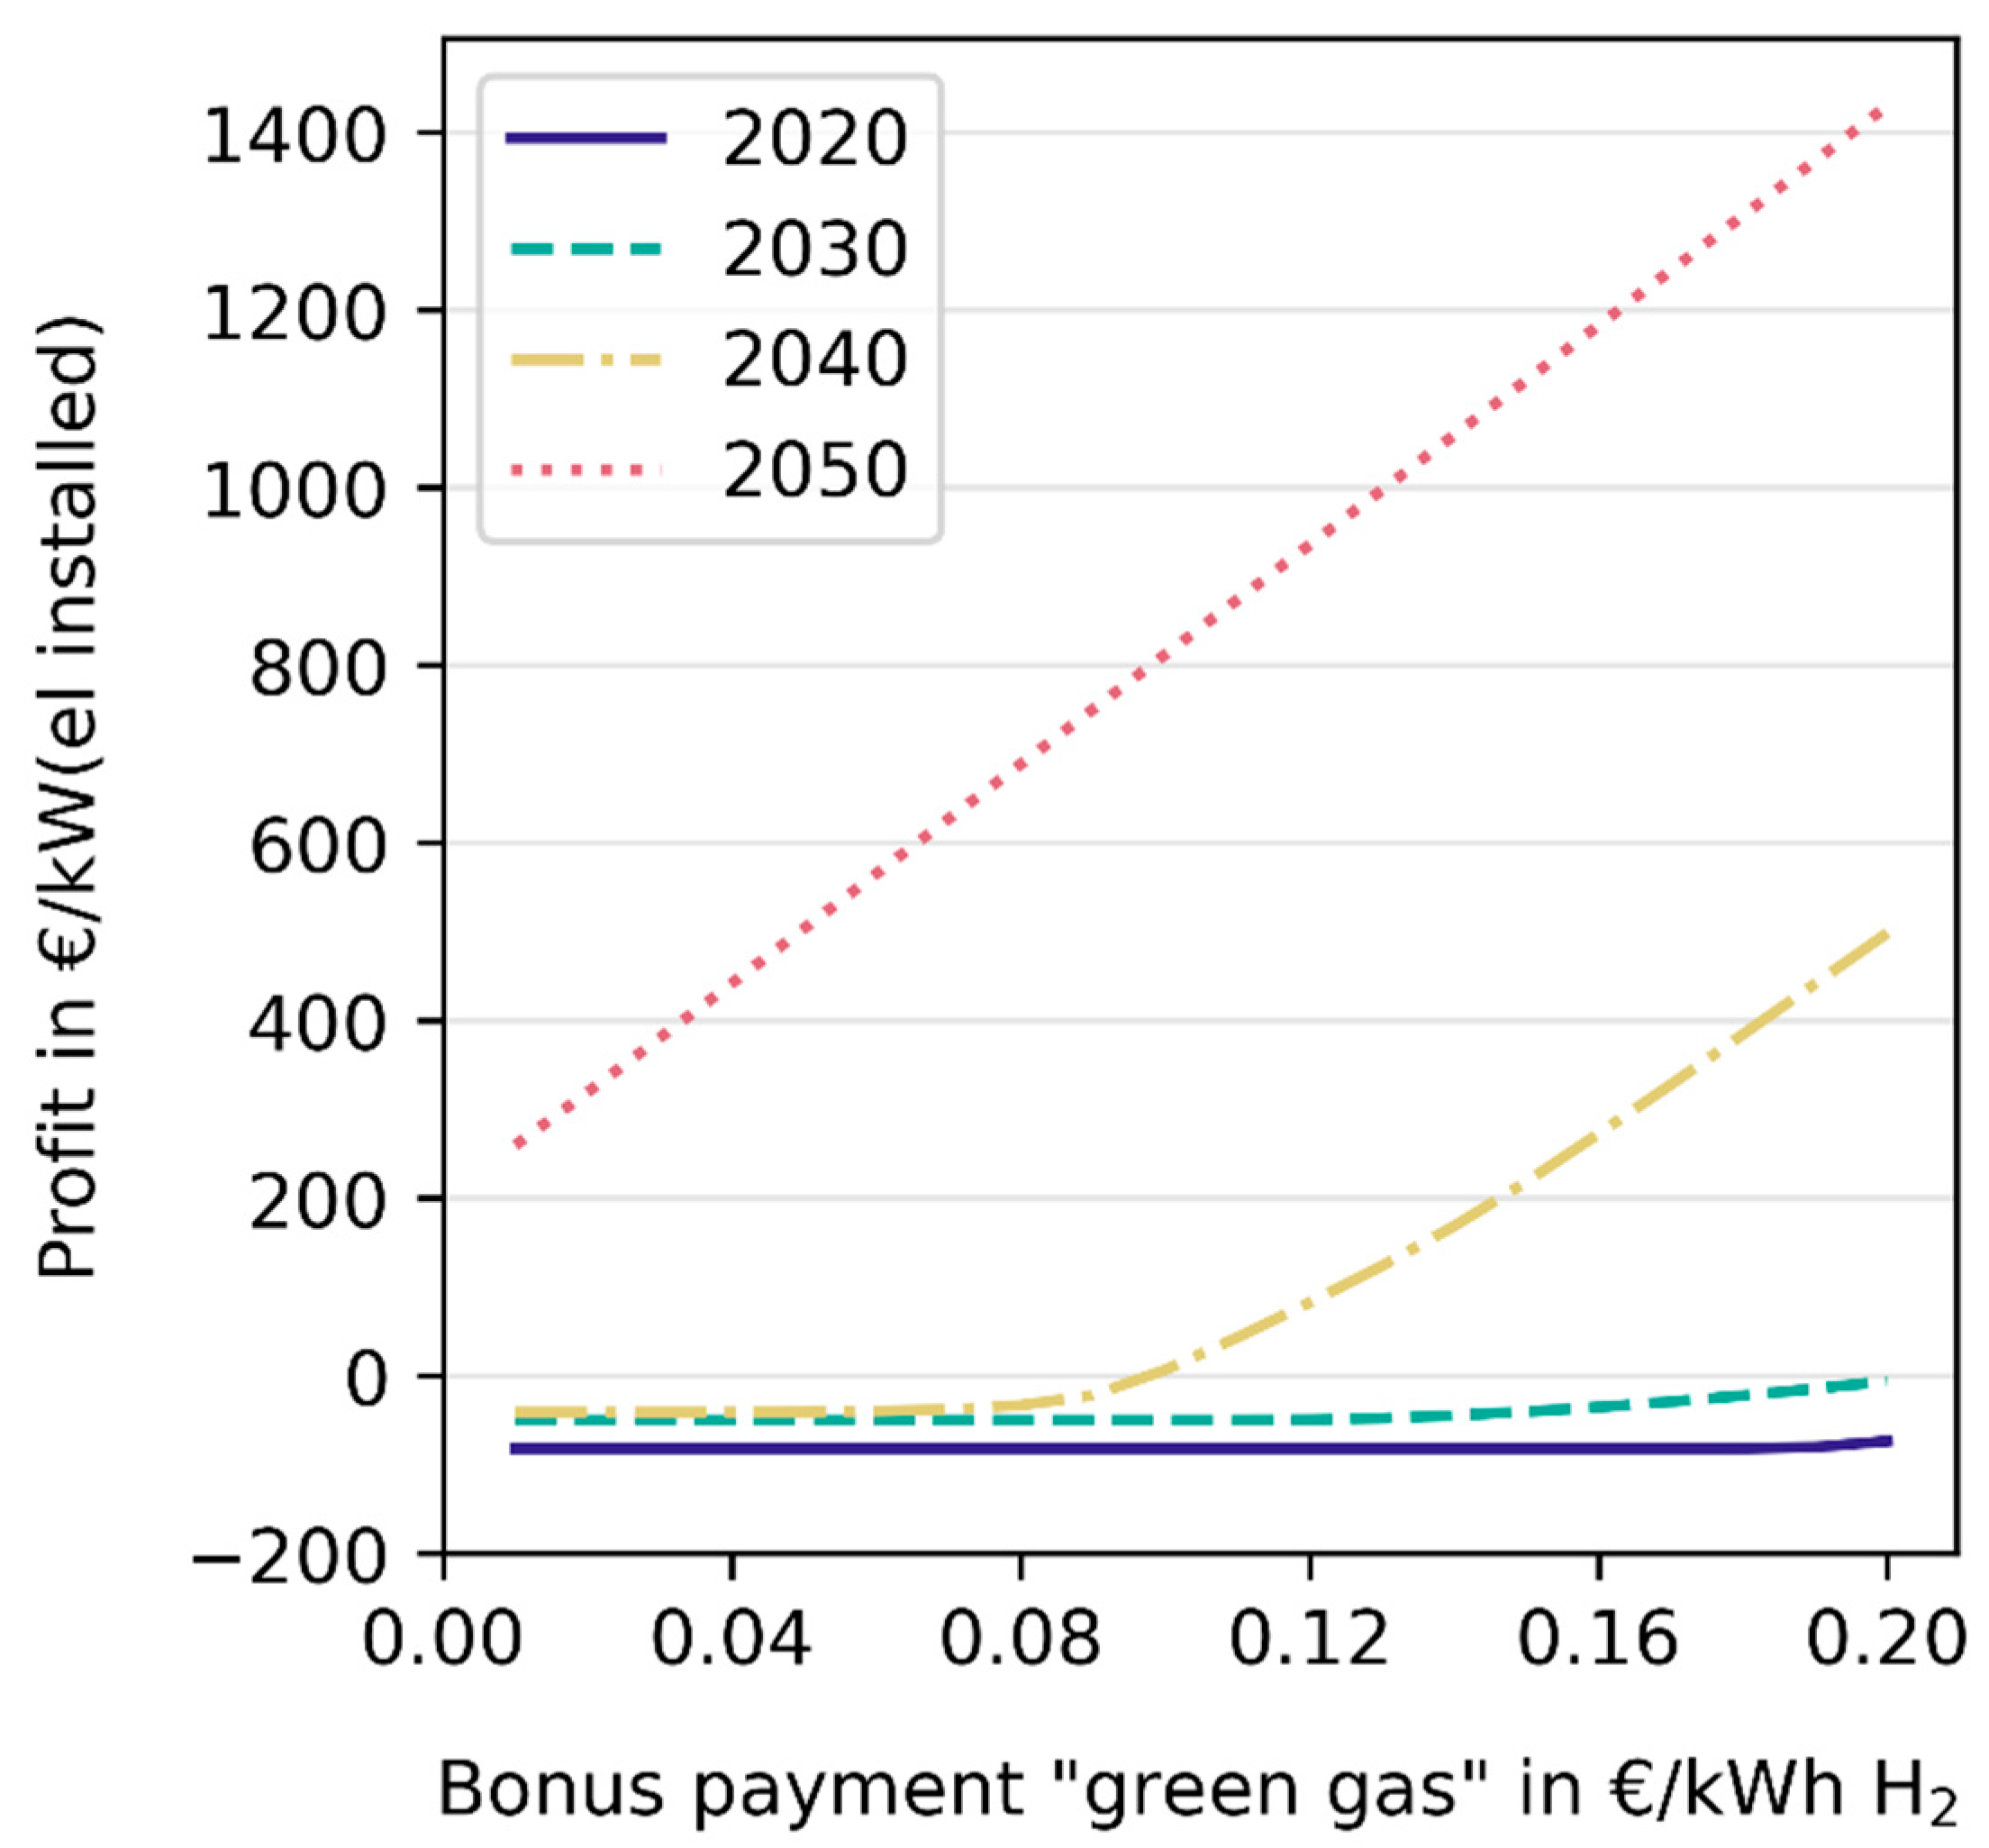
3.2. Business Perspective of Power-to-Gas-Plants

Based on model calculations with MuGriFlex, the economic efficiency of water electrolysis is examined. Figure 13 shows the yearly utilisation of power-to-gas plants (in full load hours) resulting from REMix. Since these vary greatly from region to region, they are shown as a range. Regions with the lowest full load hours are usually interior regions, and those with the highest utilization usually coastal regions. An additional marker shows the average (weighted by produced methane per year) of all power-to-gas plants in all regions:
The application of MuGriFlex aims at showing how the plants would be utilised if only the operating costs are taken into account. The number of feasible operation hours are hours in which gas can be produced at the same, or lower, costs than the reference gas price, based on the input cost of electricity, including projected surcharges.
The result is that the operation is economically feasible without bonus payments only in the scenario year 2050 (but then, for as many as 7500 h/a). In all other scenario years, synthetic gas cannot be produced economically in any hour of the year, even without considering the investment and fixed operating costs (Figure 14; intersection of the coloured lines with the Y-axis). This implies that a plant operator who receives full funding for the electrolyser would still incur a loss every hour in which the system operates.
Therefore, the second step is to analyse what incentive is necessary to allow plants to operate in more hours per year under the assumed framework conditions. The assumed incentive is in the form of a “premium for green gas” in addition to the revenue from the competitive gas price.
The feasible operating hours with this additional support are shown in Figure 14, for the four scenario years and with the premium increasing from zero to up to 0.2 €/kWh H2; still without taking into account investment and fixed operating costs.
The results show that in the year 2050, a premium of just 0.02 €/kWh H2 would lead to an increase in operating hours to more than 8500 h/a, which would correspond to a utilization factor of 97%. In all other years, considerable additional revenues, e.g., in the form of the above-mentioned premium on the gas produced, are necessary to reach noteworthy operating hours. Note, however, that similar effects to a premium payment on the output are achieved by correspondingly subsidizing the input. Thus, a reduction in electricity cost and, particularly, the respective surcharges represent an alternative option to the premium payment, analysed here, for improving the feasibility of electrolysis.
Finally, adding to the insights on feasibility of operation, it was determined whether, with these assumptions, investments would also be profitable from a business perspective. This is expressed by the profit that can be expected yearly on plant capacity (the basis is the electrical input capacity of the electrolyser). With the plant operation and electricity cost outlined above, fixed operating costs and annuity of the plant investment are deducted from the revenues of the gas trade.
The result of this evaluation is shown in Figure 15. It depicts the profit to be achieved with the plants, depending on the additional premium paid. If this value is negative, the plants may be running because they would generate a profit in some hours of the year, but the sum of the annual profit does not exceed the annual fixed operating costs and the annuity of the plant investments to be recovered.
Here, too, the year 2050 is the exception, in which an annual profit of around 200 €/kW of plant capacity can be generated even without an additional premium. However, this scenario year is also the only year in which complete defossilisation of fuels was required in REMix, which, in turn, leads to high gas prices that are advantageous from the business perspective taken here.
In 2040, premiums between about 0.08–0.12 €/kWh H2 are necessary to make a profit. As there is a significant demand for hydrogen in these years, according to the REMix results (up to about 9% energetic share in the gas mix), it can be concluded that considerable support will be necessary to operate this technology during this period of time.
In 2020 and 2030, even premiums of 0.20 €/kWh H2 would not be sufficient to ensure an economic operation of the electrolysers.

4. Discussion

The modelling is based on an exemplary long-term scenario of the development of the energy system until the year 2050, according to the goals of long-term climate neutrality. The resulting energy demands and calculated supply structures are conditioned by this narrative. Here, both of the other possible societal, political, and economic context scenarios, as well as different implementation paths of alternative technical options are not explicitly considered. In this respect, the results are exemplary and have only limited robustness with regard to their conclusions on options for action and the further design of the energy transition. In addition, it must be taken into account that the development path of the German and European energy system assumed here is not in line with the 1.5 °C temperature target formulated in Paris, but it only corresponds to the 95% reduction in GHG emissions by 2050 (relative to 1990) formulated by the German Federal Government in 2010 [25].
The combined techno-economic and business perspective energy system analysis presented here clearly has some shortcomings, which are briefly summarised in the following. The regional detail was restricted to ten model regions representing German federal states, some of which combined to reduce modelling effort. Results can, therefore, not be differentiated for each federal state and the European perspective is missing. As a consequence, the gas transport system for natural gas and hydrogen was only modelled among the ten German model regions with neighbouring countries treated in term of fixed boundary conditions. Gas transits across Europe, and the resulting international dependencies, were not part of the study. From this follows that the statements on the operation of the methane or natural gas grid in the earlier scenario years cannot be compared with today’s reality. Storage facilities and transport pipelines are used to a much lesser extent than is the case today. This is due to the restriction to Germany in the simplified representation of the gas system chosen here, which does not take transit flows into account, and to the neglect of aspects of gas trading and reserve stockpiling. These ensure that natural gas is imported according to demand without intermediate storage, which, in turn, is favoured by the model-related neglect of transport times for gases. Our results are additionally affected by not explicitly modelling CO2 costs and availability, which have an influence on siting and operation of methanation plants.
The system modelling with REMix comprises a broad range of technologies across all sectors. This allows for an improved understanding of interactions between different balancing technologies. However, for the countries outside Germany, a reduced technology scope is considered, which may have an impact on the observed cross-border power flows and the required balancing technologies. Compared to previous works [39,40], the REMix results show a different allocation of electrolysers, which is caused by a different technology scope, deviation assumptions regarding VRE potentials, and the neglect of hydrogen imports. This also drives differences in the corresponding storage and pipeline infrastructure. Still, the exploitation of hydrogen cavern storage in northern and central Germany, as well as the installation of a pipeline infrastructure from northern to western and southern Germany, is a robust result across this and previous analyses. The sensitivity of the infrastructure design to changes, in decisive input parameters or our scenario, have been assessed in [19].
Despite the broad range of technologies, the characteristics of the future gas system are not fully captured in our modelling. For example, energy import options for liquefied natural gas, as well as liquefied biogas and liquefied hydrogen, or any type of liquid organic hydrogen carrier (LOHC) on the world market have not been considered. Concerning hydrogen production, for the reason of limited modelling capacity, alternative technologies of alkaline electrolysis, and solid oxide electrolysers were not modelled, and pyrolysis was excluded as well, due to low technology readiness level. Additionally, the storage aspect was covered by cavern storages (salt dome), while potential future hydrogen storage options in porous rock formations were excluded due to their low technology readiness level as of today. Future assessments should comprise these technologies to evaluate further relevant dimensions of an emerging coupled energy system based on renewable electricity and renewable gases.
The aggregated modelling approach in REMix completely neglects the energy distribution within the model regions. This may cause an overestimation of the spatial balancing linked to an underestimation of temporal balancing, e.g., via stationary battery storage.
By integrating the REMix results into MuGriFlex, the business case for the determined least-cost infrastructures can be evaluated. The unprofitability of Power-to-Gas, under current market conditions, with a need for lower cost and higher revenues was similarly found by van Leeuwen and Mulder [41] and with a focus on flexibility provision by Li and Mulder [13]. Still, the combination of the two modelling approaches confirms the need for adjustments to the regulatory framework required to create a favourable investment environment for Power-to-Gas plants.

5. Conclusions

Our modelling results describe the path to the economic integration of power-to-gas plants into the German energy system of the future. This is based on an enhancement and coupling of the REMix and MuGriFlex models, the conception of a framework scenario of the energy system transformation in Germany and its neighbouring countries, and the research and integration of extensive data sets on gas system technologies. The results underline the significant role of flexible hydrogen and methane production for the integration of VRE power generation. In particular, flexible electrolysis, together with other sector coupling technologies, contributes to the result that, even in the case of zero-emission electricity generation, hardly any VRE curtailment is needed.
Our results show that, especially the operation of electrolysers, but also that of electric compressors in transmission networks and storage facilities, is concentrated in periods of high VRE availability. Complementarily, our analyses show that in the course of the system transformation by 2050, electrification of the equipment in the gas system occurs not only in the compressors but also in the gas preheating. A flexible operation is here realised by the installation of hybrid heat supply options and thermal energy storage. However, the amounts of electricity used for gas preheating are negligible compared to the overall system.
While the installation and use of electrolysers in the overall system optimization proves to be economically viable as early as 2030, the business analysis shows a different picture. Our results show that investments in power–to-gas plants are not economically feasible in the scenario considered using todays and the projected market conditions. Due to the high level of surcharges to be paid on the electricity needed, an operator would not run the plants at any hour of the year except in the scenario year 2050, even when investment and fixed operating costs are not taken into account. Additional bonus payments between 0.08 and 0.20 €/kWh of produced hydrogen are necessary to incentivise more than 2000 h of operation per year. To generate an overall profit, i.e., to receive an overall income higher than the total costs (including fixed operating costs and capital), bonus payments of more than 0.09 €/kWh (2040) or more than 0.20 €/kWh of hydrogen (2030) would be required. However, these incentives would require very small-scale calibration and a significant financial outlay, given the large role those synthetic gases would play from an overall system perspective. Under the framework conditions assumed, the electrolysers required from an overall system point of view could, at best, be realised in spatial proximity to, e.g., large wind farms and with consequently reduced surcharges on the electricity price.
In order to enable the rapid expansion of hydrogen infrastructures, which is both needed for the transformation of the energy system and to be economically attractive, ways must be found to close this financing gap.

Author Contributions

Conceptualization, H.C.G., M.F. (Max Fette) and J.S.; methodology, H.C.G., M.F. (Max Fette), H.G., C.B., J.S. and T.P.; software, H.C.G., H.G. and M.F. (Max Fette); validation, H.C.G., M.F. (Max Fette), C.B., H.G. and J.S.; formal analysis, H.C.G., M.F. (Max Fette), H.G. and J.S.; investigation, J.S., H.C.G., M.F. (Max Fette), H.G., C.B., T.P., N.B., E.T. and M.F. (Marc Fiebrandt); resources, J.S., H.C.G., M.F. (Max Fette), R.A. and F.B.; data curation, H.G., H.C.G., M.F. (Max Fette), J.S., E.T., N.B., M.F. (Marc Fiebrandt) and T.P.; writing—original draft preparation, J.S., H.C.G., M.F. (Max Fette), T.P., H.G. and C.B.; writing—review and editing, J.S., H.C.G., M.F. (Max Fette), H.G., C.B. and T.P.; visualization, H.G.; supervision, H.C.G., M.F. (Max Fette), F.B. and R.A.; project administration, M.F. (Max Fette), H.C.G. and J.S.; funding acquisition, M.F. (Max Fette), C.B., H.C.G., T.P. and J.S. All authors have read and agreed to the published version of the manuscript.

Funding

This research was funded by the German Federal Ministry for Economic Affairs and Energy, grant numbers 03ET4038 (Project ‘MuSeKo’) and 03EI1030 (Project ‘Fahrplan Gaswende’).

Data Availability Statement

Input data for the REMix model of this research project are publicly available at https://zenodo.org/record/5705414#.YZTaTmDMKUk (accessed on 16 November 2021).

Acknowledgments

The authors want to thank the following colleagues and students for their help during the project: Leander Kimmer, Christopher Rickert and Isabelle Roller; Felix Cebulla and Eileen Meyer, Klaus Peters, Philipp Fischer, Manfred Lange, Markus Köppke, Norman Dünne, Sophia von Berg, Enado Pineti, Aml Mahmoud, Alexandra Botor. All external feedback received during the workshops and expert interviews of the MuSeKo project is highly appreciated.

Conflicts of Interest

The authors declare no conflict of interest. The funders had no role in the design of the study; in the collection, analyses, or interpretation of data; in the writing of the manuscript, or in the decision to publish the results.

References

  1. Heide, D.; Von Bremen, L.; Greiner, M.; Hoffmann, C.; Speckmann, M.; Bofinger, S. Heide Seasonal Optimal Mix of Wind and Solar Power in a Future, Highly Renewable Europe. Renew. Energy 2010, 35, 2483–2489. [Google Scholar] [CrossRef]
  2. Heide, D.; Greiner, M.; von Bremen, L.; Hoffmann, C. Reduced Storage and Balancing Needs in a Fully Renewable European Power System with Excess Wind and Solar Power Generation. Renew. Energy 2011, 36, 2515–2523. [Google Scholar] [CrossRef] [Green Version]
  3. Gils, H.C.; Simon, S. Carbon Neutral Archipelago-100% Renewable Energy Supply for the Canary Islands. Appl. Energy 2017, 188, 342–355. [Google Scholar] [CrossRef] [Green Version]
  4. Brown, T.; Schlachtberger, D.; Kies, A.; Schramm, S.; Greiner, M. Synergies of Sector Coupling and Transmission Reinforcement in a Cost-Optimised, Highly Renewable European Energy System. Energy 2018, 160, 720–739. [Google Scholar] [CrossRef] [Green Version]
  5. Hauser, P.; Heinrichs, H.U.; Gillessen, B.; Müller, T. Implications of Diversification Strategies in the European Natural Gas Market for the German Energy System. Energy 2018, 151, 442–454. [Google Scholar] [CrossRef]
  6. Kabirian, A.; Hemmati, M.R. A Strategic Planning Model for Natural Gas Transmission Networks. Energy Policy 2007, 35, 5656–5670. [Google Scholar] [CrossRef]
  7. Wulf, C.; Linßen, J.; Zapp, P. Review of Power-to-Gas Projects in Europe. Energy Procedia 2018, 155, 367–378. [Google Scholar] [CrossRef]
  8. Farrokhifar, M.; Nie, Y.; Pozo, D. Energy Systems Planning: A Survey on Models for Integrated Power and Natural Gas Networks Coordination. Appl. Energy 2020, 262, 114567. [Google Scholar] [CrossRef]
  9. Breyer, C.; Tsupari, E.; Tikka, V.; Vainikka, P. Power-to-Gas as an Emerging Profitable Business Through Creating an Integrated Value Chain. Energy Procedia 2015, 73, 182–189. [Google Scholar] [CrossRef] [Green Version]
  10. Caglayan, D.; Heinrichs, H.U.; Robinius, M.; Stolten, D. Robust Design of a Future 100% Renewable European Energy Supply System with Hydrogen Infrastructure. Int. J. Hydrog. Energy 2021, 46, 29376–29390. [Google Scholar] [CrossRef]
  11. Torralba-Díaz, L.; Schimeczek, C.; Reeg, M.; Savvidis, G.; Deissenroth-Uhrig, M.; Guthoff, F.; Fleischer, B.; Hufendiek, K. Identification of the Efficiency Gap by Coupling a Fundamental Electricity Market Model and an Agent-Based Simulation Model. Energies 2020, 13, 3920. [Google Scholar] [CrossRef]
  12. van Leeuwen, C.; Mulder, M. Power-to-Gas in Electricity Markets Dominated by Renewables. Appl. Energy 2018, 232, 258–272. [Google Scholar] [CrossRef]
  13. Li, X.; Mulder, M. Value of Power-to-Gas as a Flexibility Option in Integrated Electricity and Hydrogen Markets. Appl. Energy 2021, 304, 117863. [Google Scholar] [CrossRef]
  14. Gils, H.C.; Gardian, H.; Pregger, T.; Schaffert, J.; Tali, E.; Fette, M.; Brandstätt, C. REMix Model Input Data for the THG95/GHG95 Scenario Analysed within the MuSeKo Project. Available online: https://zenodo.org/record/5705414 (accessed on 16 November 2021).
  15. Gils, H.C.; Scholz, Y.; Pregger, T.; de Tena, D.L.; Heide, D. Integrated Modelling of Variable Renewable Energy-Based Power Supply in Europe. Energy 2017, 123, 173–188. [Google Scholar] [CrossRef] [Green Version]
  16. Luca de Tena, D.; Pregger, T. Impact of Electric Vehicles on a Future Renewable Energy-Based Power System in Europe with a Focus on Germany. Int. J. Energy Res. 2018, 42, 2670–2685. [Google Scholar] [CrossRef]
  17. Gils, H.C. Balancing of Intermittent Renewable Power Generation by Demand Response and Thermal Energy Storage. Ph.D. Thesis, Uniersität Stuttgart, Stuttgart, Germany, 2015. [Google Scholar]
  18. Michalski, J.; Bünger, U.; Crotogino, F.; Donadei, S.; Schneider, G.-S.; Pregger, T.; Cao, K.-K.; Heide, D. Hydrogen Generation by Electrolysis and Storage in Salt Caverns: Potentials, Economics and Systems Aspects with Regard to the German Energy Transition. Int. J. Hydrog. Energy 2017, 42, 13427–13443. [Google Scholar] [CrossRef]
  19. Gils, H.C.; Gardian, H.; Schmugge, J. Interaction of Hydrogen Infrastructures with Other Sector Coupling Options towards a Zero-Emission Energy System in Germany. Renew. Energy 2021, 180, 140–156. [Google Scholar] [CrossRef]
  20. Brandstätt, C.; Fette, M. Feasibility of Balancing Renewable Electricity through Heat and Gas Based “Storage Chains”. In Proceedings of the International Renewable Energy Storage Conference (IRES), Düsseldorf, Germany, 9–11 March 2015. [Google Scholar]
  21. Brandstätt, C.; Fette, M.; Meyer, S. Multi-Grid-Storage Flexibilität für die Stromversorgung aus Gas- und Wärmenetzen. Final Report. 2015. Available online: https://www.ifam.fraunhofer.de/de/Institutsprofil/Standorte/Bremen/Formgebung_Funktionswerkstoffe/Energiesystemanalyse/Projektdetails/MuGriSto.html (accessed on 5 July 2021).
  22. Brandstätt, C.; Fette, M.; Gils, H.C.; Gardian, H.; Pregger, T.; Schaffert, J.; Brücken, N.; Tali, E. Final Report: Multi-Sektor-Kopplung (MuSeKo)—Modellbasierte Analyse der Integration Erneuerbarer Stromerzeugung Durch Die Kopplung der Stromversorgung Mit Dem Wärme, Gas- und Verkehrssektor; BMWi; Grant Agreement No, 03ET4038; Fraunhofer-Institut für Fertigungstechnik und Angewandte Materialforschung (IFAM): Bremen, Germany; Deutsches Zentrum für Luft- und Raumfahrt (DLR): Stuttgart, Germany; Gas- und Wärme-Institut Essen e.V. (GWI): Essen, Germany, 2020. [Google Scholar] [CrossRef]
  23. Pfluger, B.; Tersteegen, B.; Franke, B.; Bernath, C.; Boßmann, T.; Deac, G.; Elsland, R.; Fleiter, T.; Kühn, A.; Ragwitz, M.; et al. Langfristszenarien Fur Die Transformation Des Energiesystems in Deutschland—Modul 1: Hintergrund, Szenarioarchitektur Und Übergeordnete Rahmenparameter; Fraunhofer ISI, Consentec GmbH, ifeu, Bundesministerium für Wirtschaft und Energie: Berlin, Germany, 2017; p. 45. [Google Scholar]
  24. Project E-Highway2050—Modular Development Plan of the Pan-European Transmission System 2050. Available online: https://docs.entsoe.eu/baltic-conf/bites/www.e-highway2050.eu/results/ (accessed on 17 December 2021).
  25. Bundesministerium für Wirtschaft und Technologie (BMWi). Bundesministerium für Umwelt, Naturschutz und Reaktorsicherheit Energiekonzept Für Eine Umweltschonende, Zuverlässige Und Bezahlbare Energieversorgung; BMWi: Berlin, Germany, 2010; p. 34.
  26. International Energy Agency (IEA); European Network of Transmission System Operators for Gas (ENTSO-G). Netherlands Ministry of Economic Affairs and Climate Policy L-Gas Market Conversion Review—Winter Report 2021 Task Force Monitoring L-Gas Market Conversion 2021. Available online: https://groenevinger.files.wordpress.com/2021/02/bijlage-2-winter-report.pdf (accessed on 17 December 2021).
  27. FNB Gas—Die Fernleitungsnetzbetreiber. German Gas Network Development Plan (Netzentwicklungsplan Gas) 2016–2026; FNB Gas: Berlin, Germany, 2017; Available online: https://www.bundesnetzagentur.de/DE/Sachgebiete/ElektrizitaetundGas/Unternehmen_Institutionen/NetzentwicklungSmartGrid/Gas/fruehereNEP/NEP_Gas2016/NEP_Gas2016_node.html (accessed on 31 January 2022).
  28. European Network of Transmission System Operators for Gas (entsog): The European Natural Gas Network 2017. Available online: https://www.entsog.eu/sites/default/files/2018-09/ENTSOG_CAP_2017_A0_1189x841_FULL_064.pdf (accessed on 3 January 2019).
  29. Caglayan, D.; Weber, N.; Heinrichs, H.; Linssen, J.; Robinius, M.; Kukla, P.; Stolten, D. Technical Potential of Salt Caverns for Hydrogen Storage in Europe. Int. J. Hydrog. Energy 2020, 45, 6793–6805. [Google Scholar] [CrossRef]
  30. Stolzenburg, K.; Hamelmann, R.; Wietschel, M.; Genoese, F.; Michaelis, J.; Lehmann, J.; Miege, A.; Krause, S.; Sponholz, C.; Donadei, S.; et al. Integration von Wind-Wasserstoff-Systemen in Das Energiesystem—Abschlussbericht (Final Report); PLANET: Essen, Germany; fh lübeck Projekt-GmbH: Lübeck, Germany; Fraunhofer ISI: Karlsruhe, Germany; IFEU: Heidelberg, Germany; KBB: Bannewitz, Germany, 2014. [Google Scholar]
  31. Zivar, D.; Kumar, S.; Foroozesh, J. Underground Hydrogen Storage: A Comprehensive Review. Int. J. Hydrog. Energy 2021, 46, 23436–23462. [Google Scholar] [CrossRef]
  32. Thema, M.; Bauer, F.; Sterner, M. Power-to-Gas: Electrolysis and Methanation Status Review. Renew. Sustain. Energy Rev. 2019, 112, 775–787. [Google Scholar] [CrossRef]
  33. Gorre, J.; Ruoss, F.; Karjunen, H.; Schaffert, J.; Tynjälä, T. Cost Benefits of Optimizing Hydrogen Storage and Methanation Capacities for Power-to-Gas Plants in Dynamic Operation. Appl. Energy 2020, 257, 113967. [Google Scholar] [CrossRef]
  34. Commission of the European Union, Joint Research Centre, Institute for Energy and Transport. The JRC-EU-TIMES Model: Bioenergy Potentials for EU and Neighbouring Countries; European Union: Luxembourg, 2015. [Google Scholar] [CrossRef]
  35. Scholz, Y. Renewable Energy Based Electricity Supply at Low Costs: Development of the REMix Model and Application for Europe. Ph.D. Thesis, University of Stuttgart, Stuttgart, Germany, 2012. [Google Scholar] [CrossRef]
  36. Monitoring Report 2020; Bundesnetzagentur für Elektrizität, Gas, Telekommunikation, Post und Eisenbahnen: Bonn, Germany; Bundeskartellamt: Bonn, Germany, 2021; p. 503.
  37. StromStG 1999: Stromsteuergesetz Vom 24. März 1999 (BGBl. I S. 378; 2000 I S. 147), Das Zuletzt Durch Artikel 207 Der Verordnung Vom 19. Juni 2020 (BGBl. I S. 1328) Geändert Worden Ist. 1999. Available online: http://www.gesetze-im-internet.de/stromstg/ (accessed on 1 February 2022).
  38. KWKG 2005: Kraft-Wärme-Kopplungsgesetz Vom 21. Dezember 2015 (BGBl. I S. 2498), Das Zuletzt Durch Artikel 7 Des Gesetzes Vom 8. August 2020 (BGBl. I S. 1818) Geändert Worden Ist. 2015. Available online: http://www.gesetze-im-internet.de/kwkg_2016/ (accessed on 1 February 2022).
  39. Husarek, D.; Schmugge, J.; Niessen, S. Hydrogen Supply Chain Scenarios for the Decarbonisation of a German Multi-Modal Energy System. Int. J. Hydrog. Energy 2021, 46, 38008–38025. [Google Scholar] [CrossRef]
  40. Cerniauskas, S.; Jose Chavez Junco, A.; Grube, T.; Robinius, M.; Stolten, D. Options of Natural Gas Pipeline Reassignment for Hydrogen: Cost Assessment for a Germany Case Study. Int. J. Hydrog. Energy 2020, 45, 12095–12107. [Google Scholar] [CrossRef] [Green Version]
  41. Van Leeuwen, R.P. Towards 100% Renewable Energy Supply for Urban Areas and the Role of Smart Control. Ph.D. Thesis, University of Twente, Enschede, The Netherlands, 2017. [Google Scholar]
Figure 1. Overview of the modelling procedure and indication of respective sections in the paper.
Energies 15 01174 g001
Figure 2. Overview of inputs, method, and outputs of the REMix energy system modelling framework.
Energies 15 01174 g002
Figure 3. Simplified representation of the gas transportation network in the ten investigated model regions and assumed interconnection capacities to the neighbouring countries and regions used as start values for the REMix model calculations.
Energies 15 01174 g003
Figure 4. Underground gas storage facilities in the ten model regions in Germany.
Energies 15 01174 g004
Figure 5. Development of power demand (upper diagram) and gas demand (lower diagram) along the transformation pathway until the year 2050.
Energies 15 01174 g005
Figure 6. Development of the power supply in Germany. The left figure shows the installed power generation capacities. The right figure shows the annual power generation and imports (left axis), as well as the CO2 emissions (right axis, triangle symbols). The technology “others” subsumes waste incineration, oil, and geothermal energy.
Energies 15 01174 g006
Figure 7. Development of the load balancing technology usage in Germany. The upper diagrams show the grid-bound technology use, while the lower graphs depict the need for local balancing options. The total annual numbers are embedded in the centre of each graph.
Energies 15 01174 g007
Figure 8. Development of the overall capacities of hydrogen and methane production, hydrogen storage, hydrogen pipeline (left axis), and compression (right axis) capacities in Germany. All these are endogenously optimised by REMix.
Energies 15 01174 g008
Figure 9. Production of hydrogen, hydrogen storage output, and methane production in the ten model regions in Germany (bar charts of figure (a)) and grid-bound hydrogen transport between the model regions (network plot and right hand colour scale). Exemplary bar chart of Lower Saxony’s gas production and storage usage (b).
Energies 15 01174 g009
Figure 10. Provision of compression energy in the gas network in February 2050.
Energies 15 01174 g010
Figure 11. Electric storage compression (left axis) and VRE power generation, as well as hydrogen production (right axis) in February 2050.
Energies 15 01174 g011
Figure 12. Heat production for gas preheating per year (left axis, bar charts) and capacities of gas preheating technologies (right axis, data points).
Energies 15 01174 g012
Figure 13. Yearly utilisation of electrolysers: the blue dots represent the weighted average value of all model regions (weighted by produced methane per year). The grey bars indicate the bandwidth of the individual model region values.
Energies 15 01174 g013
Figure 14. Economically feasible operating hours of electrolysers, depending on a premium paid on the output.
Energies 15 01174 g014
Figure 15. Annual profit per installed electrolysis capacity, depending on an additional premium paid in addition to gas.
Energies 15 01174 g015
Table 1. Assumed fuel costs in €/MWh in the scenario.
Fuel2020203020402050
Natural gas38.441.043.242.1
Hard coal15.116.217.320.5
Lignite4.14.14.14.1
Uranium3.23.23.23.2
Oil58.360.565.971.3
Biogas28.128.128.128.1
Solid biomass26.926.926.926.9
Table 2. Assumed emission certificate costs in €/t CO2 in the scenario.
Scenario2020203020402050
Emission cost in €/t CO23294154216
Table 3. Electricity demand scenario for Europe in TWh per year.
Country2020 Conv.2050 Conv.2050 BEV2050 H22050 HP2050 E-H
Germany42834414542370159
Austria7247121043
Belgium9167161595
Czech Republic6741101044
Denmark (East)1483310.6
Denmark (West)23135521
France4863809990366
Italy32528484771712
Luxembourg7410.50.30.2
Netherlands115931917117
Norway131848720.6
Poland16179342997
Sweden14691161565
Switzerland6449101042
Total21291582463709174212
Conv: Conventional electricity demand of consumers; BEV: Electricity for electro-mobility; H2: Electricity for hydrogen production; HP: Electricity for heat pumps; E-H: Electricity for electric heaters.
Publisher’s Note: MDPI stays neutral with regard to jurisdictional claims in published maps and institutional affiliations.

