Article

Laboratory Testing of Small Scale Solar Facade Module with Phase Change Material and Adjustable Insulation Layer

Institute of Energy Systems and Environment, Riga Technical University, LV-1048 Riga, Latvia
*
Author to whom correspondence should be addressed.
Energies 2022, 15(3), 1158; https://doi.org/10.3390/en15031158
Submission received: 11 November 2021 / Revised: 24 January 2022 / Accepted: 29 January 2022 / Published: 4 February 2022
(This article belongs to the Special Issue Energy Efficiency Improvement Measures in Buildings)

Abstract

:
Active building envelopes that act as energy converters—gathering on-site available renewable energy and converting it to thermal energy or electricity—is a promising technological design niche to reduce energy consumption in the building sector, cut greenhouse gas emissions, and thus tackle climate change challenges. This research adds scientific knowledge in the field of composite building envelope structures containing phase-change materials for thermal energy storage. In this study, the focus lies on the cooling phase of the diurnal gain and release of solar energy. The experimental setup imitates day and night environment. Six alterations of small-scale solar facade modules are tested in two different configurations—with and without the adjustable insulation layer on their outer surface during the discharging phase. Modules explore combinations of aerogel, air gap, and Fresnel lenses for solar energy concentration. The results allow us to compare the impact of the application of an additional insulation layer at “night” for different designs of solar facade modules. The results show that modules with an air gap provide higher heat gains but do not take full advantage of the latent heat capacity of phase-change materials.

1. Introduction

The EU goal to reach carbon neutrality in 2050 defined in the European Green Deal [1] calls to accelerate the transition to more efficient technologies, consumes less energy, and create less CO2 emissions. Since the building sector consumes 40% of the overall energy and creates 36% of the CO2 emissions in the EU [2], unhesitant measures are needed in this sector, and amendments in directive 2010/31/EU on the energy performance of buildings and Directive 2012/27/EU on energy efficiency [3] call for smarter buildings that can provide better overall energy performance.
To make the shift towards a greener economy, the share of renewable energy shall be increased as well [4]. The on-site use of renewable energy for buildings is one of the decarbonization steps. Traditional building envelopes provide shelter to inhabitants and help to reduce undesirable heat losses or heat gains from the surrounding environment. The better the thermal properties of an envelope, the lower the energy bill for heating and cooling.
However, what if instead of being a passive component of the building energy balance, the building envelope could take an active part in the energy balance, providing the energy necessary for maintaining a comfortable indoor climate? One of the former trends of recent decades is improving the heat capacity of building envelopes, for instance, developing Trombe walls [5], [6], where solar energy is gathered and heat is accumulated in the building envelope itself.
Other similar trends providing thermal energy storage can be structures supplemented with phase-change materials (PCM) since those have higher heat capacity [7,8], compared to conventional materials—concrete, lightweight concrete, and wood. A more recent and equally important direction is the active/adaptive building envelopes that act as energy converters [9,10]; thus, energy that is available on–site is transformed into electrical or thermal energy. Such an approach combines the need for advanced building components and promotes the transition to the use of renewable energy instead of fossil.
Among active systems, there are building-integrated photovoltaic or photovoltaic and thermal systems [11,12], ventilated active thermoelectric envelopes [13], active systems with phase-change materials [14,15,16], transpired solar collectors [10], active glazed facades [17,18]; glazing with phase-change materials [19,20], and others. In 2019, the Fraunhofer Institute For Solar Energy Systems ISE stated that only the building-integrated photovoltaic systems are recognized as mass-produced products [21]. Therefore, in the field of active building envelope systems, the knowledge base on the performance of different types of building components has to be strengthened for these systems to become widely applicable.
The incorporation of phase-change materials (PCM) into building envelopes has great potential to raise the energy efficiency for new and retrofitted buildings and support on-site renewable energy use. Since none of the recently developed PCM enhanced materials have gained mass production status, adding scientific knowledge to the field helps to fill this knowledge gap.
Phase-change materials can serve as the energy storage medium in building thermal envelopes allowing them to store and release energy according to the heating and cooling demands of the building. In passive storage systems, PMCs can be embodied in building envelopes initiating energy charging and discharging cycles with no auxiliary energy used; however, in active storage systems, auxiliary energy is used for the operation of the system [22]. In passive PCM enhanced solar heating systems, thermal energy from daytime solar radiation is gathered inside the building envelope element (wall, roof, or floor).
Gained heat is released when solar energy decreases and the ambient temperature drops. However, an active heating system can provide the necessary room temperature by heating the PCM with a solar collector system, heat pump, or using cheap night-time electricity. In the study of the optimization of PCM wallboard for building use [23], the 10 mm thick PCM layer was compared to other building materials to determine the maximum storable energy. The simulation results showed that the wallboard with only 10 mm of PCM had the highest energy storage capacity.
Different approaches and technologies have been proposed in recent years regarding how the PCMs can be incorporated into the building envelopes. In one of the studies [24], an aluminium honeycomb containing a micro-encapsulated PCM wallboard was investigated. The experimental results showed sufficient heat conduction enhancement. In another study [25], PCM macro-capsules were incorporated in masonry wall clay bricks that led to an indoor temperature swing reduction from 10 to 5 °C and a time delay of around 3 h. A study of a numerical model of a residential building roof with a PCM layer was developed to evaluate thermal performance using the data of climatic conditions in Chennai for the month of January [26].
The findings indicate that a PCM-embedded rooftop maintains a ceiling temperature that is approximately stable in the region of 25.5–27.5 °C and decreases the highest recorded heat levels as a contrast to a rooftop without PCM. The study is expanded to account for the PCM plane’s various inclinations within the layout of the roof. In comparison to a non-PCM room, a PCM slab inclined at 2 °C offers a maximum ceiling temperature reduction of 2.38 °C and daily heat gain savings of 0.106 kWh/m2 or 16% for the same thickness and material properties.
The energetic demand for active heating, ventilation, air conditioning (HVAC) systems can be reduced by implanting PCMs in these systems. An experimental study by de Gracia, Navarro, and Castell [27] of ventilated double-skin facades with PCM during the winter period in Spain showed that the use of PCMs significantly improved the thermal behaviour of the whole building by reducing the electrical consumption and serving as heat supplier in the periods when it is necessary.
A comparison between active and passive PCM systems was developed by Gholamibozanjani and Farid [28]. The potential of passive and active systems for energy savings and peak load shifting was investigated using two identical test booths, each fitted with a control system. One of the booths was outfitted with PCM-integrated wallboards, while the other one was designed with active PCM heat storage units based on air. When both systems had the same amount of heat storage capacity, the energy used in the booth for an active system was 22 percent less over ten days in winter. When peak load shifting was investigated, it was discovered that using an active system resulted in a 32 percent reduction in energy costs.
Depending on the temperature range required, a variety of phase-change materials (PCM) are available; however, solid–liquid PCMs are the most suitable for the building sector due to their characteristics. They are divided into three main categories: organic, inorganic, and eutectics [29]. Fatty acids, sugar alcohols, and paraffin-based organic materials are the most often used solid–liquid PMCs due to their wide range of temperature performance. For temperatures beneath 0 °C, paraffin is the best option for building materials [30].
Phase separation and subcooling are the main obstacles for the broad usage of inorganic hydrated salts despite their excellent medium-low temperature heat storage properties, availability, and price [31]. Eutectics are the materials combined with several solids in various ratios to lower the melting temperature of the substance. A slightly higher density is one of the key disadvantages compared to organic PCMs [32].
The use of PCM’s in an active or passive building envelope is one of the most promising alternative ways to reduce energy demand in buildings and to improve the energy efficiency at the same time providing thermal comfort for the inhabitants.
The research presented in the paper aims to create a composite solar facade that harvests solar energy, stores it in phase-change material, and releases it to the indoor space on demand. The study is a continuation of a series of experiments on composite facade structures containing phase-change material, an insulation layer, and heat transfer enhancers—copper plate and rods (Figure 1). The proposed system is intended to function as a thermal energy storage system (TES)—to absorb on-site available solar energy in the charging phase and release stored energy to the spaces in need for heating at the discharging phase.
Six alterations of the solar wall module have been tested in previous studies [33,34]. The energy storage unit (PCM container) is one element that does not change. What changes is the heat transfer unit—there are three basic forms: unventilated air gap, aerogel filling, and cone-shaped air gap (air gap inside and aerogel outside), and those are repeated in two versions—with a Fresnel lens for the concentration of solar radiation and with PMMA glass (described in more detail later in the text). It was concluded that solar wall module variations with less insulation, on the one hand, heat up much faster and the temperature in PCM was found to be up to 25 degrees higher than in those with higher thermal resistance at the outer layer; however, on the other hand, heat is lost as fast as it was gained in the given experimental setup. It was concluded that a balance between optimal charging speed and reduced heat losses must be found.
The proposal for optimization of the solar facade module by application of an adjustable insulation layer as well as the experimental setup to evaluate the impact of the proposed solution is presented in the next section. The gained results are analysed in Section 3.

2. Materials and Methods

As a possible solution to reduce heat losses at the discharging phase while not compromising the charging speed, we suggest the use of an adjustable insulation layer—to add to the external surface of the solar facade module an additional 5 cm of insulation during the discharging phase (Figure 2a,b).
The impact of adjustable insulation is evaluated in this study on all six previously developed variations of the solar facade (Figure 3).

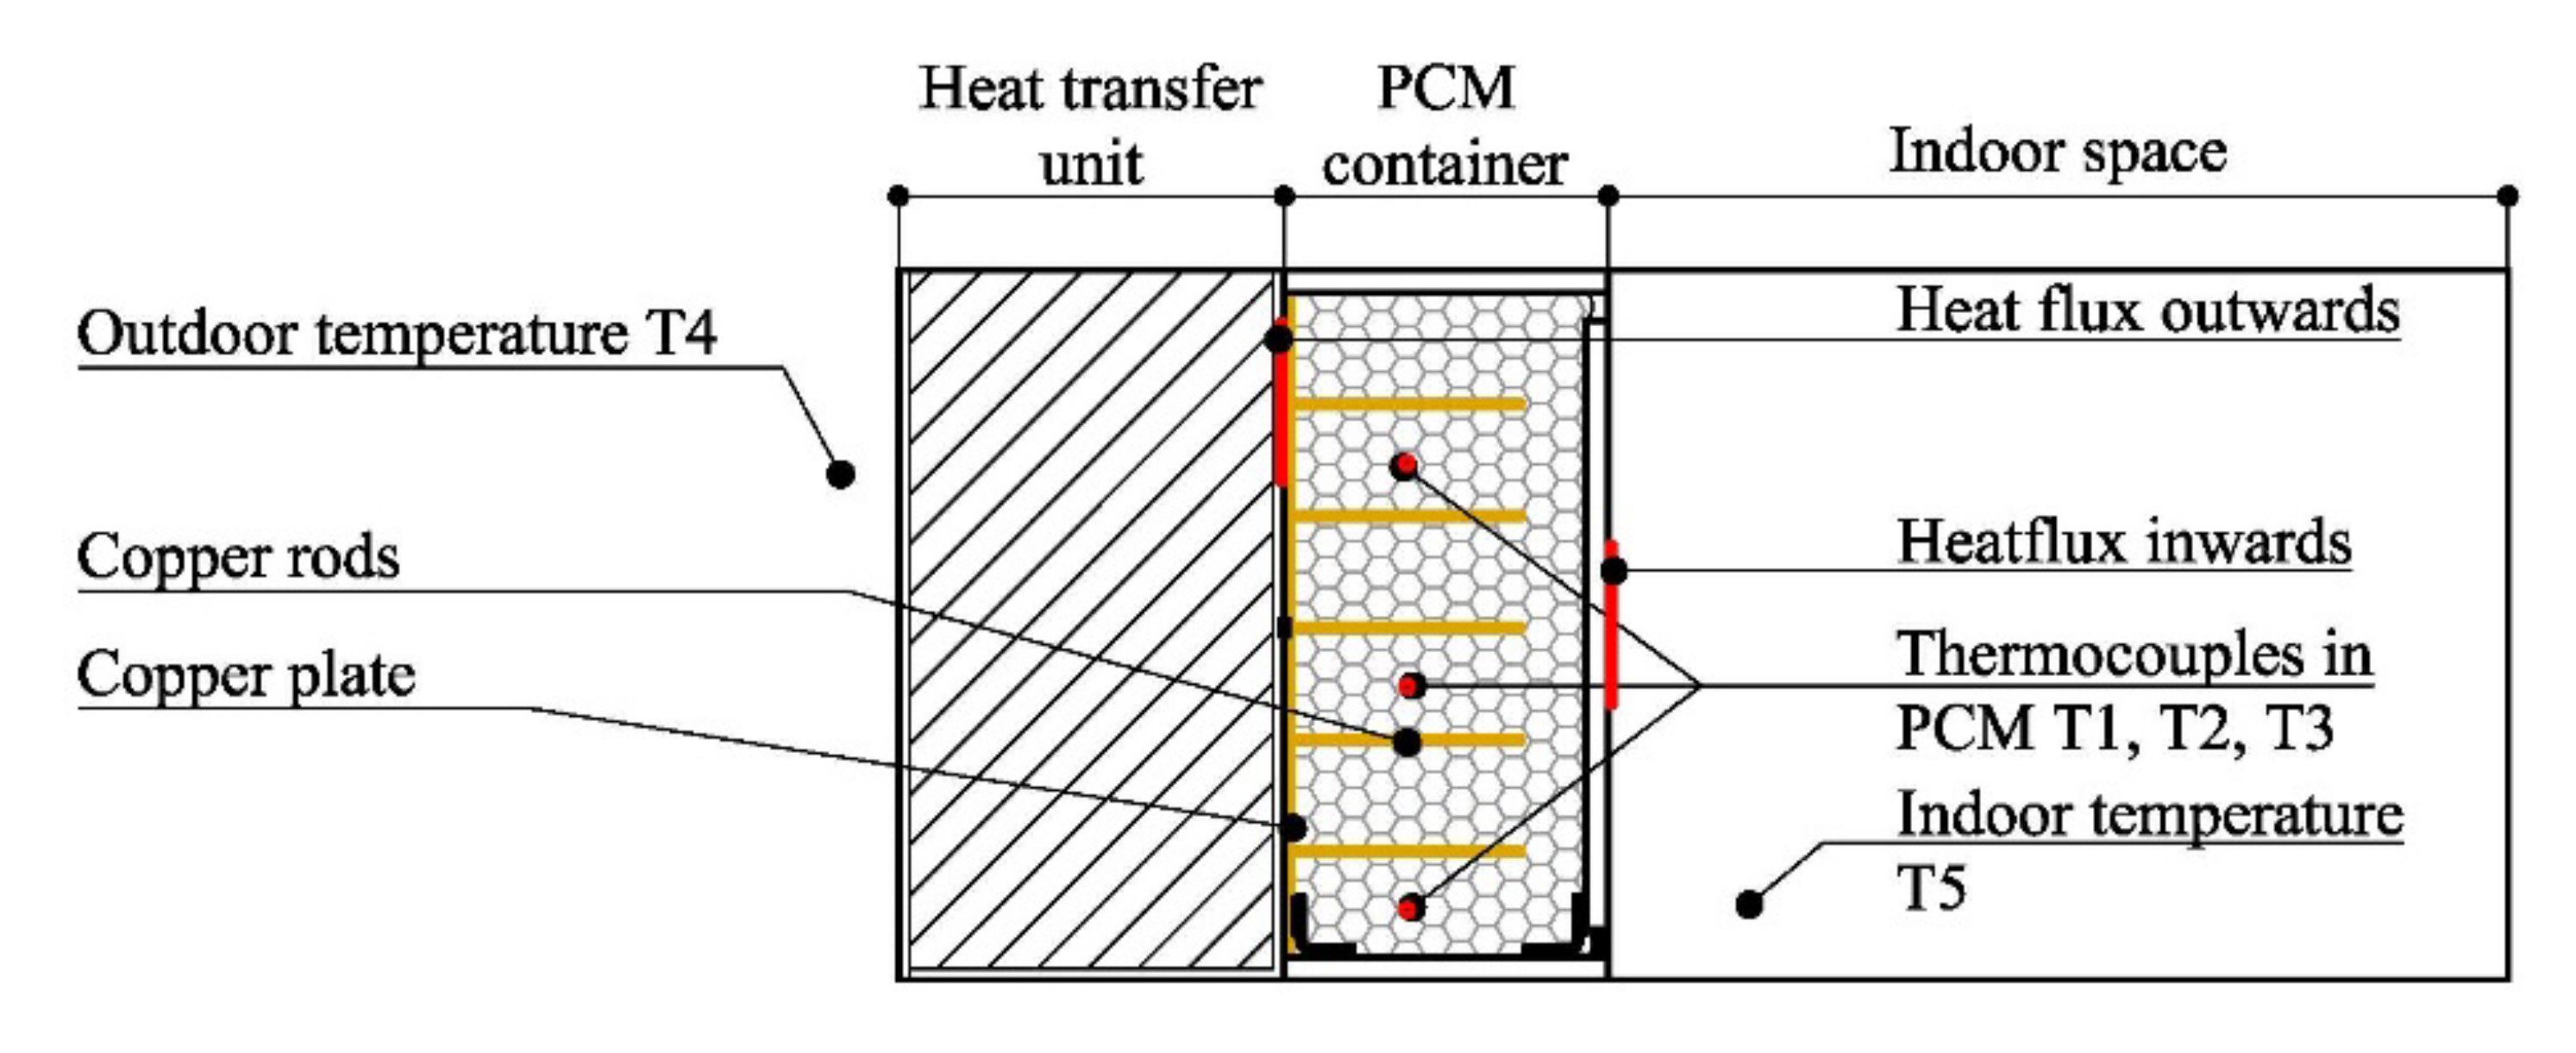
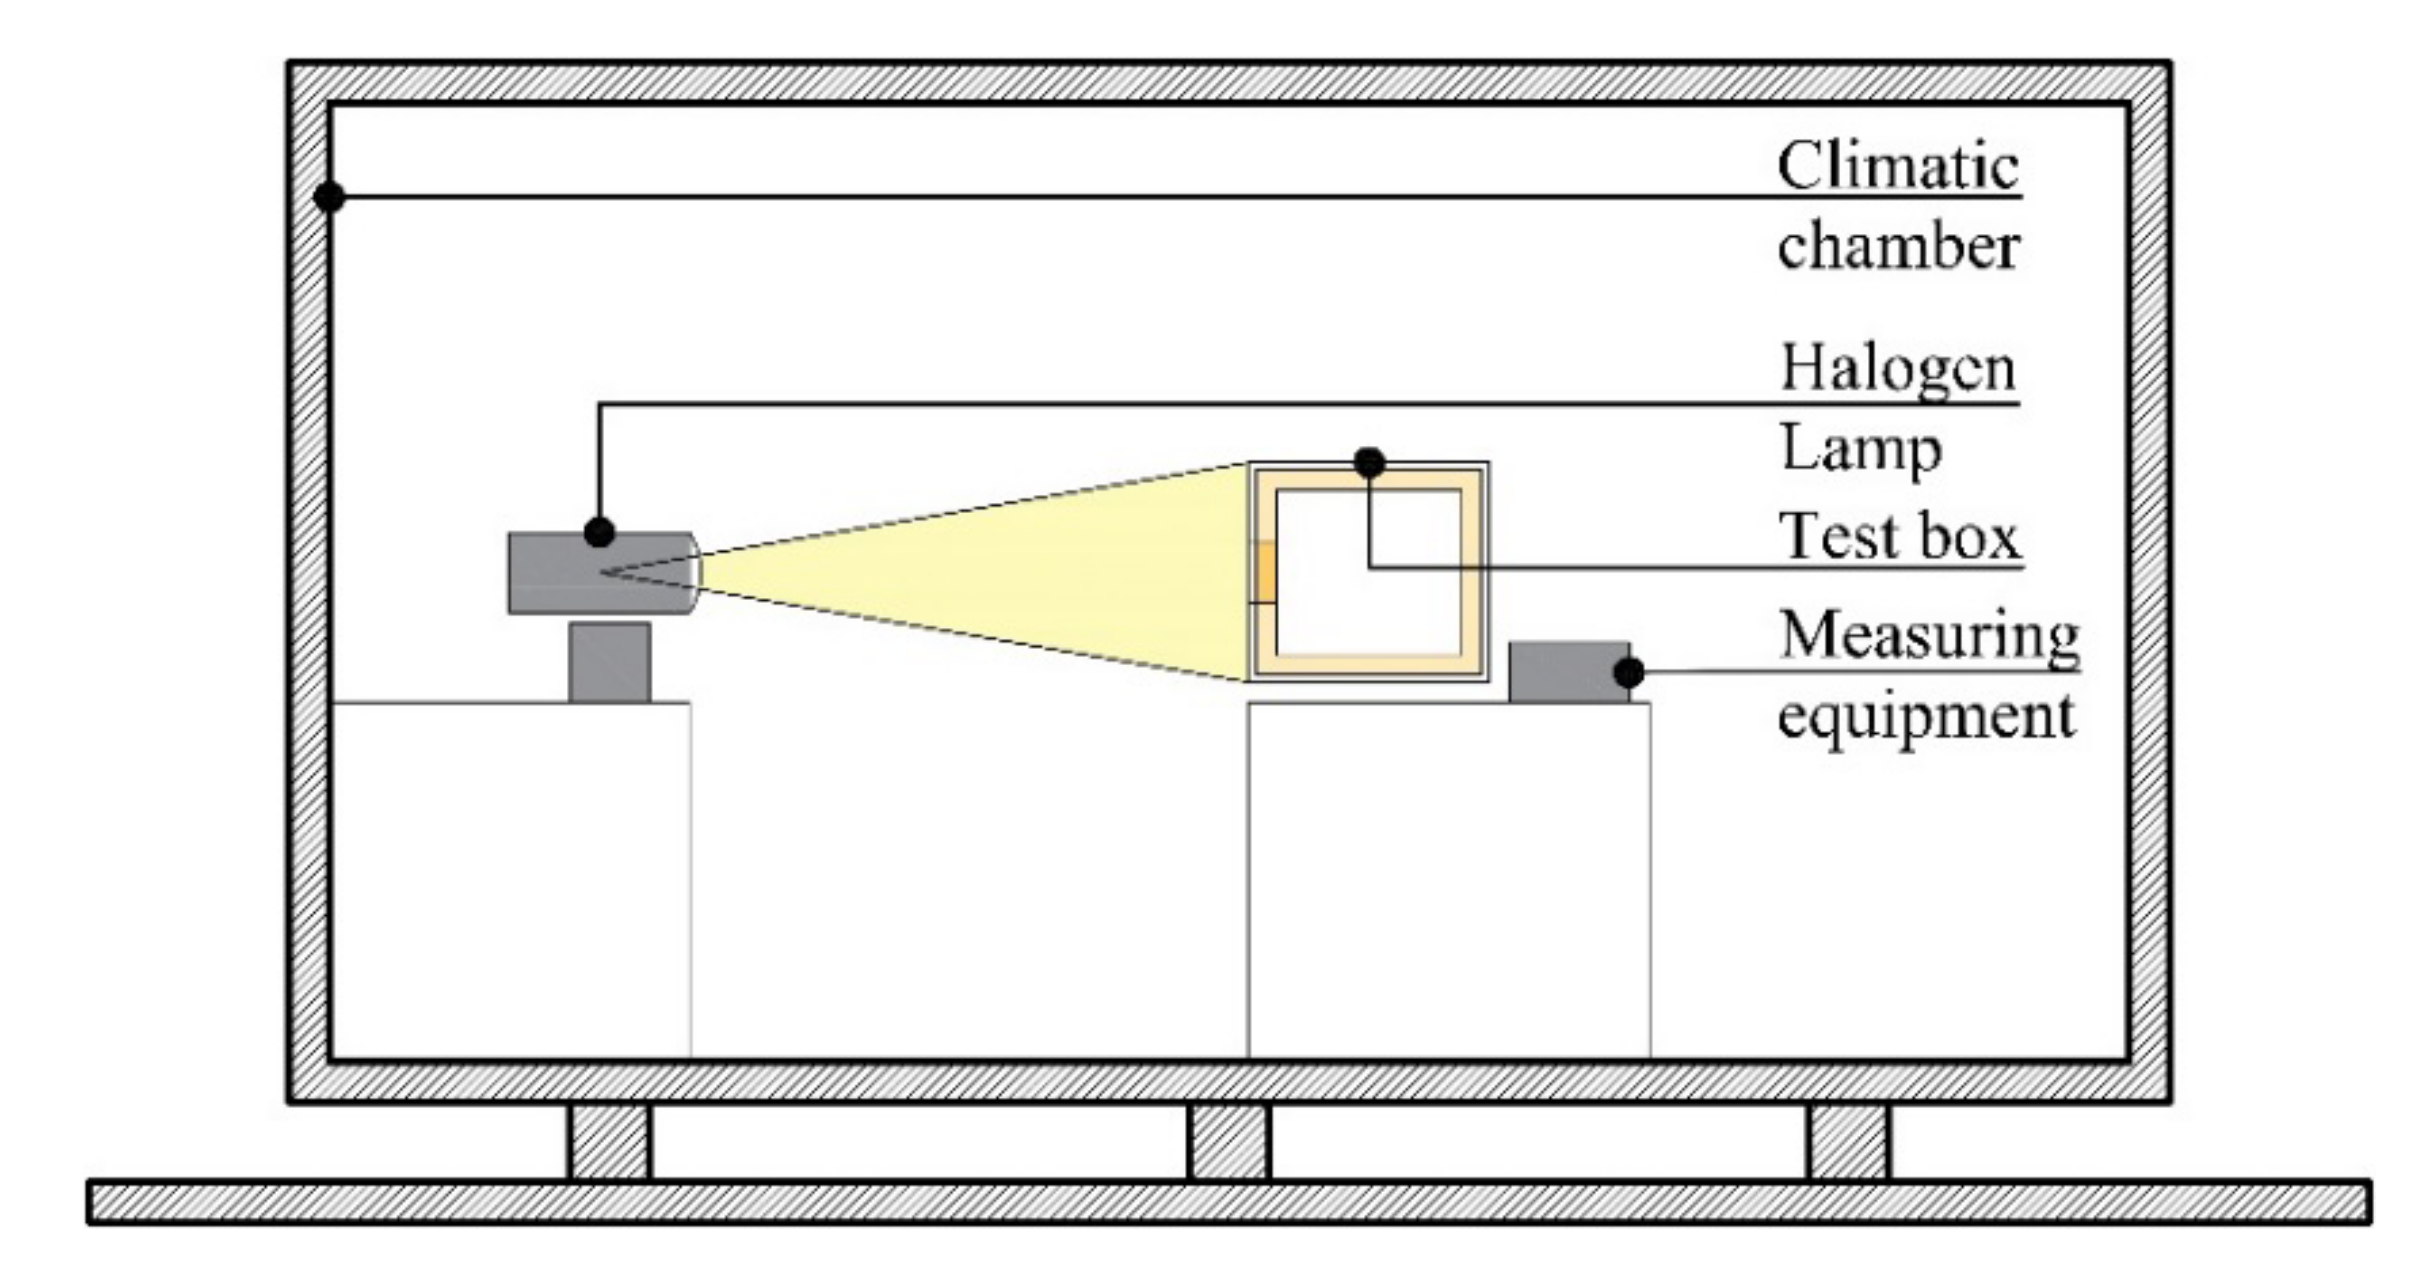
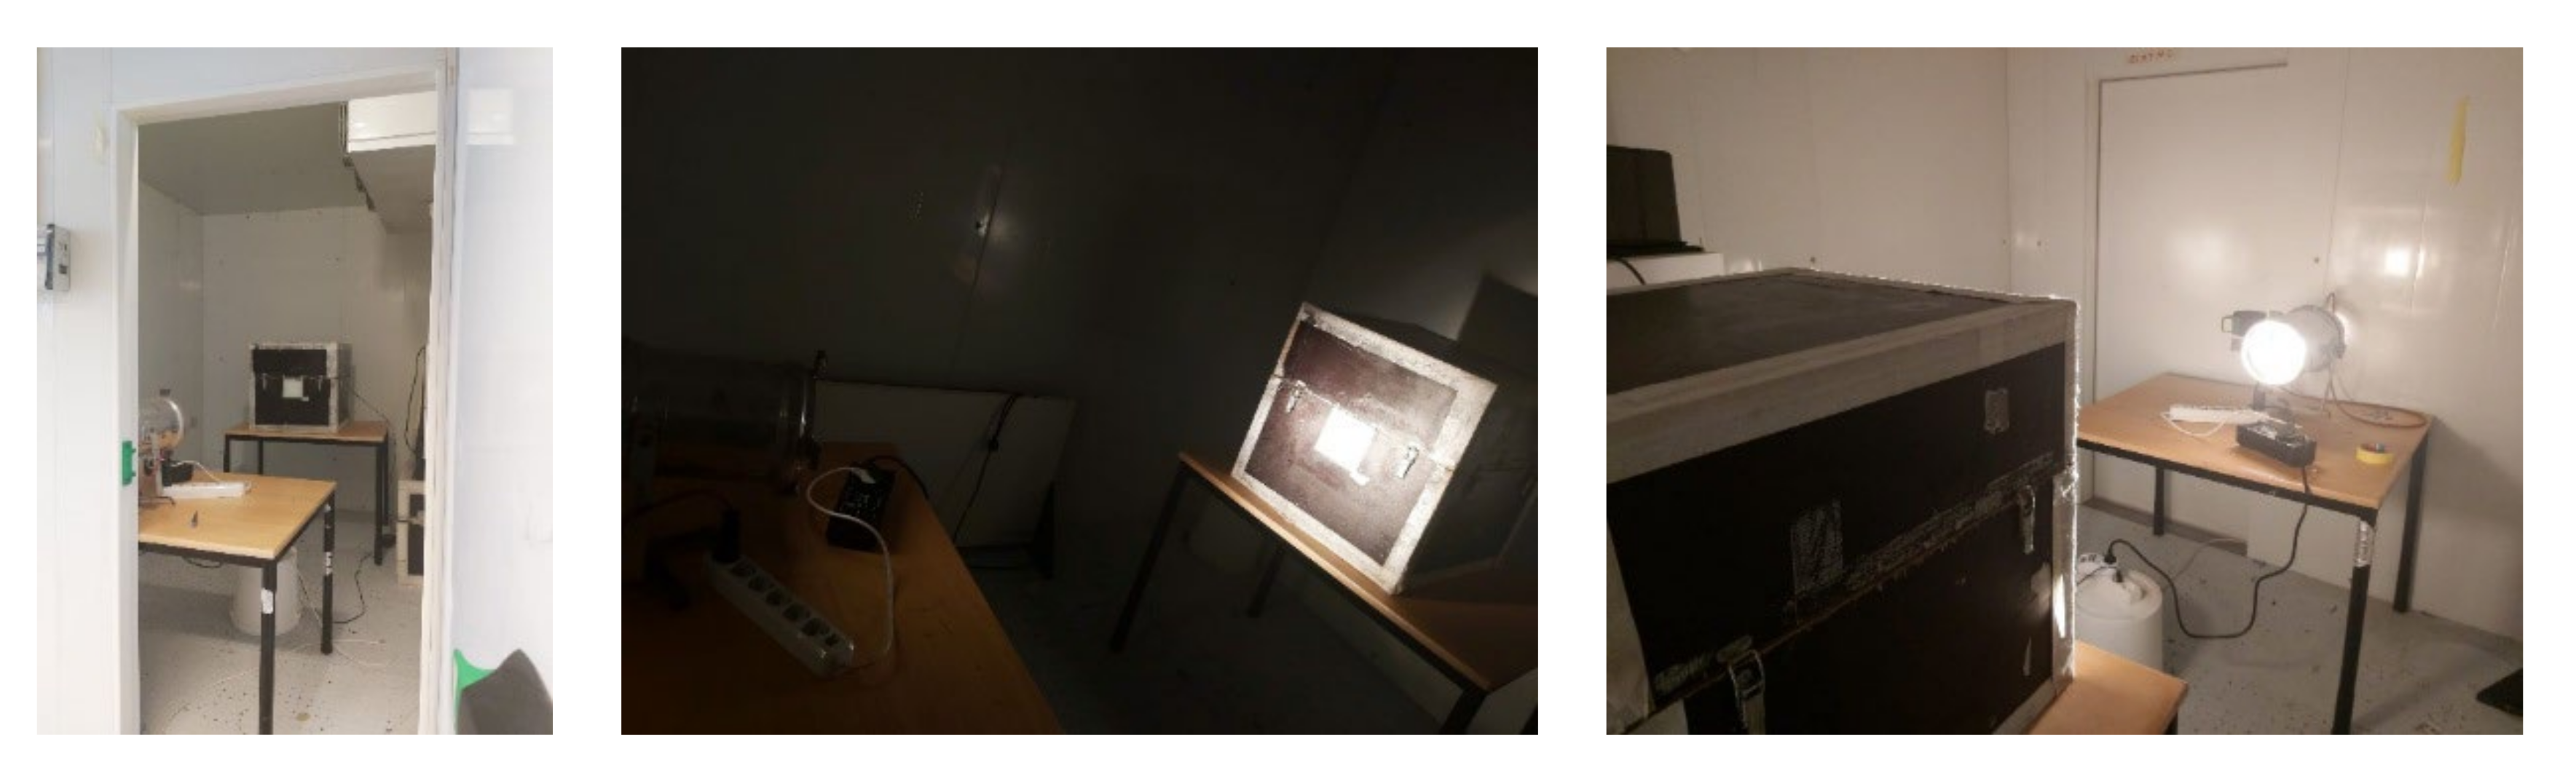
2.1. Experimental Setup

The experimental setup is a small-scale replica of the PASLINK test. The PASLINK test is a method to determine the performance of developed building components under real climatic loads that has been developed from the PASSYS Project (Passive Solar Components and Systems Testing) [35]. The PASLINK test stand consists of a building envelope (in one facade tested material is built-in) and a room under observation surrounded by the envelope.
In the experiment presented in the paper, a small-scale replica is created, and a test is performed in controlled circumstances in a climate camera. The experiment is based on the comparative testing of six small-scale solar facade modules each with a different design. The test aims to compare the performance of different design modules with and without an external insulation layer to define the best performing setup in a controlled environment and to give an insight into which combination of components could potentially be used for the development of a large-scale solar facade module.
The testing box (0.6 × 0.6 × 0.55 m) imitates the building thermal envelope—walls, floor and roof and small inside an unconditioned space. It is made from 18 mm plywood and is lined with 200 mm thermal insulation (λ = 0.037 W/mK). The thickness of the thermal insulation layer is chosen accordingly to reach the U-value determined in Latvian construction standards. In one of the walls, the developed facade module is built in (Figure 4).
For monitoring purposes, a set of thermocouples and heat flux sensors are placed in the experimental setup (Figure 5). There are five thermocouples (T1, T2, T3)—three are placed in PCM container at different heights to observe temperature changes in different layers of phase-change materials, one thermocouple (T4) registers the temperature in the climate chamber, and one thermocouple (T5) is placed in the “indoor space” of the test box. T4 is not reflected in the paper since its main purpose is to notice technical issues in ensuring equal temperatures in all test rounds.
The provided set of thermocouples will allow to compare changes in PCM temperature and “indoor space” temperature among different setups under defined conditions. Two heat flux sensors are placed at inside (facing “indoor space”) and outside (facing heat transfer unit) surfaces of the PCM container. The first sensor provides data on the heat exchange between phase-change material and indoor space, and the second sensor illustrates heat exchange with surroundings via heat transfer unit.
The test box is placed in the climate chamber (Figure 6). The heating/cooling unit ensures the desired temperature in the climate chamber.
The experimental stand is located in the laboratory at Riga Technical University (Figure 7).

2.2. Experiment Plan

Six variations of designed solar wall modules are tested in the laboratory as presented in Figure 3. As mentioned before, the PCM container is the core of the solar wall module and is not changed during the experiment. The phase-change material used is Rubitherm paraffin RT21HC. All differences are made in the heat transfer unit varying with an unventilated air gap, aerogel filling, and cone-shaped unventilated air gap embedded in the aerogel layer.
To gain insights into the whole energy charging and discharging cycle, conditions are set to provide heating and cooling phases in laboratory testing conditions:
(1)
Initial state 10 °C. All solar wall module setups and the climate chamber itself is cooled to 10 °C before the start of the experiment. This temperature was determined considering the average outdoor temperature throughout the spring and autumn seasons in northern Europe. As these periods of the year demand space heating, there is a great potential to partly or fully cover them by using on-site solar energy in a particular climate zone.
(2)
In the heating phase, the temperature in the climate chamber is raised to 15 °C and a halogen lamp GE SUPER CP60 EXC VNS 230 V|1000 W G16d 3200 K|General Electric combined with dimmer UNI BAR Elation professional imitates solar radiation. The solar irradiance is set to 1000 W/m2 as this is considered a global standard in test conditions. The charging phase takes place for 7 h 39 min.
(3)
In the cooling phase, the lamp is switched off, and the temperature in the climate chamber is lowered to 10 °C. This phase is 40 h 21 min long.
All together, testing takes 48 h.
For each setup, two rounds of tests are performed—with and without an additional 5 cm insulation layer at the outer surface of the solar wall module; thus, altogether, there are 12 setups (S-setup; 1, 2, 3 … number of setups) (Table 1). For graphical visualization of the setups, see Figure 3.
The characteristics of the materials used in the modules and PASLINK test cell are summarized in Table 2 and Table 3.

2.3. Measuring Equipment

During the test, measurements are registered via multipurpose data logger CR1000 Campbell Scientific. Data are logged once in a minute. Solar radiation is measured by pyranometer CMP3, Kipp & Zonen. Type K thermocouples are used to measure the temperature in PCM. To capture the heat flow, a Sequoia SHF series (40 × 40 mm, 12.6 μV) sensor is used. The specifications of the measuring equipment are listed in Table 4 and Table 5.

3. Results

In this section, the results of testing are presented and organized as follows:
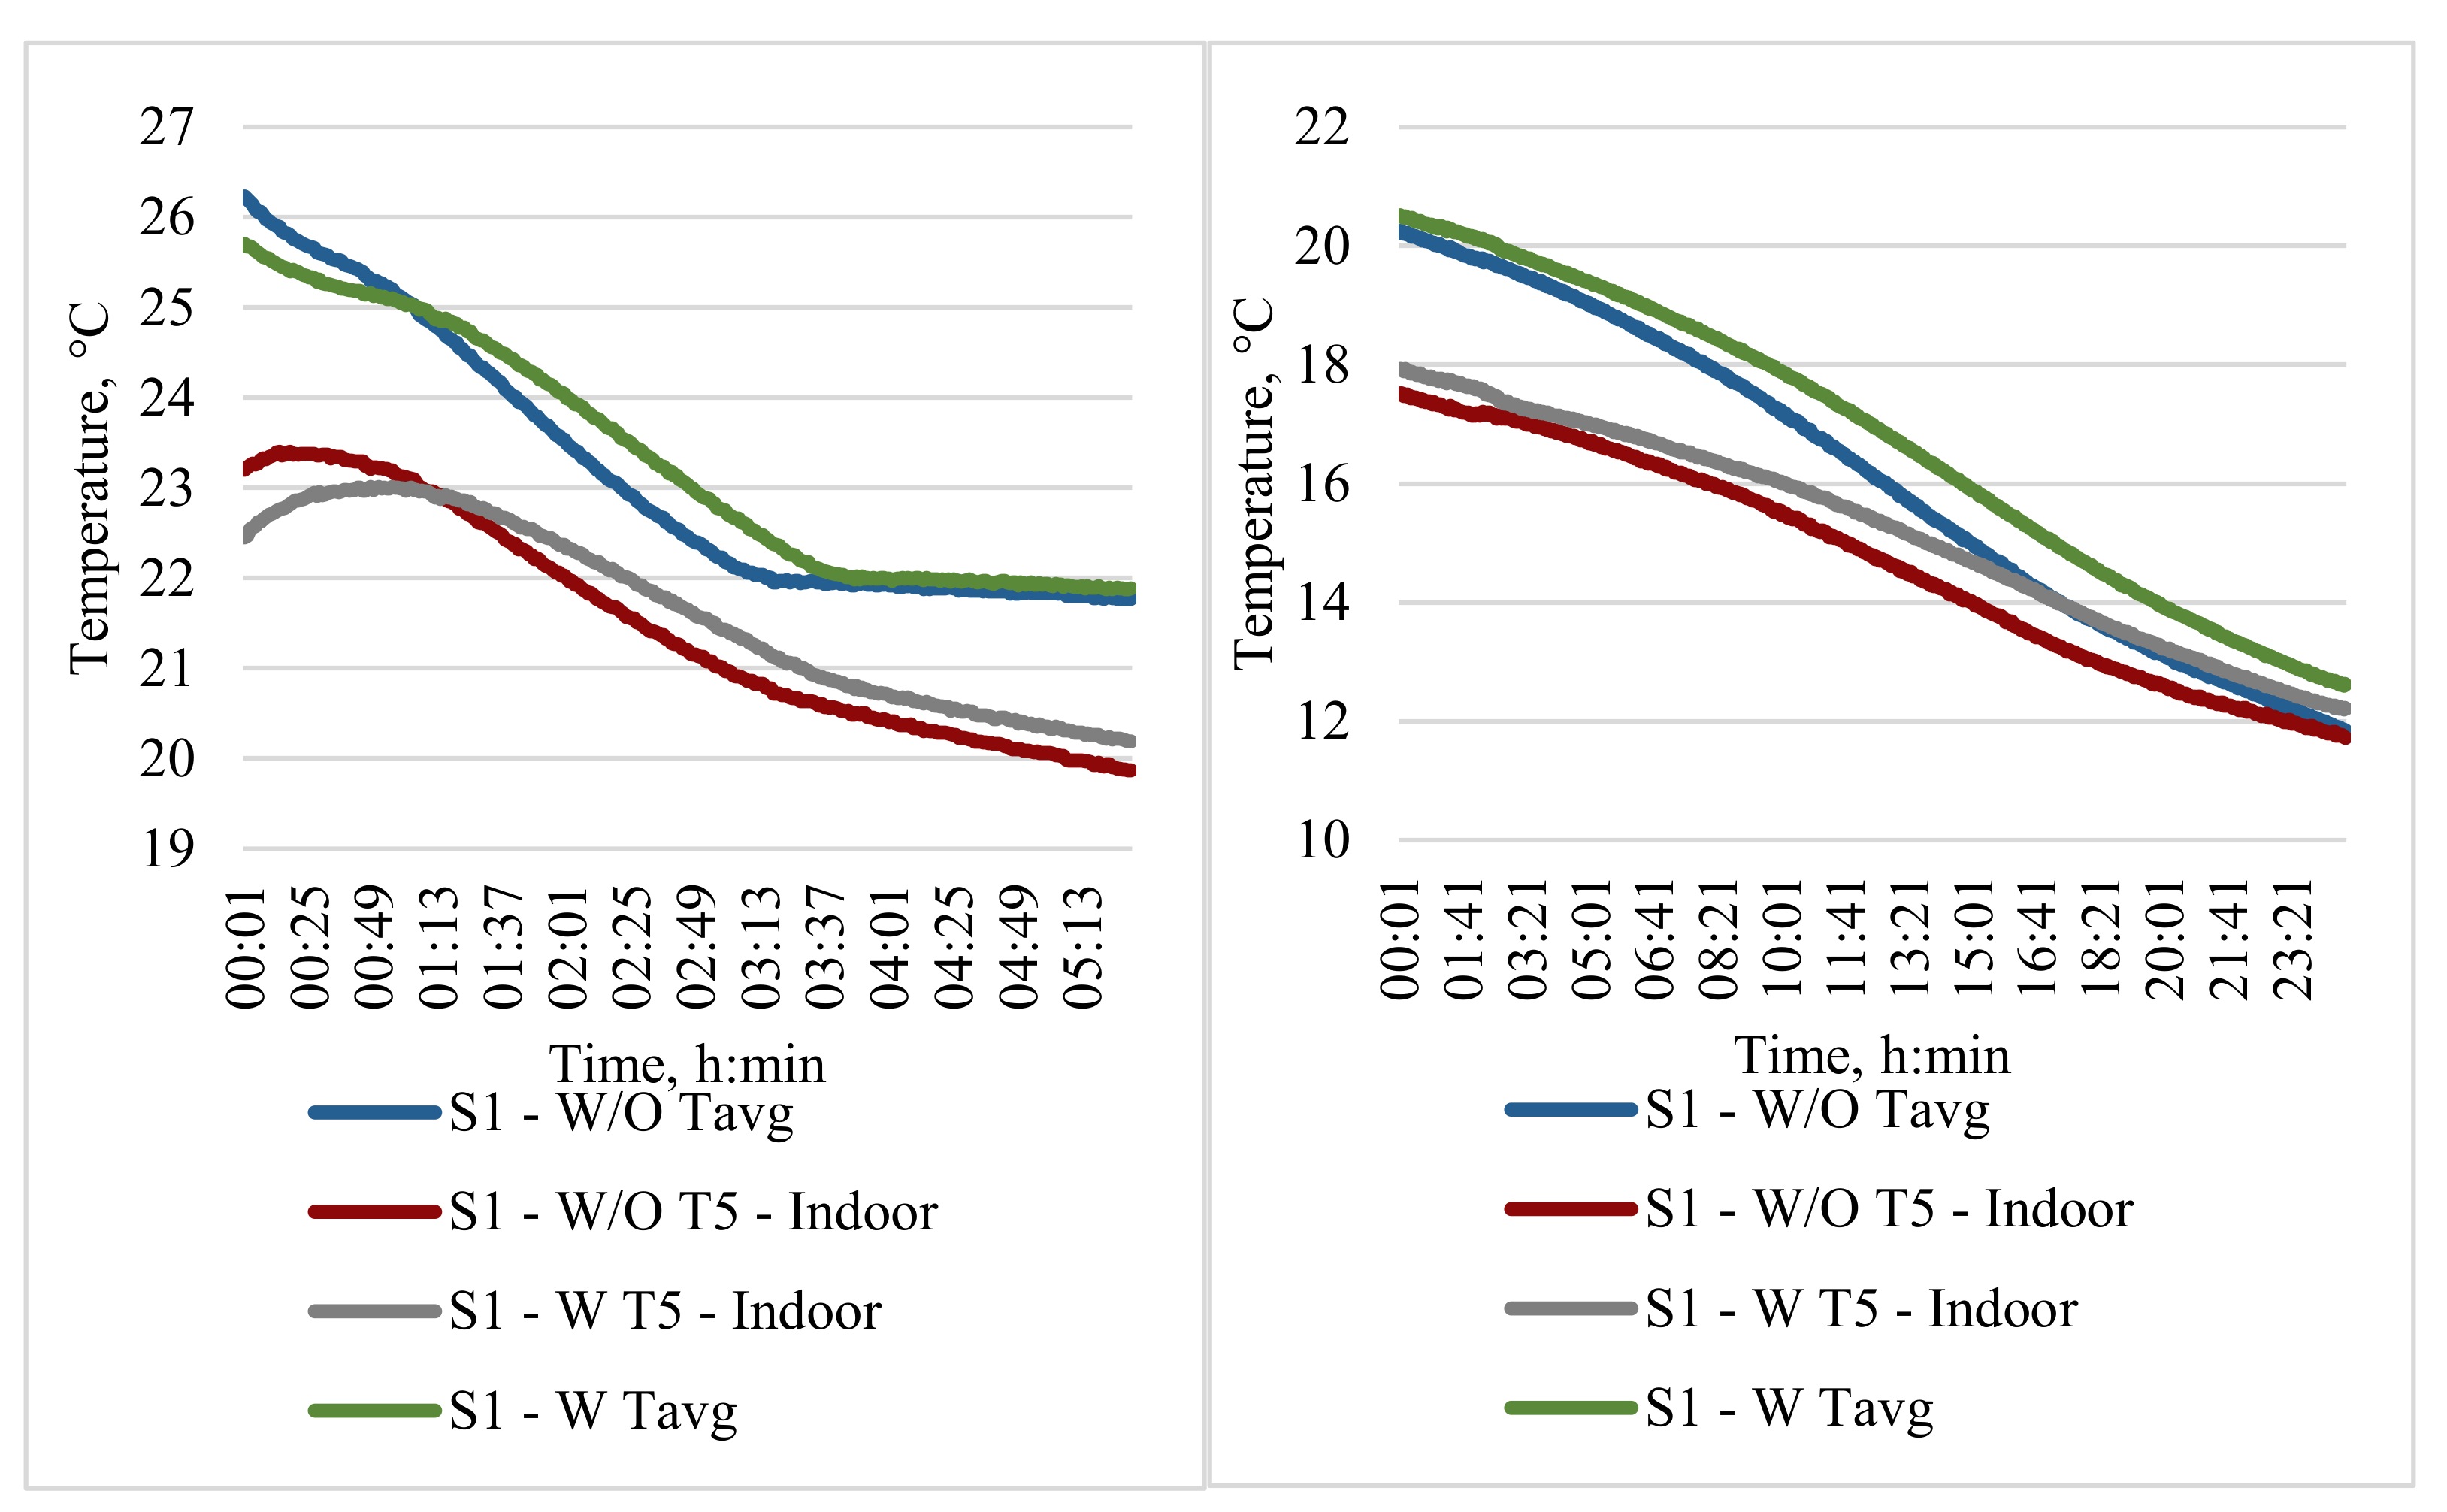
  • Temperature and heat flux graphs (average temperature in PCM, “indoor space”, heat flux inwards and outwards) are compared for each of six basic setups—the performance of one particular setup with and without an adjustable insulation layer is compared.
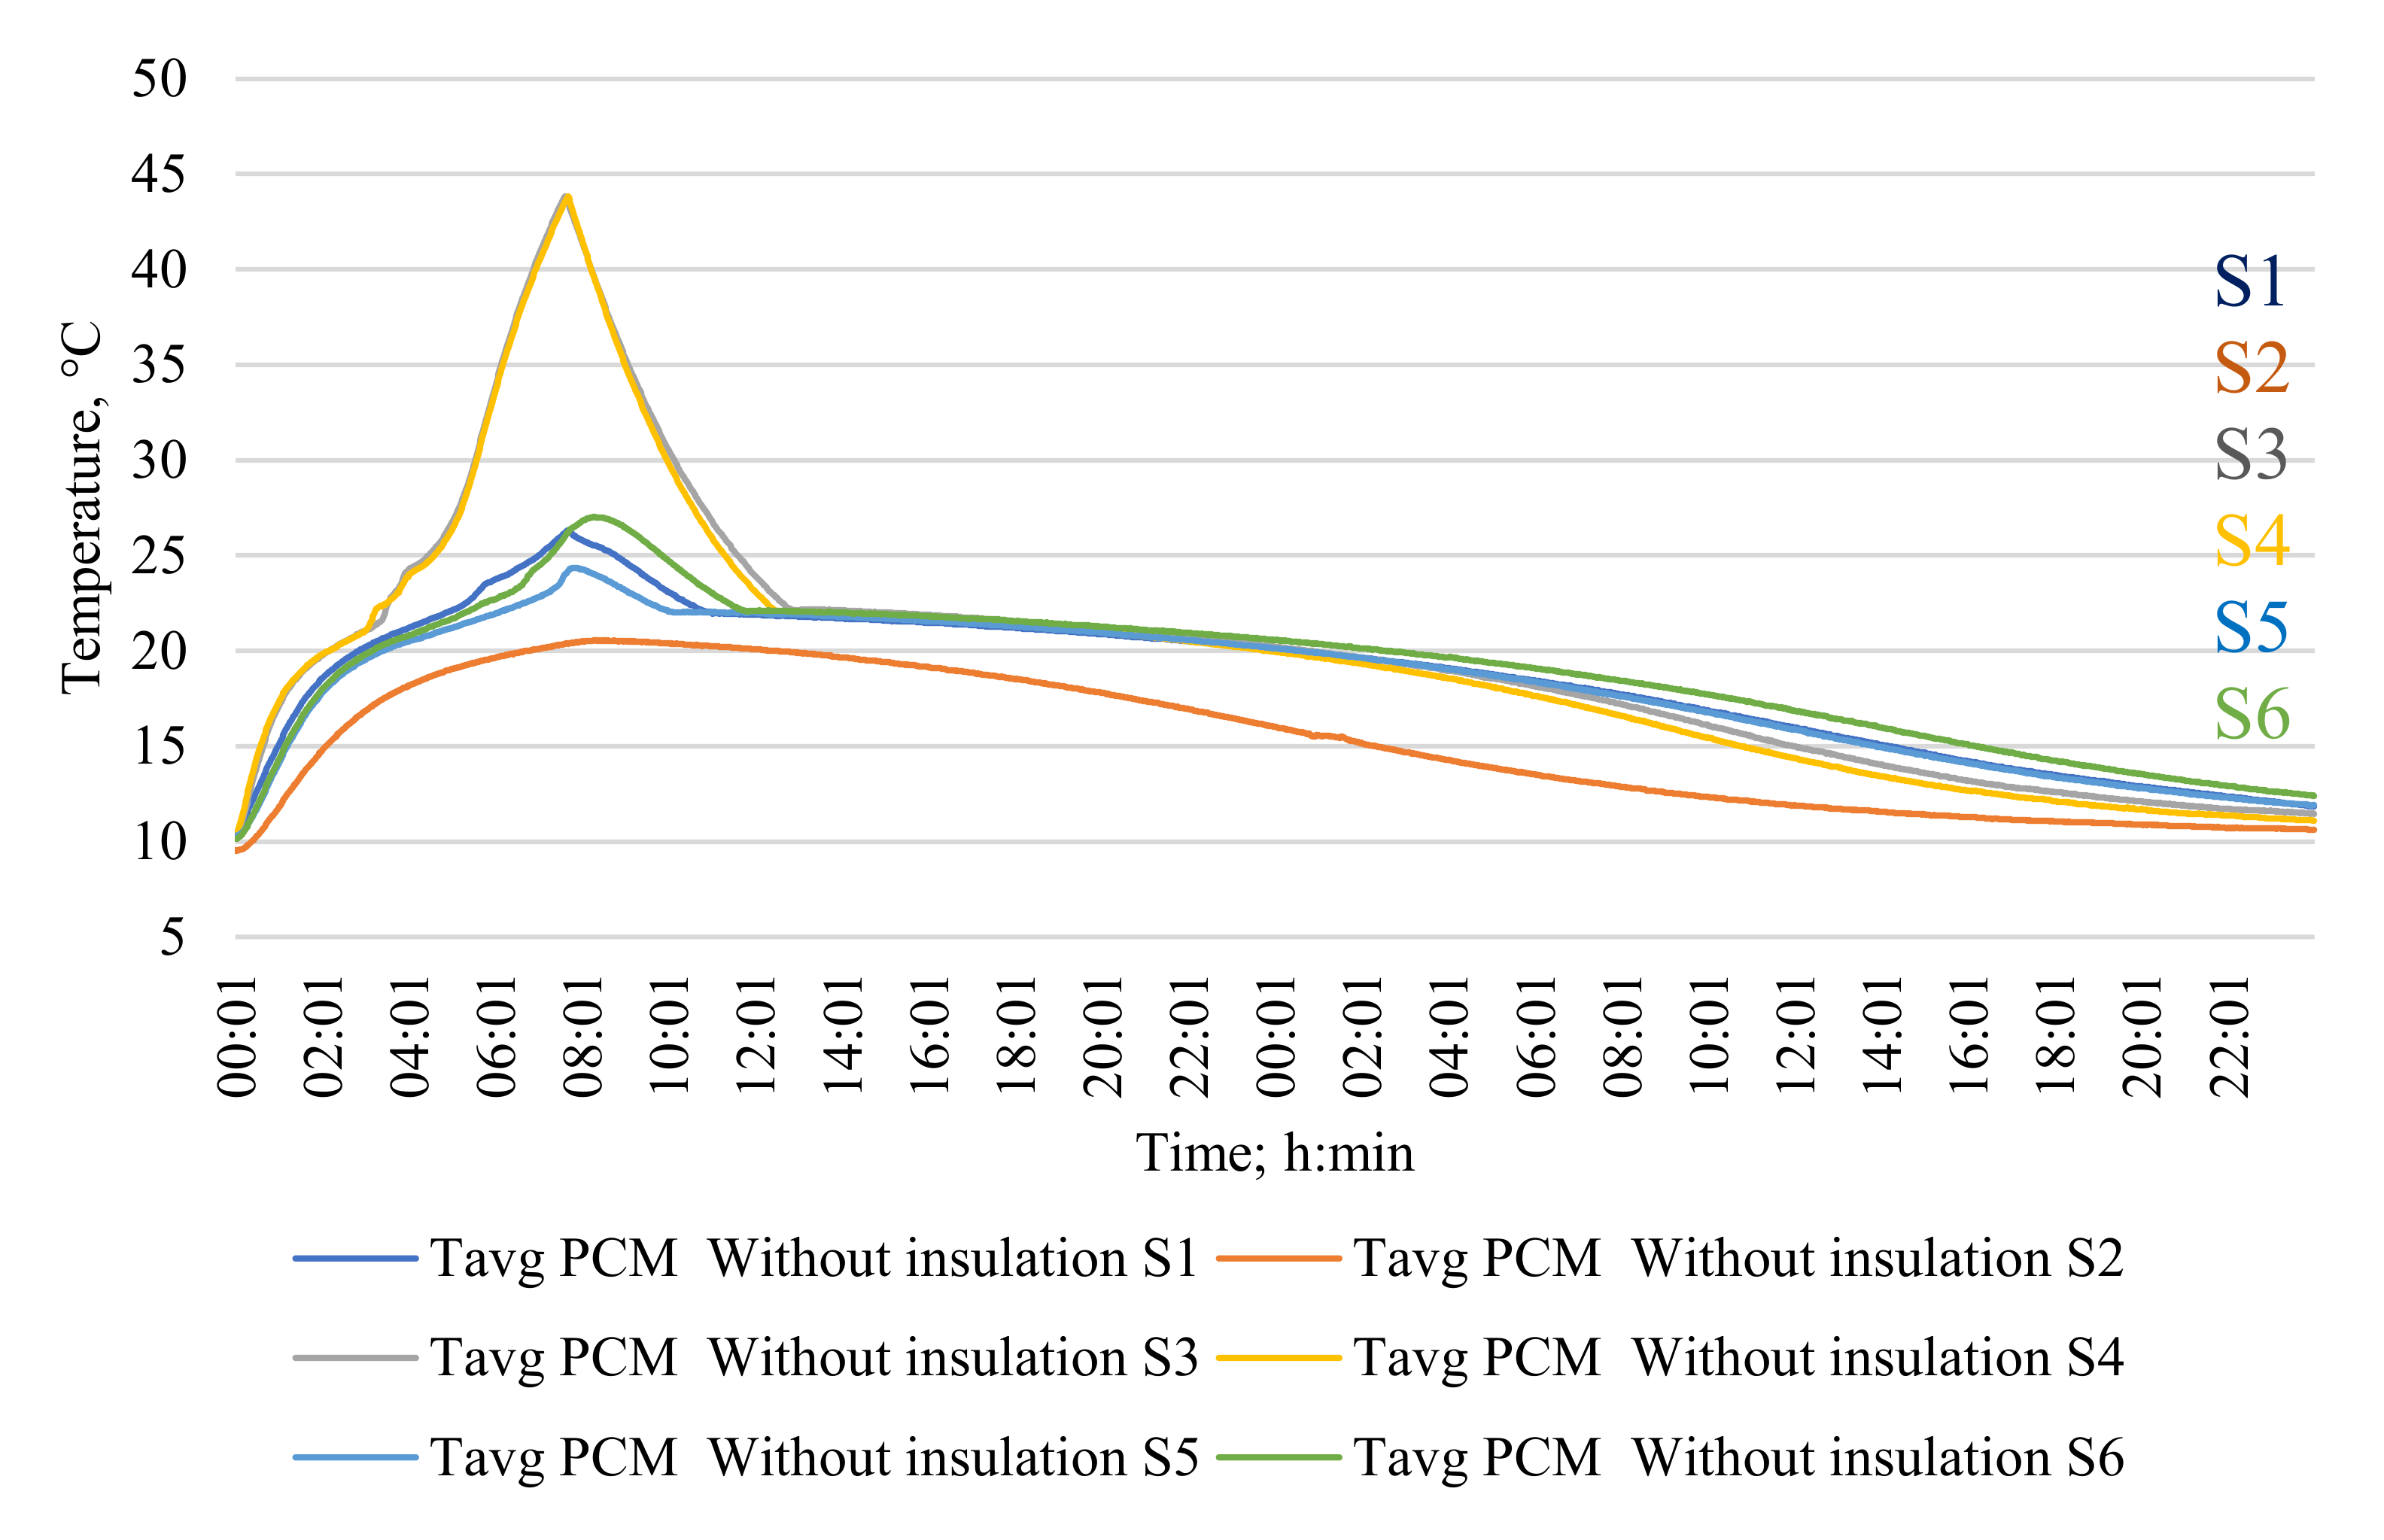
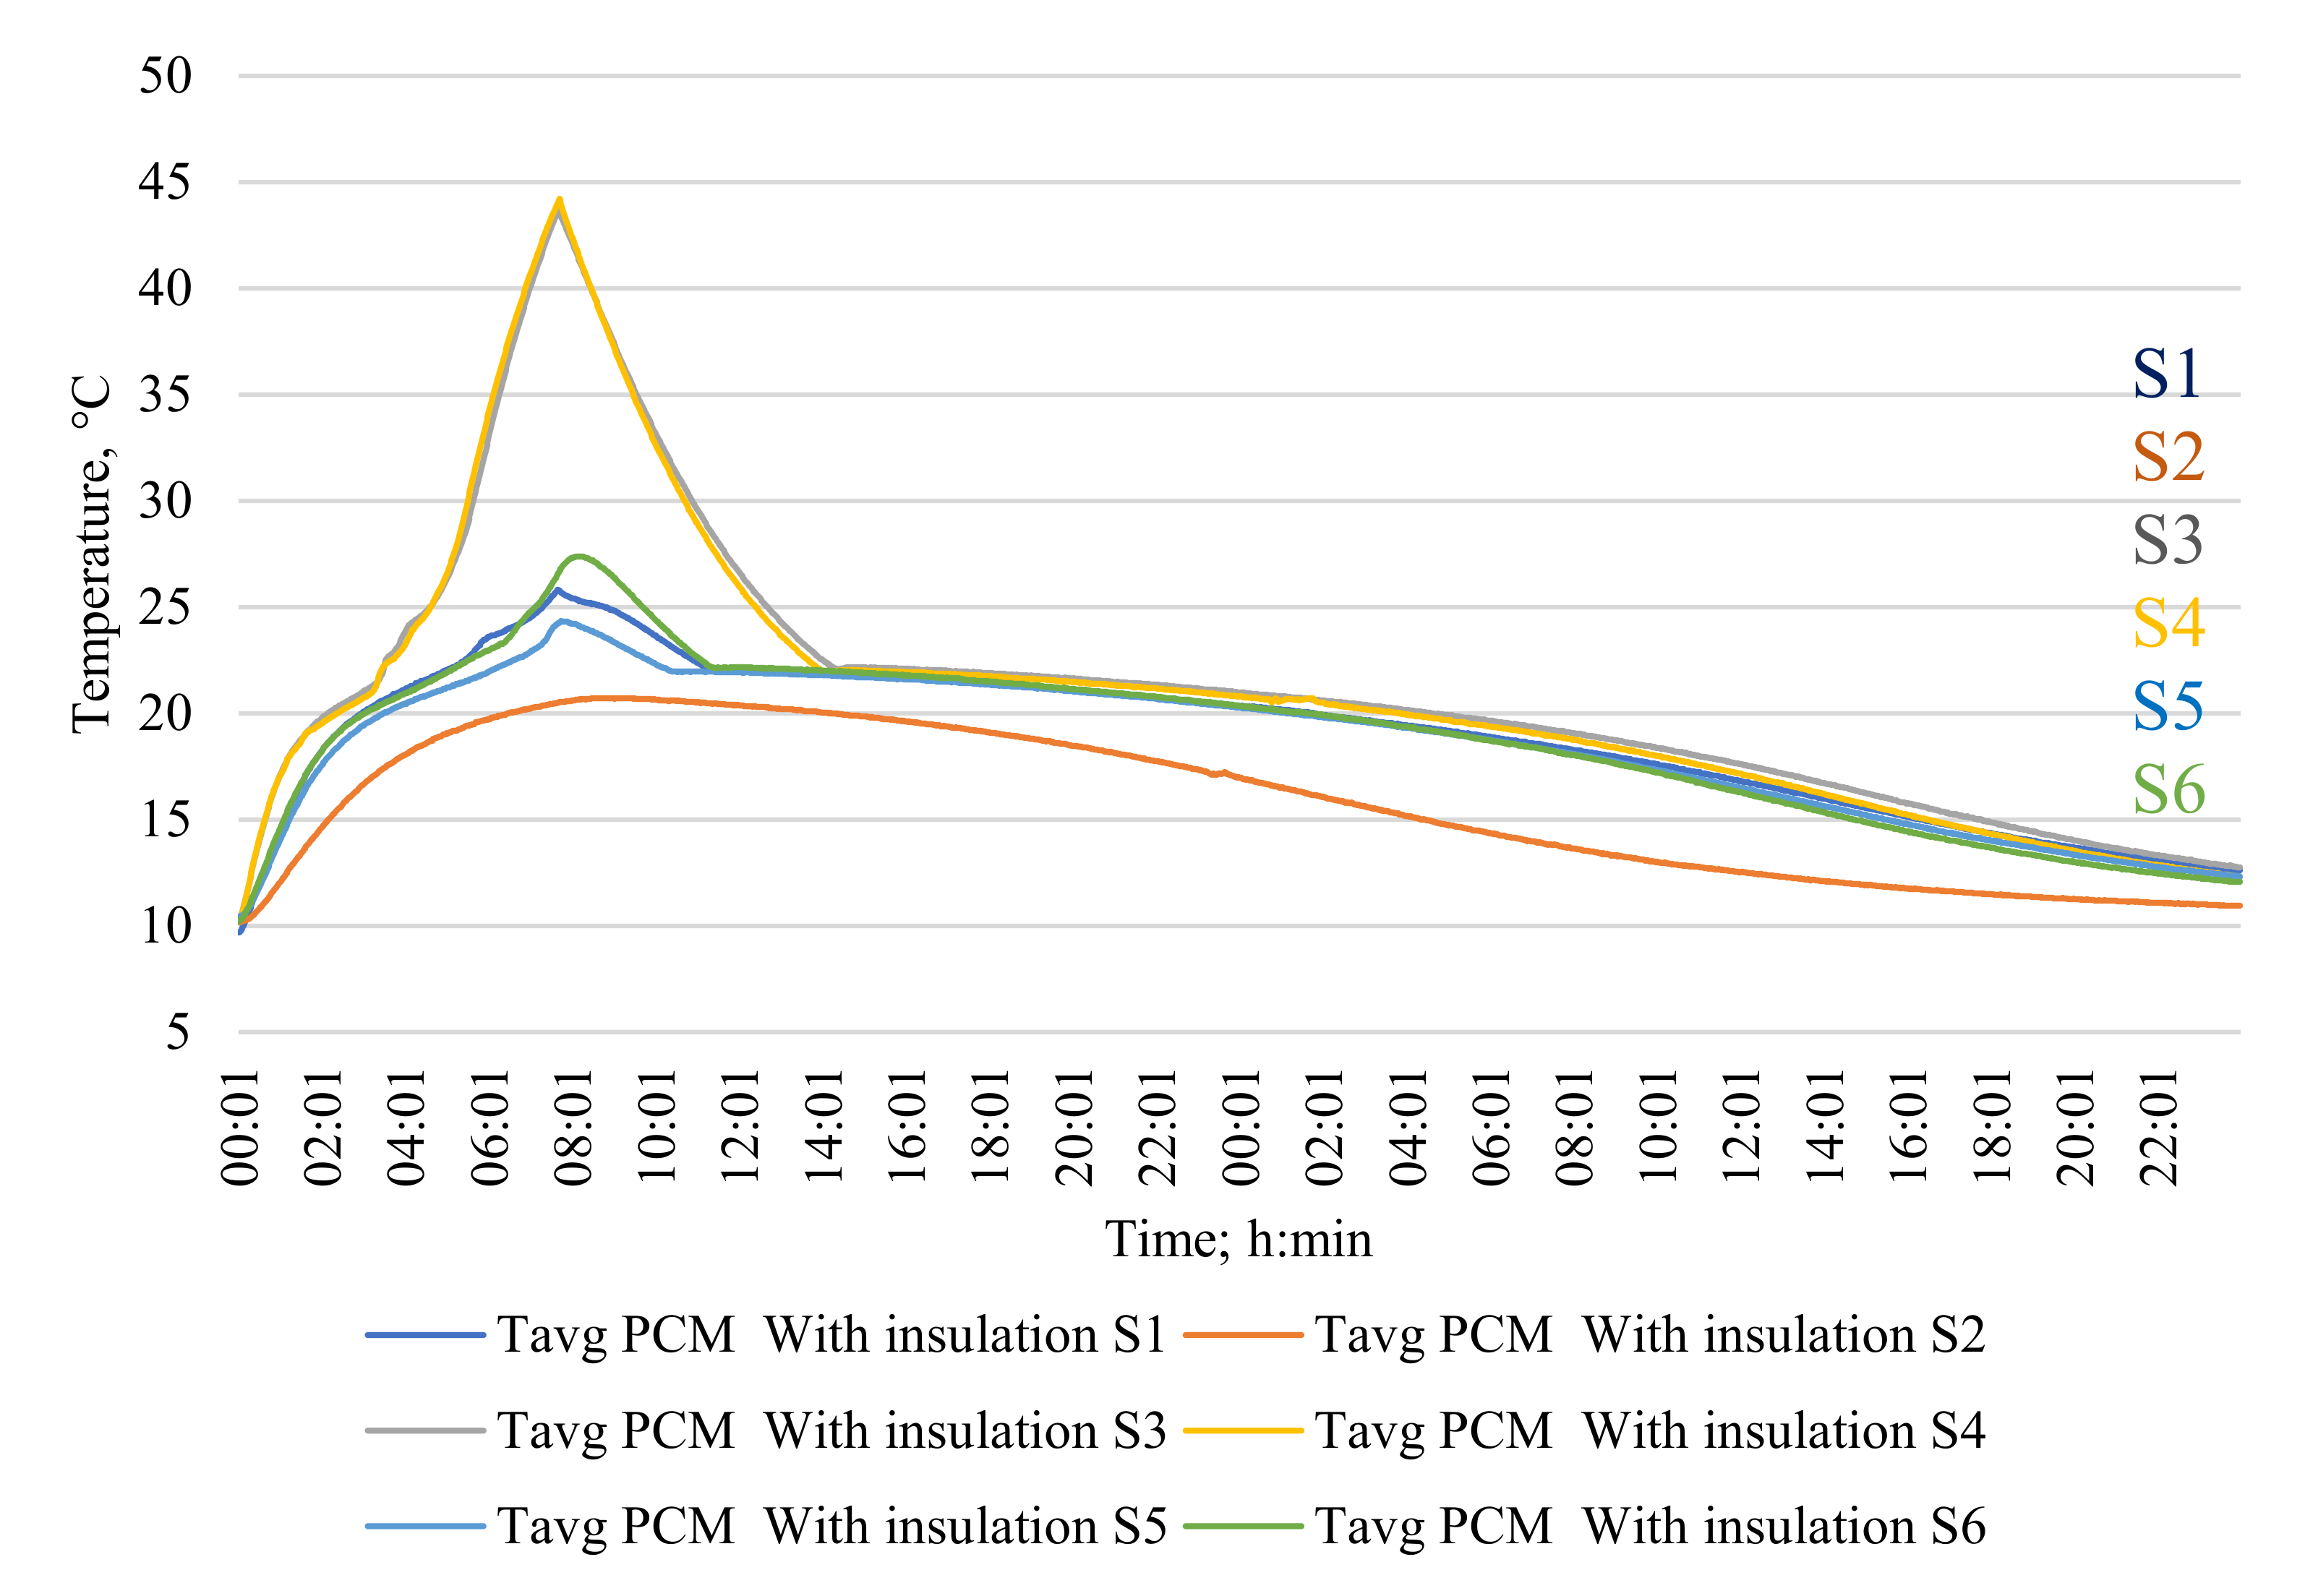
  • Temperature graphs (average temperature in PCM and “indoor space”) are compared for six basic setups compiled—the performance of all setups with and without an adjustable insulation layer are compared.
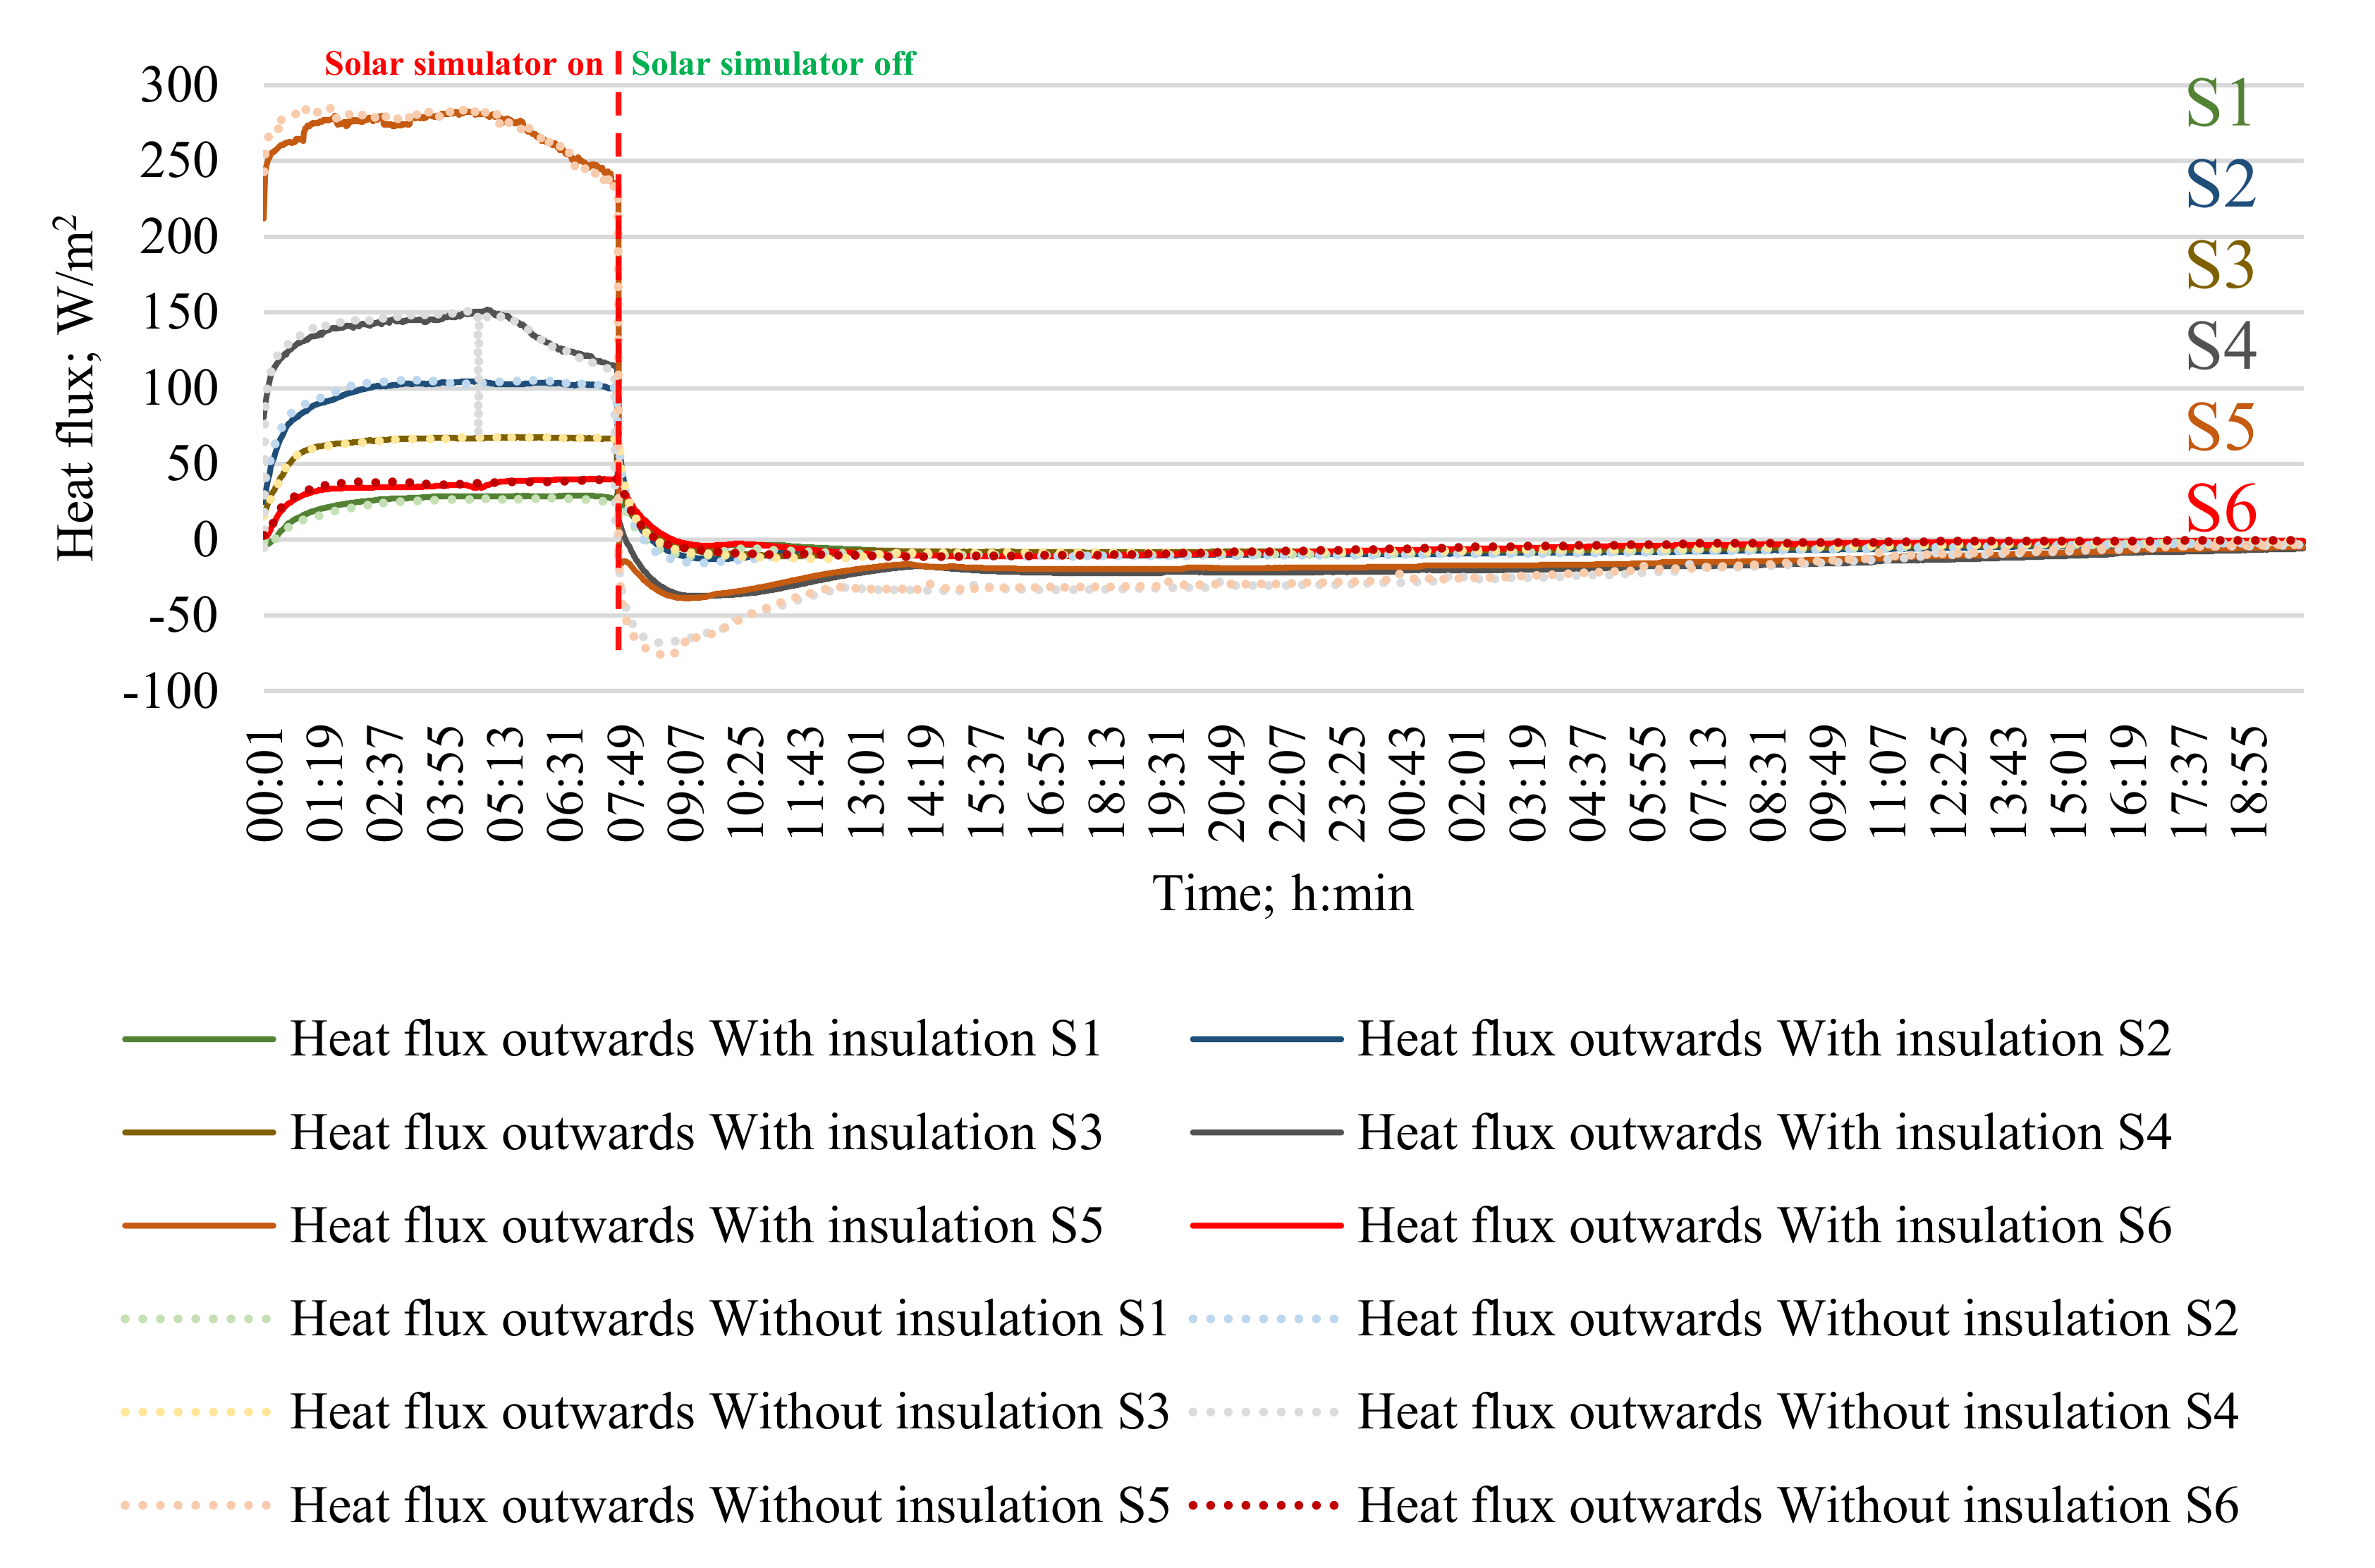
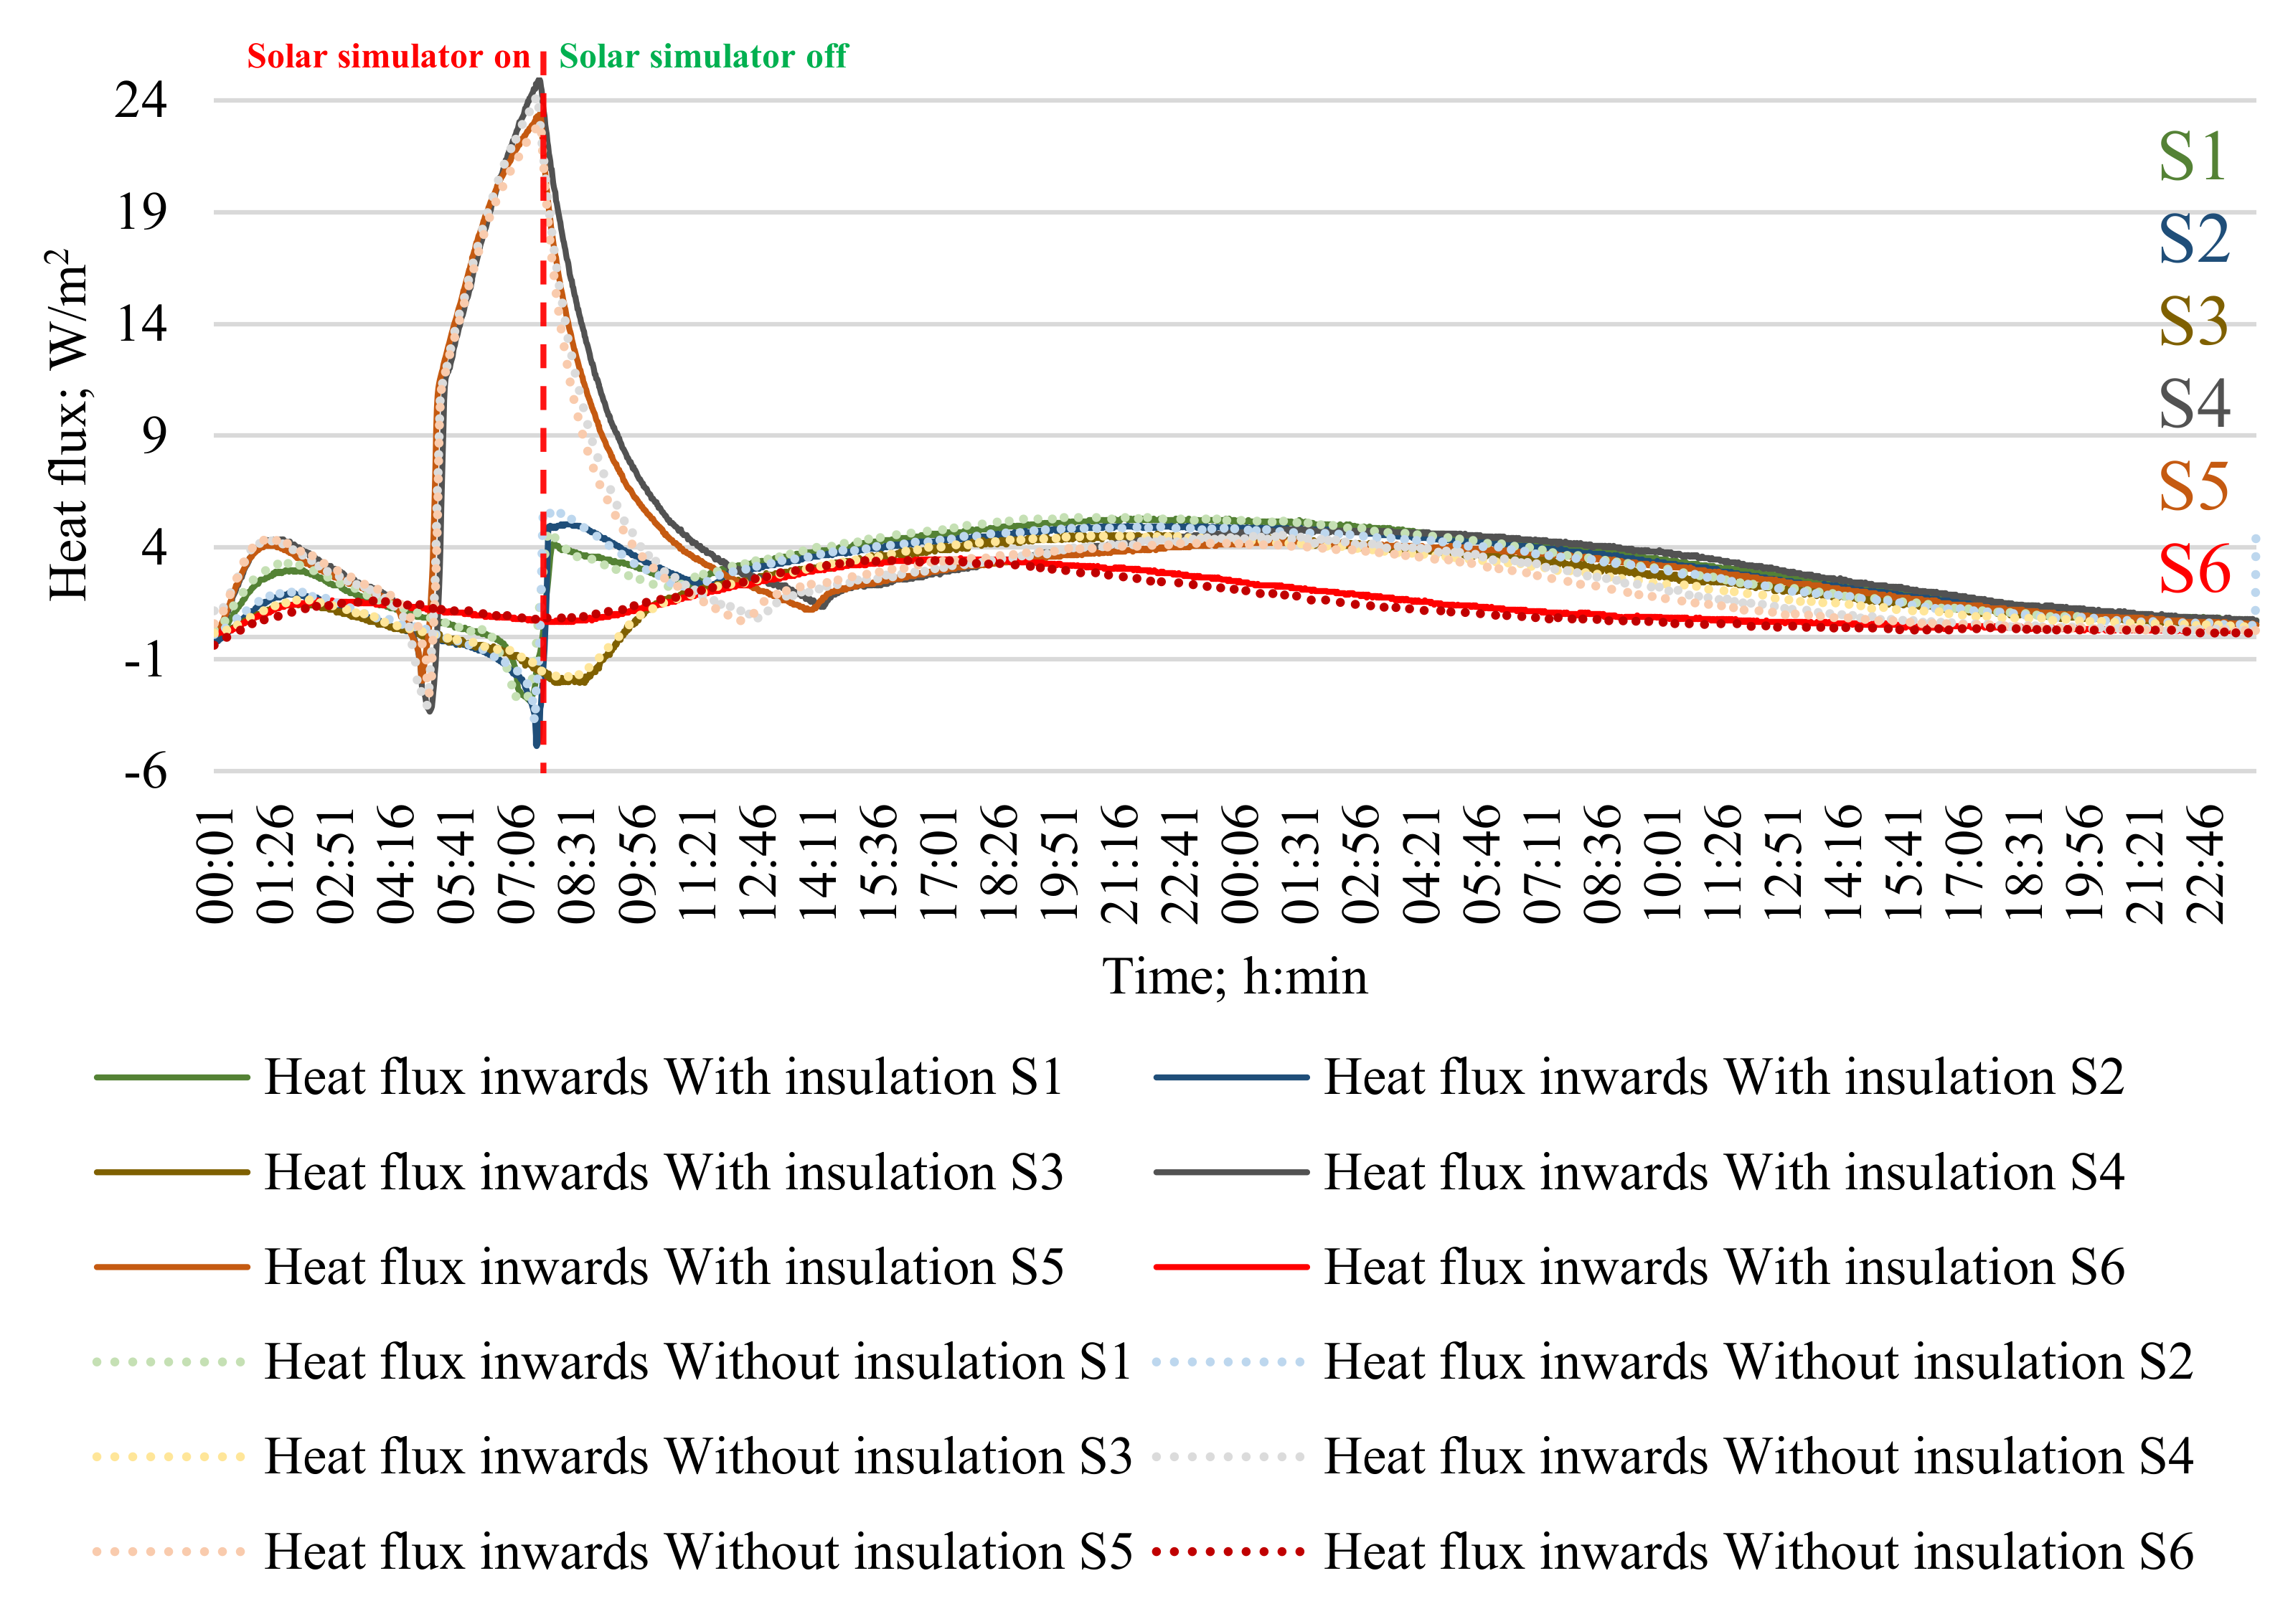
  • Heat flux graphs (inwards and outwards) are compared for six basic setups compiled—the performance of all setups with and without an adjustable insulation layer is compared.

3.1. Temperature and Heat Fluxes in Setups

The physical processes and transitions in detail are displayed in Figure 8. In the charging phase of the cycle, the temperature in PCM is raised from 10 °C to 18 °C in a linear manner gaining sensible heat. Then, the phase-change material starts to melt—the measured temperatures at different depths of PCM container start to differ due to melting proceeding faster in the upper part compared with in the lower part of the PCM. The increase of average temperature slows down after reaching 18 °C since, in some parts of the PCM, it has already melted and turned into liquid, and latent heat is being stored.
When the average temperature is above 23–24 °C, the phase change in the whole volume of PCM has ended, and sensible heat is gained. In discharging phase of the cycle, the average temperature drops after the lamp is switched off. The sensible heat gained above the melting state is lost (if any was gained), and at reaching the point of 22 °C, the solidification process starts releasing the latent heat.
The gradient of temperature drop at this stage decreases. In the next ~20 h, the temperature in phase-change material tends to reach the surrounding temperature of 10 °C. The “indoor space” temperature follows the same tendency as described for the average temperature in PCM. The only difference is that the temperature change gradient in the charging phase is steeper for the PCM average temperature curve; however, in the solidification phase, it is steeper for the “indoor space” temperature curve.
Figure 8, Figure 9, Figure 10, Figure 11, Figure 12 and Figure 13 illustrates a comparison of changes in average PCM(Tavg) and “indoor space” (Tin) temperatures as well as heat fluxes inwards and outwards with (W) and without (W/O) adjustable insulation layer applied during the discharging phase for all of the setups. The time of the charging phase is equal in both configurations (W and W/O) for all of the setups further on. After 7 h and 39 min, the discharging phase begins and differences between Setups with equal basic design can be observed.
Here, after losing the sensible heat, PCM enters the phase of discharging latent heat. At this point, it is noticeable that, with the adjusted layer of insulation, the cooling of PCM and indoor space is taking place at a slower rate, and PCM enters the solidification phase at a later point in time (see annex for close-ups). In the whole discharging phase, the temperature drop in the configuration with adjusted insulation is delayed.
At the end of the charging–discharging cycle in S1 (Fresnel lens + Cone + Aerogel), the average PCM temperature, as well as the “indoor space” temperature, is, respectively, 0.8 and 0.5 °C higher in configuration with the adjustable insulation layer (see Appendix A for close-up Figure A1). The solidification phase of PCM starts 30 min later in this configuration (Figure 8). The maximum temperature difference in PCM is 1.0 and 0.8 °C in the “indoor space”. Comparison of heat fluxes in configurations with and without an adjustable insulation layer shows that the inwards heat flow is higher, yet the outwards flux is lower in the case when the insulation layer is used. This tendency is observed in all of the setups.
Figure 9, Figure 10, Figure 11 and Figure 12 show the average PCM and “indoor space” temperature comparison, and Figure 13 and Figure 14 illustrate inward and outward heat flux comparison in all of the setups with (W) and without (W/O) adjustable insulation layer.
In S2 (PMMA + Cone + Aerogel) at the end of the charging–discharging cycle in the configuration with the adjusted layer of insulation, both the average temperature in PCM and the temperature in “indoor space” is 0.3 °C higher compared to the layout without an adjustable insulation layer. Sensible heat above melting temperature is not gained in S2, PCM has not entirely melted, and the solidification process starts right after the solar simulator is switched off. The maximum temperature difference in PCM and “indoor space” is 1.1 and 1.0 °C, respectively.
At the end of the charging–discharging cycle in S3 (Fresnel lens + Air gap), the average PCM temperature is 1.2 °C higher but the “indoor space” temperature is 0.9 °C higher in configuration with the adjustable insulation layer. The PCM enters the solidification phase approximately 1 h and 30 min minutes later in this configuration. The maximum temperature difference in PCM is 3.0 and 2.1 °C in the “indoor space”.
In S4 (PMAA + Air gap) at the end of the charging–discharging cycle in the configuration with the adjusted layer of insulation average temperature in PCM is 1.3 °C higher, and the “indoor space” temperature is 1.0 °C higher. The solidification phase is delayed by 1 h and 35 min compared to the configuration with no insulation layer. The maximum temperature variation in PCM is 2.8 but 2.0 °C in “indoor space”.
The average temperature in PCM is 0.4 °C higher and the “indoor space” temperature is 0.3 °C higher in configuration with the adjustable insulation layer at the end of the charging–discharging cycle in S5 (Fresnel lens + Aerogel). In this setup, the time difference between both configurations for PCM to reach the solidification phase is insignificant—only 15 min. The maximum temperature variation in PCM is 0.7 and 0.5 °C in “indoor space”.
At the end of the charging–discharging cycle in S6 (PMMA + Aerogel), the average PCM temperature is 0.3 °C higher but the “indoor space” temperature is 0.2 °C higher in configuration with the adjustable insulation layer. The PCM enters the solidification phase approximately 30 min later in this configuration. The maximum temperature difference in PCM is 0.6 and 0.4 °C in the “indoor space”.
The measured outward heat fluxes show similar tendencies in all of the setups (Figure 13). Values above 0 indicate that the heat flows from outside into phase-change material, and values below 0 indicate the direction of heat flow is from PCM to the surrounding environment. At first, the heat flux rises and reaches its maximum capacity, and when PCM has changed its state from solid to liquid, the value of heat flux decreases. After the solar simulator is switched off, the heat flux changes its direction and values drop negative. When sensible heat is lost, the heat flux outward accelerates. However, when the solidification of PCM starts, the heat flux slows down (see Figure 8).
The tendency of the inward heat flux is similar in setups 1, 3, 4, and 6—there is a distinctive sensible heat phase observed after PCM has changed its state to liquid (see Figure 14). In setups 2 and 5, the inward heat flux values indicate heat flow from PCM to “indoor space”. Generally, at the beginning of the charging phase, the heat flow increases in the direction to indoor space but decreases when the phase change takes place. Heat flow to “indoor space” rapidly increases at the moment when PCM is melted and the sensible heat is gained. After switching off the solar simulator, the heat flux decreases until the sensible heat is lost; however, at the beginning of the solidification process, it starts to increase again. Heat flux continues to rise for 10–12 h and then gradually decreases until the end of the experiment.
In the following sections, a comparison of temperatures in PCM and “indoor space” as well as inward and outward heat fluxes are presented to inspect the impact of adjustable insulation layer usage on the outer surface of the solar wall module.

3.2. Comparison of Setups

Table 6 provides a summary of fixed average PCM (Tavg) and “indoor space” (Tin) temperatures after 24 and 48 h in setups with and without an adjustable insulation layer (parameters compared are assigned with the same colour). It can be seen that, after 24 h, PCM is in the phase of partial solidification. The value of Tavg in setups 1, 3, 4, 5, and 6 stays in a very narrow range of 0.4 °C without and 0.7 °C with the usage of the adjustable insulation layer. After 48 h, the range of average temperature in PCM is 1.0 °C in the configuration without the insulation layer; however, the range has become narrower in the case with the usage of the additional insulation layer, suggesting that the less insulated setups have benefited in “night-time” as their performance has improved.
Analysing the “indoor” temperature, a similar trend is seen—after 24 h, the temperature range without insulation layer is narrower compared to the temperature range with additional insulation used. After 48 h, the temperature range has become wider in configurations without the insulation layer, yet in setups with additional insulation, it has become insignificant. This emphasizes the impact of the adjustable insulation layer.
Cells coloured in grey summarize the temperature and time differences in each module in two configurations—with and without the adjustable insulation layer. Maximum delta T is determined by comparing the difference in average PCM and “indoor” temperature values in 24 and 48 h periods. The highest delta T is in S3 and S4—the setups with the air-gap layer in front of the PCM container. In addition, the time delay of PCM entering the solidification phase is the highest as well. This indicates that the impact of the adjustable insulation layer on modules with the air-gap layer is the highest. Heat loss is prevented during the discharging phase.
As setups 3 and 4 have the highest maximal temperature difference, the time delay in these setups is the highest as well in both of the configurations—with and without the adjustable insulation layer.
Table 7 presents rankings of the setups in every point of reference. The rank for every position differs. The least performing is Setup 2 in all of the points of reference. When ranking performance after 48 h with adjustable insulation, four setups share first place. Thus, adjustable insulation has served as an equalizer with a smaller impact on well-insulated setups and a higher impact on less insulated ones—this is confirmed with temperature differences in setups 3 and 4 as they rank the highest. Solar facades might be installed in different climates, different cardinal directions and their main function might differ as well.
Thus, for different applications, different setups might be the preferable choice. For example, setups 3 and 4 in tested conditions exhibit the fastest melting rate and highest temperatures, and this would be appropriate for surfaces where the time duration of solar radiation is shorter so the phase change can take place faster. On surfaces more exposed to the sun, other applications might serve better (or in combination with other setups) to avoid gaining sensible heat that raise the temperature above comfortable levels.

4. Conclusions and Discussion

To ensure a faster transition to decarbonised building stock, there is an urge for new building thermal envelope concepts ensuring both high energy efficiency and the use of on-site available energy. Constructions enriched with phase-change materials are a recent development thread with great potential that can allow the building envelope to become an active part of the building’s energy balance.
The research presented in the paper adds scientific knowledge in the field of composite thermal energy storage wall structures containing phase-change materials. In this study, the focus lies on the cooling phase of the diurnal energy gain and release. The experiment was prolonged to 48 h to observe the cooling phase in-depth. Six alterations of solar facade modules in two different configurations were tested. Modules explored combinations of aerogel, air gap, and Fresnel lenses for solar energy concentration. In the first configuration, the composition of modules remained the same throughout the experiment; however, in the second one, there was an adjustable insulation layer applied to the outer surface of the solar facade modules.
The following insights were gained:
  • As expected, the average temperature in the phase-change material and “indoor space” was higher when the adjustable insulation layer was applied in all of the alterations; however, the most significant impact on the average PCM and indoor temperature was in modules with an air gap layer compared with more insulated modules.
  • Modules with an air gap were more competitive among others (cone + aerogel and aerogel filling) as, after the solidification in the cooling phase, temperature splines in the graph lay closer together compared to modules without the adjustable insulation layer.
  • Thus, we concluded that, when looking at the whole cycle (charging and discharging), more energy was gained and released in modules with the air gap; however, modules with different insulation layers took advantage of the latent heat storage.
In the defined setup, the average PCM and indoor temperatures reached were high due to the small size of the modules and relatively low volume of PCM that set the limit of the total available stored energy capacity. Thus, in the next steps, we plan to enhance the model to a larger scale and perform the experiment in a relevant environment under real climatic conditions, thus, gaining insights on the impact of the proposed solar facade on the energy demand of the building.
Modules were compared in several points of reference—indoor temperature and the average temperature in PCM after 24 and 48 h and with and without an adjustable insulation layer. Furthermore, the highest temperature differences were analysed in setups to evaluate the impact of adjustable insulation. Combinations of different setups might be preferred depending on the purpose of the solar facade.

Author Contributions

The contributions of authors are as follows—conceptualization: R.V., R.F. and A.B.; methodology: R.V., R.F. and A.B.; experimental setup, experiment: R.V. and R.F.; formal analysis: R.V. and J.N.; investigation: R.V. and J.N.; data curation: R.V.; writing—original draft preparation: R.V. and J.N.; writing—review and editing: A.B. and J.N; visualization: R.V.; supervision A.B.; project administration: R.V.; funding acquisition: R.V. and A.B. All authors have read and agreed to the published version of the manuscript.

Funding

This study has been supported by Fundamental and Applied Research project “Smart building EnVElope with solaR Energy STorage (EVEREST)”, project No. lzp-2019/1-0363, funded by the Latvian Council of Science.

Institutional Review Board Statement

Not applicable.

Informed Consent Statement

Not applicable.

Data Availability Statement

The data presented in this study are openly available in Zenodo repository (10.5281/zenodo.5969896).

Conflicts of Interest

The authors declare no conflict of interest. The funders had no role in the design of the study; in the collection, analyses, or interpretation of data; in the writing of the manuscript, or in the decision to publish the results.

Appendix A

Figure A1. (Left) Close-up of average PCM temperature and “indoor” temperature at the beginning of the discharging phase where, after losing sensible heat, PCM entered a phase of discharging latent heat. With an adjusted layer of insulation, cooling is at a slower rate, and PCM enters the solidification phase at a later point in time. (Right) Close-up of the average PCM temperature and indoor temperature at the end of the charging—discharging cycle. With an adjusted layer of insulation, the average temperature in PCM is 0.5 °C higher and the temperature in the “indoor space” is 0.9 °C higher than in the sample without an adjustable insulation layer.
Energies 15 01158 g0a1

References

  1. European Commission. The European Green Deal; European Commission: Brussels, Belgium, 2019. [Google Scholar]
  2. European Commission. Clean energy for all Europeans. Euroheat Power 2019, 14, 3. [Google Scholar] [CrossRef]
  3. EU. Directive (EU) 2018/844 of the European Parliament and of the Council amending Directive 2010/31/EU on the energy performance of buildings and Directive 2012/27/EU on energy efficiency. Off. J. Eur. Union 2018, L 156, 75–91. [Google Scholar]
  4. EU. Directive (EU) 2018/2001 of the European Parliament and of the Council on the promotion of the use of energy from renewable sources. Off. J. Eur. Union 2018, 2018, 82–209. [Google Scholar]
  5. Sergei, K.; Shen, C.; Jiang, Y. A review of the current work potential of a trombe wall. Renew. Sustain. Energy Rev. 2020, 130, 109947. [Google Scholar] [CrossRef]
  6. Hu, Z.; He, W.; Ji, J.; Zhang, S. A review on the application of Trombe wall system in buildings. Renew. Sustain. Energy Rev. 2016, 70, 976–987. [Google Scholar] [CrossRef]
  7. Heidenthaler, D.; Leeb, M.; Schnabel, T.; Huber, H. Comparative analysis of thermally activated building systems in wooden and concrete structures regarding functionality and energy storage on a simulation-based approach. Energy 2021, 233, 121138. [Google Scholar] [CrossRef]
  8. Ručevskis, S.; Akishin, P.; Korjakins, A. Parametric analysis and design optimisation of PCM thermal energy storage system for space cooling of buildings. Energy Build. 2020, 224, 110288. [Google Scholar] [CrossRef]
  9. Luo, Y.; Zhang, L.; Bozlar, M.; Liu, Z.; Guo, H.; Meggers, F. Active building envelope systems toward renewable and sustainable energy. Renew. Sustain. Energy Rev. 2019, 104, 470–491. [Google Scholar] [CrossRef]
  10. Wang, Y.; Shukla, A.; Liu, S. A state of art review on methodologies for heat transfer and energy flow characteristics of the active building envelopes. Renew. Sustain. Energy Rev. 2017, 78, 1102–1116. [Google Scholar] [CrossRef]
  11. Jouhara, H.; Milko, J.; Danielewicz, J.; Sayegh, M.; Szulgowska-Zgrzywa, M.; Ramos, J.; Lester, S. The performance of a novel flat heat pipe based thermal and PV/T (photovoltaic and thermal systems) solar collector that can be used as an energy-active building envelope material. Energy 2016, 108, 148–154. [Google Scholar] [CrossRef] [Green Version]
  12. Wang, M.; Peng, J.; Li, N.; Yang, H.; Wang, C.; Li, X.; Lu, T. Comparison of energy performance between PV double skin facades and PV insulating glass units. Appl. Energy 2017, 194, 148–160. [Google Scholar] [CrossRef]
  13. Ibañez-Puy, M.; Martín-Gómez, C.; Bermejo-Busto, J.; Sacristán, J.A.; Ibañez-Puy, E. Ventilated Active Thermoelectric Envelope (VATE): Analysis of its energy performance when integrated in a building. Energy Build. 2018, 158, 1586–1592. [Google Scholar] [CrossRef]
  14. Diarce, G.; Urresti, A.; García-Romero, A.; Delgado, A.; Erkoreka, A.; Escudero, C.; Campos-Celador, A. Ventilated active façades with PCM. Appl. Energy 2013, 109, 530–537. [Google Scholar] [CrossRef]
  15. Laaouatni, A.; Martaj, N.; Bennacer, R.; Lachi, M.; El Omari, M.; El Ganaoui, M. Thermal building control using active ventilated block integrating phase change material. Energy Build. 2019, 187, 50–63. [Google Scholar] [CrossRef]
  16. Guo, J.; Dong, J.; Wang, H.; Jiang, Y.; Tao, J. On-site measurement of the thermal performance of a novel ventilated thermal storage heating floor in a nearly zero energy building. Build. Environ. 2021, 201, 107993. [Google Scholar] [CrossRef]
  17. Ghosh, A.; Norton, B. Advances in switchable and highly insulating autonomous (self-powered) glazing systems for adaptive low energy buildings. Renew. Energy 2018, 126, 1003–1031. [Google Scholar] [CrossRef]
  18. Sheikh, W.T.; Asghar, Q. Adaptive biomimetic facades: Enhancing energy efficiency of highly glazed buildings. Front. Arch. Res. 2019, 8, 319–331. [Google Scholar] [CrossRef]
  19. Arranz, B.; Ruiz-Valero, L.; González, M.P.; Sánchez, S.V. Comprehensive experimental assessment of an industrialized modular innovative active glazing and heat recovery system. Energy 2020, 212, 118748. [Google Scholar] [CrossRef]
  20. Zhang, S.; Hu, W.; Li, D.; Zhang, C.; Arıcı, M.; Yıldız, Ç.; Zhang, X.; Ma, Y. Energy efficiency optimization of PCM and aerogel-filled multiple glazing windows. Energy 2021, 222, 119916. [Google Scholar] [CrossRef]
  21. Schneider, A.K.M.; Kuhn, T.E. Building-Integrated Photovoltaics Moves from the Niche to the Mass Market Industrial Manufacture of Solar Building Components and Their Integration into the Building Planning Process Photovoltaic Building Components: Multiple Advantages for Building Owners PRESS RELEASE. Available online: https://www.ise.fraunhofer.de/content/dam/ise/en/documents/press-releases/2019/0719_ISE_e_PR_BIPV_final.pdf (accessed on 10 November 2021).
  22. Heier, J.; Bales, C.; Martin, V. Combining thermal energy storage with buildings—A review. Renew. Sustain. Energy Rev. 2015, 42, 1305–1325. [Google Scholar] [CrossRef]
  23. Kuznik, F.; Virgone, J.; Noel, J. Optimization of a phase change material wallboard for building use. Appl. Therm. Eng. 2008, 28, 1291–1298. [Google Scholar] [CrossRef] [Green Version]
  24. Lai, C.-M.; Hokoi, S. Thermal performance of an aluminum honeycomb wallboard incorporating microencapsulated PCM. Energy Build. 2014, 73, 37–47. [Google Scholar] [CrossRef]
  25. Silva, T.; Vicente, R.; Soares, N.; Ferreira, V. Experimental testing and numerical modelling of masonry wall solution with PCM incorporation: A passive construction solution. Energy Build. 2012, 49, 235–245. [Google Scholar] [CrossRef]
  26. Bhamare, D.K.; Rathod, M.K.; Banerjee, J. Numerical model for evaluating thermal performance of residential building roof integrated with inclined phase change material (PCM) layer. J. Build. Eng. 2019, 28, 101018. [Google Scholar] [CrossRef]
  27. De Gracia, A.; Navarro, L.; Castell, A.; Ruiz-Pardo, Á.; Alvárez, S.; Cabeza, L.F. Experimental study of a ventilated facade with PCM during winter period. Energy Build. 2013, 58, 324–332. [Google Scholar] [CrossRef]
  28. Gholamibozanjani, G.; Farid, M. A comparison between passive and active PCM systems applied to buildings. Renew. Energy 2020, 162, 112–123. [Google Scholar] [CrossRef]
  29. Soibam, J. Numerical Investigation of a Heat Exchanger Using Phase Change Materials (PCMs); NTNU: Trondheim, Norway, 2017. [Google Scholar]
  30. Ben Romdhane, S.; Amamou, A.; Ben Khalifa, R.; Saïd, N.M.; Younsi, Z.; Jemni, A. A review on thermal energy storage using phase change materials in passive building applications. J. Build. Eng. 2020, 32, 101563. [Google Scholar] [CrossRef]
  31. Lin, Y.; Alva, G.; Fang, G. Review on thermal performances and applications of thermal energy storage systems with inorganic phase change materials. Energy 2018, 165, 685–708. [Google Scholar] [CrossRef]
  32. Baetens, R.; Jelle, B.P.; Gustavsen, A. Phase change materials for building applications: A state-of-the-art review. Energy Build. 2010, 42, 1361–1368. [Google Scholar] [CrossRef] [Green Version]
  33. Sirmelis, R.; Vanaga, R.; Freimanis, R.; Blumberga, A. Solar Facade Module for Nearly Zero Energy Building. Optimization Strategies. Environ. Clim. Technol. 2019, 23, 170–181. [Google Scholar] [CrossRef] [Green Version]
  34. Mols, T.; Vanaga, R.; Blumberga, A. Solar Facade Module for Nearly Zero Energy Building. Extended Test Period. Environ. Clim. Technol. 2020, 24, 442–453. [Google Scholar] [CrossRef]
  35. Martínez, S.; Erkoreka, A.; Eguía, P.; Granada, E.; Febrero, L. Energy characterization of a PASLINK test cell with a gravel covered roof using a novel methodology: Sensitivity analysis and Bayesian calibration. J. Build. Eng. 2018, 22, 1–11. [Google Scholar] [CrossRef]
Figure 1. Conceptual design of a solar facade module consisting of a PCM container and heat transfer unit.
Energies 15 01158 g001
Figure 2. Charging phase with no insulation layer (a) and discharging phase with an insulation layer (b).
Energies 15 01158 g002
Figure 3. Schematic representation of six solar facade variations.
Energies 15 01158 g003
Figure 4. Small-scale PASLINK type test box.
Energies 15 01158 g004
Figure 5. Measuring equipment.
Energies 15 01158 g005
Figure 6. The experimental setup in the climate chamber (scheme).
Energies 15 01158 g006
Figure 7. The experimental setup in the climate chamber (Riga Technical University laboratory).
Energies 15 01158 g007
Figure 8. The “indoor space” and average PCM temperatures, inwards and outwards heat fluxes in Setup S1 (Fresnel lens + Cone + Aerogel) variations with (W) and without (W/O) an adjustable insulation layer.
Energies 15 01158 g008
Figure 9. The average temperature in phase-change material in six setups without insulation applied at night.
Energies 15 01158 g009
Figure 10. The average temperature in phase-change material in six setups with insulation applied at night.
Energies 15 01158 g010
Figure 11. “Indoor” temperature in six setups without insulation applied “at night”.
Energies 15 01158 g011
Figure 12. “Indoor” temperature in six setups with insulation applied “at night”.
Energies 15 01158 g012
Figure 13. Outward heat flux comparison in all of the Setups with (W) and without (W/O) an adjustable insulation layer.
Energies 15 01158 g013
Figure 14. Inward heat flux comparison in all of the Setups with (W) and without (W/O) an adjustable insulation layer.
Energies 15 01158 g014
Table 1. Experiment plan. Twelve setup variations.
Heat Transfer Unit VariationsCone + AerogelUnventilated Air GapAerogel Filling
Fresnel LensS1—W/OS3—W/OS5—W/O
Polymethyl methacrylate (PMMA)S2—W/OS4—W/OS6—W/O
Fresnel Lens + adjustable insulationS1—WS3—WS5—W
PMMA + adjustable insulationS2—WS4—WS6—W
W—with, W/O without an adjustable insulation.
Table 2. Components of the solar facade model.
ComponentCharacteristics
Phase-change material (PCM)RUBITHERM RT21HC
Melting area: 20–23 °C
Congealing area: 21–19 °C
PCM glass containerDimensions: 127 × 127 × 60 mm
Plastic boxMaterial: Polyethylene terephthalate glycol (PETG)
ConeMaterial: Polyethylene terephthalate glycol (PETG)
GlassDimensions: 129 × 129 × 4 mm
Poly (methyl methacrylate) PMMA glassDimensions: 127 × 127 × 1.5 mm
Fresnel lensDimensions: 127 × 127 × 1.5 mm Focal length: 71.12 mm
AerogelLUMIRA translucent aerogel LA1000
Table 3. Components of the small scale PASLINK test cell.
ComponentCharacteristics
Plywood15 mm λ = 0.13 W/mK
Mineral wool200 mm λ = 0.037 W/mK
Adjustable layer
XPS insulation
50 mm λ = 0.037 W/mK
Table 4. Specifications of the CMP and Kipp & Zonen pyranometer (based on the datasheet).
CharacteristicsValue
Spectral range (50% points)300 to 2800 nm
Sensitivity10 to 32 µV/W/m2
Response time20 s
Zero offset A<15 W/m2
Zero offset B<5 W/m2
Directional response (up to 80° with 1000 W/m2 beam)<20 W/m2
Temperature dependence of sensitivity (−10 °C to +40 °C)<4%
Operational temperature range−40 °C to +80 °C
Maximum solar irradiance2000 W/m2
Field of view180°
Table 5. Specifications of the Type K thermocouples.
CharacteristicsValue
Temperature range−270 °C to 1260 °C
Accuracy±2.2 °C or ±0.75%
Table 6. Highest and lowest average phase-change material temperature in solar facade module.
Without Adjustable Insulation Layer
Tavg
With Adjustable Insulation Layer
Tavg
Without Adjustable Insulation Layer
Tindoor
With Adjustable Insulation Layer
Tindoor
TavgTinTavgTin
Typet, °C
24 h
t, °C
48 h
t, °C
24 h
t, °C
48 h
t, °C
24 h
t, °C
48 h
t, °C
24 h
t, °C
48 h
Max Δt, °C
24 h
Max Δt, °C
24 h
Max Δt, °C
48 h
Max Δt, °C
48 h
Time Delay, min
Setup 1
Fresnel lens, cone, aerogel
20.111.820.412.617.411.717.812.20.980.780.770.4930
Setup 2
PMMA, cone, aerogel
16.010.617.010.914.710.515.510.91.070.930.320.32-
Setup 3
Fresnel lens and air gap
20.011.120.812.317.511.018.212.23.022.131.200.9190
Setup 4
PMMA and air gap
20.211.521.012.718.211.418.812.22.821.981.291.0095
Setup 5
Fresnel lens and aerogel
20.211.920.312.317.911.718.012.20.730.510.410.2815
Setup 6
PMMA and aerogel
20.412.120.612.418.011.918.112.10.580.440.330.2130
Table 7. Ranking of setups in defined points of reference.
Without Adjustable Insulation LayerWith Adjustable Insulation LayerWithout Adjustable Insulation LayerWith Adjustable Insulation LayerTavgTinTavgTin
TavgTavgTindoorTindoor
t, °Ct, °Ct, °Ct, °Ct, °Ct, °Ct, °Ct, °CMax Δt, °C
24 h
Max Δt, °C
24 h
Max Δt, °CMax Δt, °CTime Delay, min
24 h48 h24 h48 h24 h48 h24 h48 h48 h48 h
Setup 13342525144333
Fresnel lens, cone, aerogel
Setup 2566565633354-
PMMA, cone, aerogel
Setup 32411131122111
Fresnel lens and air gap
Setup 44524442111222
PMMA and air gap
Setup 52254224155454
Fresnel lens and aerogel
Setup 61133313266563
PMMA and aerogel
Ranking of the performance: 1—best (green); 2—good (light green); 3—medium high (yellow); 4—medium low (light orange); 5—bad (orange); 6—worst (red).
Publisher’s Note: MDPI stays neutral with regard to jurisdictional claims in published maps and institutional affiliations.

