Article

Experimental Performance Evaluation of an Integrated, LCPV/T Membrane Distillation System for Electricity and Seawater Desalination

1
Institute of Geographic Sciences and Natural Resources Research, Chinese Academy of Sciences, Beijing 100101, China
2
Energy Research Institute of National Development and Reform Commission, Beijing 100038, China
3
School of Energy, Power and Mechanical Engineering, North China Electric Power University, Beijing 102206, China
4
Beijing Science and Technology Innovation Research Center, Beijing 101117, China
*
Author to whom correspondence should be addressed.
Energies 2022, 15(24), 9641; https://doi.org/10.3390/en15249641
Submission received: 22 October 2022 / Revised: 30 November 2022 / Accepted: 12 December 2022 / Published: 19 December 2022

Abstract

:
In this paper, an integrated system based on low-concentrated photovoltaic/thermal (LCPV/T) technology and efficient vacuum membrane distillation (VMD) seawater desalination utilizing the energy of solar is established. Through a theoretical analysis and a series of experiments, this paper explores the temperature change of a single VMD process, and the variation trend of single-day membrane flux with solar irradiation and temperature parameters. In addition, the changes in solar irradiation, temperatures of the integrated system, membrane flux, and thermoelectric properties in different seasons are also analyzed. A mathematical model was established to calculate the relationship between membrane flux and temperature difference. The experimental results show that the membrane flux of VMD is 2.73 L/(m2·h); the simulated seawater can achieve a desalination rate of 99.9%. After economic analysis, the operating incomes of the system under sunny weather conditions in different seasons were all positive.

1. Introduction

Membrane distillation (MD) is a seawater desalination technology with high industrial potential. It is a heat membrane separation method that uses a microporous hydrophobic membrane to extract water vapor from its hot feed liquid. There are four forms of MD: direct contact membrane distillation (DCMD), air gap membrane distillation (AGMD), vacuum membrane distillation (VMD), and sweeping gas membrane distillation (SGMD). Although MD has advantages, there are still drawbacks, such as large energy consumption in the MD process.
Solar energy has a good application prospect as the driving heat source of MD. The typical desalination ways by using solar energy include solar pond [1], solar still [2], and membrane technology such as reverse osmosis and MD [3]. As separate membrane or thermal technology has disadvantages, the combination of the two technologies become gradually favored [4].
Kawtar et al. [5] developed a sustainable desalination system using a combination of DCMD and solar pond. Asaad et al. [6] built an experimental facility to examine and observe the performance of saline-gradient solar ponds before and after paraffin-covered ponds. Some scholars designed a photovoltaic panel and MD (PV-MD) combined technology, which uses solar energy as a driving heat source and solar radiation energy to drive MD to purify seawater to obtain fresh water. Achmad et al. [7] developed portable and hybrid solar MD systems that utilize PV and solar collectors. The results showed that the average and the maximum distillate output rate, respectively, are 11.53 L/h and 15.94 L/h. Rihab et al. [8] used the thermodynamic properties of the seawater model to execute a detailed exergy analysis of the solar VMD unit. The research proves that the combination of MD and solar energy can realize an effective supply of low temperature heat sources. Muhammad Burhan et al. [9] introduced a heat recovery scheme into the VMD module in the form of a multi-effect VMD operation; the performance of the VMD system under different operating conditions is analyzed in detail, and the system performance is studied from the component level by comparing single effect and multi effect operations. Rihab et al. [10] also selected four typical days to analyze the energy of the solar VMD system; the results presented that the maximum freshwater production obtained by the system is 17.68 (kg/h·m2) at the maximum feed temperature of 75 °C. Omar [11] proposed a tubular solar collector auxiliary solar still for seawater desalination and analyzed its exergy performance, environment, and economy. Qian Chen et al. [12] analyzed the thermal economy of a V-MEMD system to optimize the design and operation parameters and minimize the desalination cost. The thermodynamic and economic analysis of the system is carried out; the main results of the study are as follows: when the flow rate of seawater and cooling water is increased, the productivity and specific energy consumption will increase. The influence of feed flow is more significant, which can change the productivity and energy efficiency by more than 20%; and membrane cost and energy cost account for more than 80% of the final desalination cost, and their relative contribution depends on the change of energy price.
Cui et al. [13] electrically heated porous graphene sponge architecture supported by graphene foil (PGS/GF) with PV power generation, which had been heated by solar energy. As a result, the effect of solar energy-driven water evaporation was enhanced, and the highest water production rate was about 2.61 kg/(m2·h). Qian Chen [14] studied a decentralized water/electricity cogeneration system that combines a centralized photovoltaic/heat collector with a vacuum multi-effect membrane distillation system. Under the climate conditions in Mecca, Saudi Arabia, the system can convert about 70% of the solar irradiance into useful energy. The annual power generation and distilled water output per square meter of solar collector area are 562 kWh and 5.25 m3, respectively. Electricity and water production rates are affected by hot water flow, seawater feed flow and the size of the heat storage tank, while the overall exergy efficiency is stable at 25–27%. The multi-stage photovoltaic (PV) membrane distillation device designed by Wang [15] can use the waste heat of photovoltaic cells as energy to heat the evaporation interface and promote the evaporation process. Specifically, Wang [16] arranged a three-stage DCMD system at the bottom of the photovoltaic panel to enhance the evaporation, permeation, and condensation. In terms of experimental results, the average water production rate of the system is 1.96 kg/(m2·h) when the photovoltaic load is not connected. The concentrations of the ions in water production are below the WHO drinking water standards, which also validates the reliable desalination performance of the system. Nabil combined cooled concentrating PV modules with AGMD and designed an integrated system for desalination while producing electricity, and carried out constant flow in Port Said, Egypt [15]. The results show that the system can produce 19.58 m3 of freshwater per year, but the membrane flux of the experimental system is only 0.017–0.76 kg/(m2·h). Rihab built a 70 m2 solar collector field to heat the fluid of the MD module through the heat exchanger to produce freshwater [16]. Due to the high flow rate and large membrane area, the average daily water production in summer reaches 217 kg/day, and the average annual energy consumption for water production is 4.2–7.5 kWh/m3.
However, the above technology has a limited temperature increase, which cannot fully meet the requirements of the inlet water temperature of MD. Hence, scholars proposed to use solar photovoltaic/thermal (PV/T) technology to raise the water temperature and electric energy. Zarzoum et al. [17] set up a PV/T solar MD system, in which the membrane area is 10 m2 and the collector area is 2 m2. After the experiment, the maximum yield productivity is 15.2 L/h and the all-day yield productivity is 86 L. Muhsen et al. [18] studied the performance of concentrated PV/T system (CPV/T) coupled with DCMD. The results show that DCMD can produce 3 kg/(m2·h) of freshwater. Andrew et al. [19] proposed a seawater desalination system based on a CPV system and DCMD. The experimental studies showed that the average mass flux could reach 7.1 kg/(m2·h) even at a low membrane temperature difference of 18.82 °C.
Although the above studies have studied the coupled experiments on membrane distillation and solar energy, they mainly focus on the combination of MD and pure solar thermal or flat-panel solar photovoltaic panels. Few scholars try to couple PV/T systems with vacuum membrane distillation.
This paper attempts to establish a vacuum membrane distillation seawater desalination coupled with LCPV/T modules for heat-power cogeneration and seawater purification, and explore the water production performance, and desalination effect of the system under different solar irradiation and membrane tubes inlet temperatures. The paper also analyzed the quantitative relationship between the membrane water production rate and temperature difference on both sides of the membrane under a constant vacuum.

2. Experimental Methods

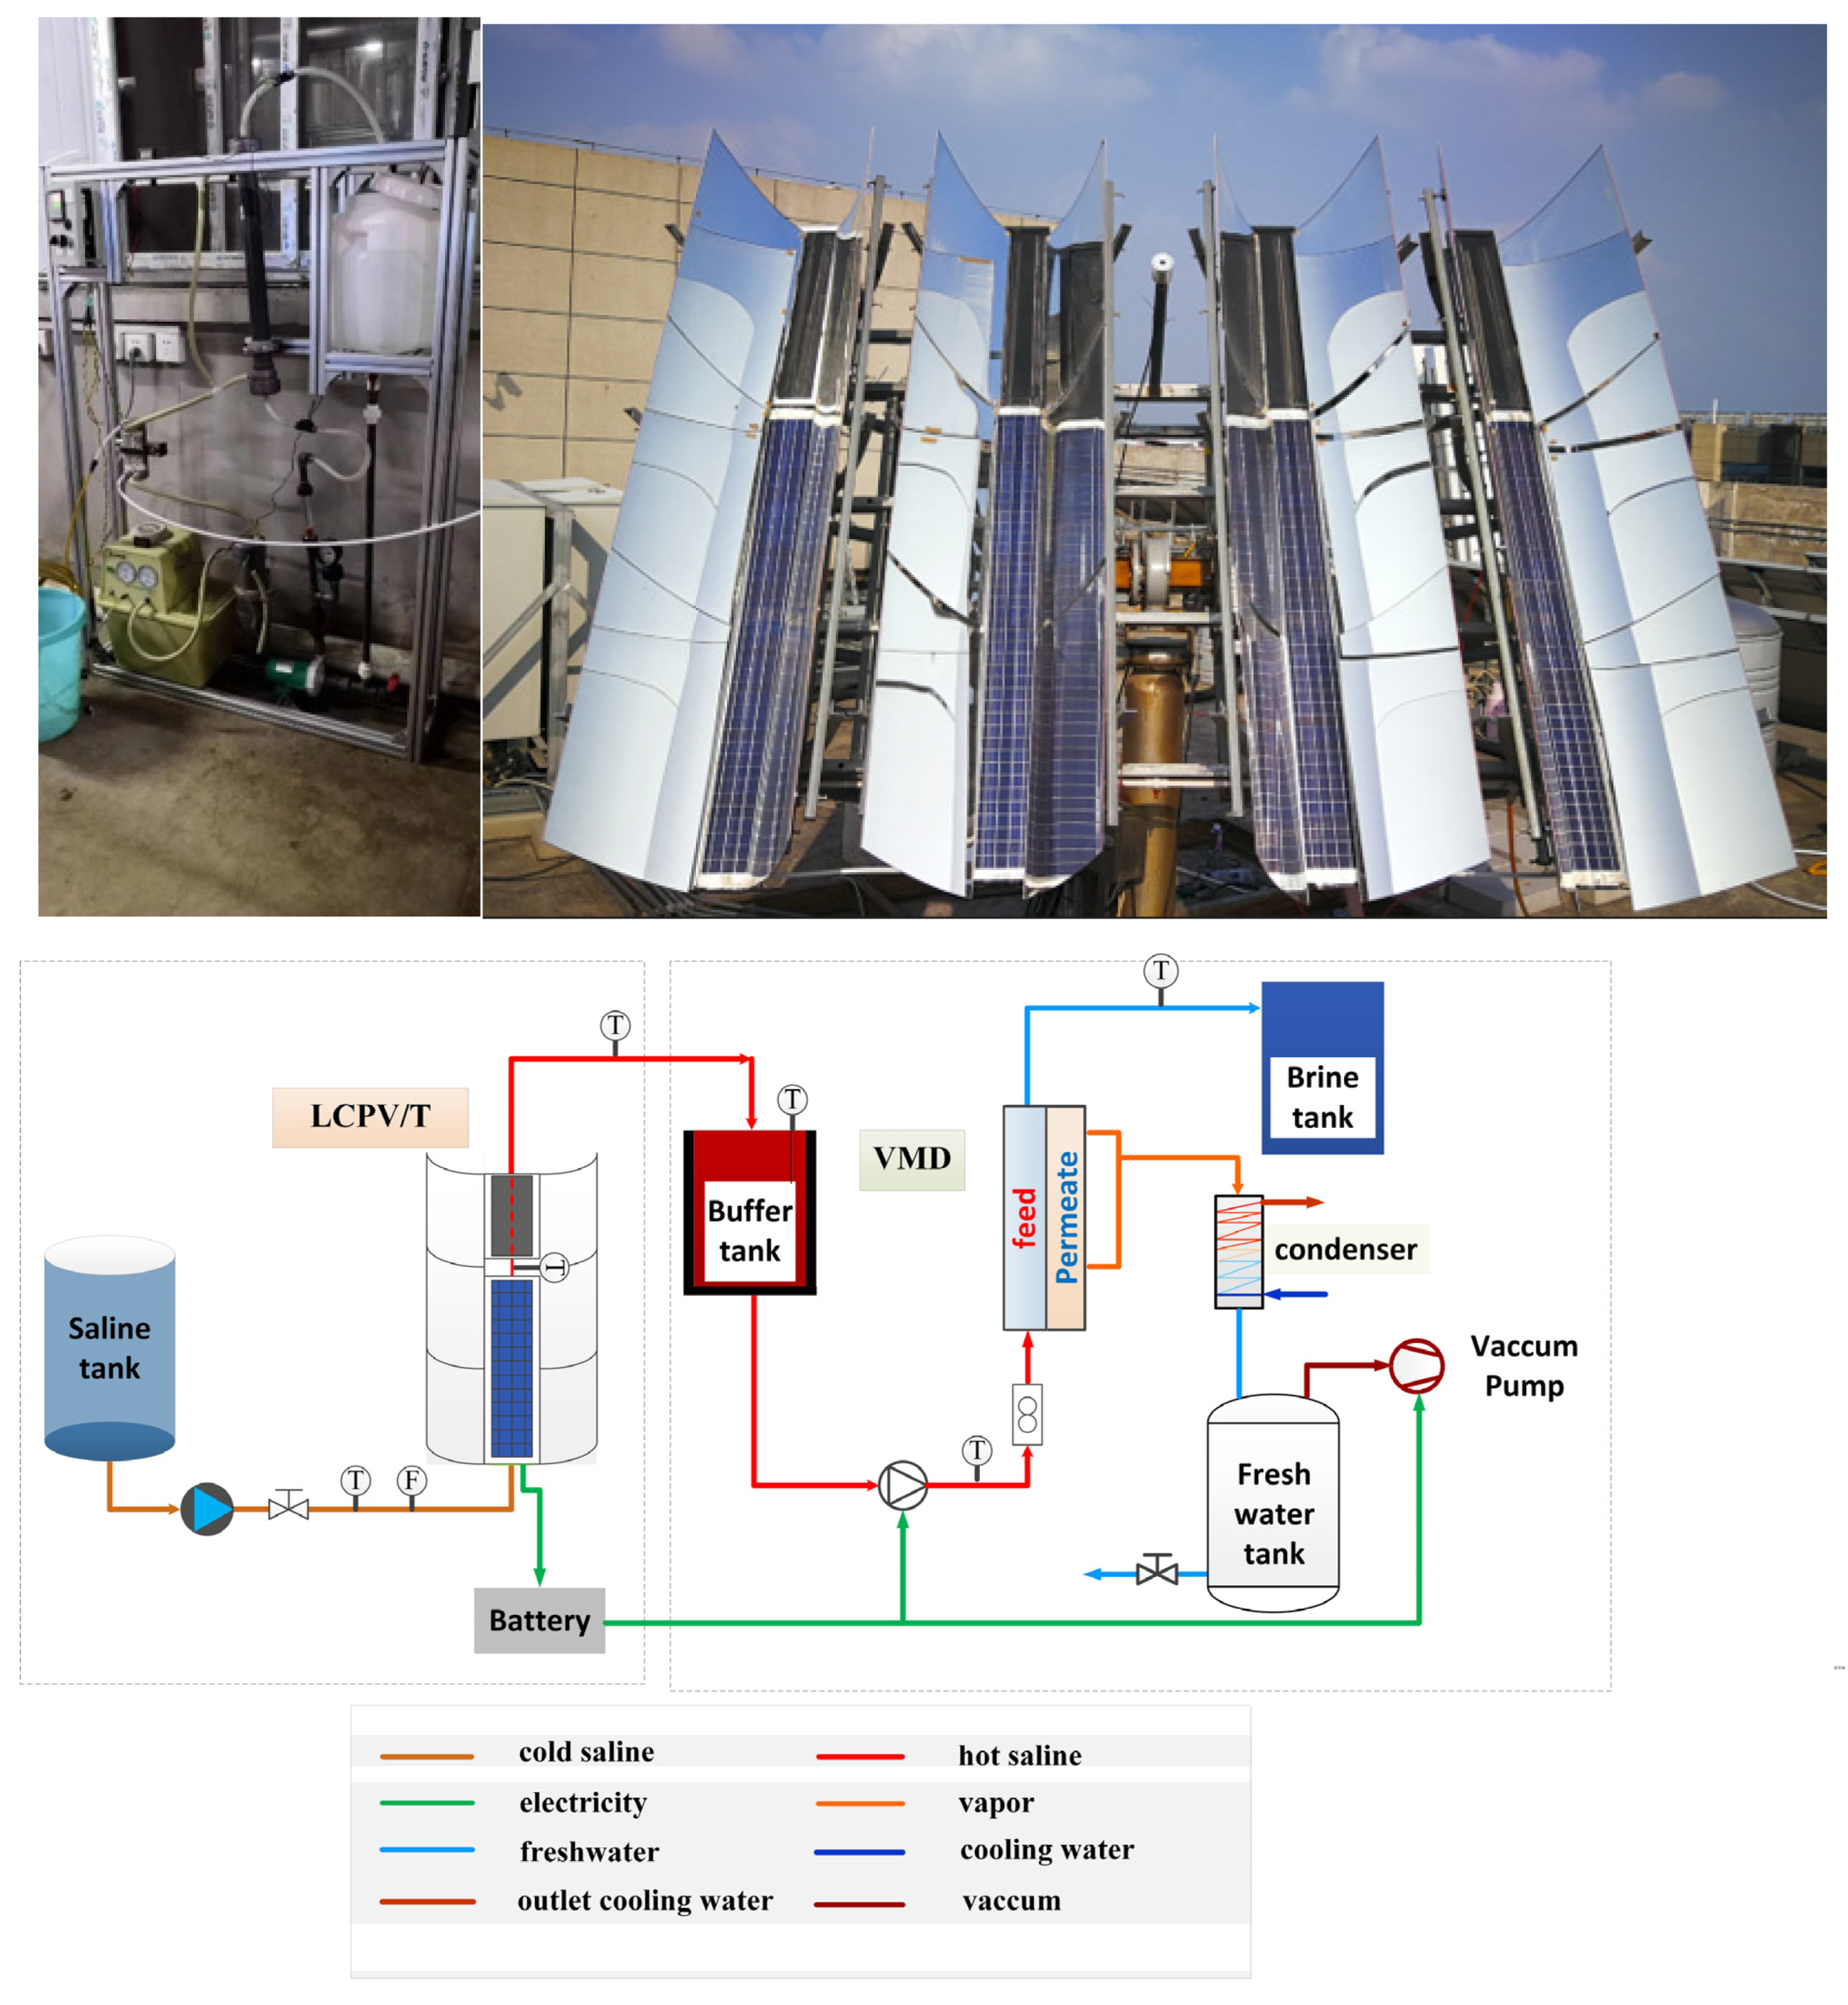
2.1. Overall System Setup

A schematic of the proposed portable LCPV/T-VMD system for desalination is depicted in Figure 1. The system consists of four PV panels arranged in series (rated power is 40 W for each), four composite parabolic condensers, saline water tank, hot water tank and important components of VMD. To simplify the processing, this schematic diagram only shows the structure of one LCPV/T unit and the solar thermal concentrator (STC) part. The detailed structural parameters and pictures of the LCPVT unit are shown in the paper published earlier by our research group [4,20]. Additionally, the system also includes a vacuum pump and two feed pumps. The MD unit is composed of a hollow fiber membrane. A large number of polytetrafluoroethylene (PTFE) hollow fiber membranes are installed in a 50 cm long tubular container made of chlorinated polyvinyl chloride (CPVC). Membrane filaments are characterized as 400 μm thickness, 48% porosity, and 0.08μm pore size. To prevent the excessive cooling water temperature from affecting PV power generation (Figure 1) the flow channel under STC without PV panels is adopted at the end of the module. Studies show that the inlet water temperature of MD should reach about 60–80 °C [21], which can have better water production performance. If the heating temperature of the concentrating module cannot meet this condition, the electric energy generated by the PV panel can be used for electric heating. Temperature data is collected by T-type thermocouples at different points in the system.
The physical diagram of the LCPV/T-VMD experimental system and instruments used are shown in the literature [4].

2.2. VMD Subsystem

VMD is a membrane separation process using latent heat of evaporation to realize phase transformation. The driving force is the vapor pressure difference between the two sides of the hydrophobic membrane. The VMD operation vacuum is generally between 0.07 Mpa and 0.095 Mpa to ensure that it is lower than the saturation pressure of volatile molecules (water molecules) in the feed solution. The schematic diagram of the buffer water tank and electric control cabinet is shown in Figure 2.

2.3. Mathematical Model and Evaluation Method

2.3.1. Mass Transfer Flux in VMD

VMD seawater desalination is a synchronous process of heat and mass transfer. In the mass transfer process, one of the key quantities is the vapor mass transfer flux in the membrane pore and the membrane flux (MF) calculation model is given as follows [22].
The definition of membrane permeation flux Ji is given by:
J i = B i Δ P i ,
where Bi is the membrane permeability of component i; Δ P i is the pressure difference between the two sides of the porous membrane; and Bi depends on the transport mechanism.
In the VMD scenario, the resistance to molecular diffusion is negligible for the trace air in the membrane pores [22]. The Knudsen number ( K n ) is an important indicator for judging the mass transfer model. For the membranes with larger pore size than the molecular mean free path, as seen when K n < 0.01 , intermolecular collisions will dominate because of the transmembrane hydrostatic pressure in VMD, and viscous flow (i.e., Poiseuille flow) will occur in the membrane pores. At this time, the viscous flow model should be used (refer to [4]). Under the VMD experimental conditions in this paper, when the membrane pore size is much smaller than the molecular mean free path, the Knudsen diffusion model can be used.

2.3.2. The Heat Transfer Model in VMD

The MD heat transfer process can be simplified as a one-dimensional steady heat transfer process, and the following calculation model is given:
q m = h m ( T f T p )
hm is the heat transfer coefficient, and W / ( m 2 · K ) is the process of MD seawater desalination. h m   is determined by membrane thickness, thermal conductivity, porosity, membrane material, and other factors.
In VMD, since the permeate side is in a near-vacuum state, the vapor-liquid boundary layer resistance on the permeate side and the transmembrane heat conduction through the membrane are negligible, so it can be considered that the heat flux on the feed-liquid side is all converted into the latent heat flux of evaporation. The total heat transfer equation is as follows:
Q f = Q v ,
i . e . ,   h f ( T b , f T m , f ) = J Δ H v .
Qf is the heat flux of the feed liquid thermal boundary layer; Qv is the heat flux corresponding to the latent heat of vaporization; hf is the heat transfer coefficient of the feed liquid side; T b , f is the main bulk temperature of the feed liquid side; T m , f is the membrane surface temperature on the feed liquid side; and Δ H v is the evaporation enthalpy of the permeating component.

2.3.3. Water Yield Rate and Desalination Rate

The calculation model of water yield in the MD process is as follows:
J = Δ m A m Δ t ,
where Δ m is water yield, Am is effective membrane area, and Δ t is the system uptime in hours.
As there is a linear relationship between the concentration and conductivity within a certain range of NaCl concentration, the ratio between them of saline water (seawater) can be considered constant within a certain range of salinity. Therefore, in the calculation of the desalination rate, the difference in conductivity can be directly replaced by the difference in concentration.
η = c f c c c f × 100 % = ρ f ρ c ρ f × 100 % ,
where η is desalination rate in MD process; cf is feed side concentration; cc is permeate side concentration; ρ f is feed liquid conductivity; and ρ c is permeate water conductivity.
In addition, the calculation models of the electrical efficiency and thermal efficiency have been shown in a previous research paper [22].

2.3.4. Thermoelectric Properties and Exergy Efficiency

For the working fluid in the LCPV/T module, it means that the exergy efficiency is closely related to the temperature of the working fluid. The definitions of electrical exergy efficiency, thermal exergy efficiency, and total exergy efficiency are given below.
Since the electrical exergy is pure, the calculation formula of electric exergy E e is consistent with the electric power.
E e = U m I m = η e ( r C G A P V )
The formula for calculating thermal exergy is as follows:
E t h = c p m ˙ f [ ( T L o u t T L i n ) T 0 · l n T L o u t T L i n ] ,
where T 0 is the reference temperature, that is, the dead state temperature, which is often taken as 298.15 K.
The electrical exergy efficiency ζ e is expressed as [23]:
ζ e = E e E s , e = U m I m ψ s ( r C G A P V ) = η e ψ s ,
where E s , e is the solar irradiation exergy on the PV panels; and ψ s is the solar energy exergy conversion coefficient; its calculation formula is shown below [24]:
ψ s = 1 4 3 · T 0 T s + 1 3 · ( T 0 T s ) 4 .
Here, the solar radiation outside the atmosphere is approximated as black body radiation [25], whereas the sun temperature T s is generally taken as 5760 K.
The definitions of thermal exergy efficiency ζ t h and overall exergy efficiency ζ o are as follows:
ζ t h = E t h E s , c = c p m ˙ f [ ( T L o u t T L i n ) T 0 · l n T L o u t T L i n ] ψ s ( r C G A c )
ζ o = E e + E t h E s , c = E s , e E s , c ζ e + ζ t h = A P V A c ζ e + ζ t h

2.3.5. Economic Evaluation

By constructing the LCPV/T- VMD seawater desalination system, the benefits can be embodied in the hot water produced by the system, the purified water produced by the VMD module, and the net electricity gained by the LCPV/T module during the operation period. Therefore, the economic evaluation method of system daily income is defined as below:
R t = ( w h · k h + w d · k d + P n · k e ) · t d .
Among them, Rt is the daily income of the solar-membrane distillation seawater desalination system in the month of operation; wh is the thermal power provided by the LCPV/T module per hour; kh is the comparable conversion price of hot water; wd is the hourly water production rate of the membrane distillation module; kd is the comparable conversion price of distillate; Ph is the hourly net power generation of LCPV/T modules; ke is the local comparable grid-connected electricity price; and td is the daily average operating hours of the LCPV/T in the operating month.

3. Results and Discussion

3.1. System Performance Analysis

3.1.1. Single VMD Process

A 30 min continuous seawater desalination experiment of the LCPV/T-VMD integrated system was carried out on a sunny and cloudless day in summer in Beijing. The water used in the experiment is manually prepared concentrated brine with a salt content similar to that of seawater. Figure 3 shows the inlet and outlet temperature change process of feed liquid and permeation side during VMD process.
According to the experiment’s results, when the vacuum pump starts, the vacuum degree increases from 0 to 90 kpa within 1 min and remains stable. At this time, the feed liquid outlet temperature of VMD decreases significantly. Since the saturation temperature corresponding to the stable vacuum pressure (about 47.7 °C) is much lower than the feed liquid inlet temperature, the VMD process begins to operate stably within 30 min.
During the VMD process, the outlet temperature of the feed liquid maintains a temperature difference lower than the inlet temperature by about 6.0 °C, which means that a part of the water vapor molecules in the feed liquid has passed through the membrane pores and entered the permeate side under the drive force of the pressure difference and released a large amount of vaporization latent heat. At the end of the experiment, the vacuum pump was turned off, then the original pressure difference was destroyed, so the temperature difference between the two sides was gradually narrowed to zero, which means the VMD process is terminated.
The temperature change of the cooling liquid in the heat exchanger is consistent with the change period of the feed liquid side of VMD process, indicating that the water vapor molecules exchange heat with the cooling liquid in the heat exchanger, and finally form a distillate.

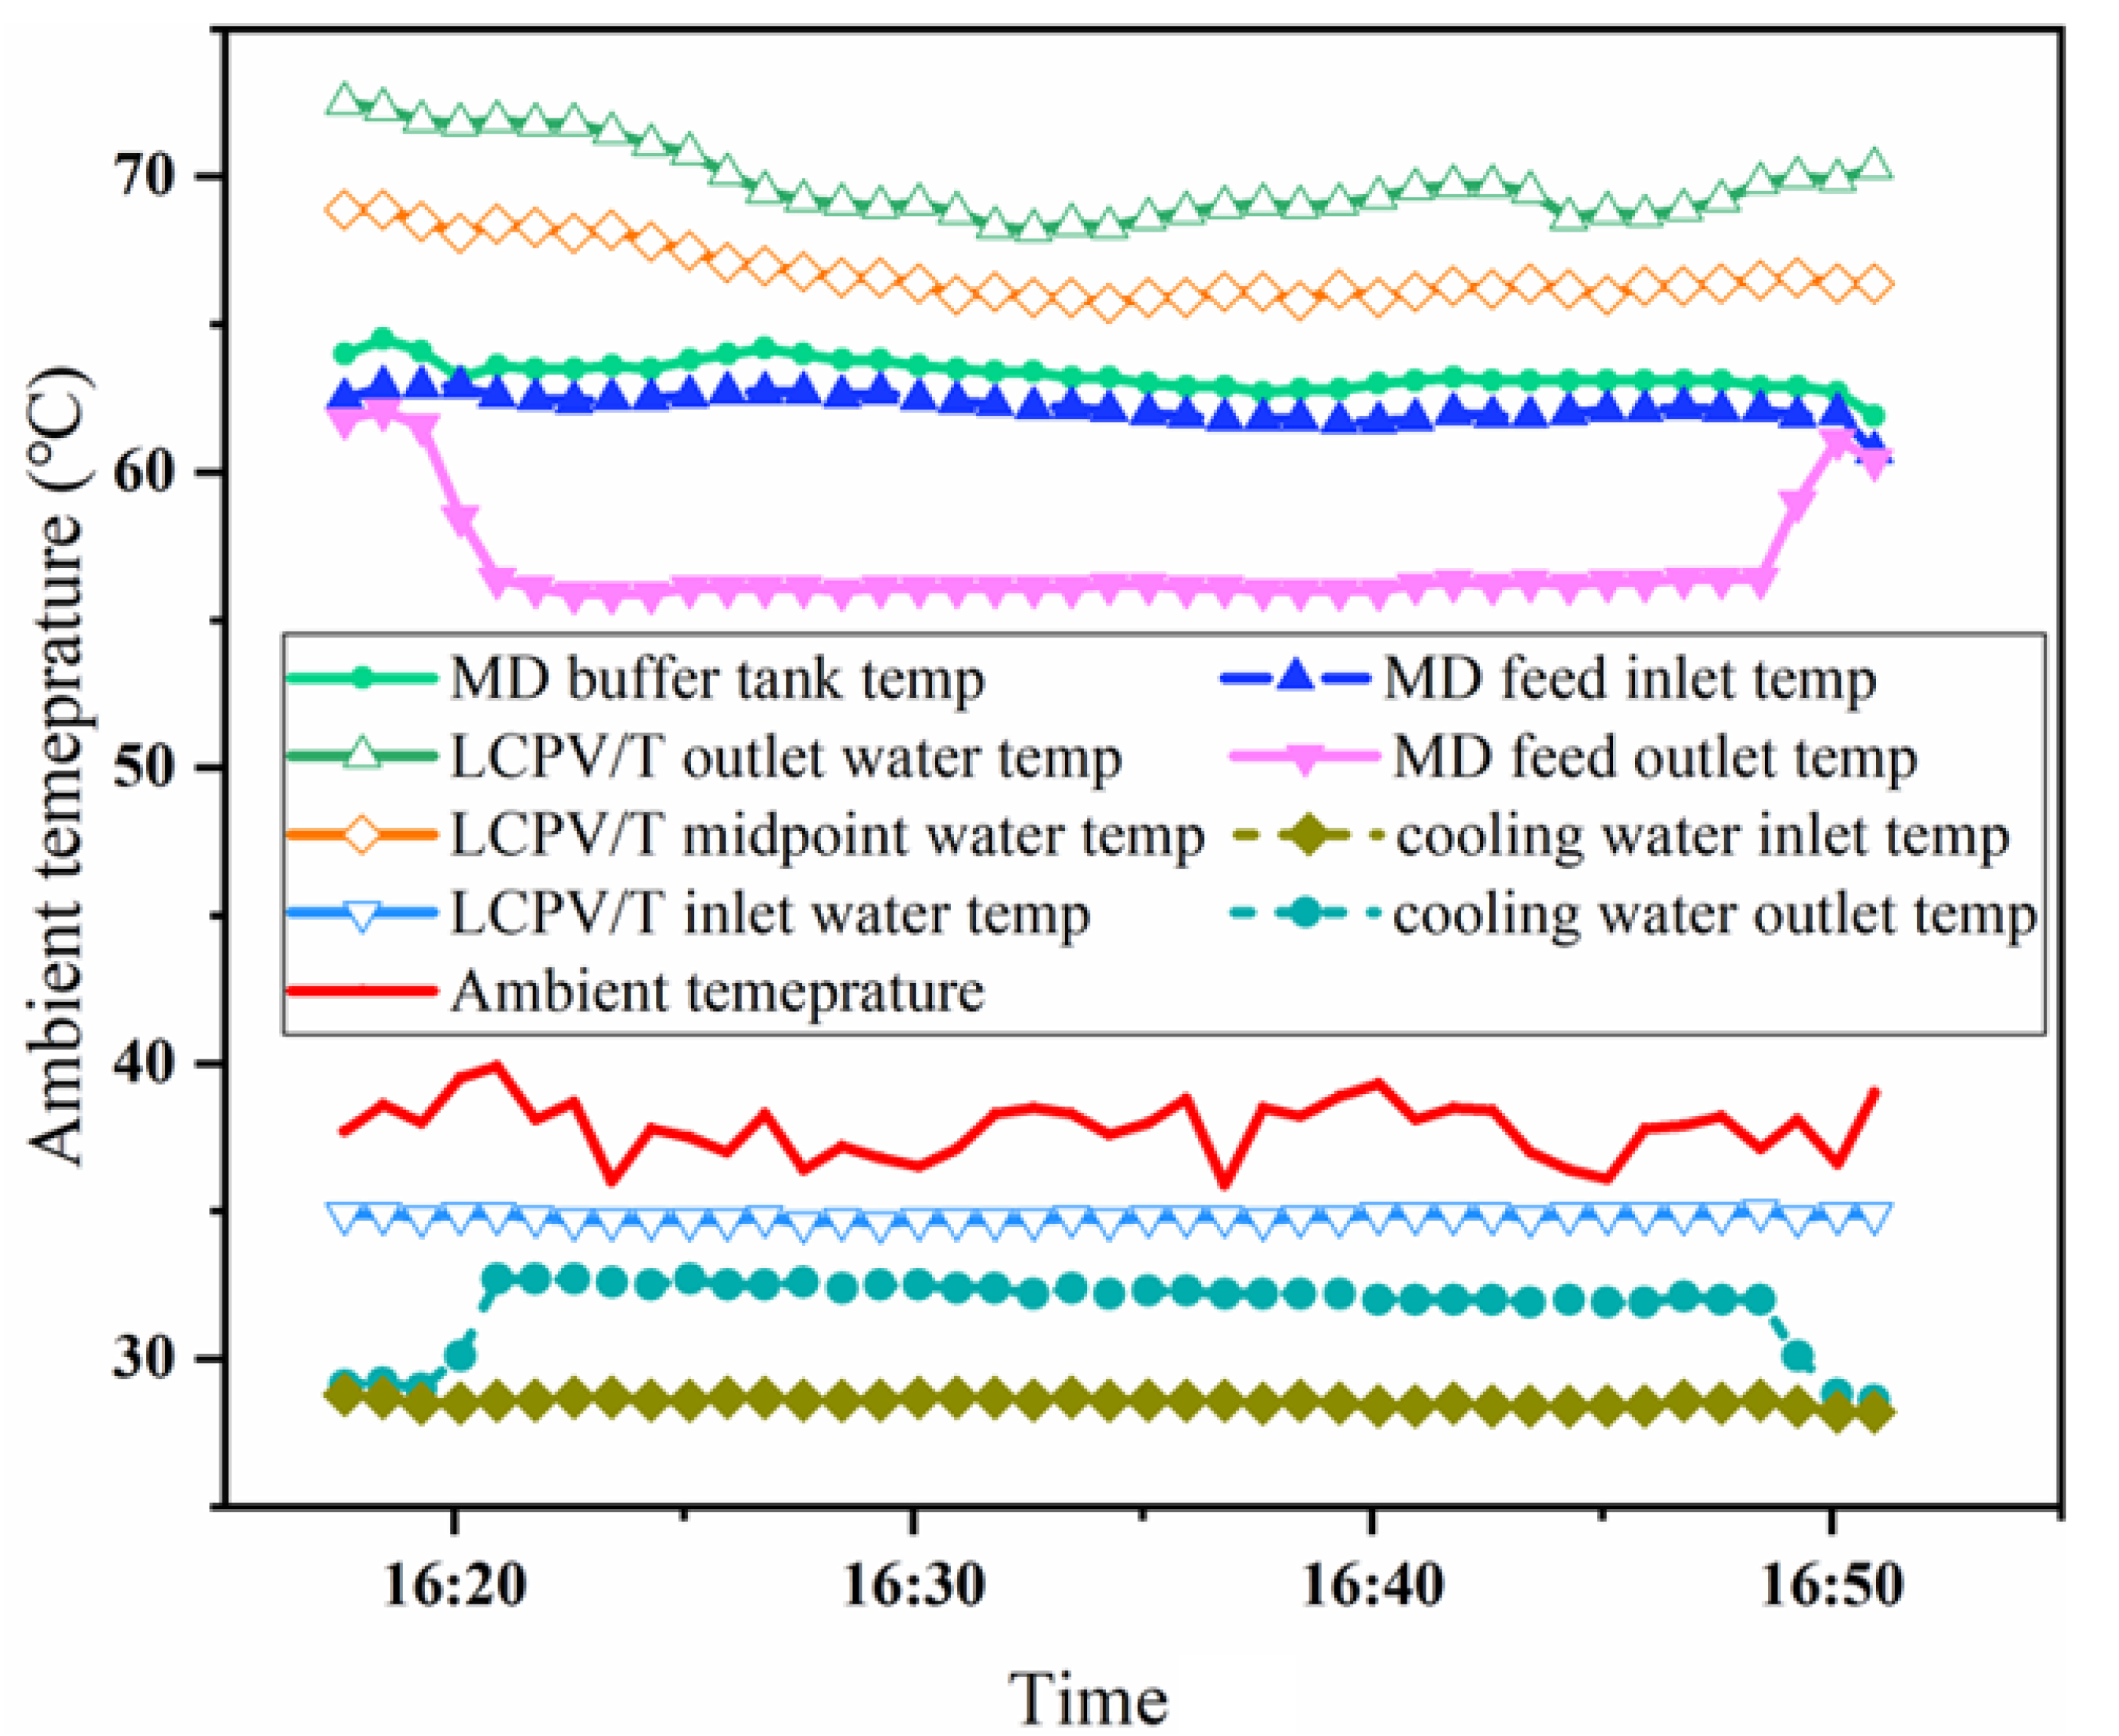
3.1.2. Two-Stage Heating in LCPV/T

Figure 4 shows the solar tracking irradiation and ambient temperature on an experimental day in August in Beijing, China. Each experiment lasts for 10 min. The figure also shows the average inlet and outlet water temperature of LCPV/T modules during the experiment. The variation trend of inlet water temperature and ambient temperature is similar, indicating that the inlet water temperature is greatly affected by the ambient temperature.
After two-stage heating by LCPV/T, the temperature of the working fluid can rise by more than 30 °C, and the average outlet temperature of the working fluid at noon is stable at more than 65 °C, with a maximum of 69.5 °C. This proves that two-stage heating through the flow channel design helps to increase the outlet water temperature to meet the requirements of VMD water temperature, and also verifies that the solar LCPV/T module can significantly absorb the heat from the PV panels and reduce the surface temperature. Additionally, the variations in outlet water temperature and solar tracking irradiance of LCPV/T modules are closely related. When the irradiation is in a stable state at noon (above 1000 W/m2), the outlet water temperature is also very stable. After 16:00, with the decrease of irradiation, the outlet temperature decreased significantly to 60 °C in 17:00.

3.1.3. Membrane Water Flux in VMD

Figure 5 shows the average inlet and outlet temperature of the VMD module on the experimental day, and the corresponding MF. On the day of the experiment, the highest MF of module was 2.73 kg/(m2·h) at 14:00; the lowest MF of module was 1.20 kg/(m2·h) at 17:00. The inlet water temperature dropped sharply after 16:00, and the pressure difference driving force corresponding to the temperature difference was insufficient.
The change of the two average temperatures of the feed liquid side reflects the gradual vaporization of the feed liquid and the release of the latent heat of vaporization. In the experiment, the vacuum degree on the permeate side can remain stable, so the vacuum pressure on the permeate side was stable, and the saturation temperature corresponding to this pressure was also fixed. Therefore, in the VMD experiment, when the vacuum degree and the feed flow rate are fixed, as the temperature of the feed liquid bulk continues to increase, the temperature difference between the two sides increases, and the MF gradually increased.

3.1.4. Thermoelectric Efficiency and Exergy Efficiency

In the experiment, the thermal efficiency of the system is much higher than the electrical efficiency. Figure 6 shows that the highest electrical and thermal efficiency is 9.7% and 73.3%, respectively. When the solar irradiation value gradually weakened in the afternoon, the thermal efficiency gradually increased. The phenomenon may be affected by the temperature uniformity of the cooling channels.
After the introduction of the exergy efficiency analysis, the thermal exergy efficiency is significantly lower than the electrical exergy efficiency. The thermal exergy efficiency is maintained at around 5%, which is lower than the electrical exergy efficiency, and the total exergy efficiency is up to 13.25%. The thermal performance parameters are correlated with MF at noon, which can corroborate the MF analysis in the previous section.

3.2. Seasonal System Performance

3.2.1. Seasonal Irradiation

Solar radiation has seasonal characteristics. Figure 7 shows the mean data of summer (Aug), autumn (Oct) and winter (Dec) for analyzing different seasonal meteorological conditions. The average solar tracking irradiation in summer at the location is strong and stable, basically maintained at about 1000 W/m2. The tracking irradiation in winter is lower than that of other seasons; the average irradiation is around 900 W/m2 and drops rapidly in the afternoon. The effective irradiation period in summer and autumn is longer than that in winter.

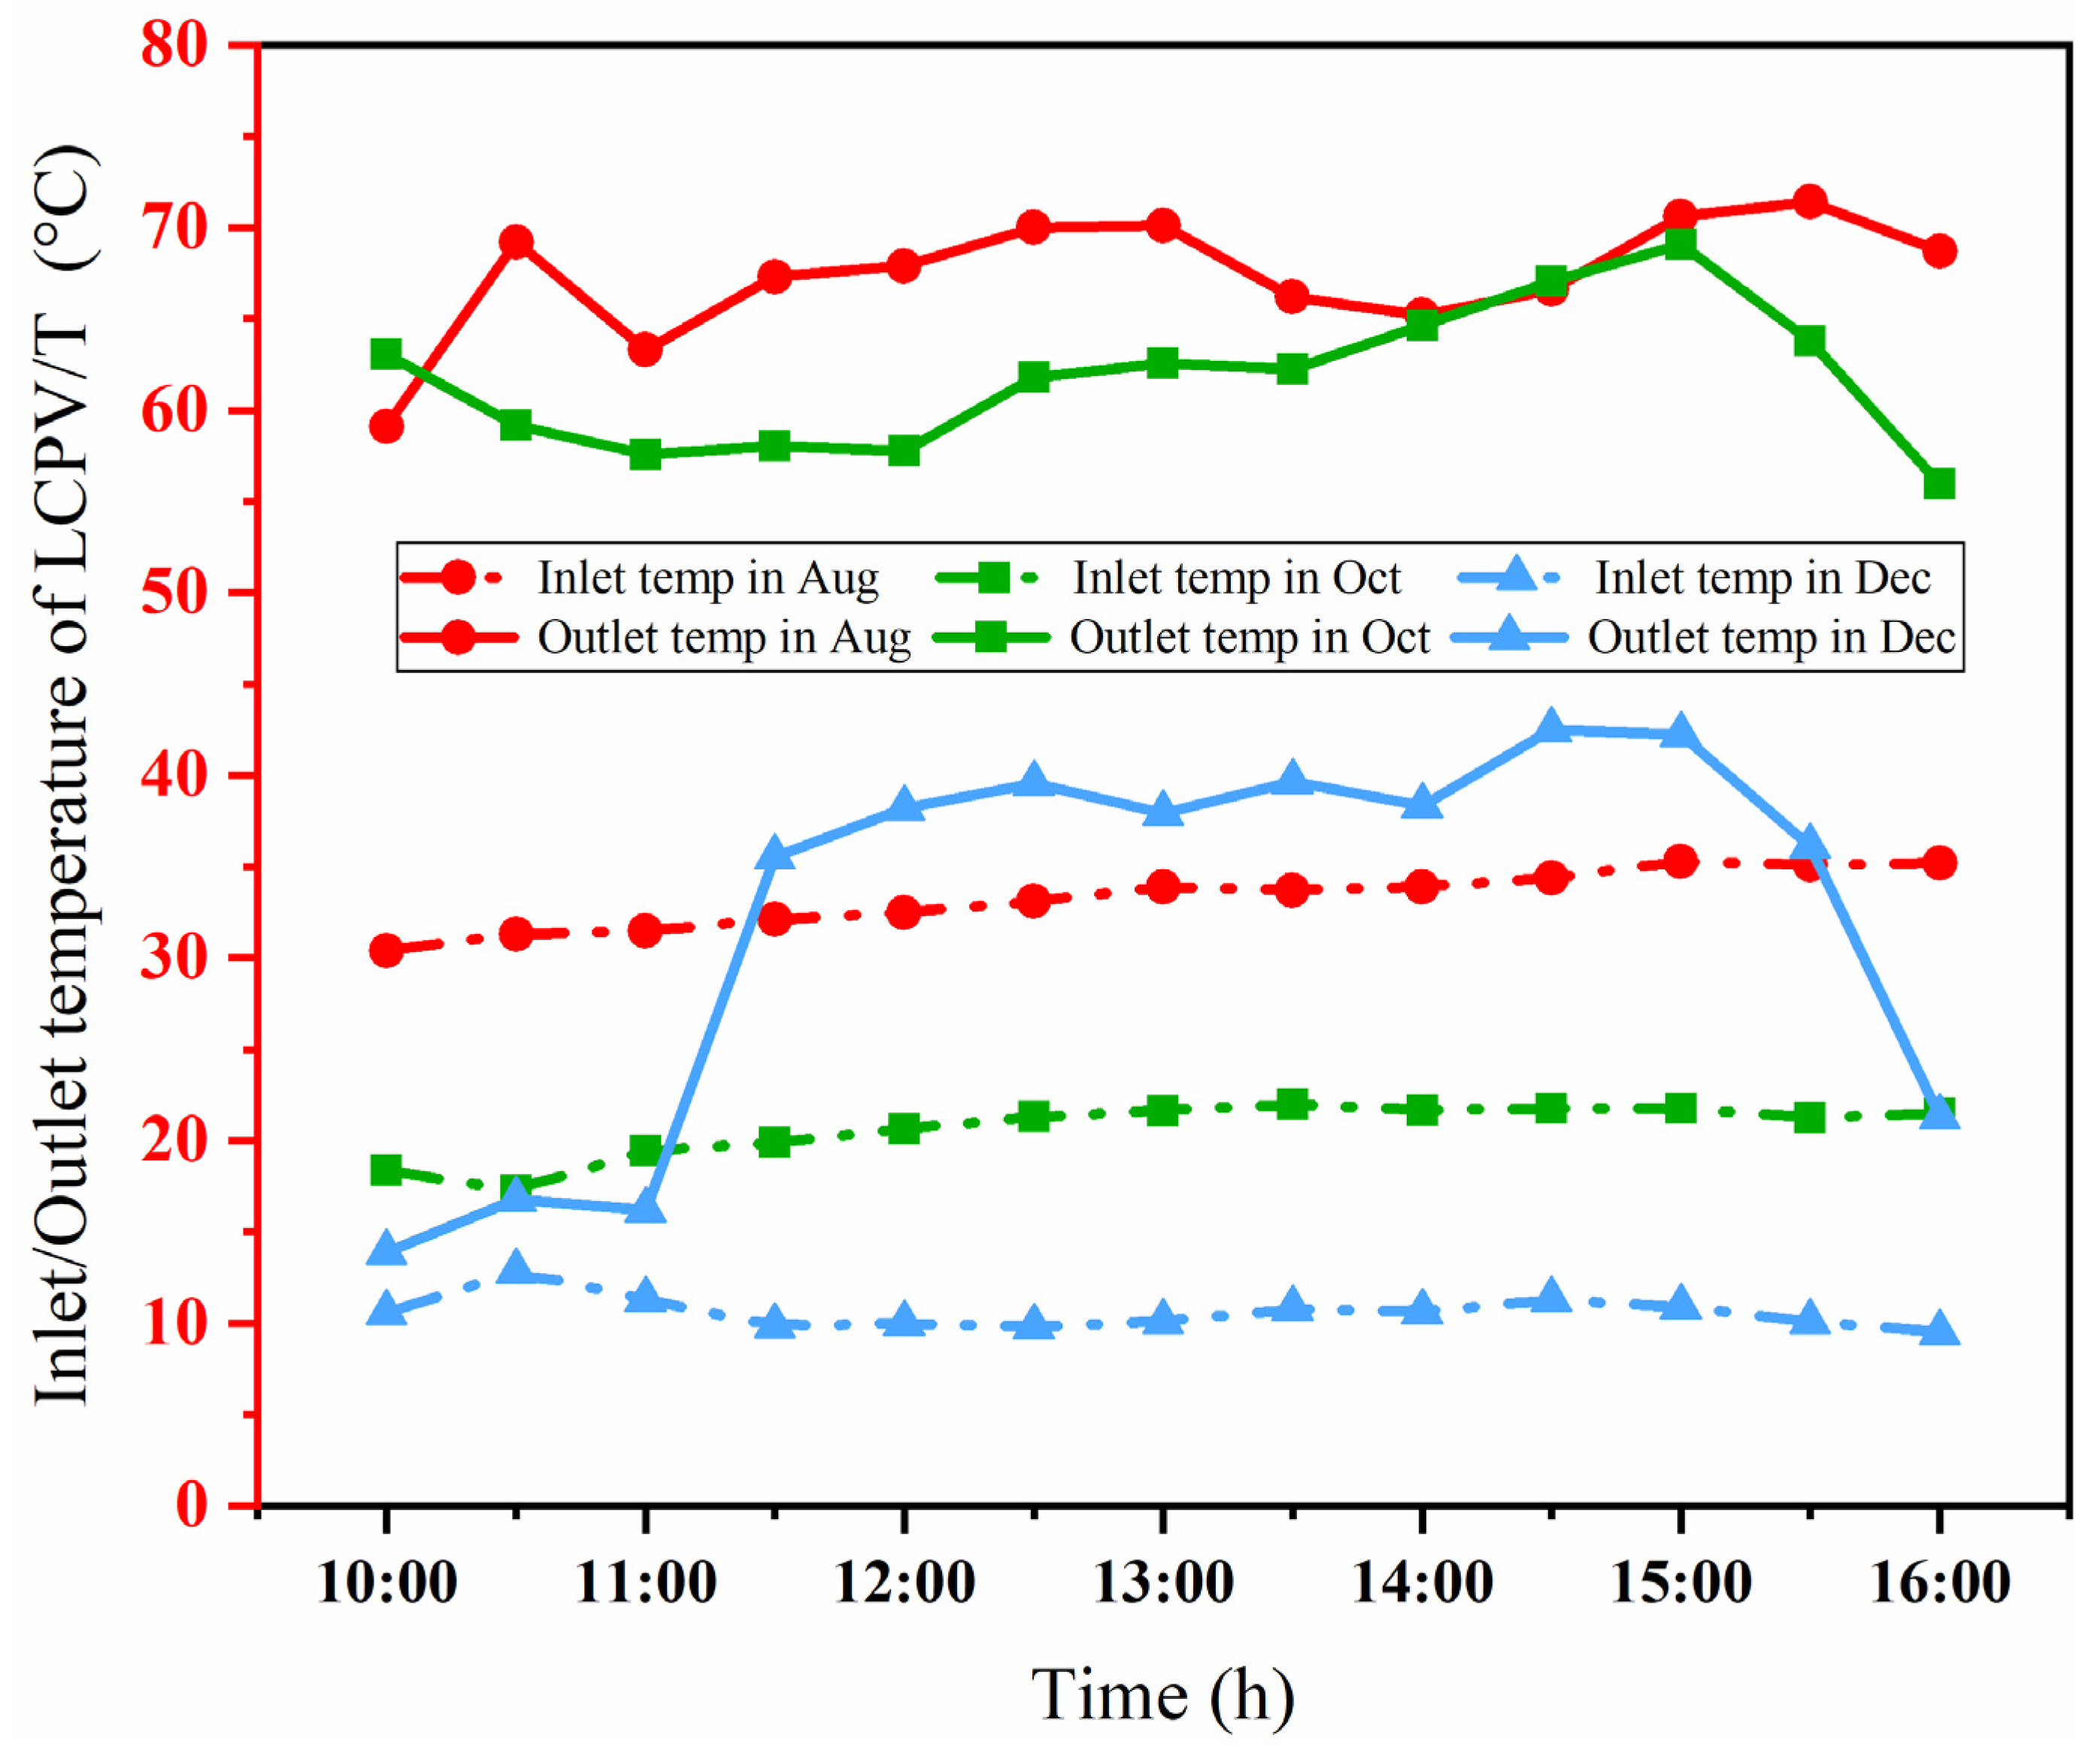
3.2.2. Seasonal Outlet Heating Temperature of LCPV/T

The changing trend of the average inlet and outlet water temperature of LCPV/T modules with seasons is shown in Figure 8. The average outlet temperature can be maintained above 65 °C in summer, with a maximum of 71.4 °C, which is beneficial for water desalination. The average outlet temperature in autumn is around 60 °C. Taking into account the heat loss along the tube, the heating water in summer and autumn can ensure the VMD process. However, the outlet water in winter is too low to ensure the process, and the high temperature period is also significantly reduced, so the auxiliary heating device needs to be turned on.

3.2.3. Seasonal Membrane Flux

Figure 9 shows the seasonal average MF with and without auxiliary heating (natural and auxiliary). The auxiliary heating mode means the temperature control device is set to 65 °C. The monthly average natural MF is significantly affected by the season, with the highest in summer, which is 1.71 kg/(m2·h). In winter, MF is zero due to the low temperature of the feed liquid.
In order to realize the effective operation of the VMD in autumn and winter, auxiliary heating was added. The average MF of the auxiliary mode in autumn reaches 1.85 kg/(m2·h), which exceeds the average MF in summer. While the winter auxiliary MF is 1.41 kg/(m2·h) for the considerable heat loss from buffer tank to environment.

3.2.4. Analysis of MF and the Membrane Temperature Difference

Experiments found that when other conditions remained unchanged, the MF and the water temperature difference between the two sides of the membrane showed a positive correlation. 48 groups of credible experiments are shown in Figure 10. The temperature difference of the membrane refers to the difference between the vapor–liquid surface temperature of the feed liquid side and that of the permeate side in MD. In the calculation, the feed liquid bulk temperature can be equal to the temperature of the feed vapor–liquid surface, and the saturation temperature corresponding to the permeate side pressure (at the vacuum degree of 90 kPa) can be approximated equal to the vapor–liquid surface temperature of the permeate side.
Through calculation and analysis, when the inlet temperature of the feed liquid is less than 70 °C, the Knudsen diffusion model applies to the system. Since the surface vapor pressure is a function of temperature, the MF Equation (1) is transformed to a univariate function that is only related to the feed liquid inlet temperature. Define x = T m , f T s a t , so the Equation (1) can be transformed into the following form:
J = B K Δ P b ( e x 19 1 ) ( T s a t + x 2 ) 0.5 .
T s a t can be calculated. This derived equation was fitted to the scatter in the above figure in Origin software. The fitting result shows that the constant b is 32.7, and the R2 value is 0.74, indicating that the regression fitting effect is good.

3.2.5. Seasonal Thermoelectric Performance

Table 1 shows the calculation results of the thermal and electrical efficiency, electrical and thermal exergy efficiency, and total exergy efficiency of the LCPV/T-VMD seawater desalination system in different seasons.
The above table shows that the average electrical performance of the system in winter (December) is higher than that in summer (August) and autumn (October), and the maximum average electrical efficiency and electrical exergy efficiency are 11.25% and 12.08%, respectively. Affected by the seasonal solar radiation and the heat absorption of the channels, the temperature of PV panels in summer and autumn is still higher than the average level in winter, which affects the electrical performance. Compared with thermal efficiency, thermal exergy efficiency more truly reflects the energy utilization efficiency of different grades. Overall, the average total exergy efficiency in summer is still the highest at 11.29%.

3.3. Membrane Desalination Performance

The experiment tested the desalination performance of the membrane module at different set temperatures. Tap water is used as the feed water, the vacuum degree is set to 0.09 MPa, and the temperature of the water tank is set to five target temperatures of 55 °C, 60 °C, 65 °C, 70 °C, and 75 °C through the temperature controller. During this period, the flow rate of the membrane module was controlled to be 25 L/h, and the cooling water flow rate was stable. The experimental results are shown in Table 2 below.
The desalination rate at different setting temperatures is above 96%. In the experiment using tap water as the water sample, the minimum conductivity of distillation water is 6.7 μS/cm, and the maximum value is 13.8 μS/cm, which meets the requirement of less than 10 μS/cm in the national standard of drinking water.
In addition, seawater simulation experiments were carried out. The saltwater with a salinity of 25 g/L is configured to simulate seawater, and the set temperature is heated to 65 °C. The experimental results show that the desalination rate of the hollow fiber VMD module for simulated seawater with high salinity can reach 99.94%, and the MF of the simulated seawater reaches 3.11 kg/m2·h, indicating that the membrane module has a reliable application prospect in seawater desalination treatment.

3.4. Power Generation Performance and Economy Analysis

The hourly average power generation and average power consumption of the system in different months are shown in Figure 11. Negative values represent equipment that consume electricity, such as vacuum pumps, heating devices, etc.; positive values represent power generation. It can be seen that under the condition of no auxiliary heating in summer and autumn, the system can meet the self-consumption demand and realize grid-connected power generation. In the auxiliary heating mode in autumn and winter, the power consumption increases significantly, and additional power consumption is required.
Table 3 shows the systemic economic indicator of average daily composite income (ADCI) by month. The thermal revenue is converted to the comparable price of gas, the freshwater revenue is converted to the comparable price of commercially distilled water, and the electricity revenue is converted to the price of grid-connected power generation.
From the table, it can be seen that the ADCI in summer (August) is the highest, which is 1.632USD per day. The ADCI of natural mode and mode were the same in autumn, about 0.877 USD per day. It can be considered that the benefit of the water production increment brought by electric heating is offset by the incremental cost of the auxiliary heating electricity consumption. In winter (December), the natural mode cannot be used. In the auxiliary mode, the ADCI is still positive, which is 20.336 USD per day.
To sum up, we can conclude that from the perspective of comprehensive income, the LCPV/T-VMD seawater desalination plant can adopt the natural mode in summer and autumn, and the auxiliary heating mode in winter. From the perspective of maximizing the MF, the auxiliary heating should be used in autumn and winter.

4. Conclusions

This paper constructs an operational VMD seawater desalination system based on LCPV/T technology. The conclusions are as follows:
(1)
The average outlet temperature of LCPV/T modules by two-stage heating can be maintained above 65 °C in summer, with a maximum of 71.4 °C, which is beneficial for water desalination. The outlet water in summer and autumn can ensure the VMD process. However, it is necessary to open the auxiliary device to heat the outlet water in winter.
(2)
In the summer tap water experiment, the maximum membrane flux of the membrane module is 2.73 kg/(m2·h) The desalination rate of the VMD module to the simulated seawater (25 g/L) can reach 99.94%, and the membrane flux of simulated seawater reaches 3.11 kg/(m2·h), which indicates that the membrane module can well realize seawater desalination treatment.
(3)
The natural membrane flux was significantly affected by the season; the highest in summer was 1.71 kg/(m2·h). To realize the effective operation of the membrane distillation module in autumn and winter, auxiliary heating is needed in autumn and winter. The autumn membrane flux by auxiliary heating is better than that in winter, and the highest value is 1.85 kg/(m2·h), which is higher than the average natural membrane flux in summer.
(4)
Compared to the different seasons, the average electrical efficiency of the system in winter is better than that in summer and autumn, while the average thermal efficiency and average total exergy efficiency in summer are higher than those in autumn and winter, and the maximum average exergy efficiency is 11.29%. Under sunny conditions, the average daily composite incomes of the system in different seasons are all positive, and the highest in summer is 11.67 CNY/day, indicating that the system has certain application prospects.

Author Contributions

Conceptualization, D.S. (Dan Su) and C.C.; Methodology, S.H., D.S. (Dongqi Sun) and C.C.; Formal analysis, S.H. and Y.Z.; Investigation, Z.L. and Y.Z.; Data curation, S.H. and Z.L.; Writing—original draft, S.H. All authors have read and agreed to the published version of the manuscript.

Funding

This work is financially supported by National Natural Science Foundation of China (CN) (52006063).

Conflicts of Interest

The authors declare no conflict of interest.

Nomenclature

Abbreviations
AGMDair gap membrane distillation
ADCIaverage daily composite income
CPVCchlorinated polyvinyl chloride
DCMDdirect contact membrane distillation
LCPV/Tlow concentrated photovoltaic/thermal
MDmembrane distillation
MFmembrane flux
PTFEpolytetrafluoroethylene
PVphotovoltaic
SGMDsweeping gas membrane distillation
VMDvacuum membrane distillation
Symbols
Ameffective membrane area, m2
APVPV panel area, m2
AcLCPV/T module total area, m2
Bmembrane permeability, mol/(m2s·Pa)
Cgeometric concentration ratio
cpspecific heat capacity of cooling liquid, J/(kg·°C)
cffeed side concentration, g/L
cdpermeate side concentration, g/L
Eeelectrical exergy, J
Eththermal exergy, J
Gsolar irradiation, W/m2
Δ H v evaporation enthalpy of the permeating component, J/mol
hfheat transfer coefficient of feed liquid side, W/(m2·K)
Jmembrane permeation flux, kg/(m2·h)
Δ m water yield, kg
m ˙ f mass flow of cooling liquid, kg/h
Δ P pressure difference between the membrane sides, Pa
Qfheat flux of the feed liquid side, W/m2
Qvheat flux of vaporization, W/m2
rreflectivity of LCPV/T module
Tb,fmain bulk temperature of the feed liquid side, °C
T L i n inlet temperature of LCPV/T channels, °C
T L o u t outlet temperature of LCPV/T channels, °C
Tm,fmembrane surface temperature on the feed liquid side, °C
Umvoltage in maximum power point, V
Imcurrent in maximum power point, A
Greek Letters
ζ e electrical exergy efficiency
ζ t h thermal exergy efficiency
ζ o overall exergy efficiency
ψ s solar energy exergy conversion coefficient
η desalination rate, %
ρ f feed liquid conductivity, μS/cm
ρ d permeate water conductivity, μS/cm

References

  1. Ruskowitz, J.A.; Suárez, F.; Tyler, S.W.; Childress, A.E. Evaporation suppression and solar energy collection in a salt-gradient solar pond. Sol. Energy 2014, 99, 36–46. [Google Scholar] [CrossRef]
  2. Joy, N.; Antony, A.; Anderson, A. Experimental study on improving the performance of solar still using air blower. Int. J. Ambient. Energy 2018, 39, 613–616. [Google Scholar] [CrossRef]
  3. Antonetto, G.; Morciano, M.; Alberghini, M.; Malgaroli, G.; Ciocia, A.; Bergamasco, L.; Spertino, F.; Fasano, M. Synergistic freshwater and electricity production using passive membrane distillation and waste heat recovered from camouflaged photovoltaic modules. J. Clean. Prod. 2021, 318, 128464. [Google Scholar] [CrossRef]
  4. Liu, Z.; Zhang, H.; Cheng, C.; Huang, J. Energetic performance analysis on a membrane distillation integrated with low concentrating PV/T hybrid system. Renew. Energy 2021, 179, 1815–1825. [Google Scholar] [CrossRef]
  5. Rahaoui, K.; Ding, L.C.; Tan, L.P.; Mediouri, W.; Mahmoudi, F.; Nakoa, K.; Akbarzadeh, A. Sustainable Membrane Distillation Coupled with Solar Pond. Energy Procedia 2017, 110, 414–419. [Google Scholar] [CrossRef]
  6. Sayer, A.H.; Al-Hussaini, H.; Campbell, A.N. Experimental analysis of the temperature and concentration profiles in a salinity gradient solar pond with, and without a liquid cover to suppress evaporation. Sol. Energy 2017, 155, 1354–1365. [Google Scholar] [CrossRef]
  7. Chafidz, A.; Kerme, E.D.; Wazeer, I.; Khalid, Y.; Ajbar, A.; Al-Zahrani, S.M. Design and fabrication of a portable and hybrid solar-powered membrane distillation system. J. Clean. Prod. 2016, 133, 631–647. [Google Scholar] [CrossRef]
  8. Miladi, R.; Frikha, N.; Gabsi, S. Exergy analysis of a solar-powered vacuum membrane distillation unit using two models. Energy 2016, 120, 872–883. [Google Scholar] [CrossRef]
  9. Burhan, M.; Shahzad, M.W.; Ybyraiymkul, D.; Oh, S.J.; Ghaffour, N.; Ng, K.C. Performance investigation of MEMSYS vacuum membrane distillation system in single effect and multi-effect mode. Sustain. Energy Technol. Assess. 2019, 34, 9–15. [Google Scholar] [CrossRef]
  10. Miladi, R.; Frikha, N.; Kheiri, A.; Gabsi, S. Energetic performance analysis of seawater desalination with a solar membrane distillation. Energy Convers. Manag. 2019, 185, 143–154. [Google Scholar] [CrossRef]
  11. Bait, O. Exergy, environ–economic and economic analyses of a tubular solar water heater assisted solar still. J. Clean. Prod. 2019, 212, 630–646. [Google Scholar] [CrossRef]
  12. Chen, Q.; Muhammad, B.; Akhtar, F.H.; Ybyraiymkul, D.; Muhammad, W.S.; Li, Y.; Ng, K.C. Thermo-economic analysis and optimization of a vacuum multi-effect membrane distillation system. Desalination 2020, 483, 114413. [Google Scholar] [CrossRef]
  13. Cui, L.; Zhang, P.; Xiao, Y.; Liang, Y.; Liang, H.; Cheng, Z.; Qu, L. High Rate Production of Clean Water Based on the Combined Photo-Electro-Thermal Effect of Graphene Architecture. Adv. Mater. 2018, 30, 1706805. [Google Scholar] [CrossRef] [PubMed]
  14. Chen, Q.; Burhan, M.; Akhtar, F.H.; Ybyraiymkul, D.; Shahzad, M.W.; Li, Y.; Ng, K.C. A decentralized water/electricity cogeneration system integrating concentrated photovoltaic/thermal collectors and vacuum multi-effect membrane distillation. Energy 2021, 230, 120852. [Google Scholar] [CrossRef]
  15. Wang, W.; Shi, Y.; Zhang, C.; Hong, S.; Shi, L.; Chang, J.; Li, R.; Jin, Y.; Ong, C.; Zhuo, S.; et al. Simultaneous production of fresh water and electricity via multistage solar photovoltaic membrane distillation. Nat. Commun. 2019, 10, 3012. [Google Scholar] [CrossRef] [Green Version]
  16. Elminshawy, N.A.; Gadalla, M.A.; Bassyouni, M.; El-Nahhas, K.; Elminshawy, A.; Elhenawy, Y. A novel concentrated photovoltaic-driven membrane distillation hybrid system for the simultaneous production of electricity and potable water. Renew. Energy 2020, 162, 802–817. [Google Scholar] [CrossRef]
  17. Zarzoum, K.; Zhani, K.; Bacha, H.B.; Koschikowski, J. Experimental parametric study of membrane distillation unit using solar energy. Sol. Energy 2019, 188, 1274–1282. [Google Scholar] [CrossRef]
  18. Al-Hrari, M.; Ceylan, İ.; Nakoa, K.; Ergün, A. Concentrated photovoltaic and thermal system application for fresh water production. Appl. Therm. Eng. 2020, 171, 115054. [Google Scholar] [CrossRef]
  19. Krnac, A.; Araiz, M.; Rana, S.; Velardo, J.; Date, A. Investigation of Direct Contact Membrane Distillation coupling with a Concentrated Photovoltaic solar system. Energy Procedia 2019, 160, 246–252. [Google Scholar] [CrossRef]
  20. Haiping, C.; Xinxin, G.; Heng, Z.; Yang, L.; Haowen, L.; Yuegang, B. Experimental study on a flash tank integrated with low concentrating PV/T (FT-LCPVT) hybrid system for desalination. Appl. Therm. Eng. 2019, 159, 113874. [Google Scholar] [CrossRef]
  21. Jantaporn, W.; Ali, A.; Aimar, P. Specific energy requirement of direct contact membrane distillation. Chem. Eng. Res. Des. 2017, 128, 15–26. [Google Scholar] [CrossRef] [Green Version]
  22. Khayet, M. Membranes and theoretical modeling of membrane distillation: A review. Adv. Colloid Interface Sci. 2010, 164, 56–88. [Google Scholar] [CrossRef] [PubMed]
  23. Evola, G.; Marletta, L. Exergy and thermoeconomic optimization of a water-cooled glazed hybrid photovoltaic/thermal (PVT) collector. Sol. Energy 2014, 107, 12–25. [Google Scholar] [CrossRef]
  24. Zhang, H.; Liang, K.; Chen, H.; Gao, D.; Guo, X. Thermal and electrical performance of low-concentrating PV/T and flat-plate PV/T systems: A comparative study. Energy 2019, 177, 66–76. [Google Scholar] [CrossRef]
  25. Xinxin, G.; Heng, Z.; Haiping, C.; Kai, L.; Jiguang, H.; Haowen, L. Experimental and theoretical investigation on a hybrid LCPV/T solar still system. Desalination 2019, 468, 114063. [Google Scholar] [CrossRef]
Figure 1. Schematic of LCPV/T-MD system and physical picture.
Energies 15 09641 g001
Figure 2. Buffer water tank and electric control cabinet in VMD.
Energies 15 09641 g002
Figure 3. Temperature Variation of single experiment of LCPV/T-VMD system (30 min, 31 July).
Energies 15 09641 g003
Figure 4. Variation trend of inlet/outlet temperature of LCPV/T module.
Energies 15 09641 g004
Figure 5. Variation trend of average inlet/outlet temperature and MF of VMD.
Energies 15 09641 g005
Figure 6. Electrothermal efficiency and exergy efficiency of LCPV/T-VMD system.
Energies 15 09641 g006
Figure 7. Schematic diagram of average solar irradiation with seasons.
Energies 15 09641 g007
Figure 8. Schematic diagram of seasonal outlet heating temperature.
Energies 15 09641 g008
Figure 9. Schematic diagram of the seasonal natural and auxiliary MF.
Energies 15 09641 g009
Figure 10. Scatter diagram and fitting curve of MF with temperature difference of membrane.
Energies 15 09641 g010
Figure 11. The hourly average power generation and power consumption of the system.
Energies 15 09641 g011
Table 1. Average seasonal thermoelectric performance LCPV/T-VMD seawater desalination system.
MonthElectrical Efficiency
ηe (%)
Thermal Efficiency ηth (%)Electrical Exergy Efficiency
ζe (%)
Thermal Exergy Efficiency ζth (%)Total Exergy Efficiency ζo (%)
August9.4455.4110.144.7311.29
October9.9940.5510.731.758.69
December11.2535.1312.080.087.89
Table 2. Desalination rates of membrane module at different temperatures.
Temperature
(°C)
Vacuum Degree (MPa)Desalination Rate (%)
500.0997.33
550.0996.71
600.0998.22
650.0997.85
700.0998.83
Table 3. Daily comprehensive income of LCPV/T-VMD system in different seasons.
MonthOperation Hours per Day (h)Thermal Revenue
(USD/h)
Fresh Water Revenue
(USD/h)
Electricity Revenue
(USD/h)
ADCI
(USD)
August80.08530.1160.0061.632
October70.0780.0410.0070.877
October (aux)70.0780.125−0.0780.878
December (aux)60.060.095−0.0990.336
Publisher’s Note: MDPI stays neutral with regard to jurisdictional claims in published maps and institutional affiliations.

