1. Introduction
When using solar energy, sufficient cooling is necessary to ensure that the equipment does not overheat and can operate continuously. In solar power, the choice of a proper cooling method is crucial for the operation of the power plant, especially when techno-economics are taken into account. For concentrated solar power (CSP) plants, the efficiency of air cooling is very low, so cooling towers should be used when available [
1]. A solar tower power plant (STPP) with air-cooling systems shows considerable drops in energy and exergy yields, while an STPP with cooling towers decreases the investment cost, as well as the levelized cost of electricity [
2]. For solar thermal power plants, the use of cooling towers can decrease the back pressure. As the back pressure decreases, the efficiency of the cycle increases and also the power generated, being 12.60% in the case of the cooling tower, while 4.65% in the case of a dry condenser [
3]. There are two ways for cooling PV panels: active cooling (e.g., closed cooling towers) and passive cooling (e.g., heat pipes). Maleki et al. and Kumari et al. analyzed the effect of various cooling methods [
4,
5]. According to those results, active water cooling can lead to an approximately 20% reduction in module temperature, which translates to about a 9% efficiency increment [
6]. In addition to the improvement in the electricity generation efficiency of PV, by applying water cooling, the extracted heat can be used for various purposes, which means an increase in energy collection. What is more, the cooling capacity of nanofluid is 100.19% of that of pure water [
7]. Nasrin et al. analyzed cooling towers for PV panels to overcome the common obstacle that hinders PVs to be widely used. The results showed a significant rise of 44.83% in PV electrical efficiency [
8].
For a solar heating and cooling system, the addition of cooling towers can increase the efficiency of the system, and the increased initial investment and water consumption can be compensated for by increased efficiency [
9]. Solar heating and cooling systems are used in a wide range of almost all climate types. Examples include Madrid, Spain, Ref. [
10] (Mediterranean climate); Ningbo, China, Ref. [
11] (subtropical monsoon climate); Puertecitos, Mexico, Ref. [
12]; and Assiut, Egypt, Ref. [
13] (subtropical desert and steppe climate). In a solar heating and cooling system, the choice of a cooling tower is related to the initial investment in the system, operating costs, and many other aspects. An appropriate cooling tower can recover up to 53% of the waste condenser and absorber heat and reduce the cooling energy cost by 15% [
14].
Since solar systems operate all year round, cooling towers must ensure proper operation throughout the year. Summer is the main time of the year when cooling towers are used. With proper design, the cooling capacity can meet the cooling demand. However, in winter, the main issue is to prevent the cooling tower from freezing to ensure proper operation.
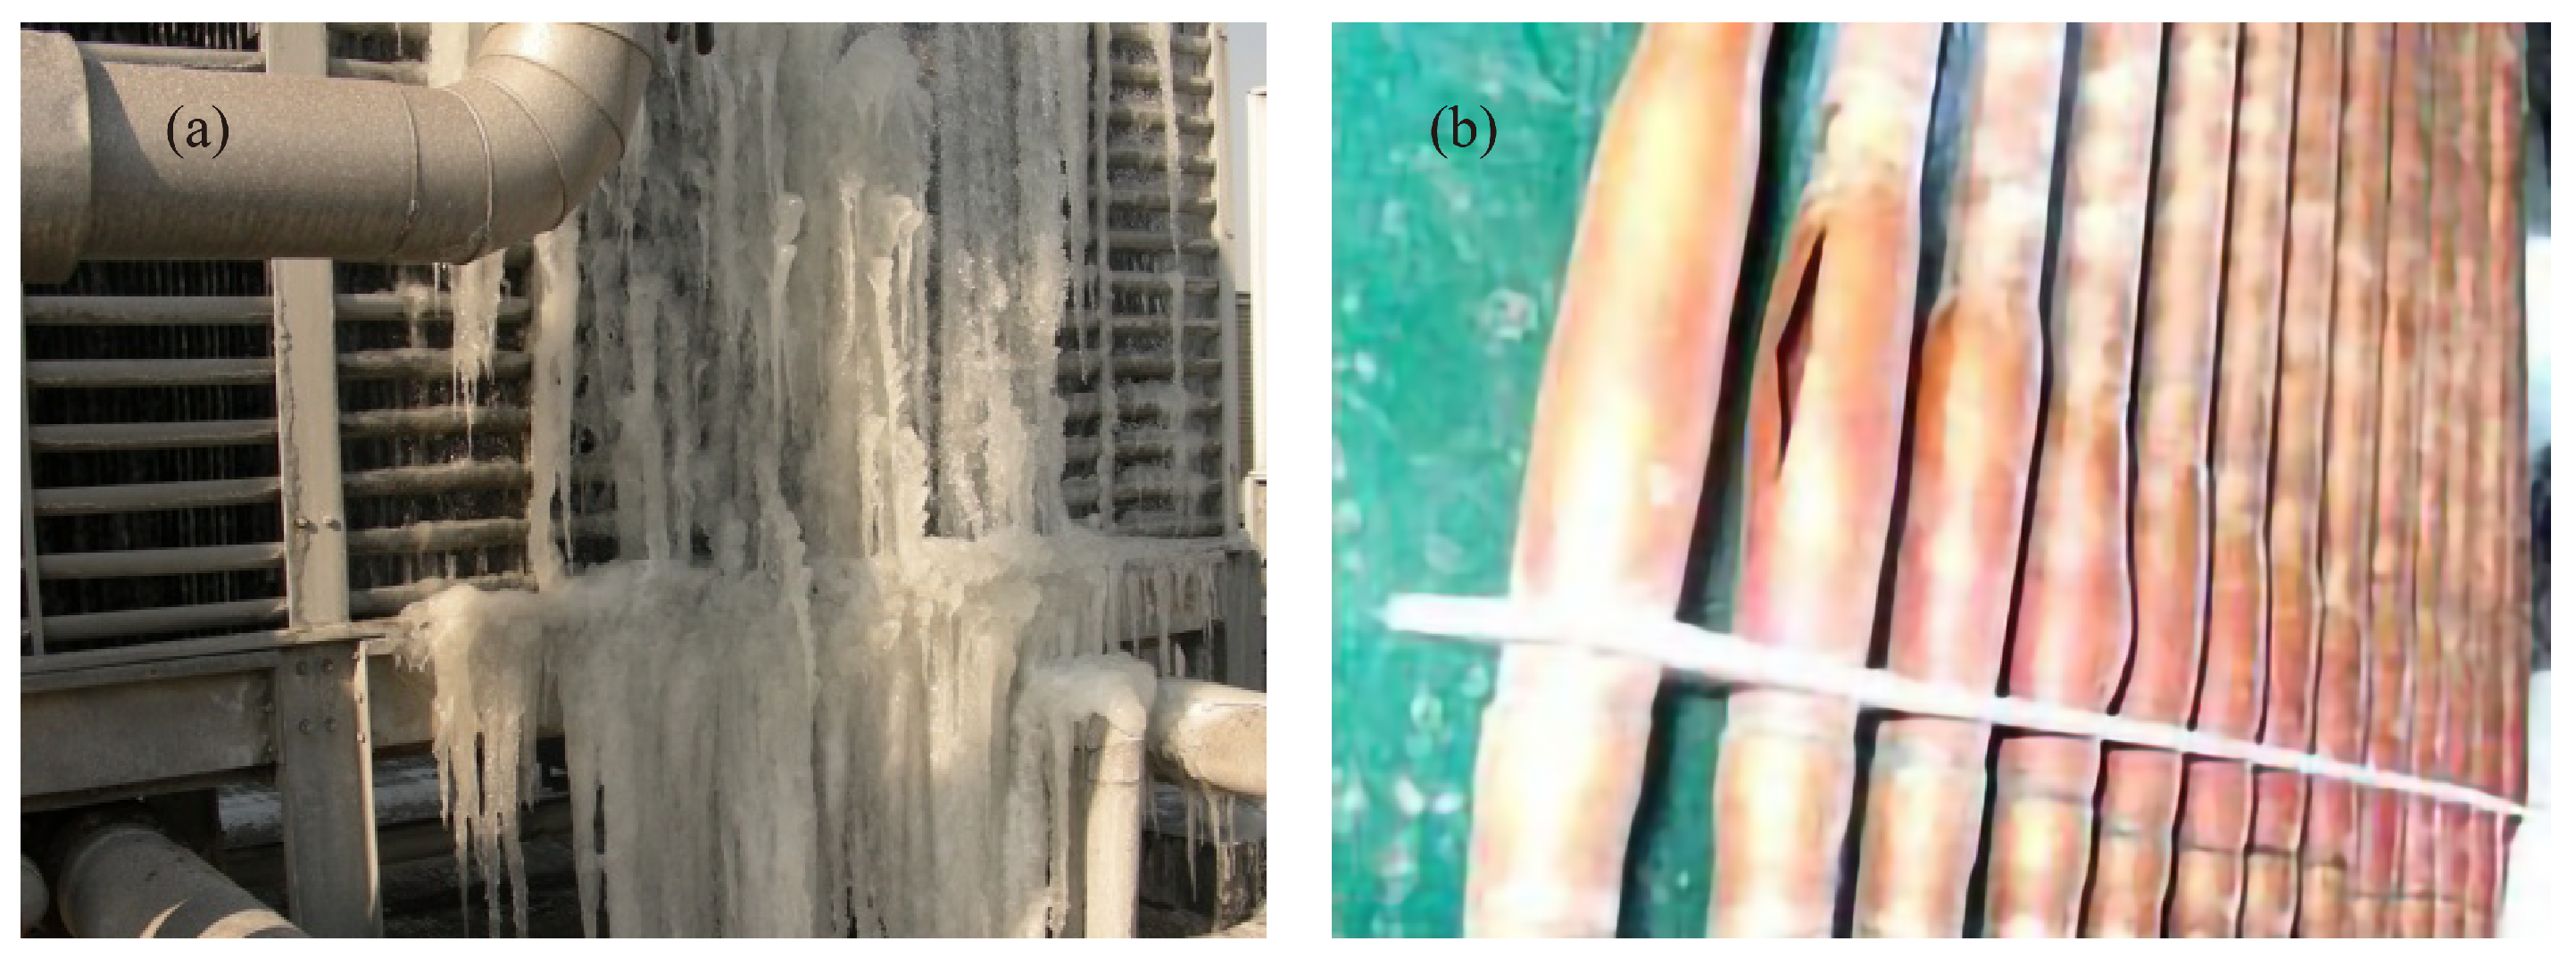
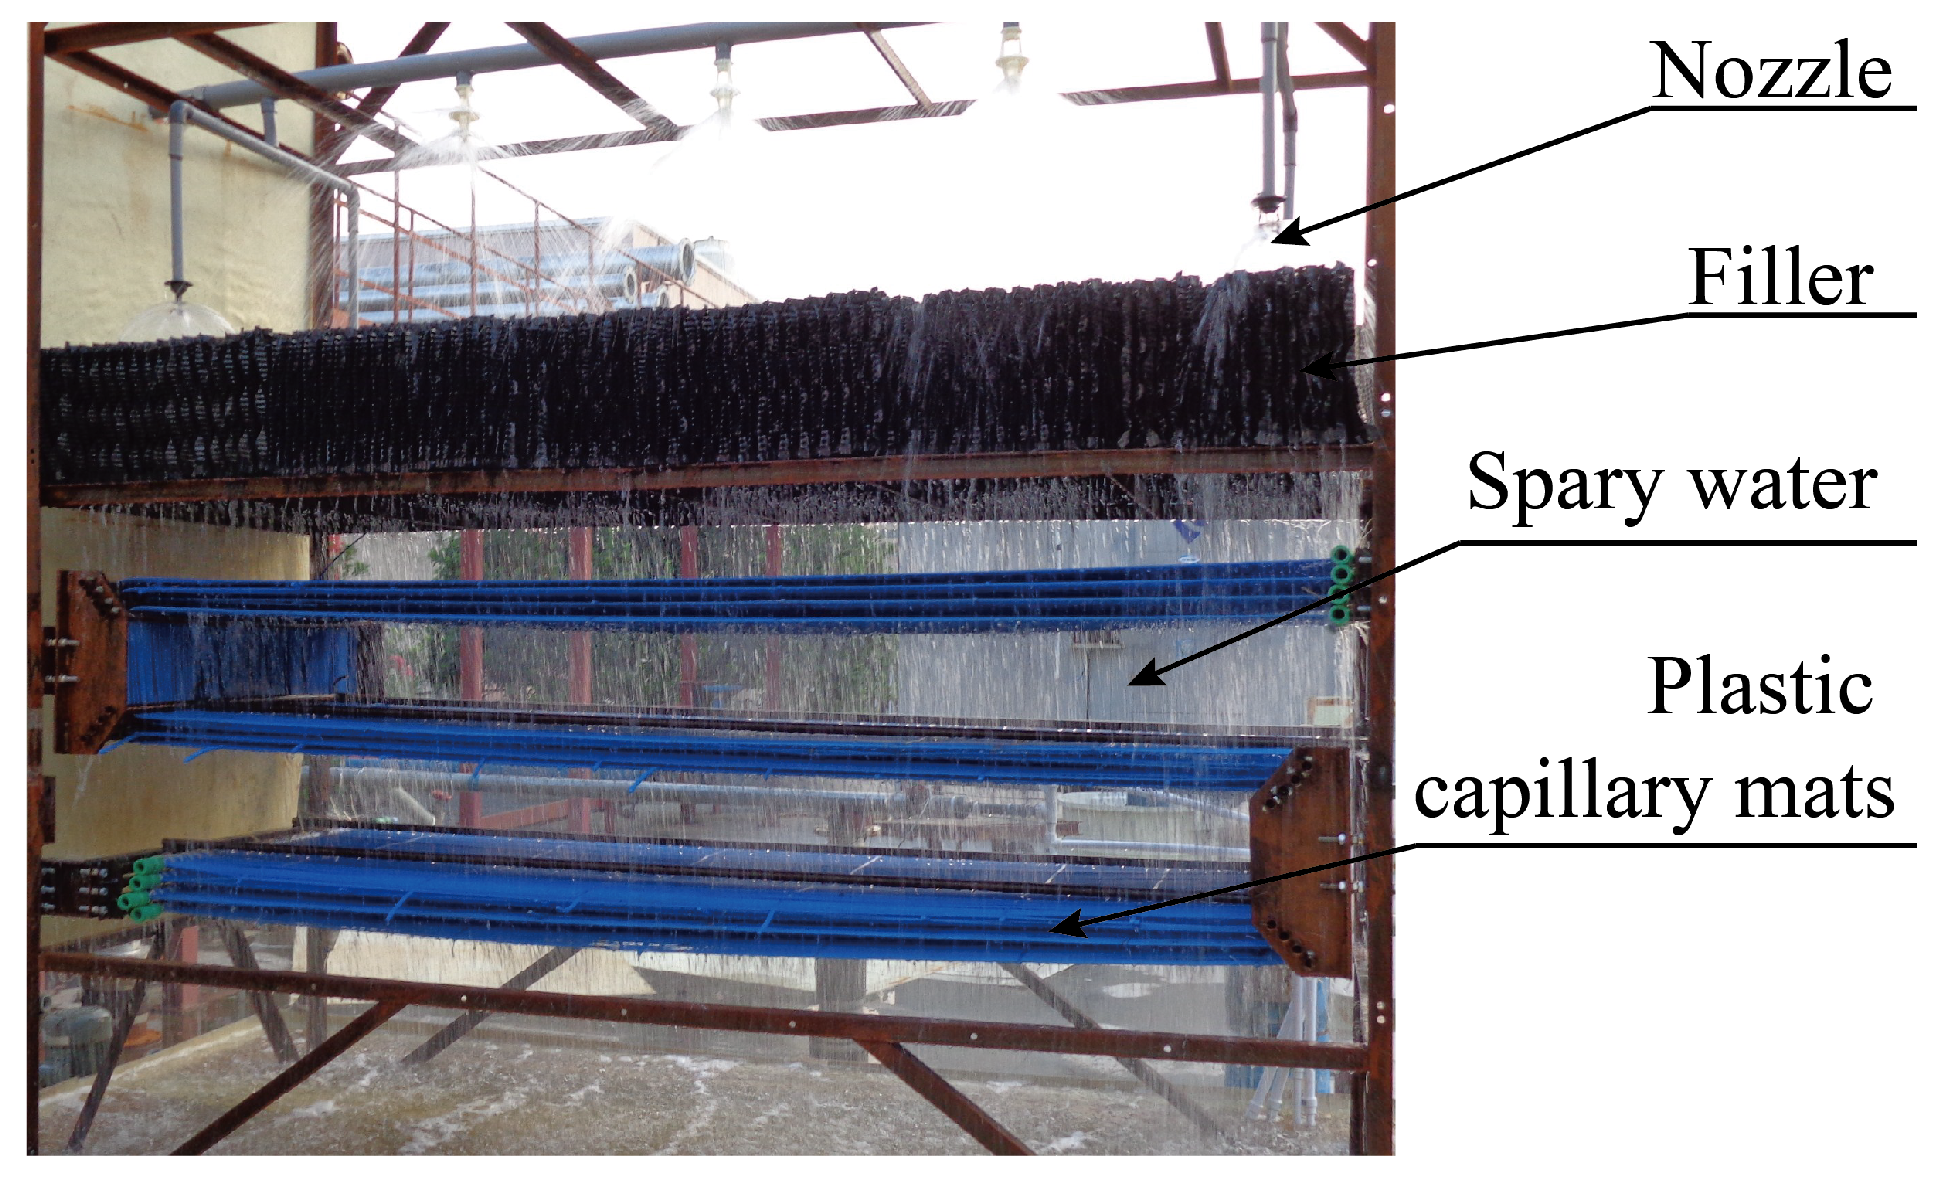
There are two major impacts of freezing on cooling towers. One is that the spray water in the cooling tower or evaporative condenser could splash at the air inlet to form hanging ice, as shown in
Figure 1a. The hanging ice could obstruct ventilation and waste heat dissipation. The other is the heat exchanger coils of the closed cooling towers could freeze to crack, as shown in
Figure 1b. This is unlikely to happen in running equipment, but the frozen water can crack the tubes and cause damage to the towers if the system shuts down with water remaining in the coils. Therefore, it is necessary to protect the cooling towers from freezing.
From the 1990s to the present, many investigations have been undertaken to solve the freezing problem of cooling towers to improve the safety and efficiency of the system operation. Zhang Jianzhong et al. took some freeze protection methods to the cooling towers in Daqing oil fields and achieved satisfying results [
15]. Pushnov and Lozovaya studied the freeze protection systems for mechanical draft cooling towers based on aerodynamics [
16]. Shi Cheng et al. found that applying the air intake diversion and integrated antifreeze and windshield could improve the thermal performance of the cooling tower [
17]. Li Yonghua et al. established a heat and mass transfer model of the cooling tower with windshield boards installed at the air inlet to solve the icing problems in multiple areas, such as the bottom surface of the filler, air inlet, and base torus [
18]. Kong, Yanqiang’s team, and Yan Jingbo’s team tried to add a heat exchanger and redistributed the cooling water to avoid freezing in the cooling towers [
19,
20,
21]. To reduce the frozen risk of the novel natural draft dry cooling tower, Cheng Tongrui et al. designed a double-layer air-cooled heat exchanger and investigated the outlet temperature of the water and the cooling capability [
22].
The above research is all about large industrial towers. For more general applications, we proposed two freeze protection methods for cooling towers and analyzed the feasibility theoretically and experimentally. In addition, taking the glycol solution as an example, the impact of antifreeze fluid on cooling towers was also analyzed for the commonly used antifreeze fluid method.
2. The Dry and Wet Mixing Operation Method
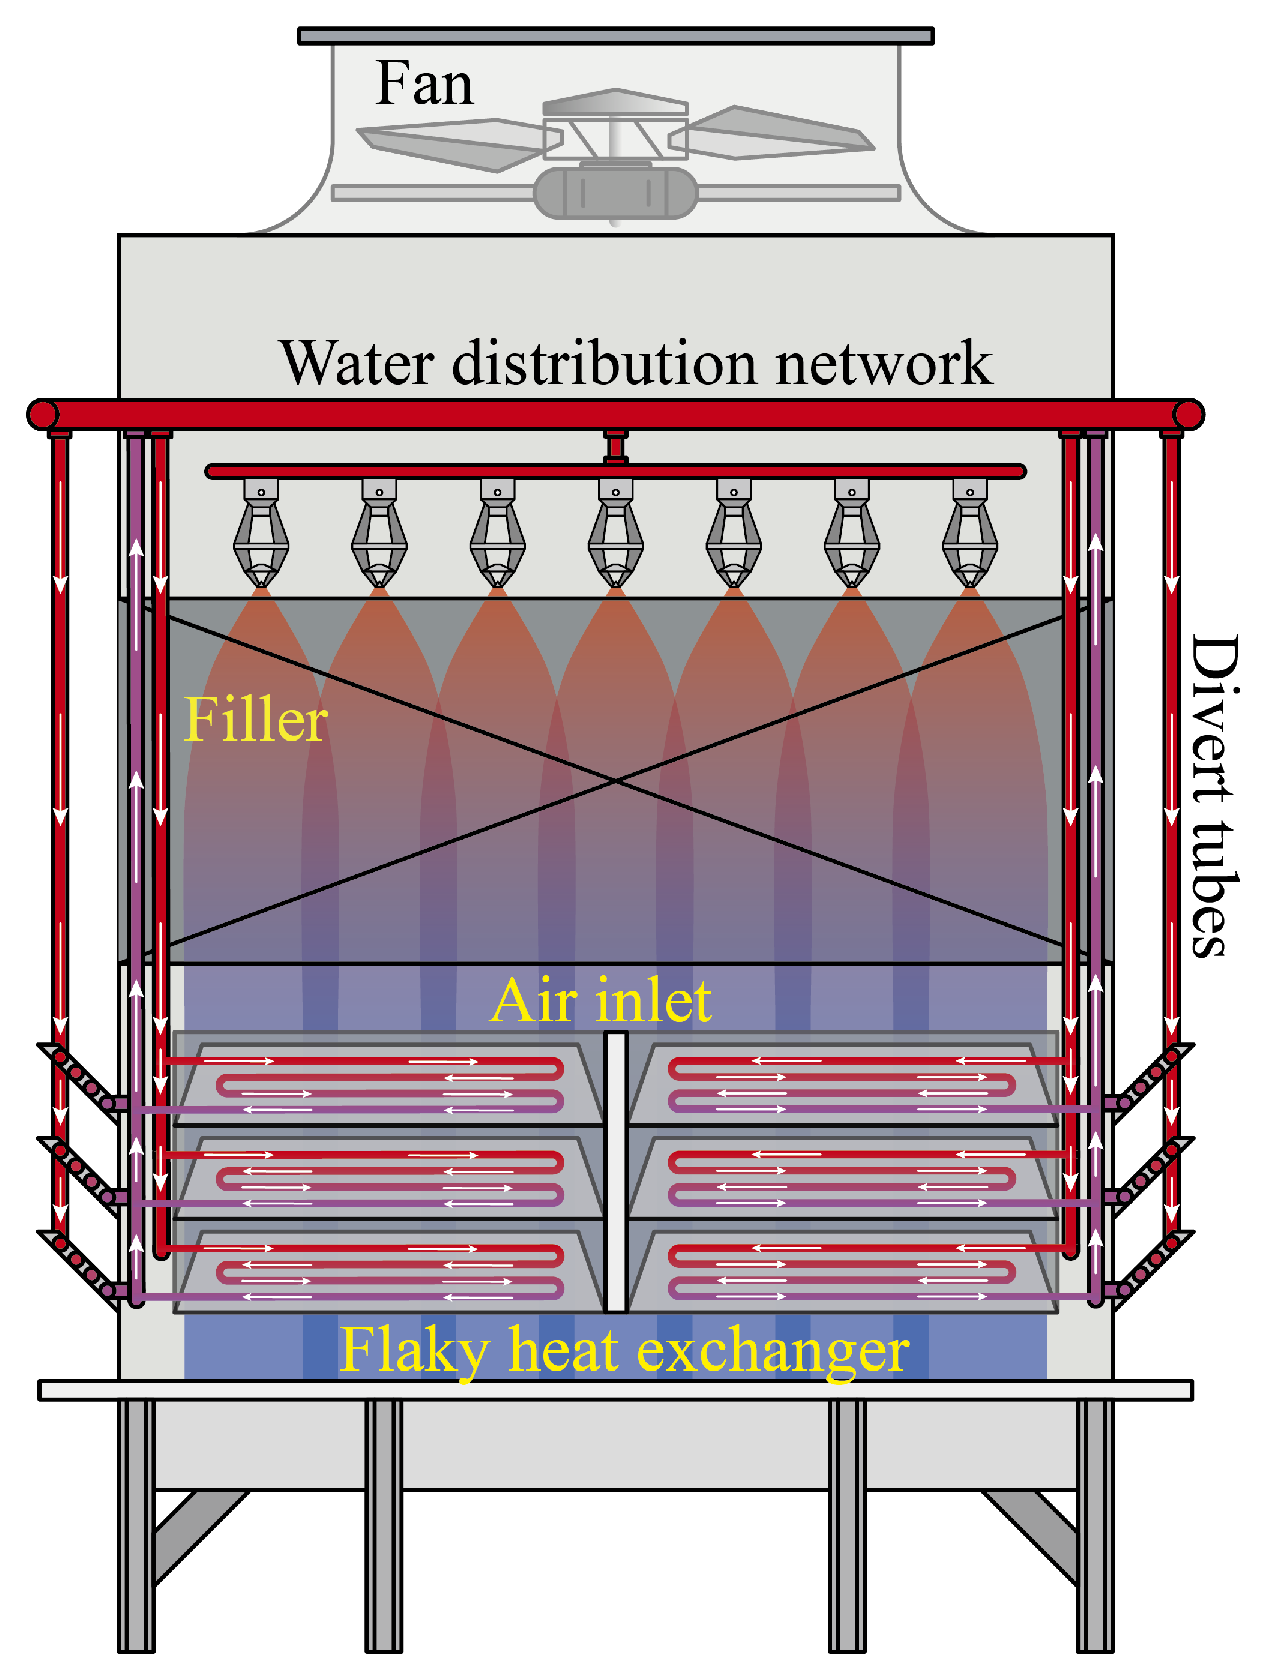
The active and system defrosting techniques in HVAC (Heating, Ventilation, and Air Conditioning) such as electrohydrodynamic, low-frequency oscillation, ultrasonic vibration methods, hot gas reverse cycle, electric heater, desiccant dehumidifiers, and controlling strategies can reduce the ice on the equipment surface [
23,
24]. Among these methods, the efficiency, COP, and energy consumption of the hot gas reverse cycle are superior to the other methods. Similarly, one way to eliminate the hanging ice is the dry and wet mixing operation: heating the air inlet louvers with hot water. A numerical test was run in MATLAB on an open countercurrent mechanical draft cooling tower. The MATLAB source code can be found in the
Supplementary Files. The air inlet louvers of the tower were replaced by flaky heat exchangers, and part of the hot water was diverted into the flaky heat exchangers before entering the nozzles. The water in the heat exchangers kept the surface temperature above the freezing point so that the water droplets splashed on the air inlet would not freeze. The schematic diagram of this method is shown in
Figure 2.
After exchanging heat in the flaky heat exchangers, the bypassed cooling water was gathered and returned to the cooling tower water inlet for spray cooling. Since the bypassed cooling water first passes through the flaky heat exchangers for air cooling and then evaporative cooling, this method is called dry and wet mixing operation.
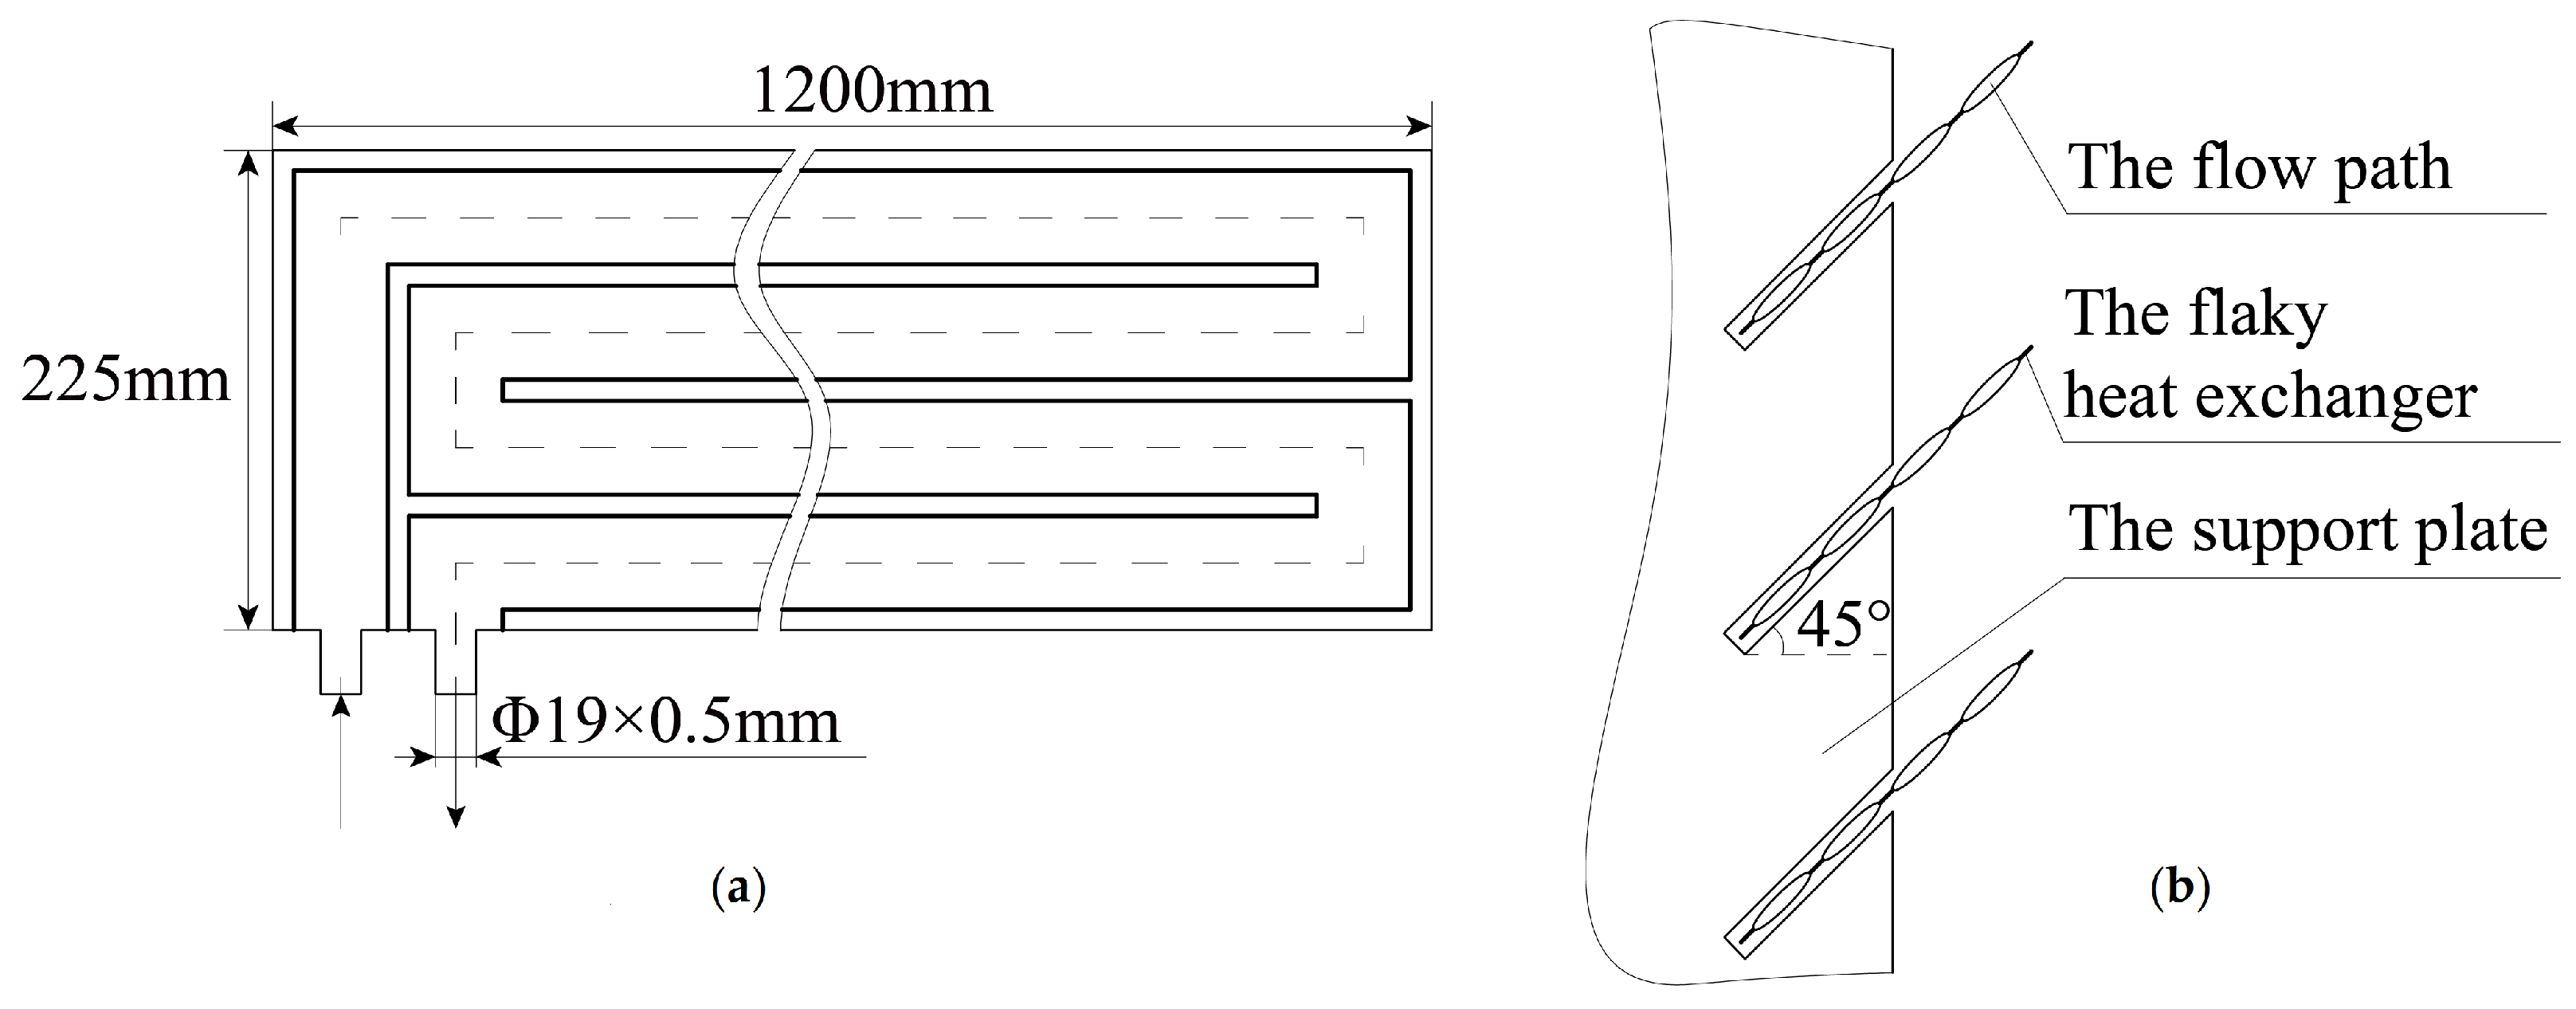
The size of the cooling tower was 2.4 m × 2.4 m and there were four air inlets distributed on the four walls. The airspeed at each air inlet was 4 m/s, and the height of the air inlets was 0.5 m. To reduce the airflow resistance within the heat exchangers, each air inlet was divided into two groups, and each group had 3 pieces of flaky heat exchangers arranged vertically. There were 24 pieces of heat exchangers in total. The diagram of the flaky heat exchanger is shown in
Figure 3a. The heat exchangers are made of 0.5 mm stainless steel plates. The cross-section of the flow path is approximately ellipse, with a short axis of 8 mm and a long axis of 44 mm. The flaky heat exchangers were fixed on a support plate with an installation angle of 45
, as shown in
Figure 3b.
The calculation method of non-circular cross-section channels [
25] (the Dittus–Boelter equation) was used in the experiment
where
is the Nusselt number,
is the Reynolds number,
is the Prandtl number, and the subscript
f represents the characteristic temperature, which equals the temperature of the water.
The equivalent diameter
was used as the characteristic dimension
where
and
are the lengths of the long and short axis of the cross-section channels, respectively.
The air outside the tube is calculated using an approximate model. For the swept flat walls model [
25],
and for the swept tube bundle model [
25],
where
is determined by the average wall temperature of the tube bundle and
is the correction factor of the tube rows. In Equation (2), the subscript
l represents the characteristic length, which equals the whole length of the board, and in Equation (2), the characteristic length is the diameter of a circle, whose area equals the cross-sectional area of the elliptical tube.
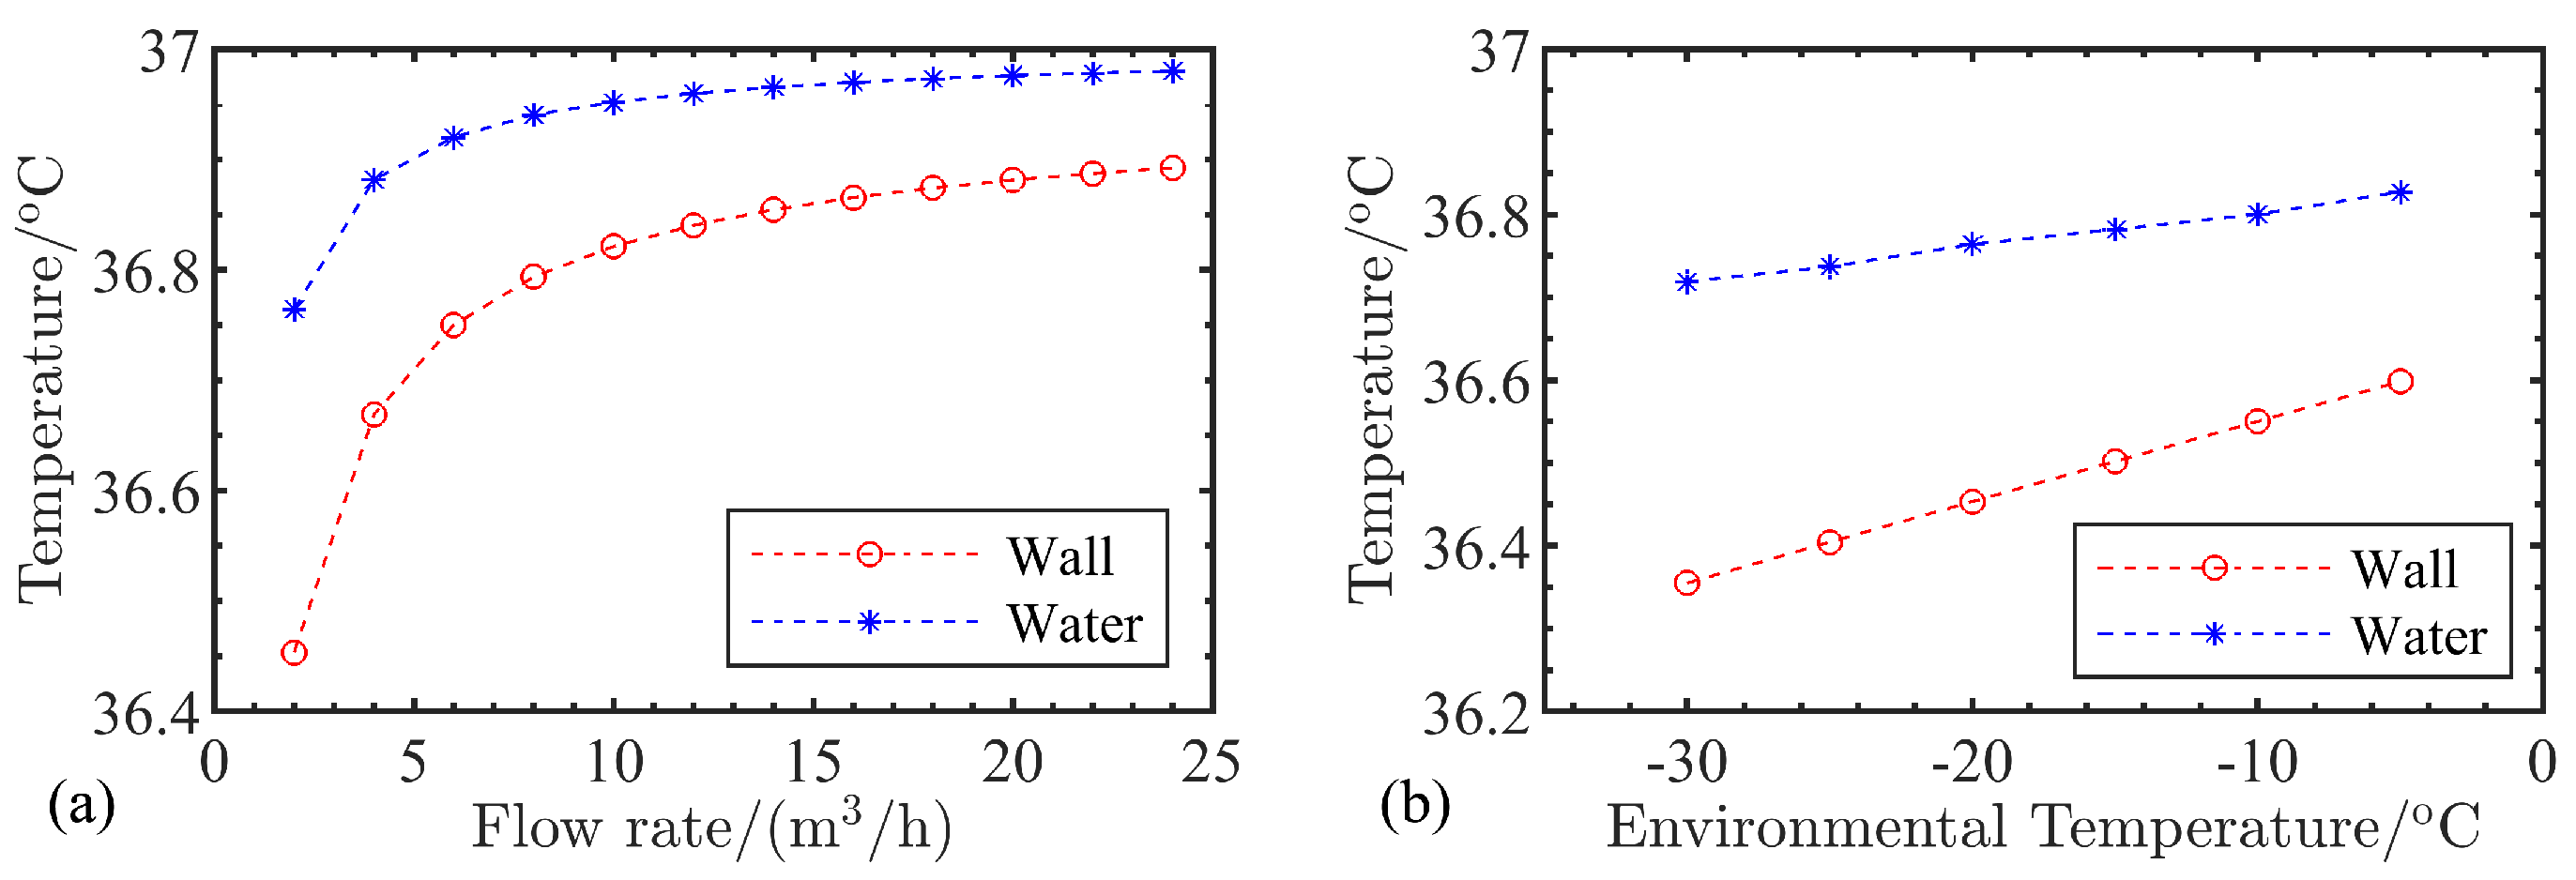
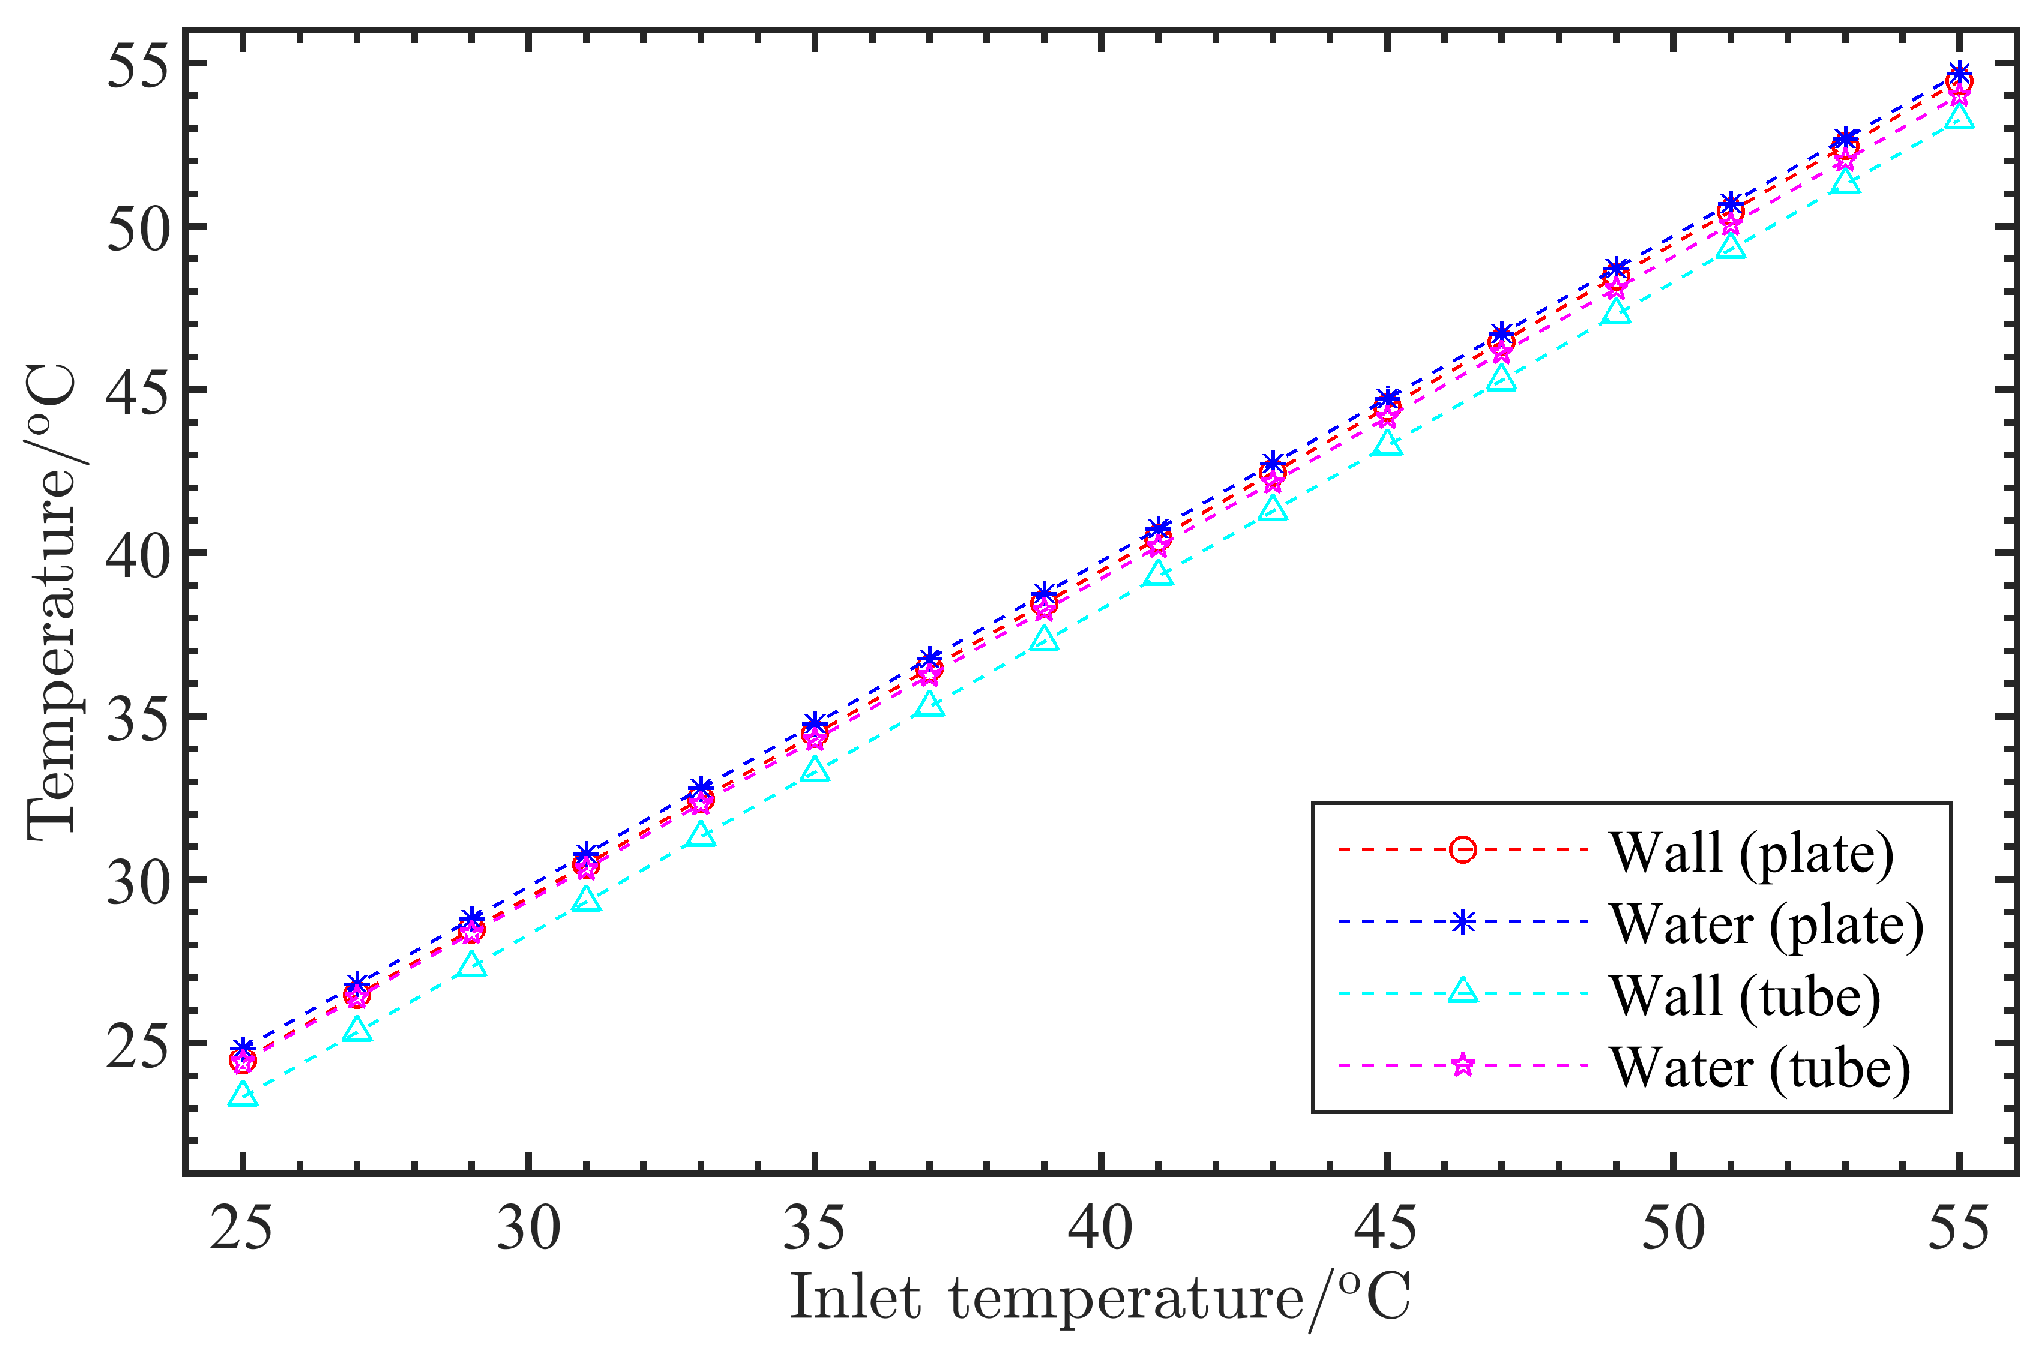
The temperature of the water and the surface of the wall at the outlet of the flaky heat exchangers under a certain inlet temperature (37
C) and environmental temperature (−20
C) were calculated, and the results are shown in
Figure 4a. The changes in the water and surface temperature at the outlet of the heat exchanger with the environmental temperature are plotted in
Figure 4b. The inlet temperature and flow rate were set to 37
C and 2 m
/h, respectively.
Figure 4a shows that when the flow rate is less than 6 m
/h, the wall temperature at the outlet drops rapidly. However, the difference between the temperatures of the wall and the inlet of the heat exchanger is small, so this method can well serve the purpose of heating the air inlet louvers and thus inhibit ice from hanging at the inlets. The fitting formula of the surface temperature in
Figure 4b is
where
is the surface temperature and
is the environmental temperature. Only if
is lower than −3765.54
C (<<−273.15
C) will
be below 0
C, which is impossible, so the flaky heat exchanger will not hang ice.
The changes in the surface and water temperature at the outlet of the heat exchanger that correspond to different inlet water temperatures are plotted in
Figure 5. The environmental temperature and flow rate were set to −20
C and 5 m
/h in the calculations, respectively. The temperature of the surface is above 15
C, so the louvers will not hang ice.
The results show that the outer wall temperature of the flaky heat exchanger is lower than the inlet water temperature by less than 1 C. Therefore, the dry and wet mixing operation method can effectively avoid ice hanging on the air inlet. This method can be applied to all types of evaporative cooling equipment. It should be noted that when the tube diameter and the number of tubes increase, the heat exchange effect will be better and the tube wall temperature will decrease. In addition, for a very large cooling tower, the flow path becomes longer and the increment in flow resistance may affect the heat transfer efficiency. Therefore, when designing flaky heat exchangers, attention should be paid to the designing and arrangement of the flow channels.
3. Engineering Plastic Capillary Mats Method
In winter, closed cooling towers are likely to freeze to crack during temporary shutdowns because it is difficult to drain the residual cooling water in the tubes. To solve this problem, we have experimentally studied the possibility of replacing metal heat exchanger coils with engineering plastics.
According to the calculations, when the thermal conductivity of the tube material is about 0 ∼ 5 W/(mK), the proportion of the heat transfer resistance in the tube to the total heat transfer resistance increases rapidly with the increase of the thermal conductivity of the tube, while it increases steadily and tends to be stable when the thermal conductivity is higher than 5 W/(mK) [
26]. The nominal thermal conductivity of engineering plastics on the market is about 1 ∼ 2 W/(mK). Therefore, replacing metal heat exchanger coils with conventional-diameter engineering plastic tubes is not cost-effective.
One common way to increase the total heat dissipation is to increase the heat transfer surface. There have been many types of research about engineering plastic capillary mats used in HVAC systems [
27,
28,
29,
30,
31,
32], and it was found that the use of engineering plastic capillary mats can make the distribution of the environment temperature more uniform. Therefore, PE (polyethylene) capillary mats were used in the experiment. The inner diameter and wall thickness of the PE tubes were 2.7 mm and 0.8 mm, respectively, and the thermal conductivity was about 0.4 W/(mK). The reason for choosing PE is that the thermal conductivity of PE is small in engineering plastics, which makes the experimental results more convincing.
The experimental setup is shown in
Figure 6. The results show that the cooling capability of two closed cooling towers with PE capillary mats was approximately equal to a normally closed cooling tower with copper tubes. Furthermore, the unit cost and energy consumption of the two PE-capillary-mats towers and the copper-tubes tower were nearly the same [
26]. In summary, it is cost-effective to use small-diameter engineering plastic tubes instead of normal metal tubes in closed cooling towers.
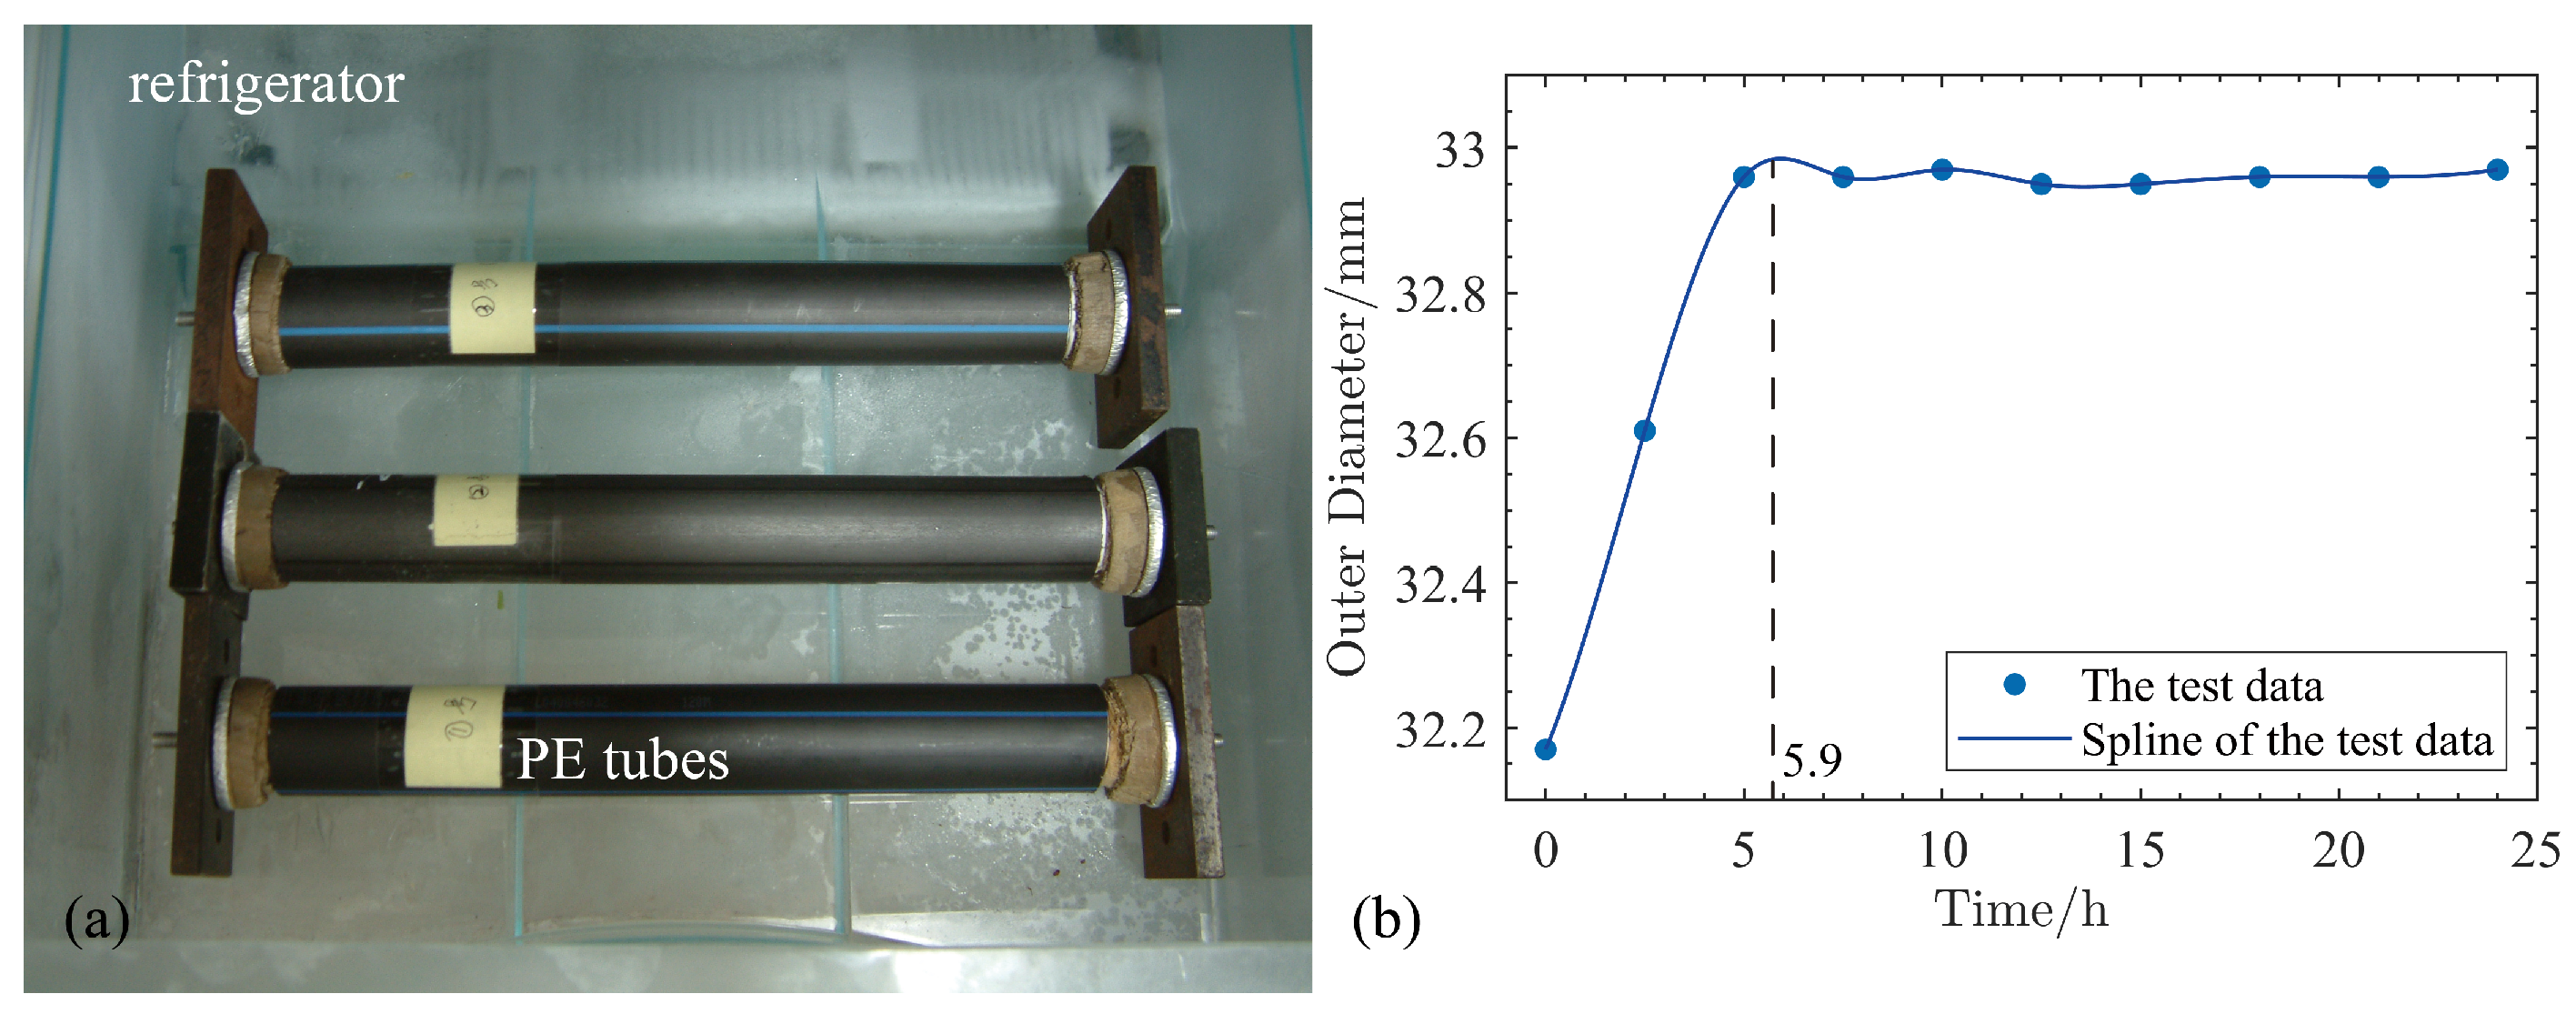
The anti-freeze experiments were first performed on a normal-sized water-filled PE tube. There were two major factors: whether the tubes would freeze to crack, and monitoring the changes in tube diameter during freezing to characterize the ability of freeze protection. The temperature in the refrigerator was kept at −18 C. The water-filled PE tube was settled in the refrigerator and gradually frozen from room temperature to −18 C.
The results show that the tube produced reversible deformation during the freezing test. The diameter of the tubes increased rapidly within the first 5.9 h and then stabilized, and no vitrification of PE was observed. The photo of the experimental setup and expanding curve of the average outer diameters of the PE tubes is shown in
Figure 7.
Then, the cooling tower with PE capillary mats was settled in a mountainous region in Zhejiang Province, China, where the typical temperature in winter ranges from −10 C to 5 C. After a winter’s freezing without draining the cooling water, the tower was still fully functional in the following tests, which indicates that PE can meet the demands of freeze protection.
In addition, the PE tubes were also found to have anticorrosion, scale inhibition, and noise reduction effects during the test [
26]. Since the cooling capacity of cooling towers with engineering plastic capillary mats is about half of the cooling towers with metal tubes, it is not suitable to use the cooling towers with engineering plastic capillary mats in narrow areas.
4. The Antifreeze Fluid Method
Using antifreeze fluid is the most common method to prevent freezing in small closed cooling systems, such as automobiles. This method has also been introduced to the freeze protection work of closed cooling towers. Glycol is one of the most widely used antifreeze fluids, and it is non-corrosive to copper, steel, and engineering plastics, so it was selected in the numerical experiments.
The effects of the concentration of the glycol solution [
33] on the closed cooling tower under various working conditions were calculated. The results show that adding glycol would lead to a reduction in the cooling capacity of the aqueous solution. However, increasing the diameter and reducing the thickness of the tube or increasing the air volume could compensate for the reduction in the cooling capacity caused by glycol.
The working conditions in the calculations were as follows: the flow rate of the solution was 100 m/h, the atmospheric pressure was 99.4 kPa, the dry-bulb temperature was 31.5 C, the wet-bulb temperature was 28 C, the inlet temperature of the solution was 37 C and the outlet temperature was 32 C, the air volume was 112,323 m/h, and the spray volume was 150 m/h.
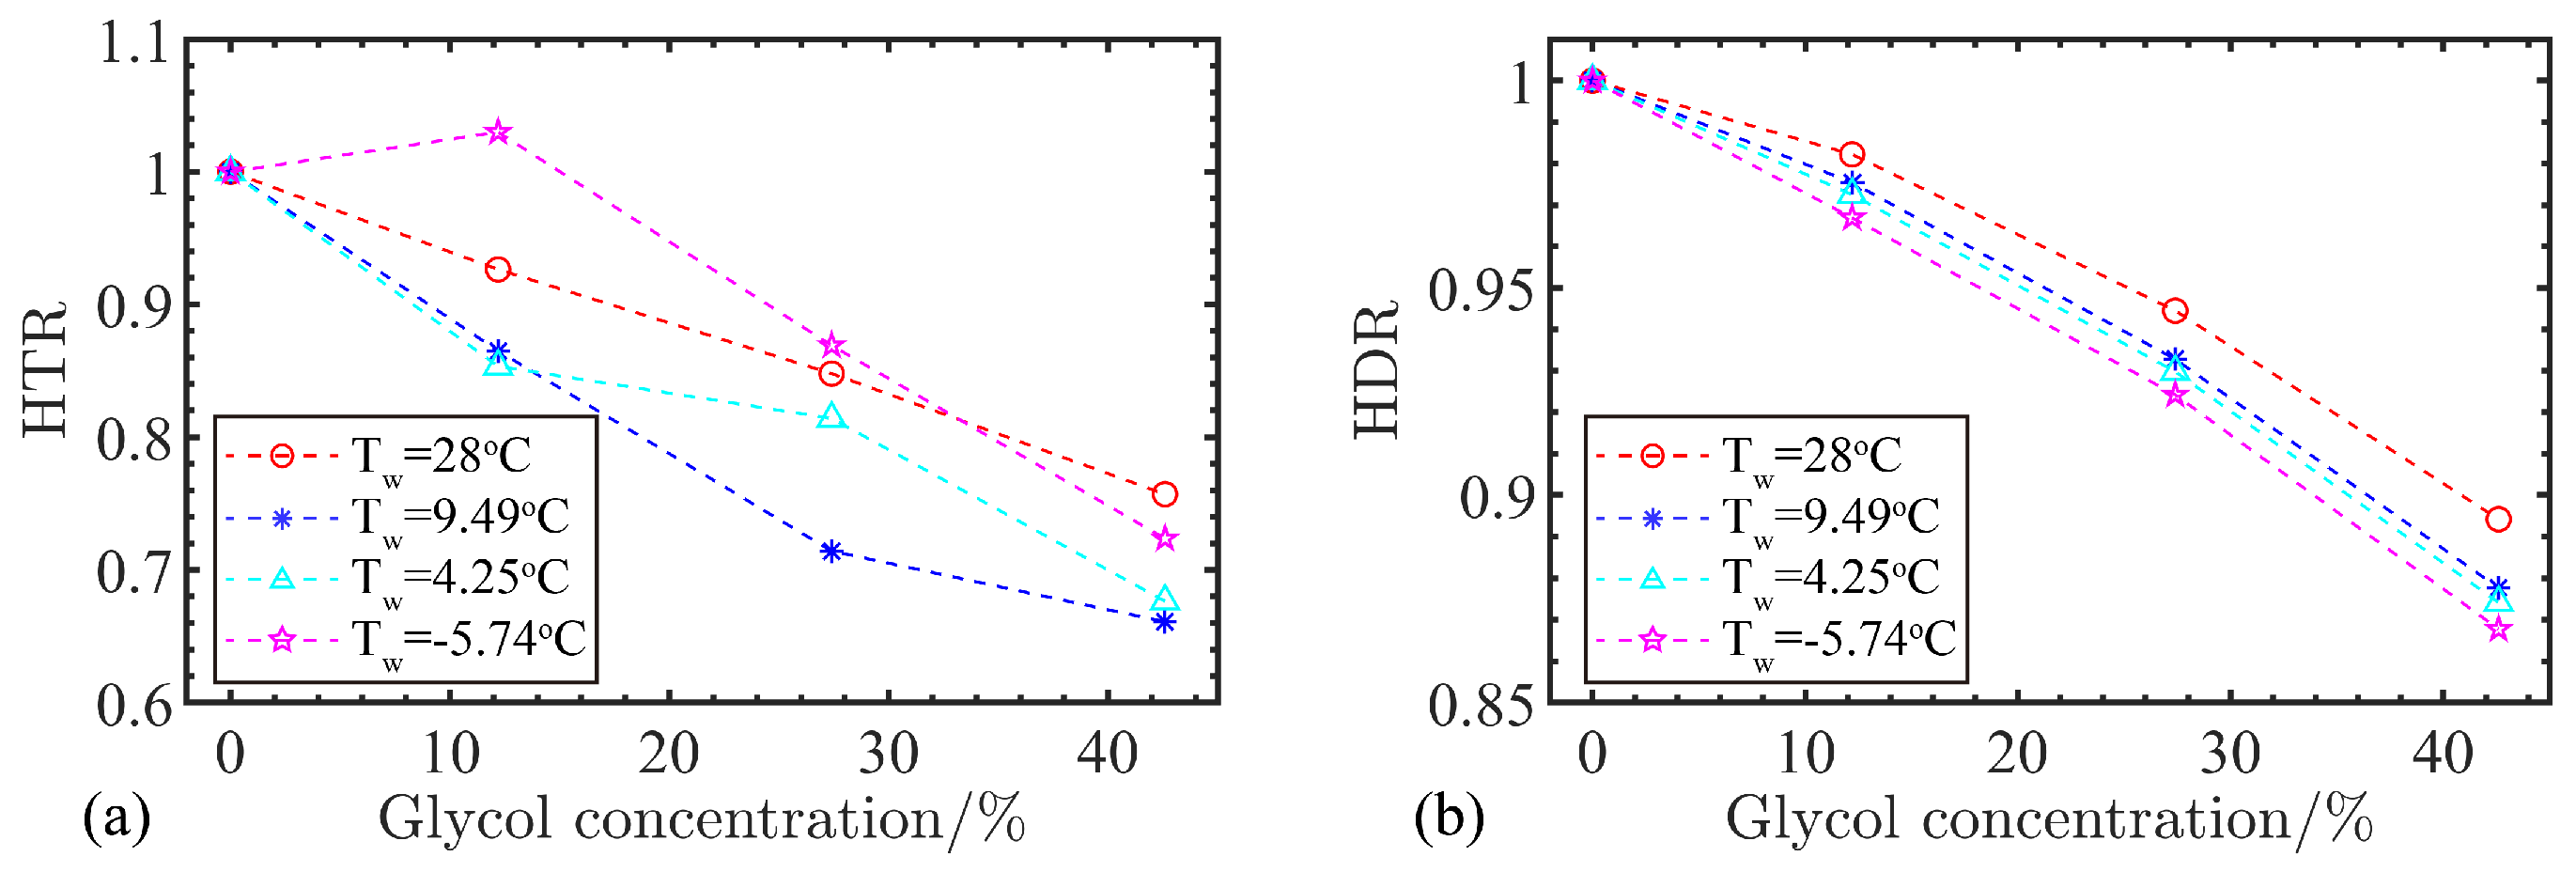
The heat transfer coefficient of the closed cooling tower decreased with the increase of glycol concentration, when the spray volume, air volume, solution flow rate, and inlet temperature are kept constant. The ratio of the heat transfer coefficient at a certain glycol concentration to the heat transfer coefficient without the addition of glycol is defined as the heat transfer coefficient ratio (HTR). Some systems are required to keep a fixed temperature difference. Heat dissipation in these systems varies with glycol concentration. The ratio of the heat dissipation at a certain glycol concentration to the heat dissipation without the addition of glycol is defined as the heat dissipation ratio (HDR). The HTRs and HDRs are plotted in
Figure 8.
In general, both the HTR and HDR decreased with the increase in glycol concentration. When the glycol concentration reached 40%, the HTR dropped to 2/3 and the HDR dropped to 85%. Compared with pure water, the specific heat capacity and thermal conductivity of glycol solutions decrease and the density and viscosity increase. The increment in density and viscosity would reduce the heat transfer capacity of the glycol solution. This causes the heat exchange performance of the cooling tower to decrease. The total heat dissipation was reduced due to the decrease in thermal performance, which is reflected in the changes in HDR.
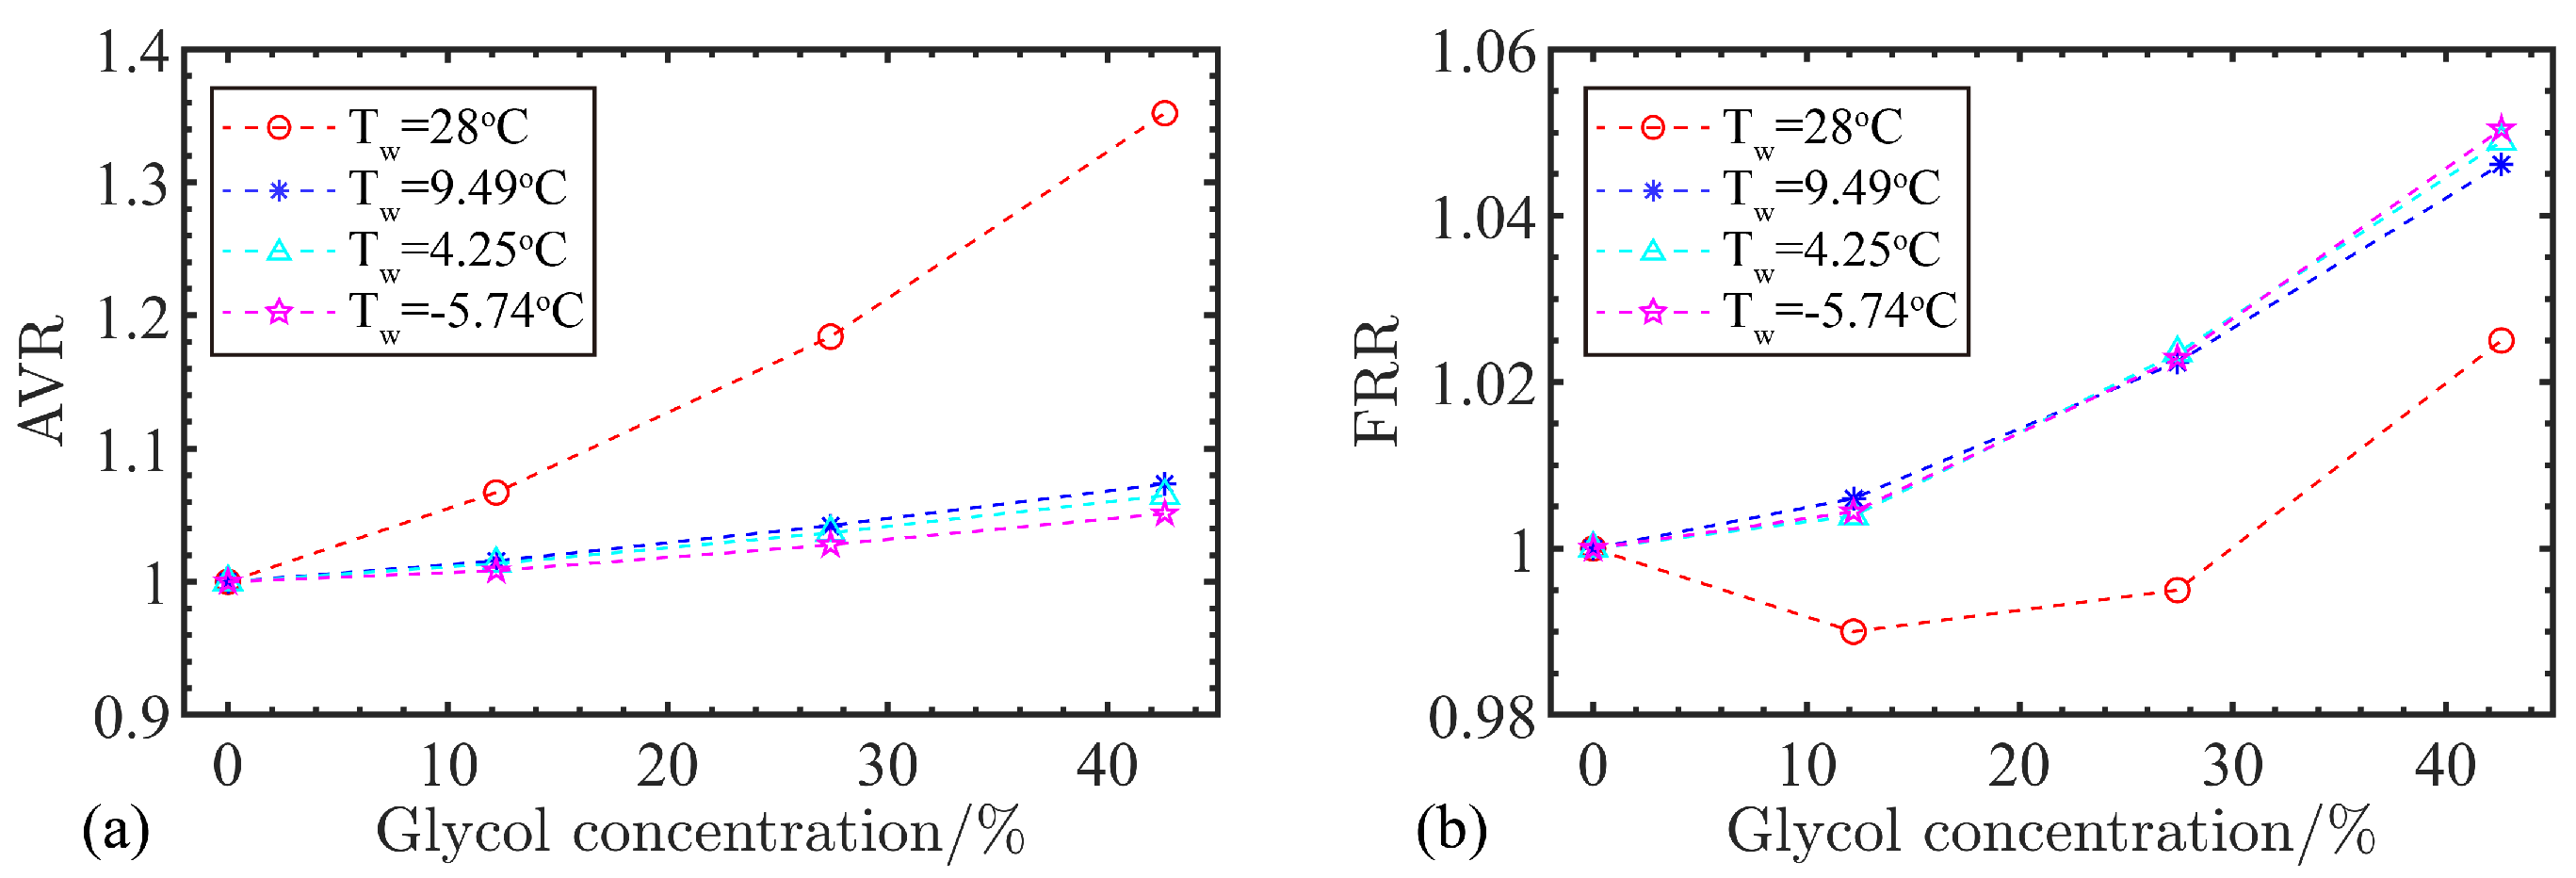
The heat dissipation is only related to the temperature difference between the outlet and inlet solutions when the glycol concentration and wet-bulb temperature are certain. Therefore, the method of adjusting the air volume can be used to ensure the cooling capacity of the tower. The ratio of the air volume at a certain glycol concentration to the original air volume without the addition of glycol is defined as the air volume ratio (AVR). To keep the heat dissipation unchanged, the flow rate of the solution must be increased to compensate for the effect of glycol. The ratio of the flow rate at a certain glycol concentration to the flow rate without the addition of glycol is defined as the flow rate ratio (FRR). The AVRs and FRRs are plotted in
Figure 9.
The trend of AVR is obviously different from that of HDR; that is to say, the higher the glycol concentration and wet-bulb temperature are, the larger the AVR will be. At low wet-bulb temperatures (≤9.49 C), FRR increases with glycol concentration. In a word, the use of antifreeze fluid should not be considered if not necessary.
The addition of antifreeze fluid changes the physical properties of water, which reduces the heat transfer efficiency of cooling towers, and the variation is more significant at low temperatures. Although the use of antifreeze fluid can prevent the heat exchanger from freezing and damaging in winter, it will reduce the cooling capacity of the cooling tower. Therefore, when using antifreeze fluid in winter, it is important to recalibrate the cooling tower’s cooling capacity (by adjusting the air volume and the flow rate of the solution). In addition, antifreeze fluid has a corrosive effect on metals and should be used with caution.
5. Conclusions
A cooling tower is an important cooling component in a solar system. The efficiency of a solar system is closely related to the proper operation of the cooling tower. However, freezing in winter affects the operation of cooling towers. For the problem of hanging ice at the air inlet of the cooling tower, the dry and wet mixing operation can raise the temperature of the air inlet louvers and prevent them from being frozen effectively. For the problem of the cooling tower’s heat exchanger coils freezing to crack, the use of engineering plastic capillary mats can prevent the tube from being damaged after freezing. The use of antifreeze fluid can prevent the cooling solution from freezing. All these three methods can improve the freeze protection ability to cool towers effectively.
The advantage of the dry and wet mixing operation is that the heat exchange area and heat exchange efficiency can be improved additionally, while the disadvantage is that it is troublesome to install. When used in large cooling towers, it is important to pay attention to the arrangement of the flow channels. The advantage of the engineering plastic capillary mats method is it can also play the role of noise reduction, anticorrosion, and scale inhibition, while the disadvantage is it cannot be used in existing cooling towers. When compared with cooling towers with metal tubes, cooling towers with engineering plastic capillary mats take a larger footprint to achieve the same cooling capacity. The advantage of the antifreeze fluid method is its ease of operation, while the disadvantage is that it will reduce the cooling capacity of the cooling towers, even though the cooling capacity can be compensated by increasing air volume and flow rate.
In practice, it is necessary to choose the most appropriate freeze protection method according to the actual situation and requirement. So far, there is no perfect method to solve the problem of cooling towers freezing in winter. Enhancing the cooling tower’s anti-freezing ability without affecting its cooling capacity requires the development of material technology.
Author Contributions
J.L.: Conceptualization, methodology, validation, formal analysis, investigation, resources, writing—original draft, data Curation, visualization; L.Z.: conceptualization, writing—review and editing, funding acquisition, project administration; Y.C.: methodology, software, formal analysis, data curation, funding acquisition, visualization; Z.Y.: formal analysis, visualization; Y.S. (Yan Shen): methodology, writing—review and editing, supervision; Y.S. (Yuedong Sun): supervision. All authors have read and agreed to the published version of the manuscript.
Funding
This research was funded by the National Natural Science Foundation of China (No. 52208116) and the China Postdoctoral Science Foundation (no. 2020M681347) and the National Natural Science Cultivation Foundation of University of Shanghai for Science and Technology (grant number ZR17PY07).
Institutional Review Board Statement
Not applicable.
Informed Consent Statement
Not applicable.
Data Availability Statement
Not applicable.
Acknowledgments
I extend my sincere thanks to my supervisor Zong-hu Lin, who was an academician of the Chinese Academy of Engineering and worked at both Xi’an Jiaotong University and University of Shanghai for Science and Technology. Lin gave much guidance and concern to the subject and gave me much help in my study life when he was alive. The capillary mats heat exchanger was made and tested in Zhejiang Jin-Ling Refrigeration Engineering Co., Ltd. I especially appreciate the support of manager Ren-tu He, deputy manager Mei Xue, and technology minister Zhi-yuan Fan.
Conflicts of Interest
The authors declare no conflict of interest.
Abbreviations
The following abbreviations are used in this manuscript:
| CSP | Concentrated solar power |
| STPP | Solar tower power plant |
| PV | Photovoltaic |
| HVAC | Heating, Ventilation, and Air Conditioning |
| PE | Polyethylene |
| HTR | heat transfer coefficient ratio |
| HDR | heat dissipation ratio |
| AVR | air volume ratio |
| FRR | flow rate ratio |
References
- Fernández-Torrijos, M.; Marugán-Cruz, C.; Sobrino, C.; Santana, D. The water cost effect of hybrid-parallel condensing systems in the thermo-economical performance of solar tower plants. Appl. Therm. Eng. 2022, 202, 117801. [Google Scholar] [CrossRef]
- Boukelia, T.E.; Bouraoui, A.; Laouafi, A.; Djimli, S.; Kabar, Y. 3E (Energy-Exergy-Economic) comparative study of integrating wet and dry cooling systems in solar tower power plants. Energy 2020, 200, 117567. [Google Scholar] [CrossRef]
- Cutillas, C.G.; Ruiz, J.; Asfand, F.; Patchigolla, K.; Lucas, M. Energetic, exergetic and environmental (3E) analyses of different cooling technologies (wet, dry and hybrid) in a CSP thermal power plant. Case Stud. Therm. Eng. 2021, 28, 101545. [Google Scholar] [CrossRef]
- Kumari, S.; Pandit, A.; Bhende, A.; Rayalu, S. Thermal Management of Solar Panels for Overall Efficiency Enhancement Using Different Cooling Techniques. Int. J. Environ. Res. 2022, 16, 1–20. [Google Scholar] [CrossRef]
- Maleki, A.; Haghighi, A.; El Haj Assad, M.; Mahariq, I.; Alhuyi Nazari, M. A review on the approaches employed for cooling PV cells. Sol. Energy 2020, 209, 170–185. [Google Scholar] [CrossRef]
- Bahaidarah, H.; Subhan, A.; Gandhidasan, P.; Rehman, S. Performance evaluation of a PV (photovoltaic) module by back surface water cooling for hot climatic conditions. Energy 2013, 59, 445–453. [Google Scholar] [CrossRef]
- Al-Waeli, A.H.; Sopian, K.; Chaichan, M.T.; Kazem, H.A.; Hasan, H.A.; Al-Shamani, A.N. An experimental investigation of SiC nanofluid as a base-fluid for a photovoltaic thermal PV/T system. Energy Convers. Manag. 2017, 142, 547–558. [Google Scholar] [CrossRef]
- Abdollahi, N.; Rahimi, M.; Karami, N.; Abdollahi, M. Heat transfer enhancement in a hybrid PV cell-cooling tower. Heat Mass-Transf.- Und Stoffuebertragung 2019, 55, 2355–2363. [Google Scholar] [CrossRef]
- Xu, Z.Y.; Wang, R.Z. Comparison of absorption refrigeration cycles for efficient air-cooled solar cooling. Sol. Energy 2018, 172, 14–23. [Google Scholar] [CrossRef]
- Martínez, P.J.; Martínez, P.; Soto, V.M.; Bujedo, L.A.; Rodriguez, J. Design of a 35 kW solar cooling demonstration facility for a hotel in spain. Appl. Sci. 2020, 10, 496. [Google Scholar] [CrossRef]
- Huang, L.; Zheng, R.; Piontek, U. Installation and operation of a solar cooling and heating system incorporated with air-source heat pumps. Energies 2019, 12, 996. [Google Scholar] [CrossRef]
- Aguilar-Jiménez, J.A.; Velázquez, N.; López-Zavala, R.; González-Uribe, L.A.; Beltrán, R.; Hernández-Callejo, L. Simulation of a solar-assisted air-conditioning system applied to a remote school. Appl. Sci. 2019, 9, 3398. [Google Scholar] [CrossRef]
- Reda, A.M.; Ali, A.H.H.; Morsy, M.G.; Taha, I.S. Optimization and performance of a small scale adsorption cooling system fully powered by solar energy for hot arid areas. SN Appl. Sci. 2019, 1, 1096. [Google Scholar] [CrossRef]
- Delač, B.; Pavković, B.; Lenić, K. Design, monitoring and dynamic model development of a solar heating and cooling system. Appl. Therm. Eng. 2018, 142, 489–501. [Google Scholar] [CrossRef]
- Jianzhong, Z.; Kanglin, L.; Furen, Y.; Daguang, Z. Cooling Tower Frosbite-Preventing Technique. Oil-Gas Field Surf. Eng. 1995, 14, 51–52+63. [Google Scholar]
- Pushnov, A.S.; Lozovaya, N.P. Anti-icing systems of the mechanical-draft cooling towers. Russ. J. Appl. Chem. 2010, 83, 2220–2228. [Google Scholar] [CrossRef]
- Cheng, S.; Yonghong, Z.; Jingjing, T. Study of the Integration Technology between Air Inlet Diversion and Frost Proofing for the Cooling Tower. Electr. Power Constr. 2011, 32, 89–91. [Google Scholar]
- Yonghua, L.; Haijun, Z.; Changyuan, P.; Yanfang, L. Numerical Study on the Temperature Field in Wet Cooling Tower and the Anti-icing Measures Under the Influence of Horizontal Wind Speed. Proc. CSEE 2013, 33, 58–64+11. [Google Scholar] [CrossRef]
- Kong, Y.; Wang, W.; Yang, L.; Du, X. Energy efficient strategies for anti-freezing of air-cooled heat exchanger. Appl. Energy 2020, 261, 114468. [Google Scholar] [CrossRef]
- Kong, Y.; Wang, W.; Yang, L.; Du, X.; Yang, Y. Water redistribution among various sectors to avoid freezing of air-cooled heat exchanger. Int. J. Heat Mass Transf. 2019, 141, 294–309. [Google Scholar] [CrossRef]
- Yan, J.; Huang, X.; Huang, W.; Yang, L.; Du, X. Auxiliary heat exchanger layout for freeze-proofing and performance recovery of natural draft dry cooling system. Int. J. Heat Mass Transf. 2020, 150, 119381. [Google Scholar] [CrossRef]
- Cheng, T.; Zhao, Z.; Lv, J.; Yu, H. Anti-freezing performances of novel natural draft dry cooling tower with double-layer air-cooled heat exchanger. In Proceedings of the 4th IEEE International Conference on Automation, Electronics and Electrical Engineering, AUTEEE 2021, Shenyang, China, 19–21 November 2021; pp. 532–540. [Google Scholar] [CrossRef]
- Amer, M.; Wang, C.C. Review of defrosting methods. Renew. Sustain. Energy Rev. 2017, 73, 53–74. [Google Scholar] [CrossRef]
- Amer, M.; Wang, C.C. An experimental study on frosting and hybrid defrosting of a cold flat plate under natural convection. Int. J. Heat Mass Transf. 2021, 164, 120560. [Google Scholar] [CrossRef]
- Shiming, Y.; Wenquan, T. Heat Transfer, 4th ed.; High Education Press: Beijing, China, 2006. [Google Scholar]
- Liu, J.n.; Zhang, L.x.; Lin, Z.h.; Gao, M.; Chen, H. Research of technical and economic performance of plastic capillary mats used as the heat exchanger of a closed-circuit cooling tower. Appl. Therm. Eng. 2019, 153, 800–807. [Google Scholar] [CrossRef]
- Zhihong, G.; Xiaohua, L.; Yi, J. Experiment study on cooling capacity of capillary-tube radiation air-conditioner. Acta Energiae Solaris Sin. 2011, 32, 101–106. [Google Scholar]
- Xudi, W. Experimental Research on Terminal Performance of Floor Cooling with Capillary Tubes in Hot-Humid Area. Master Thesis, Chongqing University, Chongqing, China, 2016. [Google Scholar]
- Chenqiu, D.; Baizhan, L.; Hong, L.; Yong, C.; Jinhua, C. Experimental study on wall and ceiling capillary radiant cooling performance. J. HV & AC 2018, 48, 103–110. [Google Scholar]
- Su, X.; Zhang, L.; Liu, Z.; Luo, Y.; Lian, J.; Luo, Y. A computational model of an improved cooling radiant ceiling panel system for optimization and design. Build. Environ. 2019, 163, 106312. [Google Scholar] [CrossRef]
- Baotian, C. The Indoor Environment Numerical Simulation Research of Radiant Refrigeration of Capillary Network and Personalized Ventilation. Master Thesis, Xi’an University of Science and Technology, Xi’an, China, 2020. [Google Scholar] [CrossRef]
- Tong, L.; Liu, N.; Hu, S.; Ji, Y.; Lu, S.; Liu, G.; Tong, Z. Study on key design parameters of subway source heat pump system with capillary exchanger. Renew. Energy 2021, 164, 183–193. [Google Scholar] [CrossRef]
- ASHRAE Handbook—Fundamentals; ASHRAE: Atlanta, GA, USA, 2021.
| Publisher’s Note: MDPI stays neutral with regard to jurisdictional claims in published maps and institutional affiliations. |
© 2022 by the authors. Licensee MDPI, Basel, Switzerland. This article is an open access article distributed under the terms and conditions of the Creative Commons Attribution (CC BY) license (https://creativecommons.org/licenses/by/4.0/).


 ,
, 


