


Two-Phase Experimentation to Determine the Optimal Composition for the Production of Biogas and Biol Substrate Mixing Waste from the Camal de Guayaquil


Abstract
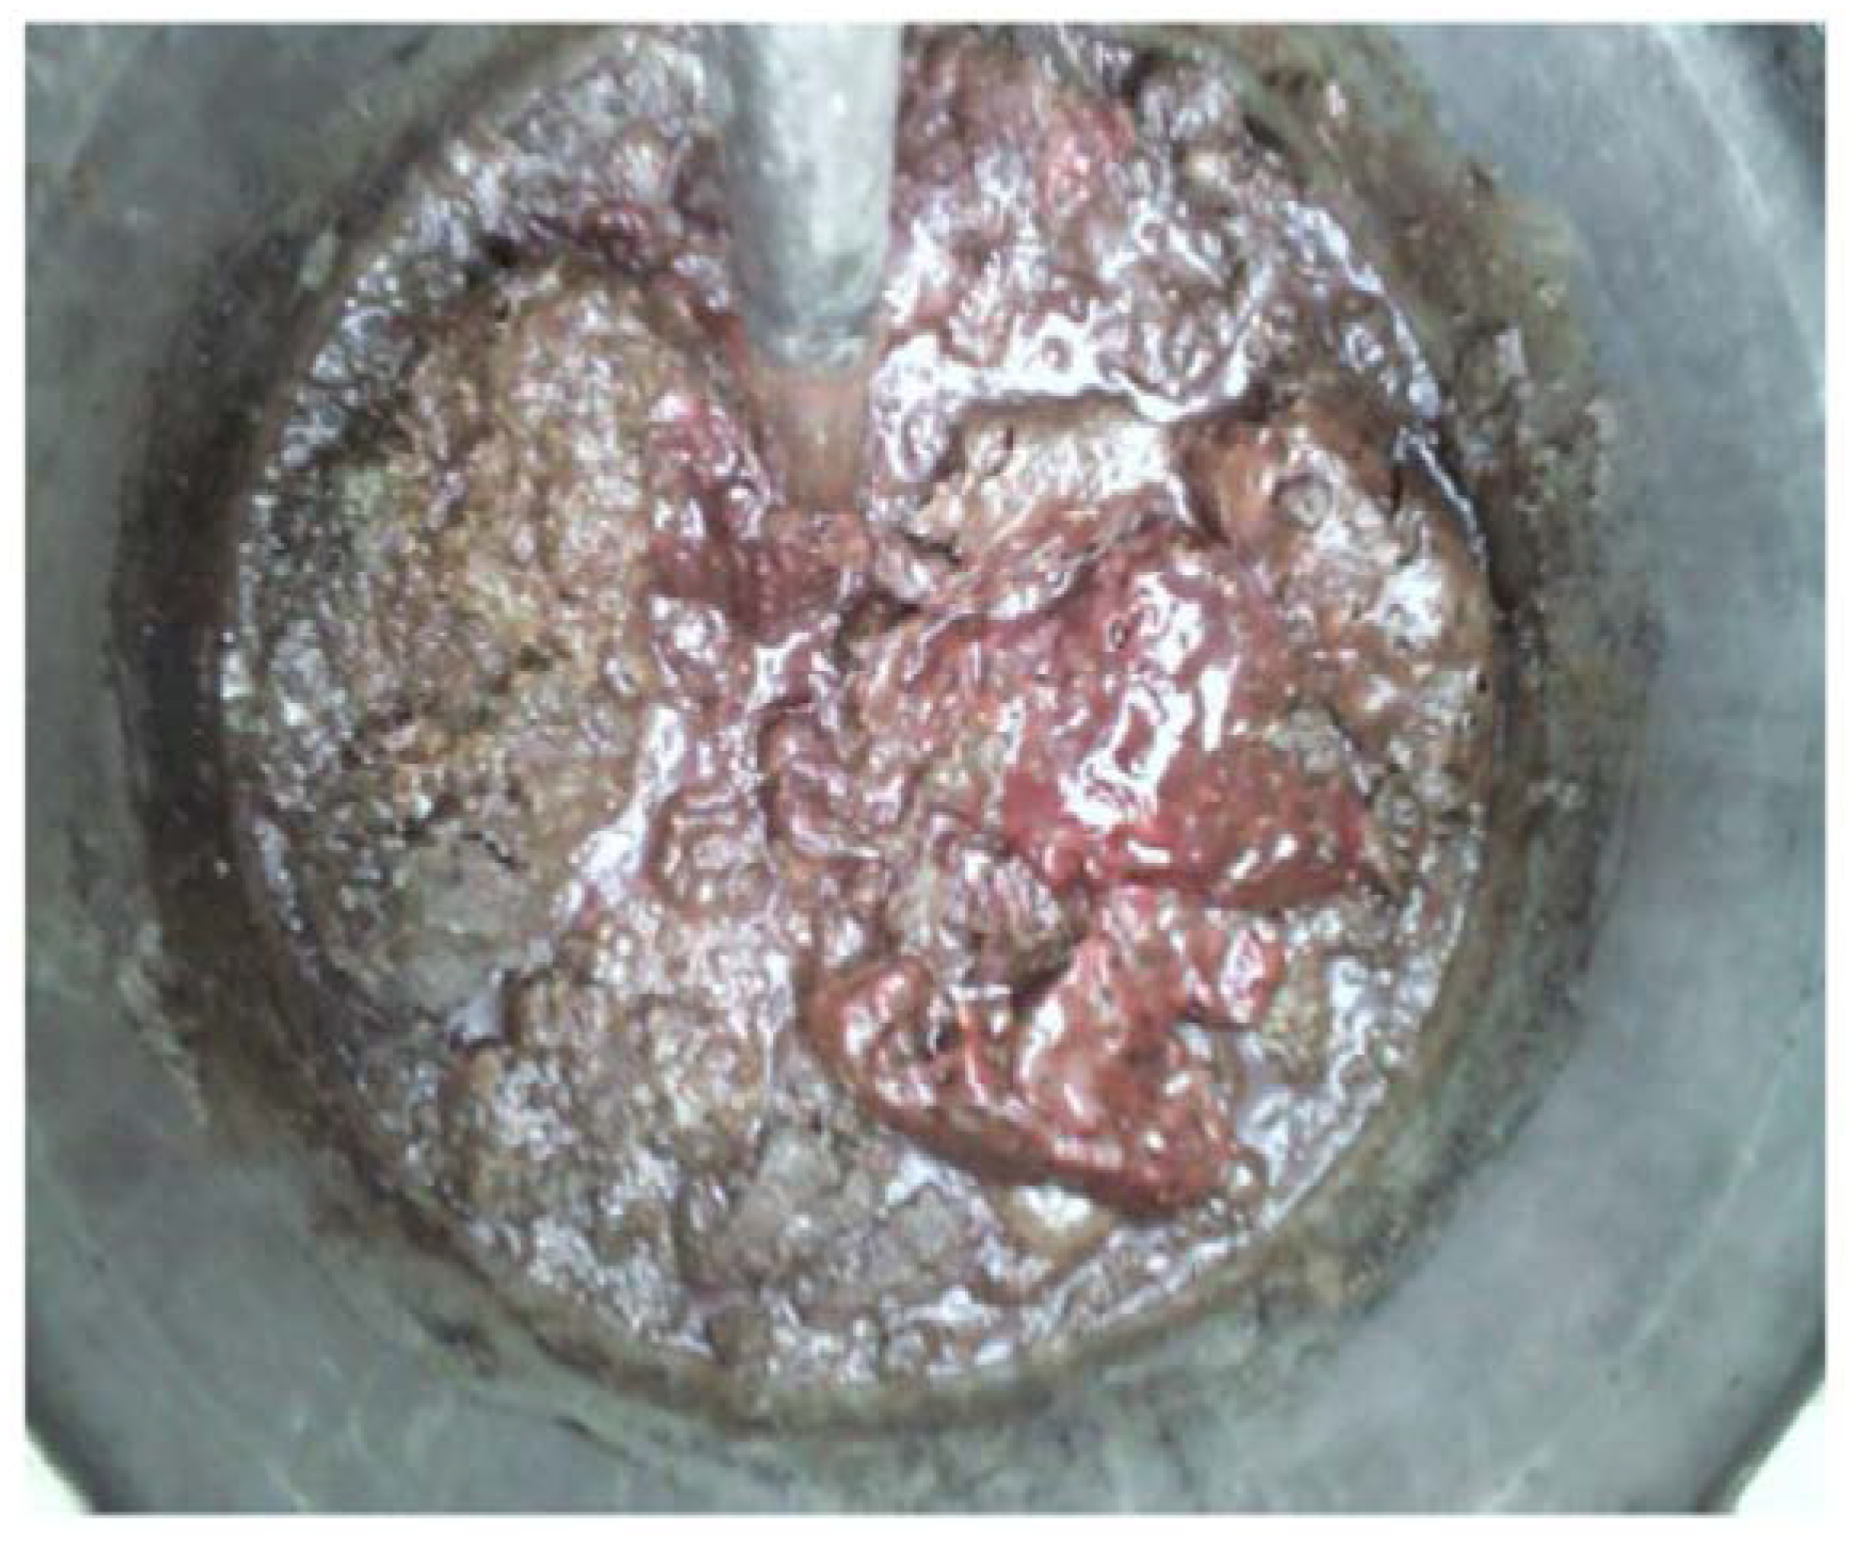
:1. Introduction
Residues and Conditions Imposed for Tests One to Six
2. Materials and Methods
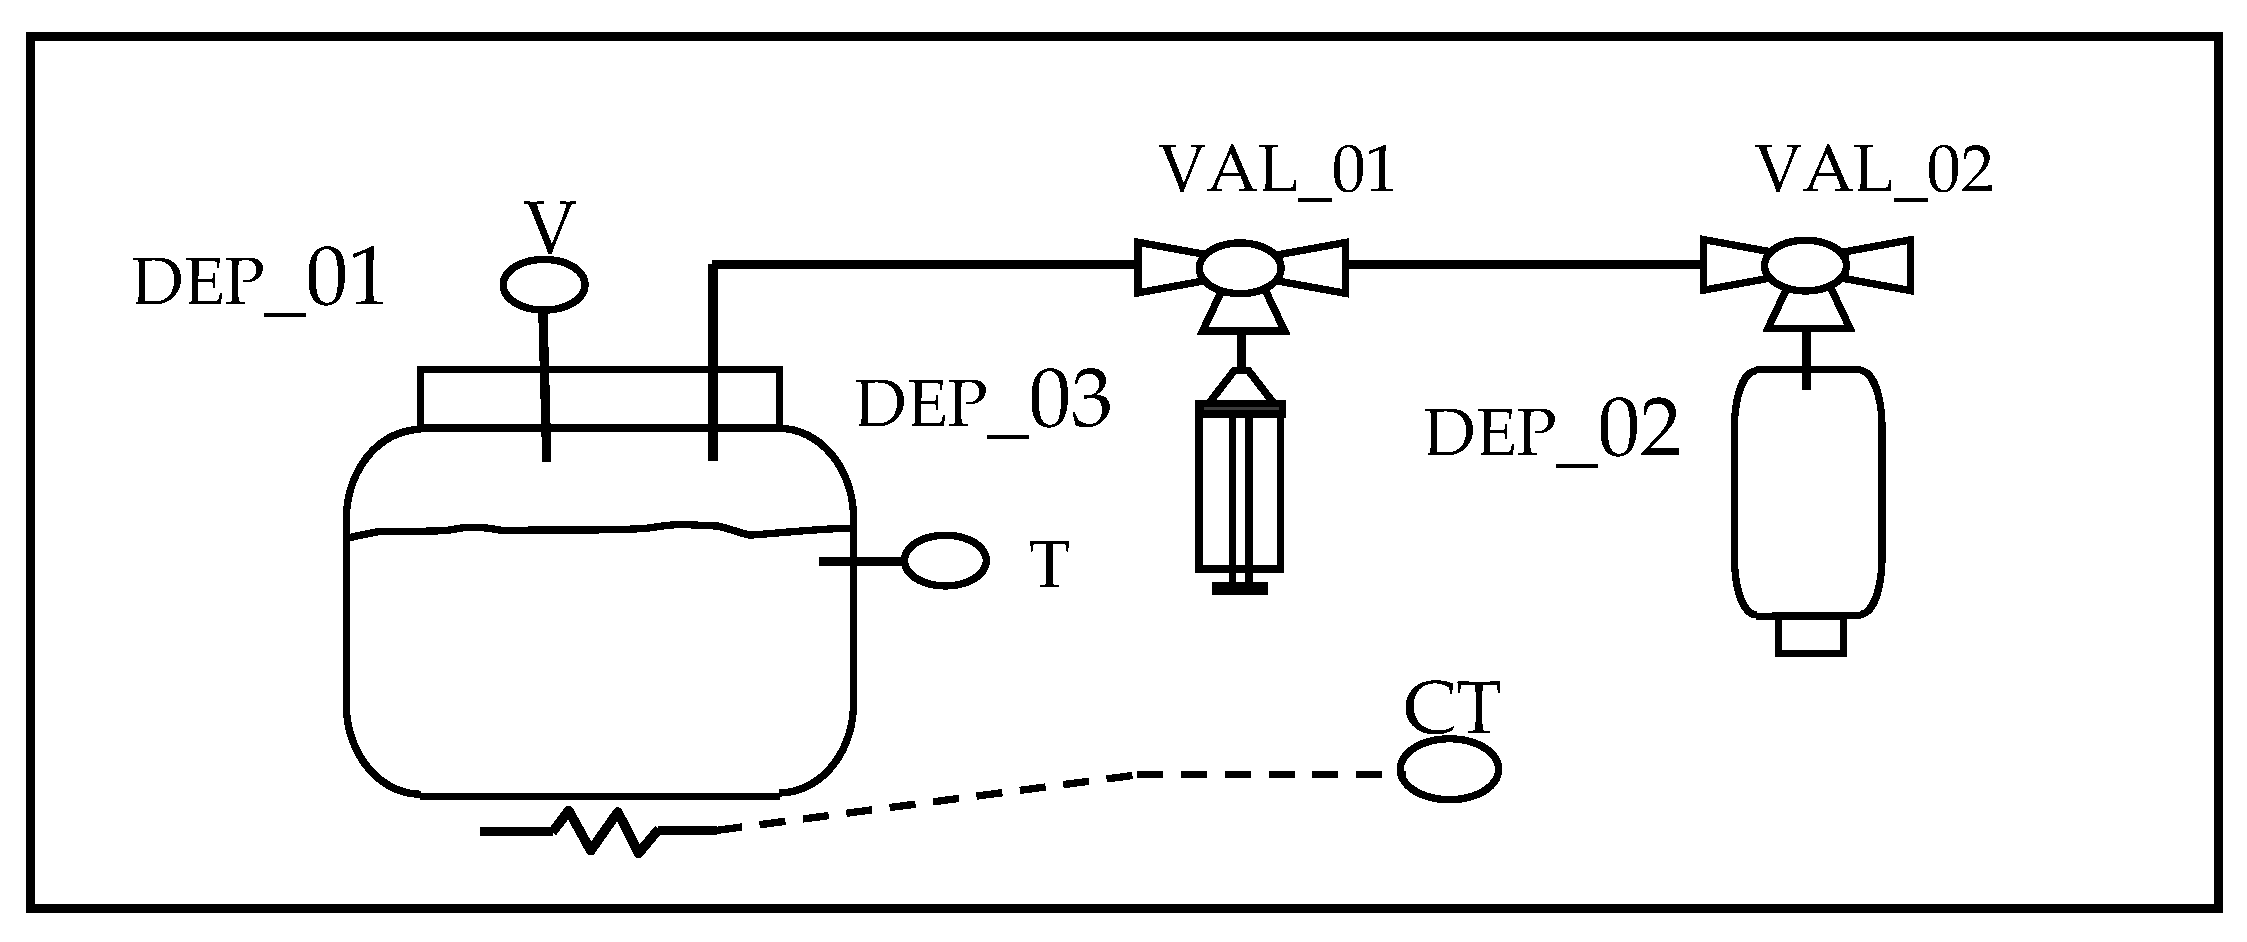
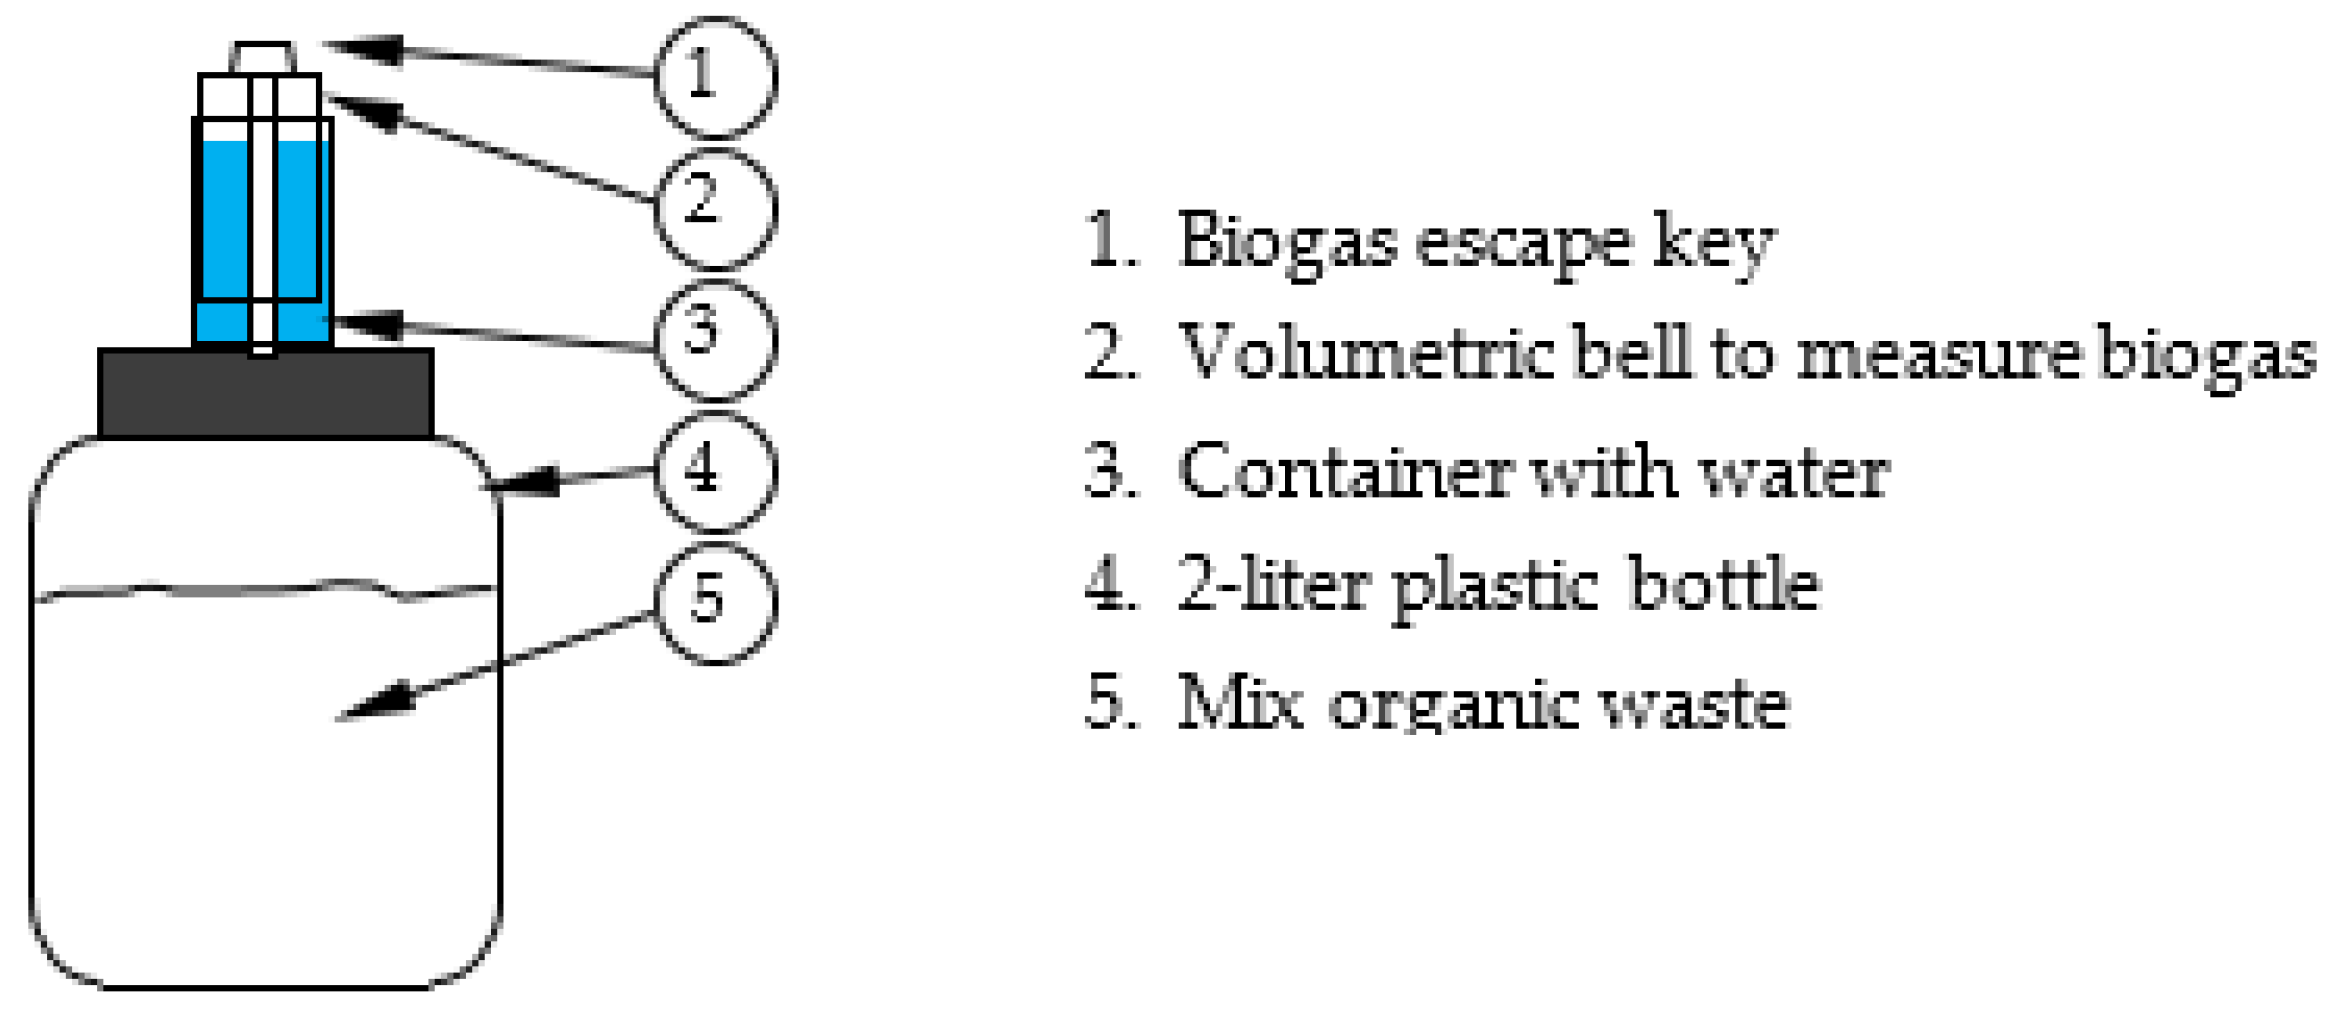
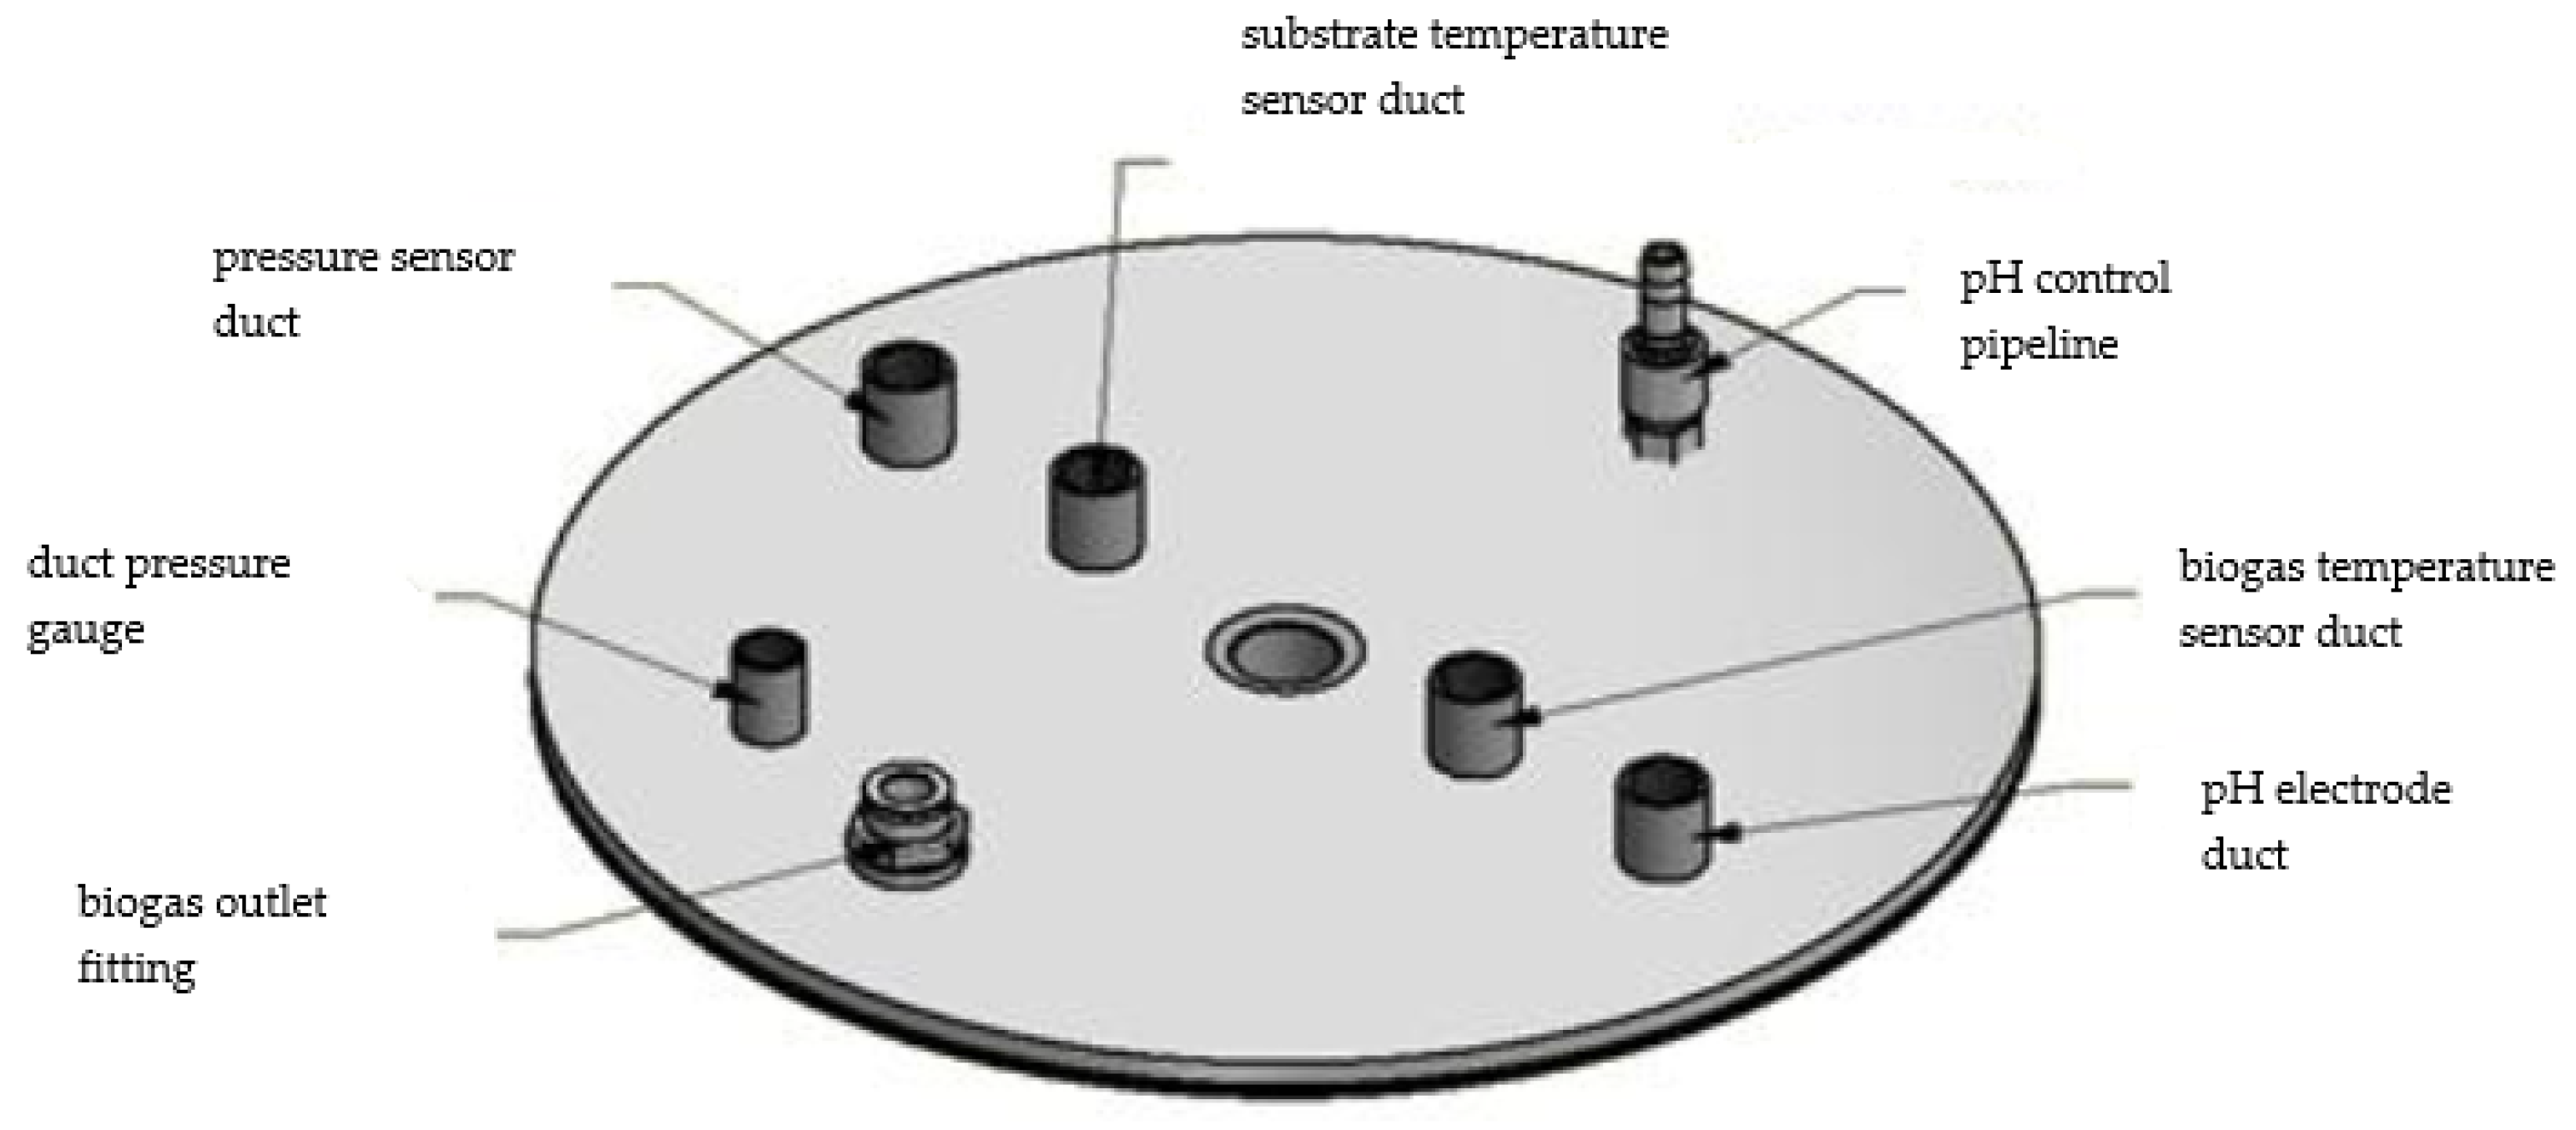
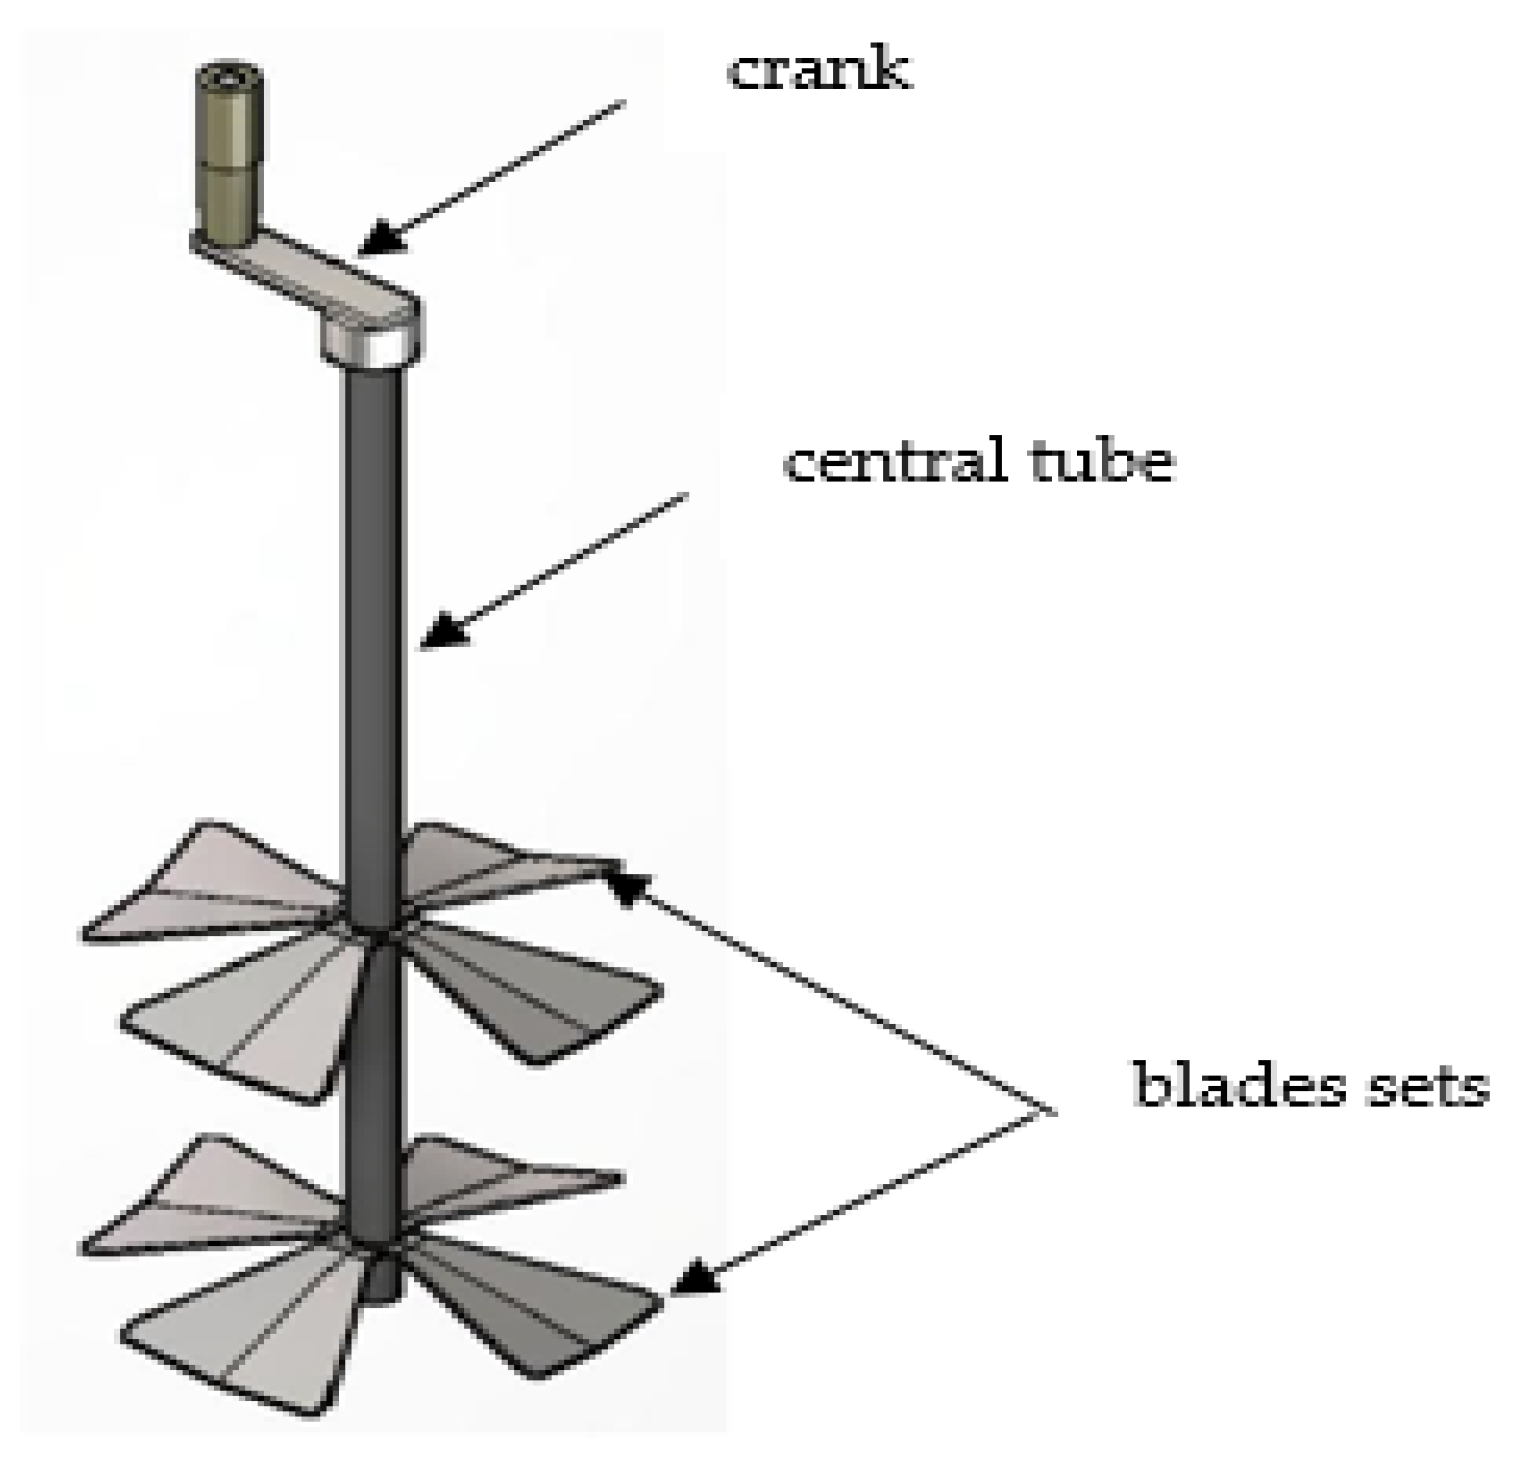
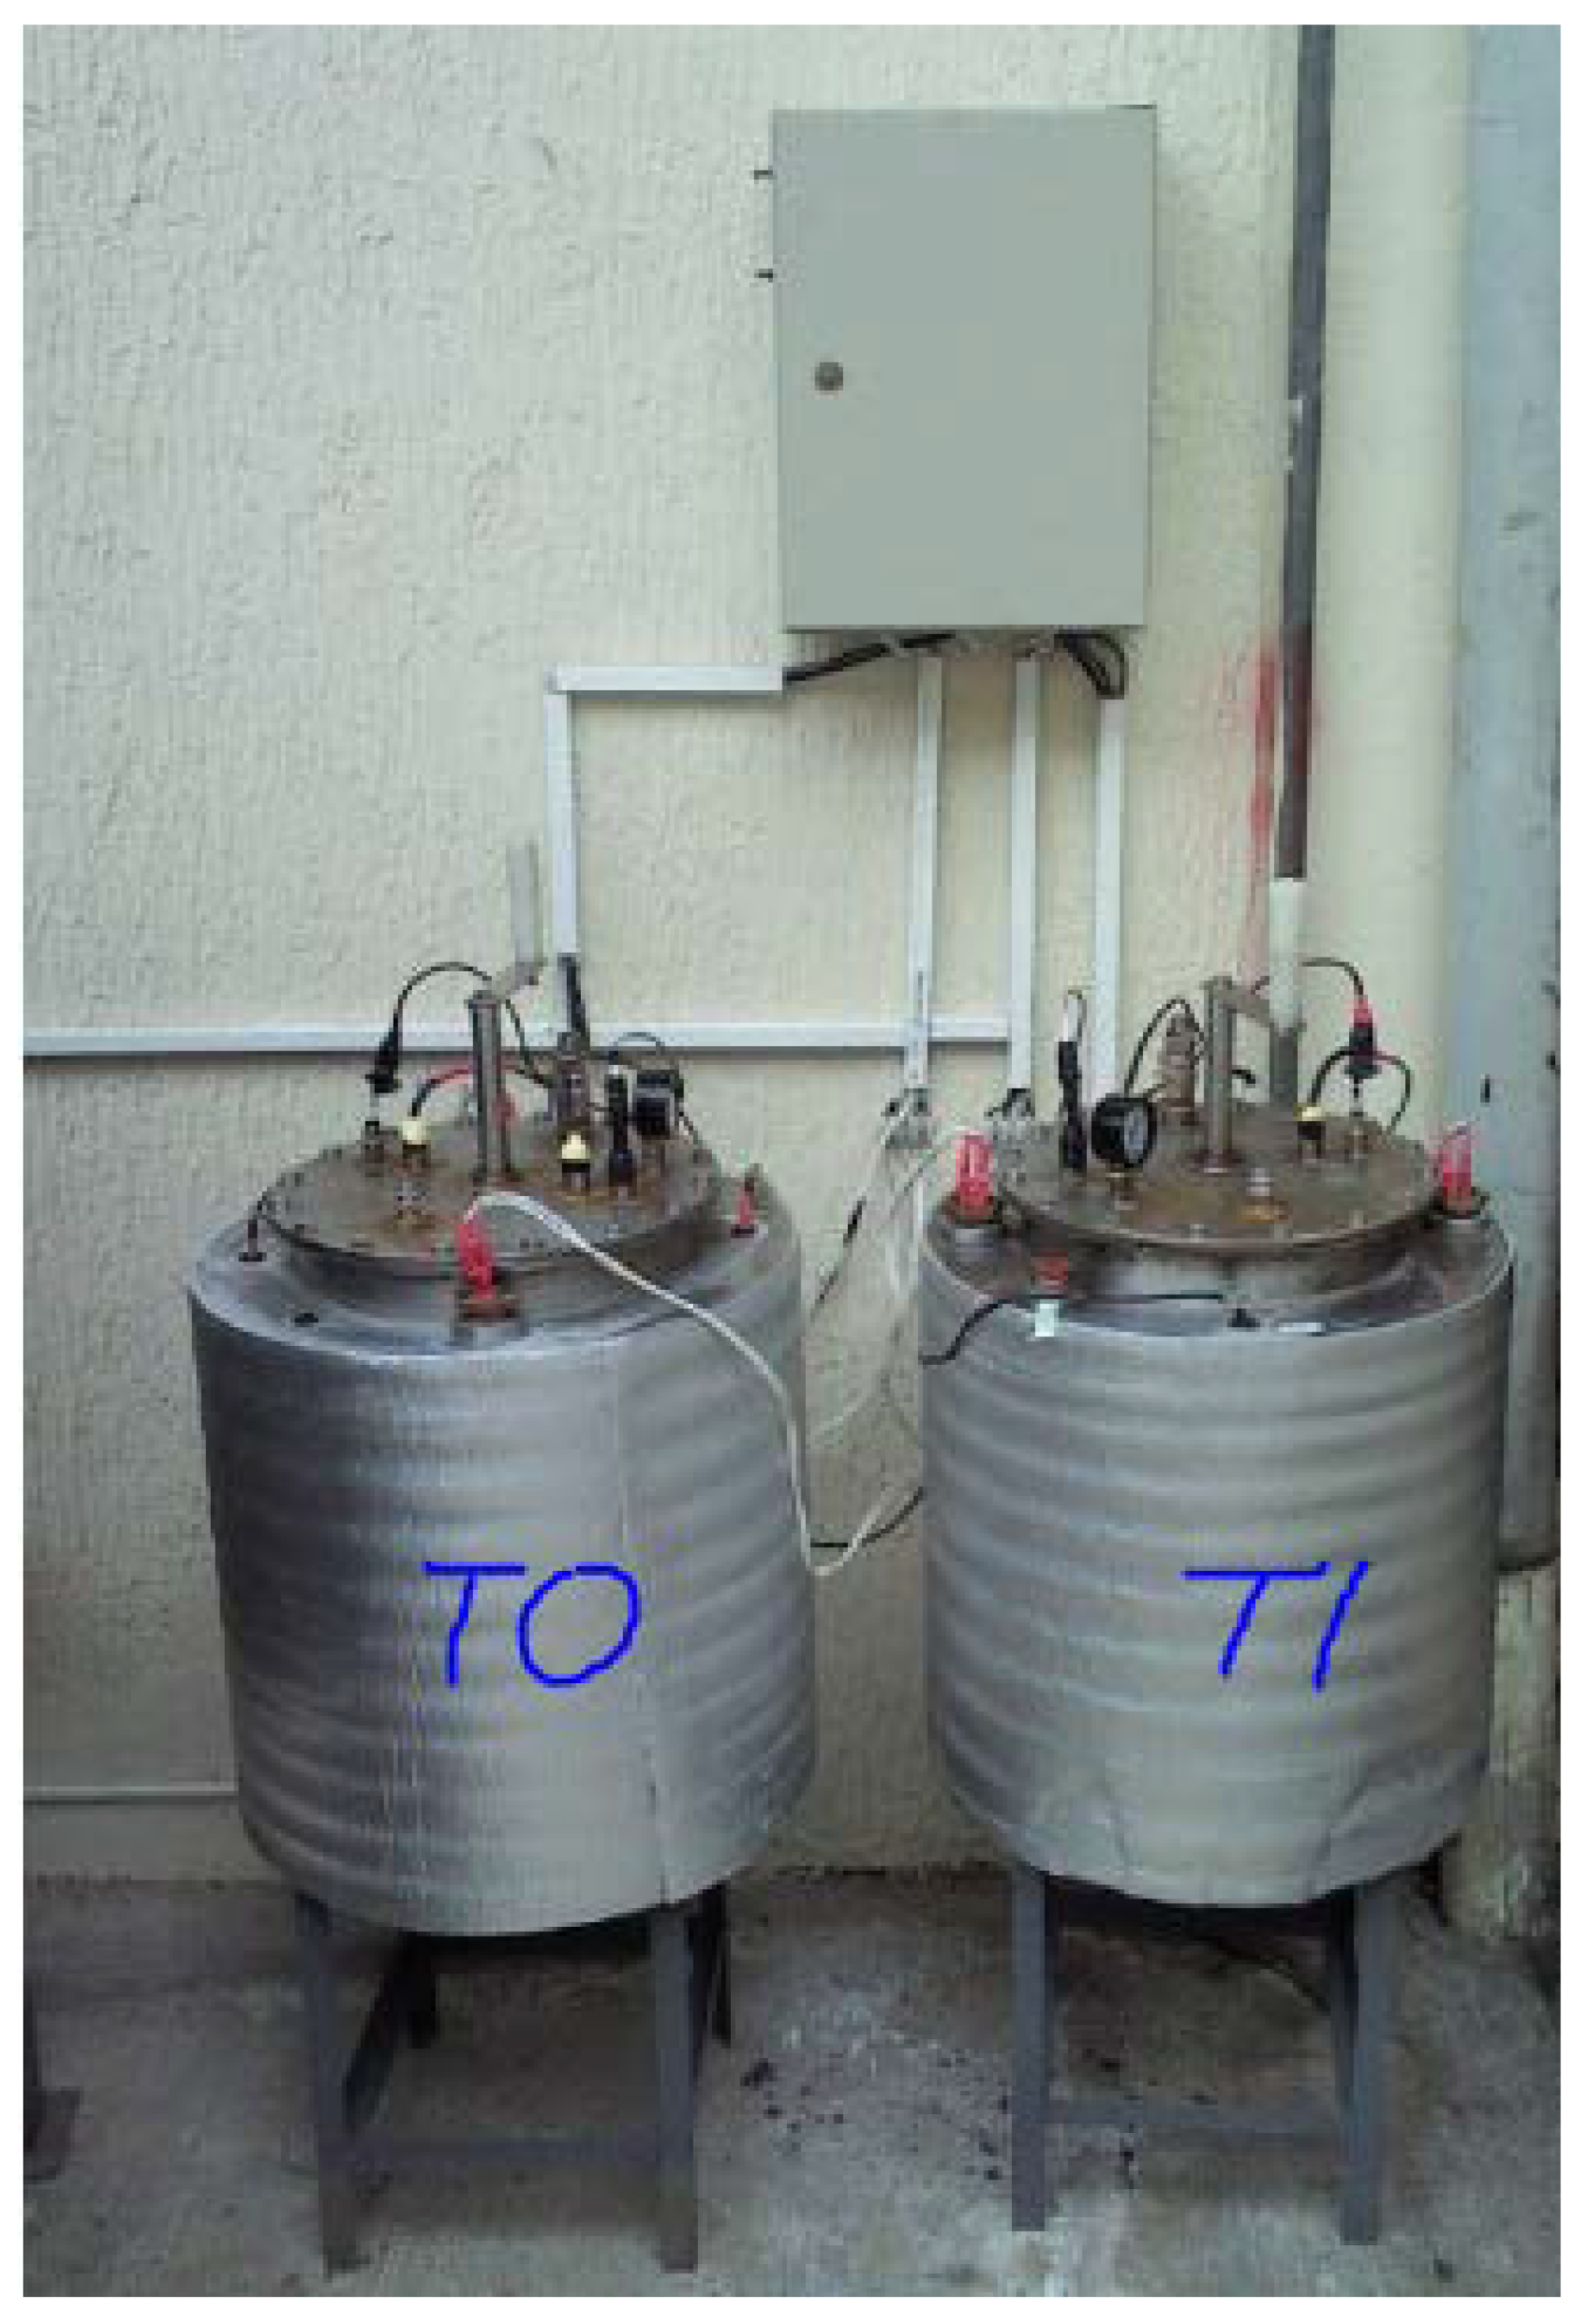
2.1. Microplant for Biogas Production
2.2. Composition of the Substrate
3. Results and Discussion
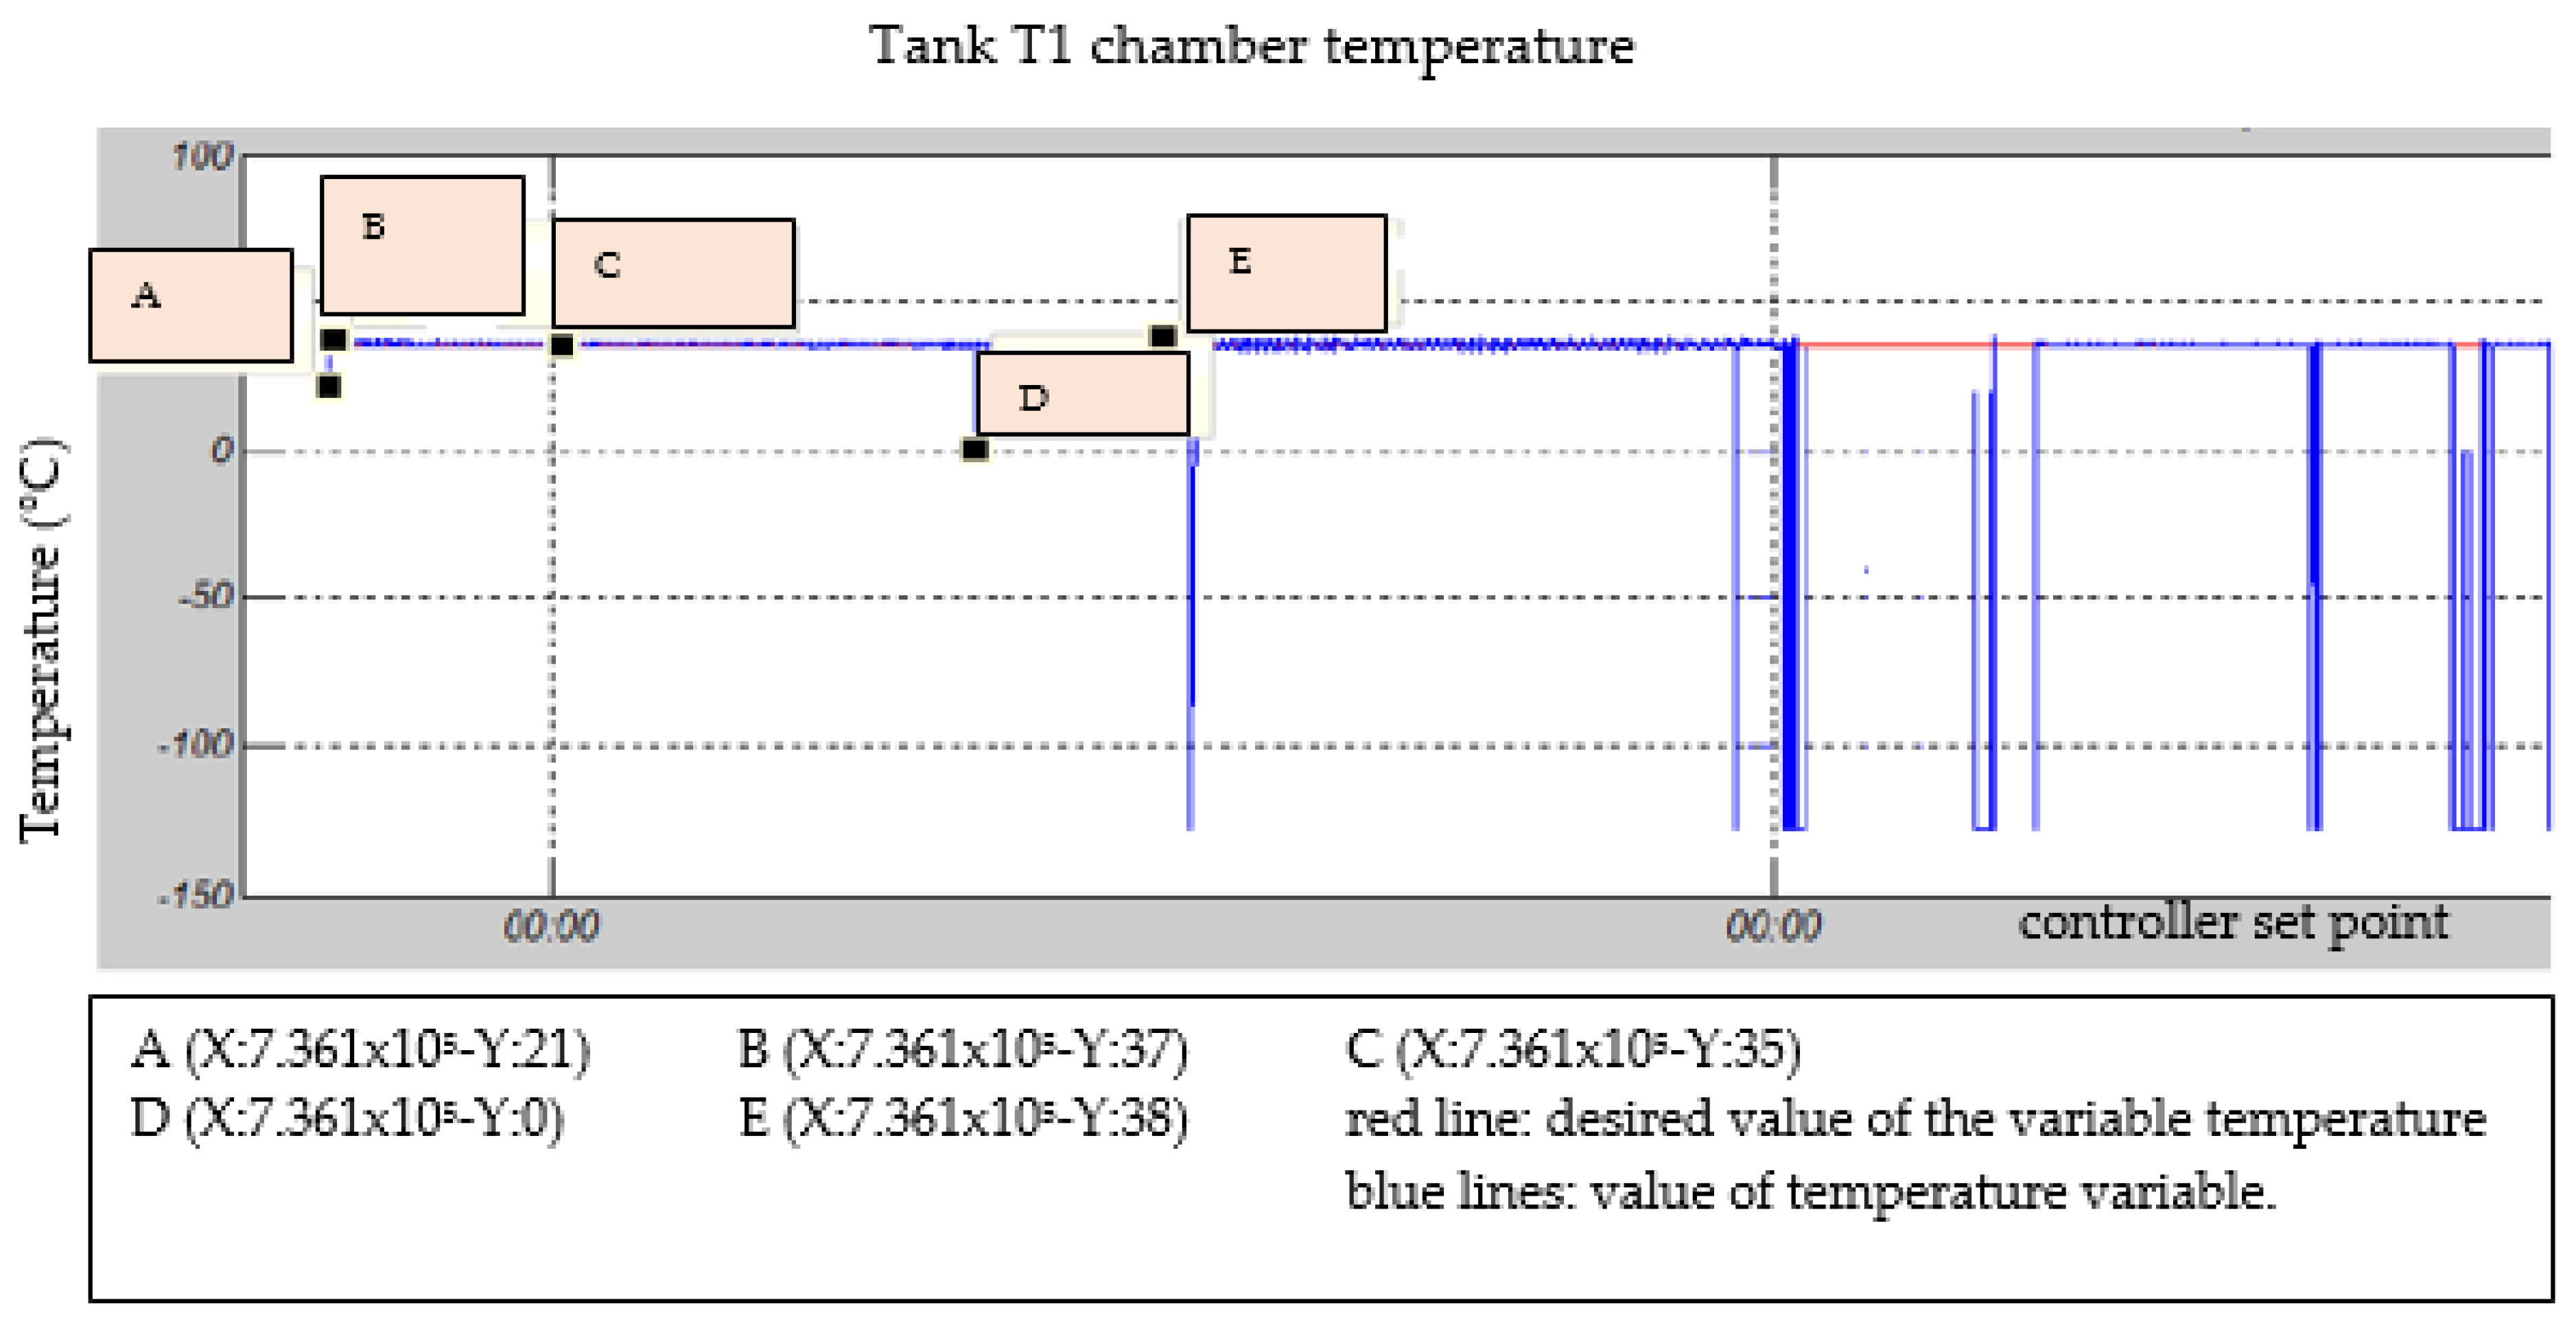
3.1. Temperature in the Water Chamber
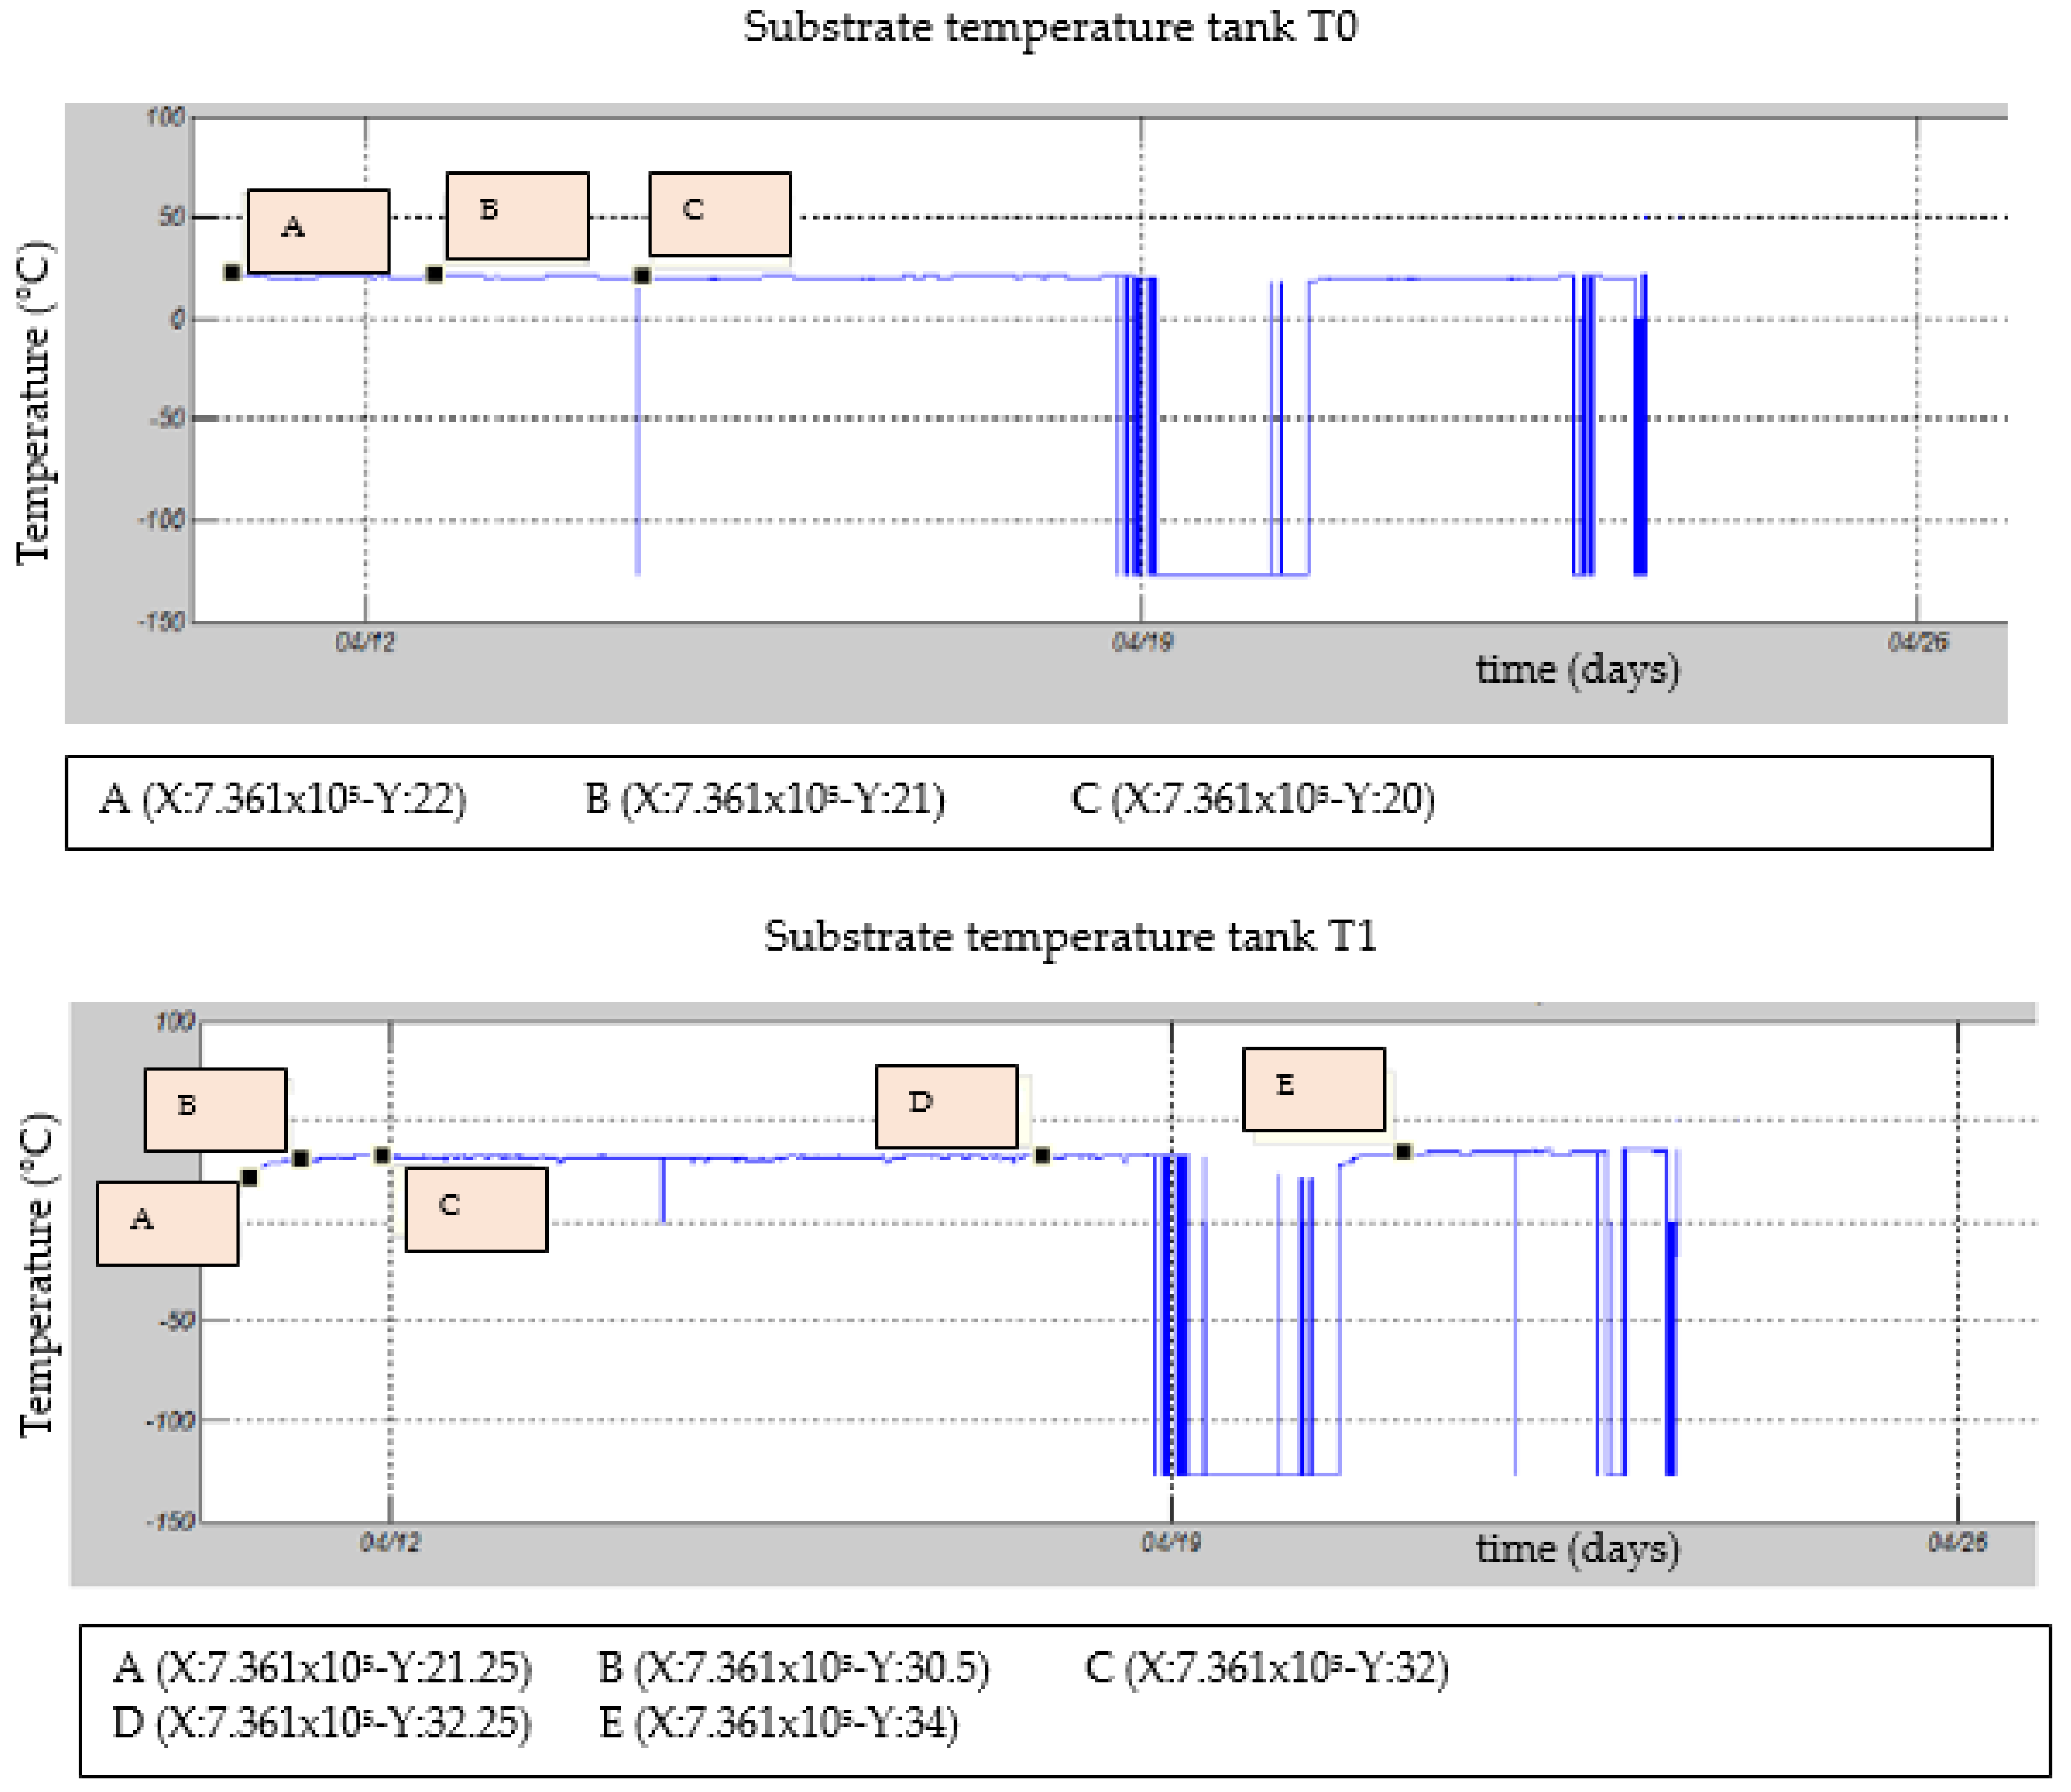
3.2. Temperature inside the Substrate or Fermentation Chamber
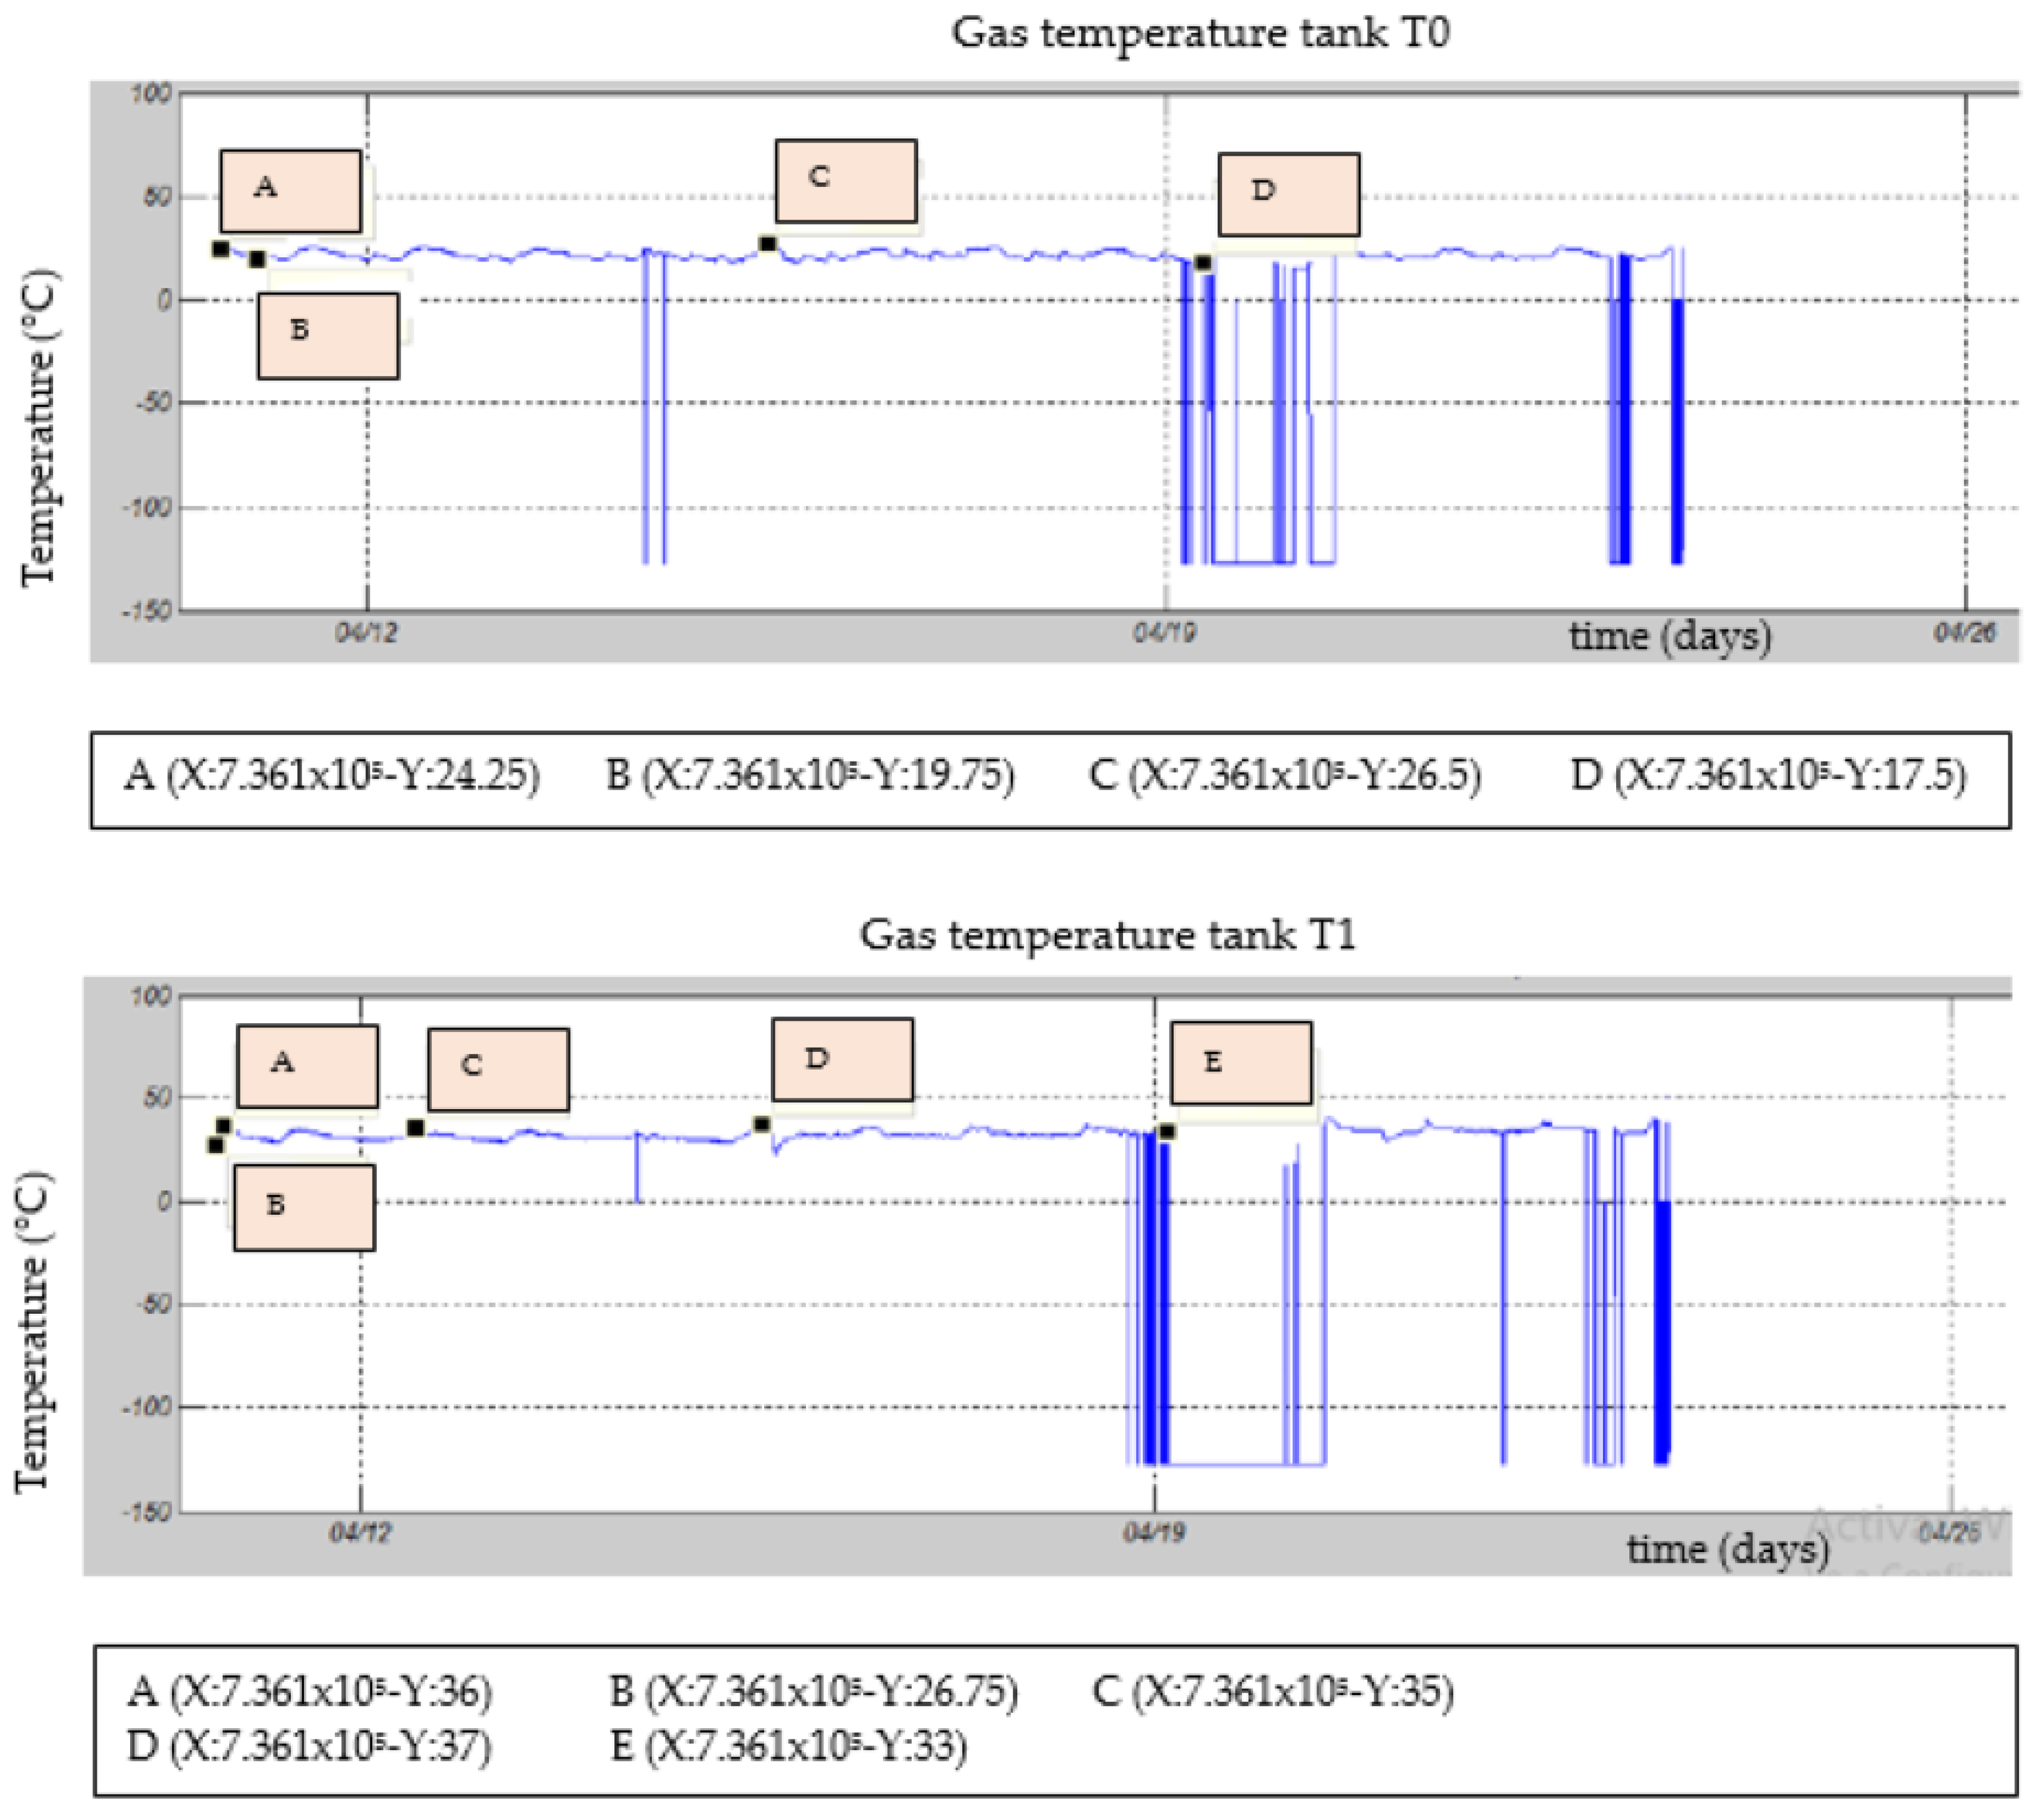
3.3. Gas Temperature inside the Fermentation Chamber
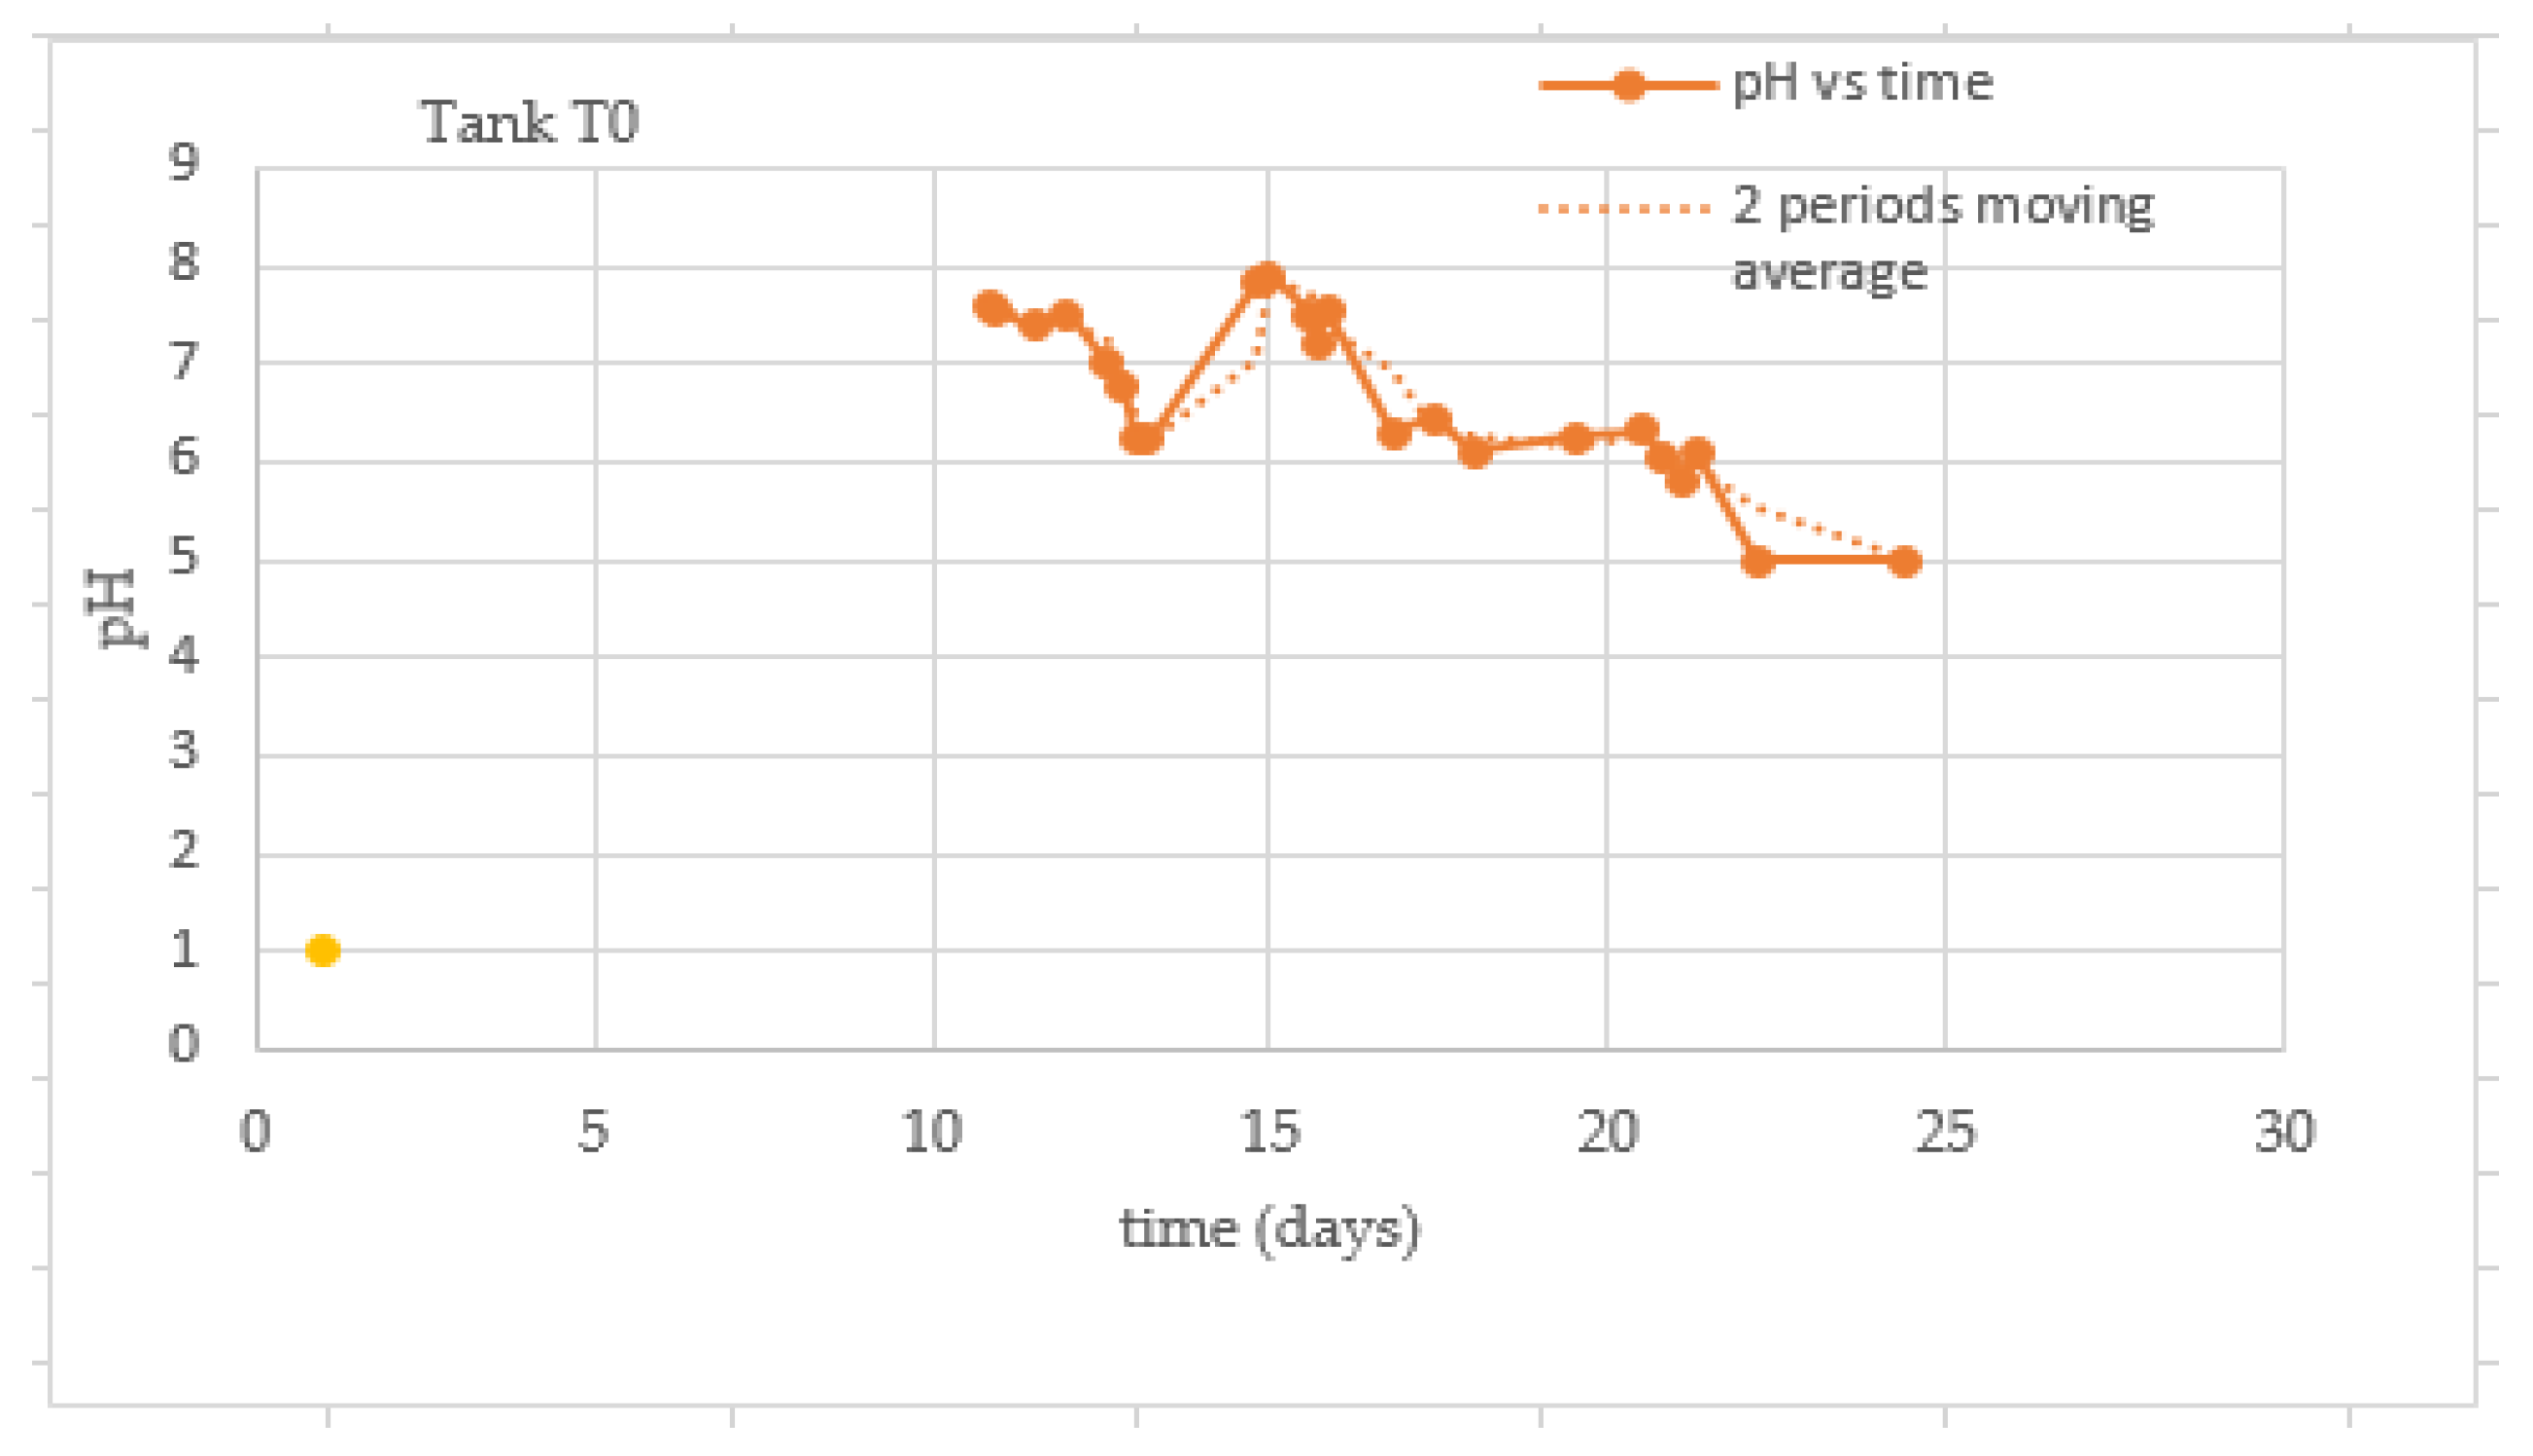
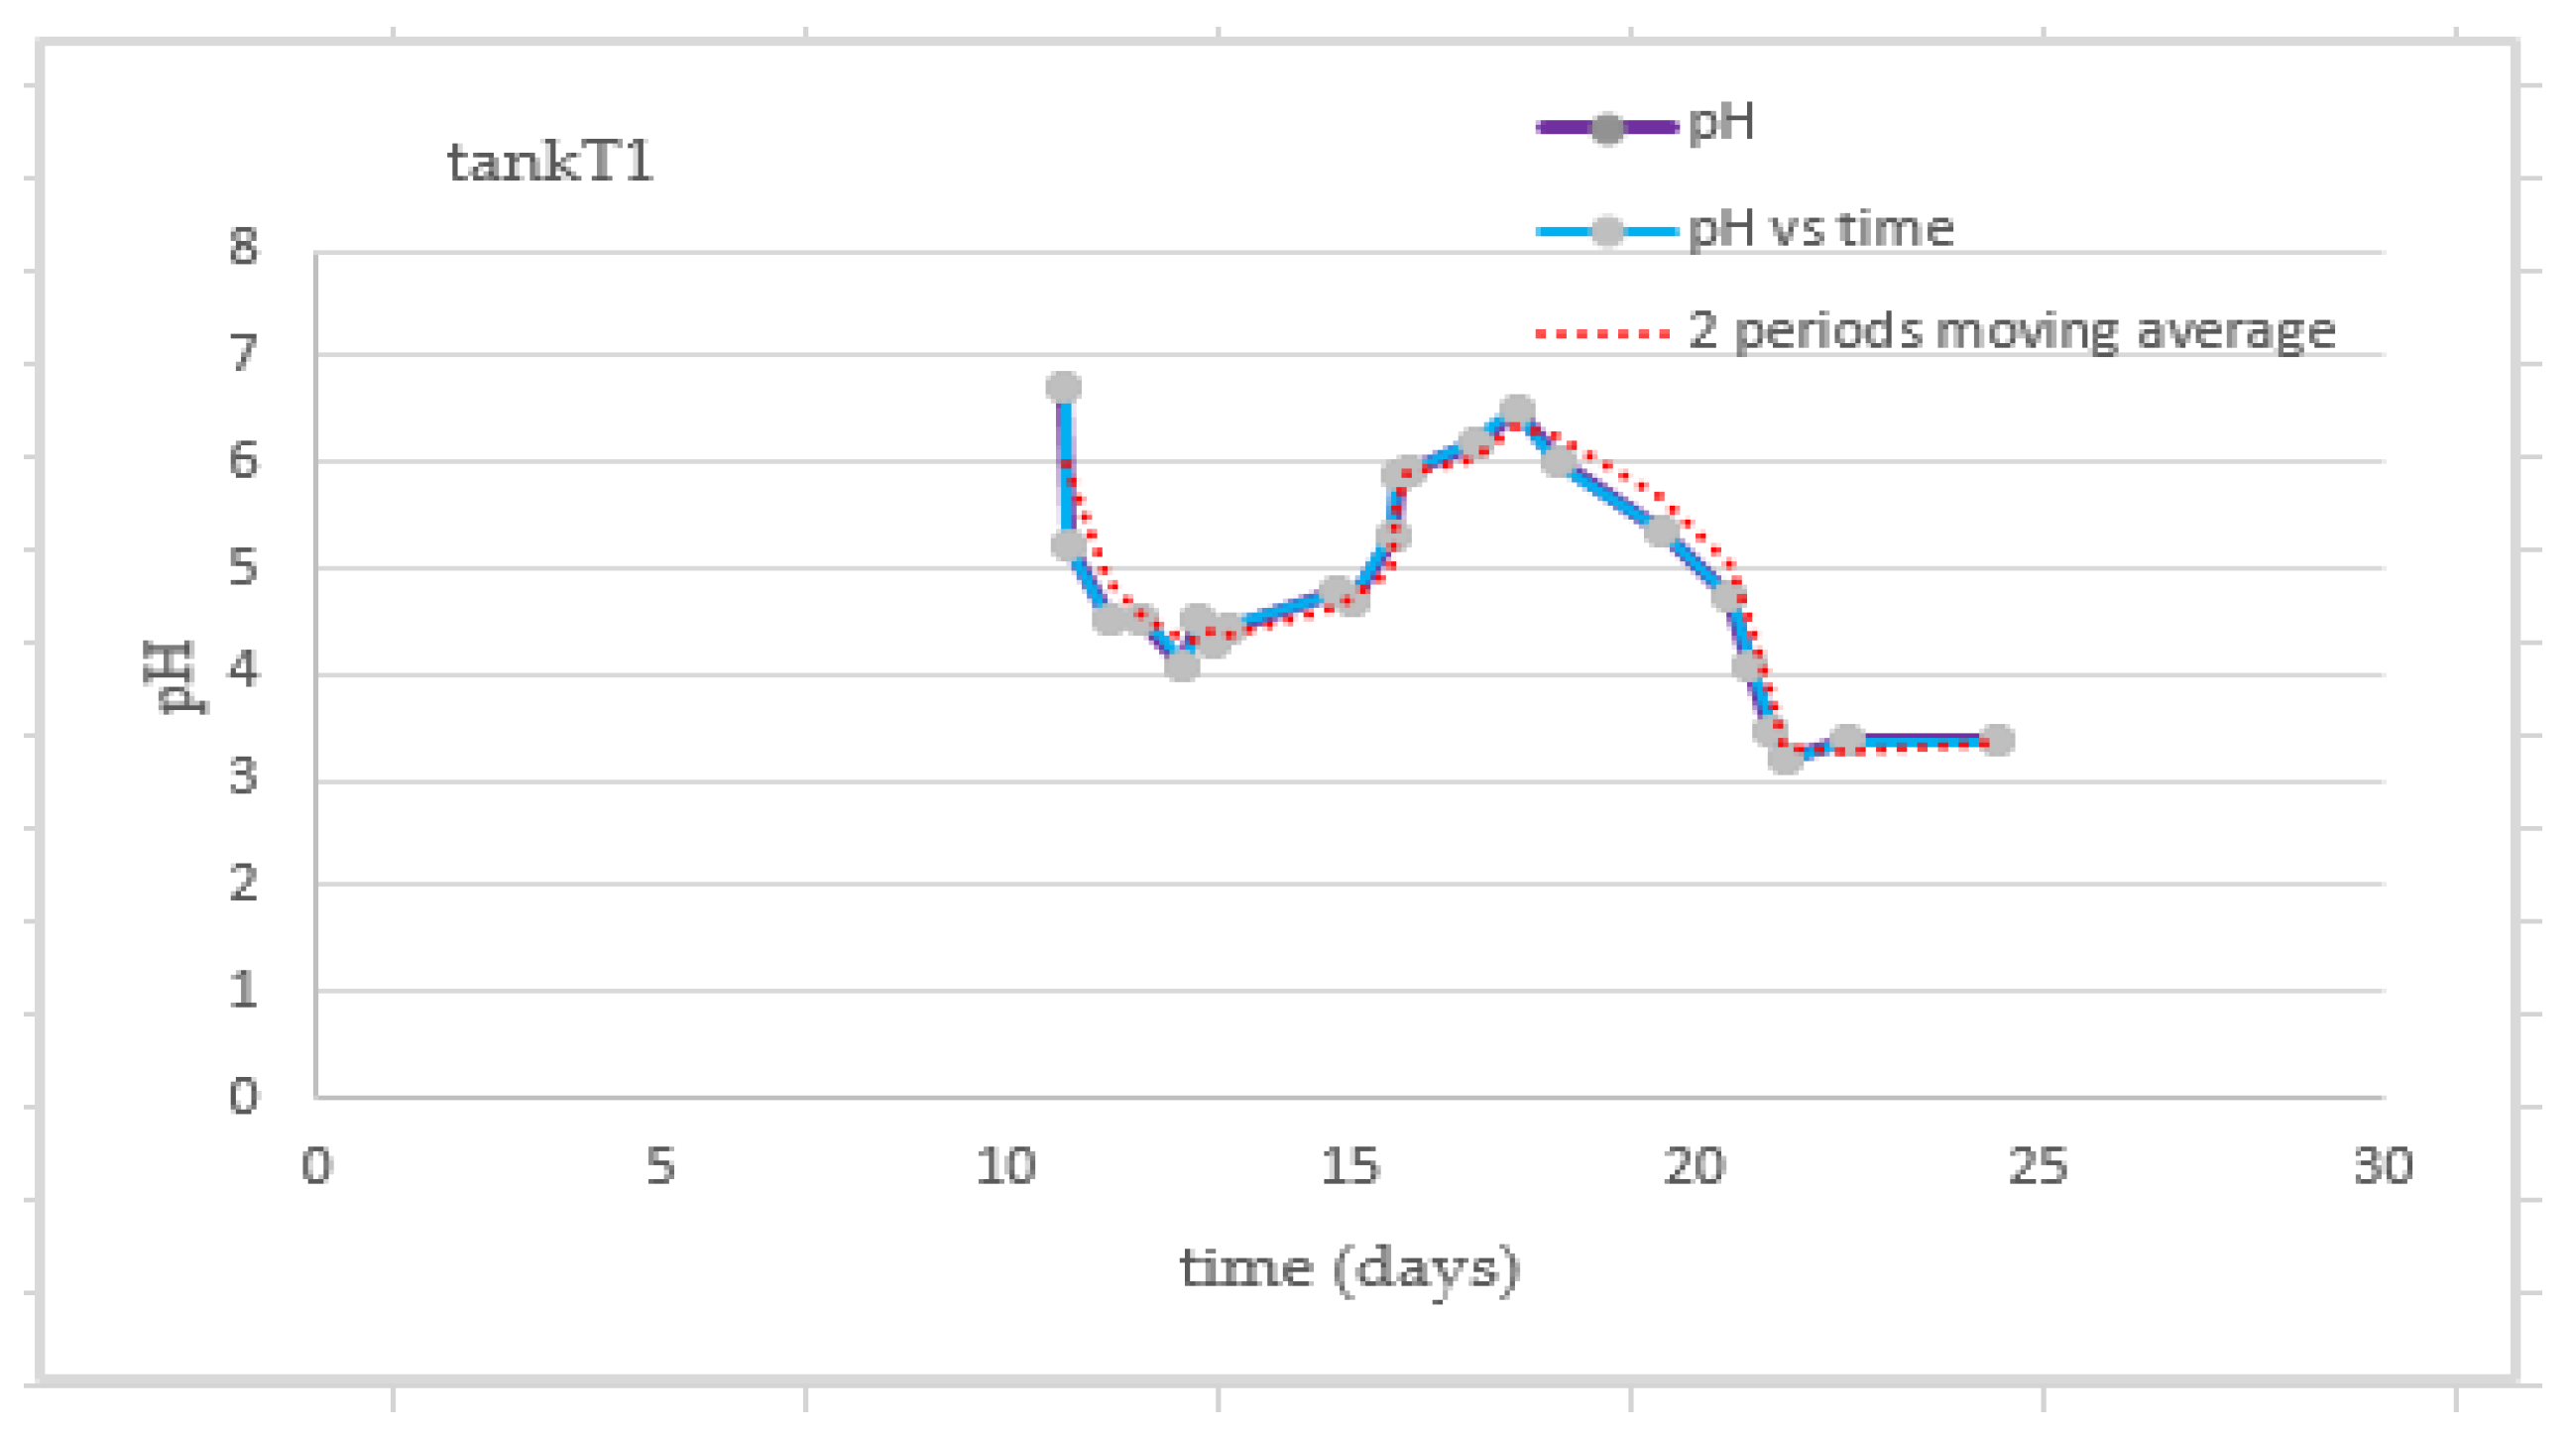
3.4. Behavior of the pH of the Substrate
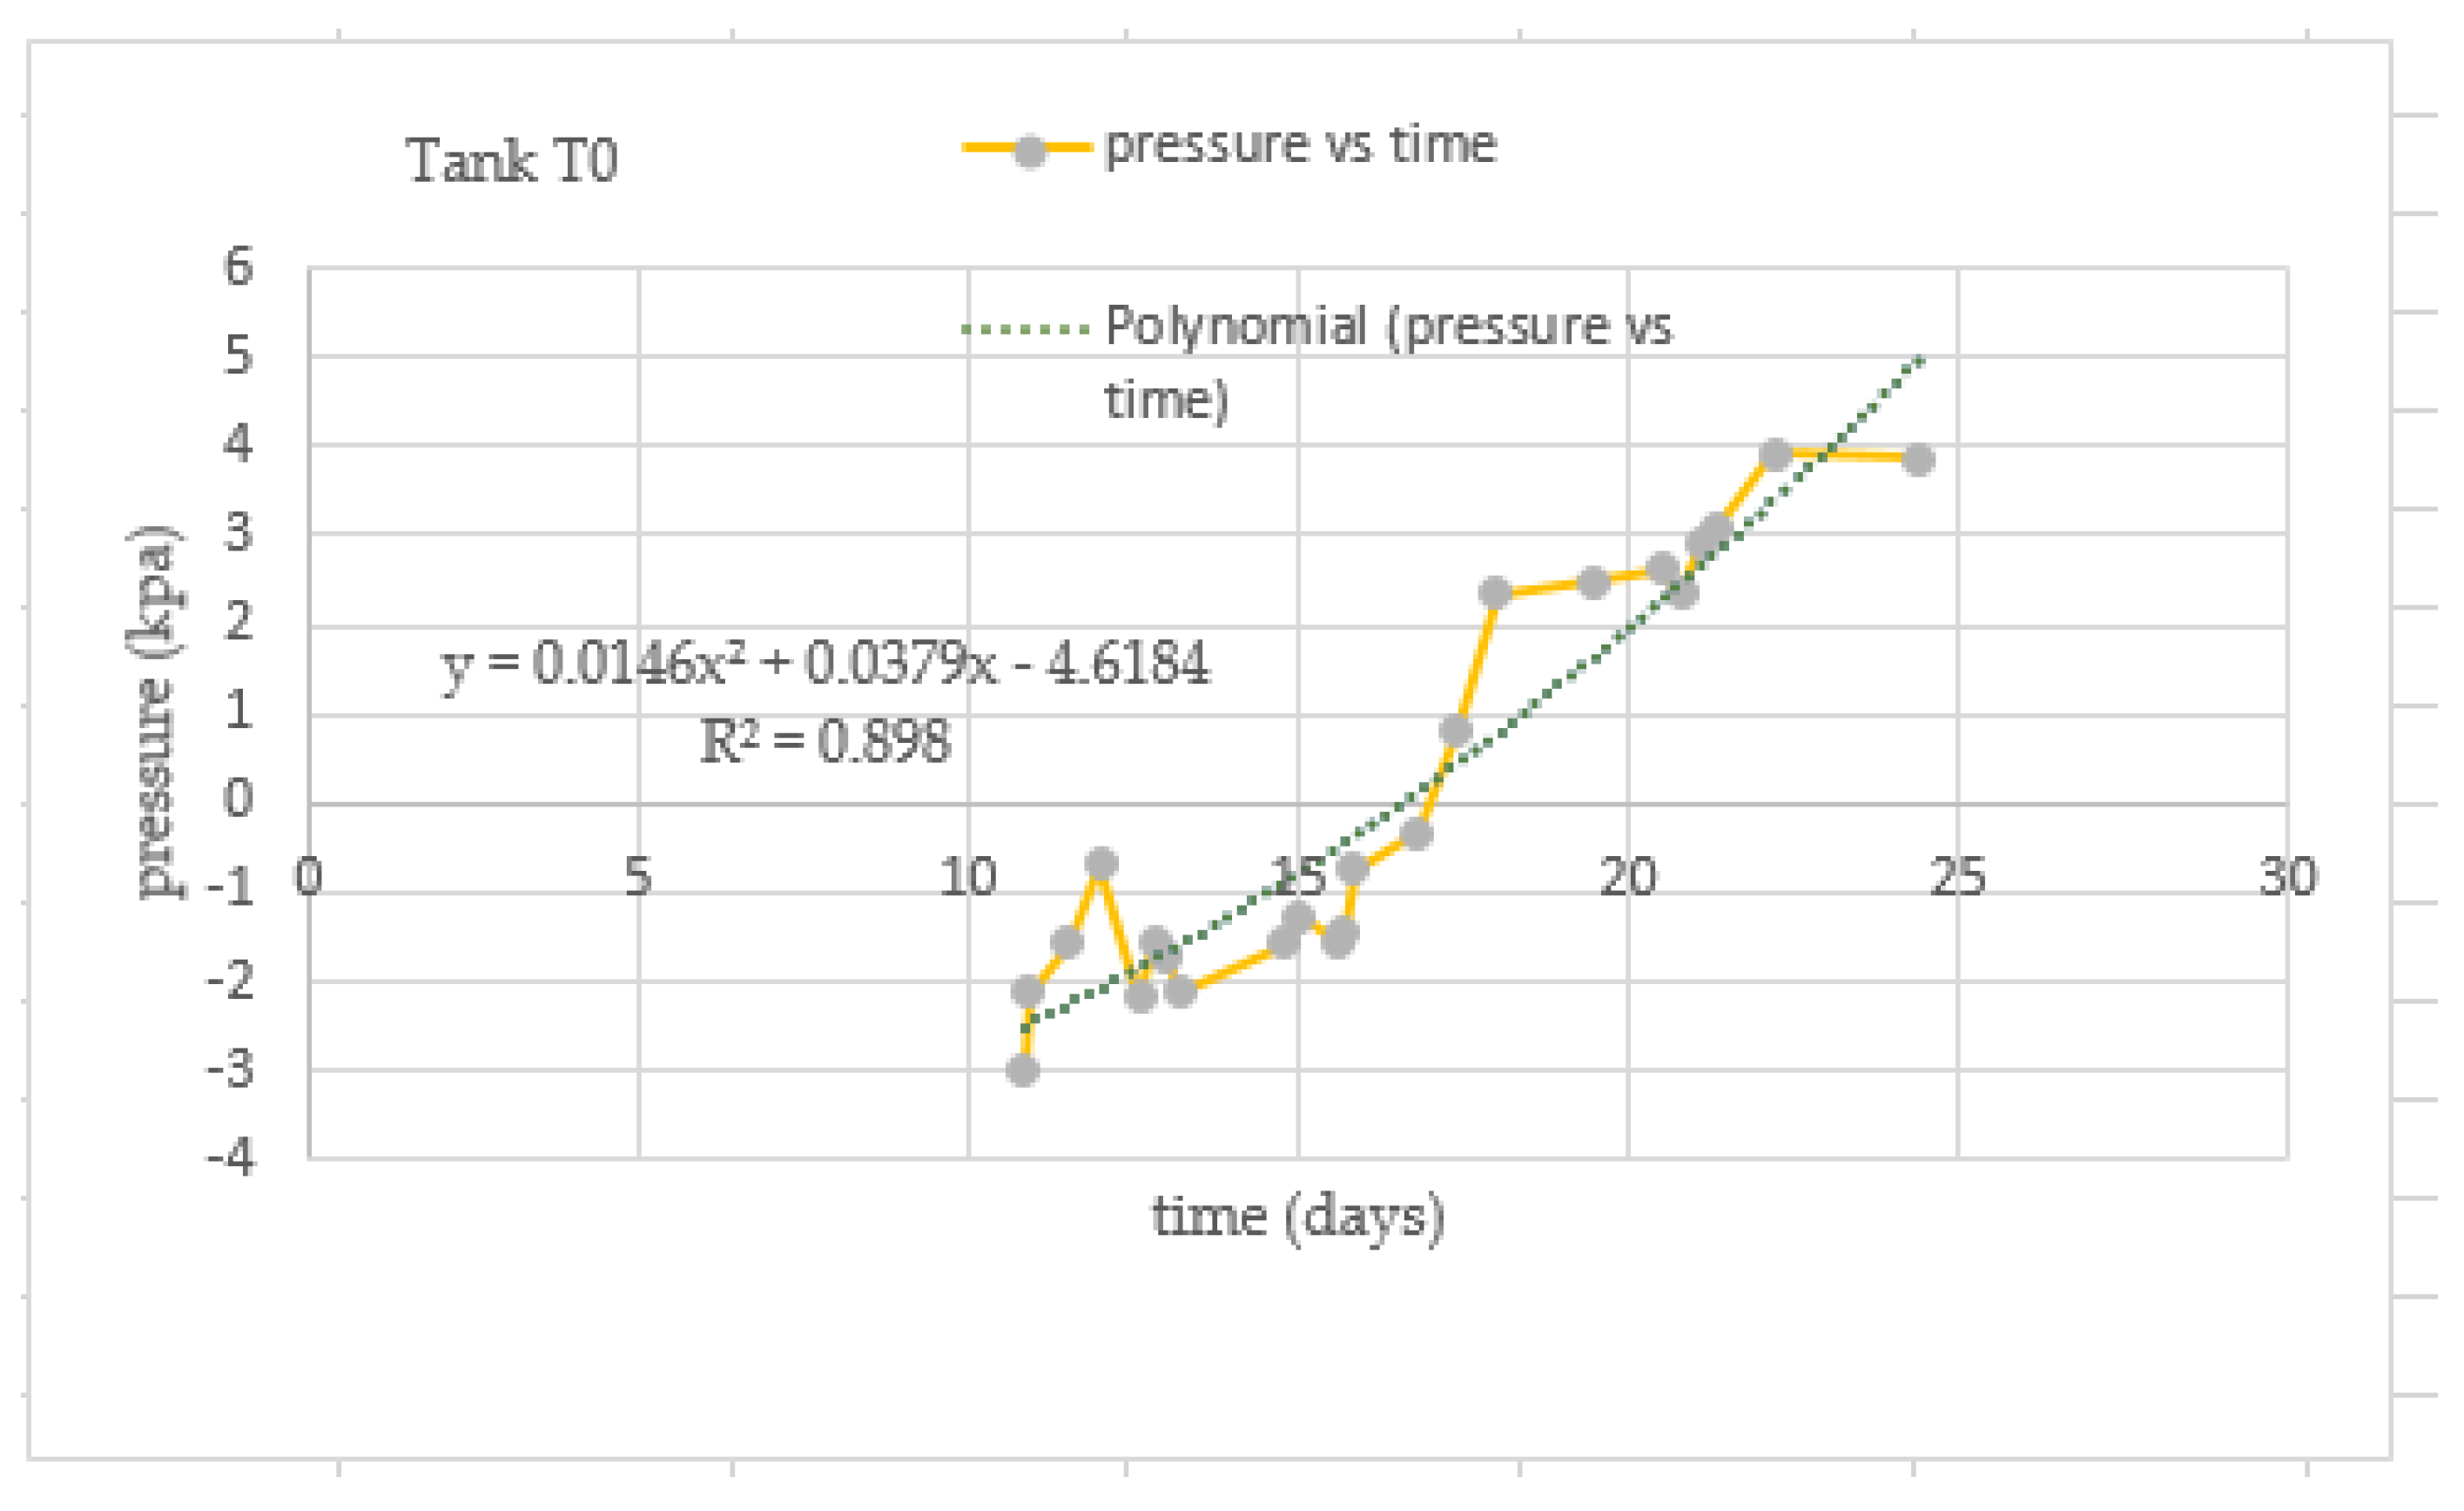
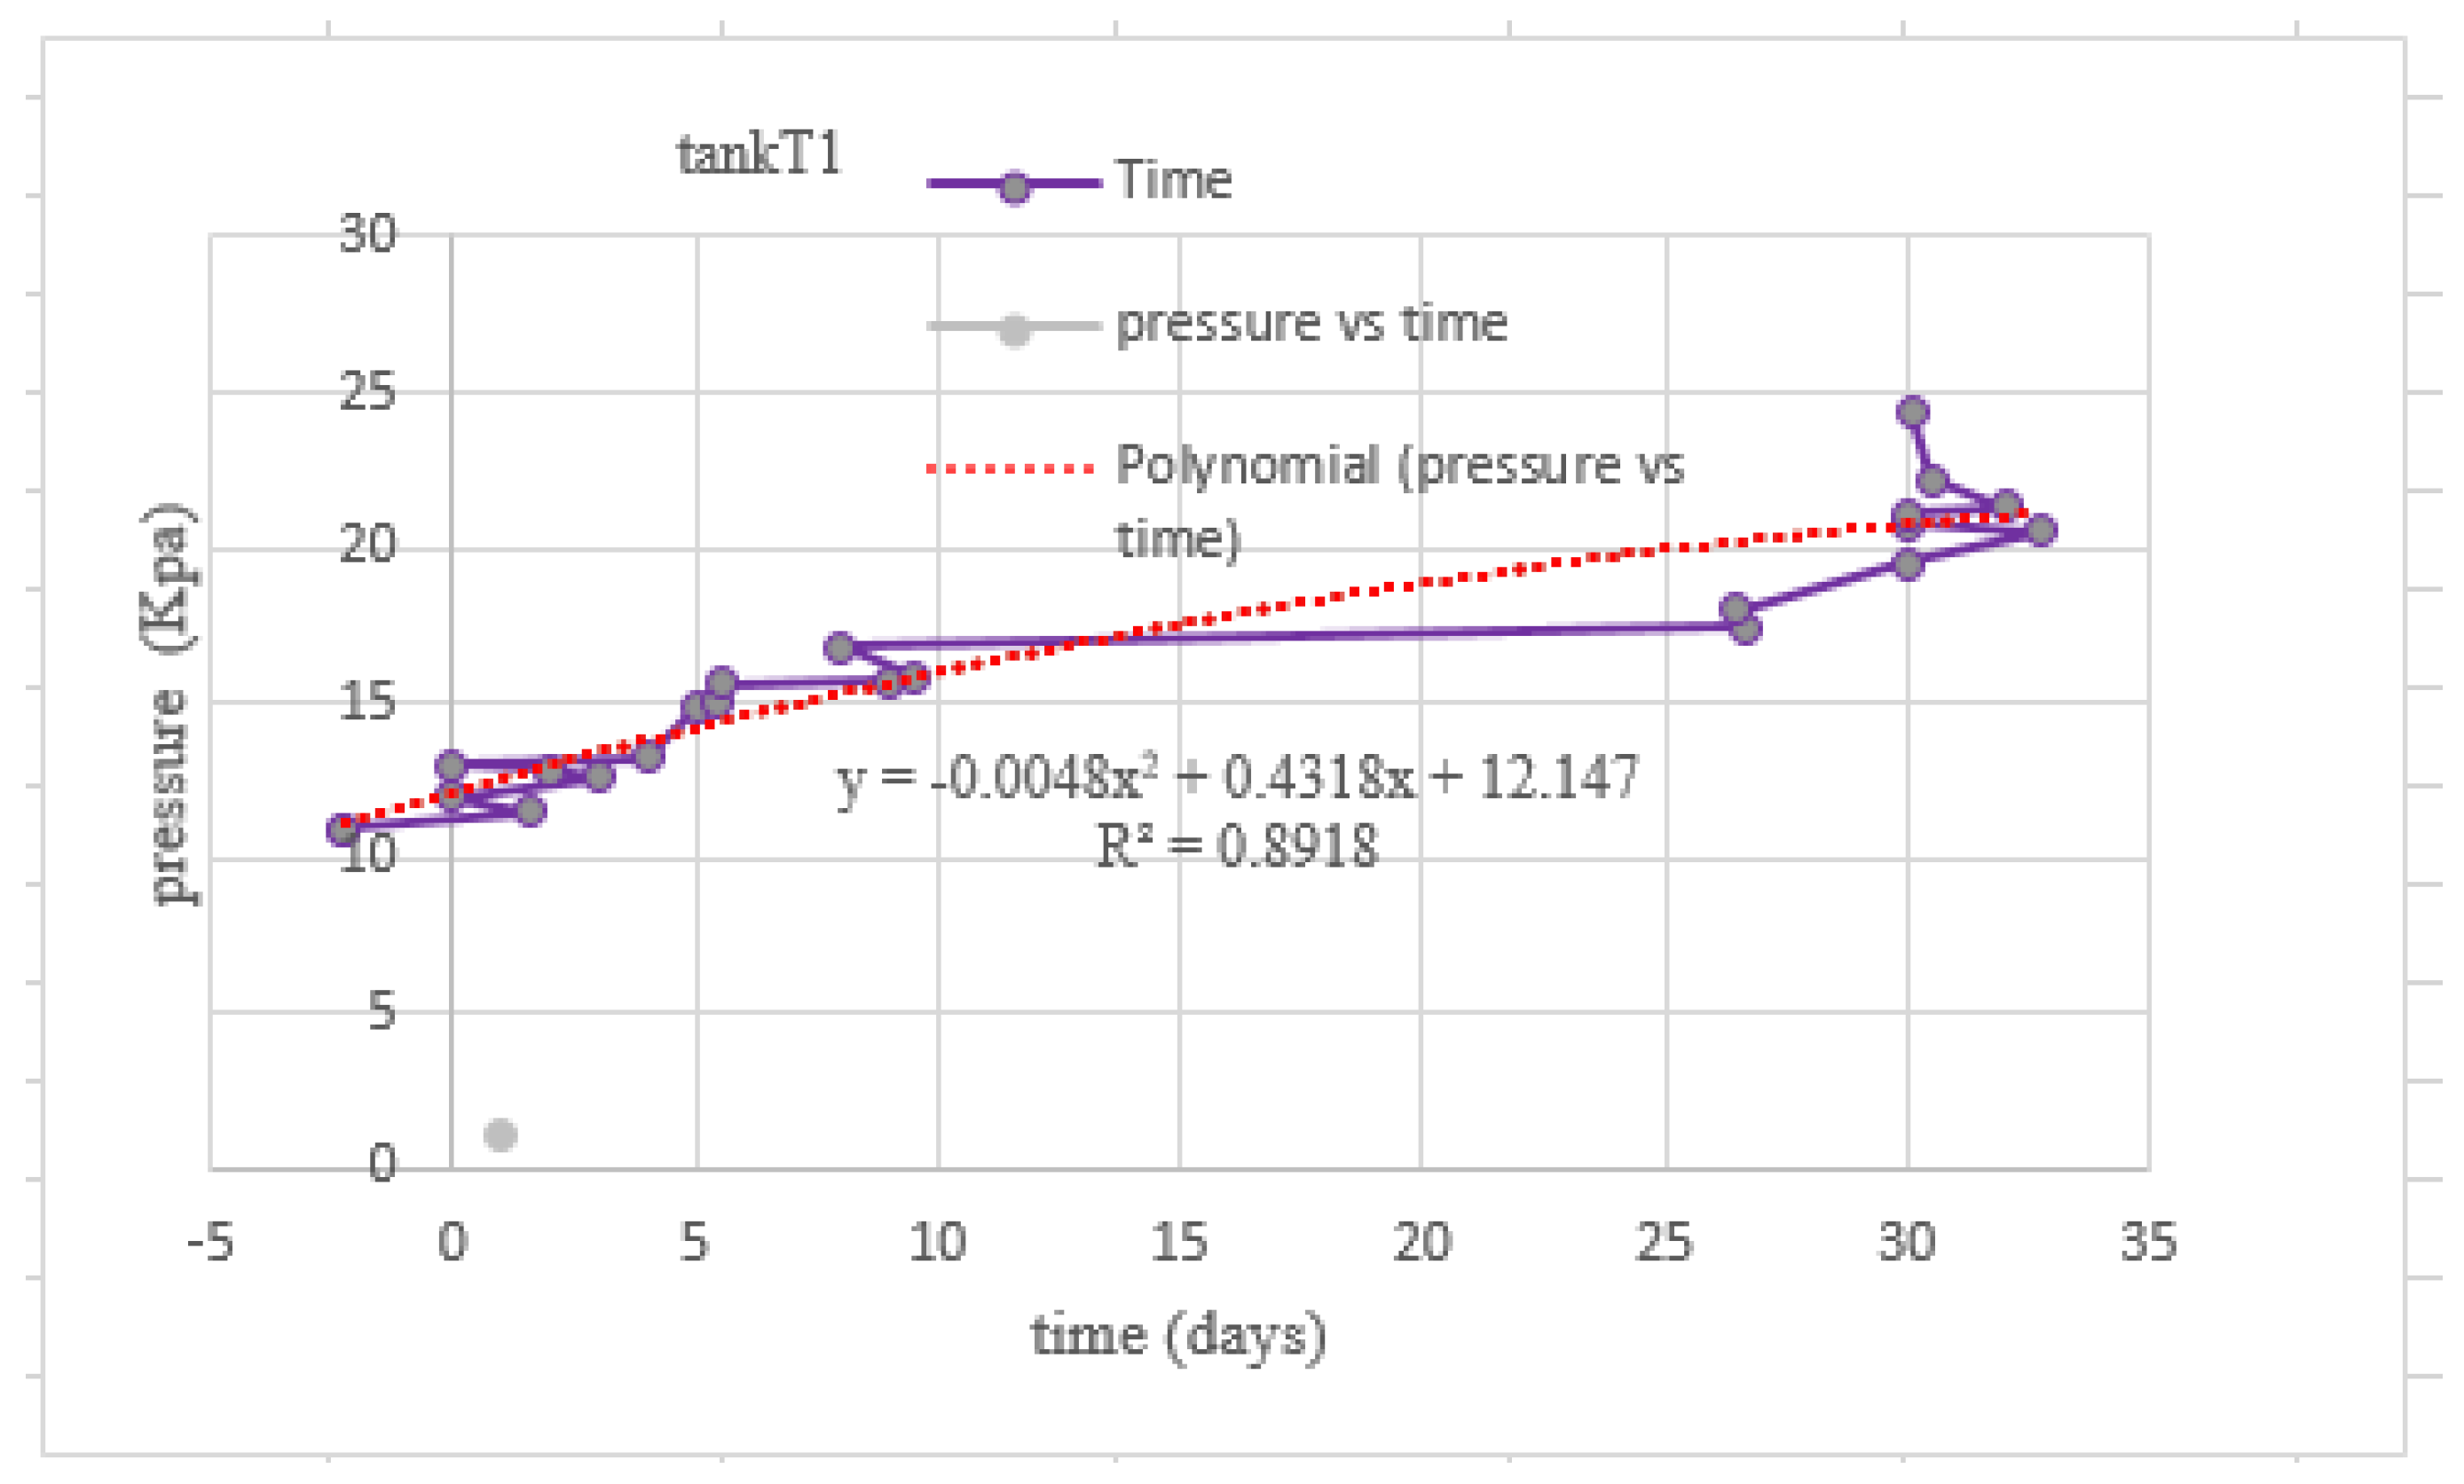
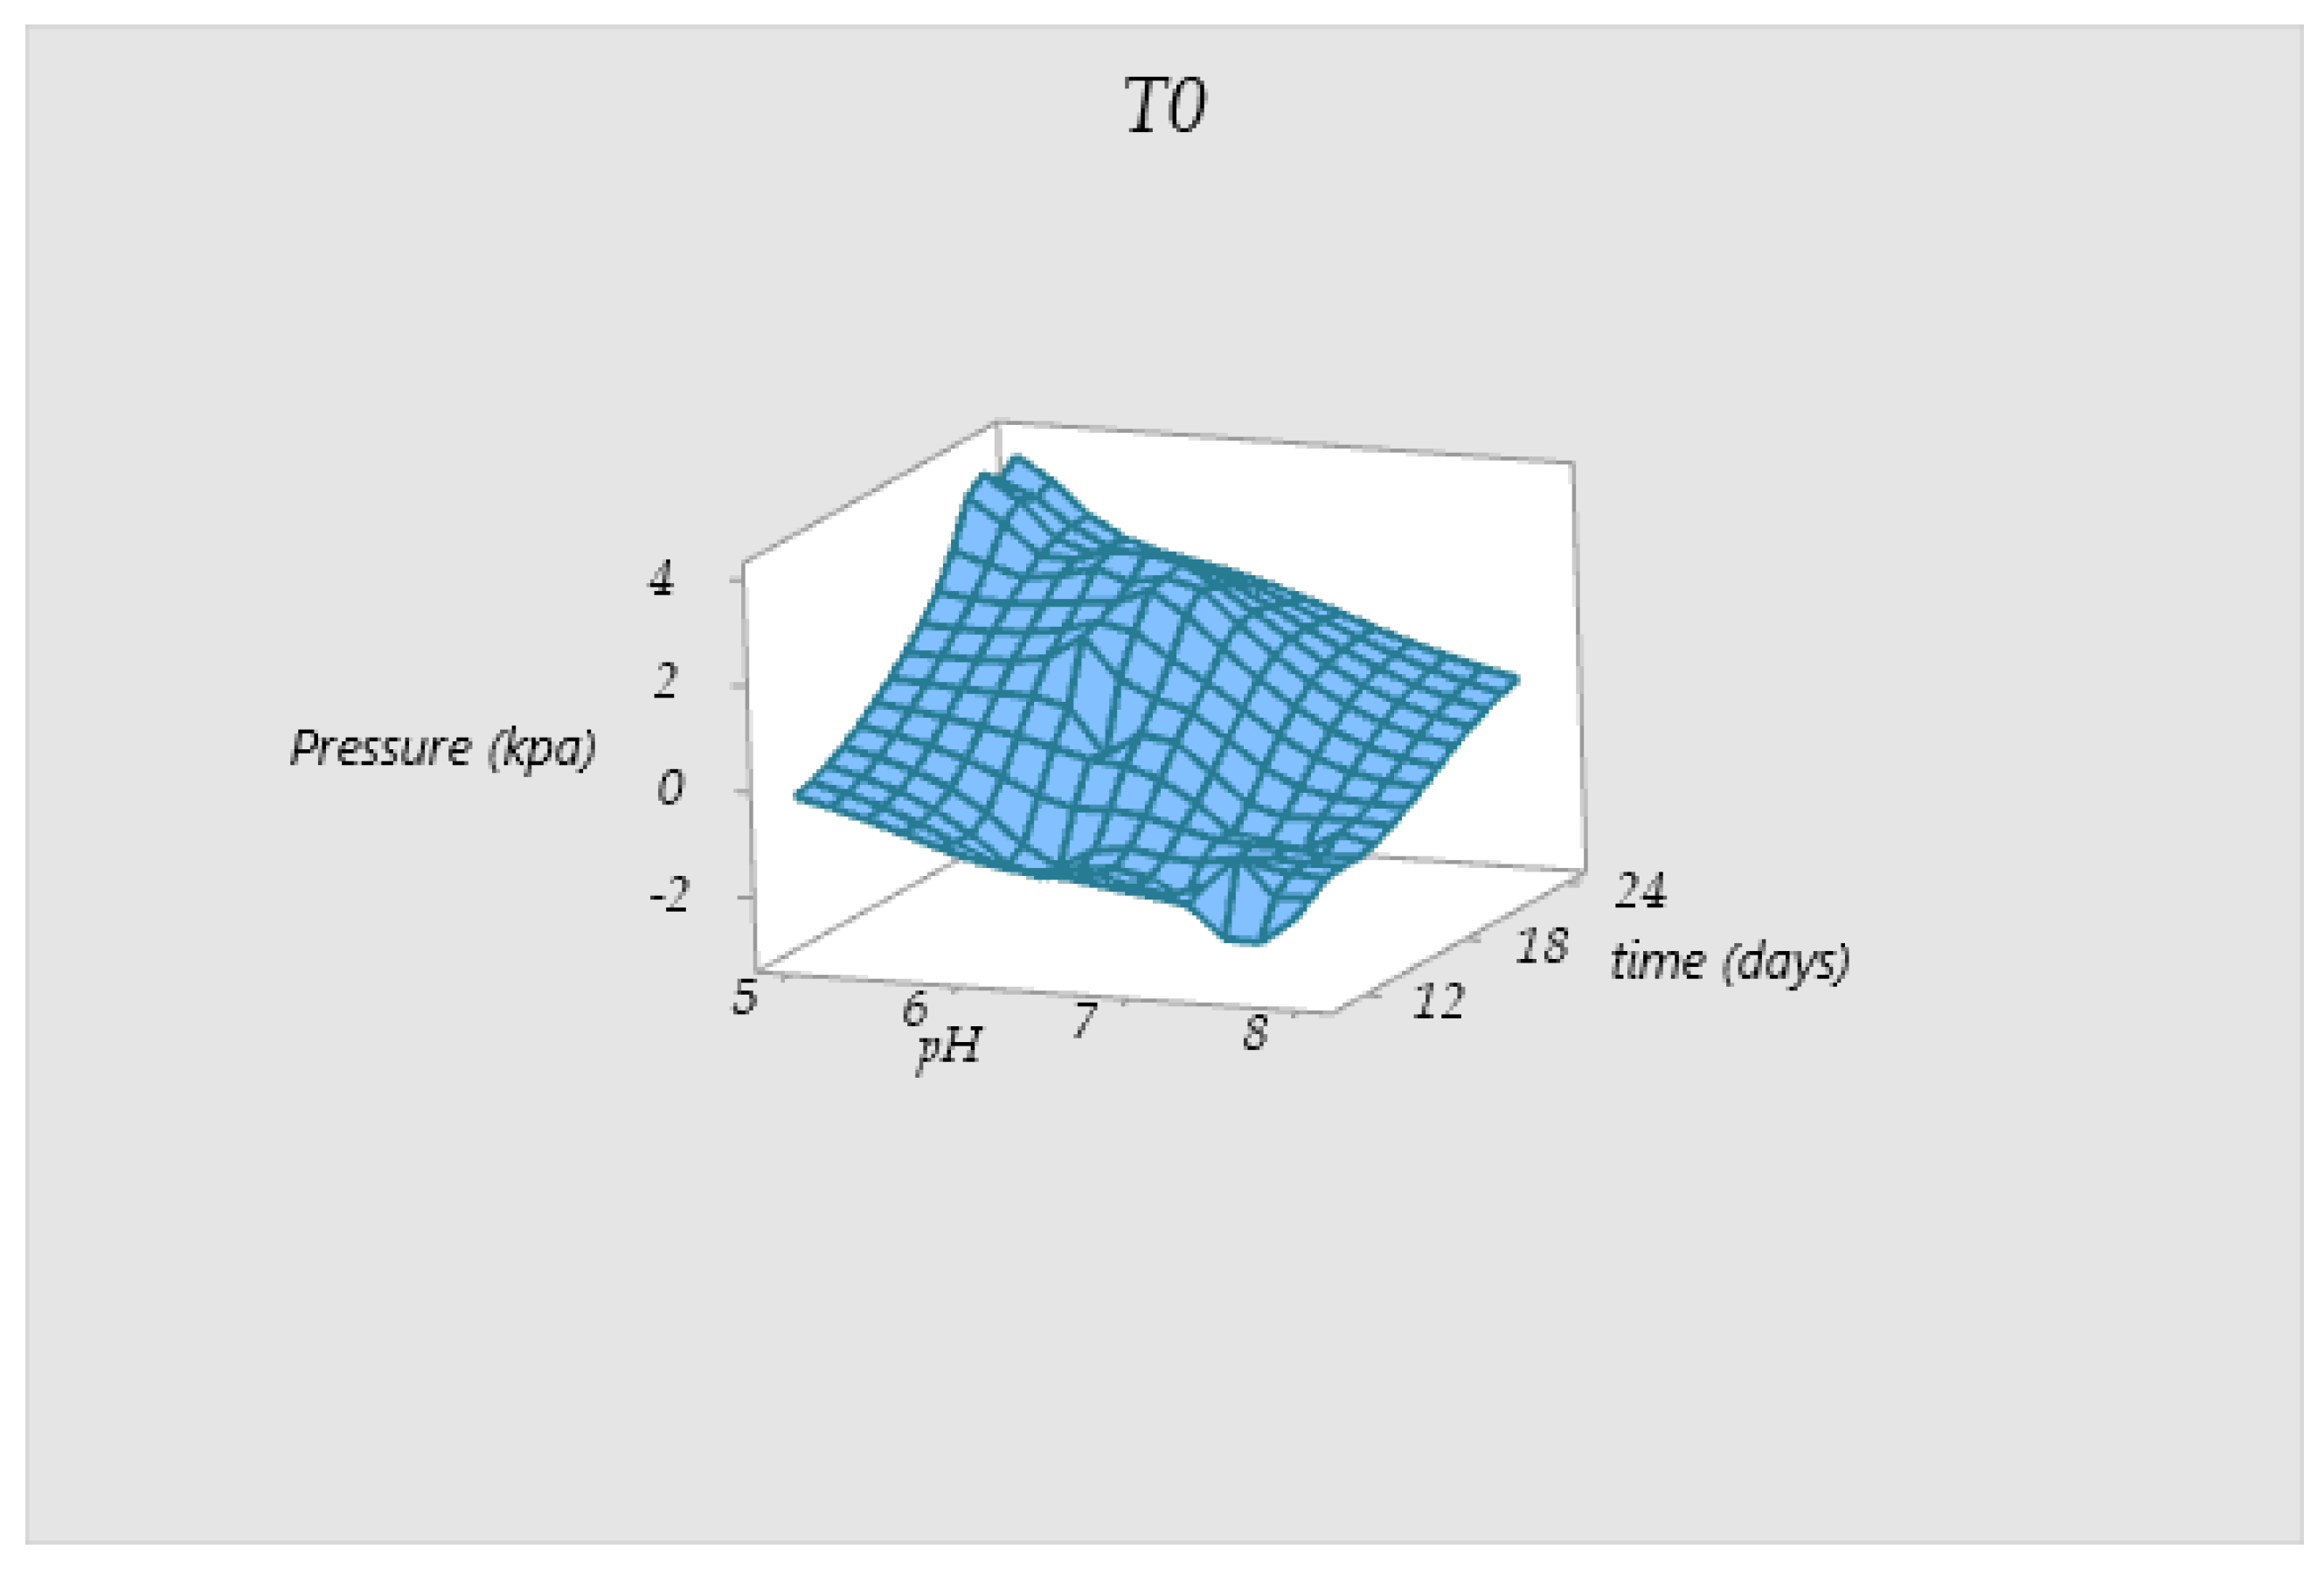
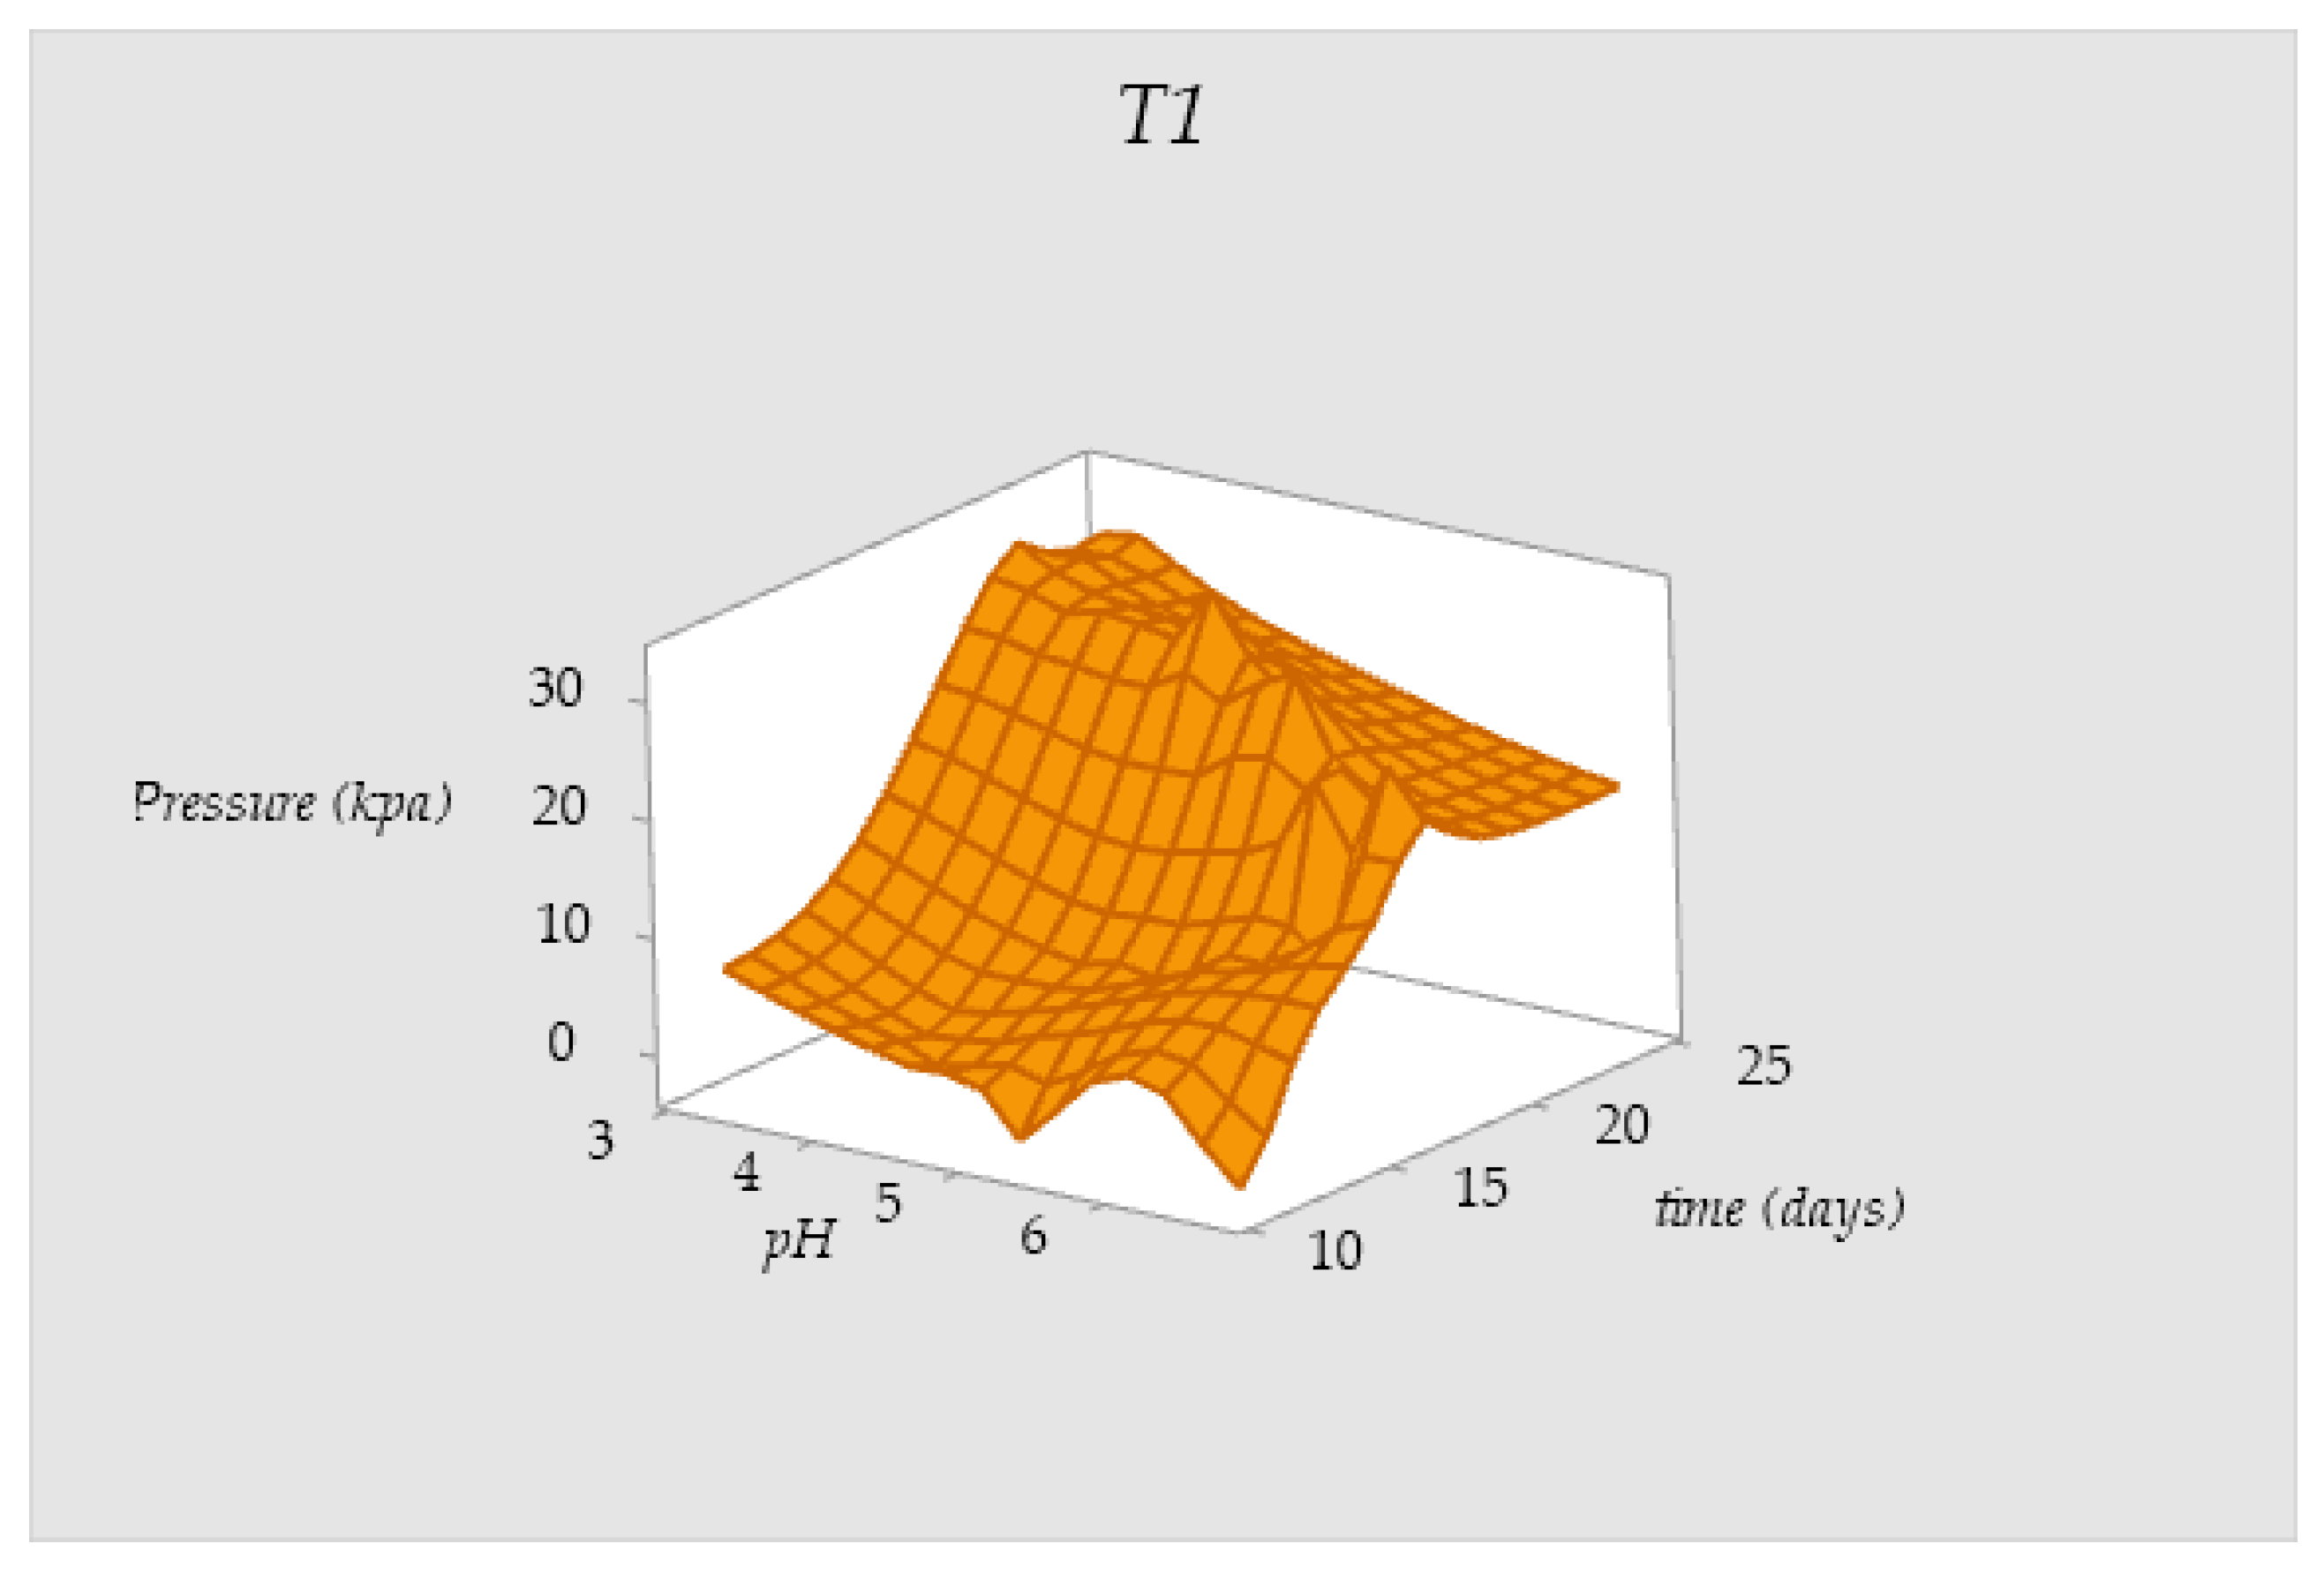
3.5. Behavior of the Pressure Values in Tanks T0 and T1
4. Conclusions
5. Recommendations
Author Contributions
Funding
Data Availability Statement
Conflicts of Interest
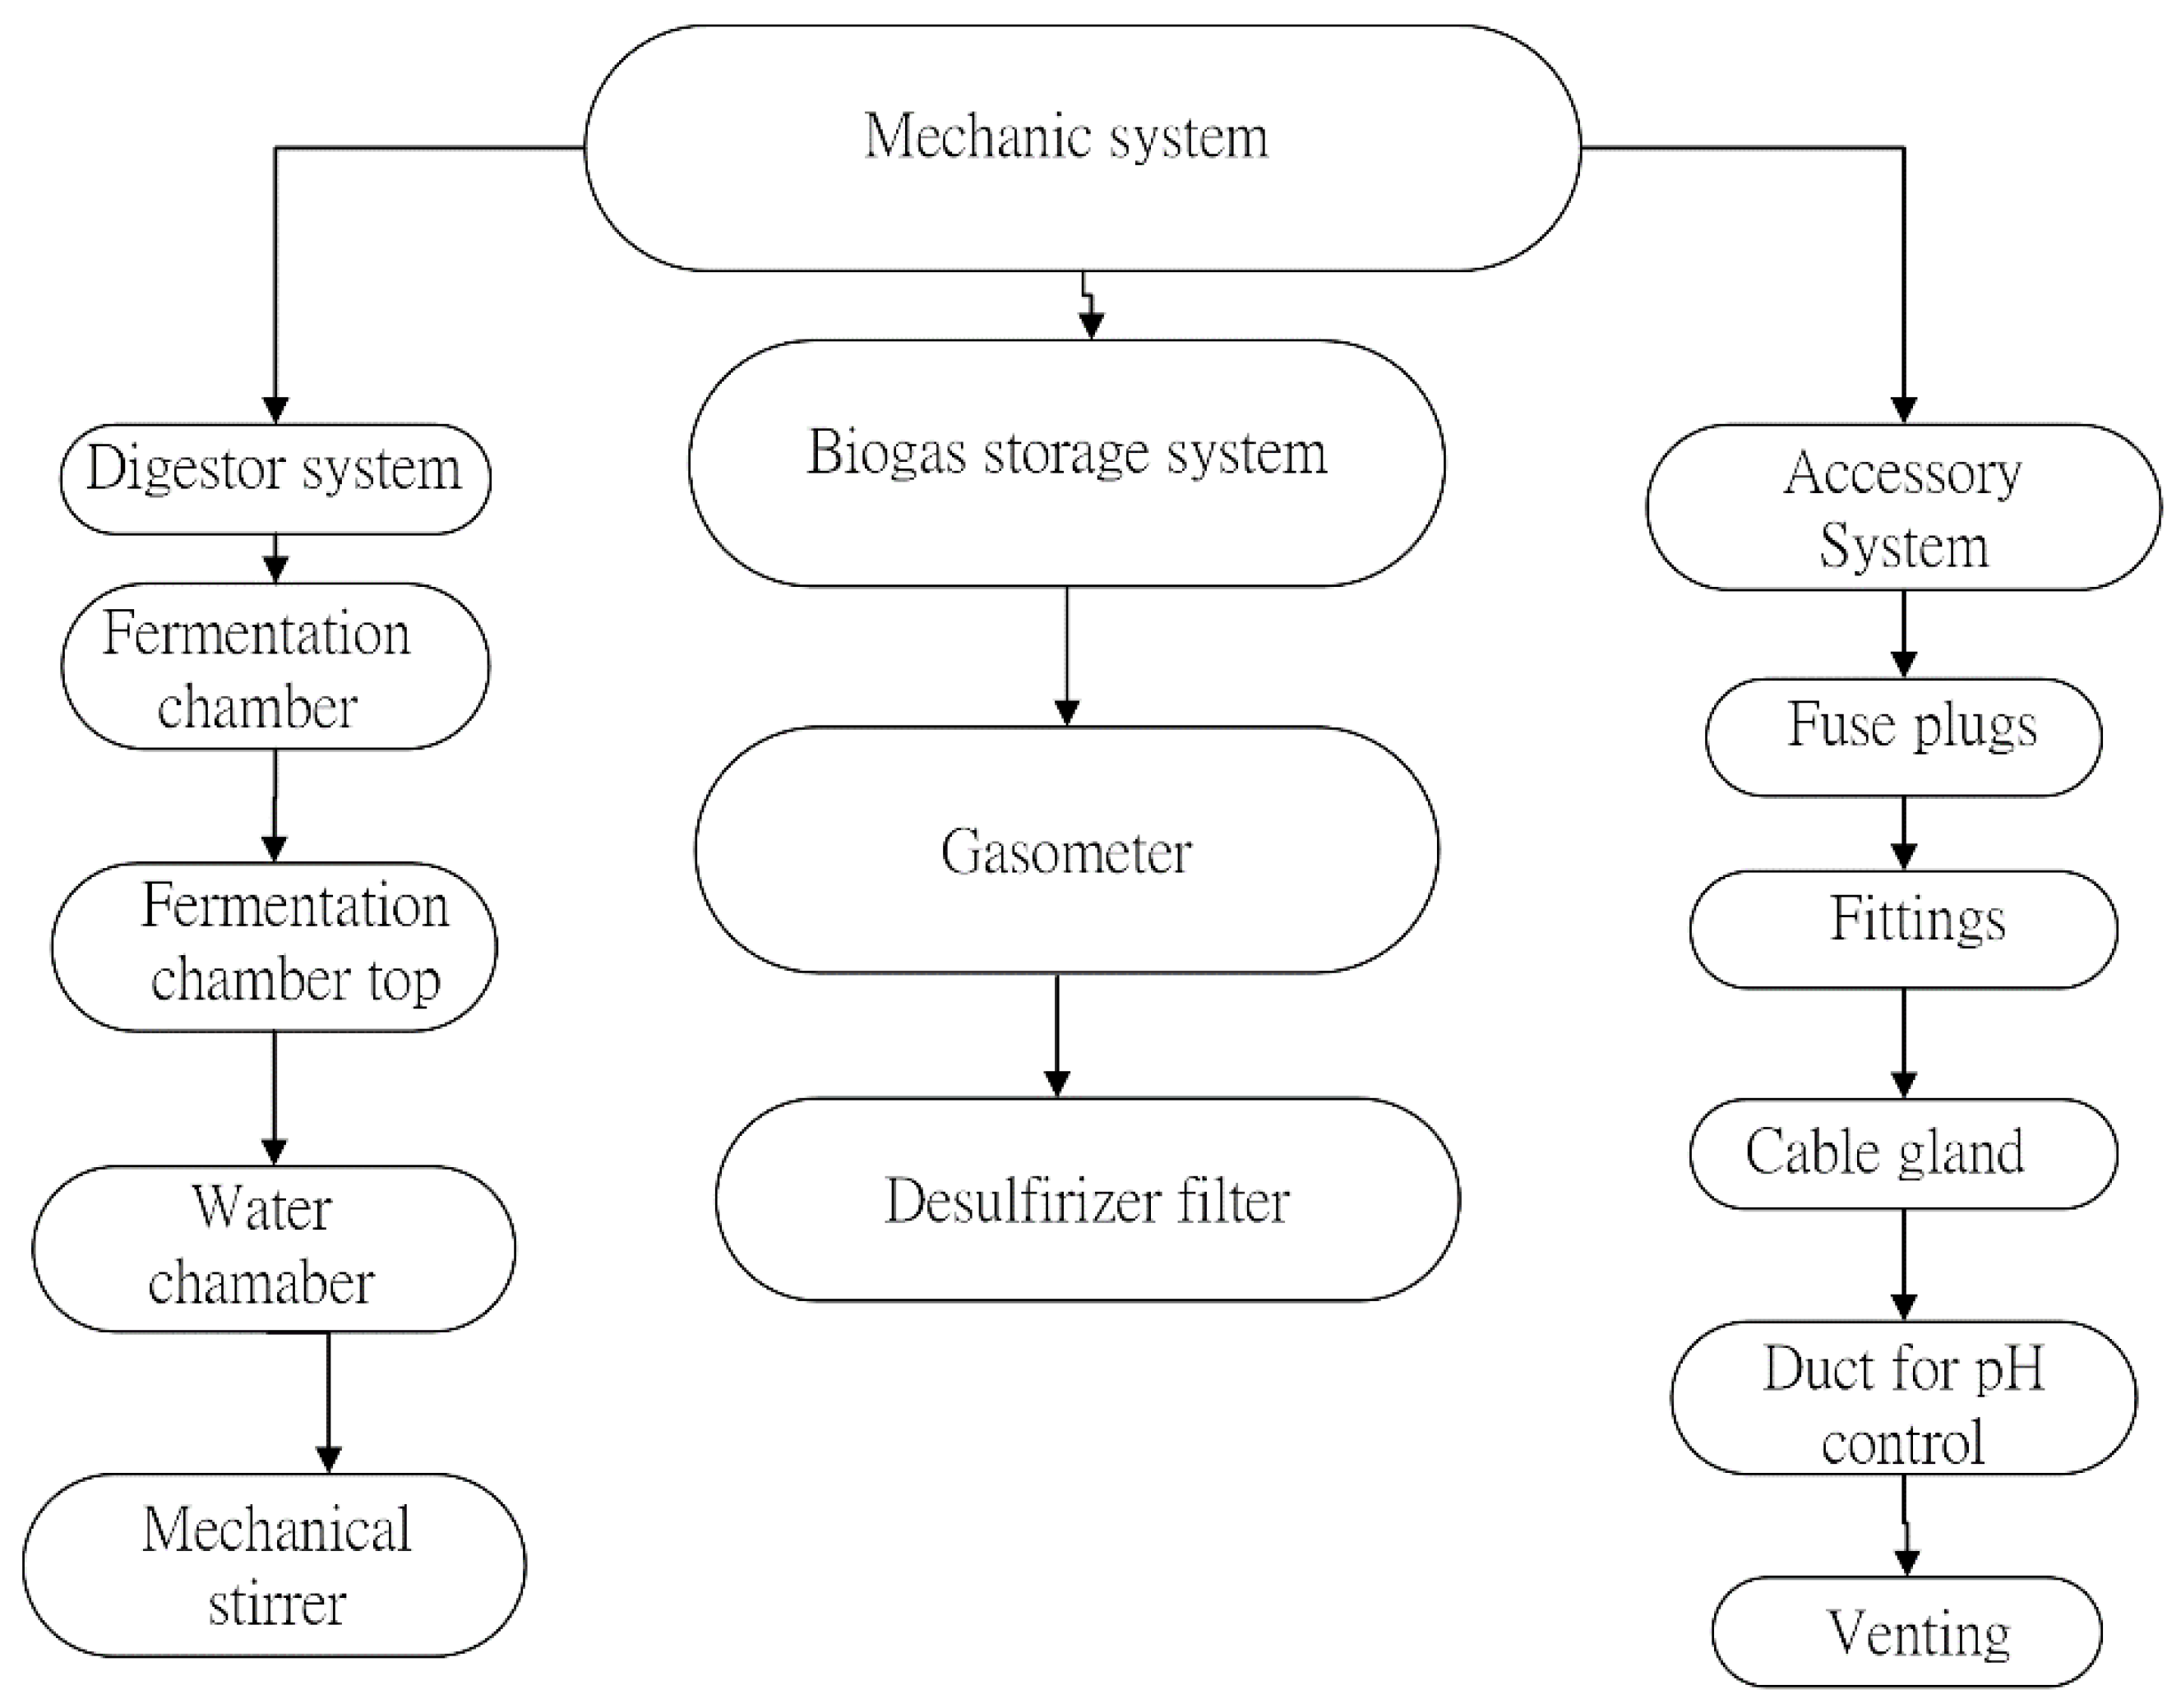
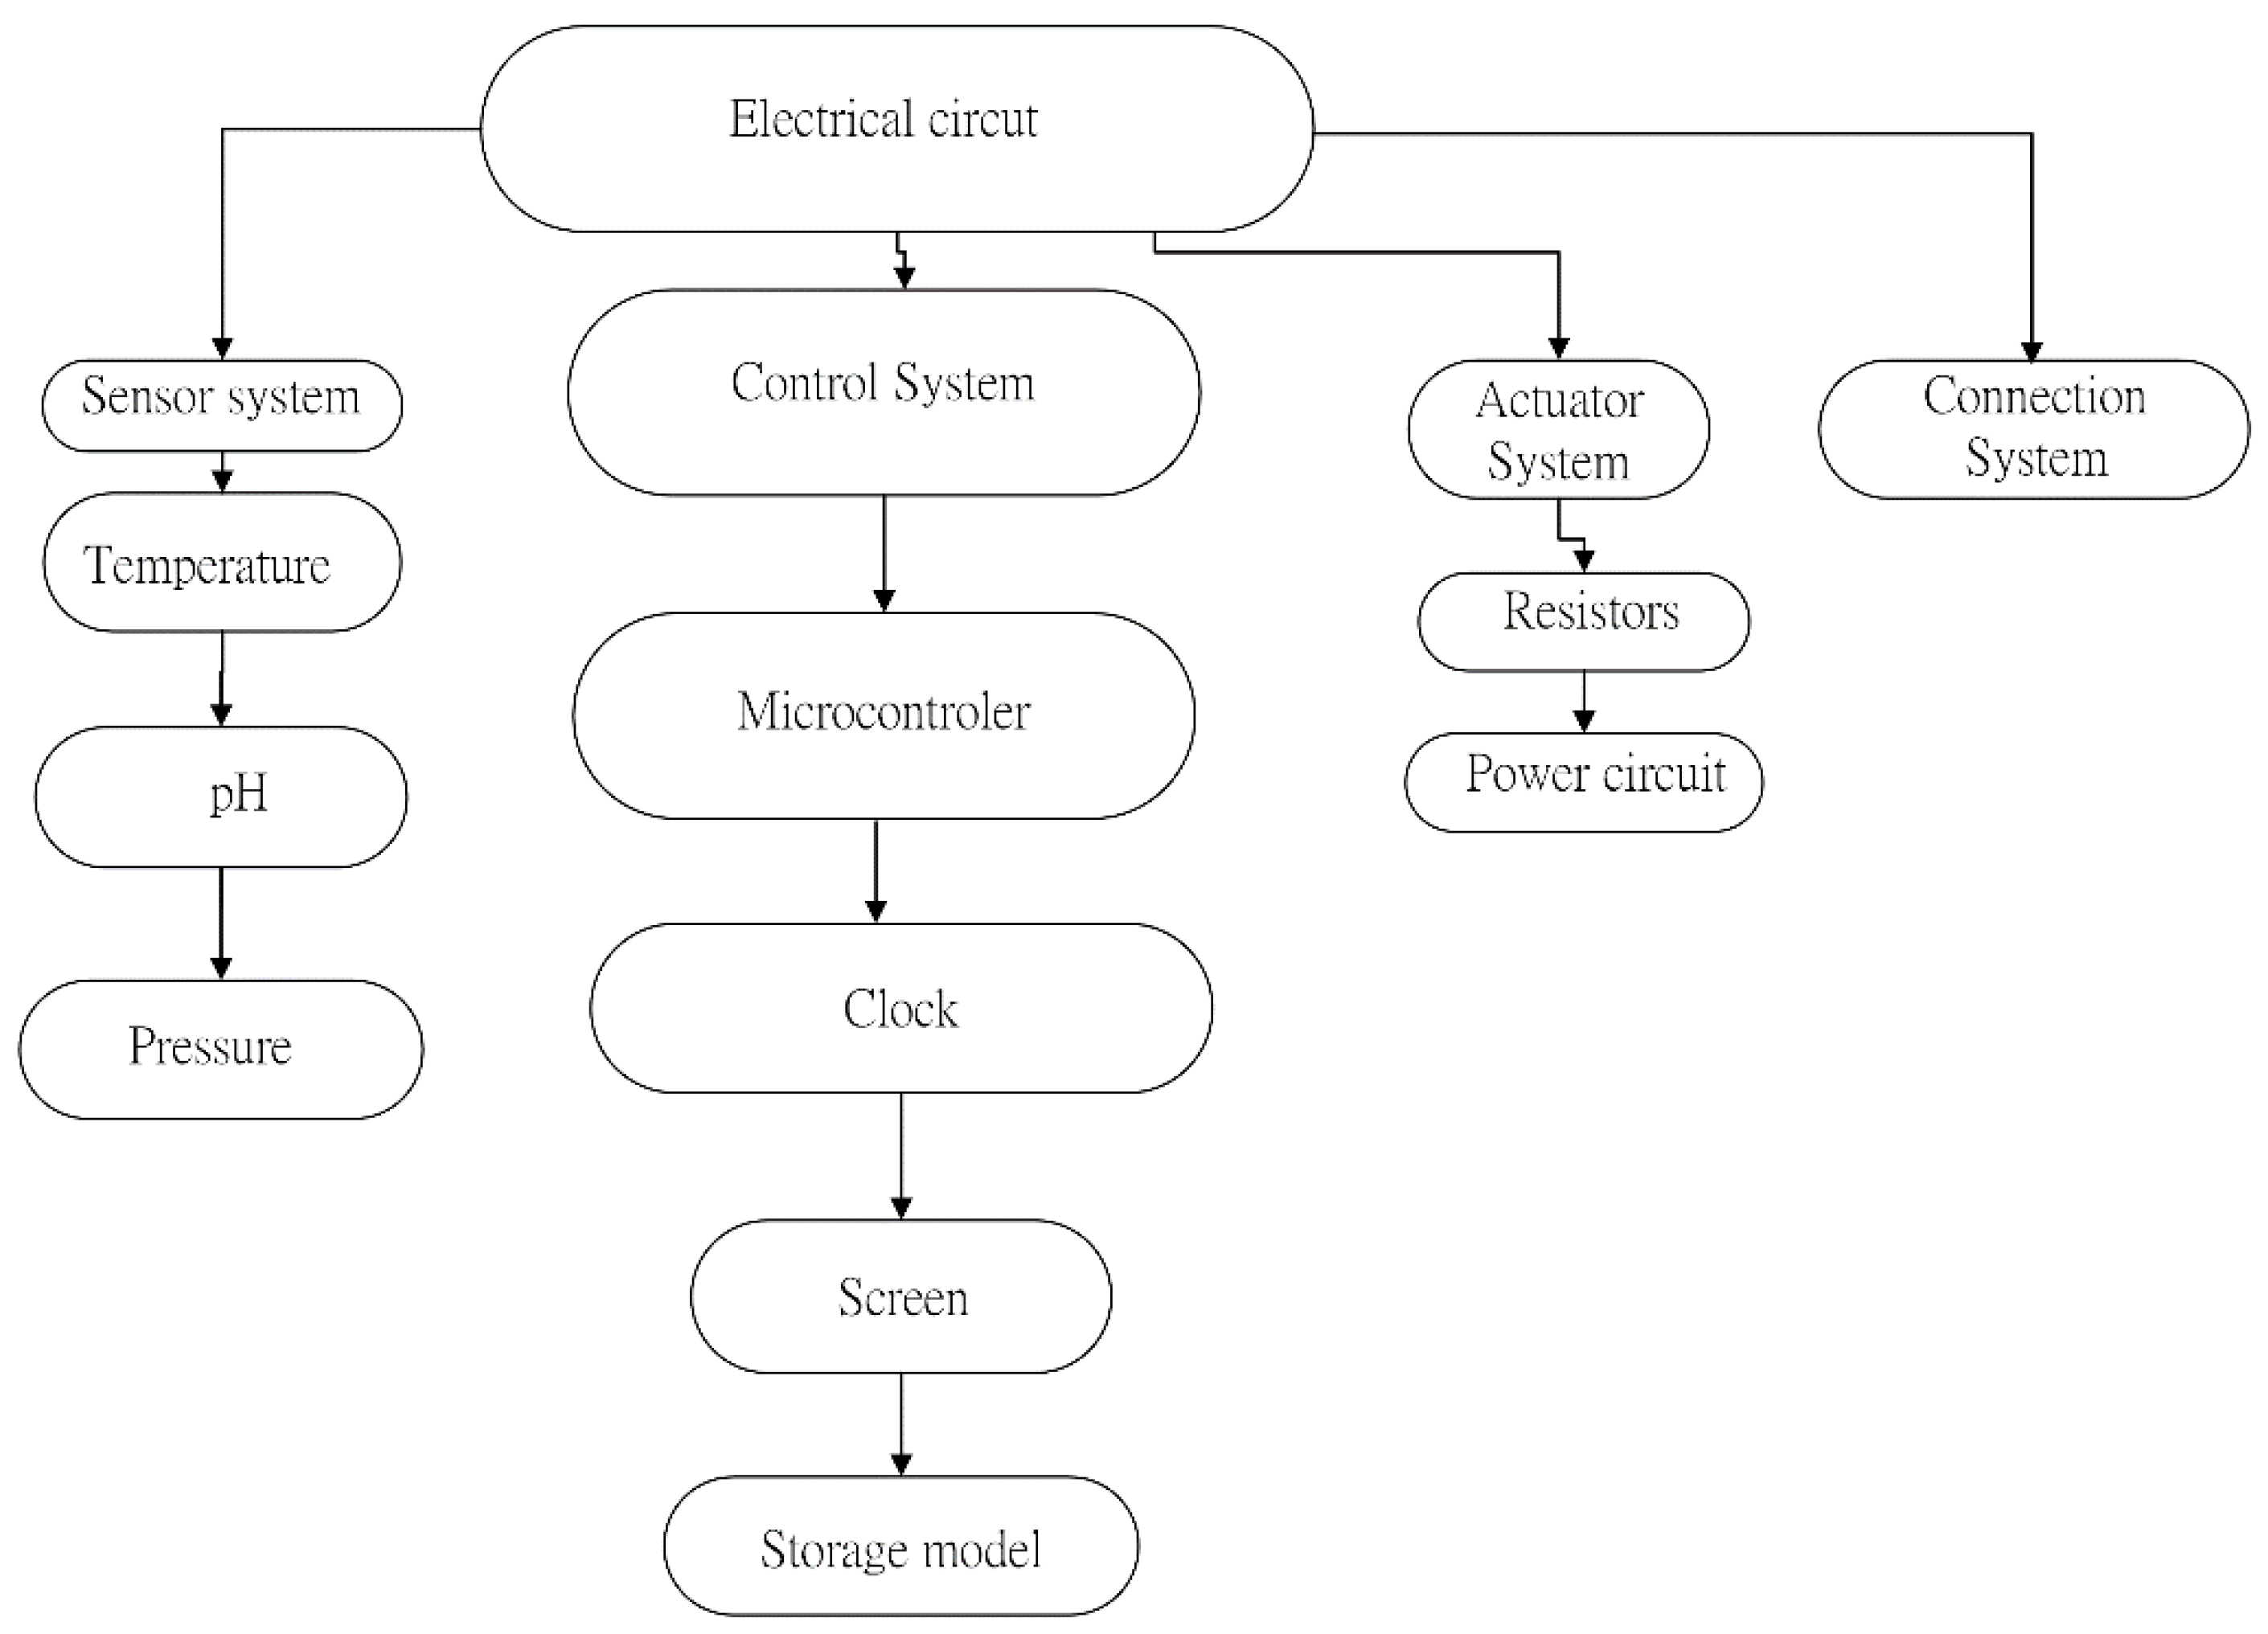
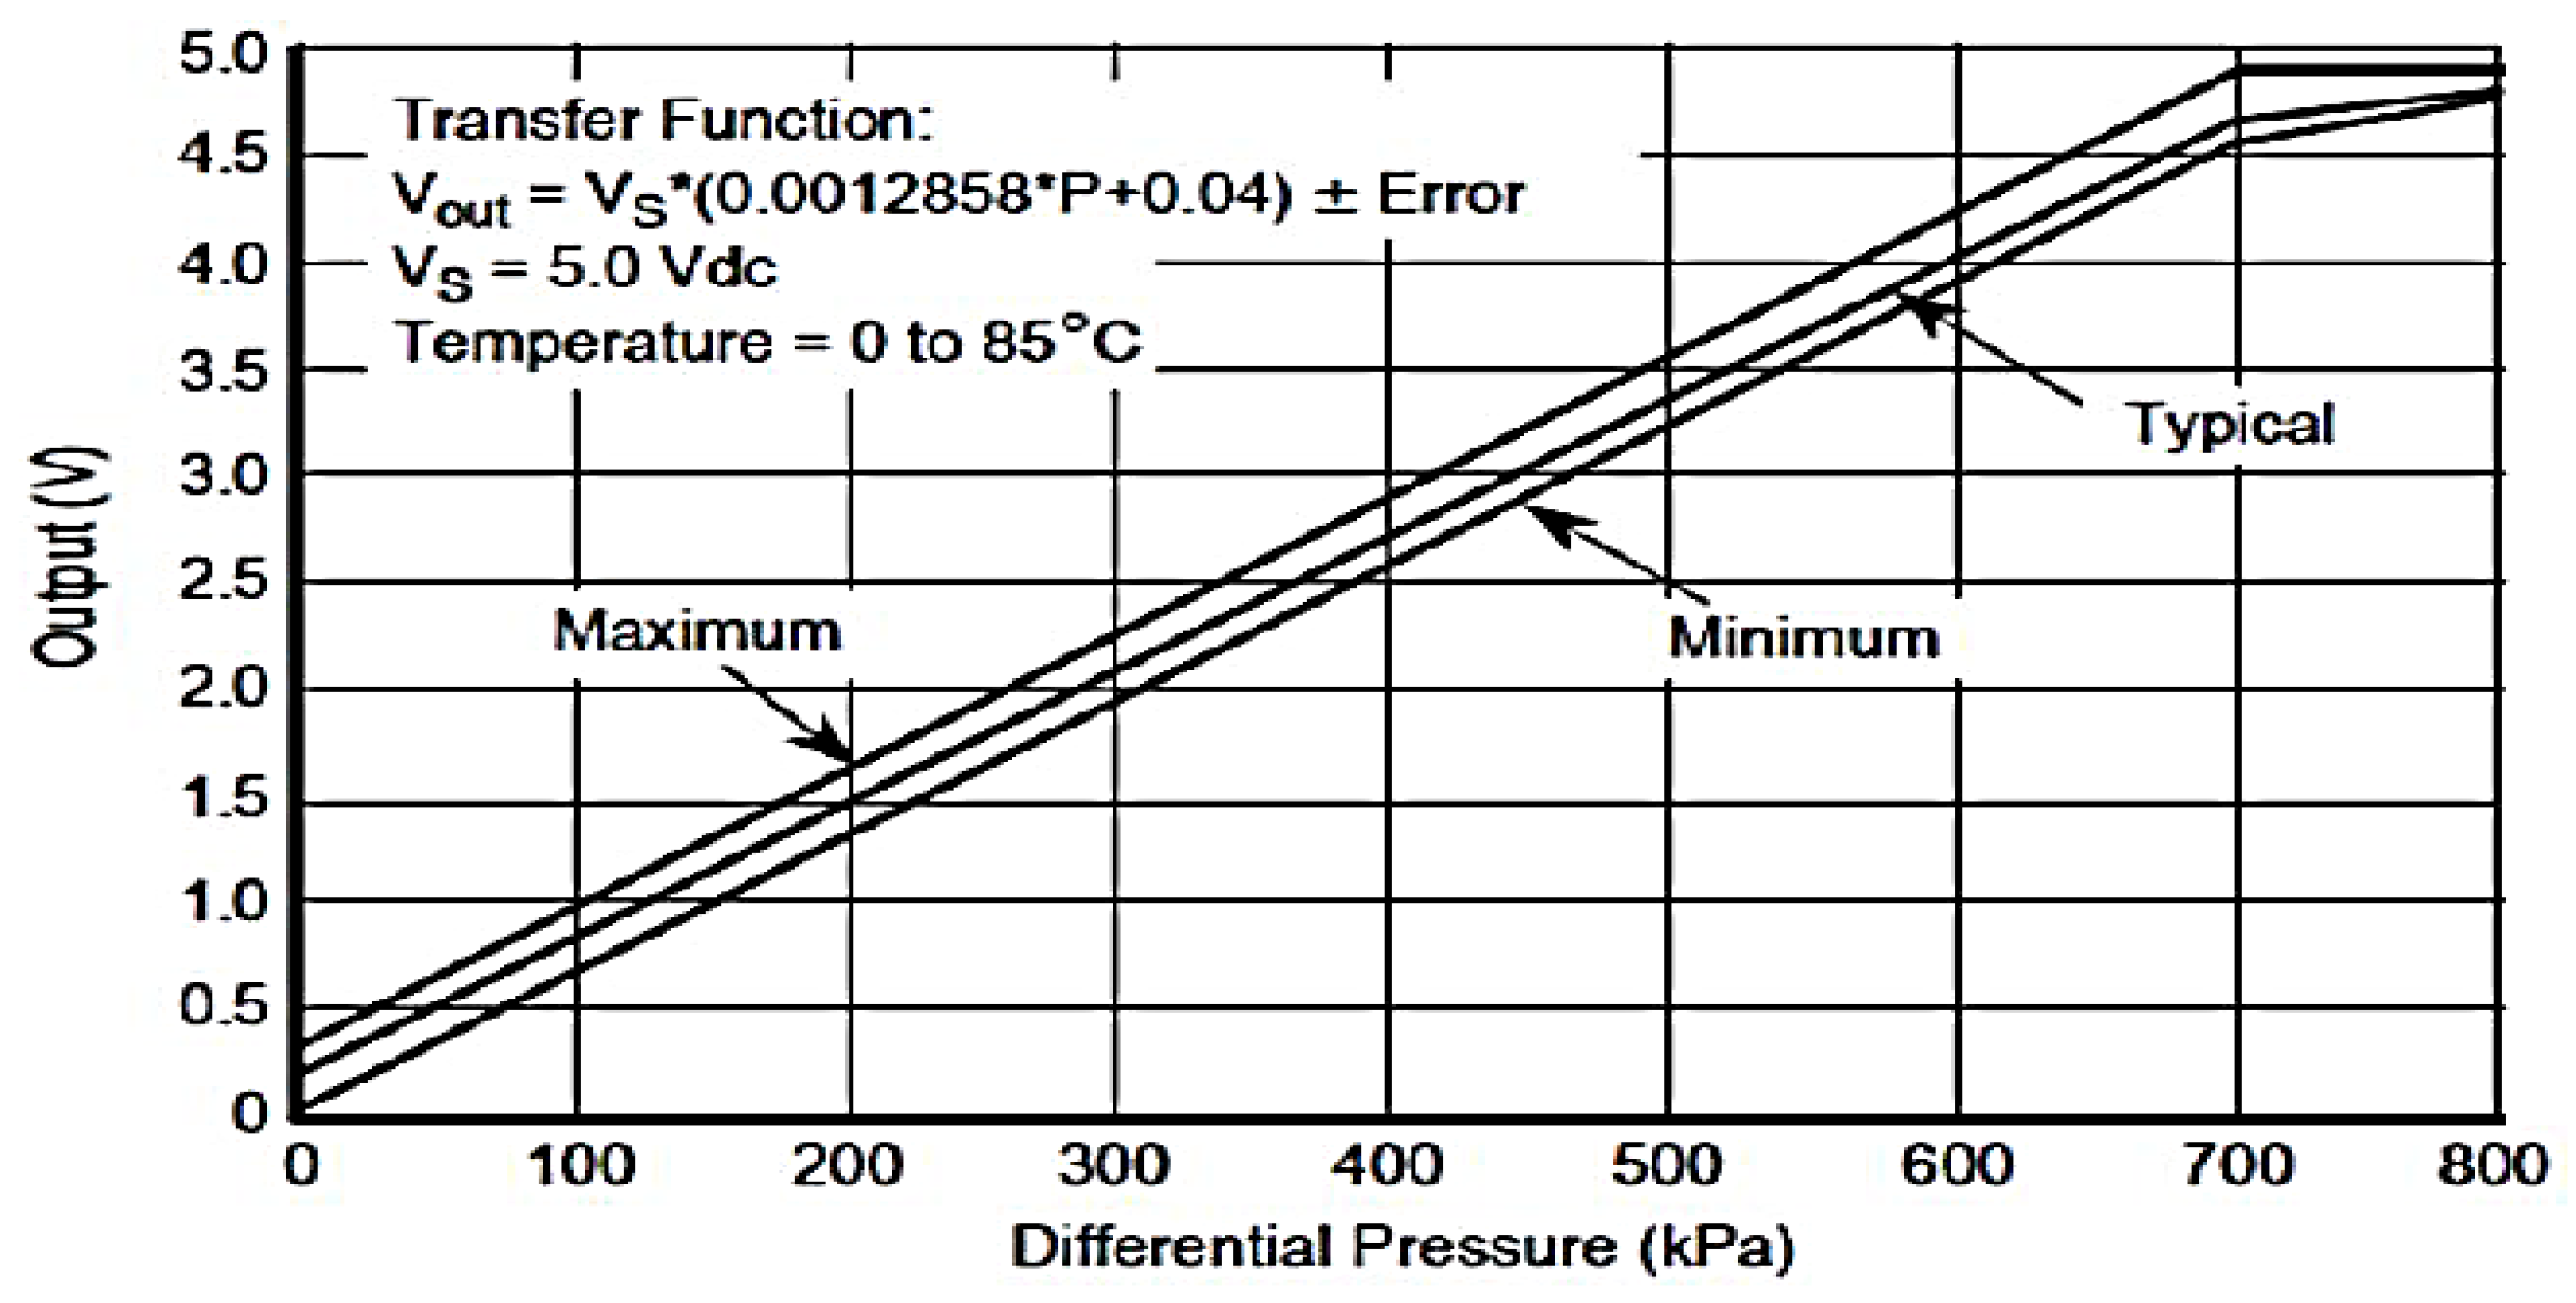
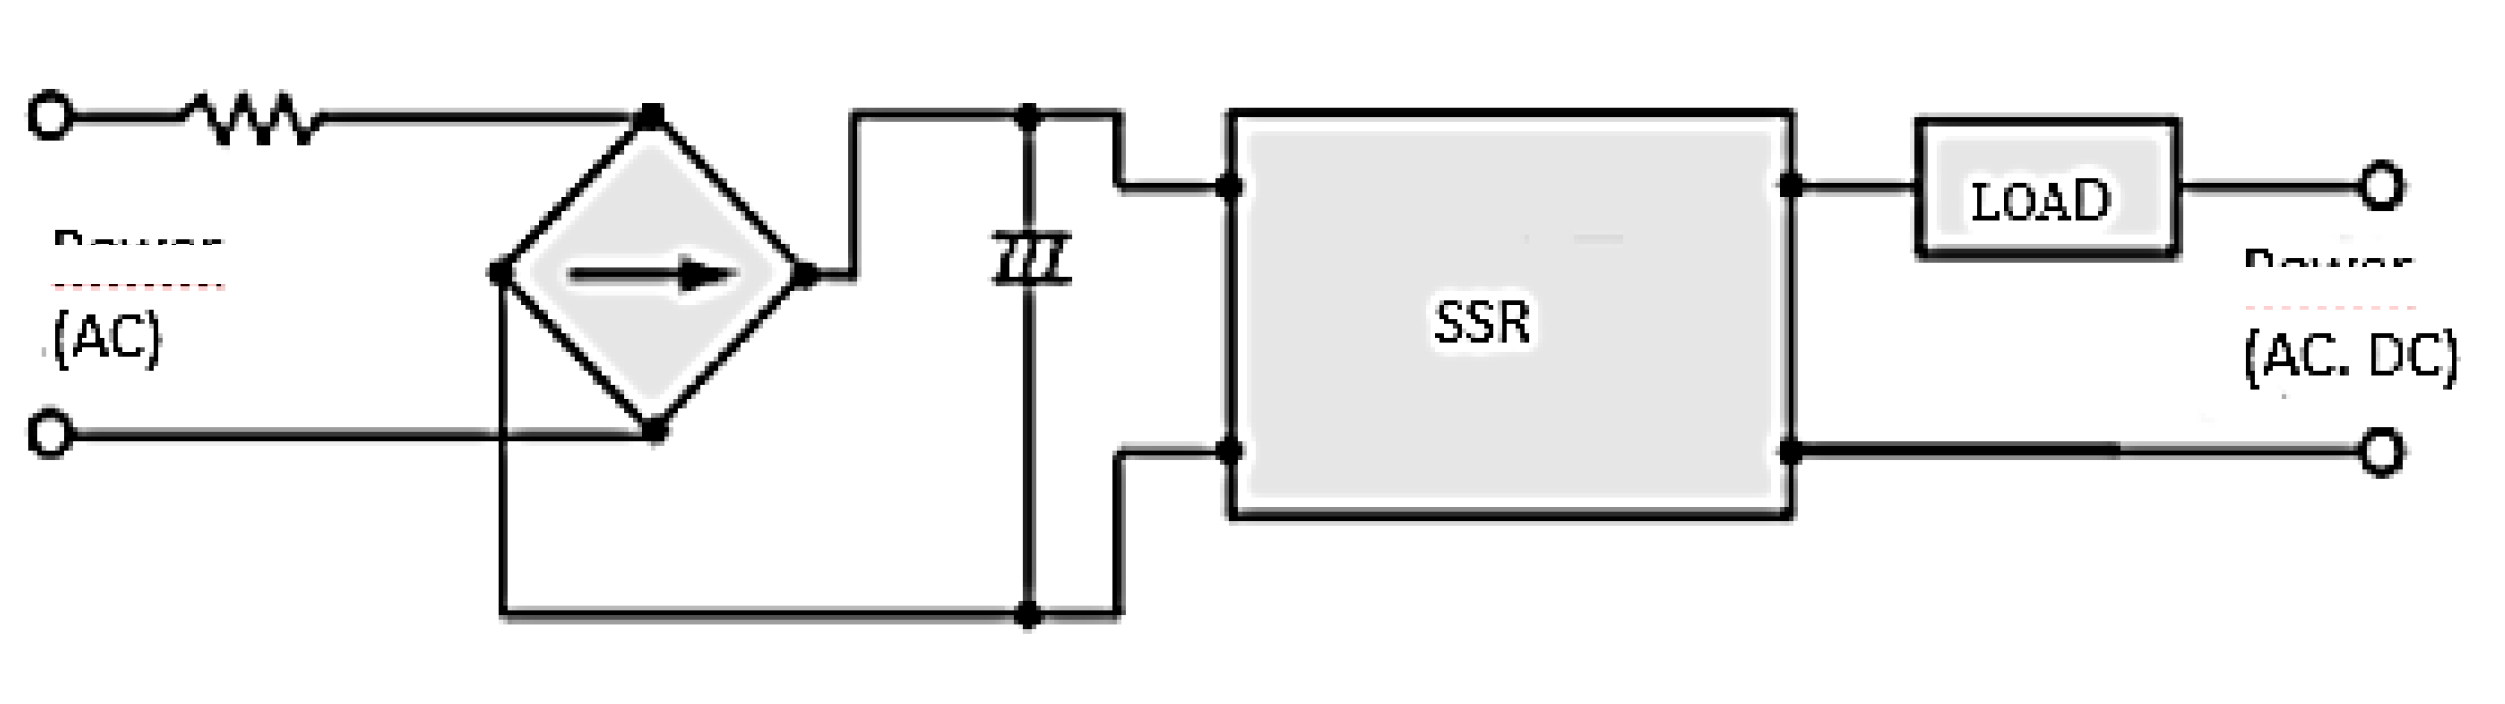
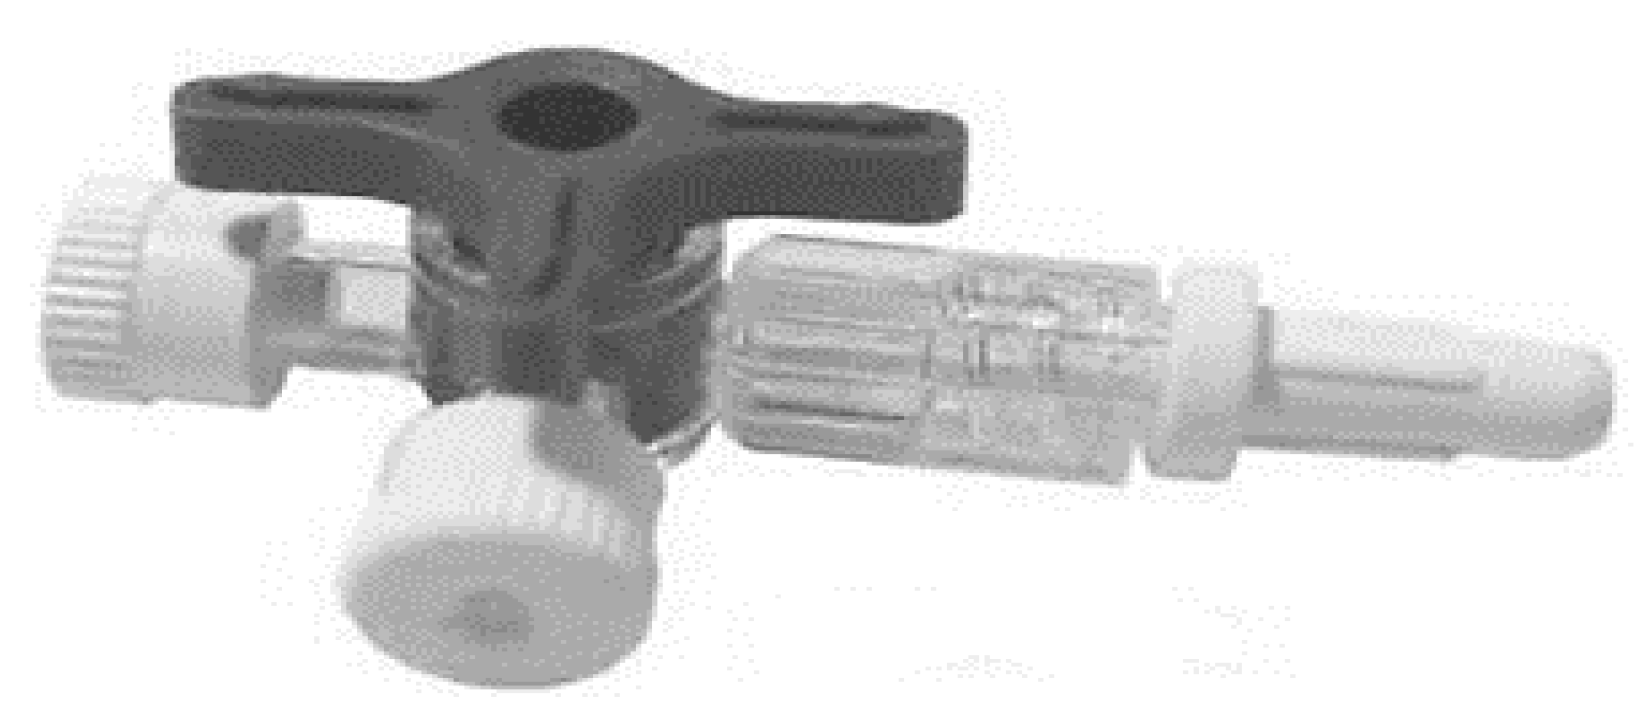
Appendix A. Connections and Mechanical-Electronic Systems Description
- Mechanical System
- Electronic System
- Conditioning Capacitors for Pressure Sensor

- Voltage vs. Differential Pressure Transfer Function
- Connection Diagram for Solid State Relay
- Software Structure

References
- Latifi, P.; Karrabi, M.; Danesh, S. Anaerobic Co-Digestion of Poultry Slaughterhouse Wastes with Sewage Sludge in Batch-Mode Bioreactors (Effect of Inoculum-Substrate Ratio and Total Solids). Renew. Sustain. Energy Rev. 2019, 107, 288–296. [Google Scholar] [CrossRef]
- Liu, X.; Gao, X.; Wang, W.; Zheng, L.; Zhou, Y.; Sun, Y. Pilot-Scale Anaerobic Co-Digestion of Municipal Biomass Waste: Focusing on Biogas Production and GHG Reduction. Renew. Energy 2012, 44, 463–468. [Google Scholar] [CrossRef]
- Forster-Carneiro, T.; Pérez, M.; Romero, L.I. Influence of Total Solid and Inoculum Contents on Performance of Anaerobic Reactors Treating Food Waste. Bioresour. Technol. 2008, 99, 6994–7002. [Google Scholar] [CrossRef] [PubMed]
- Marcos, A.; Al-Kassir, A.; López, F.; Cuadros, F.; Brito, P. Environmental Treatment of Slaughterhouse Wastes in a Continuously Stirred Anaerobic Reactor: Effect of Flow Rate Variation on Biogas Production. Fuel Process. Technol. 2012, 103, 178–182. [Google Scholar] [CrossRef]
- Holm-Nielsen, J.B.; Al Seadi, T.; Oleskowicz-Popiel, P. The Future of Anaerobic Digestion and Biogas Utilization. Bioresour. Technol. 2009, 100, 5478–5484. [Google Scholar] [CrossRef] [PubMed]
- Amorim, A.K.B.; de Nardi, I.R.; Del Nery, V. Water Conservation and Effluent Minimization: Case Study of a Poultry Slaughterhouse. Resour. Conserv. Recycl. 2007, 51, 93–100. [Google Scholar] [CrossRef]
- Kupusovic, T.; Midzic, S.; Silajdzic, I.; Bjelavac, J. Cleaner Production Measures in Small-Scale Slaughterhouse Industry—Case Study in Bosnia and Herzegovina. J. Clean. Prod. 2007, 15, 378–383. [Google Scholar] [CrossRef]
- Pagés-Díaz, J.; Westman, J.; Taherzadeh, M.J.; Pereda-Reyes, I.; Sárvári Horváth, I. Semi-Continuous Co-Digestion of Solid Cattle Slaughterhouse Wastes with Other Waste Streams: Interactions within the Mixtures and Methanogenic Community Structure. Chem. Eng. J. 2015, 273, 28–36. [Google Scholar] [CrossRef]
- Jacome, C.; Felix, J.; Olave, V.; Elizabeth, J. Modelacion, Implementacion y Automatizacion de Una Microplanta de Produccion de Biogas a Partir de Biomasa Residual Para El Laboratorio de Enrgias Renovables de La Universidad de Las Fuerzas Armadas; University of the Armed Forces Espe Headquarters: Sangolquí, Ecuador, 2015. [Google Scholar]
- Hammadi, M.; Choley, J.-Y.; Achraf Said, B.; Kellner, A.; Hehenberger, P. Systems Engineering Analysis Approach Based on Interoperability for Reconfigurable Manufacturing Systems. In Proceedings of the 2016 IEEE International Symposium on Systems Engineering (ISSE), Edinburgh, UK, 3–5 October 2016. [Google Scholar] [CrossRef]
- Arellano Arroba, C.D.; Cañizares, C.J.A. Caracterización de Los Desechos Orgánicos Del Camal de Guayaqyuil; University of the Armed Forces Espe Headquarters: Sangolquí, Ecuador, 2014. [Google Scholar]
- Bundhoo, Z.M.A.; Mauthoor, S.; Mohee, R. Potential of Biogas Production from Biomass and Waste Materials in the Small Island Developing State of Mauritius. Renew. Sustain. Energy Rev. 2016, 56, 1087–1100. [Google Scholar] [CrossRef]
- Mussoline, W.; Esposito, G.; Lens, P.; Garuti, G.; Giordano, A. Electrical Energy Production and Operational Strategies from a Farm-Scale Anaerobic Batch Reactor Loaded with Rice Straw and Piggerywastewater. Renew. Energy 2014, 62, 399–406. [Google Scholar] [CrossRef]
- Salminen, E.; Rintala, J. Anaerobic Digestion of Organic Solid Poultry Slaughterhouse Waste—A Review. Bioresour. Technol. 2002, 83, 13–26. [Google Scholar] [CrossRef] [PubMed]
- Komemoto, K.; Lim, Y.G.; Nagao, N.; Onoue, Y.; Niwa, C.; Toda, T. Effect of Temperature on VFA’s and Biogas Production in Anaerobic Solubilization of Food Waste. Waste Manag. 2009, 29, 2950–2955. [Google Scholar] [CrossRef] [PubMed]
- Matheri, A.N.; Ndiweni, S.N.; Belaid, M.; Muzenda, E.; Hubert, R. Optimising Biogas Production from Anaerobic Co-Digestion of Chicken Manure and Organic Fraction of Municipal Solid Waste. Renew. Sustain. Energy Rev. 2017, 80, 756–764. [Google Scholar] [CrossRef]
- Ahn, H.K.; Sauer, T.J.; Richard, T.L.; Glanville, T.D. Determination of Thermal Properties of Composting Bulking Materials. Bioresour. Technol. 2009, 100, 3974–3981. [Google Scholar] [CrossRef] [PubMed]
- Tambone, F.; Genevini, P.; D’Imporzano, G.; Adani, F. Assessing Amendment Properties of Digestate by Studying the Organic Matter Composition and the Degree of Biological Stability during the Anaerobic Digestion of the Organic Fraction of MSW. Bioresour. Technol. 2009, 100, 3140–3142. [Google Scholar] [CrossRef] [PubMed]
- Sahito, A.R.; Mahar, R.B.; Brohi, K.M. Anaerobic Biodegradability and Methane Potential of Crop Residue Co-Digested with Buffalo Dung. Mehran Univ. Res. J. Eng. Technol. 2013, 32, 509–518. [Google Scholar]
- Hegde, G.; Pullammanappallil, P. Comparison of Thermophilic and Mesophilic One-Stage, Batch, High-Solids Anaerobic Digestion. Environ. Technol. 2007, 28, 361–369. [Google Scholar] [CrossRef] [PubMed]
- Safar, K.M.; Bux, M.R.; Aslam, U.M. Waste to Energy: Power Generation Potential of Putrescible Wastes by Anaerobic Digestion Process at Hyderabad, Pakistan. J. Mater. Cycles Waste Manag. 2018, 20, 1239–1247. [Google Scholar] [CrossRef]
- Doran, P.M. Design of Mixing Systems for Plant Cell Suspensions in Stirred Reactors. Biotechnol. Prog. 1999, 15, 319–335. [Google Scholar] [CrossRef] [PubMed]


| Test | TS Manure (g) | Fat (gr) | TS Blood (gr) | TS Liver (g) | Total Water (g) |
|---|---|---|---|---|---|
| (P1) | 100 | - | - | 100 | 1400 |
| (P2) | 50 | - | 50 | - | 1500 |
| (P3) | 50 | - | - | 100 | 1450 |
| (P4) | 50 | 50 | - | - | 1500 |
| (P5) | 30 | - | 50 | 70 | 1450 |
| (P6) | 600 | - | - | - | 1000 |
| Test | TS (g) | %TS | %Humidity | VS (g) | Total (g) |
|---|---|---|---|---|---|
| (P1) | 200 | 12.50 | 87.50 | 117.8 | 1600 |
| (P2) | 100 | 6.25 | 93.75 | 37.95 | 1600 |
| (P3) | 150 | 9.38 | 90.63 | 97.30 | 1600 |
| (P4) | 100 | 6.25 | 93.75 | 52.90 | 1600 |
| (P5) | 150 | 9.38 | 90.63 | 83.57 | 1600 |
| (P6) | 600 | 37.5 | 62.50 | 245.56 | 1600 |
| Values | Unit | Blood | Liver | Manure |
|---|---|---|---|---|
| pH | 7.19 | 6.15 | 6.9 | |
| C/N | 4 | 24 | 23 | |
| VS | % | 30.97 | 60.4 | 40.93 |
| FS | % | 15.00 | 25.50 | 19.00 |
| Humidity | % | 84.23 | 71.06 | 70 |
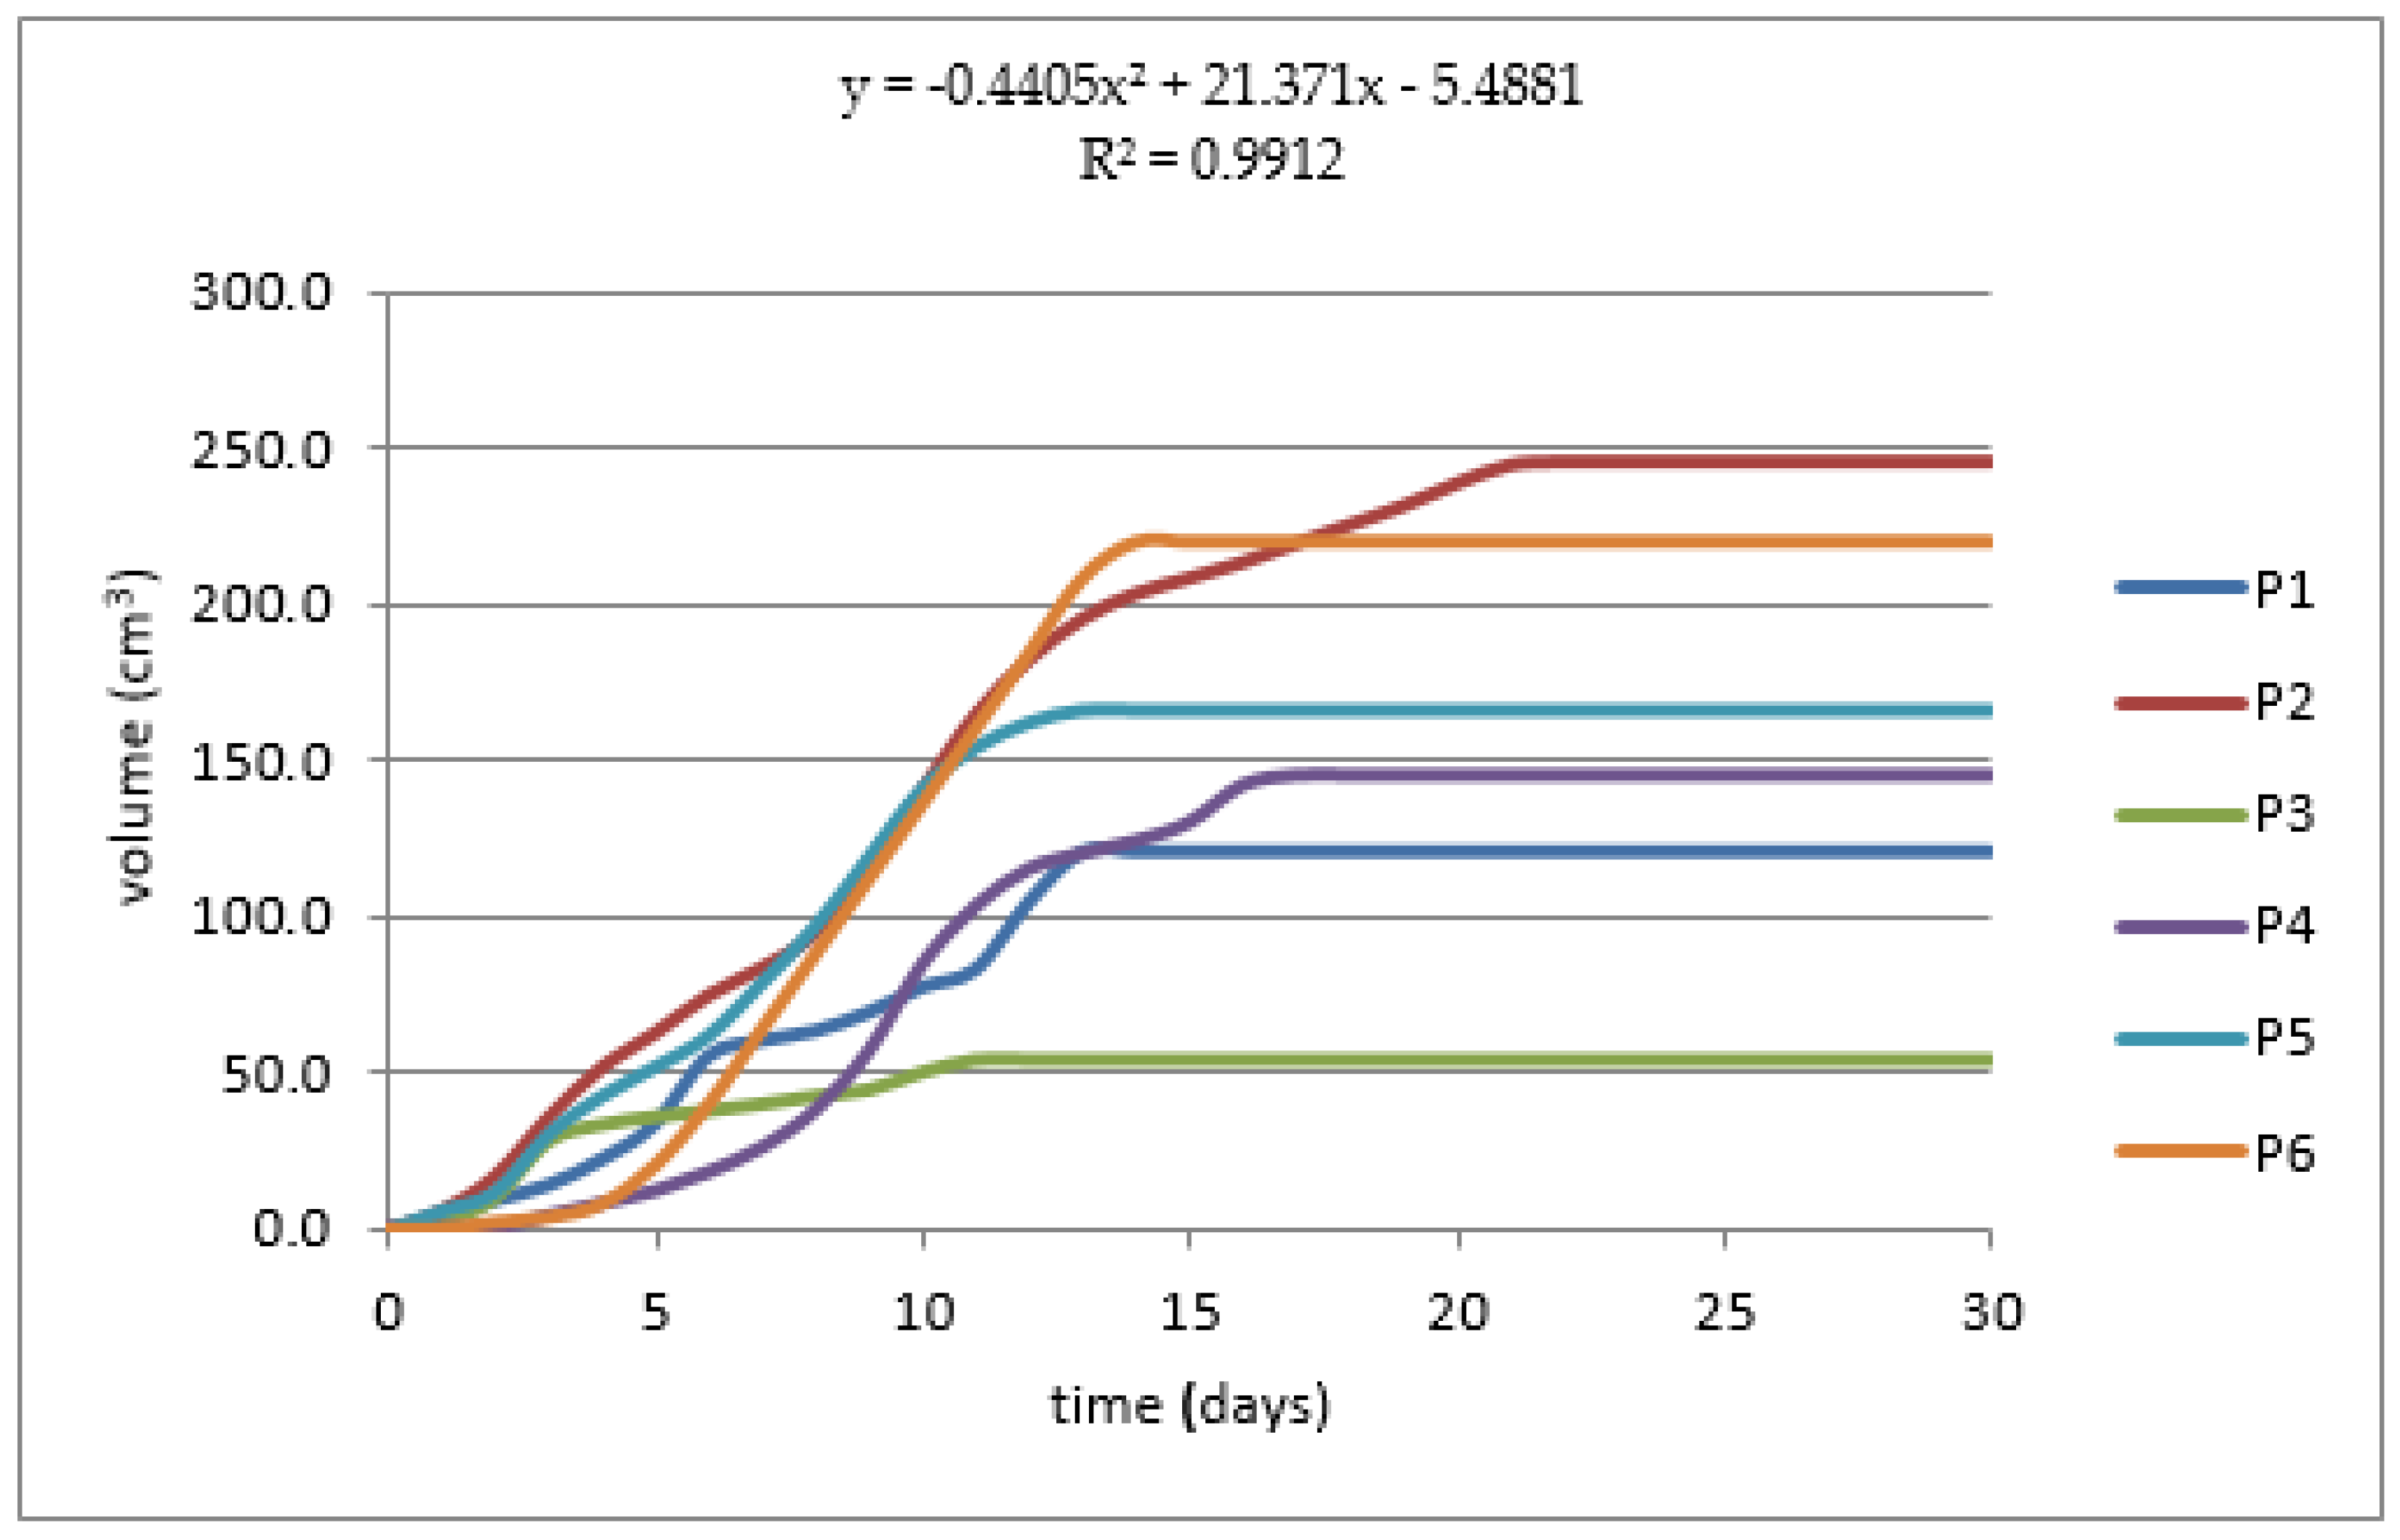
| Initial Mixture pH | Final Mixture pH | Gas (cm3) | Production (Days) | Efficiency (cm3·gVS−1) | |
|---|---|---|---|---|---|
| (P1) | 6.7 | 7.5 | 120.7 | 13 | 1.02 |
| (P2) | 7.2 | 7.0 | 245.2 | 22 | 6.46 |
| (P3) | 7.8 | 7.3 | 53.7 | 11 | 0.55 |
| (P4) | 6.8 | 5.7 | 146.0 | 15 | 2.76 |
| (P5) | 7.0 | 7.0 | 166.0 | 13 | 1.99 |
| (P6) | 7.4 | 7.5 | 219.3 | 13 | 0.89 |
| Fact | Description |
|---|---|
| T1 | Water temperature |
| T2 | Water temperature |
| T3 | Biogas temperature |
| T4 | Substrate temperature |
| P | Biogas Pressure |
| PH | Substrate PH |
| Substrate Component | Characteristic | T0 | T1 |
|---|---|---|---|
| Manure | Source | Porcine | Porcine |
| Quantity | 5 kg | 5 kg | |
| Humidity Physical Treatment before the test | 0.43% | 0.43% | |
| Sun dried | Sun-dried | ||
| Blood | Source | Freshly slaughtered chickens | Freshly chickens Sacrificed |
| Quantity | 5 Kg | 5 Kg | |
| Humidity | 90% | 90% | |
| Physical treatment before the test | None | None | |
| Water | Source | Rain | Rain |
| Quantity | 18 L | 18 L | |
| Physical treatment before the test | None | None | |
| Variables | Temperature of operation in the water chamber | 20 °C | 35 °C |
| C/N ratio | 7.53 | 7.53 | |
| Initial pH | 7.54 | 6.67 | |
| PH control | None | None | |
| Internal pressure in the digester | −0.101 (psi) | −0.101 (psi) |
Publisher’s Note: MDPI stays neutral with regard to jurisdictional claims in published maps and institutional affiliations. |
© 2022 by the authors. Licensee MDPI, Basel, Switzerland. This article is an open access article distributed under the terms and conditions of the Creative Commons Attribution (CC BY) license (https://creativecommons.org/licenses/by/4.0/).
Share and Cite
Arla, S.; Delgado, R.; Goyos, L.; Robaina, L. Two-Phase Experimentation to Determine the Optimal Composition for the Production of Biogas and Biol Substrate Mixing Waste from the Camal de Guayaquil. Energies 2022, 15, 9624. https://doi.org/10.3390/en15249624
Arla S, Delgado R, Goyos L, Robaina L. Two-Phase Experimentation to Determine the Optimal Composition for the Production of Biogas and Biol Substrate Mixing Waste from the Camal de Guayaquil. Energies. 2022; 15(24):9624. https://doi.org/10.3390/en15249624
Chicago/Turabian StyleArla, Sandra, Reinaldo Delgado, Leonardo Goyos, and Leandro Robaina. 2022. "Two-Phase Experimentation to Determine the Optimal Composition for the Production of Biogas and Biol Substrate Mixing Waste from the Camal de Guayaquil" Energies 15, no. 24: 9624. https://doi.org/10.3390/en15249624
APA StyleArla, S., Delgado, R., Goyos, L., & Robaina, L. (2022). Two-Phase Experimentation to Determine the Optimal Composition for the Production of Biogas and Biol Substrate Mixing Waste from the Camal de Guayaquil. Energies, 15(24), 9624. https://doi.org/10.3390/en15249624