Article

Linearly Polarized Antenna Boosters versus Circularly Polarized Microstrip Patch Antennas for GPS Reception in IoT Devices

1
R&D Department, Ignion, 08190 Barcelona, Spain
2
Engineering Department, Universitat Ramon LLull, 08022 Barcelona, Spain
*
Author to whom correspondence should be addressed.
Energies 2022, 15(24), 9623; https://doi.org/10.3390/en15249623
Submission received: 7 November 2022 / Revised: 5 December 2022 / Accepted: 13 December 2022 / Published: 19 December 2022
(This article belongs to the Section F: Electrical Engineering)

Abstract

:
GPS has become an attractive feature for geolocalization enabling asset tracking IoT devices. GPS satellite antennas radiate RHCP (right-hand circularly polarized) electromagnetic waves; thus, the typical antenna at the receiver is also RHCP. However, when the orientation of the receiving device is random, linear polarization antennas operate better in terms of TTFF (time to first fix). Through field measurements (urban and field) and considering different positions of the device in a vehicle, an RHCP microstrip patch antenna and a linear non-resonant antenna element called an antenna booster were compared. TTFF averaged for several positions was 7 s better for the linearly polarized antenna booster than for the microstrip RHCP patch antenna. The results demonstrate that the behavior of the linear polarization antenna booster technology is more robust in terms of TTFF to the arbitrary position of the IoT device while keeping a small size and simplicity.sdf

1. Introduction

Due to the latest innovations in electronic technology in IoT devices, GPS applications are becoming a valuable asset for tracking devices. Keeping track of one’s assets is crucial for many businesses and people. The benefit of knowing where your assets are is enormous. For instance, keeping track of a fleet of vehicles to maintain control to get the most out of their utilization to streamline routes and thus reduce CO2 emissions. The location of delivery or vehicles and similar use cases are also possible.
This study compared a traditional technology—the microstrip RHCP patch antennas—with antenna booster technology based on electrically small antenna elements called antenna boosters that can excite currents on the ground plane of the IoT device to become the main actor in the radiation process [1,2]. Thanks to a matching network, the device embedding an antenna booster can easily be tuned at GPS frequencies. This study will enable alternative antennas to the traditional ones for various IoT devices.
The size and energy efficiency of IoT devices are crucial factors to consider. Making these devices as small and efficient as feasible is therefore essential. Therefore, the size of the antenna element is key. In this regard, the present study used a very compact 7 × 3 × 2 mm3 antenna booster that is easy to integrate into an IoT device.
Different parameters were compared from both devices that have been considered to realize this case: The carrier-to-noise ratio (CNo), the number of satellites found, the dilution of precision (DOP), and the time to first fix (TTFF). Although antennas can be compared in terms of SWR, gain, and efficiency, when dealing with battery-powered IoT devices, the TTFF is the crucial parameter since it takes into account all antenna parameters to finally determine how good the antenna is to capture enough satellites to determine the position in a short period of time.
The time from when a GPS receiver is turned on until a navigation solution is generated within a specific performance range is considered by the TTFF performance metric [3].
In [4], the study demonstrates the benefits of embedding a GPS antenna in a mobile phone with linear polarization rather than circular polarization in a multipath scenario. This study was conducted in many places, but always statically. Our research covered various dynamic environments within a car because IoT tracking devices frequently move.
To know in which position to place our devices to compare them, some information can be found in the literature [5,6]. In [5], the experiment findings revealed that a GPS antenna should be mounted on a vehicle’s roof or trunk lid to see the entire sky. IoT devices are typically placed inside automobiles for tracking purposes. It is necessary to consider this factor because [5] also states that installing the antenna inside the automobile will reduce system performance due to the car body’s shielding effects. The positioning and choice of a GPS antenna have also been demonstrated to impact how well the system performs by altering the satellite coverage in the sky, modifying the system noise figure, and adding measurement inaccuracies due to multipath.
For handheld GPS terminals, other experiments successfully created a low-profile linearly polarized 3D PIFA antenna [7]. This antenna aims to cover the GPS L1 band, which has a 1575 MHz central frequency and was the subject of this study. In [7], they developed an antenna with a performance comparable to right-hand circularly polarized antennas.
Geometric coefficients (DOP) are vital elements that determine the precision of location in the GPS, and the number of satellites was found to be significant in terms of accuracy [8]. It is crucial to keep this in mind when evaluating the data.
There is a good amount of reading on circularly polarized antennas [9,10,11,12]. In [9], the antenna is a planar device composed of a single-sided printed circuit board that concurrently emits the linear polarization of an RFID and a mobile phone band and the circular polarization of a GPS band. Another proposal for a circular polarization antenna aims to cover all Global Navigation Satellite Systems, including GPS in L1 and L2 bands, GLONASS, Galileo, and BeiDou. It also has a highly effective structure for SDARS satellite broadcasting [10]. This passive structure’s design, with its overall dimensions of 43 × 104 × 14.5 mm3, allows for simple integration into various mounting points in the car. In [11], a single-feed GPS antenna was introduced with enhanced multipath rejection. The antenna was built on a shorted annular elliptical patch.
A device with two different GNSS (Global Navigation Satellite Systems) antennas was presented in [13]. The gadget has two antennas: a GNSS PCB (printed circuit board) inverted-F antenna on top and a GNSS ceramic patch antenna on the device’s bottom. The conclusions reached are that the patch is generally the best option if the device is static and able to point to the sky. However, the inverted-F antenna in the device is preferred for random orientations of the device.
However, there was little discussion compared to [4], and the common belief is that an RHCP antenna for an IoT device is always the best choice. However, what happens when the IoT device with an embedded antenna is not pointing to the sky? What happens if the device is on a seat of a vehicle? What is the performance of both the RHCP patch antenna and antenna booster if the device is upside-down? Does the radiation pattern of a microstrip patch antenna, typically directive, become worse than a quasi-isotropic linearly polarized antenna booster when the orientation of the device is not known, or even worse, cannot be controlled? Consequently, a comparison of circularly polarized microstrip patch antennas and linear-polarized antenna boosters was conducted to determine the performance, depending on the position and orientation of the IoT device inside a vehicle.
There are different antenna designs when creating a GPS microstrip patch antenna [14,15,16,17,18,19,20]. Some consist of a single layer patch antenna, one or two feeding points as well as modifying the geometry to generate two degenerated out-of-phase orthogonal modes to radiate an RHCP electromagnetic wave.
The rest of this paper is divided as follows. Section 2 describes all the resources used to conduct the research. Section 3 describes the steps taken to gather all data required for the study. Section 4 demonstrates the results of the procedure. Section 5 discusses some representative cases of IoT devices. Section 6 presents the conclusions.

2. Components for the Testing

2.1. Antennas under Study

An RHCP microstrip patch antenna and a linearly polarized antenna booster were used for the analysis (Table 1).

2.1.1. Linearly Polarized Antenna Booster

The antenna booster for the linear polarization device had the dimensions of 7.0 × 3.0 × 2.0 mm3 and was centered at a frequency of 1575 MHz (Table 1). This radiates evenly because of its omnidirectional emission pattern. The peak gain for this antenna was 1.8 dBi. Figure 1 depicts the 53 × 53 mm2 device and the GPS antenna booster positioned at the top left corner of the PCB [21].
The LNA used for these measurements was an external LNA attached to the device with SMA transitions, which introduces losses. This LNA had a gain of 16.5 dB, a noise figure of 1.03 dB, and was centered at 1575 MHz (Table 2).
Additionally, to model a more realistic scenario, an antenna booster-based chip component was placed at the right corner of the PCB, operating at cellular frequency bands comprising 698–960 MHz and 1710–2170 MHz. The objective was to consider a real situation, such as a tracking device having cellular connectivity (ex. LTE-M) and GPS (Figure 1).
Since the 7 × 3 × 2 mm3 GPS antenna booster is non-resonant at the frequency bands of operation, a matching network with lumped components (SMD 0402) was designed [1]. Due to the narrow bandwidth needed for GPS (1.5%), the matching network was simple, comprising only three lumped components, a series, and a shunt inductor (Figure 1). The measured total efficiency (ηt = ηr·(1 − |S11)2 − |S21|2) takes into account all losses of the antenna system (antenna booster, FR4 of the PCB, feeding line, and matching network), the matching at the GPS port (S11), and the coupling between the GPS and cellular port (S21). This total efficiency was measured using 3D-pattern integration with an MVG Star-Lab anechoic chamber resulting in a total efficiency of 75% at 1575 MHz. Note that antenna booster technology can also operate for other radio protocols from a single frequency band to multiband operation [1,2]. For multiband operation, a multiband matching network was designed that can be easily addressed through matching network synthesis [1]. For example, operation across 824–960 MHz and 1710–2690 MHz can be achieved with a tiny antenna booster of only λ/30 at 824 MHz.

2.1.2. Circularly Polarized Microstrip Patch Antenna

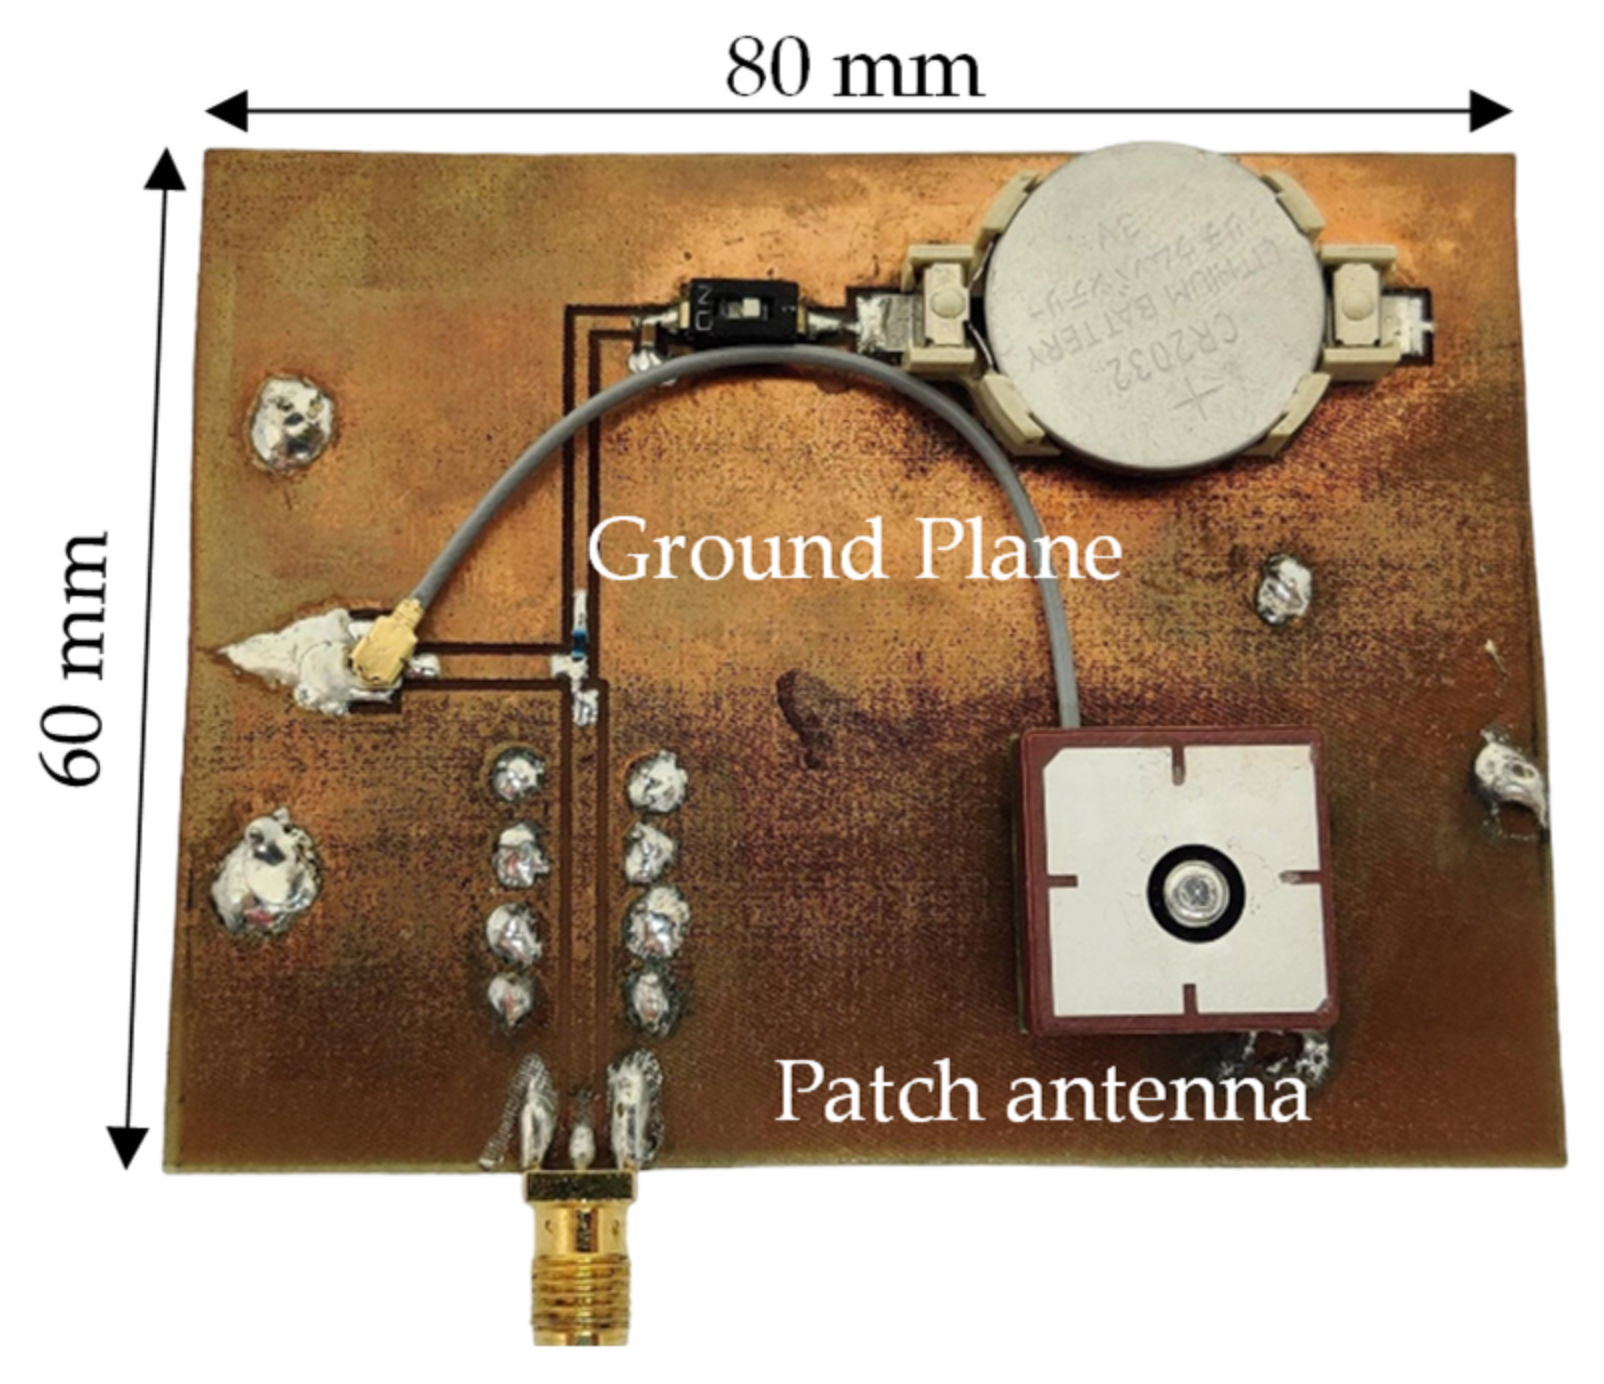
The specifications of the circularly polarized antenna are listed in Table 1. This was a 17.0 × 17.0 × 4.0 mm3 microstrip patch centered at 1575.42 MHz. At its zenith, this antenna’s gain was −1.0 dBi. Figure 2 illustrates the 80 mm by 60 mm device’s ground plane, with the microstrip patch positioned close to the left corner of the device, being a typical position.
As for the LNA, this was integrated into the patch antenna. The specifications of this antenna are given in Table 2. Only the ceramic patch was included in this measurement; the actual antenna size was 17.0 × 17.0 × 6.1 mm3.
This was centered at a frequency of 1575.42 MHz and has a gain of 16 dB. The noise value introduced by this LNA was 2.5 dB.

2.2. GNSS Evaluation Kit

To make the comparisons as equitable as possible, two u-blox devices were used as receivers at the same time, which was the EVK-8, an evaluation kit that evaluates the performance of the positioning technology.
Both devices were connected to each of the PCBs simultaneously, and software signed by u-blox was used to evaluate the performance of the devices to compare them. With this software, the NMEA frames, which are the data and electrical standard that combines for communication between electronic devices, can be obtained. With such data, an exhaustive analysis was carried out thanks to a program developed with MATLAB. This provides different information, such as the signal-to-noise ratio, the number of satellites in use at any given moment, the dilution of precision, and the TTFF.

3. Testing Procedures

3.1. Static Setup

The first procedure is a measurement called static measurement. In this measurement, data were collected during 30-min periods inside a building. In the first test, both devices were placed next to the window. Once the 30 min had elapsed, the measurement was repeated, placing the devices away from the window toward the inside of the building. The purpose of this was to check how each device was affected by being more conditioned inside the building in order to simulate whether the geolocation could be obtained within the building. For this measurement, the average of the CNo, the average of the satellites used during this period, and the average of the accuracy were used, as illustrated next.

3.2. Dynamic Setup

The second group of measurements is called dynamic because these measurements are carried out in motion by placing both devices in different positions inside a car, as shown in Figure 3. Within this group of measurements, different tests were carried out to evaluate the performance of both technologies, the circularly polarized microstrip patch antenna and the linearly polarized antenna booster.
The first set of dynamic measurements that were performed was a continuous measurement in which, when a fix is obtained, the route is covered by a car in which the data are captured in different environments. These environments are categorized as highway, in which there is a more open space without buildings or trees that can interfere with the signal; then the city environment, in which the vehicle goes between wide and narrow streets; and finally, forest, which is an intermediate between the highway and city.
In the second campaign of measurements, the same route was followed as in the previous one, but the aim was to obtain another type of data. In this case, cold starts are performed during the route, the time to first fix is measured, and then an average is obtained. The purpose of this measure is to check how long it takes each device to find the location of the vehicle in the different positions of the device. This measurement is fundamental because it provides how fast both antenna technologies can determine the position.
The last of the tests performed within the dynamic measurements were to run the same procedure as in the previous case, but in this case, instead of performing a cold start, a warm start is carried out. The data on the almanac (information about the time and status of the entire satellite constellation) and the ephemeris (data used to calculate the position of each satellite in orbit) were wiped to run the cold start simulation, which mimics a device that has just been activated for the first time without a previous fix. For the warm start, however, the ephemeris is eliminated to imitate a device that has lost its units temporarily while the almanac is known [3]. By doing this, we can make a case as similar as possible to the behavior obtained from an IoT geolocation device, which obtains the position of the vehicle in every certain period to optimize the battery. Therefore, this measure is significant because it seeks the minimum possible time to obtain a location so that the battery lasts the maximum time.

3.2.1. Device Positions

To perform the dynamic measurements, both devices were placed at different positions of the vehicle to test their behavior and performance in different environments. Four locations were proposed inside the car where the devices were placed. Then, in each of these locations, the devices were placed at different orientations to analyze how the position and orientation impact the performance of the GPS parameters under study.
The four positions inside the car are the front dashboard (a–d), rear dashboard (e–f), under the seat (g,h), and over the seat (i–k), as can be seen in Figure 3.
These different positions simulate the other places where a person can drop an IoT geolocation device, so how each technology behaves concerning these positions can be compared. All of these positions and orientations are interesting because an IoT device will not always be facing the sky but in any orientation since the device may be dropped randomly. Therefore, when placing the device in these locations in the car, there are other ways of facing the device, such as the device facing the sky, facing downward, facing the front of the vehicle, or facing the rear of the car (Figure 3).

3.2.2. Route

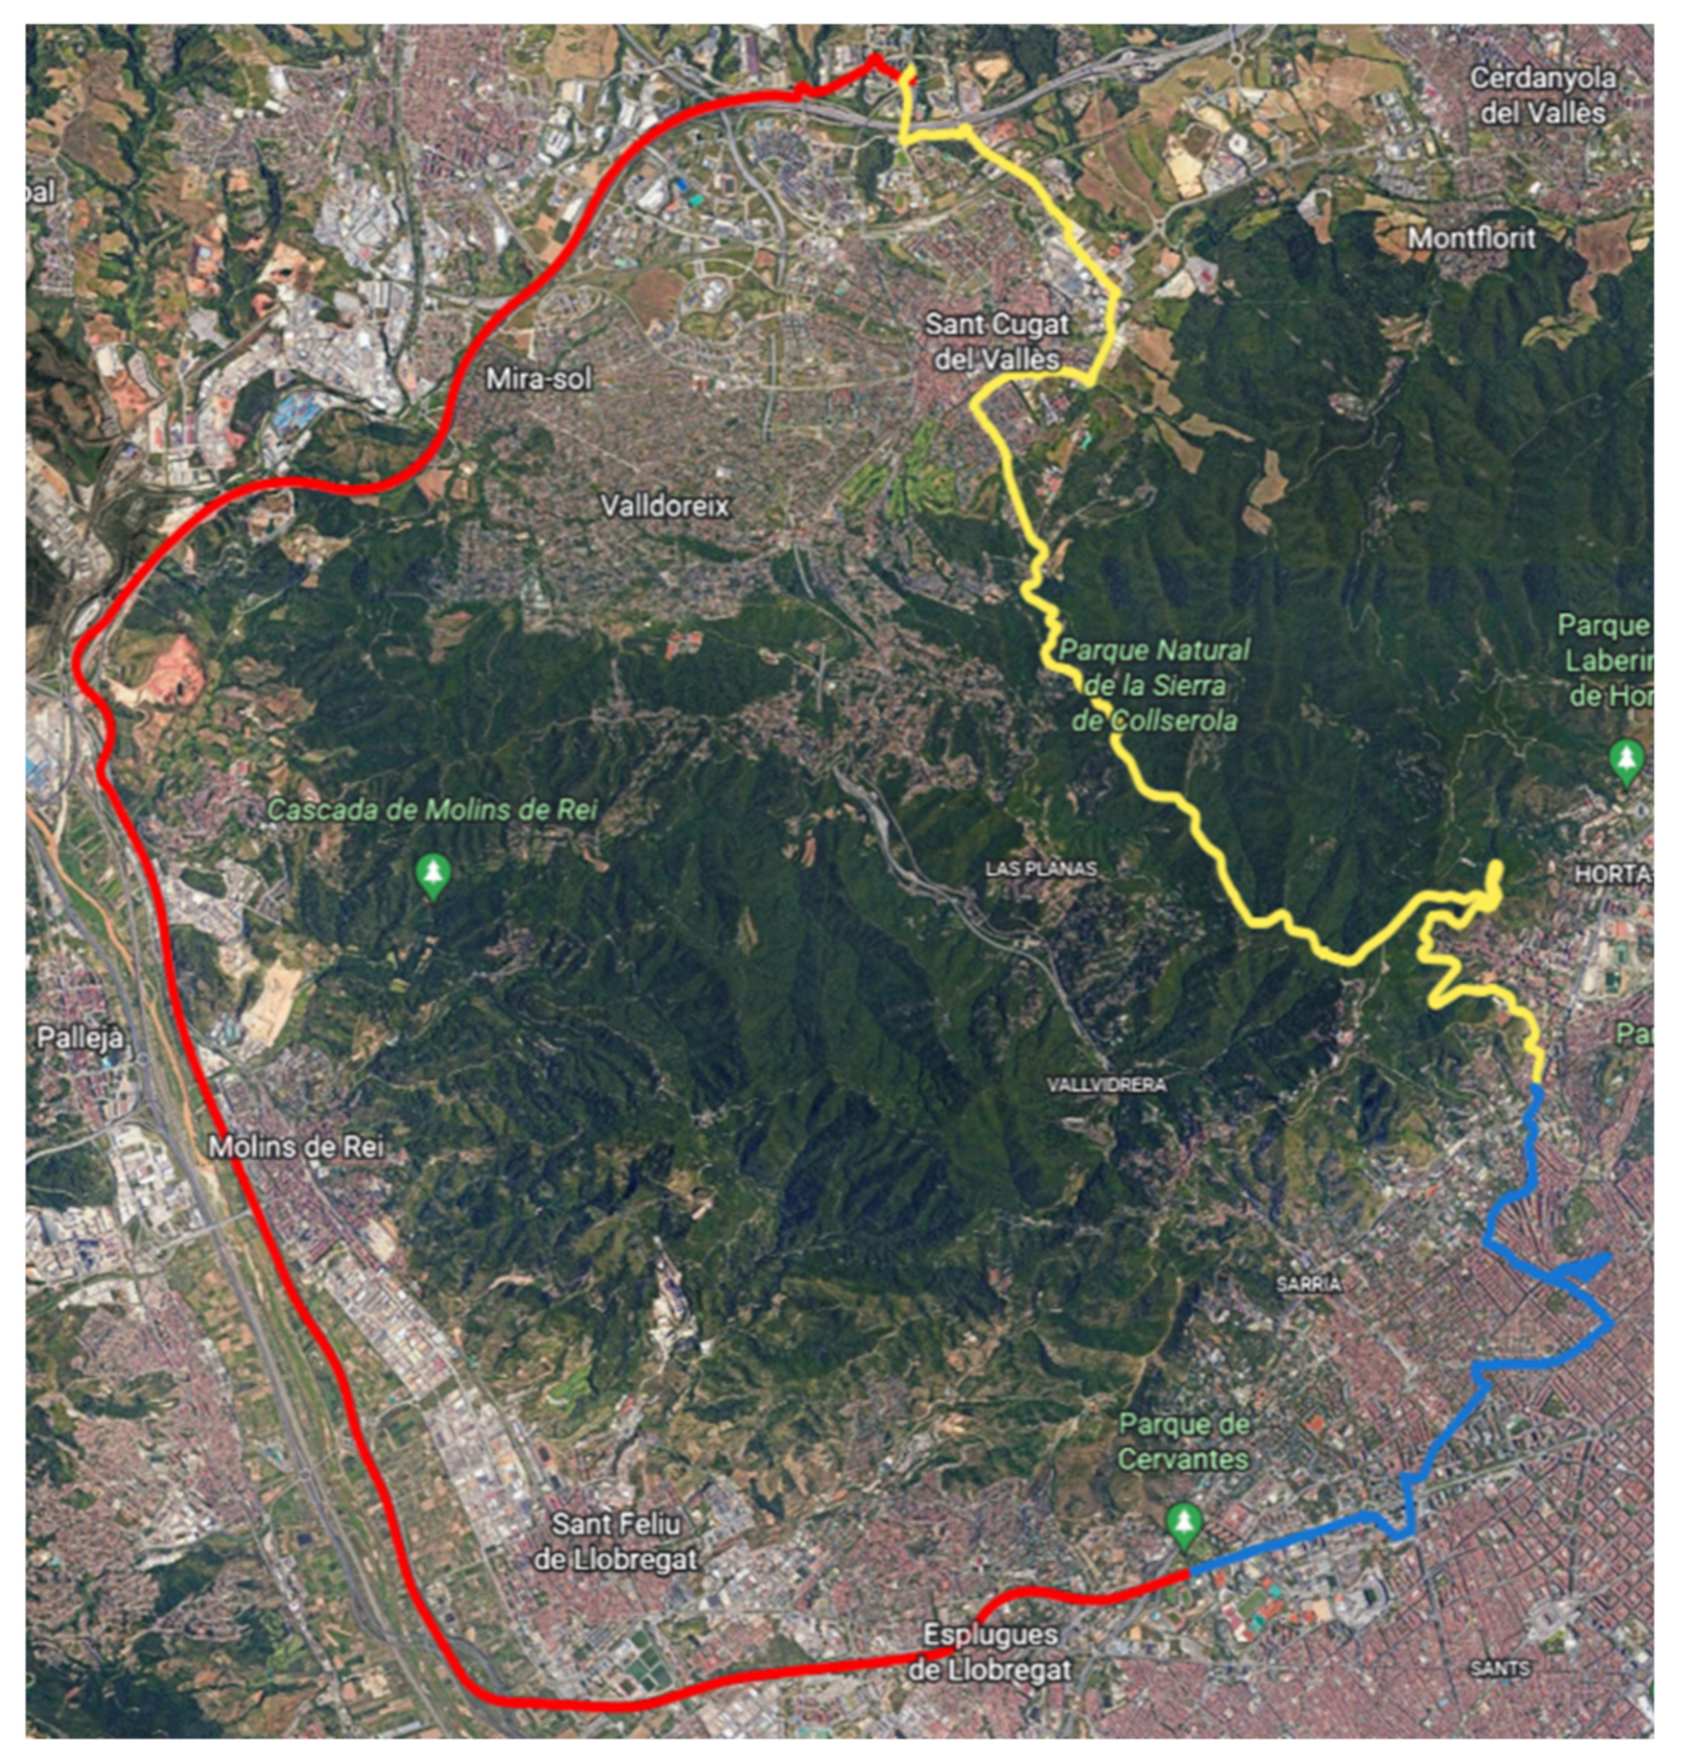
As observed in Figure 4, a 50 km route was selected to perform the averages and compare the two antenna technologies in as many environments as possible. The route was divided into three sections: highway, city, and forest.
A highway is an environment with open spaces, without buildings or trees that can interfere with the signal. The city environment runs between wide and narrow streets, and finally, the forest, with trees and irregular topography with mountains.

4. Results

4.1. Static Results

This section shows the results for both antenna technologies when the devices were in a static position, such as close to a window or in a car.

4.1.1. Cno

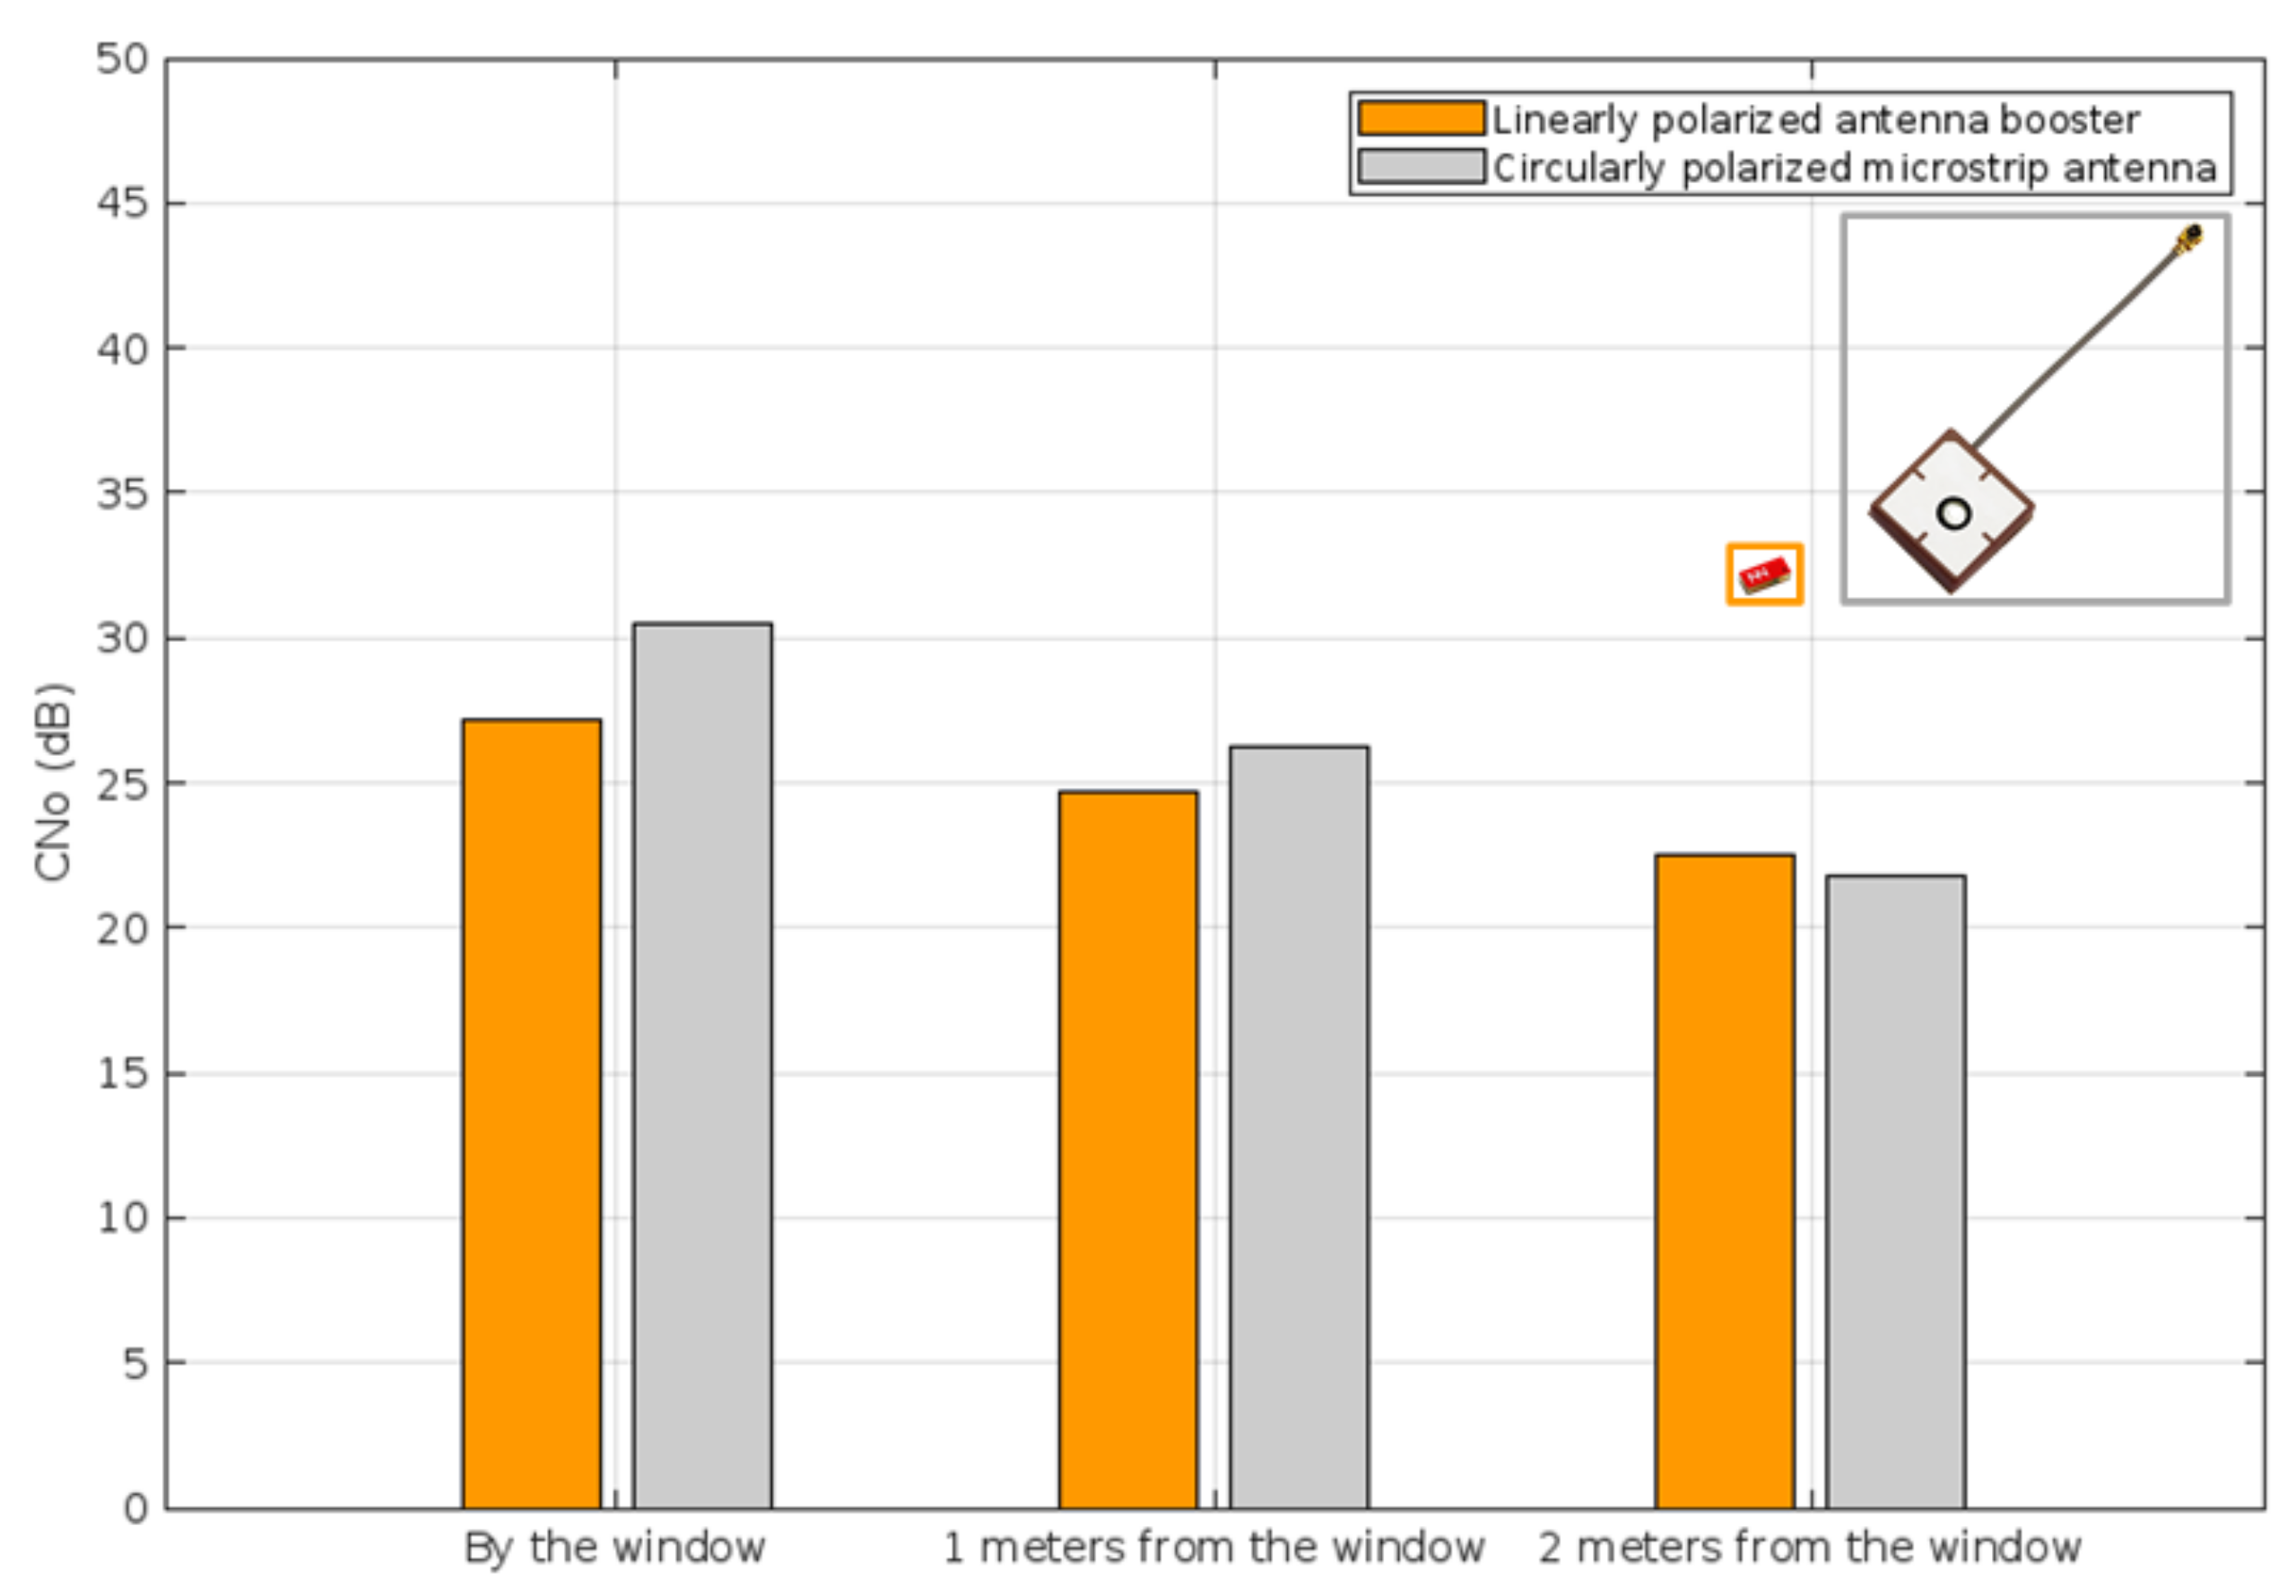
The static signal-to-noise ratio measurement was performed inside a building with large glass windows. As the testing procedure section mentioned, measures were taken at various distances from the window. As seen in Figure 5, these are the results of the measurement from the window up to 2 m into the building. As observed in the graph, the measurement made with both devices right at the window, the circularly polarized antenna, showed better results, with a difference of approximately 3 dB. This position closely resembles the clear view and, therefore, is optimum for circular polarization.
The second measurement shown in Figure 5 was performed with both devices at a distance of 1-m inward of the building. As can be seen, the circularly polarized antenna still had a better signal-to-noise ratio, but in this case, the difference dropped to approximately 1.5 dB.
The last measurement was made with the devices at a distance of 2 m from the interior of the building. In this case, since the circularly polarized antenna did not have a direct view of the sky, it lost more signal-to-noise ratio. However, we observed that the performance of the linearly polarized antenna, although with a lower Cno than in the previous case, was better. This is because the device was less conditioned by the environment. The difference in this scenario was 0.7 dB better.

4.1.2. Number of Satellites

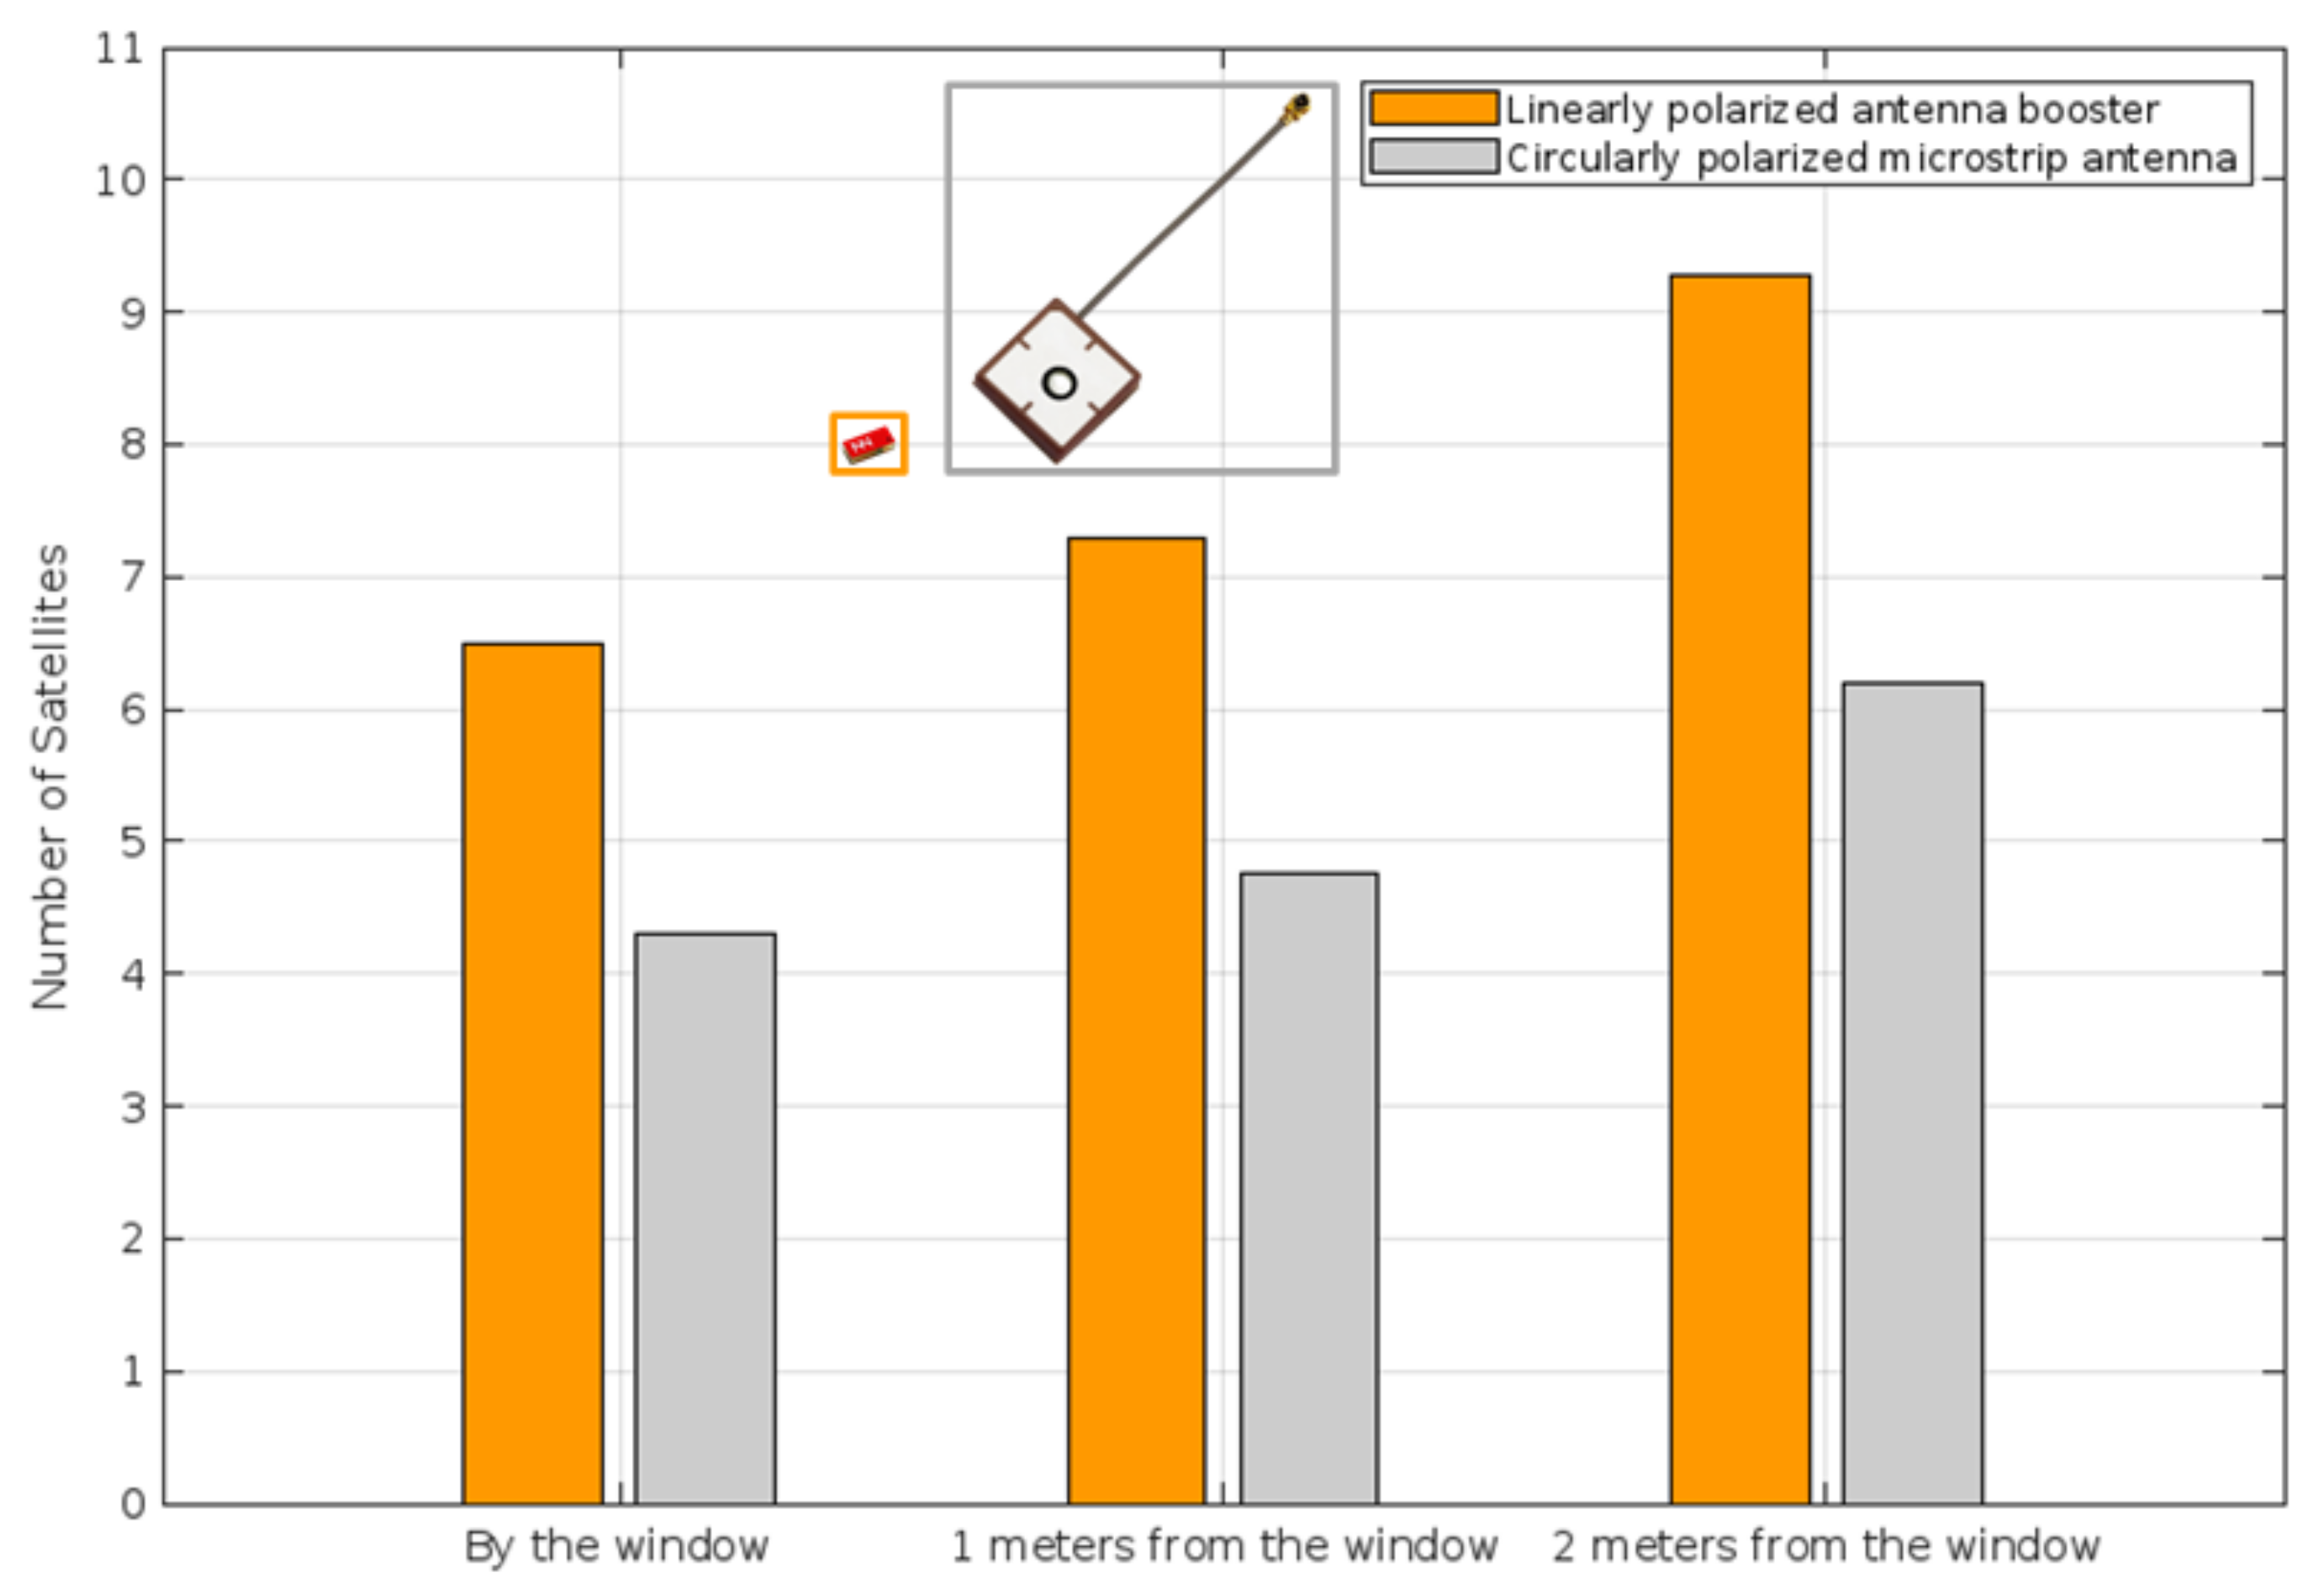
In order to measure the number of satellites that could be seen for each of the devices, measurements were carried out as mentioned in the testing procedure. As seen in Figure 6, the number of satellites that the device could see with linear technology obtained a higher number of satellites in all cases.
Concerning the circular polarization case, the average number of satellites on those closer to the window was 4.2, which is very close to the minimum number of satellites required to obtain the geolocation. A value of 4 is needed to obtain the geolocation. The average satellite value significantly increased as soon as the device was brought within the structure, but it never reached the levels attained by the device using linear polarization.
In the case of the linear polarization device (Figure 6), it followed the same tendency as the circular polarization device to have a higher average value in positions farther away from the window. Additionally, it should be taken into account that this was 6.5, a mean value significantly higher than 4, in the position where it had the worst average, demonstrating a higher level of robustness.

4.1.3. Dilution of Precision

The dilution of precision is a term used in geomatics engineering and satellite navigation to describe the mathematical impact of the geometry of navigation satellites on the accuracy of positional measurements. Figure 7 displays this situation and demonstrates how the precision of the linearly polarized devices performed better in all scenarios. DOP is an approximation of the ratio between the accuracy of measurements and positioning. Figure 7 displays the position DOP (PDOP), which depicts the influence of satellite geometry on position estimates while accounting for the precision attained both horizontally and vertically (in height). A smaller number implies a more exact accuracy value, hence the lower the DOP (in this instance PDOP), the better, as it is a variable that determines the accuracy of a device in obtaining geolocation.
To quantify the quality of the results, it can be observed that results between 1 and 2 were deemed excellent, those between 2 and 5 were considered good, those between 5 and 10 were deemed moderate, and outcomes over 10 were deemed fair or poor [22]. It was also possible to note a correlation between geolocation accuracy and window distance with the previous results; the accuracy increased with increasing distance from the window.

4.1.4. TTFF in an Ideal Position in a Vehicle

The last static measurement was an average of 10 TTFF measurements performed at the front of the car, specifically at the front dashboard–Face up position, as shown in Figure 3a. In this case, we decided to conduct the TTFF measurements for the static position inside the car when it was parked in an open area because it would provide a preview of the results when conducting the dynamic measurements. The TTFF test was not deemed applicable inside the building since IoT devices are often operated outside. As shown in Figure 8, although both results were very similar, the average of the linearly polarized antenna was slightly better than the average obtained with the circularly polarized antenna. Regarding the maximum time it takes to obtain the fix, both devices showed similar performance, but the linearly polarized antenna was 0.9 s better (lest seconds to connect). The last comparison in Figure 8 shows the minimum time it takes to perform the fix, as we can see, both devices behaved identically, with a slight difference of fewer than 0.2 s in favor of the linear polarization.

4.2. Dynamic Setup

This section shows the results for both antenna technologies when the devices were in a dynamic position. In contrast to the previous section, this section gathers the results for both antenna technologies when the devices were in different positions inside a vehicle.

4.2.1. CNo

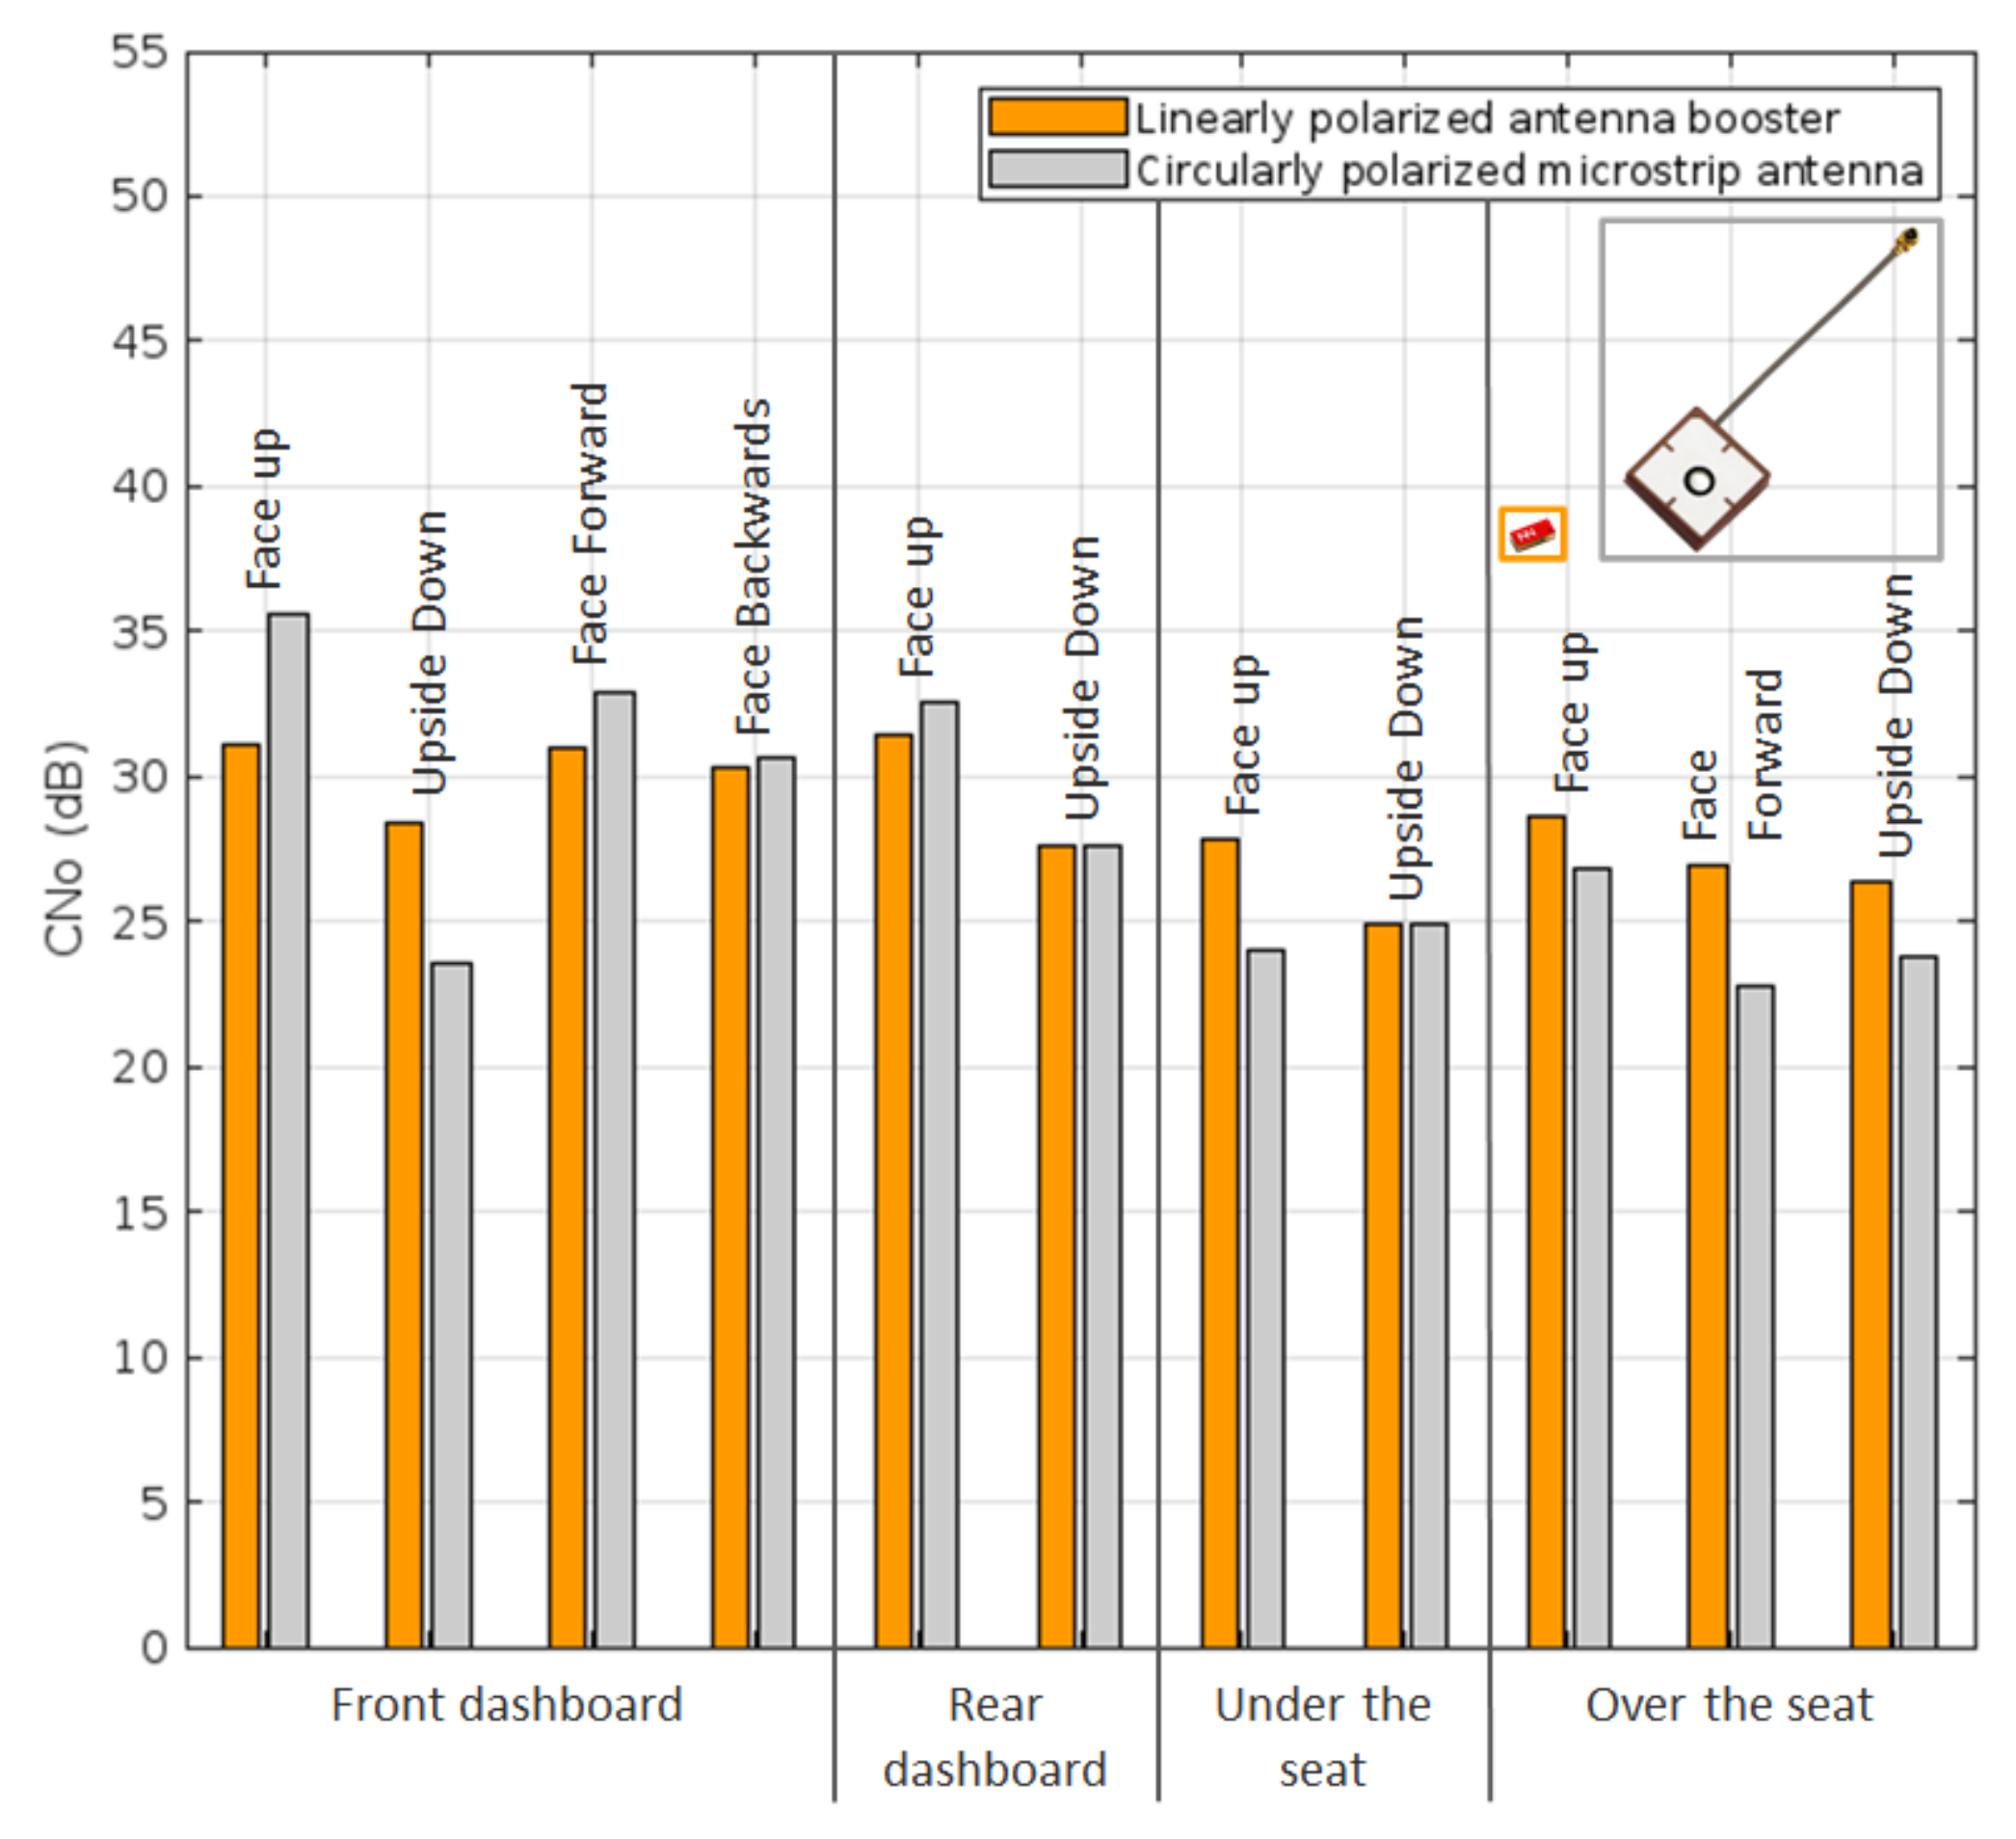
The findings for the signal-to-noise ratio are displayed in Figure 9, and they were collected to achieve the results with a moving vehicle.
In four of the 11 scenarios evaluated, the circularly polarized devices performed better. On the other hand, five out of the 11 test scenarios showed better performance from the devices using linear polarization. The two remaining scenarios showed a virtually comparable performance from both devices, with the linearly polarized devices performing 0.1 dB better.

4.2.2. Number of Satellites

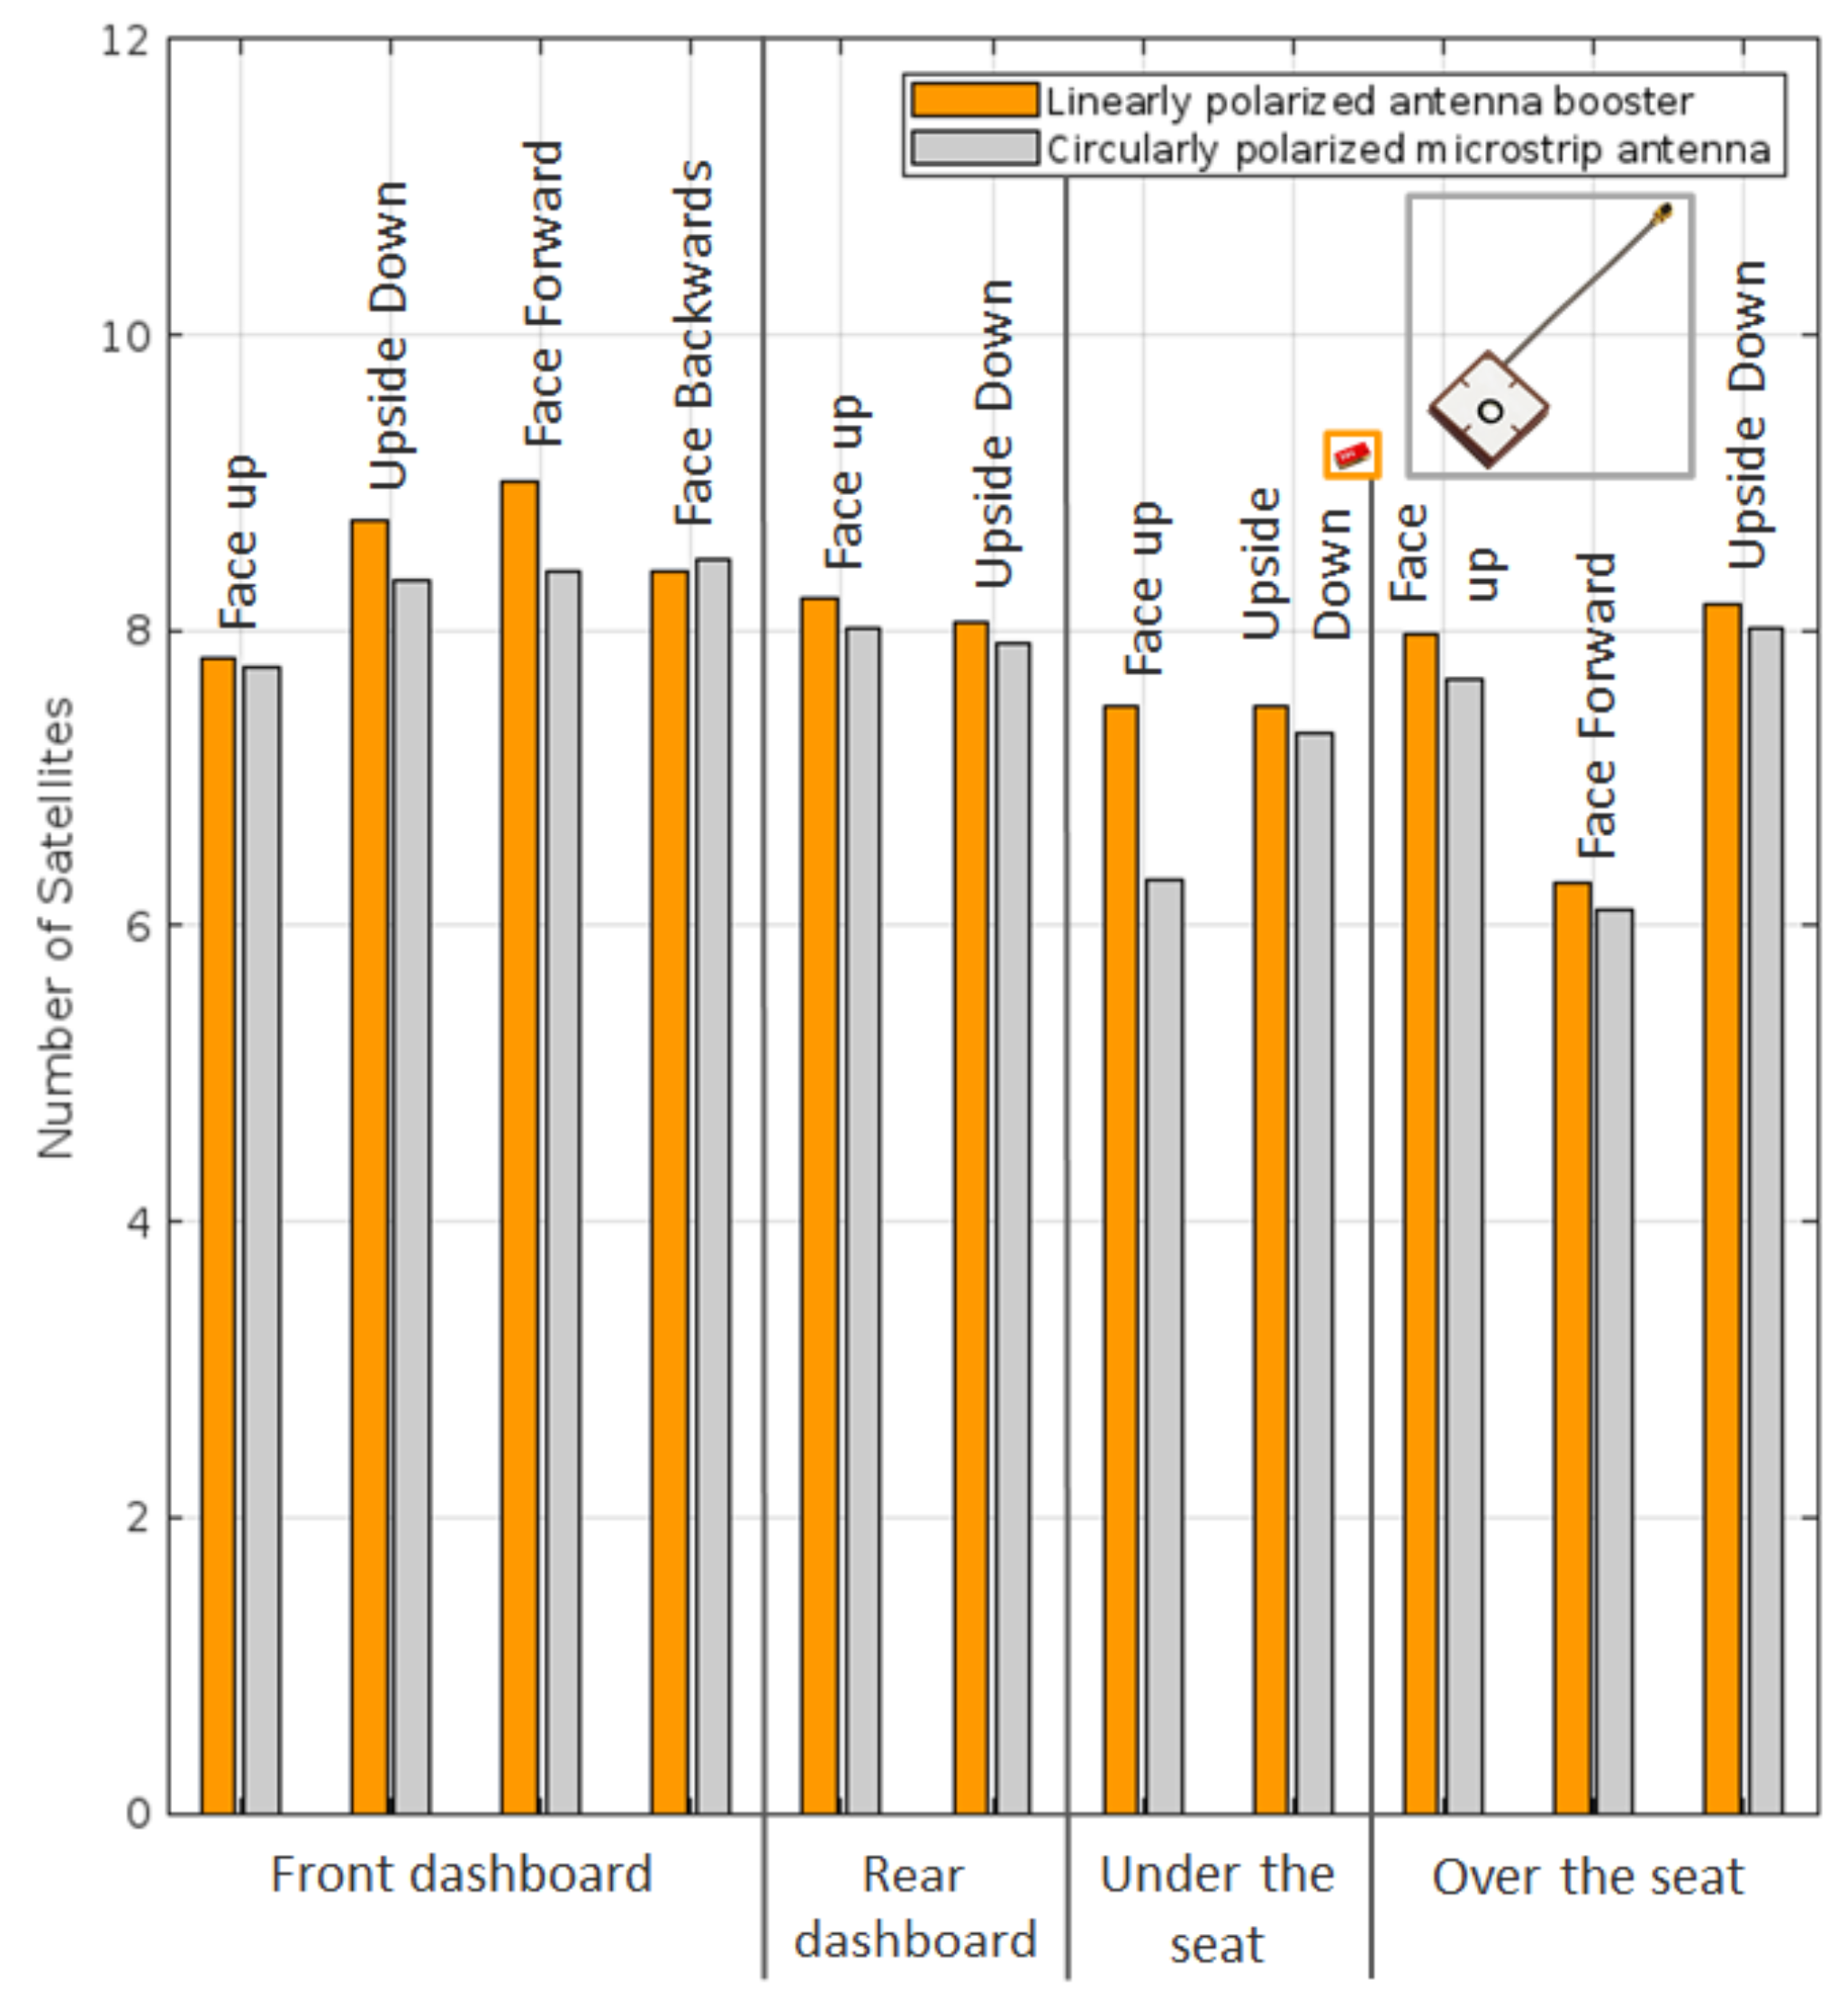
In this scenario, Figure 10 shows the average number of satellites obtained during the measurements carried out while the vehicle was moving.
Both devices performed nearly identically, with a slight advantage over the device with a linearly polarized antenna booster.

4.2.3. Dilution of Precision

In this instance, Figure 11 illustrates the average DOP obtained by observations carried out while driving.
In only one of the 11 studied scenarios, the device with circular polarization performed better. The device using the linearly polarized antenna booster functioned better in the remaining scenarios (10/11). Although the accuracy was higher in the linear polarization scenarios in this instance, the outcomes were relatively comparable.

4.2.4. TTFF Results by Device Positioning

The time it takes for a GPS device to gather satellite signals and navigational data to determine its position or fix is known as the time to first fix. Before a GPS device offers the correct position data, it needs three types of data: GPS satellite signals, almanac data, and ephemeris data.
This measure is significant because it generally encompasses the measures observed above, such as the signal-to-noise ratio (Cno), the number of satellites, and the accuracy. The less time it takes to perform a fix, the faster the reception of all the necessary values to obtain the position, and thus, the lower the battery consumption since the device can go to sleep mode once the position (fix) is determined. In the following results, it is important to emphasize that for TTFF values, the lower the values, the better, as it is the time it takes to find the geolocation.
The warm start startup mode was used for this TTFF measurement. A warm or normal start requires the GPS device to have the following features: timing precision of 20 s, positioning accuracy of 100 km, velocity accuracy of 25 m per second, and correct almanac data. To gather orbital information during a warm start, the device must receive a signal from each relevant satellite [3]. This startup mode was chosen because it most closely replicates the behaviors of an IoT device.
  • Front Dashboard
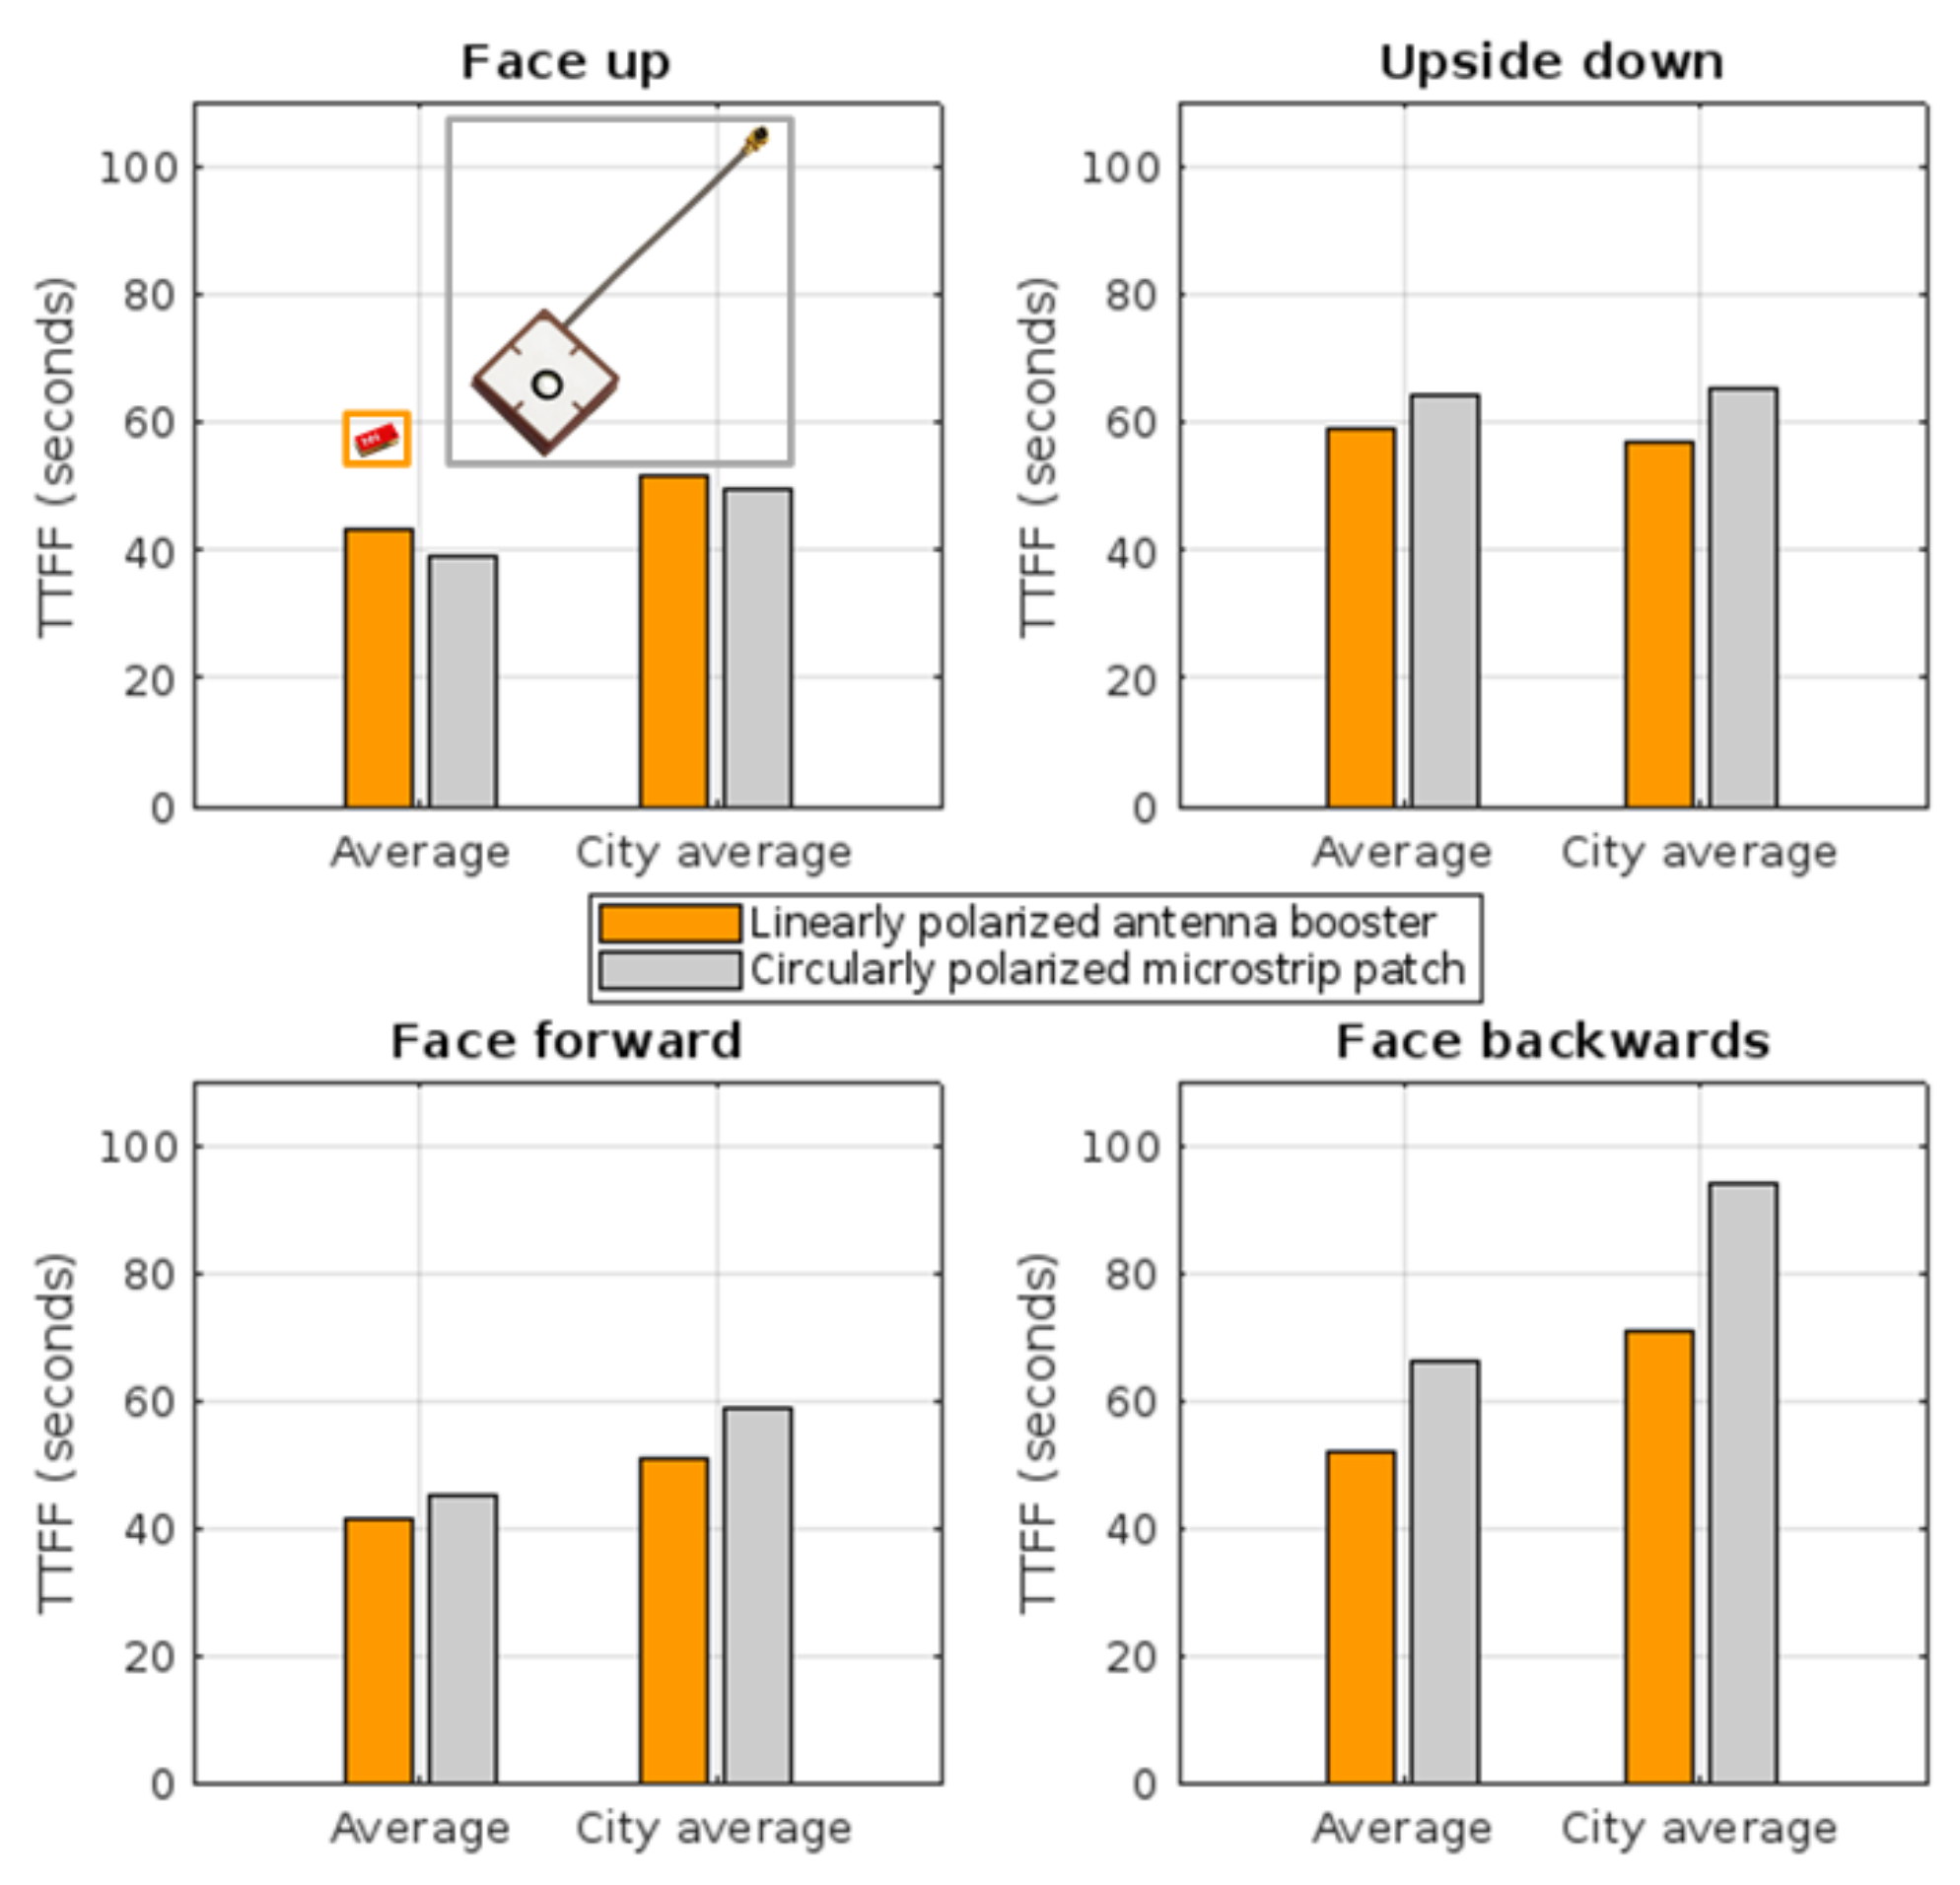
Figure 12 illustrates the results for the TTFF in the locations where the device was on the front dashboard. As seen, the measurement results carried out with the device facing up were relatively similar, with the device with the circularly polarized patch antenna achieving a marginally superior result. This is because this was in a position in which this technology functions more effectively.
On the other hand, we could also observe similar results for the face forward orientation, where the linearly polarized antenna booster benefits from this position. The linear polarization devices performed better in both the upside-down and backward positions. This leads to the conclusion that a linearly polarized antenna booster produces better results for the random orientation of a wireless device.
  • Rear Dashboard
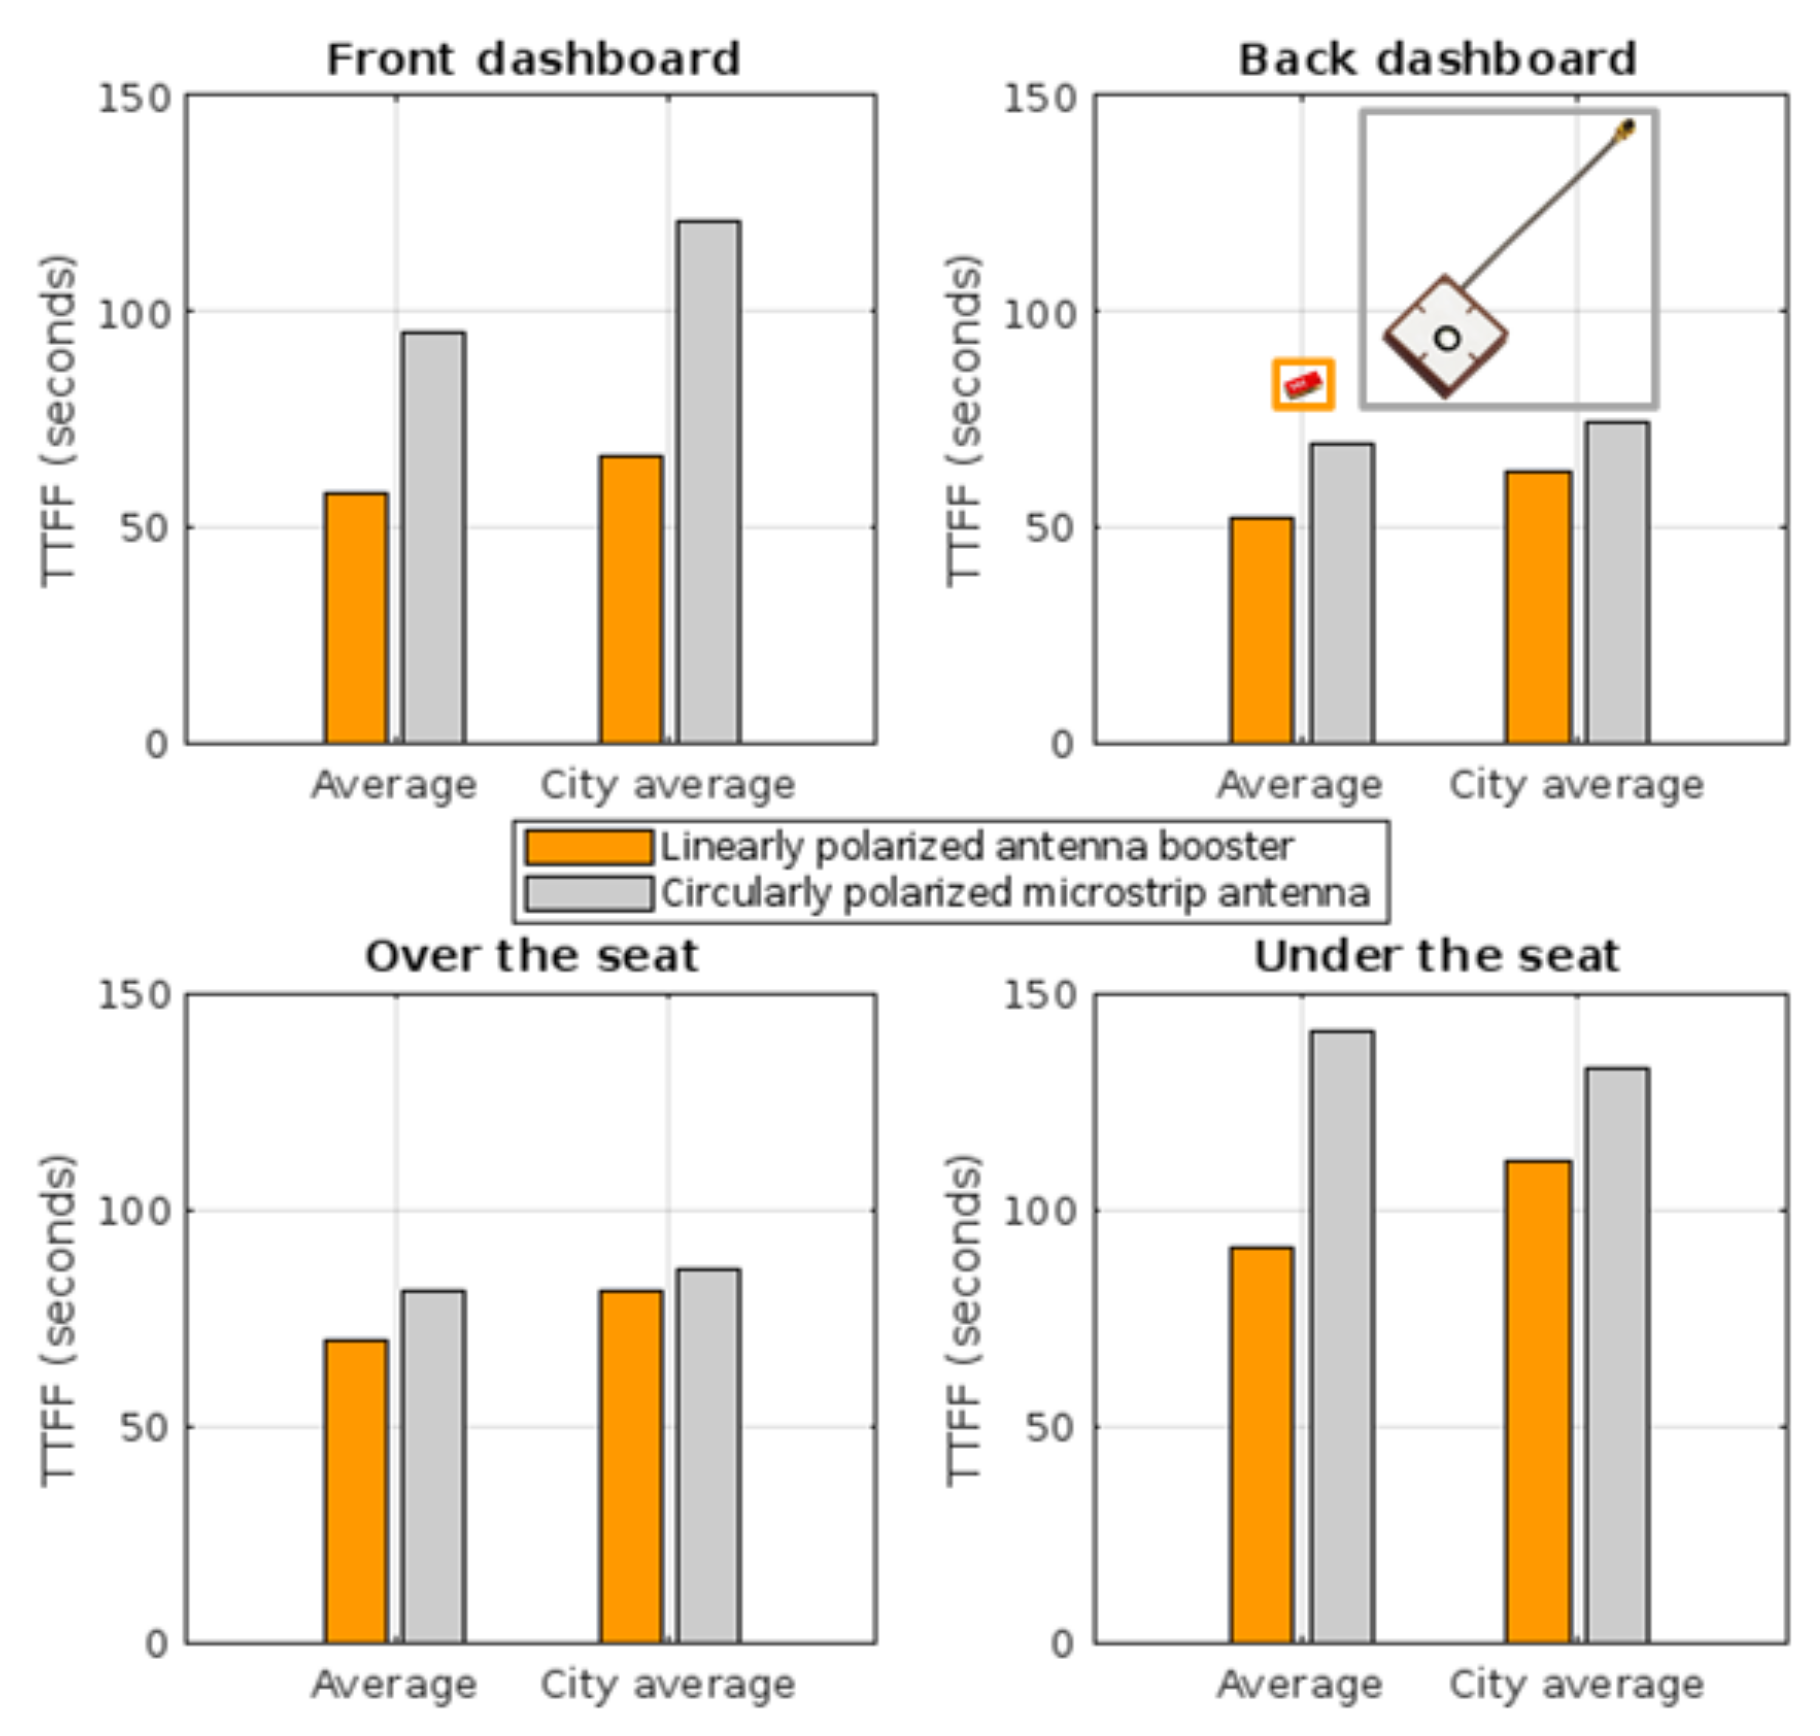
Figure 13, in this case, displays the outcomes for the rear dashboard position. The results from the route depicted in Section 3.2.2 were averaged. The average result observed for face-up orientation was slightly better for the device using circular polarization (2.3 s better). In the same position, but observing only the city average, it could be observed that the linear polarization device was improved (2.3 s better), which may be due to the negative impact of multi-path for circular polarization. As can be observed, in the other cases, the device with the linearly polarized antenna booster featured better behavior since it took less time to perform the fix (average and city averages were 3.7 and 9.9 s better, respectively). As before, the linearly polarized antenna booster was more robust to random orientations of the device.
  • Over the Seat
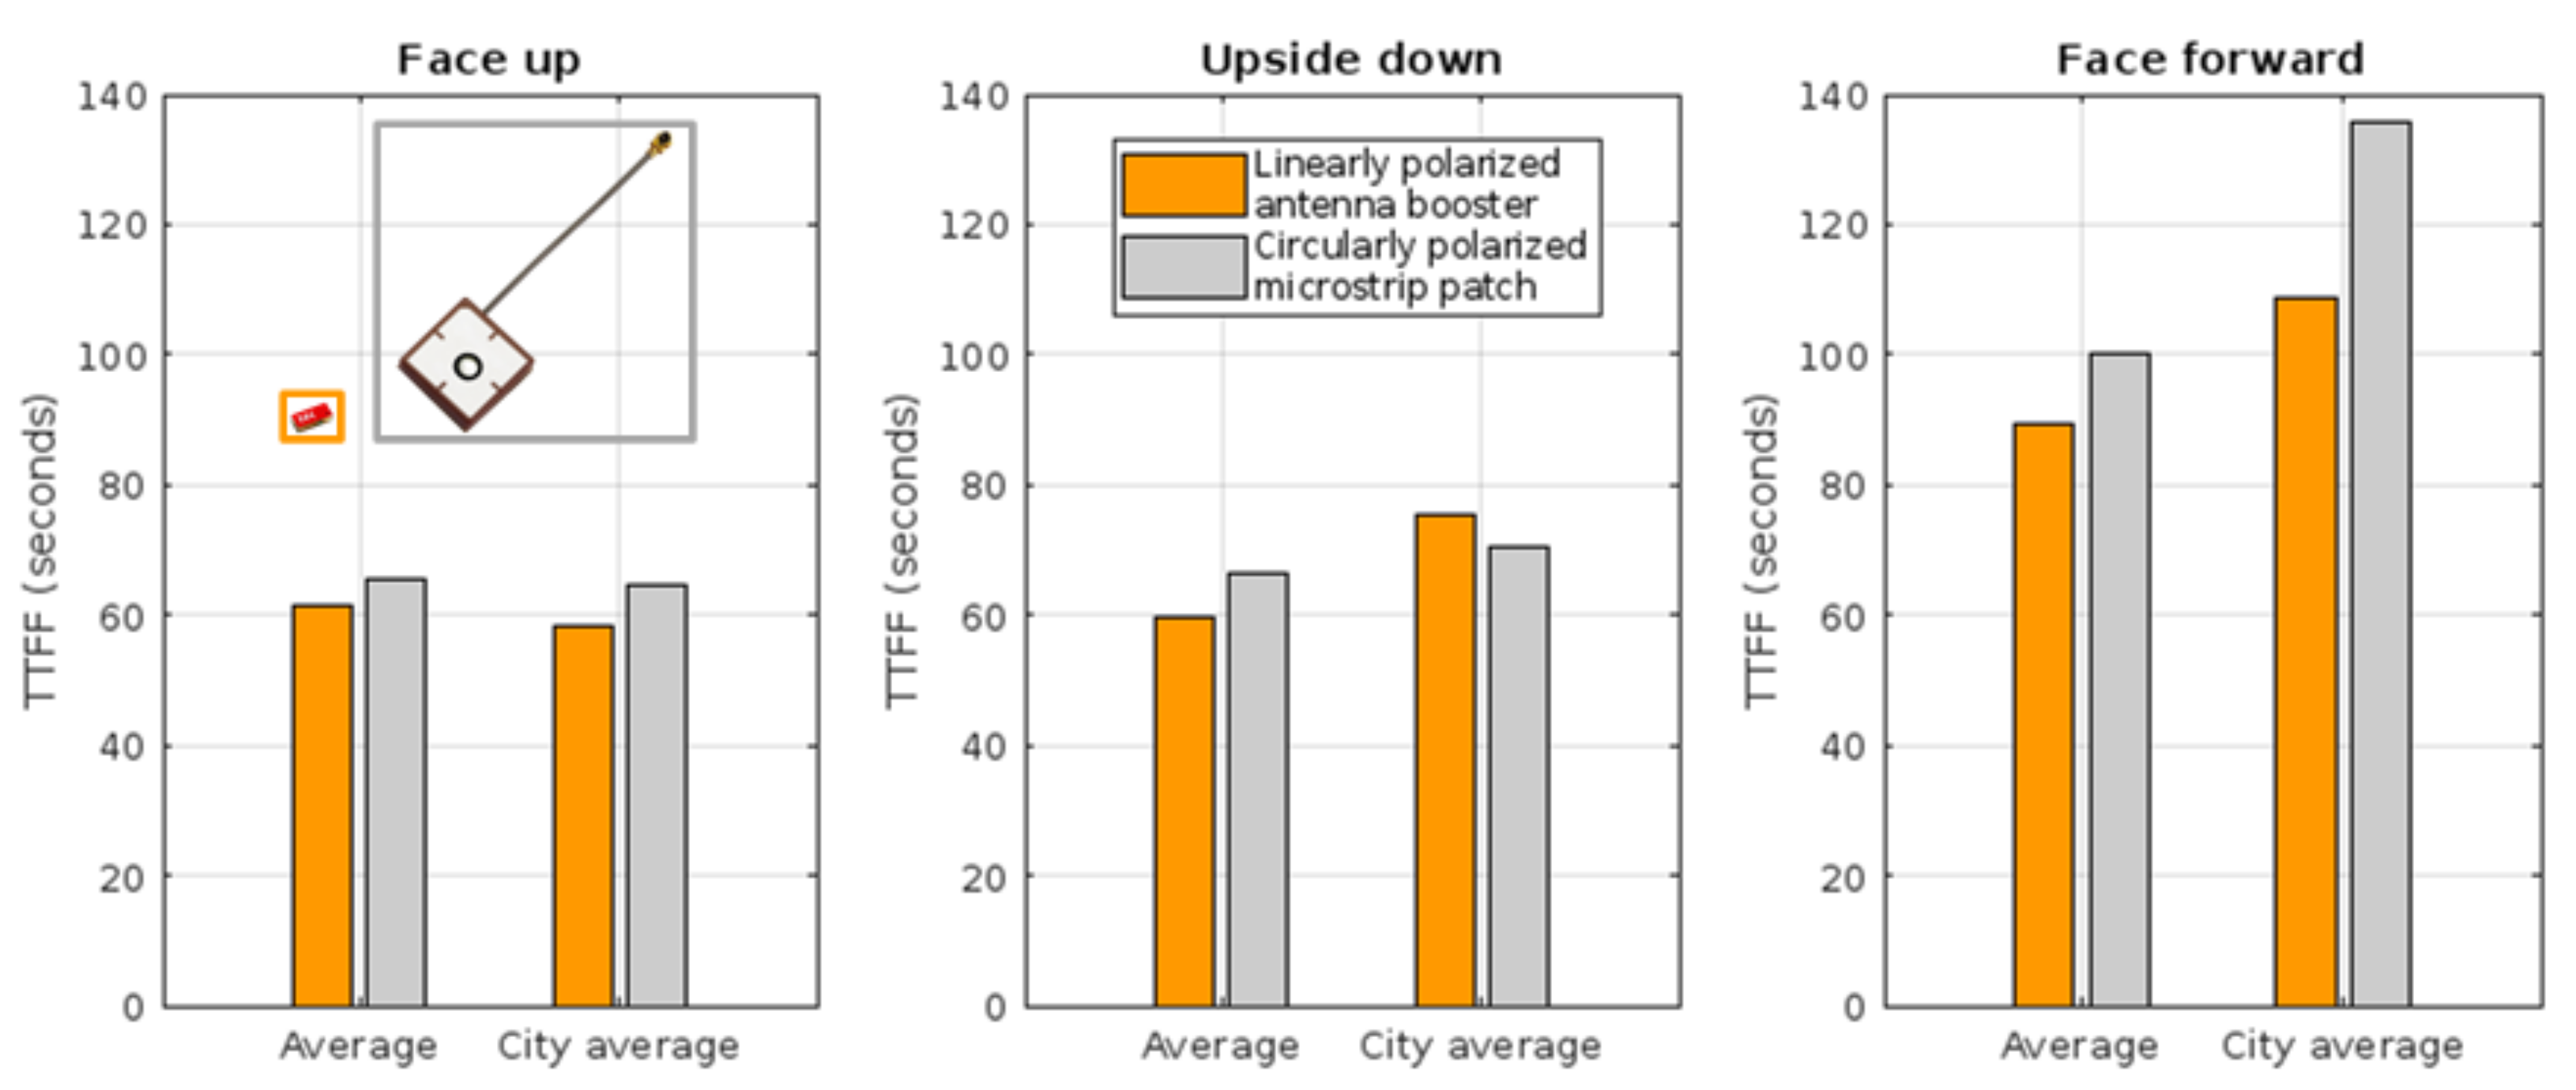
Figure 14 for the over-seat scenario shows that the results obtained by the linearly polarized antenna booster were better (7.8 s less in total average), as the performance was better in five out of the six averages shown. The results of the Face-Up position show that the linearly polarized antenna booster worked better in both scenarios (4.1 and 6.6 s less in the average and city average, respectively). In the case of Upside down orientation, as can be observed, the linearly polarized antenna booster worked better (6.4 s less) on average, however, when we simply considered the city, the results, in this case, favored the circularly polarized microstrip patch (4.7 s less). In the case of Face Forward, there was a difference of 27 s in the city average and 11 s in the overall average, which favored the linearly polarized antenna booster in both circumstances. Therefore, we can conclude that the results were better for the device with the linearly polarized antenna booster.
  • Under the Seat
The data in Figure 15 represent the under-the-seat measurement results. In this scenario, if we focus on the Face-Up position, it can be observed that the linearly polarized antenna booster had a much better performance in both the total average and in the city average, with a difference in TTFF of 38.2 s and 73.7 s, respectively.
On the other hand, for the Upside Down position, the data obtained showed very similar results for both technologies. Another fact is that compared to the device with the circularly polarized patch antenna, results with the antenna booster fluctuated significantly less between positions. Therefore, the performance with the linearly polarized antenna booster was robust to the position of the wireless device.
  • TTFF Warm Star Summary by position
Figure 16 shows the results obtained from the TTFFs performed depending on the position of the devices inside the vehicle. The data collected in each location where the device was installed in each position of the vehicle were averaged.
For this section, the four scores obtained from time-to-fix were better in the linear polarization technology. Obtaining the lowest possible values is crucial in an IoT environment where battery longevity is critical. An IoT device does not obtain the geolocation continuously but receives the position every certain period to optimize the battery as much as possible. Every time a device tries to obtain its position, it must perform a fix, so the less time it takes, the less time the device is active; therefore, it consumes less battery. Therefore, since the linear polarization technology obtains the fix faster, we can say that it can make the device more energy efficient.

4.2.5. TTFF Cold Start

Among the last results obtained during this study was the TTFF, in this case, performed using the cold start startup mode. When a cold start is performed, the information that the receiver may have stored is considered erroneous: current position, visibility of any of the GPS satellites, velocity, and time. As a result, the receiver is required to look for any satellites [3]. After receiving a signal from a satellite, the device can begin calculating the approximate location of the other satellites.
Figure 17 illustrates the results obtained from the TTFFs performed depending on the position of the two devices inside the vehicle. The data obtained in each of the various positions in which the device was arranged in every location of the vehicle were averaged.
As can be seen, for each of the positions, discrimination was made between the average of the city and the total average of all the data obtained. The general result shown in Figure 17 is that, in all positions, the linearly polarized antenna showed better results, both in general and in a city environment. This proves the robustness of the linear polarization technology since it takes less time to perform a fix.

5. Discussion

The size of an antenna used in Internet of Things (IoT) devices is relevant since these devices are commonly compact and low-profile. The antenna booster, in this instance, was up to ~42 times smaller in volume than the microstrip antenna. The difference was ~13.8 times larger than the antenna booster when measured in the area they occupied (Table 3).
In terms of the ideal TTFF measured in the front dashboard position, with the car stopped away from any obstructions such as trees or buildings, we can see in Table 3 that the antenna booster performed 1.1 s faster.
According to the bill of materials, the matching network for the antenna booster technology requires lumped SMD components, an LNA, and an antenna booster. On the other hand, a ceramic patch, LNA, coaxial cable, and receptacles at the microstrip antenna are necessary for the microstrip patch antenna.
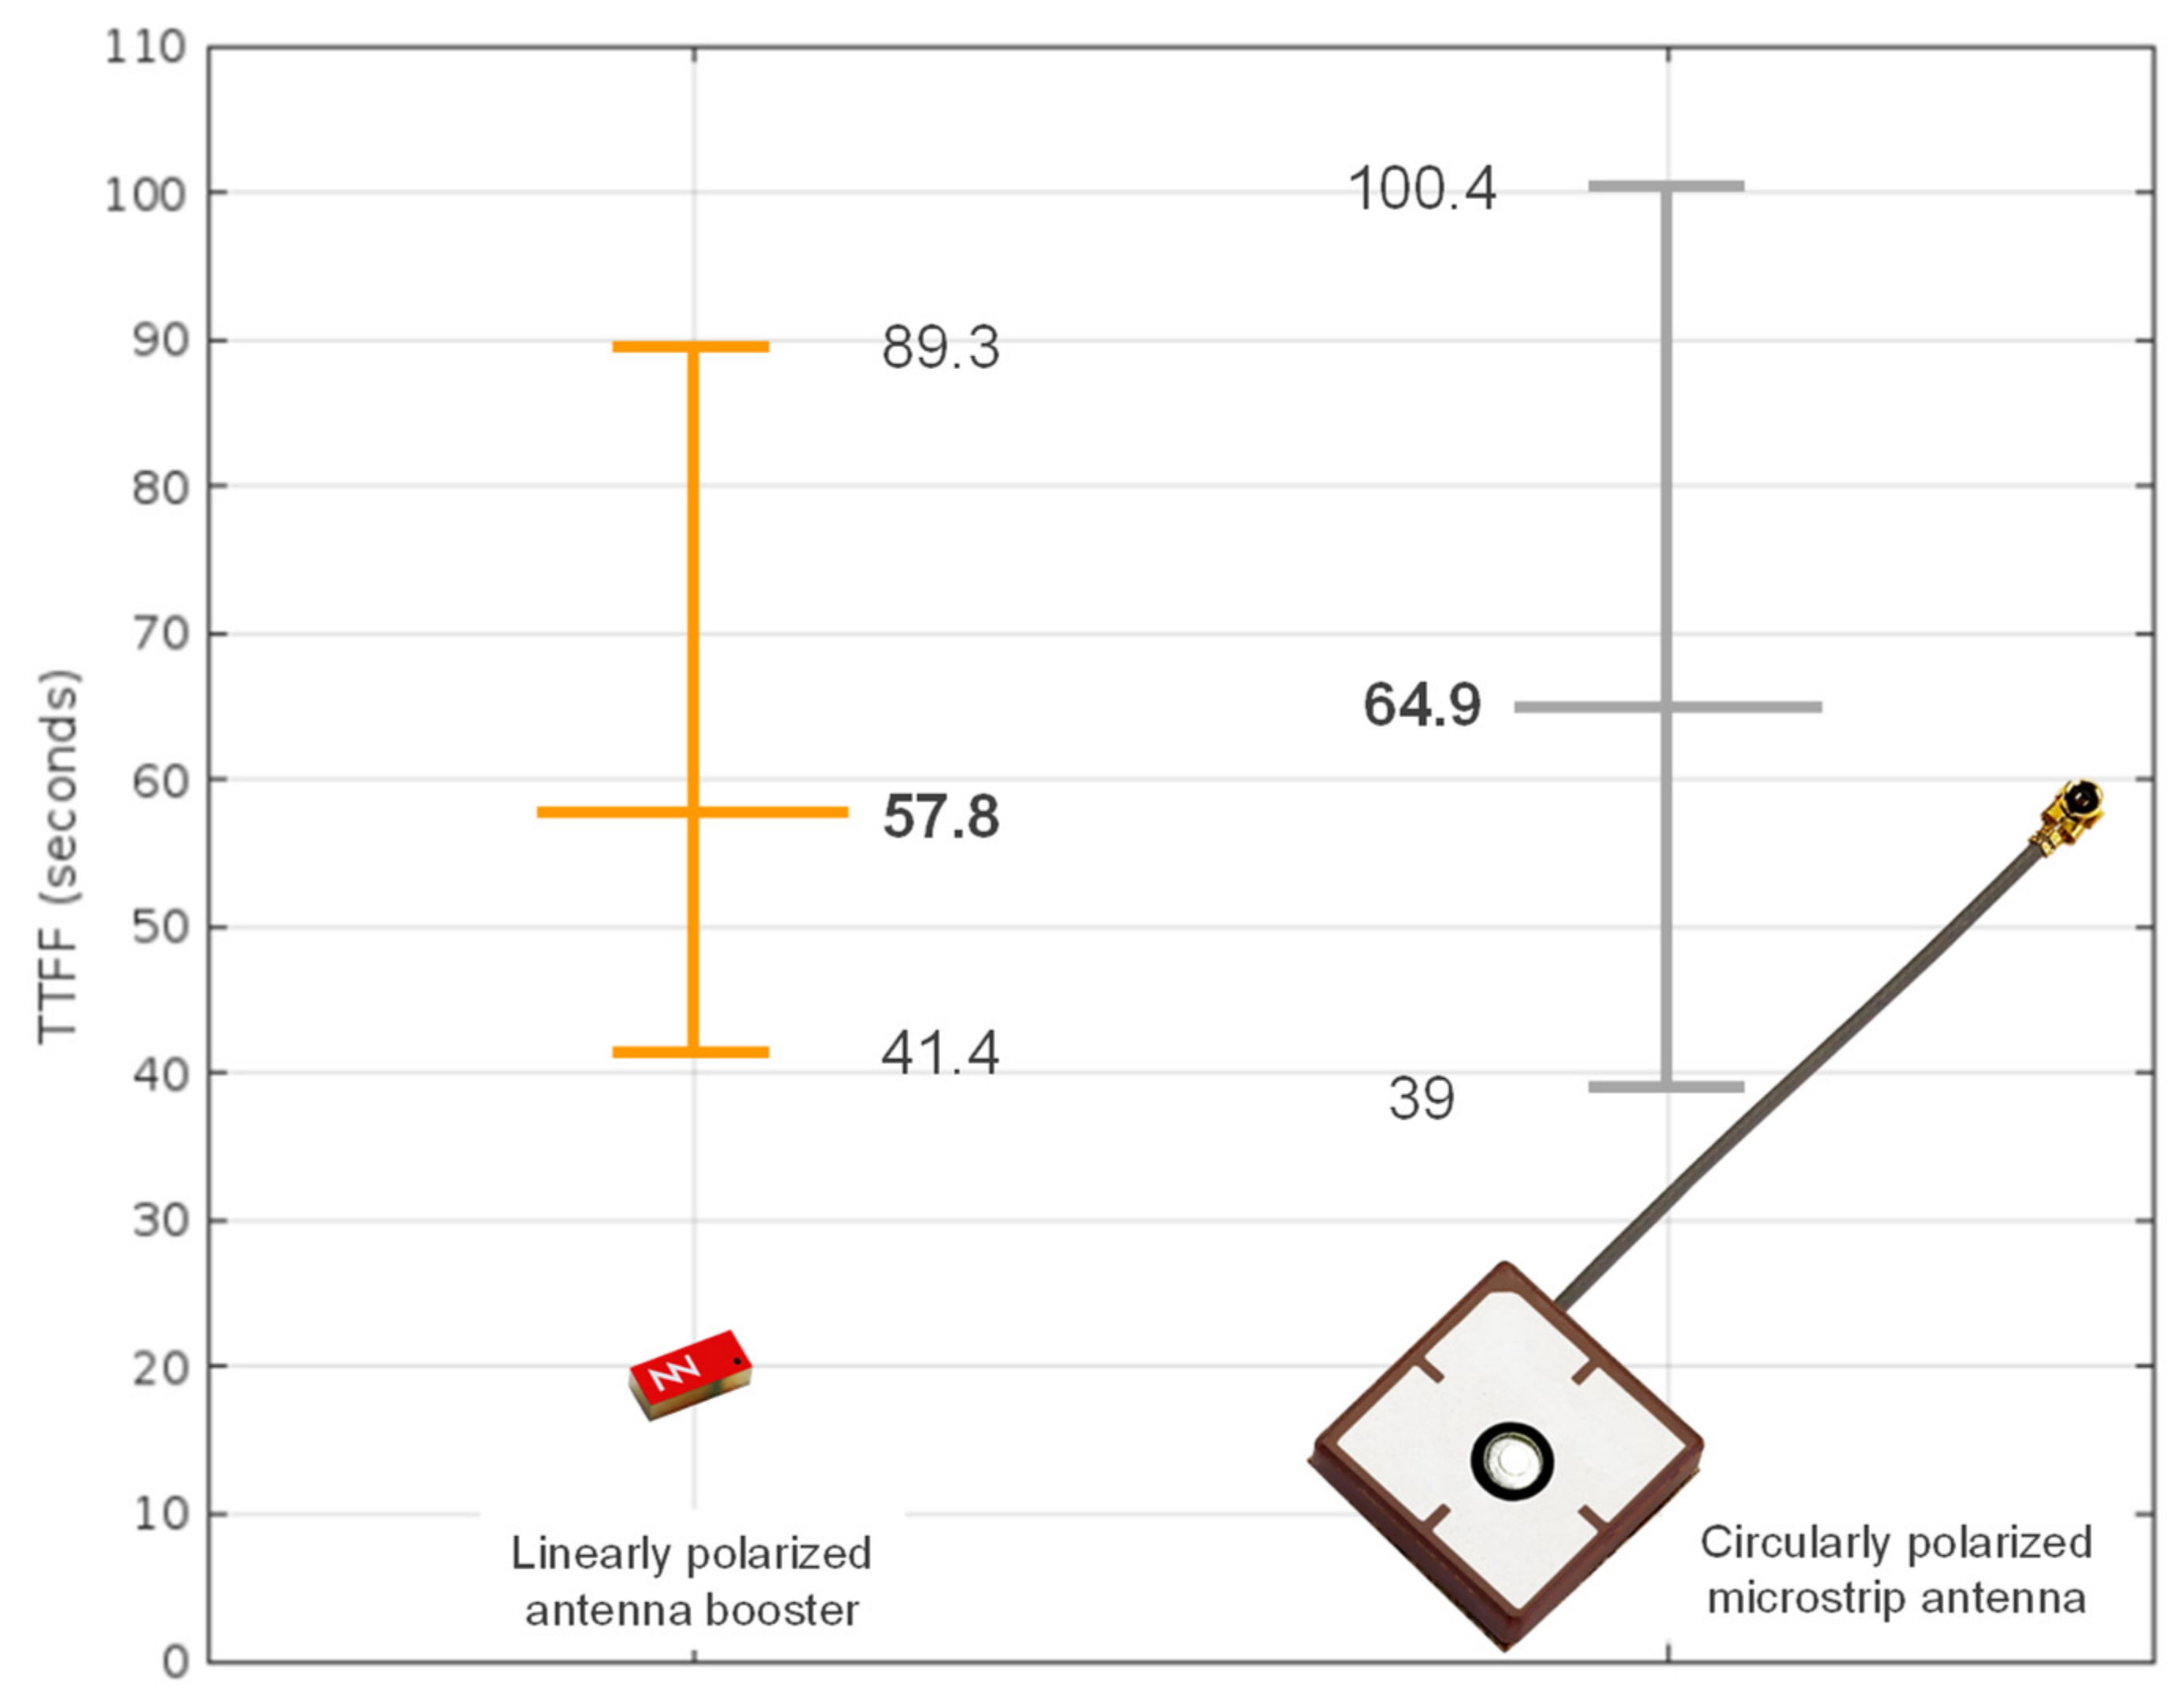
Figure 18 shows a general summary of all the TTFF averages performed with a warm start. This was an average of the eleven results obtained in the different positions and orientations of the devices (Figure 11). The middle line shows the average of all results, the top line shows the maximum, and the bottom line indicates the minimum.
As can be seen, the linearly polarized antenna booster had a more robust behavior since its deviation was lower than that of circularly polarized devices. The device with the circularly polarized patch antenna had a deviation of 61.4 s, whereas those with a linearly polarized antenna booster had a variation of 47.9 s, 13.5 s less.
Figure 18 further reveals that the overall average of all positions and orientations was 57.8 s for devices with linear polarization and 64.9 s for devices with circular polarization. As seen in Section 3.2.1, these locations and orientations resulted in a total of 11 distinct scenarios divided across the car into four locations. This demonstrates that the linearly polarized antenna booster performed the fix 7.1 s faster on average across all scenarios. If we assume a low-power GPS receiver where 50% of power consumption is due to the position fix, this 7.1 s difference results in ~6% more battery life on average for the device embedding linearly polarized antenna boosters.
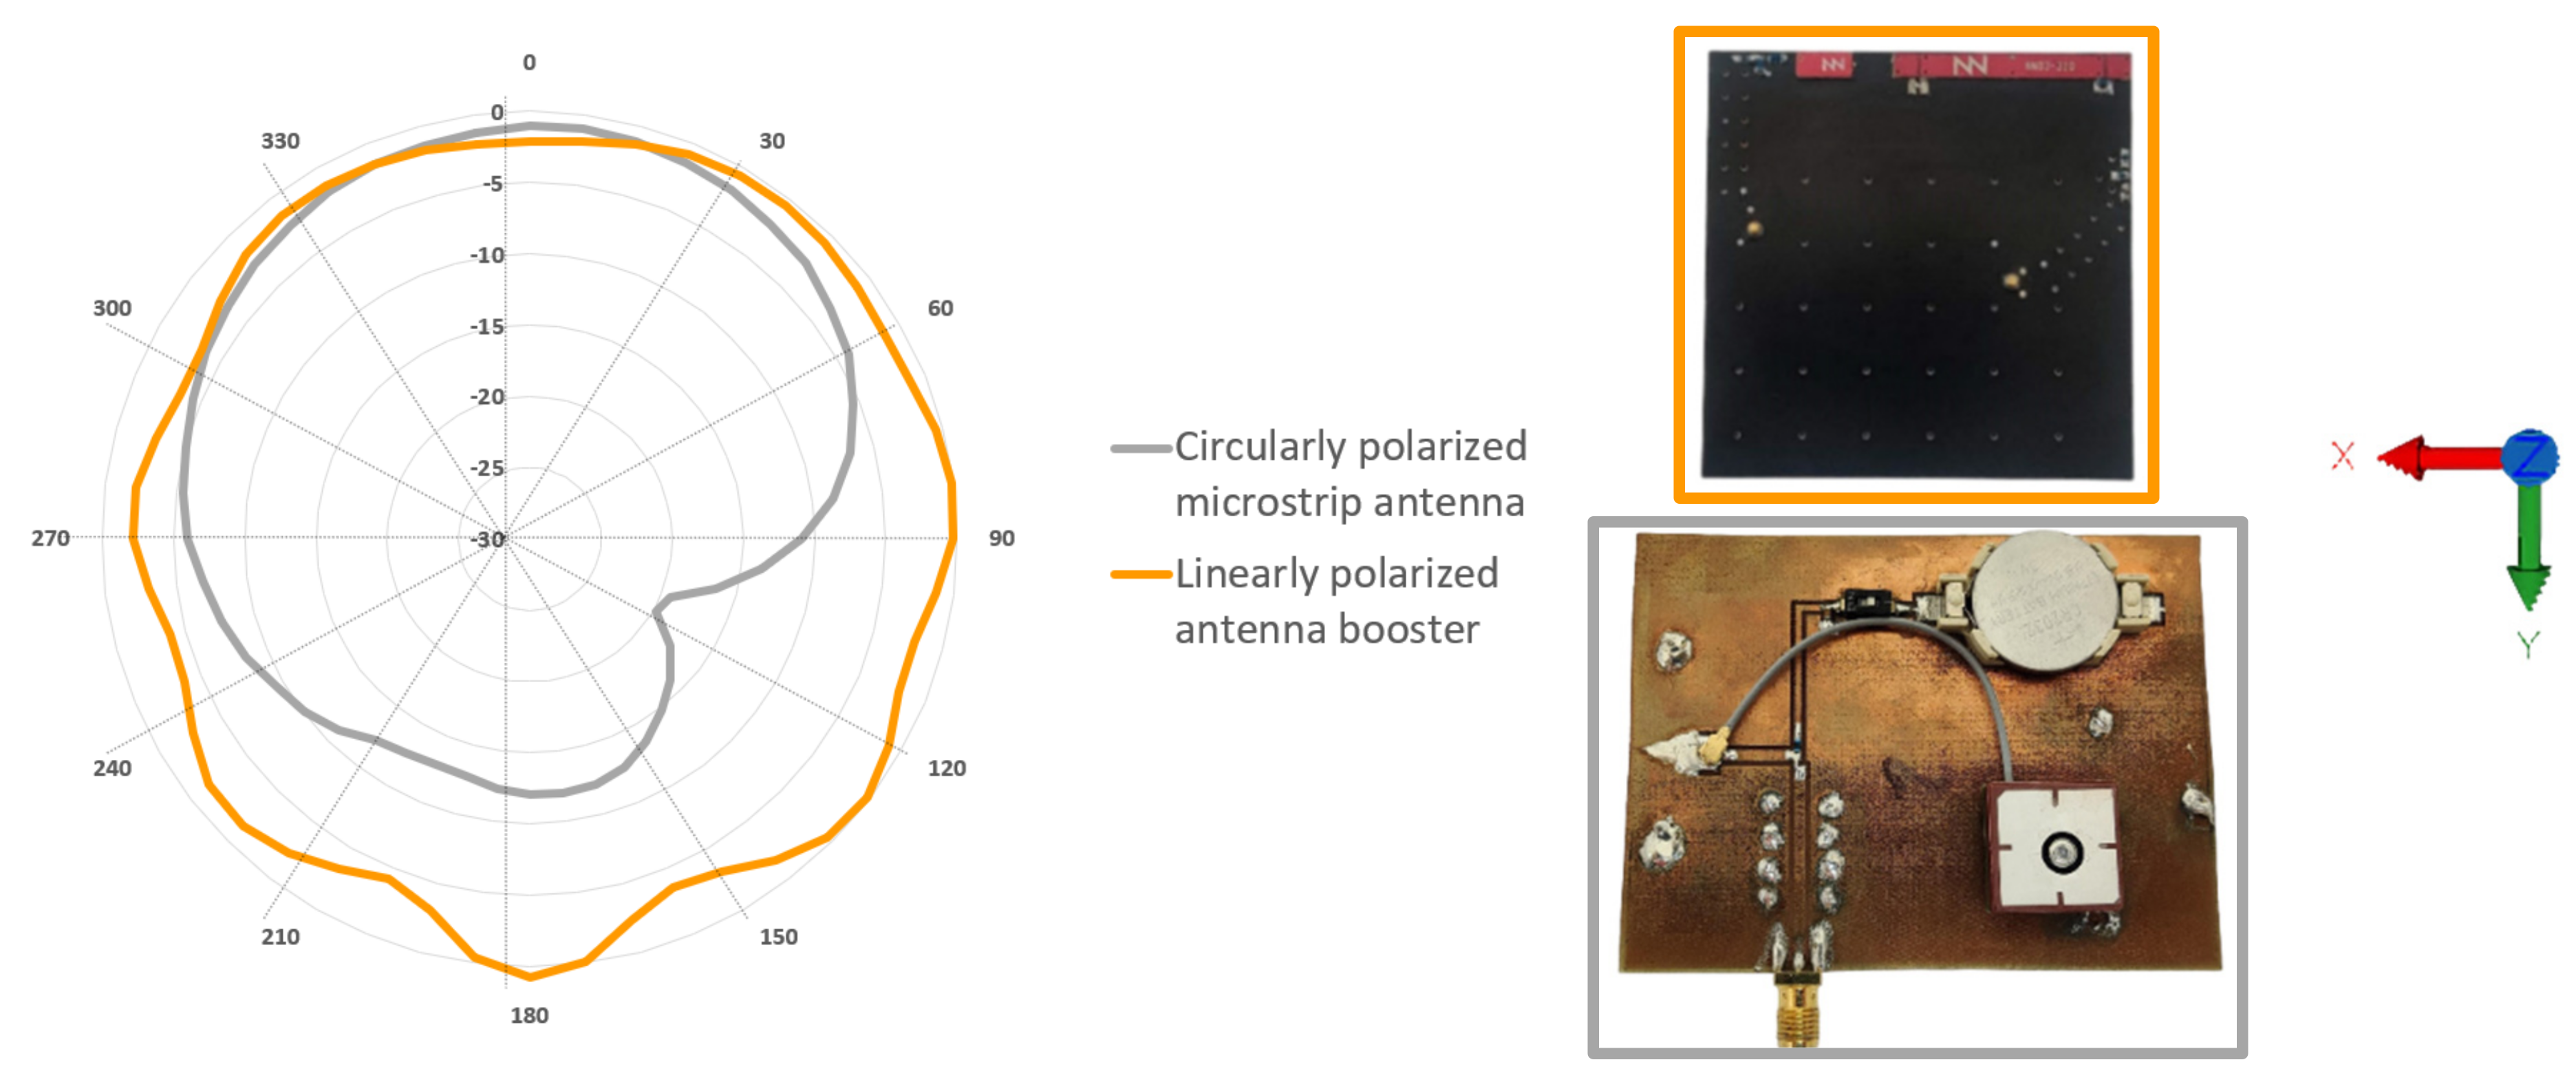
If we examine the other results in Section 4.2, we can observe that the data obtained exhibited a consistent pattern depending on where the devices were placed in the car. A circularly polarized patch antenna performed better than a linearly polarized antenna booster only when the device was mounted on the front dashboard of the car and pointed skyward, which is the best location for this sort of antenna, given the radiation pattern. However, the device behaved better in all the other positions within the car when using the linearly polarized antenna booster. This is partly because of the omnidirectional radiation pattern, which lessens the impact of the antenna orientation (Figure 19). A summary of the results for each position is illustrated in Figure 20.
The radiation pattern in the phi = 90° plane is illustrated in Figure 19, where we observed the differences between the circularly polarized and linearly polarized terminals. The pattern created by the linearly polarized antenna was more omnidirectional than the one created by the circularly polarized antenna, as seen in Figure 19. This is evident from the behavior of both antennas at an angle of 0°, where the circular polarization had a minor advantage. However, at angles other than 0°, we observed that the linear polarization acted more consistently. Regarding the front-to-back ratio or the difference between 0° and 180°, we saw a difference of 2.9 dB for the antenna booster and 11.1 dB for the microstrip patch. It is also important to note that the circular polarization’s difference between its lowest and maximum was 18.7 dB, whereas the linear polarization’s difference was 4.9 dB, which highlights the omnidirectionality of the antenna booster.

6. Conclusions

It has been shown that when the devices had a clear vision of the zenith, both the linear polarized antenna boosters and circularly polarized patch antennas behaved similarly in terms of TFFF.
However, for other positions of the devices in a vehicle and several orientations (up, upside down, vertical pointing to the front and back part of a car), the advantage of a linear polarized antenna booster becomes clear with a reduced TTFF. For example, when placing the tracking device on the seat of a vehicle, after averaging four orientations of the device, the TTFF was 7.3 s better. These differences became even larger in an urban environment. For example, in the same previous case, the TTFF was 15.7 s less for the device with antenna boosters. Some challenging positions, such as the tracking device under the seat for an urban scenario, increased these differences even more to 44.8 s less for the antenna booster case.
Therefore, for unpredictable environments, the theoretical loss of 3 dB due to different polarization than the incoming electromagnetic signal from the satellite is not at all relevant. Other antenna parameters, such as the radiation patterns, become more important. This is the case in the linear polarized antenna booster with quasi-isotropic radiation patterns that allow the device to be robust to reception to any orientation of the device. However, for a circularly polarized patch antenna, the reception is reduced when the device is not located in the ideal position, pointing to the sky and with buildings modifying the polarization. This situation can be extrapolated to other situations rather than vehicles. For example, when the IoT device is on a vertical wall of a container and thus, the patch antenna is not pointing to the sky, but to the horizon where received, the signals are weaker.
To sum up, for typical random positions and orientations of tracking devices, linear polarized antenna boosters ensure a better TTFF. Not only does less TTFF imply more battery life, but it also reduces the impact of CO2 due to the longer battery duration.

Author Contributions

J.G. (Jaime Gui) contributed to writing the original draft, formal analysis, and investigation. J.L.L. contributed to the investigation. A.A. contributed to the conceptualization and investigation. J.G. (Jaap Groot) contributed to the conceptualization. J.L.P. contributed to writing review. J.A. contributed to the investigation, writing review, conceptualization, and supervision. All authors have read and agreed to the published version of the manuscript.

Funding

Part of this research was funded by CDTI (Centro para el Desarrollo Tecnológico Industrial) Spain, Project IDI-20190285.

Conflicts of Interest

The authors declare no conflict of interest.

References

  1. Anguera, J.; Andújar, A.; Mestre, G.; Rahola, J.; Juntunen, J. Design of Multiband Antenna Systems for Wireless Devices Using Antenna Boosters. IEEE Microw. Mag. 2019, 20, 102–114. [Google Scholar] [CrossRef]
  2. Anguera, J.; Picher, C.; Bujalance, A.; Andújar, A. Ground plane booster antenna technology for smartphones and tablets. Microw. Opt. Technol. Lett. 2016, 58, 1289–1294. [Google Scholar] [CrossRef]
  3. GMV. TTFF. TTFF-Navipedia. 2012. Available online: https://gssc.esa.int/navipedia/index.php/TTFF (accessed on 2 September 2022).
  4. Pathak, V.; Thornwall, S.; Krier, M.; Rowson, S.; Poilasne, G.; Desclos, L. Mobile handset system performance comparison of a linearly polarized GPS internal antenna with a circularly polarized antenna. In Proceedings of the IEEE Antennas and Propagation Society International Symposium. Digest. Held in conjunction with: USNC/CNC/URSI North American Radio Sci. Meeting (Cat. No.03CH37450), Columbus, OH, USA, 22–27 June 2003; Volume 3, pp. 666–669. [Google Scholar] [CrossRef]
  5. Dai, Y.; Talty, T.; Lanctot, L. GPS antenna selection and placement for optimum automotive performance. In Proceedings of the IEEE Antennas and Propagation Society International Symposium. 2001 Digest. Held in conjunction with: USNC/URSI National Radio Science Meeting (Cat. No.01CH37229), Boston, MA, USA, 3–13 July 2001; Volume 1, pp. 132–135. [Google Scholar] [CrossRef]
  6. Yegin, K. On-Vehicle GPS Antenna Measurements. IEEE Antennas Wirel. Propag. Lett. 2007, 6, 488–491. [Google Scholar] [CrossRef]
  7. Serra, A.A.; Nepa, P.; Manara, G.; Massini, R. A Low-Profile Linearly Polarized 3D PIFA for Handheld GPS Terminals. IEEE Trans. Antennas Propag. 2010, 58, 1060–1066. [Google Scholar] [CrossRef]
  8. Specht, C.; Mania, M.; Skóra, M.; Specht, M. Accuracy Of The GPS Positioning System In The Context Of Increasing The Number Of Satellites In The Constellation. Pol. Marit. Res. 2015, 22, 9–14. [Google Scholar] [CrossRef] [Green Version]
  9. Matsunaga, M.; Suzuki, M. An electrically small three-band multi-polarization cross spiral antenna. In Proceedings of the 2015 9th European Conference on Antennas and Propagation (EuCAP), Lisbon, Portugal, 13–17 April 2015; pp. 1–2. [Google Scholar]
  10. Goncharova, I.; Lindenmeier, S. A compact satellite antenna module for GPS, Galileo, GLONASS, BeiDou and SDARS in automotive application. In Proceedings of the 2017 11th European Conference on Antennas and Propagation (EUCAP), Paris, France, 19–24 March 2017; pp. 3639–3643. [Google Scholar] [CrossRef]
  11. Boccia, L.; Amendola, G.; Di Massa, G. A shorted elliptical patch antenna for GPS applications. IEEE Antennas Wirel. Propag. Lett. 2003, 2, 6–8. [Google Scholar] [CrossRef]
  12. Liang, Z.; Li, Y.; Long, Y. Multiband Monopole Mobile Phone Antenna with Circular Polarization for GNSS Application. IEEE Trans. Antennas Propag. 2014, 62, 1910–1917. [Google Scholar] [CrossRef]
  13. Ferrero, F. Antenna Design for Miniature LR1110 Trackers: Challenges and First Experiment. Available online: https://www.youtube.com/watch?v=hQCg_5JLSM8&t=269s (accessed on 28 September 2022).
  14. Lai, Z.; Yuan, J. Design of single-layer single-feed patch antenna for GPS and WLAN applications. In Proceedings of the International Symposium on Antennas & Propagation, Lake Buena Vista, FL, USA, 7–13 July 2013; pp. 737–739. [Google Scholar]
  15. Ma, S.-L.; Row, J.-S. Design of Single-Feed Dual-Frequency Patch Antenna for GPS and WLAN Applications. IEEE Trans. Antennas Propag. 2011, 59, 3433–3436. [Google Scholar] [CrossRef]
  16. Diggikar, A.; Chinchpure, P.; Ingale, C.; Jog, S. Design and Development of Microstrip Patch Antenna for GPS Applications. In Proceedings of the 2018 Fourth International Conference on Computing Communication Control and Automation (ICCUBEA), Pune, India, 16–18 August 2018; pp. 1–4. [Google Scholar] [CrossRef]
  17. Rao, K.S.; Jahagirdar, D.R.; Ramakrishna, D. Compact broadband asymmetric slit Circularly Polarized Microstrip Patch Antenna for GPS and GLONASS applications. In Proceedings of the 2017 IEEE International Conference on Antenna Innovations & Modern Technologies for Ground, Aircraft and Satellite Applications (iAIM), Bangalore, India, 24–26 November 2017; pp. 1–3. [Google Scholar] [CrossRef]
  18. Adhikary, P.; Ray, S.; Chatterjee, S.; Ghosh, S.; Chattopadhyay, S.; Banerjee, S.; Dhar, A.K.; Das, A. Design and development of wearable patch antenna for GPS applications. In Proceedings of the 2019 IEEE International Electromagnetics and Antenna Conference (IEMANTENNA), Vancouver, BC, Canada, 14–17 October 2019; pp. 68–71. [Google Scholar] [CrossRef]
  19. So, K.K.; Wong, H.; Luk, K.M.; Chan, C.H. Miniaturized Circularly Polarized Patch Antenna With Low Back Radiation for GPS Satellite Communications. IEEE Trans. Antennas Propag. 2015, 63, 5934–5938. [Google Scholar] [CrossRef]
  20. Sun, C.; Zheng, H.; Liu, Y. Analysis and Design of a Low-Cost Dual-Band Compact Circularly Polarized Antenna for GPS Application. IEEE Trans. Antennas Propag. 2015, 64, 365–370. [Google Scholar] [CrossRef]
  21. Anguera, J.; Andújar, A.; Puente, C. Compact Antenna Technology for Wireless Communications. WO 2020120589A1, 2022. not granted yet. [Google Scholar]
  22. Isik, O.; Hong, J.; Petrunin, I.; Tsourdos, A. Integrity Analysis for GPS-Based Navigation of UAVs in Urban Environment. Robotics 2020, 9, 66. [Google Scholar] [CrossRef]
Figure 1. A 53 × 53 mm2 PCB with a linearly polarized GPS antenna booster. A ground plane was printed over the FR4 substrate (1 mm thick, εr = 4.15, tanδ = 0.017). The chip antenna booster component on the right operated at 698–960 MHz and 1710–2170 MHz. The GPS antenna booster was 7 × 3 × 2 mm3. [S] represents the S11 for each antenna booster without a matching network.
Energies 15 09623 g001
Figure 2. An 80 × 60 mm2 PCB with a circularly polarized microstrip patch antenna was employed for the study. The battery was used to feed the embedded LNA under the patch antenna.
Energies 15 09623 g002
Figure 3. Different positions and orientations in which the devices were arranged inside the vehicle. For (g,h), the seat covered the device. For illustrative purposes, the seat was moved to the back to show both devices. (a) Front Dashboard–Face Up; (b) Front Dashboard–Upside down; (c) Front Dashboard–Face forward; (d) Front Dashboard–Face backward; (e) Rear Dashboard; (f) Rear Dashboard–Upside down; (g) Under the seat; (h) Under the seat–Upside down; (i) Over the seat; (j) Over the seat–Face forward; (k) Over the seat–Upside down.
Energies 15 09623 g003
Figure 4. The route followed by the car. First, the highway, which was 24.4 km long (red), followed by the city (Barcelona), which was 9 km long (blue), and the forest, which was 16.7 km long (yellow) to finish.
Energies 15 09623 g004
Figure 5. Cno results were obtained in a static position inside a building with large windows. The position of this device has been moved toward the interior of the building.
Energies 15 09623 g005
Figure 6. Average of the satellites used by each device in a static position inside a building with large windows. The position of this device was moved toward the interior of the building.
Energies 15 09623 g006
Figure 7. Average dilution of precision or DOP for each device in a static position inside a building with large windows. The position of this device was moved toward the interior of the building. The lower the DOP, the better.
Energies 15 09623 g007
Figure 8. TTFF results were obtained in the front dashboard location of a car, with the vehicle parked in a place with open space.
Energies 15 09623 g008
Figure 9. Result of the signal-to-noise ratio obtained at different locations of the car on a route, including highway, city, and forest, following the path in Figure 4.
Energies 15 09623 g009
Figure 10. Results of the average of satellites used in different positions of the car on a route including highway, city, and forest following the path in Figure 4.
Energies 15 09623 g010
Figure 11. Average dilution of precision (DOP) results for the different positions of the car on a route including highway, city, and forest following the path of Figure 4. For DOP, the lower the value, the better.
Energies 15 09623 g011
Figure 12. TTFF results of all device orientations placed on the front dashboard of the vehicle when moving following the path in Figure 4. For TTFF, the lower the value, the better.
Energies 15 09623 g012
Figure 13. TTFF results of all device orientations placed on the rear dashboard of the vehicle when moving following the path in Figure 4. For TTFF, the lower the value, the better.
Energies 15 09623 g013
Figure 14. TTFF results of all device orientations placed over the front seat of the vehicle when moving following the path in Figure 4. For TTFF, the lower the value, the better.
Energies 15 09623 g014
Figure 15. TTFF results of all of the device orientations placed under the front seat of the vehicle when moving following the path of Figure 4. For TTFF, the lower the value, the better.
Energies 15 09623 g015
Figure 16. Summary of all the results of TTFF measured with the warm start method when moving following the path in Figure 4. For TTFF, the lower the value, the better.
Energies 15 09623 g016
Figure 17. Summary of all the results of TTFF measured with the cold start method when moving following the path in Figure 4. For TTFF, the lower the value, the better.
Energies 15 09623 g017
Figure 18. A summary of all the TTFF averages performed with a warm start. Schemes of the microstrip patch antenna and antenna booster have the same scale.
Energies 15 09623 g018
Figure 19. Measured radiations pattern from both devices in the plane phi = 90° (YZ plane). The microstrip patch antenna, the antenna booster, and the PCBs have the same scale.
Energies 15 09623 g019
Figure 20. Average TTFF in seconds for the different positions for the circularly polarized microstrip antenna and the linearly polarized antenna booster. These results were placed on a schematic design of an automobile representing the position of the device. As shown in Figure 3, for each position, the results were averaged considering the different orientations. (a) Rear dashboard (left) and Front dashboard (right), (b) Over the seat (top) and Under the seat (bottom).
Energies 15 09623 g020
Table 1. Linearly polarized antenna and circularly polarized antenna specifications.
ParameterAntenna BoosterMicrostrip Antenna
Frequency1575 MHz1575.42 ± 1.023 MHz
Dimensions7.0 × 3.0 × 2.0 mm317.0 × 17.0 × 4.0 mm3 1
Peak Gain−2.1 dBi Typ. @ Zenit−1.0 dBi Typ. @ Zenit
PolarizationLinearRHCP
Radiation patternOmnidirectionalNE
Impedance50 Ω50 Ω
1 Only the ceramic patch was included in this measurement; the patch size was 17.0 × 17.0 × 6.1 mm3.
Table 2. LNA (low noise amplifier) is used in both devices.
ParameterAntenna BoosterMicrostrip Antenna
Frequency1575.42 MHz1575.42 MHz
Gain16.5 dB 116 dB 1
Noise figure1.03 dB2.5 dB
1 Two RF transitions used for the antenna booster setup had insertion losses of 0.15 dB. This justifies the 0.5 dB extra gain in the LNA.
Table 3. Comparison of the microstrip patch antenna with antenna booster technology. Schemes of the microstrip patch antenna and antenna booster have the same scale.
Circular Pol.: Microstrip Patch AntennaLinear Pol.: Antenna Booster
Energies 15 09623 i001Energies 15 09623 i002
Volume of the antenna part17.0 × 17.0 × 6.1 mm37.0 × 3.0 × 2.0 mm3
Automatic pick and placeNoYes
TTFF average in a static ideal position29 s27.9 s
TTFF total average64.9 s57.8 s
Omnidirectional radiation patternNoYes
BoMCeramic patch, LNA, coaxial line, and receptacles at the microstrip antenna and PCBAntenna booster, LNA, and a matching network are all placed on the PCB
Publisher’s Note: MDPI stays neutral with regard to jurisdictional claims in published maps and institutional affiliations.