
Impact of Renewable Energy Sources and Nuclear Energy on CO2 Emissions Reductions—The Case of the EU Countries


Abstract
1. Introduction
2. Literature Review
3. Materials and Methods
3.1. Data Sources and Description of Variables
- Carbon dioxide (CO2) emissions per capita (tons)—CO2;
- Gross domestic product (GDP) per capita (thousands USD)—GDP;
- Total energy consumption per capita (MWh)—TEC;
- Energy produced from renewable sources per capita (MWh)—RES;
- Energy produced in nuclear power plants per capita (MWh)—Nuclear.
3.2. Descriptive Statistics
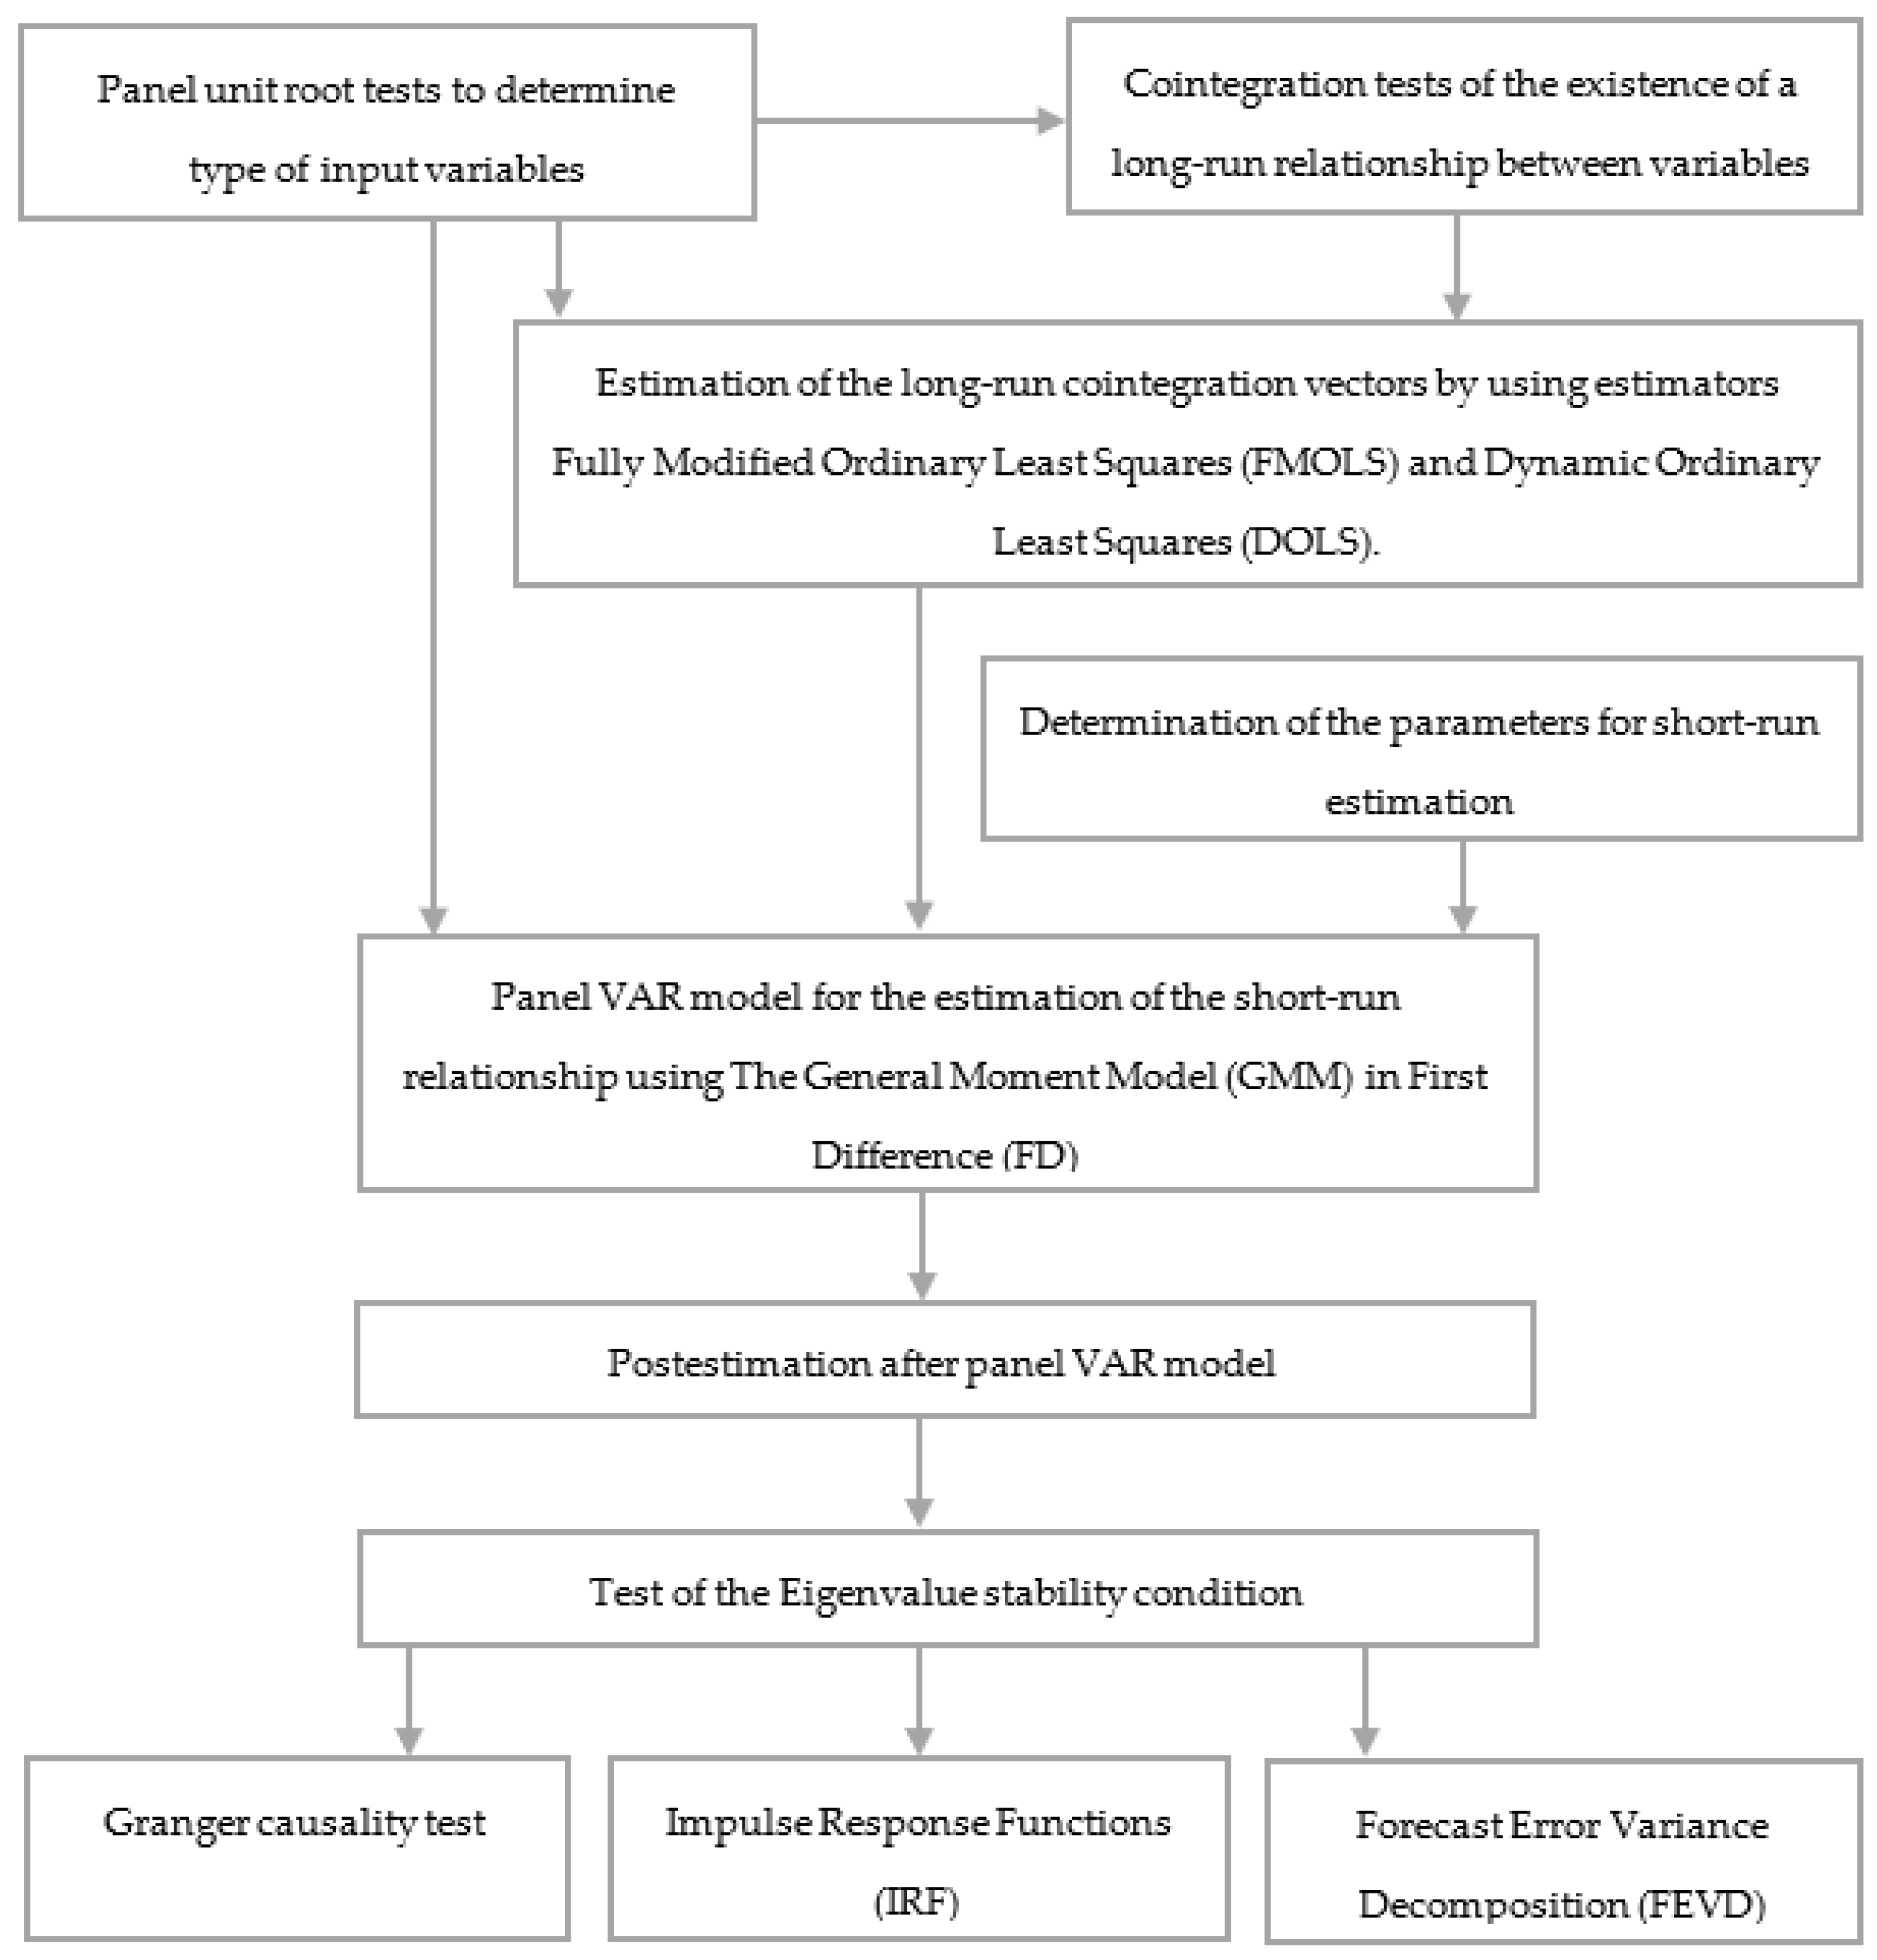
3.3. Empirical Methodology
4. Results and Discussion
4.1. Panel Unit Root Tests
- Fisher (augmented Dickey–Fuller test)—Time trend, Lagged difference 1;
- Fisher (Phillips–Perron unit root test)—Time trend, Lagged difference 1;
- Im–Pesaran–Shin [55]—Time trend, Lagged specification 1;
- Levin–Lin–Chu [54]—Time trend, Lagged specification 1;
- Breitung [52]—Time trend, Lagged difference 1;
- Hadri [57]—Time trend;
- Second-generation unit root test, CIPS and CIPS* test [49]—Time trend.
4.2. Panel Cointegration Test
- KAO test—Lags(1);
- Pedroni test—AR parameter is panel-specific, includes panel-specific time trend, Lags(1);
- Westerlund tests—include panel-specific time trend; the Bartlett kernel with Newey–West lags [82] was used to estimate long-run variance.
4.3. Long-Run Dynamics Estimation
4.4. Short-Run Dynamics Estimation
4.5. Panel VAR Estimation Results and Granger Causality
5. Discussion
6. Conclusions
Author Contributions
Funding
Institutional Review Board Statement
Informed Consent Statement
Data Availability Statement
Acknowledgments
Conflicts of Interest
Nomenclature
| ADF | Fisher augmented Dickey–Fuller test |
| AIC | Akaike information criteria |
| BIC | Bayesian information criteria |
| BRIC | Brazil, Russia, India and China |
| CIPS | cross-sectionally augmented Im–Pesaran–Shin test |
| CO2 | carbon dioxide |
| DOLS | dynamic ordinary least squares |
| EKC | environmental Kuznets curve |
| EU | European Union |
| FD | first differenced |
| FEVD | forecast error variance decomposition |
| FMOLS | fully modified ordinary least squares model |
| GDP | gross domestic product |
| GMM | general moments methods |
| HQIC | Hannan–Quinn information criteria |
| IPCC | Intergovernmental Panel on Climate Change |
| IPS | Im–Pesaran–Shin test |
| IRF | impulse response function |
| LLC | Levin–Lin–Chu test |
| MENA | Middle East and North Africa |
| MMSC | moment and model selection criteria |
| MWh | megawatt hours |
| OECD | Organisation for Economic Co-operation and Development |
| PP | Fisher Phillips–Perron test |
| PVAR | panel vector autoregression |
| RES | renewable energy sources |
| TEC | total energy consumption |
| USD | United States dollar |
| VAR | vector autoregression |
References
- Vavrek, R.; Chovancová, J. Energy performance of the European Union Countries in terms of reaching the European energy union objectives. Energies 2020, 13, 5317. [Google Scholar] [CrossRef]
- IPCC. Climate Change 2022: Impacts, Adaptation and Vulnerability. 2022. Available online: https://www.ipcc.ch/report/ar6/wg2/ (accessed on 10 November 2022).
- Lu, Y.; Yuan, J.; Lu, X.; Su, C.; Zhang, Y.; Wang, C.; Sweijd, N. Major threats of pollution and climate change to global coastal ecosystems and enhanced management for sustainability. Environ. Pollut. 2018, 239, 670–680. [Google Scholar] [CrossRef]
- Malhi, Y.; Franklin, J.; Seddon, N.; Solan, M.; Turner, M.G.; Field, C.B.; Knowlton, N. Climate change and ecosystems: Threats, opportunities and solutions. Philos. Trans. R. Soc. B 2020, 375, 20190104. [Google Scholar] [CrossRef]
- Schwarte, C. EU climate policy under the Paris Agreement. Clim. Law 2021, 11, 157–175. [Google Scholar] [CrossRef]
- EEA. EU Greenhouse Gas Emissions Kept Decreasing in 2018, Largest Reductions in Energy Sector. Available online: https://www.eea.europa.eu/highlights/eu-greenhouse-gas-emissions-kept (accessed on 3 October 2022).
- EC. Proposal for a Directive of the European Parliament and of the Council on Energy Efficiency (Recast); COM/2021/558 Final; European Comission: Brussels, Belgium, 2021. [Google Scholar]
- EC. Proposal for a Directive of the European Parliament and of the Council Amending Directive (EU) 2018/2001 of the European Parliament and of the Council, Regulation (EU) 2018/1999 of the European Parliament and of the Council and Directive 98/70/EC of the E; European Comission: Brussels, Belgium, 2021. [Google Scholar]
- Brook, B.W.; Alonso, A.; Meneley, D.A.; Misak, J.; Blees, T.; van Erp, J.B. Why nuclear energy is sustainable and has to be part of the energy mix. Sustain. Mater. Technol. 2014, 1–2, 8–16. [Google Scholar] [CrossRef]
- Buongiorno, J.; Corradini, M.; Parsons, J.; Petti, D. Nuclear energy in a carbon-constrained world: Big challenges and big opportunities. IEEE Power Energy Mag. 2019, 17, 69–77. [Google Scholar] [CrossRef]
- Pearce, J.M. Limitations of Nuclear Power as a Sustainable Energy Source. Sustainability 2012, 4, 1173–1187. [Google Scholar] [CrossRef]
- Poinssot, C.; Bourg, S.; Ouvrier, N.; Combernoux, N.; Rostaing, C.; Vargas-Gonzalez, M.; Bruno, J. Assessment of the environmental footprint of nuclear energy systems. Comparison between closed and open fuel cycles. Energy 2014, 69, 199–211. [Google Scholar] [CrossRef]
- Yano, K.H.; Mao, K.S.; Wharry, J.P.; Porterfield, D.M. Investing in a permanent and sustainable nuclear waste disposal solution. Prog. Nucl. Energy 2018, 108, 474–479. [Google Scholar] [CrossRef]
- Toth, F.L.; Rogner, H.H. Oil and nuclear power: Past, present, and future. Energy Econ. 2006, 28, 1–25. [Google Scholar] [CrossRef]
- Antonakakis, N.; Chatziantoniou, I.; Filis, G. Energy consumption, CO2 emissions, and economic growth: An ethical dilemma. Renew. Sustain. Energy Rev. 2017, 68, 808–824. [Google Scholar] [CrossRef]
- Han, J.; Du, T.; Zhang, C.; Qian, X. Correlation analysis of CO2 emissions, material stocks and economic growth nexus: Evidence from Chinese provinces. J. Clean. Prod. 2018, 180, 395–406. [Google Scholar] [CrossRef]
- Litavcová, E.; Chovancová, J. Economic development, CO2 emissions and energy use nexus-evidence from the danube region countries. Energies 2021, 14, 3165. [Google Scholar] [CrossRef]
- Petruška, I.; Chovancová, J.; Litavcová, E. Dependence of CO2 emissions on energy consumption and economic growth in the European Union: A panel threshold model. Ekon. I Środowisko. 2021, 3, 73–89. [Google Scholar] [CrossRef]
- Sarkodie, S.A.; Strezov, V. Empirical study of the Environmental Kuznets curve and Environmental Sustainability curve hypothesis for Australia, China, Ghana and USA. J. Clean. Prod. 2018, 201, 98–110. [Google Scholar] [CrossRef]
- Ang, J.B. CO2 emissions, energy consumption, and output in France. Energy Policy 2007, 35, 4772–4778. [Google Scholar] [CrossRef]
- Zhang, X.P.; Cheng, X.M. Energy consumption, carbon emissions, and economic growth in China. Ecol. Econ. 2009, 68, 2706–2712. [Google Scholar] [CrossRef]
- Zhang, H. Exploring the impact of environmental regulation on economic growth, energy use, and CO2 emissions nexus in China. Nat. Hazards 2016, 84, 213–231. [Google Scholar] [CrossRef]
- Kongkuah, M.; Yao, H.; Yilanci, V. The relationship between energy consumption, economic growth, and CO2 emissions in China: The role of urbanisation and international trade. Environ. Dev. Sustain. 2022, 24, 4684–4708. [Google Scholar] [CrossRef]
- Farhani, S.; Shahbaz, M. What role of renewable and non-renewable electricity consumption and output is needed to initially mitigate CO2 emissions in MENA region? Renew. Sustain. Energy Rev. 2014, 40, 80–90. [Google Scholar] [CrossRef]
- Gorus, M.S.; Aydin, M. The relationship between energy consumption, economic growth, and CO2 emission in MENA countries: Causality analysis in the frequency domain. Energy 2019, 168, 815–822. [Google Scholar] [CrossRef]
- Mensah, I.A.; Sun, M.; Gao, C.; Omari-Sasu, A.Y.; Zhu, D.; Ampimah, B.C.; Quarcoo, A. Analysis on the nexus of economic growth, fossil fuel energy consumption, CO2 emissions and oil price in Africa based on a PMG panel ARDL approach. J. Clean. Prod. 2019, 228, 161–174. [Google Scholar] [CrossRef]
- Ahmed, K.; Rehman, M.U.; Ozturk, I. What drives carbon dioxide emissions in the long-run? Evidence from selected South Asian Countries. Renew. Sustain. Energy Rev. 2017, 70, 1142–1153. [Google Scholar] [CrossRef]
- Pao, H.T.; Tsai, C.M. CO2 emissions, energy consumption and economic growth in BRIC countries. Energy Policy 2010, 38, 7850–7860. [Google Scholar] [CrossRef]
- Kais, S.; Sami, H. An econometric study of the impact of economic growth and energy use on carbon emissions: Panel data evidence from fifty eight countries. Renew. Sustain. Energy Rev. 2016, 59, 1101–1110. [Google Scholar] [CrossRef]
- Salari, M.; Javid, R.J.; Noghanibehambari, H. The nexus between CO2 emissions, energy consumption, and economic growth in the US. Econ. Anal. Policy 2021, 69, 182–194. [Google Scholar] [CrossRef]
- Adebayo, T.S.; Rjoub, H.; Akinsola, G.D.; Oladipupo, S.D. The asymmetric effects of renewable energy consumption and trade openness on carbon emissions in Sweden: New evidence from quantile-on-quantile regression approach. Environ. Sci. Pollut. Res. 2022, 29, 1875–1886. [Google Scholar] [CrossRef]
- Vural, G. Renewable and non-renewable energy-growth nexus: A panel data application for the selected Sub-Saharan African countries. Resour. Policy 2020, 65, 101568. [Google Scholar] [CrossRef]
- Cai, Y.; Sam, C.Y.; Chang, T. Nexus between clean energy consumption, economic growth and CO2 emissions. J. Clean. Prod. 2018. 182, 1001–1011. [CrossRef]
- Štefko, R.; Vašaničová, P.; Jenčová, S.; Pachura, A. Management and economic sustainability of the Slovak industrial companies with medium energy intensity. Energies 2021, 14, 267. [Google Scholar] [CrossRef]
- Cheng, M.; Liu, B. Analysis on the Influence of China’s Energy Consumption on Economic Growth. Sustainability 2019, 11, 3982. [Google Scholar] [CrossRef]
- Shafiei, S.; Salim, R.A. Non-renewable and renewable energy consumption and CO2 emissions in OECD countries: A comparative analysis. Energy Policy 2014, 66, 547–556. [Google Scholar] [CrossRef]
- Anwar, A.; Sarwar, S.; Amin, W.; Arshed, N. Agricultural practices and quality of environment: Evidence for global perspective. Environ. Sci. Pollut. Res. 2019, 26, 15617–15630. [Google Scholar] [CrossRef]
- Charfeddine, L.; Kahia, M. Impact of renewable energy consumption and financial development on CO2 emissions and economic growth in the MENA region: A panel vector autoregressive (PVAR) analysis. Renew. Energy 2019, 139, 198–213. [Google Scholar] [CrossRef]
- Chovancová, J.; Vavrek, R. (De) coupling Analysis with Focus on Energy Consumption in EU Countries and Its Spatial Evaluation. Pol. J. Environ. Stud. 2020, 29, 2091–2100. [Google Scholar] [CrossRef]
- Chovancová, J.; Popovičová, M.; Huttmanová, E. Decoupling transport-related greenhouse gas emissions and economic growth in the European Union countries. J. Sustain. Dev. Energy Water Environ. Syst. 2023, 11, 1090411. [Google Scholar] [CrossRef]
- Adedoyin, F.F.; Zakari, A. Energy consumption, economic expansion, and CO2 emission in the UK: The role of economic policy uncertainty. Sci. Total Environ. 2020, 738, 140014. [Google Scholar] [CrossRef]
- Chovancová, J.; Litavcová, E.; Shevchenko, T. Assessment of the relationship between economic growth, energy consumption, carbon emissions and renewable energy sources in the V4 countries. J. Manag. Bus. Res. Pract. 2021, 13, 1–14. [Google Scholar] [CrossRef]
- Menegaki, A.N. Growth and renewable energy in Europe: A random effect model with evidence for neutrality hypothesis. Energy Econ. 2011, 33, 257–263. [Google Scholar] [CrossRef]
- Radmehr, R.; Henneberry, S.R.; Shayanmehr, S. Renewable Energy Consumption, CO2 Emissions, and Economic Growth Nexus: A Simultaneity Spatial Modeling Analysis of EU Countries. Struct. Chang. Econ. Dyn. 2021, 57, 13–27. [Google Scholar] [CrossRef]
- Ozcan, B.; Ari, A. Nuclear energy-economic growth nexus in OECD countries: A panel data analysis. J. Econ. Manag. Perspect. 2017, 11, 138–154. [Google Scholar]
- Gozgor, G.; Lau, C.K.M.; Lu, Z. Energy consumption and economic growth: New evidence from the OECD countries. Energy 2018, 153, 27–34. [Google Scholar] [CrossRef]
- Al-Mulali, U.; Ozturk, I.; Lean, H.H. The influence of economic growth, urbanization, trade openness, financial development, and renewable energy on pollution in Europe. Nat. Hazards 2015, 79, 621–644. [Google Scholar] [CrossRef]
- Baltagi, B.H. Econometric Analysis of Panel Data; John Wiley & Sons: West Sussex, UK, 2005. [Google Scholar]
- Pesaran, M.H. A simple panel unit root test in the presence of cross-section dependence. J. Appl. Econom. 2007, 22, 265–312. [Google Scholar] [CrossRef]
- Basak, G.K.; Das, S. Understanding Cross-sectional Dependence in Panel Data. arXiv 2018, arXiv:1804.08326. Available online: https://arxiv.org/pdf/1804.08326.pdf (accessed on 2 September 2022). [CrossRef]
- Harris, R.D.F.; Tzavalis, E. Inference for unit roots in dynamic panels where the time dimension is fixed. J. Econom. 1999, 91, 201–226. [Google Scholar] [CrossRef]
- Breitung, J. The local power of some unit root tests for panel data. In Advances in Econometrics, Volume 15: Nonstationary Panels, Panel Cointegration, and Dynamic Panels; Baltagi, B.H., Ed.; JAI Press: Amsterdam, The Netherlands, 2000; pp. 161–178. [Google Scholar]
- Breitung, J.; Das, S. Panel unit root tests under cross-sectional dependence. Stat. Neerl. 2005, 59, 414–433. [Google Scholar] [CrossRef]
- Levin, A.; Lin, C.F.; Chu, C.S.J. Unit root tests in panel data: Asymptotic and finite-sample properties. J. Econom. 2002, 108, 1–24. [Google Scholar] [CrossRef]
- Im, K.S.; Pesaran, M.H.; Shin, Y. Testing for unit roots in heterogeneous panels. J. Econom. 2003, 115, 53–74. [Google Scholar] [CrossRef]
- Choi, I. Unit root tests for panel data. J. Int. Money Financ. 2001, 20, 249–272. [Google Scholar] [CrossRef]
- Hadri, K. Testing for stationarity in heterogeneous panel data. Econom. J. 2000, 3, 148–161. [Google Scholar] [CrossRef]
- Burdisso, T.; Sangiácomo, M. Panel time series: Review of the methodological evolution. Stata J. 2016, 16, 424–442. [Google Scholar] [CrossRef]
- Kao, C. Spurious regression and residual-based tests for cointegration in panel data. J. Econom. 1999, 90, 1–44. [Google Scholar] [CrossRef]
- Pedroni, P. Critical values for cointegration tests in heterogeneous panels with multiple regressors. Oxf. Bull. Econ. Stat. 1999, 61, 653–670. [Google Scholar] [CrossRef]
- Pedroni, P. Panel cointegration: Asymptotic and finite sample properties of pooled time series tests with an application to the PPP hypothesis. Econom. Theory 2004, 20, 597–625. [Google Scholar] [CrossRef]
- Westerlund, J. New simple tests for panel cointegration. Econom. Rev. 2005, 24, 297–316. [Google Scholar] [CrossRef]
- Phillips, P.C.B.; Hansen, B.E. Statistical inference in instrumental variables regression with I(1) processes. Rev. Econ. Stud. 1990, 57, 99–125. [Google Scholar] [CrossRef]
- Saikkonen, P. Estimation and testing of cointegrated systems by an autoregressive approximation. Econom. Theory 1992, 8, 1–27. [Google Scholar] [CrossRef]
- Stock, J.H.; Watson, M. A simple estimator of cointegrating vectors in higher order integrated systems. Econometrica 1993, 61, 783–820. [Google Scholar] [CrossRef]
- Phillips, P.C.B.; Moon, H.R. Nonstationary panel data analysis: An overview of some recent developments. Econom. Rev. 2000, 19, 263–286. [Google Scholar] [CrossRef]
- Kao, C.; Chiang, M.H. On the estimation and inference of a cointegrated regression in panel data. In Nonstationary Panels, Panel Cointegration, and Dynamic Panels; Emerald Group Publishing Limited: Bingley, UK, 2001; pp. 179–222. [Google Scholar] [CrossRef]
- Pedroni, P. Fully modified OLS for heterogeneous cointegrated panels. In Advances in Econometrics; Emerald (MCB UP): Bingley, UK, 2000; pp. 93–130. [Google Scholar]
- Pedroni, P. Social capital, barriers to production and capital shares: Implications for the importance of parameter heterogeneity from a nonstationary panel approach. J. Appl. Econom. 2007, 22, 429–451. [Google Scholar] [CrossRef]
- Holtz-Eakin, D.; Newey, W.; Rosen, H.S. Estimating vector autoregressions with panel data. Econometrica 1988, 56, 1371–1395. [Google Scholar] [CrossRef]
- Abrigo, M.R.M.; Love, I. Estimation of panel vector autoression in Stata. Stata J. 2016, 16, 778–804. [Google Scholar] [CrossRef]
- Granger, C.W.J. Investigating causal relations by econometric models and cross-spectral methods. Econometrica 1969, 37, 424–438. [Google Scholar] [CrossRef]
- Hansen, L.P. Large sample properties of generalized method of moment estimators. Econometrica 1982, 50, 1019–1054. [Google Scholar] [CrossRef]
- Akaike, H. Fitting autoregressive models for prediction. Ann. Inst. Stat. Math. 1969, 21, 243–247. [Google Scholar] [CrossRef]
- Schwarz, G. Estimating the dimension of a model. Ann. Stat. 1978, 6, 461–464. [Google Scholar] [CrossRef]
- Rissanen, J. Modeling by shortest data description. Automatica 1978, 14, 465–471. [Google Scholar] [CrossRef]
- Akaike, H. An extension of the method of maximum likelihood and the Stein’s problem. Ann. Inst. Stat. Math. 1977, 29, 153–164. [Google Scholar] [CrossRef]
- Hannan, E.J.; Quinn, B.G. The determination of the order of an autoregression. J. R. Stat. Soc. Ser. B 1979, 41, 190–195. [Google Scholar] [CrossRef]
- Andrews, D.W.K.; Lu, B. Consistent model and moment selection procedures for GMM estimation with application to dynamic panel data models. J. Econom. 2001, 101, 123–164. [Google Scholar] [CrossRef]
- Lütkepohl, H. New Introduction to Multiple Time Series Analysis; Springer: Berlin/Heidelberg, Germany, 2005. [Google Scholar]
- Kwiatkowski, D.; Phillips, P.C.B.; Schmidt, P.; Shin, Y. Testing the null hypothesis of stationarity against the alternative of a unit root: How sure are we that economic time series have a unit root? Ournal Econom. 1992, 54, 159–178. [Google Scholar]
- Newey, W.K.; West, K.D. A simple, positive semi-definite, heteroskedasticity and autocorrelation consistent covariance matrix. Econometrica 1987, 55, 703–708. [Google Scholar] [CrossRef]
- Khodzhimatov, R. Introducing Panel FMOLS/DOLS command for Stata. Available online: http://ravshansk.com/blog/xtcointreg.html (accessed on 9 September 2022).
- Bond, S.R.; Windmeijer, F. Finite Sample Inference for GMM Estimators in Linear Panel Data Models; Centre for Microdata Methods and Practice (Cemmap): London, UK, 2002. [Google Scholar] [CrossRef]
- Amisano, G.; Giannini, C. Topics in Structural VAR Econometrics, 2nd ed.; Springer: Berlin/Heidelberg, Germany, 1997. [Google Scholar]
- Cheng, C.; Ren, X.; Wang, Z.; Yan, C. Heterogeneous impacts of renewable energy and environmental patents on CO2 emission—Evidence from the BRIICS. Sci. Total Environ. 2019, 668, 1328–1338. [Google Scholar] [CrossRef]
- Azam, A.; Rafiq, M.; Shafique, M.; Zhang, H.; Yuan, J. Analyzing the effect of natural gas, nuclear energy and renewable energy on GDP and carbon emissions: A multi-variate panel data analysis. Energy 2021, 219, 119592. [Google Scholar] [CrossRef]
- Nathaniel, S.P.; Iheonu, C.O. Carbon dioxide abatement in Africa: The role of renewable and non-renewable energy consumption. Sci. Total Environ. 2019, 679, 337–345. [Google Scholar] [CrossRef]
- Nathaniel, S.P.; Alam, M.S.; Murshed, M.; Mahmood, H.; Ahmad, P. The roles of nuclear energy, renewable energy, and economic growth in the abatement of carbon dioxide emissions in the G7 countries. Environ. Sci. Pollut. Res. 2021, 28, 47957–47972. [Google Scholar] [CrossRef]
- Wang, Z.; Ben Jebli, M.; Madaleno, M.; Doğan, B.; Shahzad, U. Does export product quality and renewable energy induce carbon dioxide emissions: Evidence from leading complex and renewable energy economies. Renew. Energy 2021, 171, 360–370. [Google Scholar] [CrossRef]
- Menyah, K.; Wolde-Rufael, Y. CO2 emissions, nuclear energy, renewable energy and economic growth in the US. Energy Policy 2010, 38, 2911–2915. [Google Scholar] [CrossRef]
- Vaillancourt, K.; Labriet, M.; Loulou, R.; Waaub, J. The role of nuclear energy in long-term climate scenarios: An analysis with the World-Times model. Energy Policy 2008, 36, 2086–2097. [Google Scholar] [CrossRef]
- Fragkos, P.; Paroussos, L. Employment creation in EU related to renewables expansion. Appl. Energy 2018, 230, 935–945. [Google Scholar] [CrossRef]
- Proença, S.; Fortes, P. The social face of renewables: Econometric analysis of the relationship between renewables and employment. Energy Rep. 2020, 6, 581–586. [Google Scholar] [CrossRef]
- Zhao, J.; Dong, K.; Dong, X.; Shahbaz, M. How renewable energy alleviate energy poverty? A global analysis. Renew. Energy 2022, 186, 299–311. [Google Scholar] [CrossRef]
- Sachs, J.D.; Woo, W.T.; Yoshino, N.; Taghizadeh-Hesary, F. Importance of Green Finance for Achieving Sustainable Development Goals and Energy Security. In Handbook of Green Finance. Sustainable Development; Sachs, J., Woo, W., Yoshino, N., Taghizadeh-Hesary, F., Eds.; Springer: Singapore, 2019; pp. 3–12. [Google Scholar] [CrossRef]
- Mathews, J.; Tan, H. Economics: Manufacture renewables to build energy security. Nature 2014, 513, 166–168. [Google Scholar] [CrossRef]
- Saidi, K.; Mbarek, M.B. Nuclear energy, renewable energy, CO2 emissions, and economic growth for nine developed countries: Evidence from panel Granger causality tests. Prog. Nucl. Energy 2016, 88, 364–374. [Google Scholar] [CrossRef]
- Ope Olabiwonnu, F.; Haakon Bakken, T.; Anthony Jnr, B. The role of hydropower in renewable energy sector toward co2 emission reduction during the COVID-19 pandemic. Int. J. Green Energy 2022, 19, 52–61. [Google Scholar] [CrossRef]
- Hoang, A.T.; Nižetić, S.; Olcer, A.I.; Ong, H.C.; Chen, W.H.; Chong, C.T.; Thomas, S.; Bandh, S.A.; Nguyen, X.P. Impacts of COVID-19 pandemic on the global energy system and the shift progress to renewable energy: Opportunities, challenges, and policy implications. Energy Policy 2021, 154, 112322. [Google Scholar] [CrossRef]
- Mofijur, M.; Fattah, I.M.R.; Alam, M.A.; Islam, A.B.M.S.; Ong, H.C.; Rahman, S.M.A.; Najafi, G.; Ahmed, S.F.; Uddin, M.A.; Mahlia, T.M.I. Impact of COVID-19 on the social, economic, environmental and energy domains: Lessons learnt from a global pandemic. Sustain. Prod. Consum. 2021, 26, 343–359. [Google Scholar] [CrossRef]
- Chen, H.; Shi, Y.; Xu, M.; Zhao, X. Investment in renewable energy resources, sustainable financial inclusion and energy efficiency: A case of US economy. Resour. Policy 2022, 77, 102680. [Google Scholar] [CrossRef]
- Gielen, D.; Boshell, F.; Saygin, D.; Bazilian, M.D.; Wagner, N.; Gorini, R. The role of renewable energy in the global energy transformation. Energy Strateg. Rev. 2019, 24, 38–50. [Google Scholar] [CrossRef]
- Liang, W.; Yang, M. Urbanization, economic growth and environmental pollution: Evidence from China. Sustain. Comput. Inform. Syst. 2019, 21, 1–9. [Google Scholar] [CrossRef]


| Variable | Unit | Mean | Std. Dev | Min | Max |
|---|---|---|---|---|---|
| CO2 | tons | 8.784 | 3.721 | 3.818 | 31.253 |
| GDP | thousands USD | 30.406 | 17.058 | 4.504 | 124.591 |
| TEC | MWh | 44.345 | 17.233 | 17.920 | 114.632 |
| RES | MWh | 4.259 | 5.394 | 0.055 | 26.539 |
| Nuclear | MWh | 4.637 | 5.726 | 0 | 23.385 |
| Variable | Panel Unit Root Tests | |||||||
|---|---|---|---|---|---|---|---|---|
| 1st-Generation (p-Value) | 2nd-Gener. | |||||||
| Fisher (ADF) | Fisher (PP) | IPS | LLC | Breitung | Hadri | CIPS | ||
| Log_GDP | P | 0.8839 | 0.9977 | 0.5506 | 0.010 | 0.0783 | 0.000 | −2.035 |
| Z | 0.5765 | 0.9883 | ||||||
| L* | 0.5878 | 0.9827 | ||||||
| Pm | 0.8761 | 0.9905 | ||||||
| D.Log_GDP | P | 0.000 | 0.000 | 0.000 | 0.000 | 0.000 | 0.000 | −3.798 *** |
| Z | 0.000 | 0.000 | ||||||
| L* | 0.000 | 0.000 | ||||||
| Pm | 0.000 | 0.000 | ||||||
| Log_CO2 | P | 0.9171 | 0.9339 | 0.8553 | 0.0202 | 0.9543 | 0.000 | −2.454 |
| Z | 0.9002 | 0.9398 | ||||||
| L* | 0.8967 | 0.9391 | ||||||
| Pm | 0.9052 | 0.9113 | ||||||
| D.Log_CO2 | P | 0.000 | 0.000 | 0.000 | 0.000 | 0.000 | 0.4880 | −5.229 *** |
| Z | 0.000 | 0.000 | ||||||
| L* | 0.000 | 0.000 | ||||||
| Pm | 0.000 | 0.000 | ||||||
| Log_TEC | P | 0.7400 | 0.5265 | 0.5297 | 0.0009 | 0.7906 | 0.000 | −2.722 ** |
| Z | 0.5714 | 0.7502 | ||||||
| L* | 0.5537 | 0.6720 | ||||||
| Pm | 0.7516 | 0.5543 | ||||||
| D.Log_TEC | P | 0.000 | 0.000 | 0.000 | 0.000 | 0.000 | 0.1404 | −5.008 *** |
| Z | 0.000 | 0.000 | ||||||
| L* | 0.000 | 0.000 | ||||||
| Pm | 0.000 | 0.000 | ||||||
| Log_RES | P | 0.0001 | 0.000 | 0.003 | 0.0329 | 0.003 | 0.000 | −3.670 *** |
| Z | 0.0013 | 0.000 | ||||||
| L* | 0.0005 | 0.000 | ||||||
| Pm | 0.000 | 0.000 | ||||||
| D.Log_RES | P | 0.000 | 0.000 | 0.000 | 0.000 | 0.000 | 0.9453 | −5.642 *** |
| Z | 0.000 | 0.000 | ||||||
| L* | 0.000 | 0.000 | ||||||
| Pm | 0.000 | 0.000 | ||||||
| Nuclear | P | 0.8234 | 0.0996 | * | 0.9138 | 0.2019 | 0.000 | −1.574 |
| Z | 0.2295 | 0.0133 | ||||||
| L* | 0.1999 | 0.004 | ||||||
| Pm | 0.8240 | 0.0932 | ||||||
| D.Nuclear | P | 0.000 | 0.000 | * | 0.0002 | 0.000 | 0.9977 | −2.815 *** |
| Z | 0.000 | 0.000 | ||||||
| L* | 0.000 | 0.000 | ||||||
| Pm | 0.000 | 0.000 | ||||||
| Panel Cointegration Test | p-Value | ||
|---|---|---|---|
| H0: No cointegration | H1: All panels are cointegrated | ||
| Kao test | 1 | Modified Dickey–Fuller | 0.0658 |
| 2 | Dickey–Fuller | 0.0659 | |
| 3 | Augmented Dickey–Fuller | 0.4550 | |
| 4 | Unadjusted modified Dickey–Fuller | 0.000 | |
| 5 | Unadjusted Dickey–Fuller | 0.0019 | |
| Pedroni test | 1 | Modified Philips–Perron | 0.0010 |
| 2 | Philips–Perron | 0.0880 | |
| 3 | Augmented Dickey–Fuller | 0.0399 | |
| Westerlund test | 1 | Group-mean variance-ratio variance, H1: all panels are cointegrated | 0.0115 |
| 2 | Group-mean variance-ratio variance, H1: some panels are cointegrated | 0.0414 | |
| Panel FMOLS | Panel DOLS | |||||||
|---|---|---|---|---|---|---|---|---|
| Log_GDP | Log_RES | Log_TEC | Nuclear | Log_GDP | Log_RES | Log_TEC | Nuclear | |
| AUT | 0.000 | −0.49 *** | 1.40 *** | 0.000 | 0.01 * | −0.65 *** | 1.35 ** | 0.000 |
| BEL | −0.25 *** | −0.03 | 1.18 *** | −0.01 *** | 0.15 *** | −0.15 *** | 0.64 ** | −0.01 |
| BGR | 0.05 *** | −0.06 *** | 0.99 *** | −0.01 *** | 0.11 *** | −0.11 *** | 0.79 ** | −0.01 * |
| CZ | −0.07 *** | −0.05 *** | 1.04 *** | −0.01*** | −0.09 *** | 0.01 *** | 1.40 *** | −0.01 *** |
| DNK | −0.29 *** | 0.03 | 1.42 | 0000 | −0.22 *** | 0.02 *** | 1.53 *** | 0000 |
| FIN | 0000 | −0.32 *** | 1.83 *** | 0.01 *** | 0.10 *** | −0.78 *** | 1.49 *** | −0.01 |
| FRA | −0.08 *** | −0.12 *** | 1.59 *** | −0.01 *** | −0.14 *** | −0.08 *** | 1.26 *** | −0.01 *** |
| DEU | −0.53 *** | 0.13 *** | 1.27 *** | −0.01 *** | −0.53 *** | 0.12 *** | 0.83 *** | −0.01 *** |
| GRC | −0.26 *** | −0.01 | 1.60 *** | 0.000 | −0.35 *** | 0.03 ** | 1.79 *** | 0.000 |
| HUN | −0.09 *** | −0.02 *** | 1.11 ** | −0.02 *** | 0.10 *** | −0.08 *** | 1.53 *** | 0.000 |
| IRL | −0.07 *** | −0.06 *** | 1.10 *** | 0.000 | −0.02 | −0.09 *** | 1.02 *** | 0000 |
| ITA | −0.11 *** | −0.09 *** | 1.19 *** | 0.000 | −0.07 *** | −0.15 *** | 1.06 *** | 0.000 |
| LUX | −0.19 *** | −0.01 | 1.00 *** | 0.000 | −0.36 *** | 0.17 *** | 0.98 *** | 0.00 |
| NLD | −0.06 *** | −0.03 *** | 0.58 *** | 0.000 | 0.13 * | −0.11 *** | 0.63 *** | −0.13 *** |
| POL | −0.10 *** | 0.000 | 1.02 *** | 0.000 | −0.14 *** | 0.02 *** | 0.96 *** | 0.000 |
| SVN | −0.06 *** | −0.22 *** | 1.39 *** | −0.002 *** | 0.04 ** | −0.49 *** | 1.29 *** | −0.02 *** |
| SVK | −0.03 *** | −0.14 *** | 1.04 *** | −0.01 *** | −0.02 *** | −0.23 *** | 0.76 *** | −0.01 *** |
| ESP | −0.12 *** | −0.19 *** | 1.26 *** | −0.01 ** | −0.05 | −0.22 *** | 1.16 *** | −0.02 * |
| ROU | −0.05 *** | −0.17 *** | 1.25 *** | −0.02 *** | 0.000 | −0.25 *** | 0.75 *** | −0.01 |
| PRT | −0.14 *** | −0.24 *** | 1.25 *** | 0.000 | −0.10 *** | −0.29 *** | 1.36 *** | 0.000 |
| SWE | −0.18 *** | −0.70 *** | 2.17 *** | −0.01 *** | −0.14 *** | −0.98 *** | 2.86 *** | −0.02 *** |
| GBR | −0.18 *** | −0.03 * | 1.39 *** | −0.03 *** | −0.08 | −0.10 ** | 1.25 *** | −0.03 *** |
| EU22 | −0.13 *** | −0.13 *** | 1.27 *** | −0.01 | −0.08 *** | −0.20 *** | 1.21 *** | −0.01 |
| lag | CD | J | J p-Value | MMSCBIC | MMSCAIC | MMSCQIC |
|---|---|---|---|---|---|---|
| 1 | 1 | 77.98326 | 0.3841055 | −389.007 | −72.01674 | −196.3398 |
| 2 | 1 | 37.47426 | 0.9044813 | −273.8526 | −62.52574 | −145.4078 |
| 3 | 1 | 11.19275 | 0.9919546 | −144.4707 | −38.80725 | −80.24826 |
| 4 | 0.999 | - | - | - | - | - |
| Equation | Log_CO2 | Log_GDP | Log_RES | |||
|---|---|---|---|---|---|---|
| Coef | p-Val | Coef | p-Val | Coef | p-Val | |
| L1Log_CO2 | 0.6831 | 0.032 | 0.2957 | 0.134 | 2.4302 | 0.038 |
| L1Log_GDP | −0.1117 | 0.102 | 0.9424 | 0.000 | 0.3801 | 0.224 |
| L1Log_RES | −0.1584 | 0.754 | 0.0370 | 0.270 | 0.8944 | 0.000 |
| L1Log_TEC | 0.0335 | 0.944 | −0.9147 | 0.006 | −4.0431 | 0.038 |
| L1Nuclear | −0.0038 | 0.418 | 0.0031 | 0.433 | 0.0064 | 0.749 |
| Equation | Log_TEC | Nuclear | ||||
| Coef | p-Val | Coef | p-Val | |||
| L1Log_CO2 | 0.51997 | 0.095 | 35.609 | 0.360 | ||
| L1Log_GDP | 0.0413 | 0.510 | 4.9377 | 0.546 | ||
| L1Log_RES | −0.1616 | 0.720 | −0.8652 | 0.876 | ||
| L1Log_TEC | −0.0827 | 0.857 | −33.2113 | 0.587 | ||
| L1Nuclear | −0.0031 | 0.471 | 0.4592 | 0.452 | ||
| Variables | p-Value | ||||
|---|---|---|---|---|---|
| Log_CO2 | Log_GDP | Log_RES | |||
| Log_GDP | 0.102 | Log_CO2 | 0.134 | Log_CO2 | 0.038 |
| Log_RES | 0.754 | Log_RES | 0.270 | Log_GDP | 0.224 |
| Log_TEC | 0.944 | Log_TEC | 0.006 | Log_TEC | 0.038 |
| Nuclear | 0.418 | Nuclear | 0.443 | Nuclear | 0.749 |
| All | 0.149 | All | 0.014 | All | 0.109 |
| Log_TEC | Nuclear | ||||
| Log_CO2 | 0.095 | Log_CO2 | 0.360 | ||
| Log_GDP | 0.510 | Log_GDP | 0.546 | ||
| Log_RES | 0.720 | Log_RES | 0.876 | ||
| Nuclear | 0.471 | Log_TEC | 0.587 | ||
| All | 0.036 | All | 0.668 | ||
| Forecast Horizon | Nuclear | Log_RES | Log_TEC | Log_CO2 | Log_GDP |
|---|---|---|---|---|---|
| 0 | 0.000000 | 0.000000 | 0.000000 | 0.000000 | 0.000000 |
| 1 | 0.008880 | 0.017959 | 0.650928 | 0.322234 | 0.000000 |
| 2 | 0.033737 | 0.030996 | 0.611791 | 0.318511 | 0.004966 |
| 3 | 0.037700 | 0.032663 | 0.613452 | 0.297096 | 0.019090 |
| 4 | 0.037558 | 0.033654 | 0.611291 | 0.279795 | 0.037702 |
| 5 | 0.036244 | 0.034782 | 0.604205 | 0.267851 | 0.056918 |
| 6 | 0.034857 | 0.036351 | 0.594312 | 0.260128 | 0.074352 |
| 7 | 0.033689 | 0.038483 | 0.583476 | 0.255299 | 0.089054 |
| 8 | 0.032752 | 0.041160 | 0.572784 | 0.252387 | 0.100918 |
| 9 | 0.031988 | 0.044279 | 0.562751 | 0.250764 | 0.110218 |
| 10 | 0.031346 | 0.047701 | 0.553564 | 0.250042 | 0.117347 |
Publisher’s Note: MDPI stays neutral with regard to jurisdictional claims in published maps and institutional affiliations. |
© 2022 by the authors. Licensee MDPI, Basel, Switzerland. This article is an open access article distributed under the terms and conditions of the Creative Commons Attribution (CC BY) license (https://creativecommons.org/licenses/by/4.0/).
Share and Cite
Petruška, I.; Litavcová, E.; Chovancová, J. Impact of Renewable Energy Sources and Nuclear Energy on CO2 Emissions Reductions—The Case of the EU Countries. Energies 2022, 15, 9563. https://doi.org/10.3390/en15249563
Petruška I, Litavcová E, Chovancová J. Impact of Renewable Energy Sources and Nuclear Energy on CO2 Emissions Reductions—The Case of the EU Countries. Energies. 2022; 15(24):9563. https://doi.org/10.3390/en15249563
Chicago/Turabian StylePetruška, Igor, Eva Litavcová, and Jana Chovancová. 2022. "Impact of Renewable Energy Sources and Nuclear Energy on CO2 Emissions Reductions—The Case of the EU Countries" Energies 15, no. 24: 9563. https://doi.org/10.3390/en15249563
APA StylePetruška, I., Litavcová, E., & Chovancová, J. (2022). Impact of Renewable Energy Sources and Nuclear Energy on CO2 Emissions Reductions—The Case of the EU Countries. Energies, 15(24), 9563. https://doi.org/10.3390/en15249563