

Experimental Evaluation of Shale Oil Development Effectiveness by Air Injection


 ,
,  and
and 
Abstract
1. Introduction
2. Experiments
2.1. Experiment Materials
2.2. Experiment Equipment and Conditions
2.3. Experimental Procedures
3. Results and Discussion
3.1. Development Dynamics
3.2. Residual Oil Analysis
3.3. Produced Oil Analysis
4. Conclusions
- (1)
- For the Jimsar shale oil reservoir, air flooding is characterized by an early gas breakthrough, a rapid increase in GOR, and an “L” shape oil production decline. To achieve a certain recovery factor, adequate air injection (≥10.6 PV) should be guaranteed, and the ultimate recovery factor of large PV (16 PV) air flooding can reach 23.36%.
- (2)
- In contrast to air flooding, air HnP presents characteristics of first producing gas and then producing oil. The GOR is high first and then low, and the oil production rate is first low, then high. The recovery factor of the first round of HnP accounts for 60% of the cumulative recovery factor of the three rounds of HnP, indicating a rapid decrease in recovery factor with increasing HnP rounds. The air volume required for the first round of air HnP is smaller and the development time is significantly shorter, although the cumulative recovery factor (17.17%) of the three rounds of HnP is lower than that of air flooding. Consequently, air HnP seems to be a more feasible and efficient development model for nearby oil in the shale reservoir, while a higher final recovery factor can be achieved through air flooding due to its large swept volume.
- (3)
- As shown from the NMR results, the oil in large pores (>10 ms) accounts for only 23.48% of the total oil volume under initial conditions, but contributes more than 60% of the recovery factor from air injection development, while the oil in small pores is difficult effectively extract. It is mainly the difference in the degree of oil recovery in large pores that leads to the difference in air flooding recovery and air HnP recovery. After air injection development, more than 54% of the initial oil is still in medium (1–10 ms) pores, which are the main concentrations of residual oil, accounting for more than 66% of the residual oil.
- (4)
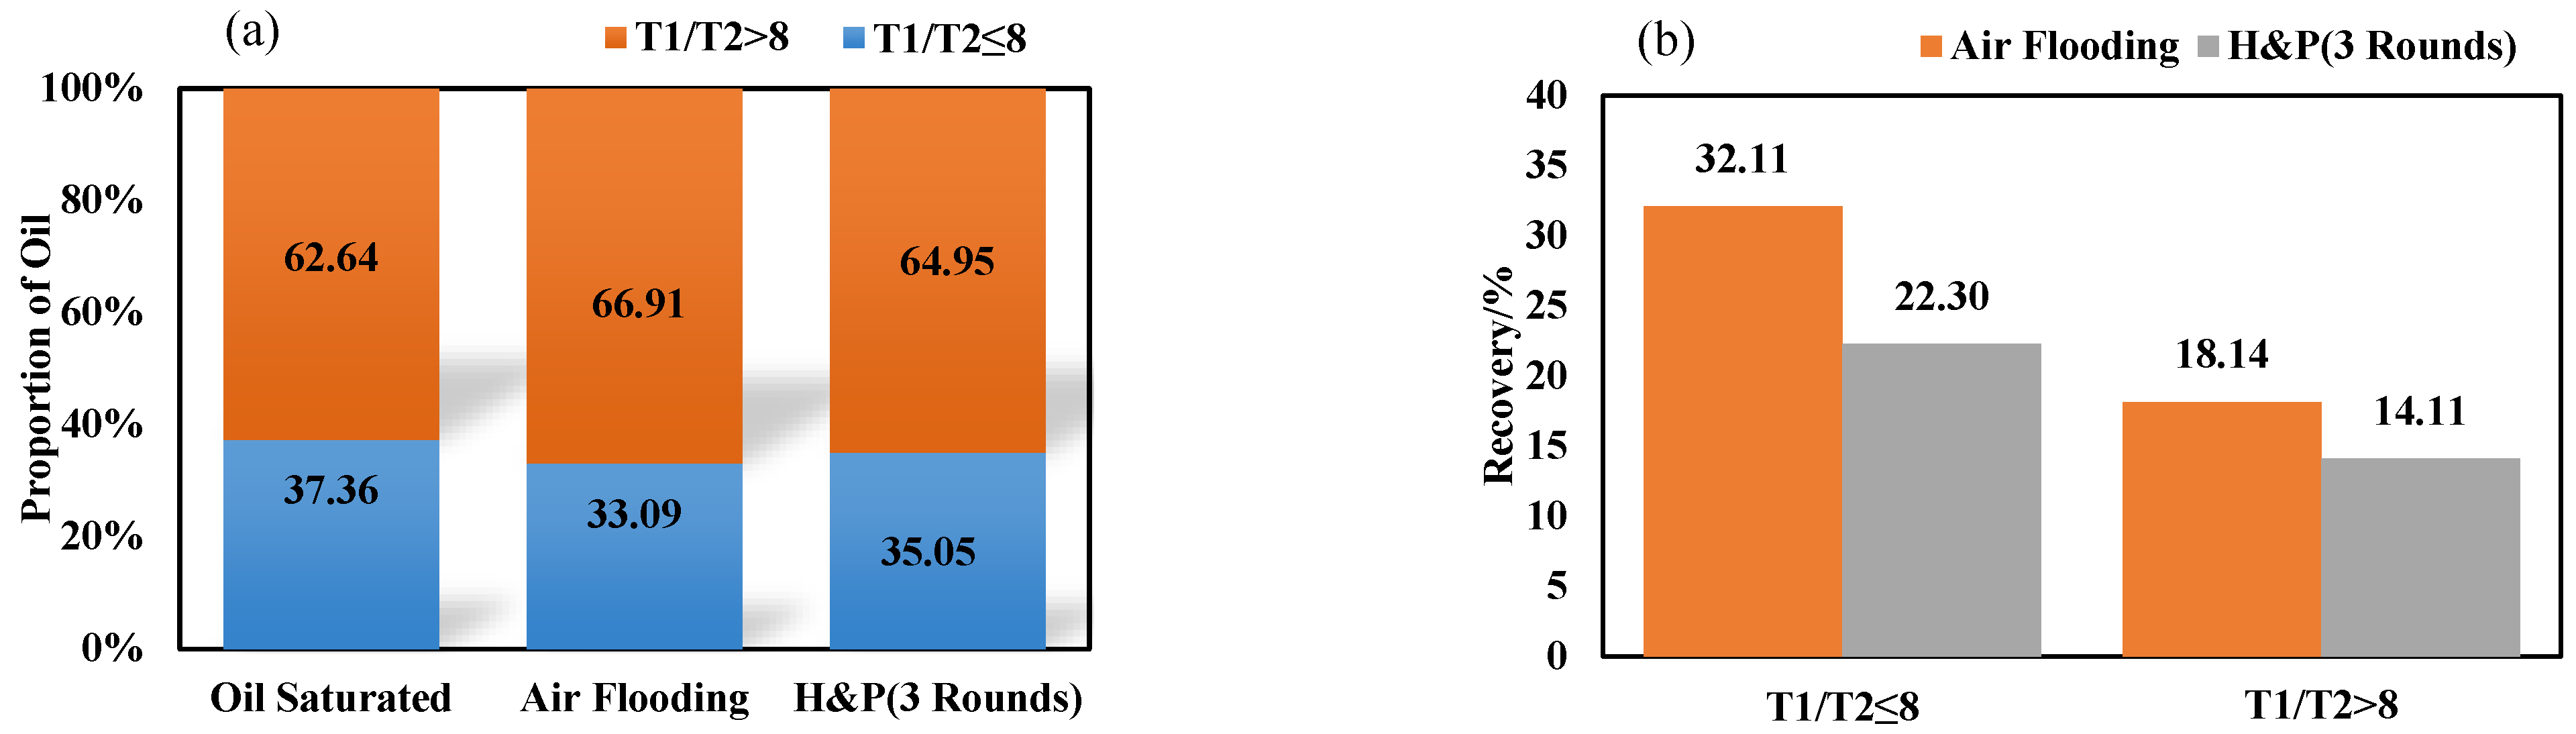
- Air injection development has a higher recovery factor for light components (), which will lead to an increase in the content of heavy components () in residual oil, and the development effectiveness of gas flooding is more obvious than air HnP.
- (5)
- Based on the 2D NMR data, the distinction and quantitative analysis of light and heavy components of oil in cores can be realized, which provides a new approach to analyze oil properties in porous media, and a systematic method was established to evaluate the development effectiveness of air injection in shale oil.
Author Contributions
Funding
Data Availability Statement
Conflicts of Interest
References
- Dong, C.; Hoffman, B.T. Modeling gas injection into shale oil reservoirs in the sanish field, North Dakota. In Proceedings of the Unconventional Resources Technology Conference, Denver, CO, USA, 12–14 August 2013; Society of Exploration Geophysicists, American Association of Petroleum Geologists, Society of Petroleum Engineers: Tulsa, OK, USA, 2013; pp. 1824–1833. [Google Scholar]
- Yu, W.; Al-Shalabi, E.W.; Sepehrnoori, K. A sensitivity study of potential CO2 injection for enhanced gas recovery in Barnett shale reservoirs. In Proceedings of the SPE Unconventional Resources Conference, The Woodlands, TX, USA, 1–3 April 2014. [Google Scholar]
- Sheng, J.J.; Chen, K. Evaluation of the EOR potential of gas and water injection in shale oil reservoirs. J. Unconv. Oil Gas Resour. 2014, 5, 1–9. [Google Scholar] [CrossRef]
- Zhu, P.; Balhoff, M.T.; Mohanty, K.K. Simulation of fracture-to-fracture gas injection in an oil-rich shale. In Proceedings of the SPE Annual Technical Conference and Exhibition, Houston, TX, USA, 28–30 September 2015. [Google Scholar]
- Kong, B.; Wang, S.; Chen, S. Simulation and optimization of CO2 huff-and-puff processes in tight oil reservoirs. In Proceedings of the SPE Improved Oil Recovery Conference, Tulsa, OK, USA, 11–13 April 2016. [Google Scholar]
- Kokkinos, N.C.; Nkagbu, D.C.; Marmanis, D.I.; Dermentzis, K.I.; Maliaris, G. Evolution of Unconventional Hydrocarbons: Past, Present, Future and Environmental FootPrint. J. Eng. Sci. Technol. Rev. 2022, 15, 15–24. [Google Scholar] [CrossRef]
- Sheng, J. Enhanced Oil Recovery in Shale and Tight Reservoirs; Gulf Professional Publishing: Houston, TX, USA, 2019. [Google Scholar]
- Alfarge, D.; Wei, M.; Bai, B. Air injection in shale and tight oil reservoirs. In Developments in Petroleum Science; Elsevier: Amsterdam, The Netherlands, 2020; Volume 67, pp. 87–111. [Google Scholar]
- Jia, H.; Yuan, C.-D.; Zhang, Y.-C.; Peng, H.; Zhong, D.; Zhao, J.-Z. Recent progress of high-pressure air injection (HPAI) process in Light Oil Reservoir: Laboratory investigation and field application. In Proceedings of the SPE Heavy Oil Conference Canada, Calgary, AB, Canada, 12–14 June 2012. [Google Scholar]
- Jia, H. Investigation into the Oxidation Mechanism of Crude Oil and Gas Channeling Prevention for Application of High-Pressure Air Injection (HPAI) Process. Ph.D. Dissertation, Southwest Petroleum University, Sichuan, China, 2012. [Google Scholar]
- Juan, E.; Sanchez, A.; Del Monte, A.; Moore, R.; Mehta, S.; Ursenbach, M. Laboratory Screening for Air Injection-Based IOR in Two Waterf looded Light Oil Reservoirs. J. Can. Pet. Technol. 2005, 44, 31–41. [Google Scholar] [CrossRef]
- Gutierrez, D.; Kumar, V.; Moore, R.G.; Mehta, S.A. Air injection and waterflood performance comparison of two adjacent units in the Buffalo Field. SPE Reserv. Eval. Eng. 2008, 11, 848–857. [Google Scholar]
- Youwei, J.; Yitang, Z.; Shangqi, L.; Wenlong, G.; Yaping, C.; Shuangmao, L. Displacement mechanisms of air injection in low permeability reservoirs. Pet. Explor. Dev. 2010, 37, 471–476. [Google Scholar] [CrossRef]
- Li, J.; Mehta, S.; Moore, R.; Ursenbach, M.; Zalewski, E.; Ferguson, H.; Okazawa, N. Oxidation and ignition behaviour of saturated hydrocarbon samples with crude oils using TG/DTG and DTA thermal analysis techniques. J. Can. Pet. Technol. 2004, 43, 45–51. [Google Scholar] [CrossRef]
- Huan, Q.I.; Yiqiang, L.I.; Xiaolong, C.H.; Anlin, L.O.; Li, W.E.; Jie, L.I.; Jianghao, L.U.; Xuebin, S.U.; Xiang, T.A.; Cuo, G.U. Low-temperature oxidation of light crude oil in oxygen-reduced air flooding. Pet. Explor. Dev. 2021, 48, 1393–1402. [Google Scholar]
- Liu, G.; Zhang, T.; Xie, Q.; Liu, W.; Wang, L.; Yang, D. Experimental evaluation of live oil oxidation together with its physical properties during air injection in a tight oil reservoir. Fuel 2021, 283, 119121. [Google Scholar] [CrossRef]
- O’Brien, W.J.; Moore, R.G.; Mehta, S.A.; Ursenbach, M.G.; Kuhlman, M.I. Performance of air injection vs. CO2/water injection in a tight, light-oil reservoir: A laboratory study. SPE Reserv. Eval. Eng. 2019, 22, 1049–1062. [Google Scholar] [CrossRef]
- Zhang, Y.; Huang, S.; Sheng, J.J.; Jiang, Q. Experimental and analytical study of oxygen consumption during air injection in shale oil reservoirs. Fuel 2020, 262, 116462. [Google Scholar] [CrossRef]
- Jia, H.; Sheng, J.J. Discussion of the feasibility of air injection for enhanced oil recovery in shale oil reservoirs. Petroleum 2017, 3, 249–257. [Google Scholar] [CrossRef]
- Yu, Y.; Li, L.; Sheng, J.J. A comparative experimental study of gas injection in shale plugs by flooding and huff-n-puff processes. J. Nat. Gas Sci. Eng. 2017, 38, 195–202. [Google Scholar] [CrossRef]
- Bai, J.; Liu, H.; Wang, J.; Qian, G.; Peng, Y.; Gao, Y.; Yan, L.; Chen, F. CO2, water and N2 injection for enhanced oil recovery with spatial arrangement of fractures in tight-oil reservoirs using huff-‘n-puff. Energies 2019, 12, 823. [Google Scholar] [CrossRef]
- Nguyen, P.; Carey, J.W.; Viswanathan, H.S.; Porter, M. Effectiveness of supercritical-CO2 and N2 huff-and-puff methods of enhanced oil recovery in shale fracture networks using microfluidic experiments. Appl. Energy 2018, 230, 160–174. [Google Scholar] [CrossRef]
- Lu, T.; Li, Z.; Li, J.; Hou, D.; Zhang, D. Flow behavior of N2 huff and puff process for enhanced oil recovery in tight oil reservoirs. Sci. Rep. 2017, 7, 15695. [Google Scholar] [CrossRef]
- Yue, P.; Xie, Z.; Huang, S.; Liu, H.; Liang, S.; Chen, X. The application of N2 huff and puff for IOR in fracture-vuggy carbonate reservoir. Fuel 2018, 234, 1507–1517. [Google Scholar] [CrossRef]
- Zou, B.; Pu, W.; Zhou, X.; Du, D.; Shi, Y.; Xia, W.; Zeng, F. Experimental study on the feasibility of nitrogen huff-n-puff in a heavy oil reservoir. Chem. Eng. Res. Des. 2022, 184, 513–523. [Google Scholar] [CrossRef]
- Neng, G.A.O.; Jian, Z.; Jia, H.E. Application of hypoxic air huff and puff technology in deep heavy oil reservoirs in Lukeqin oilfield. Xinjiang Pet. Geol. 2020, 41, 748. [Google Scholar]
- Jia, H.; Sheng, J.J. Simulation study of huff-n-puff air injection for enhanced oil recovery in shale oil reservoirs. Petroleum 2018, 4, 7–14. [Google Scholar] [CrossRef]
- Tang, W.; Sheng, J.J. Huff-n-puff gas injection or gas flooding in tight oil reservoirs? J. Pet. Sci. Eng. 2022, 208, 109725. [Google Scholar] [CrossRef]
- Li, L.; Su, Y.; Hao, Y.; Zhan, S.; Lv, Y.; Zhao, Q.; Wang, H. A comparative study of CO2 and N2 huff-n-puff EOR performance in shale oil production. J. Pet. Sci. Eng. 2019, 181, 106174. [Google Scholar] [CrossRef]
- Song, Y.; Song, Z.; Zeng, H.; Tai, C.; Chang, X. N2 and CO2 Huff-n-Puff for Enhanced Tight Oil Recovery: An Experimental Study Using Nuclear Magnetic Resonance. Energy Fuels 2022, 36, 1515–1521. [Google Scholar] [CrossRef]
- Jun, W.; Xiaohai, M.; Weimin, W.; Naigui, L. 2D NMR distribution function for microscale remaining oil. Pet. Geol. Exp. 2015, 37, 654–659. [Google Scholar]
- Zhang, X. Experimental Study on Mechanisms of Chemical Flooding for Heavy Oil Reservoirs at Pore Scale Based on Two-Dimensional Spectrum Technology; China Science: Beijing, China, 2020; p. 1. [Google Scholar]
- Yang, Z.; Hirasaki, G.J.; Appel, M.; Reed, D.A. Viscosity evaluation for NMR well logging of live heavy oils. Petrophys.-SPWLA J. Form. Eval. Reserv. Descr. 2012, 53, 22–37. [Google Scholar]
- Lo, S.-W.; Hirasaki, G.J.; House, W.V.; Kobayashi, R. Mixing rules and correlations of NMR relaxation time with viscosity, diffusivity, and gas/oil ratio of methane/hydrocarbon mixtures. SPE J. 2002, 7, 24–34. [Google Scholar] [CrossRef]
- Korb, J.-P.; Nicot, B.; Louis-Joseph, A.; Bubici, S.; Ferrante, G. Dynamics and wettability of oil and water in oil shales. J. Phys. Chem. C 2014, 118, 23212–23218. [Google Scholar] [CrossRef]
- Rylander, E.; Philip, M.S.; Jiang, T.; Lewis, R. NMR T2 distributions in the Eagle Ford shale: Reflections on pore size. In Proceedings of the SPE Unconventional Resources Conference, The Woodlands, TX, USA, 10–12 April 2013. [Google Scholar]
- Tinni, A.; Sondergeld, C.; Rai, C. NMR T1–T2 response of moveable and non-moveable fluids in conventional and unconventional rocks. In Proceedings of the International Symposium of the Society of Core Analysts, Avignon, France, 8–11 September 2014; pp. 8–11. [Google Scholar]
- Fleury, M.; Romero-Sarmiento, M. Characterization of shales using T1–T2 NMR maps. J. Pet. Sci. Eng. 2016, 137, 55–62. [Google Scholar] [CrossRef]


| Core Number | Permeability (×10−3 μm2) | Porosity (%) | Diameter (cm) | Length (cm) |
|---|---|---|---|---|
| J1 | 0.85 | 11.57 | 9.90 | 8.93 |
| J27-1 | 0.87 | 13.94 | 2.51 | 3.51 |
| J27-2 | 0.90 | 13.76 | 2.51 | 3.53 |
| Number | Core Number | Development Model | Injection Pressure/MPa |
|---|---|---|---|
| 1 | J1 | Air flooding | 0.5 |
| 2 | Air HnP | 20 | |
| 3 | J27-1 | / | / |
| 4 | J27-2 | Air flooding | 0.5 |
Publisher’s Note: MDPI stays neutral with regard to jurisdictional claims in published maps and institutional affiliations. |
© 2022 by the authors. Licensee MDPI, Basel, Switzerland. This article is an open access article distributed under the terms and conditions of the Creative Commons Attribution (CC BY) license (https://creativecommons.org/licenses/by/4.0/).
Share and Cite
Chen, C.; Tang, X.; Qin, M.; Zhou, R.; Ding, Z.; Lian, G.; Qi, H.; Chen, X.; Liu, Z.; Li, Y. Experimental Evaluation of Shale Oil Development Effectiveness by Air Injection. Energies 2022, 15, 9513. https://doi.org/10.3390/en15249513
Chen C, Tang X, Qin M, Zhou R, Ding Z, Lian G, Qi H, Chen X, Liu Z, Li Y. Experimental Evaluation of Shale Oil Development Effectiveness by Air Injection. Energies. 2022; 15(24):9513. https://doi.org/10.3390/en15249513
Chicago/Turabian StyleChen, Chao, Xiang Tang, Ming Qin, Rui Zhou, Zhenhua Ding, Guihui Lian, Huan Qi, Xin Chen, Zheyu Liu, and Yiqiang Li. 2022. "Experimental Evaluation of Shale Oil Development Effectiveness by Air Injection" Energies 15, no. 24: 9513. https://doi.org/10.3390/en15249513
APA StyleChen, C., Tang, X., Qin, M., Zhou, R., Ding, Z., Lian, G., Qi, H., Chen, X., Liu, Z., & Li, Y. (2022). Experimental Evaluation of Shale Oil Development Effectiveness by Air Injection. Energies, 15(24), 9513. https://doi.org/10.3390/en15249513