Abstract
Industrial revolution 4.0 has enabled the advent of new technological advancements, including the introduction of information technology with physical devices. The implementation of information technology in industrial applications has helped streamline industrial processes and make them more cost-efficient. This combination of information technology and physical devices gave birth to smart devices, which opened up a new research area known as the Internet of Things (IoT). This has enabled researchers to help reduce downtime and maintenance costs by applying condition monitoring on electrical machines utilizing machine learning algorithms. Although the industry is trying to move from scheduled maintenance towards predictive maintenance, there is a significant lack of algorithms related to fault prediction of electrical machines. There is quite a lot of research going on in this area, but it is still underdeveloped and needs a lot more work. This paper presents a signal spectrum-based machine learning approach toward the fault prediction of electrical machines. The proposed method is a new approach to the predictive maintenance of electrical machines. This paper presents the details regarding the algorithm and then validates the accuracy against data collected from working electrical machines for both cases. A comparison is also presented at the end of multiple machine learning algorithms used for training based on this approach.
1. Introduction
The advancement in information technology and its integration with other fields have opened up new research and development areas. This has also resulted in the revolution of industrial standards with the massive turn of events along with the introduction of industrial standards 4.0 [1]. This has helped industries streamline processes and make them more efficient and cost-effective. The integration of information technology with physical devices developed a whole new domain, which has become the core of the modern industry and resulted in the advent of smart devices. This has made it easier for industries to reduce shutdown times and help tackle issues in a more systematic way. Smart devices can communicate with each other over the internet and make decisions or pinpoint the issues in the system, which has made the industrial process smoother. This field of development of smart devices and their communication over a network (or internet) is commonly referred to as the Internet of Things (IoT) [2,3]. These devices can not only communicate with each other, but they also can act as end nodes for data collection from electrical machines using sensors. This process is known as condition monitoring of electrical machines as the data are transmitted in real-time through smart devices and monitored in real-time. This helps monitor the health of the electrical machine and reduces shutdown times in case of fault occurrence. This collected data can further be used for training models for real-time fault detection, fault prediction, data analysis, and diagnostics of the connected machine [4,5,6,7]. IoT has cemented its position in industrial applications, become one of the fundamental pillars of modern industry [8], and further enhanced its importance due to predictive maintenance research [9,10,11,12,13].
This advancement has helped the industry to switch from scheduled maintenance towards predictive maintenance and real-time condition monitoring of electrical machines. Condition monitoring of electrical machines is now a standard implementation in any modern industry [14,15]. Data collection for further data analysis is a core part of this system that helps develop predictive maintenance systems [10,16]. In general, electrical machine maintenance can be divided into four phases: periodic, proactive, reactive, and predictive maintenance. Most of the industry still works with periodic and reactive maintenance, i.e., scheduled maintenance or when a machine is down, as shown in Figure 1. There is an uptrend to move towards proactive and predictive maintenance as it is more cost-efficient and productive. This move is mainly possible because of the recent development in the field of IoT and research on the development of more accurate machine learning-trained models for electrical machines with high-quality data collected with the help of condition monitoring systems.
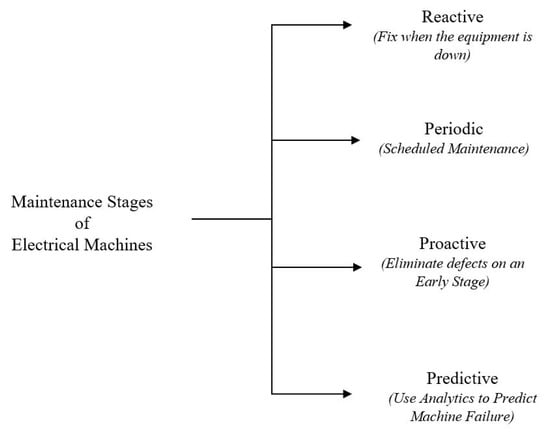
Figure 1.
Maintenance phases of an electrical machine.
Condition monitoring systems are implemented concerning electrical machines and making their way into other industries. Currently, most of the work related to classification or detection using such systems is in the health domain [17,18,19]. Wearable devices are used to monitor patients for any abnormal health conditions [16,17] so that doctors can react quickly if a problem occurs. The development of such systems has also made its way into environmental control, where systems have been developed for monitoring air pollution [20], carbon dioxide [21], and solar power [22]. Systems are also being developed to monitor and control residential buildings, making them into smart homes [23] and monitoring grids, and controlling network congestion. With the development of condition monitoring systems, researchers are now looking at cost-effective systems, especially in the domain of electrical machines, with more work being done on microcontroller boards. This can help gather data, especially from off-shore electrical machines. Hence, condition monitoring systems are being developed, which are particularly targeted toward weather sensors [24] and wind turbines [25,26,27]. Researchers are also looking into a more portable approach towards condition monitoring systems with the advancement of electrical machines, which can give better mobility and less complexity [20,28,29,30,31].
The recent advancement in micro-controller boards has made way for the development of condition monitoring systems [7,32,33] utilizing these boards as it is not only cost-efficient but flexible and scalable too. This work is still in its early stages and is underdeveloped. Most of the condition monitoring systems designed using this approach lack the sampling frequency of data acquired through it, as generally, it is kept low. However, work is being done for higher sampling frequency and more stable data acquisition systems based on micro-controller boards [7,34]. These micro-controller boards are scaling at a rapid pace with their safety, security, and power taken into account. Soon, it will be enough to develop more stable and faster data acquisition systems utilizing these boards, with will be cost-efficient and productive compared to currently available data acquisition systems. Currently, most of the data acquisition systems in place are either developed with SCADA or PLC [35,36,37,38], which are complex to use and expensive. Data acquisition cards are available in the market but are expensive compared to micro-controller boards and need a separate system to set up.
One of the most crucial parts of predictive maintenance or condition monitoring [39] is the implementation of machine learning-based trained models. The accuracy of these models depends mainly on the quality of data used for training and their diversity. Hence, it is always instructed to utilize high-quality data samples with all possible scenarios and an optimal number of features to get better results. Artificial Neural Networks (ANNs) are the most commonly used models for fault detection classification. Although other offline models are available for the diagnostics of electrical machines like FEM [40,41], they are primarily for offline implementation and take much more time, which is unsuitable for real-time detection. ANNs models are usually trained with high processing power systems or cloud systems [42,43] to get minimum training time. However, there might be a chance that the model gets over-trained, so it is always good to check the optimal number of samples needed and optimize the machine learning algorithm.
Much work is being done on the condition monitoring of electrical machines [12] and fault detection [44] in electrical machines and bearings [45,46]. However, not much work is being done in the field of fault prediction in electrical machines. Some researchers are working in this domain, but some are utilizing the time domain while other systems are still being developed or are primarily for offline analysis and diagnostics [16,47]. Some of the other systems used in this domain only utilize fault detection while gathering data for training, or there are some commercialized products available. However, they are not only expensive, but their technology is still not disclosed.
This article presents a new signal spectrum-based approach for fault prediction in electrical machines based on signal processing and machine learning. Different machine learning models are trained using the data generated through the proposed method to check their accuracy and performance. A comparison between different neural networks is also given to help choose the best suited for this case.
2. Methodology
This section of the article can be divided into three parts: (i) Signal Processing, (ii) Data Preparation, and (iii) Machine Learning Training and comparison between trained models. The method proposed here is a new approach to fault prediction of electrical machines utilizing the frequency spectrum. This article includes the spectrum of an induction machine with broken rotor bar faults. In this article, one broken rotor bar is used as a reference for a faulty case. The method includes data gathered through Dewetron from multiple induction motors for healthy and faulty cases. The general overview of the data acquisition for the article, including the proposed method, is shown in Figure 2. The acquired data are preprocessed to get distinct features in healthy and faulty cases, which will be explained below. The processed data are then used for data generation to cover expected cases, and a model is trained to test it with real-time data from the induction machine.
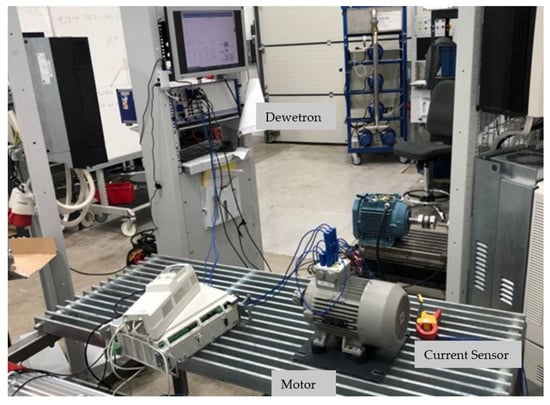
Figure 2.
Data acquisition experimental setup.
As it is difficult to gather data for each scenario, primarily when the fault is generated or is about to be generated, it is of utmost importance to consider all the possible cases and the effect of fault frequency components. Researchers work on generating this data using Simulink models or statistical equations to cover more situations and gather more data samples. However, this approach usually does not consider the effect of external parameters on the electrical machine. Here, a more straightforward approach is taken to generate missing data in between or to cover all the expected outcomes. The general overview of the paper is shown in Figure 3.
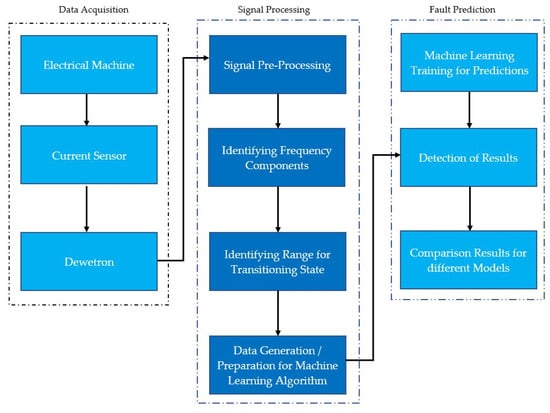
Figure 3.
General overview of the proposed method in the article.
2.1. Signal Processing
The first step is to process the gathered data and make it suitable for training. The data gathered through Dewetron are in the time domain, which is converted into the frequency domain using Fast Fourier Transform (FFT). The approach taken here is considering the current signature of the electrical machines and the effect of faults on them. A comparison between the entire frequency spectrum of both healthy and faulty cases is shown in Figure 4a. The spectrum is also shown in the logarithmic scale in Figure 4b for better understanding.
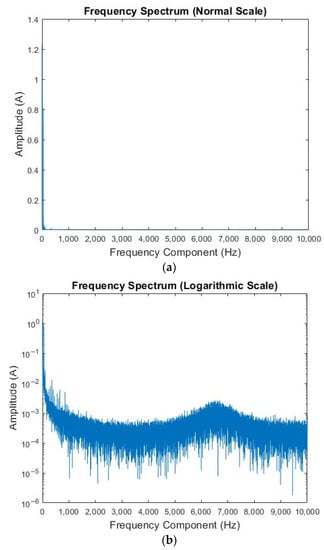
Figure 4.
Frequency spectrum of current sample (a) general scale (b) logarithmic scale.
As a wide range of frequency components are present in the spectrum, the first step is to identify the most prominent frequency components and filter out the negligible ones. This will give fewer frequency components and will make identifying distinct components easier. In this case, the frequency range was decided to be up to 500 Hz as, after this range, the frequency component amplitude is negligible and is not making any significant difference. The frequency spectrum after applying the cut-off is shown in Figure 5.
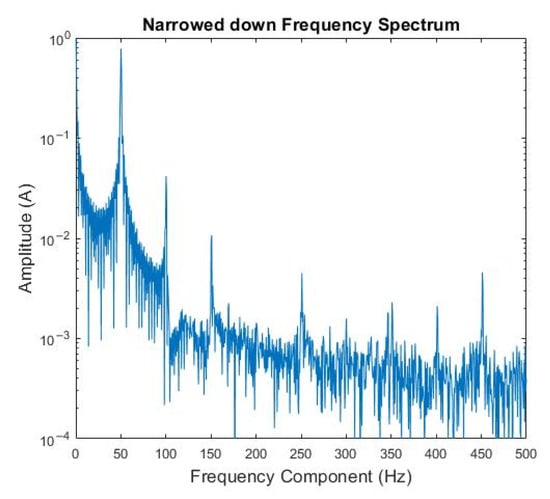
Figure 5.
Narrowed down frequency spectrum example.
After narrowing down the frequency components used for training, a comparison is made between the healthy and faulty spectrums to narrow down the frequency components that make a difference. This comparison is carried out for multiple cases, and data are collected from different induction motors to help identify the correct frequency components. General spectrums and their difference for one of the samples are shown in Figure 6. Once it is narrowed down, the most prominent components are selected to help determine the specific fault. This help simplifies the training more, and these components will be used as one of the basics to complete combinations for the training of the predictive algorithm.
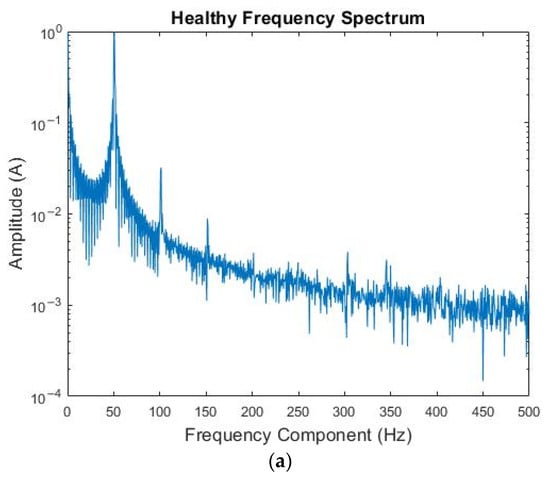
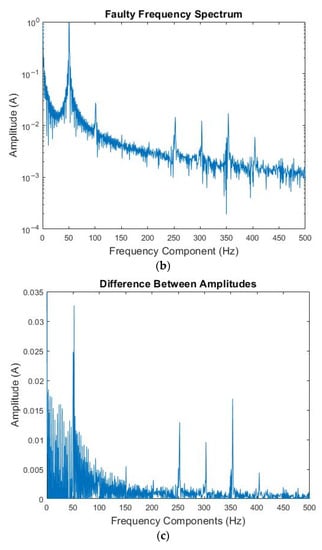
Figure 6.
Frequency spectrum (a) healthy case, (b) faulty case, (c) difference to identify frequency components.
The data are then further processed to check the amplitude of these frequency components in healthy and faulty cases. This process is carried out for multiple samples from different induction machines so that the identified components are universal for this specific fault. All amplitudes are normalized to lie between the range of 0–1 to get consistent results. Figure 7 shows an example of a frequency spectrum for both healthy and faulty cases with frequency components and amplitudes.
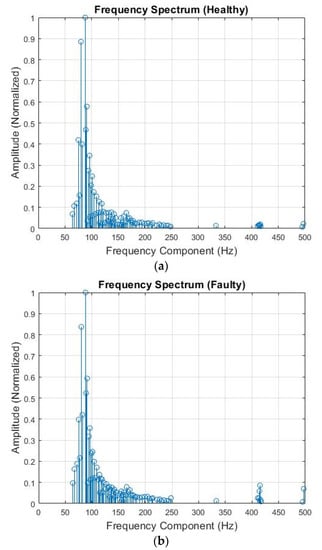
Figure 7.
Frequency spectrum with normalized amplitudes (0–1) (a) healthy case, (b) faulty case.
After going through multiple samples, the changes in amplitude of the frequency components for both healthy and faulty are singled out. After careful analysis, the amplitude range for the prominent frequency components for fault occurrence is determined. Some of the frequency components with their amplitude range for the healthy case are shown in Table 1, whereas the faulty case is shown in Table 2. This range will help specify the fault occurrence probability for the predictive algorithm.

Table 1.
Frequency amplitude range for fault occurrence (healthy signal).

Table 2.
Frequency amplitude range for fault occurrence (faulty signal).
After identifying the frequency components and their amplitude ranges for healthy and faulty cases, the trend of change in amplitude is noted. This will help to generate data and form combinations for the training of machine learning mode for fault prediction.
2.2. Data Preparation
After identifying the ranges and combinations, the next step is to prepare the data for training the machine learning model. In this case, the data gathered from the electrical machine are either for the healthy or faulty case. The combinations present are for either of the cases, and there are no such data samples at this point that can predict the movement before fault occurrence or chances of fault occurrence. To compensate for this lack of data points in between, we will be using average to get the range value of range between the healthy and faulty cases. Equation (1) depicts the calculation of frequency amplitudes for the case between healthy and faulty states.
Here, is the higher average amplitude of the frequency component when it is transitioning from a healthy to a faulty state. Let us say this is the transition state of the motor, whereas and represent the maximum amplitude of the frequency component at healthy and faulty states, respectively. This will give the range of values for the frequency component amplitude between the transitioning state, which can be used further to determine which combinations can identify the faulty frequency components. A general overview of the amplitude range of different frequency components during the transitioning state is shown in Table 3.

Table 3.
Frequency amplitude range for fault occurrence (transition state).
The difference in ranges for a specific frequency component is graphically shown in Figure 8. This gives an idea about the specific ranges needed to generate combinations for training a machine learning model.
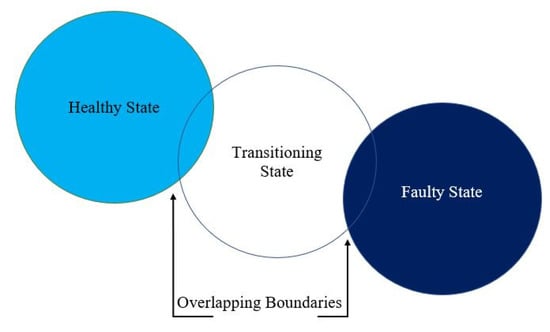
Figure 8.
Overlapping frequency amplitude range for three states.
It can be seen that the ranges might overlap a bit, but it is either on the minimum side or maximum size of the transitioning state of the motor, which is to be expected. Once all the ranges of each considered frequency component are determined, the next step is to divide these ranges further into three parts, i.e., each part will be 30% of the range, excluding healthy and faulty areas. This will give us some idea about how much of a chance there is for the occurrence of a fault in the electrical machine. Table 4 shows the division of one of the frequency component amplitudes in the transition state.

Table 4.
Division of transition state frequency component range for 250.21 Hz frequency component.
Table 4 shows the division of the range for one of the frequency component’s amplitudes. This will help define the probability of fault occurrence in the incoming signal and will further enable the determination of the fault occurrence level. Once these are established, data points are generated based on these ranges, which will then be used for training the machine learning algorithm. Multiple combinations of these ranges are created to avoid missing out on any possible scenarios. The generated data are then combined with the data for healthy and faulty states for the specific frequency ranges and used for training the machine learning algorithm. The probability of fault occurrence is taken as an average with a weight of the ranges used in the combination. A weight is assigned based on the critical value of the frequency component amplitude and in which range it lies.
For example, for the initial combinations, the range values are the same, so similar weightage is applied to each range value to determine the probability of the fault occurrence, and the average of those probabilities is taken. This will give us the same probability of the urgency of the fault that is occurring. The ranges are divided into five parts for simplicity, as shown in Table 4 above. The weightage assigned to each range is shown in Table 5. The final occurrence probability percentage is decided by taking the average for all frequency components, as shown in Equation (2).

Table 5.
The weightage assigned to the range of amplitude of frequency component.
Here, is the probability of fault occurrence, whereas to are the assigned probabilities to different frequency component amplitudes in the combination, and is the total number of frequency components present in the combination. This will give an average probability for the fault occurrence, which is then simplified based on the division shown in Table 4. The general overview of the data points combination example used for training the machine learning mode is shown in Figure 9.
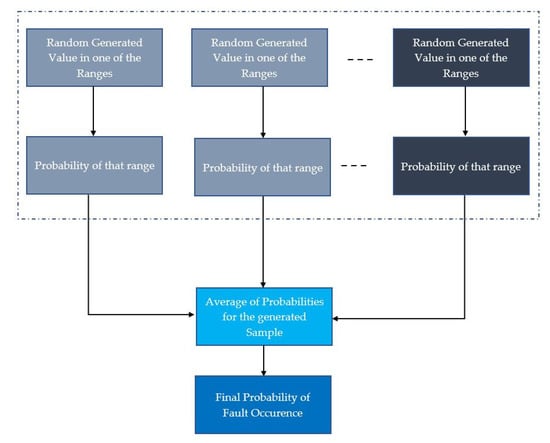
Figure 9.
Training data points example.
This will determine the probability of fault occurrence in the electrical machine. However, for this research, the probability is rounded off to 0%, 30%, 60%, 90%, and 100% to classify the data for these five cases. However, they can be further divided into multiple options, and a machine learning model can be trained based on them. Once the data are prepared, different machine learning models are used for training the sample data. The blind validation method was used to determine the accuracy of the trained model.
2.3. Machine Learning Training and Comparison
After completing the data points, the next step is to train machine learning models based on those data sets and validate the results to see if they predict the occurrence correctly or not. To ensure we cover all possible cases, healthy and faulty data points for validation were gathered from running electrical machines, whereas the data points for validation for transitioning state were randomly generated from the defined ranges. For comparison purposes, five different kinds of machine learning algorithms were selected, and models were trained using those models.
For machine learning, different neural network algorithms were trained to compare purposes. As this is the initial stage of the proposed algorithm, the data points used for training the machine learning based models were around 68,000 data samples with a validation sample count of 6800 data samples. These initial tests were carried out on smaller data sets and might need to be tested for bigger data sample sets. Each range was assigned a classification label, which is shown in Table 6.

Table 6.
Classification assigned per range of error.
Machine learning models were trained based on blind validation, i.e., the samples used for validation were not used for the training of the models. A total of eight models were considered, with the majority from neural networks for classification. A comprehensive comparison between the accuracies of these models is given in Table 7. The confusion matrix for the validation results of the two models is shown in Figure 10.

Table 7.
Comparison results.
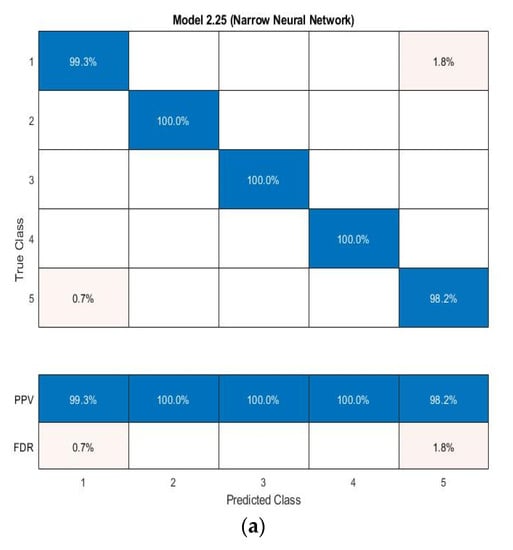
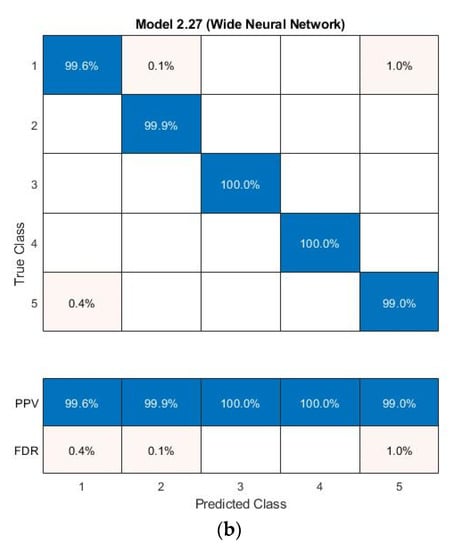
Figure 10.
Machine learning results (a) narrow neural network, (b) wide neural network.
As can be seen from Table 7, all of the Neural Network techniques performed well, whereas the others were nearby. This might be because the data set is small and not too big. Further experiments need to be done with bigger data sets to confirm results.
3. Discussion and Conclusions
There has been much research in predictive maintenance, but it is still lacking a good predictive maintenance algorithm. Most of the algorithms being utilized at the moment are related to fault detection, and work is still under development in the area of the prediction of faults. Some commercial products are available in the market, but they are too expensive and company-dependent. Moreover, the technology included for these products is confidential but includes both hardware and software. The algorithm presented in this paper is a step towards a stable and general-purpose approach for fault prediction in electrical machines, which can be implied to different faults.
This paper proposes a novel single-spectrum-based approach for the predictive maintenance of electrical machines. This is a new concept and might need some more refinement and research. The method presented here is based on the current signature fluctuations because of faults in electric machines and utilizing those changes to predict faults. There is only one fault considered for this research, i.e., a broken rotor bar in the electrical machine for reference.
There are two different parts of the presented approach; one is signal processing, whereas the other is the preparation of data samples for training a machine learning model for fault prediction. The proposed method and experiment show a promising result. The data set used for training is small, which might be one reason for the higher accuracy of neural network models. Nevertheless, this shows that predictive maintenance can be achieved using the proposed method. There is still a need to test the approach on a bigger data set with more faulty scenarios and combinations. Although the method needs initial processing to be processed on the incoming signals before giving it to detection, it does not take much time, and the models can be implemented and tested in real-time scenarios.
However, there is still a need to improve the method and include different faults of the electrical machines and also work on multiple combinations between transition, healthy and faulty states. This will make the algorithm broader and will help with the predictive maintenance of machines. Moreover, the algorithm can be improved in determining the urgency of maintenance by adding more layers of transition state and combinations. It might be possible in the future to utilize the presented approach for predicting different faults of electrical machines in real time.
The presented algorithm/approach for fault prediction is still in its early phase. For test purposes, only one type of fault was considered to validate the algorithm. This work can be further extended by considering other faults and testing the algorithm to validate their accuracy. It would also be beneficial to test out its general approach and to evaluate its working with any fault of the electrical machine just by changing the faulty signal. The future work also includes the implementation of this algorithm with bigger data samples and more complex faults.
Author Contributions
Conceptualization, H.A.R. and K.K.; methodology, H.A.R.; software, H.A.R.; validation, H.A.R., K.K. and B.A.; formal analysis, H.V.K.; data curation, B.A.; writing—original draft preparation, H.A.R.; writing—review and editing, K.K.; visualization, A.R.; supervision, A.K.; project administration, T.V. All authors have read and agreed to the published version of the manuscript.
Funding
The research leading to these results received funding from the EEA/Norway Grants 2014–2021, Industrial Internet methods for electrical energy conversion systems monitoring and diagnostics. The “Industrial Internet methods for electrical energy conversion systems monitoring and diagnostics” benefits from a 993,000€ grant from Iceland, Liechtenstein and Norway through the EEA Grants. The project aims to provide research in the field of energy conversion systems and to develop artificial intelligence and virtual emulator-based prognostic and diagnostic methodologies for these systems. The project contract with the Research Council of Lithuania (LMTLT) No is S-BMT-21-5 (LT08-2-LMT-K-01-040).
Conflicts of Interest
The authors declare no conflict of interest.
References
- Zhou, K.; Liu, T.; Zhou, L. Industry 4.0: Towards future industrial opportunities and challenges. In Proceedings of the 2015 12th International Conference on Fuzzy Systems and Knowledge Discovery (FSKD), Zhangjiajie, China, 15–17 August 2015; pp. 2147–2152. [Google Scholar] [CrossRef]
- Atzori, L.; Iera, A.; Morabito, G. The Internet of Things: A survey. Comput. Netw. 2010, 54, 2787–2805. [Google Scholar] [CrossRef]
- Internet of Things Architecture Project. Available online: http://www.iot-a.eu/public (accessed on 30 November 2022).
- Pulavskyi, A.; Krivenko, S.S.; Kryvenko, L.S. Functional diagnostic using electrical impedance tomography reconstruction and the Internet of Things. In Proceedings of the 2017 6th Mediterranean Conference on Embedded Computing, MECO 2017—Including ECYPS 2017, Bar, Montenegro, 11–15 June 2017; pp. 1–4. [Google Scholar] [CrossRef]
- Raja, H.A.; Raval, H.; Vaimann, T.; Kallaste, A.; Rassolkin, A.; Belahcen, A. Cost-efficient real-time condition monitoring and fault diagnostics system for BLDC motor using IoT and Machine learning. In Proceedings of the Diagnostika 2022–2022 International Conference on Diagnostics in Electrical Engineering, Proceedings, Pilsen, Czech Republic, 6–8 September 2022; pp. 1–4. [Google Scholar] [CrossRef]
- Rajan, V.; Sobhana, N.; Jayakrishnan, R. Machine Fault Diagnostics and Condition Monitoring Using Augmented Reality and IoT. In Proceedings of the 2nd International Conference on Intelligent Computing and Control Systems, ICICCS 2018, Madurai, India, 14–15 June 2018; pp. 910–914. [Google Scholar] [CrossRef]
- Raja, H.A.; Vaimann, T.; Rassolkin, A.; Kallaste, A.; Belahcen, A. IoT Based Tools for Data Acquisition in Electrical Machines and Robotics. In Proceedings of the 2021 IEEE 19th International Power Electronics and Motion Control Conference, PEMC 2021, Gliwice, Poland, 25–29 April 2021; pp. 737–742. [Google Scholar] [CrossRef]
- Wang, J.; Lim, M.K.; Wang, C.; Tseng, M.-L. The evolution of the Internet of Things (IoT) over the past 20 years. Comput. Ind. Eng. 2021, 155, 107174. [Google Scholar] [CrossRef]
- Frosini, L. Monitoring and Diagnostics of Electrical Machines and Drives: A State of the Art. In Proceedings of the 2019 IEEE Workshop on Electrical Machines Design, Control and Diagnosis, WEMDCD 2019, Athens, Greece, 22–23 April 2019; Volume 1, pp. 169–176. [Google Scholar] [CrossRef]
- Parpala, R.C.; Iacob, R. Application of IoT concept on predictive maintenance of industrial equipment. MATEC Web Conf. 2017, 121, 02008. [Google Scholar] [CrossRef]
- Zhang, W.; Yang, D.; Wang, H. Data-Driven Methods for Predictive Maintenance of Industrial Equipment: A Survey. IEEE Syst. J. 2019, 13, 2213–2227. [Google Scholar] [CrossRef]
- Raja, H.A.; Kudelina, K.; Asad, B.; Vaimann, T. Fault Detection and Predictive Maintenance for Electrical Machines. In New Trends in Electric Machines—Technology and Applications; IntechOpen: London, UK, 2022. [Google Scholar]
- Compare, M.; Baraldi, P.; Zio, E. Challenges to IoT-Enabled Predictive Maintenance for Industry 4.0. IEEE Internet Things J. 2019, 7, 4585–4597. [Google Scholar] [CrossRef]
- Yoo, Y.; Baek, J.-G. A Novel Image Feature for the Remaining Useful Lifetime Prediction of Bearings Based on Continuous Wavelet Transform and Convolutional Neural Network. Appl. Sci. 2018, 8, 1102. [Google Scholar] [CrossRef]
- Li, S.; Li, J. Condition monitoring and diagnosis of power equipment: Review and prospective. High Volt. 2017, 2, 82–91. [Google Scholar] [CrossRef]
- Kudelina, K.; Asad, B.; Vaimann, T.; Rassõlkin, A.; Kallaste, A.; Van Khang, H. Methods of Condition Monitoring and Fault Detection for Electrical Machines. Energies 2021, 14, 7459. [Google Scholar] [CrossRef]
- Sofi, A.; Regita, J.J.; Rane, B.; Lau, H.H. Structural health monitoring using wireless smart sensor network—An overview. Mech. Syst. Signal Process 2022, 163, 108113. [Google Scholar] [CrossRef]
- Sheela, K.G.; Varghese, A.R. Machine Learning based Health Monitoring System. Mater. Today Proc. 2019, 24, 1788–1794. [Google Scholar] [CrossRef]
- Rahman, N.A.A.; Jambek, A.B. Biomedical health monitoring system design and analysis. Indones. J. Electr. Eng. Comput. Sci. 2019, 13, 1056–1064. [Google Scholar] [CrossRef]
- Potbhare, P.D.; Bhange, K.; Tembhare, G.; Agrawal, R.; Sorte, S.; Lokulwar, P. IoT based Smart Air Pollution Monitoring System. In Proceedings of the International Conference on Applied Artificial Intelligence and Computing, ICAAIC, Salem, India, 9–11 May 2022; pp. 1829–1834. [Google Scholar] [CrossRef]
- Rodriguez-Huerta, R.; Martinez-Castillo, J.; Morales-Gonzalez, E.; Herrera-May, A.L. Development of a Monitoring System for CO/CO2 with Android. In Proceedings of the IEEE International Conference on Engineering Veracruz, ICEV, Boca del Rio, Mexico, 14–17 October 2019. [Google Scholar] [CrossRef]
- Prasanna, J.L.; Lavanya, D.; Kumar, T.A. Condition monitoring of a virtual solar system using IoT. In Proceedings of the 2nd International Conference on Communication and Electronics Systems, ICCES, Coimbatore, India, 19–20 October 2017; pp. 286–290. [Google Scholar] [CrossRef]
- Yu, Y.; Hao, Z.; Li, G.; Liu, Y.; Yang, R.; Liu, H. Optimal search mapping among sensors in heterogeneous smart homes. Math. Biosci. Eng. 2022, 20, 1960–1980. [Google Scholar] [CrossRef]
- Xie, P.; Kennedy, N.; French, G.; Popovici, E.; Edwards-Murphy, F.; O’Ríordáin, S.; Leahy, P. Sensing wind for environmental and energy applications. In Proceedings of the 25th IET Irish Signals & Systems Conference 2014 and 2014 China-Ireland International Conference on Information and Communications Technologies, Limerick, Ireland, 26–27 June 2014. [Google Scholar] [CrossRef]
- Hsu, J.-Y.; Wang, Y.-F.; Lin, K.-C.; Chen, M.-Y.; Hsu, J.H.-Y. Wind Turbine Fault Diagnosis and Predictive Maintenance Through Statistical Process Control and Machine Learning. IEEE Access 2020, 8, 23427–23439. [Google Scholar] [CrossRef]
- Zhao, L.; Zhou, Y.; Matsuo, I.B.M.; Korkua, S.K.; Lee, W.-J. The Design of a Remote Online Holistic Monitoring System for a Wind Turbine. IEEE Trans. Ind. Appl. 2020, 56, 14–21. [Google Scholar] [CrossRef]
- Wymore, M.L.; Van Dam, J.E.; Ceylan, H.; Qiao, D. A survey of health monitoring systems for wind turbines. Renew. Sustain. Energy Rev. 2015, 52, 976–990. [Google Scholar] [CrossRef]
- Srivastava, P.; Bajaj, M.; Rana, A.S. IOT based controlling of hybrid energy system using ESP8266. In Proceedings of the IEEMA Engineer Infinite Conference, eTechNxT 2018, New Delhi, India, 13–14 March 2018; pp. 1–5. [Google Scholar] [CrossRef]
- Kalyanraj, D.; Prakash, S.L.; Sabareswar, S. Wind turbine monitoring and control systems using Internet of Things. In Proceedings of the International Conference on 21st Century Energy Needs—Materials, Systems and Applications, ICTFCEN, Kharagpur, India, 17–19 November 2016; pp. 1–4. [Google Scholar] [CrossRef]
- Raju, L.; Gokulakrishnan, S.; Muthukumar, P.R.; Jagannathan, S.; Morais, A.A. Iot based autonomous demand side management of a micro-grid using arduino and multi agent system. In Proceedings of the International Conference on Power and Embedded Drive Control, ICPEDC 2017, Chennai, India, 16–18 March 2017; pp. 44–49. [Google Scholar] [CrossRef]
- Mhatre, V.; Chavan, S.; Samuel, A.; Patil, A.; Chittimilla, A.; Kumar, N. Embedded Video Processing and Data Acquisition for Unmanned Aerial Vehicle. In Proceedings of the 2015 International Conference on Computers, Communications and Systems, ICCCS 2015, Kanyakumari, India, 2–3 November 2015. [Google Scholar]
- Shyamala, D.; Swathi, D.; Prasanna, J.L.; Ajitha, A. IoT platform for condition monitoring of industrial motors. In Proceedings of the 2017 2nd International Conference on Communication and Electronics Systems (ICCES), Coimbatore, India, 19–20 October 2017; pp. 260–265. [Google Scholar]
- Milenković, A.; Otto, C.; Jovanov, E. Wireless sensor networks for personal health monitoring: Issues and an implementation. Comput. Commun. 2006, 29, 2521–2533. [Google Scholar] [CrossRef]
- Pjevalica, V.; Pjevalica, N.; Petrovic, N. Cloud Based Data Acquisition via IoT for Electric Power Quality Monitoring. In Proceedings of the Zooming Innovation in Consumer Technologies Conference (ZINC 2019), Novi Sad, Serbia, 29–30 May 2019; pp. 82–85. [Google Scholar] [CrossRef]
- Gopalamma, A.S.L.K.; Naik, R.S. Smart Drive Control using IoT. In Proceedings of the TENCON 2019—2019 IEEE Region 10 Conference (TENCON), Kochi, India, 17–20 October 2019; pp. 1853–1856. [Google Scholar] [CrossRef]
- Kuzlu, M.; Pipattanasomporn, M.; Rahman, S. Review of Communication Technologies for Smart Homes/Building Applica-tions. In Proceedings of the 2015 IEEE Innovative Smart Grid Technologies—Asia, ISGT ASIA 2015, Bangkok, Thailand, 3–6 November 2015. [Google Scholar]
- Yakimov, P.I.; Lovev, A.N.; Tuliev, N.T. Implementation of Internet of Things based solution of universal power transducer. In Proceedings of the 26th International Scientific Conference Electronics, ET 2017—Proceedings 2017, Sozopol, Bulgaria, 13–15 September 2017; pp. 1–4. [Google Scholar] [CrossRef]
- Debbag, Y.; Yilmaz, E.N. Internet based monitoring and control of a wind turbine via PLC. In Proceedings of the 2015 3rd International Istanbul Smart Grid Congress and Fair (ICSG 2015), Istanbul, Turkey, 29–30 April 2015; pp. 1–5. [Google Scholar] [CrossRef]
- Wang, Q.; Wang, H.; Hou, L.; Yi, S. Overview of Tool Wear Monitoring Methods Based on Convolutional Neural Network. Appl. Sci. 2021, 11, 12041. [Google Scholar] [CrossRef]
- Asad, B.; Vaimann, T.; Belahcen, A.; Kallaste, A.; Rassolkin, A. Rotor Fault Diagnostic of Inverter Fed Induction Motor Using Frequency Analysis. In Proceedings of the 2019 IEEE 12th International Symposium on Diagnostics for Electrical Machines, power Electronics and Drives (SDEMPED), Toulouse, France, 27–30 August 2019. [Google Scholar] [CrossRef]
- Asad, B.; Vaimann, T.; Belahcen, A.; Kallaste, A.; Rassõlkin, A.; Iqbal, M. The Cluster Computation-Based Hybrid FEM–Analytical Model of Induction Motor for Fault Diagnostics. Appl. Sci. 2020, 10, 7572. [Google Scholar] [CrossRef]
- Li, J.H.; Zhao, S.; Wang, Y.R. Using Cloud Computing and the Internet of Things to Construct Vehicle Condition Fault Di-agnosis Platform. Proc. Appl. Mech. Mater. 2014, 574, 752–755. [Google Scholar] [CrossRef]
- Aazam, M.; Khan, I.; Alsaffar, A.A.; Huh, E.-N. Cloud of Things: Integrating Internet of Things and cloud computing and the issues involved. In Proceedings of the 11th International Bhurban Conference on Applied Sciences and Technology (IBCAST), Islamabad, Pakistan, 14–18 January 2014; pp. 414–419. [Google Scholar] [CrossRef]
- Gong, W.; Chen, H.; Zhang, Z.; Zhang, M.; Wang, R.; Guan, C.; Wang, Q. A Novel Deep Learning Method for Intelligent Fault Diagnosis of Rotating Machinery Based on Improved CNN-SVM and Multichannel Data Fusion. Sensors 2019, 19, 1693. [Google Scholar] [CrossRef]
- Kudelina, K.; Asad, B.; Vaimann, T.; Belahcen, A.; Rassõlkin, A.; Kallaste, A.; Lukichev, D.V. Bearing Fault Analysis of BLDC Motor for Electric Scooter Application. Designs 2020, 4, 42. [Google Scholar] [CrossRef]
- Xu, G.; Liu, M.; Jiang, Z.; Söffker, D.; Shen, W. Bearing Fault Diagnosis Method Based on Deep Convolutional Neural Network and Random Forest Ensemble Learning. Sensors 2019, 19, 1088. [Google Scholar] [CrossRef] [PubMed]
- Kudelina, K.; Vaimann, T.; Rassolkin, A.; Kallaste, A.; Demidova, G.; Karpovich, D. Diagnostic Possibilities of Induction Motor Bearing Currents. In Proceedings of the International Scientific Technical Conference Alternating Current Electric Drives (ACED), Los Angeles, CA, USA, 23–25 January 2021; pp. 1–5. [Google Scholar] [CrossRef]
Publisher’s Note: MDPI stays neutral with regard to jurisdictional claims in published maps and institutional affiliations. |
© 2022 by the authors. Licensee MDPI, Basel, Switzerland. This article is an open access article distributed under the terms and conditions of the Creative Commons Attribution (CC BY) license (https://creativecommons.org/licenses/by/4.0/).