Abstract
An increasing number of devices and their communication with each other generates huge amounts of data. The efficiency of processing such large and heterogeneous data is crucial for extracting the reliable and consistent information that is needed for the effective management of smart cities within the field of transport. Data heterogeneity and volume as well as its integration and analytics are big challenges for decision-makers. The development of urban agglomerations is largely dependent on the proper management of such data. Therefore, this paper explores the role of these data repositories, their acquisition from different sources, and the ways to combine them. The main goal of this paper is to propose a concept of Smart City management based on Big Data Analytics and technology related to UAVs (Unmanned Aerial Vehicle) which may reduce costs and resource consumption. The presented concept includes successive data generation and collection, data type identification, problem and requirement identification, filtering, classification, pre-processing, and data optimization, as well as decision support analysis. A key part of this analysis utilizes computer algorithms, such as Speeded Up Robust Features (SURF) and Thresholding and Blob detection, to develop a multi-camera image recognition system for freight transport management and logistics in smart cities. The objective is to design a system that optimizes the route planning and time of vehicle passage on selected road sections, ultimately leading to the reduction of emissions. During the study, data obtained from multiple sources were compared, and the analysis uncovered different results for the same assumptions. We discuss the reasons for these variances. Overall, the results obtained in the analysis indicated that it is necessary to correct the predictions of the multi-camera image recognition system with additional methods and algorithms.
Keywords:
UAV; smart cities; ITS; big data analytics; fleet management; heterogeneity; freight transport 1. Introduction
The rapid increase in the population of cities creates many challenges related to overflowing data repositories. The amount of data being acquired is growing at an unprecedented rate. Such repositories, the so-called Big Data, have great potential to be used as a source of data in the analysis of financial issues, energy management, and ecology, as well as in the management of city transportation systems. Managing and analysing such data offers huge benefits, but it also generates problems. In the age of the information society, Big Data is an important issue that enables organizations to store, manage, collect, and manipulate huge amounts of data at the right time, at the right speed, and for the right purpose. Big Data is not a standalone technology, it is a set of data obtained from heterogeneous, autonomous sources that is collected in extremely large quantities and updated in fractions of a second.
The rapid accumulation of huge amounts of data strengthened the need to change the classical approach and adopt the concepts related to Big Data Analytics. Big Data Analytics, as defined in [1,2,3,4,5], is the implementation of selected processes considering new paradigms. The main challenges of such an approach are [1]:
- Heterogeneity;
- Interpretation;
- Modelling and analysis process;
- Process of data integration, aggregation, and representation;
- Process of data extraction and cleaning;
- Data acquisition process.
It should be highlighted that the implementation of such a concept, regarding known challenges, requires modern IT techniques and tools.
The concept of Smart Cities is widely described in the literature [6,7,8,9,10,11,12] and requires the reorganization of city life areas (e.g., creation and implementation of modern information and telecommunication technologies for smart city management, root planning, etc.). One of the reasons for this reorganization is the increasing number of vehicles that congest the streets and produce harmful substances that pollute the environment. To counteract this problem, radical steps have been developed to improve the quality of local transport with the objective of making transport more efficient and environmentally friendly. Innovative planning leads to resource optimisation and a reduction of harmful emissions. Efficient management systems provide better planning of routes, networks, and locations in addition to simplified activities that can replace obsolete solutions, outsource transport to “green” carriers, and fulfil transport with less energy-consuming means.
It should be noted that it is necessary to establish effective mechanisms for the management of intelligent transport systems, especially those that will efficiently use large amounts of heterogeneous data to obtain reliable information. The ability to perform analysis and provide decision support alternatives is crucial, whether the task is to evaluate an existing unstructured repository or real-time and archival data sets from various data sources. Motion sensors, surveillance systems, and other detection devices (e.g., radars, lidars, induction loops) are the primary tools to obtain such data (e.g., vehicle speed, frequency, traffic, etc.) and to develop professional analytical systems (Table 1).

Table 1.
Data sources and collection technologies for ITS [13].
Information on the vehicle traffic of different road sections and intersections is crucial for transport companies and local administration [14]. Trend analysis based on historical data is used to plan/develop transport infrastructure in cities and beyond [15]. The measurement of traffic volume is an indicator of congestion, the possible concentration of air and noise pollutants, expected fuel taxes, and toll collection [16,17]. These factors have a great impact on the decision-making process related to the management of smart cities. The impact of each factor has a different rank [18]; however, air emissions likely affect decision-makers the most. Even small changes to emissions affect the perception of transportation means and change attitudes toward the technology used. Although emission reductions in the transport industry have increased significantly, there is a belief that even better results can be achieved by using new tools or by improving the existing ones.
Therefore, we claim that the acquisition of traffic parameters, such as vehicle speed and vehicle type classification, may be improved with the use of vision devices mounted on UAVs. Small unmanned aerial vehicles, known as “drones”, are more often used in traffic analysis. UAVs can perform air operations in places where manned aviation cannot be used (e.g., in dense urban infrastructure), and their usage provides significant economic and environmental benefits with minimal human risk. Methods that use UAVs for traffic testing, unlike other methods, are non-invasive, environmentally friendly, and ready for use in dynamically changing circumstances. Data obtained by UAVs are used for various purposes including surveillance and monitoring, traffic violation recognition, traffic jam management, traffic light optimization, and vehicle trajectory identification. The collected data about road traffic are processed and analysed using specialized algorithms [17,19] to answer research questions related to accident risk assessment, etc.
Despite its enormous advantages, such data requires a lot of computation to obtain reliable and accurate information. An even greater challenge is the integration of these data with data obtained from existing devices in ITS systems. This article discusses the concept of Big Data repositories and how to merge heterogeneous data from stationary devices, UAV cameras, and online map services using so-called cloud computing.
The remainder of this article is organized as follows: Section 2 provides the fundamentals of big data analytics and its heterogeneity; Section 3 and Section 4 describe the methods and main objectives of extending data resources with image information collected using UAVs; Section 4 provides the results of research on combining heterogeneous data from different sources on urban vehicle traffic; and Section 5 presents a discussion of the related work and ends the article with some concluding remarks and suggestions for future work.
2. Big Data and Its Heterogeneity
The term Big Data refers to data repositories so extensive that it is difficult to manage them using existing methods and tools. Difficulties may also result from the way they are collected, stored, searched, shared, analysed, etc. Big Data is characterized by the following properties (i.e., the 4Vs) [20]:
- Large, rapidly growing quantity (volume);
- The need for real-time processing (velocity);
- Various levels of data uncertainty and reliability (veracity);
- Small structuring of the form and standard of writing (variety or heterogeneity).
Using systems with such data collection raises numerous challenges, e.g., the need to use many specialized methods, means, and techniques. When the analysis speed and repository volume need to increase, Big Data processing tools are the most appropriate options [12]. This is especially useful for fast-changing, real-time data repositories. Big Data tools can divide complex tasks into simpler, parallel tasks, thus reducing computational complexity. The Hadoop Distributed File System (HDFS) is one of the basic Big Data tools that simplifies the distributed processing of large data sets with simple programming models. Hadoop YARN (planning and management of data resources) supports various programming models, real-time, and other specific data. Elastic MapReduce (EMR), which works with numeric and symbolic values, and Flume are used to efficiently collect, aggregate, and move large amounts of data. Zookeeper is used to handle the quantity and authenticity of data. One may also use many other high-quality tools to manage large data sets.
The Big Data tools and algorithms that solve the difficulties associated with large amounts of data, distributed data sets, and complex and dynamically changing data features include:
- Pre-processing of heterogeneous, incomplete, uncertain, rare, and multi-source data;
- Extraction, after initial processing, of complex and dynamically changing data;
- Data testing;
- Performing feedback analysis.
Heterogeneity, as mentioned earlier, is one of the basic features of Big Data. Heterogeneous datasets are composed of structured, partially structured, or even completely unstructured data produced by any device capable of transmitting information. Heterogeneous data are any data with a high variability of types, formats, and sources. They have many different types and forms of representation that may be related to each other or completely unrelated. They may be ambiguous and of poor quality, worthless, redundant, and underdeveloped. Heterogeneity can be desirable when increasing the efficiency of local systems, but it can also be an undesirable obstacle to the cooperation between distributed systems. According to the literature, the heterogeneity of data may involve the following aspects:
- Syntactic heterogeneity, which occurs when two data sources are represented with different languages.
- Conceptual heterogeneity, also known as semantic heterogeneity or logical mismatch, which is caused by the following differences in modelling the same domain:
- ○
- Range difference, when two data sources describe different parts of the field studied at the same level of detail but from a unique perspective;
- ○
- Detail difference, when two data sources describe the same part of the domain from the same perspective, but at different levels of detail;
- ○
- Perspective difference, when two data sources describe the same part of the field studied at the same level of detail, but from a different perspective.
- Terminological heterogeneity, which includes name differences for the same entities from different data sources.
- Semiotic heterogeneity, also known as pragmatic heterogeneity, which is defined as the different interpretations of objects by different people.
Implementation of information technologies that integrate functions in any system is commonly known and supported with many solutions. However, the integration and analysis of diverse, heterogeneous data seems to be more challenging (Figure 1). It is important to understand and analyse heterogeneous data in complex IT systems without any delay, and every successful system must be able to handle heterogeneous data.
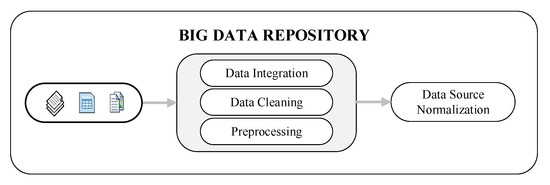
Figure 1.
Integration of data from heterogeneous sources.
There are many challenges throughout the Big Data analysis process, including real-time processing, handling complex data types, simultaneous data processing, etc. To solve these challenges, an appropriate model is required that presents data sources and their actual attributes, relationships, and functions (e.g., scalar measurements, numbers, samples, signals, images, documents, etc.). Such data should be described using appropriate mathematical sets and constructed according to the state of the objects they represent. The presented models should also consider incomplete information, which gives an accurate representation of the real world.
3. Materials and Methods
Significant ITS development has accelerated the pace and direction of data acquisition. Nowadays, data come from many different, unprecedented sources. Whether stationary, portable, or online, the acquired data may be used to detect traffic dependencies (monitoring, incident detection, verification, and classification) faster. Most of these data are generated directly in digital format, which makes their use more convenient. The most popular method of road situation analysis regarding the above issues is based on algorithms created by Google for their Maps functionality. Google Maps generates data during the transmission of GNSS signals between satellites and individual users’ devices (e.g., cell phones or vehicles). The technology used to collect large amounts of data from consumer devices has been called crowdsourcing. Google Maps also has access to local municipality data, such as information about roads, road types, road works, and speed limits. Google uses these data to design algorithms that continuously calibrate and tune predicted travel times.
Figure 2 shows the process of collecting traffic information from the Google application interface. Users of Google services share their location information with Google when they use services such as web browsing, Google Maps, Gmail, YouTube, and similar Google-branded services. The locations shared by thousands of people in each city are connected to Google’s location servers. Using both the information shared by users in real-time and past data, Google’s servers obtain traffic information including the traffic volume on roads, estimated travel time between the origin and destination, the popularity of places, identification of extreme traffic conditions, etc. The methodology for estimating traffic parameters is not disclosed by Google and thus remains unavailable to the public. However, the current traffic volume results are made available to the public in graphical form via Google Maps, and the numerical data are available in the Google API (Application Programming Interface) [21].
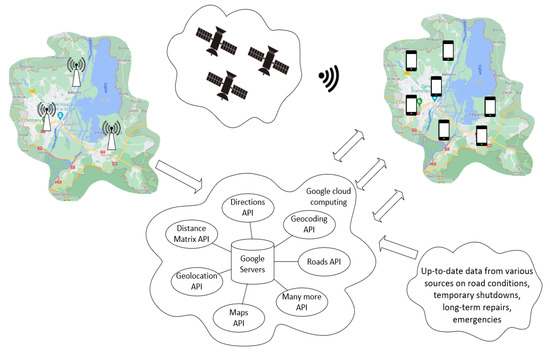
Figure 2.
Google crowdsourcing model. Source: our studies described in [21].
In this paper, the Speeded Up Robust Features (SURF) algorithm for object recognition in motion was used. This algorithm was presented in 2006 at the Computer Vision conference in Gartz, Austria. It is a development of the SIFT (Scale-invariant feature transform) algorithm and, similar to the SIFT algorithm, the SURF algorithm is robust to scale changes and object rotations during the analysis. The main components of this algorithm are feature descriptors and an edge detector. The detector is based on a Hessian matrix:
where Lxx(x,σ) is the result of smoothing filters at point x and the σ scale, and xy is the first derivative in the dx direction and the second derivative in the dy direction (Figure 3) (similarly: Lxy(x,σ), Lyx(x,σ), Lyy(x,σ)). The SURF algorithm uses an approximation similar to the Difference of Gaussians (DoG) method:
where g(x,y) is the filtered image; f(x,y) is the original image; and ω is the filter kernel. However, to simplify the computational complexity, the SURF algorithm is based on a basic Laplacian. In turn, the descriptor describes the distribution of Haar-wavelet responses in the neighbourhood of the point of interest. The individual steps of the algorithm involve finding portions of the image that remain constant, as well as selecting baseline points and evaluating the degree of transformation based on the gradients of the selected areas. Each change in the observed points represents a unique feature that is tracked throughout the image analysis process. The search for points in each successive frame of the image sequence is performed by comparing their fragments with a pattern. However, whole areas are not checked. Only the values of the base points along with their nearest neighbours are checked to detect the offset from the previous image frame. If the values are similar, the object is recognized and labelled. The computation of the Hessian matrix is responsible for the degree of similarity [22].
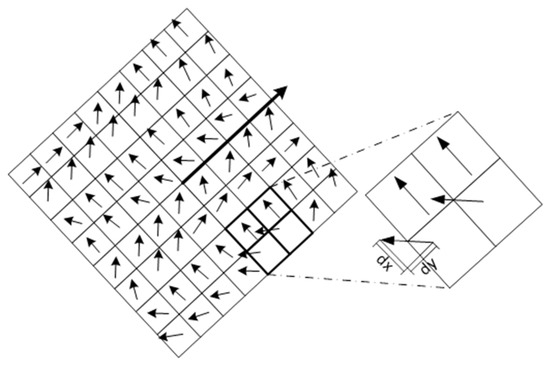
Figure 3.
An example 4 × 4 pixel set showing how the SURF algorithm finds object features and determines the gradient of the points of interest using dx and dy differentials [23].
As a first step to obtaining the SURF descriptor area, it is necessary to build a window around the points of interest. This window consists of the pixels that make up the entries in the descriptor vector. The default size of this window is 20 pixels. The window is divided into a descriptor of 4 × 4 regular subregions. In each of these subregions, regularly spaced samples of points are determined using the Haar wavelet, from which gradients, local minima, and local maxima are examined. The relative and absolute values of the dx and dy vectors shown in Figure 3 are used to gather information for each subregion.
A novel approach is to use two independently operated cameras mounted on unmanned aerial vehicles that collect video footage from two remote points in the city. A schematic of the automatic object detection algorithm used and the comparison of the analysis results to the data collected through the Google Distance Matrix API is shown in Figure 4. The purpose of this study is to propose a method for analysing data on the current traffic situation using real images from cameras mounted on UAVs. The study using two drones was conducted at different times of the day considering peak traffic hours and holidays.
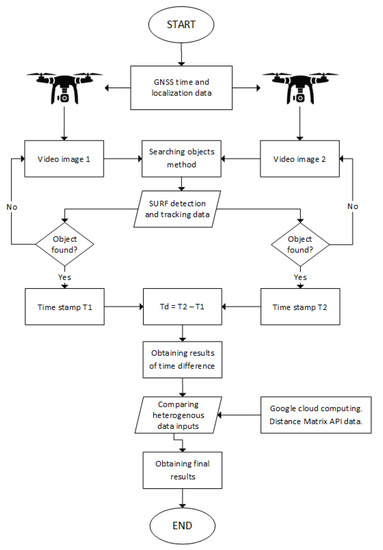
Figure 4.
Algorithm for comparing vehicle travel time results obtained from UAV with data from the Google Distance Matrix API application. Source: our own study.
The data extracted from Google cloud computing contains the travel times proposed by the Google algorithm for different routes at different times of the day considering the estimated vehicle traffic. The getDistance() function [24]:
| function getDistance() { |
| var ss = SpreadsheetApp.getActiveSpreadsheet(); |
| var inputSheet = ss.getSheetByName("Inputs"); |
| var range = inputSheet.getRange("B2:I"); |
| var inputs = range.getValues(); |
| var outputSheet = ss.getSheetByName("Outputs"); |
| var recordcount = outputSheet.getLastRow(); |
| var timeZone = "GMT+5:30"; |
| var now = new Date(); |
| var rDate = Utilities.formatDate(now, timeZone, "MM/dd/yyyy"); |
| var rTime = Utilities.formatDate(now, timeZone, "HH:mm:ss"); |
| var numberOfRoutes = inputSheet.getLastRow()-1; |
was used to automate the data retrieval. Example results of travel time and distance for different routes are shown in Table 2.

Table 2.
Sample of automatic travel time and distance data from Google API.
The sample materials for testing the automatic travel time counting of selected urban vehicles with an emphasis on urban freight transport are shown in Figure 5.

Figure 5.
Sample images for automatic detection of a vehicle moving between two cameras.
Example results of the automatic detection of moving vehicles are shown in Figure 6.
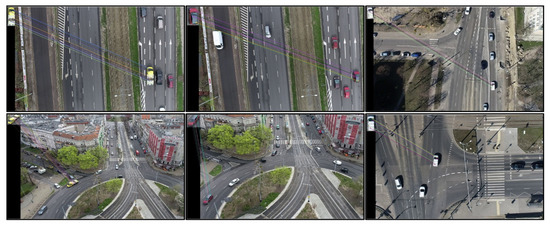
Figure 6.
Example results of image analysis for the automatic detection of moving vehicles. Upper image—camera1; Lower image—camera2.
Based on the data obtained, several analyses can be carried out regarding the distribution of traffic intensity in the selected area. This is a particularly important task in relation to the city’s transport system. At the same time, such a large dataset often makes it difficult to perform optimal analyses due to the time consumption, labour intensiveness, cost, and possibility of unknown systematic errors. Obtaining reliable values requires a well-chosen algorithm and the correct measurement process. Unfortunately, it often turns out that not all measurements give real results, and the data obtained must be simplified or rounded.
4. Results
Preliminary findings and supporting research were completed before the actual research was conducted. Single drone flights were conducted over multiple urban locations including expressways, intersections, traffic circles, and single and multi-lane roads. Several image processing algorithms were analysed and selected to determine the appropriate drone flight altitude. GNSS measurement accuracy tests without RTK (Real Time Kinematic) corrections were performed to avoid time and flight location synchronization problems. Several simplifications were made due to the conceptual nature of the research, including narrowing down to finished vehicle silhouette samples to identify possible problems. However, we did not delve into methods such as deep learning so that we could quickly implement algorithms from the OpenCV library using the Visual Studio environment.
After collecting travel time proposal data from Google’s servers, an attempt was made to find a formula and method to determine travel time based on the actual traffic data in the city. Data from Google Cloud Processing was collected from February to May 2022 on many different routes simultaneously. Figure 7 shows the predicted travel time for only three selected routes leading to the same destination following different intermediate points (it can be observed how much information is collected in just one month).
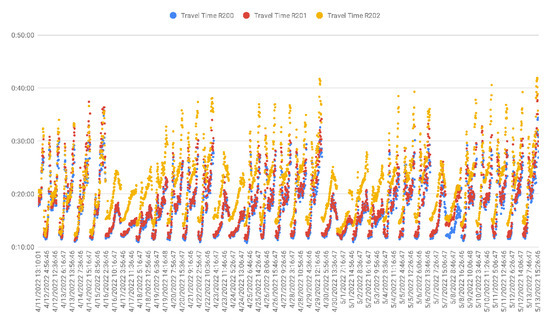
Figure 7.
Google Cloud data from predicted travel times for three routes over a one-month period.
To visualise this situation, the data obtained from various sources (e.g., images from a camera mounted on a drone, measurements obtained online, and GPS forecasts) were correlated. The analysis used the selected measurement data generated over 12 days (Figure 8).
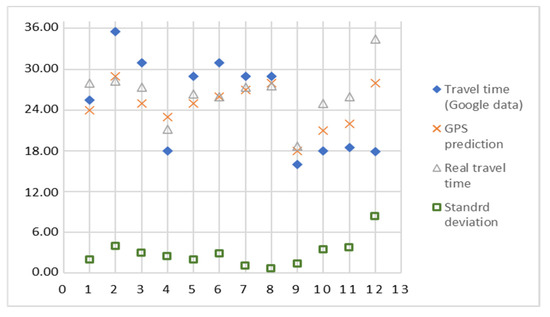
Figure 8.
Comparison of heterogeneous data from different sources (Google Cloud data, UAV flight video data, GNSS data) on travel time for selected routes.
The presented sample data contains driving routes at different times of the day and week, where the real-time data were automatically collected by two UAVs. We observed differences in the prediction errors of the Google data depending on the number of vehicles and the distance. The obtained data varied depending on the specific day (communication peak or holidays) from 16 to 35 min. The standard deviation between the results for subsequent days took values from 0.70 to 8.36. The differences were quite low (except on the last day) but still relevant for enhancing the algorithms and optimizing their sensitivity. The different density of vehicles on the streets, despite the survey being completed during the same hours, was due to working days and holidays (measurements 4 and 9). The largest variances occurred during peak hours of working days and before upcoming holidays (measurements 2 and 12). This study compared different heterogeneous data and identified reasons for the variances. Overall, the automatic measurement using two UAVs shows that it is necessary to include a correction for travel time predictions when using third-party algorithms.
The heterogeneity of the data being compared (i.e., vehicle traffic flow data, travel times, travel speeds, and pixel-based video data) requires the use of multiple assessment criteria to analyse these data and draw appropriate conclusions that can serve as reliable and reproducible information in intelligent transportation systems. Additionally, the variability of conditions and factors that differently affect these inconsistent data makes proper interpretation difficult.
5. Conclusions
This paper proposes a method to combine and analyse heterogeneous data from different sources to improve the quality of travel time forecasting on selected routes in urban agglomerations and reduce harmful emissions. The method could be useful for travel route planning in urban logistics and freight transport. We analyse several technologies and standards, the problems of large data sets (Big Data) and their heterogeneity, heterogeneous contents analytics, and their significance for intelligent transportation systems in smart sustainable cities. We also examined the reliability of available systems, such as Google Maps and Google Cloud Computing, etc., when processing large data sets to obtain reliable information for their users. Despite the purely informative nature of these data, they are often treated as non-questionable. All technologies that generate such data for dynamic modelling focus on supporting and developing effective calibration and monitoring methods in ITS systems. Each of them has different technical characteristics and operating principles that determine the types of data collected, accuracy of the measurements, maturity levels, feasibility, costs, etc.
To make full and proper use of our proposed method, one should know the special conditions that must be fulfilled and the weaknesses of the proposed method. Firstly, the problem of the short battery life of UAVs is known. According to the manufacturer of the vehicle used, batteries last up to a maximum of 30 min of flight, but in practice, it has been shown that there is no more than 25 min of flight on a single battery. Of course, it is possible to change the battery, but testing has shown that this change results in about a two-minute pause in data collection. A solution is to use commercially available platforms for inductive drone charging. Secondly, several conditions need to be considered when selecting and using algorithms for video data processing and analysis. The selection should be performed in a way to represent a balance between efficiency, reliability, and processing time. For the purposes of the proposed concept, this paper uses a simplification consisting of using existing image processing methods with the lowest possible computational complexity to enable real-time analysis. Large feature sets and libraries of all possible objects were not considered, and the topic of artificial intelligence and deep learning was not explored.
Overall, it is possible to draw the conclusion that the proposed method is suitable for use by transport companies and by city authorities. It may enhance existing methods and serve as a tool to plan future transport systems that improve the comfort of life for citizens. The right approach to the problem utilizes existing transport models based on three basic management classes: macro, medium, and microscopic approaches. Such approaches determine the level of analysis details and the use of its results. The proposed concept and IT tools used in it allow one to obtain and analyse macroscopic data without considering detailed parameters such as license plates, current permissions, drivers’ working time, etc. The presented macroscopic concept, when used to analyse vehicle traffic flows, can test the effectiveness of other measurement devices through their verification and ability to exchange heterogeneous data. As it was shown, it is possible to apply such traffic flow measurements without major problems (even in places previously difficult to reach) and without expensive infrastructure changes. This analysis can be carried out in selected elements of a transport network, such as crossroads, road sections, and many other places (depending on the number of UAVs).
Author Contributions
Conceptualization, methodology, validation, formal analysis, investigation, resources, data curation, review and editing, visualization—T.D. and A.K. All authors have read and agreed to the published version of the manuscript.
Funding
This research received no external funding.
Data Availability Statement
Not applicable.
Acknowledgments
This research outcome has been achieved under the GReen And SuStainable—kNowledge EXpanded freight Transport in Cities project financed under the Norwegian Financial Mechanism.
Conflicts of Interest
The authors declare no conflict of interest.
References
- Jagadish, H.V.; Gehrke, J.; Labrinidis, A.; Papakonstantinou, Y.; Patel, J.M.; Ramakrishnan, R.; Shahabi, C. Big Data and Its Technical Challenges. Commun. ACM 2014, 57, 86–94. [Google Scholar] [CrossRef]
- Mikalef, P.; Pappas, I.O.; Krogstie, J.; Giannakos, M. Big Data Analytics Capabilities: A Systematic Literature Review and Research Agenda. Inf. Syst. e-Bus. Manag. 2018, 16, 547–578. [Google Scholar] [CrossRef]
- Shabbir, M.Q.; Gardezi, S.B.W. Application of Big Data Analytics and Organizational Performance: The Mediating Role of Knowledge Management Practices. J. Big Data 2020, 7, 47. [Google Scholar] [CrossRef]
- Batko, K.; Ślęzak, A. The Use of Big Data Analytics in Healthcare. J. Big Data 2022, 9, 3. [Google Scholar] [CrossRef] [PubMed]
- Girtelschmid, S.; Steinbauer, M.; Kumar, V.; Fensel, A.; Kotsis, G. Big Data in Large Scale Intelligent Smart City Installations. In Proceedings of the ACM International Conference on Information Integration and Web-based Applications & Services, Vienna, Austria, 2 December 2013; pp. 428–432. [Google Scholar]
- Haidine, A.; El Hassani, S.; Aqqal, A.; El Hannani, A. The Role of Communication Technologies in Building Future Smart Cities. Smart Cities Technol. 2016, 1, 1–24. [Google Scholar] [CrossRef]
- Nathali, B.; Jung, C.; Kang, J.; Seo, J.; Kim, J.; Han, K.; Khan, M.; Jin, S.; Yoon, Y. Planning of Smart Cities Performance Improvement Using Big Data Analytics Approach. In Proceedings of the Fourth International Conference on Advances in Computing, Electronics and Communication-ACEC, Rome, Italy, 15–16 December 2016; pp. 51–55. [Google Scholar] [CrossRef]
- Małecki, K.; Pietruszka, P.; Iwan, S. Comparative Analysis of Selected Algorithms in the Process of Optimization of Traffic Lights. In Proceedings of the Asian Conference on Intelligent Information and Database Systems, Kanazawa, Japan, 3–5 April 2017; Lecture Notes in Computer Science (Including Subseries Lecture Notes in Artificial Intelligence and Lecture Notes in Bioinformatics). Springer: Berlin/Heidelberg, Germany, 2017; pp. 497–506. [Google Scholar]
- Ganesh, E.N. Development of Smart City Using Iot and Big Data. Int. J. Comput. Tech. 2017, 4, 36–41. [Google Scholar]
- Yadav, P.; Vishwakarma, S. Application of Internet of Things and Big Data towards a Smart City. In Proceedings of the 2018 3rd International Conference On Internet of Things: Smart Innovation and Usages, IoT-SIU 2018, Bhimtal, India, 23–24 February 2018; pp. 1–5. [Google Scholar] [CrossRef]
- Kirimtat, A.; Krejcar, O.; Kertesz, A.; Tasgetiren, M.F. Future Trends and Current State of Smart City Concepts: A Survey. IEEE Access 2020, 8, 86448–86467. [Google Scholar] [CrossRef]
- Stępniak, C.; Jelonek, D.; Wyrwicka, M.; Chomiak-Orsa, I. Integration of the Infrastructure of Systems Used in Smart Cities for the Planning of Transport and Communication Systems in Cities. Energies 2021, 14, 3069. [Google Scholar] [CrossRef]
- Leduc, G. Road Traffic Data: Collection Methods and Applications. Working Papers on Energy, Transport and Climate Change; EUR Number Technical Note; Institute for Prospective Technological Studies (IPTS), Joint Research Centre: Seville, Spain, 2008; p. 47967. [Google Scholar]
- Kijewska, K.; Braga França, J.G.C.; De Oliveira, L.K.; Iwan, S. Evaluation of Urban Mobility Problems and Freight Solutions from Residents’ Perspectives: A Comparison of Belo Horizonte (Brazil) and Szczecin (Poland). Energies 2022, 15, 710. [Google Scholar] [CrossRef]
- Davidich, N.; Galkin, A.; Iwan, S.; Kijewska, K.; Chumachenko, I.; Davidich, Y. Monitoring of Urban Freight Flows Distribution Considering the Human Factor. Sustain. Cities Soc. 2021, 75, 169–178. [Google Scholar] [CrossRef]
- Davidich, N.; Galkin, A.; Davidich, Y.; Schlosser, T.; Capayova, S.; Nowakowska-Grunt, J.; Kush, Y.; Thompson, R. Intelligent Decision Support System for Modeling Transport and Passenger Flows in Human-Centric Urban Transport Systems. Energies 2022, 15, 2495. [Google Scholar] [CrossRef]
- Dey, B.; Kundu, M.K. Turning Video into Traffic Data–An Application to Urban Intersection Analysis Using Transfer Learning. IET Image Process 2019, 13, 673–679. [Google Scholar] [CrossRef]
- Yang, Y.; Yuan, Z.; Chen, J.; Guo, M. Assessment of Osculating Value Method Based on Entropy Weight to Transportation Energy Conservation and Emission Reduction. Environ. Eng. Manag. J. 2017, 16, 2413–2424. [Google Scholar] [CrossRef]
- Outay, F.; Mengash, H.A.; Adnan, M. Applications of Unmanned Aerial Vehicle (UAV) in Road Safety, Traffic and Highway Infrastructure Management: Recent Advances and Challenges. Transp. Res. Part A Policy Pract. 2020, 141, 116–129. [Google Scholar] [CrossRef]
- Jelonek, D. Big Data Analytics in the Management of Business. MATEC Web Conf. 2017, 125, 04021. [Google Scholar] [CrossRef]
- Kumarage, S. Use of Crowdsourced Travel Time Data in Traffic Engineering Applications. Ph.D. Thesis, University of Moratuwa, Moratuwa, Sri Lanka, 2018. [Google Scholar]
- Bay, H.; Tuytelaars, T.; Van Gool, L. SURF: Speeded up Robust Features. In Proceedings of the European Conference on Computer Vision, Graz, Austria, 7–13 May 2006; Lecture Notes in Computer Science (Including Subseries Lecture Notes in Artificial Intelligence and Lecture Notes in Bioinformatics). Springer: Berlin/Heidelberg, Germany, 2006; Volume 3951, pp. 404–417. [Google Scholar]
- Bay, H.; Ess, A.; Tuytelaars, T.; Van Gool, L. Speeded-Up Robust Features (SURF). Comput. Vis. Image Underst. 2008, 110, 346–359. [Google Scholar] [CrossRef]
- Prasanna, B. Automate Google Sheet to Get Google Map Travel Time and Distance. Available online: https://www.bpwebs.com/get-google-map-travel-time-and-distance (accessed on 22 April 2022).
Publisher’s Note: MDPI stays neutral with regard to jurisdictional claims in published maps and institutional affiliations. |
© 2022 by the authors. Licensee MDPI, Basel, Switzerland. This article is an open access article distributed under the terms and conditions of the Creative Commons Attribution (CC BY) license (https://creativecommons.org/licenses/by/4.0/).