Abstract
Performed gels are widely used in fields to support profile modification and Enhance Oil Recovery. Previous studies of profile modification of performed gels mainly used the index of pressure, resistance factor, or residual resistance factor to represent their ability. However, there is a lack of methods available to directly study their modification ability. In this article, the preformed gels with fluorescence properties, CQDs@PPG, would provide a new way to explore the profile modification of preformed gels. This paper uses poly (acrylamide, sodium p-styrene sulfonate), carbon quantum dots, and N,N-methylenebisacrylamide to prepare the CQDs@PPG via inverse emulsion polymerization. The morphology, size distribution, structure, fluorescence characteristics, surface potential thermal stability, viscosity changes, and viscoelastic properties of CQDs@PPG were analyzed. Moreover, the fluorescence properties of CQDs@PPG under different temperature, salinity, and pH were examined. Results indicate that the CQDs@PPG have excellent stability and that pH and salinity have little influence on their fluorescence properties. Further, only the temperature would affect the fluorescence properties of CQDs@PPG, but that effect is reversible after the temperature drops. By examining the fluorescence intensity, it would be more direct for researchers to study the profile modification in further experiments.
1. Introduction
For the last several decades, Enhance Oil Recovery (EOR) methods significantly recovered millions of tons of residual oil, while conventional technologies could not generate around two-thirds of this giant amount of oil production. Not only that, under the current carbon neutrality problem, more efficient EOR methods means lower carbon dioxide emissions, which can benefit human beings’ aim to achieve their goals ahead of schedule [1]. Thousands of methods have been tried or applied in the field to facilitate the enhancement. Some succeed, but some do not. Chemistry injection should be called one of the most capable of these methods. The study of chemical injection started around the 1960s, and the very first field test of polymer injection was conducted in 1964 in the United States. Sixty-one field tests were run over the following five years. Since then, petroleum engineers have discovered the capability of profile modification of chemistry injection. Early chemistry injection mainly focuses on continuous phase products, such as polymer, starch, etc. [2,3,4]. In the year of 1997, BP started a project called “Brightwater”, which used a discontinuous phase, that is, particle gel, to handle the profile modification within the reservoirs [5,6,7], and BP successfully met its expectations regarding “Brightwater” in well B-21i in Alaska [8].
Polymer gels can be characterized by many types. The most thoroughly classified are microgels, Brightwater, preformed particle gels (PPG), small calibrated microgels (SMG), and colloidal dispersion gels (CDG). The commercial products reported include water shut-off microgel [9,10,11], pH resisted SMG [12,13], Brightwater [5,6,14], and preformed CDG [15,16]. Most of the reported commercial particle gels are preformed gels. All their gelation progress is finished on the ground before injection, which means no gelling exists after injection. This on-ground gelation provides the preformed gels with significant resistance to the physicochemical condition within the reservoir, including temperature, pH, and salinity [17,18]. The preformed gels take advantage of various synthetic particle sizes and good dispersibility. Moreover, the uncertainty of gelation time control and gelling failure due to the shearing and dilution are reduced [17,18,19]. Thus far, more than ten thousand successful cases have been reported using a preformed gel as the EOR method [17]. The preformed gel is a new trend with the most substantial potential for EOR, leading to the considerable development of gel preparation in petroleum engineering over the last two decades [20].
Research and studies about preformed gel have never stopped during these years [21,22,23,24]. Chauveteau et al. reported a new type of preform gel and gave the characteristics of the gel in solution, which include size, viscosity, and rheology [25]. They also investigated the gel performances within porous media. The results show that this preformed gel could significantly reduce the partial permeability of the water phase while maintaining oil permeability [25]. Bai et al. introduced a PPG used for profile modification, and their field tests show a positive result [17]. Moreover, this gel could establish a strong resistance factor and residual resistance factor by forming an absorbing layer. Duran–Valencia et al. have reported a new king of nano-PPG with exceptional stability and mechanical properties [26]. Under the environment temperature condition of 130 °C, this nano-PPG maintained its shape and mechanical properties for more than three months. In addition, its welling capacity could reach 9.5 g/g and 53.43 g/g while in 25% TDS and water. Tang et al. investigated a new kind of reinforced preformed gels, in which the maximum degradation temperature could reach above 420 °C [27]. The plugging properties of these reinforced gels is also significant; able to reach a plugging rate of 30%, while the core permeability drops to 0.35 μm2 from an initial 2.17 μm2.
Quantum Dot (QD) is a solid particulate material in an intermediate state between atoms, molecules, and macroscopic objects [28]. It has been widely used as a fluorescence label in the biological and medical fields due to its optical properties [29,30]. The most prominent features of QD materials are their small size and unique optical properties. However, during the application of QD, the fluorescence properties of bare-state quantum dots may be affected by the environment, which limits their applications. Therefore, with the deepening of research, people have begun to propose the preparation of QDs into composite materials for application. The emergence of QDs microspheres is an essential milestone in developing quantum dot materials, significantly expanding the application of QD materials. Unfortunately, only a few journals were reported to study the microgels’ or preformed gels’ properties by applying any QDs or fluorescence technologies.
This article presents one kind of preformed gel with fluorescence properties, CQDs@PPG. The fluorescence properties of the CQDs@PPG are achieved by synthesized carbon quantum dots (CQDs), and their structure, optics, size distribution, and stability have been analyzed to prove successful synthesis. In addition, after the synthesis of CQDs@PPG, their structural and optical properties, swelling ability, viscoelastic properties, and fluorescence properties have been characterized. Furthermore, checks of their abilities and properties have also been run under reservoir conditions to test the stability of CQDs@PPG in harsh environments. The results show the excellent stability of CQDs@PPG, especially their fluorescence properties. Since the CQDs are synthesized on the microspheres, the fluorescence can more intuitively reflect the migration of the microspheres. Therefore, as a kind of performed gel with fluorescence properties, it would help us to study the profile modification of preformed gels deeper and more directly in further examinations.
2. Materials and Methods
2.1. Materials and Chemicals
All chemicals are commercial products and were used with no further purification. Poly (Acrylamide (AA)), and crosslinking (N,N′-methylenebisacrylamide (MBAA)) were purchased from Chengdu Kelong Chemical Co., Ltd. (Chengdu, China). Poly (Sodium styrenesulfonate (SSS)) was purchased from Hangzhou Gaosheng Biotechnology Co., Ltd. (Hangzhou, China). Emulsifier (Sorbitan monooleate polyoxyethylene ether (Tween 80), Sorbitan fatty acid ester (Span 80)) was purchased from Jiangsu Aikon Co., Ltd. (Nanjing, China). Ammonium persulfate, sodium bisulfite, sodium hydroxide, acetone, glucose acid, citric acid, malic acid, Ethylenediamine, anhydrous ethanol, and potassium bromide were all analytically pure and purchased from Chengdu Kelong Chemical Co., Ltd. (China). Electronic Analytical Balance was purchased from Sartorius (Goettingen, Germany). The high-temperature hydrothermal reactor was purchased from Nanjing Zhengxin Co., Ltd. (Nanjing, China). A high-speed centrifuge was purchased from Shanghai Kehua Co., Ltd. (Shanghai, China). The ultrasonic cleaner was purchased from Shanghai Kedao Ultrasound Instrument Co., Ltd. (Shanghai, China). The rotary evaporator was purchased from Shanghai Heqi Glassware Co., Ltd. (Shanghai, China). The Field-Emission Transmission Electron Microscopy was purchased from FEI (US). The Fourier transform infrared spectrometer was purchased from Beijing Beifen-Ruili Analytical Instrument Co., Ltd. (Beijing, China). The UV-visible spectrophotometer was purchased from Shanghai Youke Instrument Co., Ltd. (Shanghai, China). The fluorescence spectrophotometer was purchased from PerkinElmer (Ohio, US). The synchronous comprehensive thermal analyzer was purchased from NETZSCH (Selb, Germany).
2.2. Synthesis of the Carbon Quantum Dots (CQDs)s
The technique of synthesis of the Carbon Quantum Dot has been previously developed, and in this paper, the procedure of Wang et al. [31] was followed. In addition, we used AM as the monomer, SSS as temperature-resistant functional monomer, CQDs as fluorescent functional monomer, MBAA as initiator, Span 80 and Tween 80 as an emulsifier, ammonium persulfate, and sodium bisulfite as redox initiators, and white oil as the continuous phase (Figure 1). The appropriate amounts of gluconic acid, citric acid, and malic acid were weighed and dissolved in 30 mL of pure water. Then, ethylenediamine was added through the micro-injector according to the molar ratio of the carbon source and nitrogen source, 1:1 and 1:2. After stirring and dispersing evenly, it was transferred to a high-temperature hydrothermal reactor. The solution was allowed to react for 6 h in an oven at 200 °C. After the reaction was completed, it was cooled to obtain an aqueous solution of carbon quantum dots. The solution was transferred to a high-speed centrifuge for 30 min. The supernatant was taken and filtered with a water filter membrane with a diameter of 0.22 μm. Then, the filtrate was transferred into a dialysis bag within a beaker of pure water and allowed to dialysis for 12 h on a magnetic stirrer. The aqueous solution was placed into a rotary evaporator with anhydrous ethanol added to the aqueous. Moisture was removed from the mixing solution using a rotary evaporator at 50 °C, and dry carbon quantum dot powder was obtained after another 6 h drying in an oven.
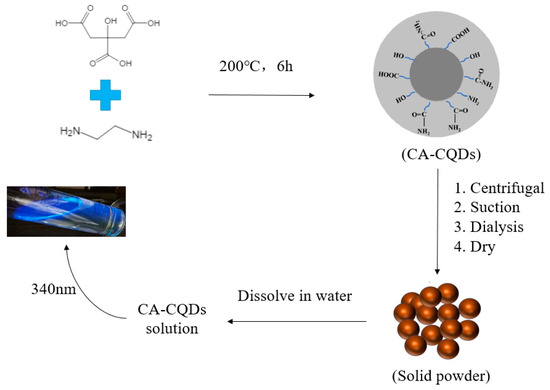
Figure 1.
Preparation and purification process of fluorescent carbon quantum dots.
2.3. Synthesis of CQDs@PPG
In this section, the preparation of CQDs@PPG is through Inverse Emulsion Polymerization [32]. AA with a double bond is polymerized with SSS under certain conditions to obtain some linear macromolecules. At the same time, MBAA with multiple double bonds is cross-linked with linear macromolecules to obtain polymer microspheres. In the process of cross-linking polymerization, small-sized CQDs enter the polymerization site and form hydrogen bonds with certain molecules in polymer microspheres, thereby forming CQDs@PPG. The procedure includes (Figure 2 and Table 1):
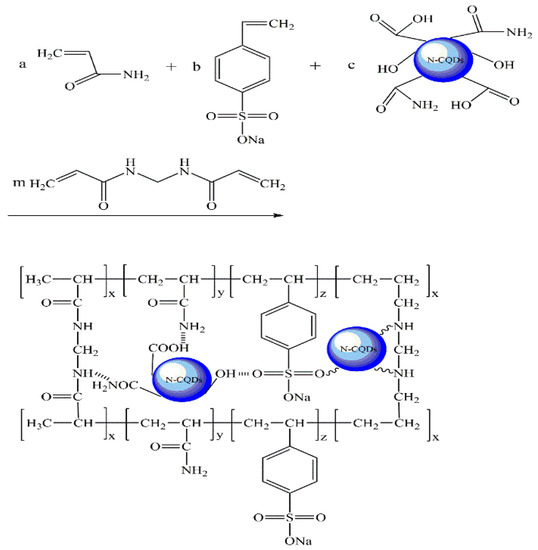
Figure 2.
Principle diagram of fluorescence microsphere preparation.

Table 1.
Polymerization and monomer molecules.
- Oil phase: weigh 2.24 g of Span 80 and 0.56 g of Tween 80, and add them into 50 g of white oil in a four-necked flask, stirring well to make it evenly mixed.
- Aqueous phase: weigh 13.0 g of AA, 3.0 g of SSS, 0.8 g of dry CQDs, and 0.3 g of MBAA into 30 g of pure water, stir well to make it evenly mixed. Adjust pH to neutral with NaOH standard solution, then add 0.0313 g sodium bisulfite and stir well.
- Preparation of CQDs@PPG: After building the synthesis device, add a magnetic stirring bar to the four-necked flask containing the oil phase, turn on the stirring switch, and set the rotating speed to 400 r/min. Slowly drop the aqueous phase into the oil phase with a constant-pressure dropping funnel to obtain a W/O emulsion. Continue the stirring while injecting nitrogen for 30 min to remove oxygen altogether, and then add 0.0687 g of ammonium persulfate aqueous solution dropwise under nitrogen protection. Rising the environmental temperature to 45 °C for 4 h of reaction, and the CQDs@PPG emulsion was obtained by cooling the product to room temperature. Demulsify and wash it with acetone and absolute ethanol, and then the mixture was centrifuged at 6000 r/min. Remove the supernatant and wash with ethanol again, then filter to obtain CQDs@PPG precipitation. Finally, dehydrate the precipitation for 12 h in the oven to collect CQDs@PPG powder.
2.4. Optimized Synthesis of CQDs@PPG
To obtain an exceptional particle size, monomer conversion rate, and fluorescence peak of CQDs@PPG, the synthesis conditions detailed were considered. The conditions include the dosage amount of monomer/initiator/emulsifier and reaction time and temperature. Particle size distribution was gained by using a particle size analyzer. The monomer conversion rate was calculated using the following equation:
where M represents all using amount of monomer, g; m represents the weight of the dry CQDs@PPG powder, g and Q is the monomer conversion rate, dimensionless. Moreover, the fluorescence peak of CQDs@PPG is tested by a fluorescence spectrophotometer.
Orthogonal Design
Five factors, which are the dosage amount of SSS/CQDs/MBAA/initiator/emulsifier, were selected to be optimized. Four levels were set for the above five factors, respectively, and an orthogonal experiment was carried out with five factors and four levels (Table 2 and Table 3).

Table 2.
L16 (45) Orthogonal design.

Table 3.
L16 (45) Orthogonal test and results.
Taking the particle size, the monomer conversion rate, and the fluorescence peak value of CQDs@PPG as evaluation indicators, the total of the same level (K), an average of the same level (k), and the range (R) were calculated and listed in Table 4. Moreover, the optimum procedure conditions are A2B2C1D3E4. Specifically, the SSS, CQDs, MBAA, initiator, and emulsifier dosages were 15 wt%, 4 wt%, 1.5 wt%, 0.5 wt%, and 12 wt%, respectively. In addition, the degree of factors were CQDs > SSS > initiator > MBAA > emulsifier.

Table 4.
Analysis of L16 (45) Orthogonal Test Results.
2.5. Influence of Single Factor on CQDs@PPG
2.5.1. Influence of CQDs Dosage on CQDs@PPG
To study the influence of each factor, the experiments control the other factors as fixed qualities. As shown in the orthogonal experiment results the SSS, MBAA, initiator, and emulsifier dosages were set at 15 wt%, 1.5 wt%, 0.5 wt%, and 12 wt%, respectively. Moreover, the synthesis temperature was adjusted to 50 °C for 5 h and the stirring speed was set to 300 r/min. The orthogonal experiment results advise that the appropriate dosage of CODs is 4 wt%. Therefore, five synthesis tests were run with CQDs dosages of 2 wt%, 3 wt%, 4 wt%, 5 wt%, and 6 wt% to determine the optimal dosage of CQDs.
The synthesis test results are shown in Table 5 and Figure 3. With the increase of CQDs dosage, the particle size of CQDs@PPG first decreased and then increased, and both the monomer conversion rate and fluorescence peak increased first and then decreased. When the performed gel (PPG) can interact with more CQDs, the gelation time is shortened, resulting in smaller particle size and increasing the monomer conversion rate and fluorescence peak. However, when CQDs dosage reaches a critical point and the interaction between CQDs and PPG reaches its peak, the gelation time stops shortening. Therefore, the particle size starts growth and the monomer conversion rate and fluorescence peak drop.

Table 5.
Influence of CQDs dosage on CQDs@PPG.
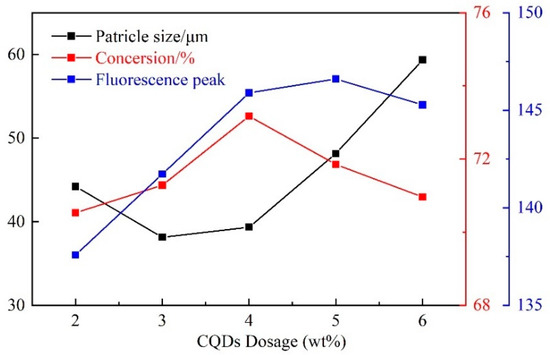
Figure 3.
Influence of CQDs dosage on CQDs@PPG.
2.5.2. Influence of SSS Dosage on CQDs@PPG
For the same idea and similar procedure, five synthesis tests were set with SSS dosages of 13 wt%, 14 wt%, 15 wt%, 16 wt%, and 17 wt% (Table 6 and Figure 4).

Table 6.
Influence of SSS dosage on CQDs@PPG.
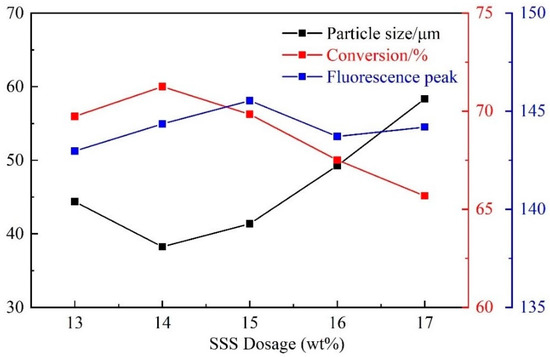
Figure 4.
Influence of SSS dosage on CQDs@PPG.
With the increase of SSS dosage, the particle size first decreased and then increased, and the monomer conversion rate and fluorescence peak first increased and then decreased (Figure 4). This is similar to the influence of CQDs dosage on CQDs@PPG, and is caused by the peak of SSS dosage. Hence, the optimal dosage of SSS is 14 wt%.
2.5.3. Influence of Initiator Dosage on CQDs@PPG
Five tests were run with initiator dosages of 0.3 wt%, 0.4 wt%, 0.5 wt%, 0.6 wt%, 0.7 wt% (Table 7).

Table 7.
Influence of initiator dosage on CQDs@PPG.
As shown in Figure 5, with the increase of initiator dosage, the particle size first decreased and then increased, and the monomer conversion rate and fluorescence peak first increased and then decreased. The particle size is the smallest when the initiator dosage is 0.4 wt%, while the monomer conversion rate and fluorescence peak are the largest. When the content of the initiator is small, the content of free radicals generated is small, which makes the polymerization reaction slow or insufficient. As a result, the particle size of the product is larger, and the monomer conversion rate and fluorescence peak are lower. On the other hand, when the initiator content is too large, the polymerization reaction rate is accelerated and the reaction is terminated early. As a result, the particle size increases while the monomer conversion rate and fluorescence peak decrease. The optimum addition amount of initiator is chosen as 0.4 wt%.
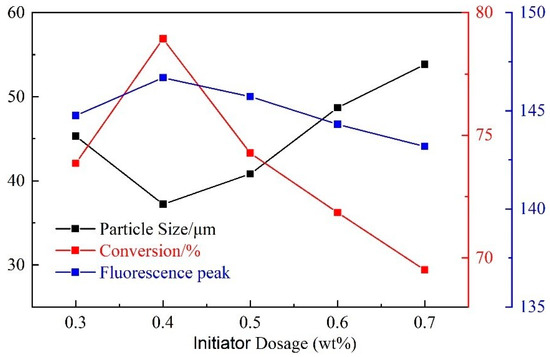
Figure 5.
Influence of initiator dosage on CQDs@PPG.
2.5.4. Influence of MBAA Dosage on CQDs@PPG
The tests of the influence of MBAA dosage on CQDs@PPG were set with MBAA dosages of 1.3 wt%, 1.4 wt%, 1.5 wt%, 1.6 wt%, and 1.7 wt% (Table 8).

Table 8.
Influence of MBAA dosage on CQDs@PPG.
With the increase of the crosslinking agent, the particle size first decreased and then increased, and the monomer conversion rate and fluorescence peak first increased and then decreased (Figure 6). When the dosage of added crosslinking agent is small, the effective crosslinking degree of the polymer microspheres is poor, leading to a low monomer conversion rate and fluorescence peak. In addition, the chain-like polymer molecules are entangled with each other, increasing particle size. However, when the content of the crosslinking agent is too large, the crosslinking agent is prone to self-cross-linking, so the effective use rate of the crosslinking agent is low. Moreover, the particle size becomes larger while the monomer conversion rate and fluorescence peak decrease. For optimum consideration, the dosage of crosslinking agent is 1.5 wt%.
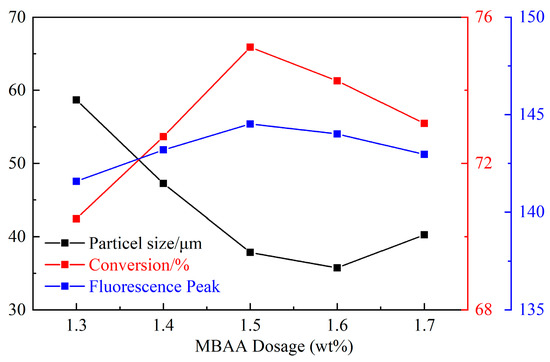
Figure 6.
Influence of MBAA dosage on CQDs@PPG.
2.5.5. Influence of Emulsifier Dosage on CQDs@PPG
The tests were set with emulsifier dosages of 10 wt%, 11 wt%, 12 wt%, 13 wt%, and 14 wt% (Table 9).

Table 9.
Influence of emulsifier dosage on CQDs@PPG.
With the increase of the emulsifier dosage, the particle size first decreased and then increased, and the monomer conversion first increased and then decreased with no significant change in fluorescence peak (Figure 7). When the emulsifier content is too low, fewer micelles are formed, and fewer places for the polymerization of monomers occur. Hence, the particle size of the product is larger, and the conversion rate of monomers is lower. However, when the emulsifier content is too high, a large number of small micelles form large micelles under stirring conditions, which can coat more monomers for polymerization, thus forming a product with a larger particle size. In addition, too much monomer in the micelle creates a condition in which it is not easy for the monomer to enter other micelles for polymerization, so the monomer conversion rate is slightly reduced. Therefore, the optimum dosage of the emulsifier is 12 wt%.
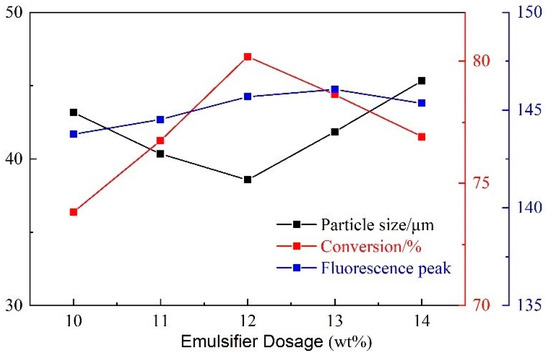
Figure 7.
Influence of emulsifier dosage on CQDs@PPG.
2.5.6. Influence of Synthesis Temperature on CQDs@PPG
After determining the dosage of monomers and others, five tests were carried out to study the influence of synthesis temperature on CQDs@PPG with a temperature range of 40 °C, 45 °C, 50 °C, 55 °C, and 65 °C (Table 10).

Table 10.
Influence of synthesis temperature on CQDs@PPG.
With the increase of reaction temperature, the particle size first decreased and then increased, and the monomer conversion rate and fluorescence peak first increased and then decreased (Figure 8). When the reaction temperature is low, the number of free radicals is also low, leading to a low polymerization reaction rate and insufficient reaction. Therefore, the particle size of the polymer microspheres is larger, and the monomer conversion rate and fluorescence peak become lower. Further, when the reaction temperature is too high, the molecular Brownian motion is intensified, and the number of free radicals generated is too large. As a result, the formation of more latex particles makes the polymerization reaction terminate early. Hence, the particle size of the product becomes larger, and the monomer conversion rate and fluorescence peak decrease. For better synthesis, the optimum synthesis temperature is 45 °C.
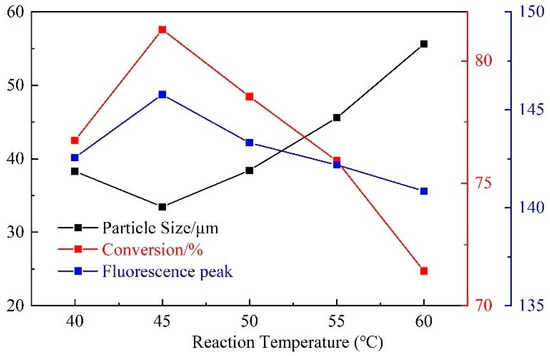
Figure 8.
Influence of synthesis temperature on CQDs@PPG.
2.5.7. Influence of Reaction Duration Time on CQDs@PPG
Similarly, five tests were launched with duration times of 3 h, 4 h, 5 h, 6 h, and 7 h (Table 11).

Table 11.
Influence of reaction duration time on CQDs@PPG.
With the increase of duration time, the particle size first decreased and then increased, and the monomer conversion rate and fluorescence peak first increased and then decreased (Figure 9). This is because a short duration leads to incomplete monomer polymerization, insufficient reaction, and low crosslinking degree, resulting in a large particle size and insignificant monomer conversion rate and fluorescence peak. Further, when the reaction time is too long, the latex particles stick to each other, which reduces the surface area and makes it more difficult for unreacted small-molecule monomers to participate in the reaction. As a result, the particle size becomes larger, and the monomer conversion rate and fluorescence peak decrease.
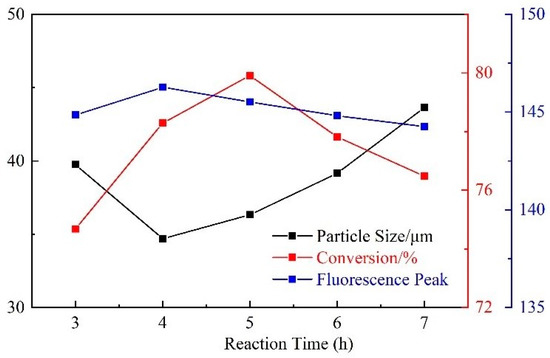
Figure 9.
Influence of reaction duration time on CQDs@PPG.
2.5.8. Influence of Stirring Speed on CQDs@PPG
Tests were run with stirring at 100 r/min, 200 r/min, 300 r/min, 400 r/min, and 500 r/min (Table 12).

Table 12.
Influence of stirring speed on CQDs@PPG.
With the increase of stirring speed, the particle size first decreased and then increased, and the monomer conversion rate and fluorescence peak first increased and then decreased (Figure 10). When the stirring speed is small, the water phase monomers are dispersed into larger droplets in the oil phase. The mass transfer and heat transfer process at this time is slow, and the polymerization reaction is insufficient. Thusly, the product would have a larger particle size, and the monomer conversion rate and fluorescence peak are low. When the stirring speed is too fast, some of the intermediate polymerization products will collide and bond, affecting the continuous nucleation stage during the polymerization process. Therefore, the particle size of the polymerization product starts to increase, and the monomer conversion rate and fluorescence peak starts to decrease. For an optimum, stirring speed is controlled at 400 r/min.
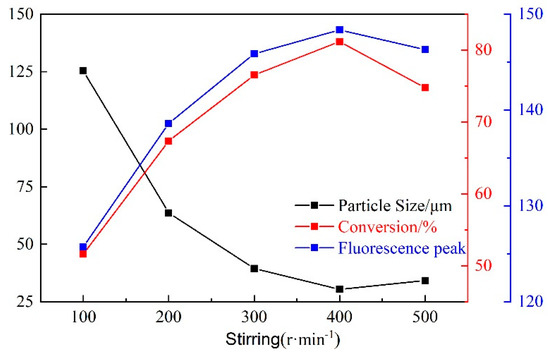
Figure 10.
Influence of stirring speed on CQDs@PPG.
2.5.9. Optimizing Synthetic Analysis Results
The amount of carbon quantum dots added was 4 wt%. The optimum addition amount of initiator was chosen as 0.4 wt%. The optimum usage of MBAA and emulsifier was 1.5 wt% and 12 w%, respectively. Synthetic time was controlled at 4 h under 45 °C via stirring speed at 400 r/min.
3. Results and Discussion
3.1. Characterization of CQDs
Transmission electron microscopy (TEM) shows that the CQDs are spherical particles of uniform size, with diameters below 10 nm (Figure 11A). The particle size of CQDs shows a normal distribution, with an average particle size of about 5.36 nm, which is roughly consistent with the morphology and size of carbon quantum dots in the literature [31]. Figure 11B shows the infrared spectra of anhydrous citric acid and CQDs. In the infrared spectrum of citric acid, the 3395 cm−1 absorption band corresponds to the stretching vibration of O-H, the 2914 cm−1 absorption band is due to the C-H stretching vibration in the saturated carbonmethylene group, the sharp peak at 1725 cm−1 corresponds to the stretching vibration of -C=O in the carboxyl group. In the infrared spectrum of CQDs, multiple absorption bands are displayed from 3500 cm−1 to 3800 cm−1, which might be caused by the O-H stretching vibration in different environments. The weak absorption band at 3233 cm−1 corresponds to the stretching vibration of N-H in the amide group, which proves that the dehydration reaction of carboxyl and amino groups in carbon quantum dots successfully introduces the N element. Furthermore, the double peaks at 1694 cm−1 and 1649 cm−1 are caused by stretching vibration of -C=O in the amide group, which confirms the introduction of the N element. Moreover, the continuous absorption band at 1511 cm−1 corresponds to the skeleton vibration of the benzene ring, while the peaks at 1057 cm−1, 840 cm−1, and 690 cm−1 might be caused by the bending vibration of C-H in the aromatic ring. In addition, this finding indicates that the surface of CQDs may contain some aromatic ring structures, so they exhibit excellent biochemical stability.
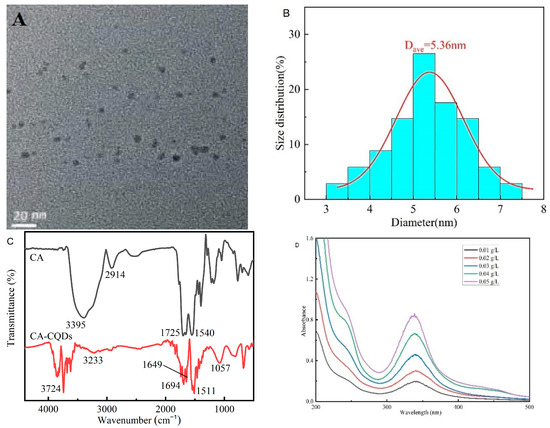
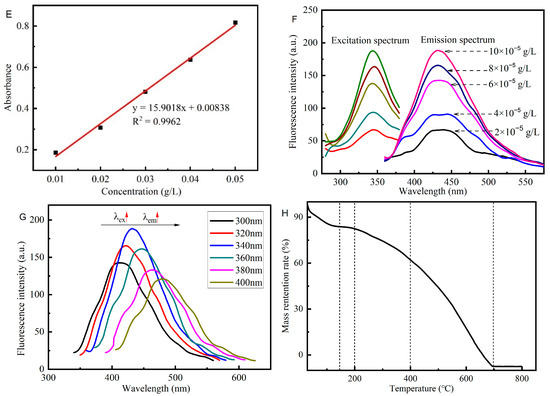
Figure 11.
Characterization of the structural and optical properties of the CQDs: (A) Transmission electron microscopy (TEM) images of the CQDs. (B) Size distribution of the CQDs. (C) The infrared spectrum of the CQDs and citric acid. (D) UV spectrum of the CQDs. (E) Curve Fitting Plot of UV spectrum of the CQDs. (F,G) Fluorescence spectra of CQDs. (H) Thermogravimetric Analysis (TGA) of CQDs.
The ultraviolet-visible spectroscopy of CQDs is shown in Figure 11D. The CQDs have a strong absorption band in the near-ultraviolet region, and the optimal absorption wavelength is 340 nm, which may be caused by the n-π* transition of -C=O in CQDs to the stretching vibration peak of -C=O in the infrared spectrum. At the same time, the CQDs have a continuous strong absorption band around 200 nm, which may be formed by multiple conjugated double bonds π-π* transitions, which indirectly indicates that CQDs may contain aromatic rings structures. In addition, in a specific concentration range, the absorbance of CQDs exhibits a satisfactory linear relationship with the concentration, so the absorbance can be used to quantitatively analyze their concentration (Figure 11E).
Figure 11F,G show that the CQDs have a strong fluorescence emission band in the range of 415 nm–455 nm, and the optimal emission wavelength λem = 435 nm. The excitation and emission spectra show an apparent mirror-image relationship, indicating that the CQD molecules change little when transitioning from the ground state to the excited state, and exhibit the same vibrational energy level interval. In addition, the CQDs exhibit obvious excitation wavelength dependence. When the excitation wavelength gradually increased from 300 nm to 400 nm, the fluorescence intensity value of the emission spectrum increased and then decreased. Further, the fluorescence intensity value reaches a maximum at 340 nm, and the emission peak of the corresponding emission spectrum is red-shifted as the excitation wavelength increases. This fluorescence tunability may be due to the fact that the relaxation rate of fluorescence lifetime of the oxygen-containing group-related fluorophore dipoles in the CQDs is close to that between the solvent dipoles, so the localized electron density experiences longer excited states recombination, resulting in a red-edge effect. This feature can be applied to fluorescence resonance energy transfer technology.
As shown in Figure 11H, below 150 °C, the sample has partial weight because the water molecules encapsulated by the CQD material gradually volatilize during the heating process, resulting in a decrease of the quality of the sample. Furthermore, with the temperature continuing to rise, the TGA results of CQDs show that the quality of samples gradually decreases. When the temperature was raised to 200 °C, the sample began to lose weight uniformly because the oxygen-containing groups on the surface of the CQDs were decomposed into CO2 and H2O. Moreover, when the temperature reaches 400 °C, the C=C on the aromatic ring in the carbon quantum dots begins to break. As the temperature increases, the amide group also begins to cleave. This may be accompanied by the combustion and decomposition of part of the C skeleton, so the rate of weight loss increases slightly. The TGA of CQDs shows that they have good thermal stability.
3.2. Characterization of CQDs@PPG
Figure 12A shows the CQDs@PPG have a regular spherical shape and are evenly dispersed in water with a clear sense of layering. At the same time, it can be seen that their absorbance of them is different, indicating that the interaction degree between the CQDs and the microspheres is different. Hence, it demonstrated successful preparation. Under Scanning Electron Microscope (SEM), CQDs@PPG have complete rules, good spheroidization, large specific surface area, and relatively uniform size of microspheres (Figure 12B). SEM measurement shows a relatively concentrated size distribution with a median of 28.32 μm in the range of 10–40 μm (Figure 12D). The size distribution measured by particle size analyzer is slightly wider than above. It shows a distribution range of 10–60 μm with a median of 30.84 μm (Figure 12E). Both results demonstrate a uniform and normal size distribution.
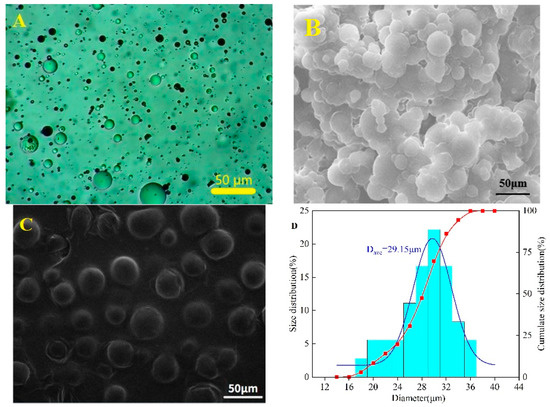
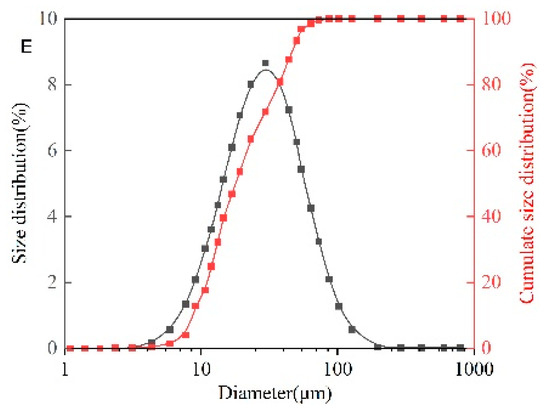
Figure 12.
Characterization of structure of CQDs@PPG: (A) Morphology of CQDs@PPG via microscope. (B) SEM image of CQDs@PPG. (C) SEM measurement of CQDs@PPG image. (D) Size distribution of CQDs@PPG via SEM measurement. (E) Size distribution of CQDs@PPG via particle size analyzer.
The Infrared spectroscopy of CQDs@PPG is similar to the superposition of that of gel and CQDs (Figure 13A). The CQDs@PPG have a broad absorption band around 3500 cm−1, indicating that there are multi-molecularly associated O-H and N-H in the preformed gel. There are sharp double absorption peaks at 2931 cm−1 and 2858 cm−1, indicating an existing methylene structure. The peak at 1616 cm−1 and 1108 cm−1 present a benzene ring skeleton and sulfonate group, respectively. In other words, polymerization proceeds as expected and successfully interacts with CQDs to form CQDs@PPG. Figure 13B shows a shift of 14 nm of fluorescence emission peak from 435 nm to 449 nm compared with CQDs and CQDS@PPG. This shift might be caused by hydrogen bonds and other conjugated structures in the CQDs@PPG. In addition, with the increase in the concentration of the CQDs@PPG dispersion, the shape and peak position of the emission spectrum of CQDS@PPG did not change significantly, but the fluorescence intensity increased significantly (Figure 13C). Further, considering the peak values as the fluorescence intensity, a linear relationship exists between concentration and fluorescence peak (Figure 13D, Equation (2)).
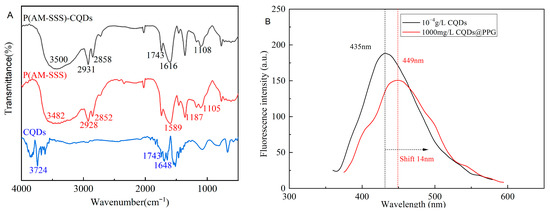
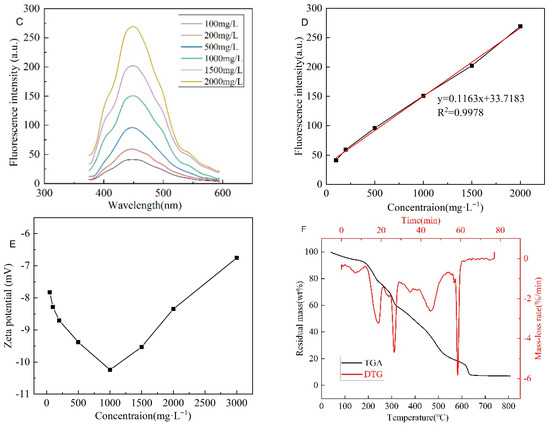
Figure 13.
Characterization of optical properties of CQDs@PPG: (A) Infrared spectroscopy of CQDs@PPG and relevant matters. (B) Fluorescence Spectrum of CQDs and CQDs@PPG. (C) The emission spectrum of CQDs@PPG with different concentrations. (D) The fitting plot of the Emission spectrum of CQDs@PPG with different concentrations. (E) Zeta potential of CQDs@PPG. (F) TGA of CQDs@PPG.
Where y is the fluorescence peak of CQDs@PPG, and x is the concentration of CQDs@PPG dispersion. The correlation could achieve 0.9978; hence, within a specific concentration range, the emission peak could be used to determine the concentration of CQDs@PPG dispersion. According to Figure 13E, with the increase of the concentration, the Zeta potential of the dispersion first decreased and then increased. The minimum value appears at a concentration of 1000 mg/L, indicating that the dispersion tends to be more stable at 1000 mg/L. As shown in Figure 11F, the mass of the CQDs@PPG sample gradually decreases with the increase of temperature, and its weight loss process mainly occurs in three stages. The first stage is before 230 °C, mainly caused by the thermal decomposition of water molecules and small-molecular compounds within the CQDs@PPG powder. The second stage occurs at a temperature between 260 °C and 400 °C, because oxygen-containing groups, amide groups, and sulfonic acid groups are broken and decomposed. In the third stage, at a temperature between 450 °C and 620 °C, the molecular chain of the microspheres begins to break and fall off, and may be accompanied by the combustion and decomposition of the carbon skeleton, so the weight loss rate is significantly accelerated.
3.3. Fluorescence Performance Test
From Figure 14A–G, it can be seen that none of the swelling time, temperature, salinity, and pH significantly impact the fluorescence properties of CQDs@PPG. The fluorescence intensity loss of 4.7% after CQDs@PPG swells for 30 days. In addition, even if the salinity rises to 100,000 mg/L, the fluorescence intensity loss is less than 2.8%. However, the fluorescence reaction does become weaker when the temperature and pH rise to a critical point. When the temperature reaches 100 °C, the fluorescence intensity would have a 12.1 to 17.2% loss, depending on concentration. When the pH of the environment varies greatly, the fluorescence intensity loss could reach a maximum of 16.4%. As a result, while using this fluorescence reaction to study the migration and plugging of CQDs@PPG, the influence of temperature and pH should be considered.
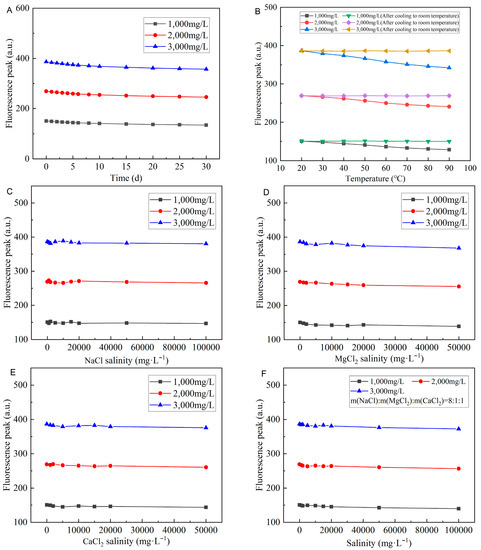
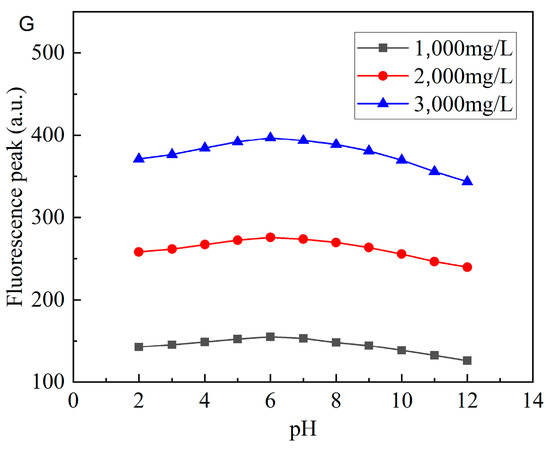
Figure 14.
Characterization of fluorescence properties of CQDs@PPG: (A) Fluorescence peaks change over time. (B) Fluorescence peaks change over temperature. (C) Fluorescence peaks change over in-creasing NaCl salinity. (D) Fluorescence peaks change over increasing MgCl2 salinity. (E) Fluo-rescence peaks change over increasing CaCl2 salinity. (F) Fluorescence peaks change over in-creasing salinity. (G) Fluorescence peaks change over pH.
The literature review about fluorescent PPG in the oil industry is lacking, but studies in the medical industry are easier to find. Li et al. synthesized a Quantum Dot for antigen detection [28]. Since it is a medical application, compared with CQDs@PPG, the temperature and pH resistance of Quantum Dot are insufficient. The fluorescence performance tests prove CQDs@PPG have a significant temperature, salinity, and pH resistance, which would help further study the plugging and migration of CQDs@PPG in porous media. The tracer CQDs are wrapped within the particle gel and move along with the particle gel. By using fluorescence detection technology, the migration, plugging, and bridging track would be clear at a glance. In addition, further studies about CQDs@PPG in porous media would contribute to the studies of profile modification.
4. Conclusions
Characterization of synthesized CQDs and CQDs@PPG has been carried out. CQDs were synthesized with a molar ratio of citric acid and ethylenediamine of 1:2 by hydrothermal method. The results show that the CQDs are spherical particles below 10 nm, which proves the successful synthesis of carbon quantum dots. The optimal synthesis conditions have been confirmed based on the successful synthesis of CQDs and orthogonal experiments. Characterization of CQDs shows they have excellent fluorescence properties and thermal stability at 200 °C.
Further, the fluorescence properties of CQDs@PPG would also not be impacted by environmental conditions. Based on the fluorescence performance experiments, during 30 swelling days, the loss of fluorescence intensity of CQDs@PPG is less than 4.7%. While in a high-salinity environment, the fluorescence intensity of CQDs@PPG fluctuates no more than 2.8%. Temperature affects CQDs@PPG the most; when the temperature reaches 100 °C, the fluorescence intensity lost could reach up to 17.2%. Based on this superior advantage of fluorescence properties, the CQDs@PPG could be a possible way for us to go a step further in researching the profile modification performance of performed gels.
Author Contributions
Conceptualization, D.W.; methodology, N.L. and D.W.; experiments andformal analysis: D.W. and J.W.; supervision, N.L. and L.T. funding acquisition: N.L.; writing, review and editing, D.W. All authors have read and agreed to the published version of the manuscript.
Funding
This paper is subsidized by the project of the key laboratory of well stability and fluid & rock mechanics in Oil and gas reservoir of Shaanxi Province, Xi’an Shiyou University (No. WSFRM20210402001); Also supported by the Opening Project of Oil & Gas Field Applied Chemistry Key Laboratory of Sichuan Province (NO. YQKF202010).
Data Availability Statement
Not applicable.
Conflicts of Interest
The authors declare no conflict of interest.
References
- Liu, E.-B.; Peng, Y.; Peng, S.-B.; Yu, B.; Chen, Q.-K. Research on low carbon emission optimization operation technology of natural gas pipeline under multi-energy structure. Pet. Sci. 2022. [Google Scholar] [CrossRef]
- Fang, Y.; Yang, E.; Guo, S.; Cui, C.; Zhou, C. Study on micro remaining oil distribution of polymer flooding in Class-II B oil layer of Daqing Oilfield. Energy 2022, 254, 124479. [Google Scholar] [CrossRef]
- Wang, Z.; Xu, Y.; Gan, Y.; Han, X.; Liu, W.; Xin, H. Micromechanism of partially hydrolyzed polyacrylamide molecule agglomeration morphology and its impact on the stability of crude oil−water interfacial film. J. Pet. Sci. Eng. 2022, 214, 110492. [Google Scholar] [CrossRef]
- Sheng, J.J.; Leonhardt, B.; Azri, N. Status of polymer-flooding technology. J. Can. Pet. Technol. 2015, 54, 116–126. [Google Scholar] [CrossRef]
- Frampton, H.; Morgan, J.C.; Cheung, S.K.; Munson, L.; Chang, K.T.; Williams, D. Development of a Novel Waterflood Conformance Control System. In Proceedings of the SPE/DOE Symposium on Improved Oil Recovery, Tulsa, OK, USA, 3–5 April 2004. [Google Scholar]
- Pritchett, J.; Frampton, H.; Brinkman, J.; Cheung, S.; Morgan, J.; Chang, K.T.; Williams, D.; Goodgame, J. Field Application of a New In-Depth Waterflood Conformance Improvement Tool. In Proceedings of the SPE International Improved Oil Recovery Conference in Asia Pacific, Kuala Lumpur, Malaysia, 20–21 October 2003. [Google Scholar]
- Chang, K.; Frampton, H.; Morgan, J. Composition for Recovering Hydrocarbon Fluids from a Subterranean Reservoir. U.S. Patent 7,300,973, 27 November 2007. [Google Scholar]
- Ohms, D.S.; McLeod, J.D.; Graff, C.J.; Frampton, H.; Morgan, J.C.; Cheung, S.K.; Chang, K.T. Incremental-Oil Success From Waterflood Sweep Improvement in Alaska. SPE Prod. Oper. 2010, 25, 247–254. [Google Scholar] [CrossRef]
- Burcik, E.J. Note on the flow behavior of polyacrylamide solutions in porous media. Prod. Mon. 1965, 29, 6. [Google Scholar]
- Burcik, E.J.; Walrond, W.K. Microgel in polyacrylamide solutions and its role in mobility control. Prod. Mon. 1968, 32. Available online: https://www.osti.gov/biblio/7299555 (accessed on 1 October 2022).
- Feng, Y.; Tabari, R.; Renard, M.; Le Bon, C.; Omari, A.; Chauveteau, G. Characteristics of HSPAM/Zr(IV) microgels designed for oilwell water shut-off and profile control. In Proceedings of the Society of Petroleum Engineers (SPE) 2003 Oilfield Chemistry Symposium, Houston, TX, USA, 5–7 February 2003. [Google Scholar]
- Al-Anazi, H.A.; Sharma, M.M. Use of a pH Sensitive Polymer for Conformance Control. In Proceedings of the International Symposium & Exhibition on Formation Damage Control, Lafayette, LA, USA, 23–24 February 2002. [Google Scholar]
- Huh, C.; Choi, S.K.; Sharma, M.M. A Rheological Model for pH-Sensitive Ionic Polymer Solutions for Optimal Mobility Control Applications. In Proceedings of the SPE Annual Technical Conference and Exhibition, Dallas, TX, USA, 9–12 October 2005. [Google Scholar]
- Roussennac, B.; Toschi, C. Brightwater Trial in Salema Field (Campos Basin, Brazil). In Proceedings of the SPE EUROPEC/EAGE Annual Conference and Exhibition, Barcelona, Spain, 6–9 June 2010. [Google Scholar]
- Spildo, K.; Skauge, A.; Aarra, M.G.; Tweheyo, M.T. A New Polymer Application for North Sea Reservoirs. SPE Reserv. Evaluation Eng. 2009, 12, 427–432. [Google Scholar] [CrossRef]
- Liu, Y.; Bai, B.; Wang, Y. Applied Technologies and Prospects of Conformance Control Treatments in China. Oil Gas Sci. Technol. 2010, 65, 859–878. [Google Scholar] [CrossRef]
- Bai, B.; Li, L.; Liu, Y.; Liu, H.; Wang, Z.; You, C. Preformed Particle Gel for Conformance Control: Factors Affecting Its Properties and Applications. SPE Reserv. Eval. Eng. 2007, 10, 415–422. [Google Scholar] [CrossRef]
- Bai, B.; Liu, Y.; Coste, J.-P.; Li, L. Preformed Particle Gel for Conformance Control: Transport Mechanism through Porous Media. SPE Reserv. Eval. Eng. 2007, 10, 176–184. [Google Scholar] [CrossRef]
- Chauveteau, G.; Tabary, R.; Le Bon, C.; Renard, M.; Feng, Y.; Omari, A. In-Depth Permeability Control by Adsorption of Soft Size-Controlled Microgels. In Proceedings of the SPE European Formation Damage Conference, Hague, The Netherlands, 13–14 May 2003. [Google Scholar]
- Salehi, M.B.; Moghadam, A.M.; Jarrahian, K. Effect of Network Parameters of Preformed Particle Gel on Structural Strength for Water Management. SPE Prod. Oper. 2020, 35, 362–372. [Google Scholar] [CrossRef]
- Zhu, D.; Bai, B.; Hou, J. Polymer Gel Systems for Water Management in High-Temperature Petroleum Reservoirs: A Chemical Review. Energy Fuels 2017, 31, 13063–13087. [Google Scholar] [CrossRef]
- Bai, B.; Zhou, J.; Yin, M. A comprehensive review of polyacrylamide polymer gels for conformance control. Pet. Explor. Dev. 2015, 42, 525–532. [Google Scholar] [CrossRef]
- Esfahlan, M.S.; Khodapanah, E.; Tabatabaei-Nezhad, S.A. Comprehensive review on the research and field application of preformed particle gel conformance control technology. J. Pet. Sci. Eng. 2021, 202, 108440. [Google Scholar] [CrossRef]
- O’Brien, J.; Sayavedra, L.; Mogollon, J.L.; Lokhandwala, T.; Lakani, R. Maximizing Mature Field Production - A Novel Approach to Screening Mature Fields Revitalization Options. In Proceedings of the SPE Europec Featured at 78th EAGE Conference and Exhibition, Vienna, Austria, 30 May–2 June 2016. [Google Scholar] [CrossRef]
- Chauveteau, G.; Tabary, R.; Blin, N.; Renard, M.; Rousseau, D.; Faber, R. Disproportionate Permeability Reduction by Soft Preformed Microgels. In Proceedings of the SPE/DOE Symposium on Improved Oil Recovery, Tulsa, OK, USA, 3–5 April 2004. [Google Scholar] [CrossRef]
- Duranvalencia, C.D.L.A.; Bai, B.; Reyes-Perez, H.; Fajardo-López, R.; Barragán-Aroche, J.F.; Lopez-Ramirez, S. Development of enhanced nanocomposite preformed particle gels for conformance control in high-temperature and high-salinity oil reservoirs. Polym. J. 2014, 46, 277–284. [Google Scholar] [CrossRef]
- Tang, X.; Yang, H.; Gao, Y.; Lashari, Z.A.; Cao, C.; Kang, W. Preparation of a micron-size silica-reinforced polymer microsphere and evaluation of its properties as a plugging agent. Colloids Surf. A Phys. Eng. Asp. 2018, 547, 8–18. [Google Scholar] [CrossRef]
- Li, X.; Li, W.; Yang, Q.; Gong, X.; Guo, W.; Dong, C.; Liu, J.; Xuan, L.; Chang, J. Rapid and Quantitative Detection of Prostate Specific Antigen with a Quantum Dot Nanobeads-Based Immu-nochromatography Test Strip. ACS Appl. Mater. Interfaces 2014, 6, 6406–6414. [Google Scholar] [CrossRef]
- Rosi, N.L.; Mirkin, C.A. Nanostructures in Biodiagnostics. Chem. Rev. 2005, 105, 1547–1562. [Google Scholar] [CrossRef]
- Guo, W.; Chen, N.; Tu, Y.; Dong, C.; Zhang, B.; Hu, C.; Chang, J. Synthesis of Zn-Cu-In-S/ZnS core/shell quantum dots with inhibited blue-shift photoluminescence and appli-cations for tumor targeted bioimaging. Theranostics 2013, 3, 99–108. [Google Scholar] [CrossRef]
- Wang, Y.; Hu, A. Carbon quantum dots: Synthesis, properties and applications. J. Mater. Chem. C 2014, 2, 6921–6939. [Google Scholar] [CrossRef]
- Vanderhoff, J.W.; Bradford, E.B.; Tarkowski, H.L.; Shaffer, J.B.; Wiley, R.M. Inverse Emulsion Polymerization. In Polymerization and Polycondensation Processes; American Chemical Society: Washington, DC, USA, 1962; pp. 32–51. [Google Scholar]
Publisher’s Note: MDPI stays neutral with regard to jurisdictional claims in published maps and institutional affiliations. |
© 2022 by the authors. Licensee MDPI, Basel, Switzerland. This article is an open access article distributed under the terms and conditions of the Creative Commons Attribution (CC BY) license (https://creativecommons.org/licenses/by/4.0/).