Article

Numerical Analysis of Thermal Impact between the Cooling Facility and the Ground

by
Paweł Sokołowski
1,
Grzegorz Nawalany
1,*,
Tomasz Jakubowski
2,
Ernest Popardowski
2,
Vasyl Lopushniak
3 and
Atilgan Atilgan
4
1
Department of Rural Building, Faculty of Environmental Engineering and Land Surveying, University of Agriculture in Krakow, Al. Mickiewicza 24/28, 30-059 Krakow, Poland
2
Department of Machine Operation, Ergonomics and Production Processes, Faculty of Production and Power Engineering, University of Agriculture in Krakow, 30-059 Krakow, Poland
3
Institute for Soil Science and Agrochemistry Research, National University of Life and Environmental Sciences of Ukraine, 03041 Kyiv, Ukraine
4
Department of Biosystem Engineering, Alanya Alaaddin Keykubat University, Antalya 07425, Turkey
*
Author to whom correspondence should be addressed.
Energies 2022, 15(24), 9338; https://doi.org/10.3390/en15249338
Submission received: 10 November 2022 / Revised: 3 December 2022 / Accepted: 6 December 2022 / Published: 9 December 2022

Abstract

:
The article presents the results of research on the range of the impact of a cooling facility on the surrounding ground. An analysis of the heat exchange with the ground and through the building partitions was carried out. The analysis was carried out on the basis of the results of actual field tests carried out throughout the measurement year. The object of the research was an agricultural cold store located in southern Poland. The computational analysis of the interaction between the cooling facility and the ground was based on the numerical elementary balances method. The validation of the calculation model was performed based on the adopted boundary conditions. Calculations for the analyzed variants were carried out on the basis of a geometric model of the cooling facility built in the WUFI®plus program, corresponding to the actual dimensions. The analysis of the energy balance of the studied facility showed that the share of energy flow through the floor to the ground constitutes 8.2% of all energy flows through other partitions and the ventilation system. In order to maintain the set air temperature inside the studied building, intensive cooling was required with an energy demand of 5184.5 kWh/year. The results of the research showed that the range of the thermal impact of the building changes depending on the location of the studied ground area in terms of cardinal direction. The external and internal microclimate characteristics also affect the extent of the impact of the cooling facility on the surrounding ground. Under the assumption of stable values of Θi within a range of 0.0–4.0 °C, the largest range of influence (4.0 m) occurs in the summer.

1. Introduction

One of the most important criteria for the distribution of fruit and vegetables is their quality. This mainly depends on the conditions and method of storing harvests [1,2]. Depending on shelf life and type, produce can be stored in traditional warehouses or cold stores [3,4]. Cold stores of vegetables and fruits are buildings in which it is possible to precisely define selected parameters of the internal microclimate, the characteristics of which directly affect the quantitative and qualitative features of the stored produce [5,6]. In order to reduce costs, producers increasingly associate in producer groups and cooperatives, which have much greater production potential than individual farms [7]. However, there are many farms that still store harvests in small cold stores and agricultural warehouses. In the case of agricultural cold stores without a controlled atmosphere, ensuring appropriate microclimate conditions in cooling chambers is difficult [8,9]. This is mainly due to the inability to adjust selected parameters, such as the temperature and humidity of the indoor air. In addition, cooling facilities operating on farms will very often not have sufficient thermal insulation of partitions, which translates into increased energy consumption of buildings of this type [10].
Due to the specificity of the internal microclimate in agricultural facilities, an intensive process of heat exchange through partitions and the floor on the ground can be observed [11,12]. In order to protect the facility against the occurrence of an unfavorable and excessive amplitude of internal air temperature fluctuation, it is necessary to provide adequate thermal insulation of external partitions [13,14]. The construction type of the building and the method used in the construction of its foundation, as well as the height and insulation of the floor level, are also important [15]. These factors are essential for their use value. In the case of newly created buildings, attention should be paid to the possibility of using the soil as a medium for dampening the impact of the amplitude of external temperature change on the temperature of the internal air [16,17]. The amplitude of the ground temperature at a depth of as little as 0.50 m below the ground surface shows a value of less than half that of the amplitude of the change in external air temperature [18,19].
The analysis of the energy performance of buildings, especially agricultural buildings, requires continuous research of the internal and external microclimate [20]. In order to obtain a full picture of the phenomena occurring in a given facility, the tests should be carried out in specific periods, such as production cycles and technological breaks. The optimal solution will be to plan the research for at least a 12-month research period, covering the variability of the external microclimate throughout the year [21,22]. Measurement data obtained in this way, subjected to appropriate processing, can be extremely valuable from the point of view of conducting computational analyses aimed at optimizing the operation of a given building in terms of energy. In analyses of this type, numerical methods are very useful, allowing non-stationary conditions to determine the energy characteristics of the tested object and the directions of heat flow [23]. Computer simulations can be carried out using specialized software. However, the choice of a calculation tool should always be supported by the characteristics of the available data and taking into account certain limitations of various tools that require certain simplifications when performing calculations. The most important task during the simulation, however, is the appropriate validation and calibration of the computational model, which, if done correctly, allows for conducting modified variant analyses [24].
With respect to the aforementioned specificity of cooling buildings and the manner of their operation, this paper analyzes the interaction between the ground surroundings and the cooling facility. The aim of the study was to determine the range of the impact of the cooling facility on the surrounding soil. As part of the study, a quantitative analysis of the energy flow through the building partitions and the soil in its surroundings was also carried out.

2. Materials and Methods

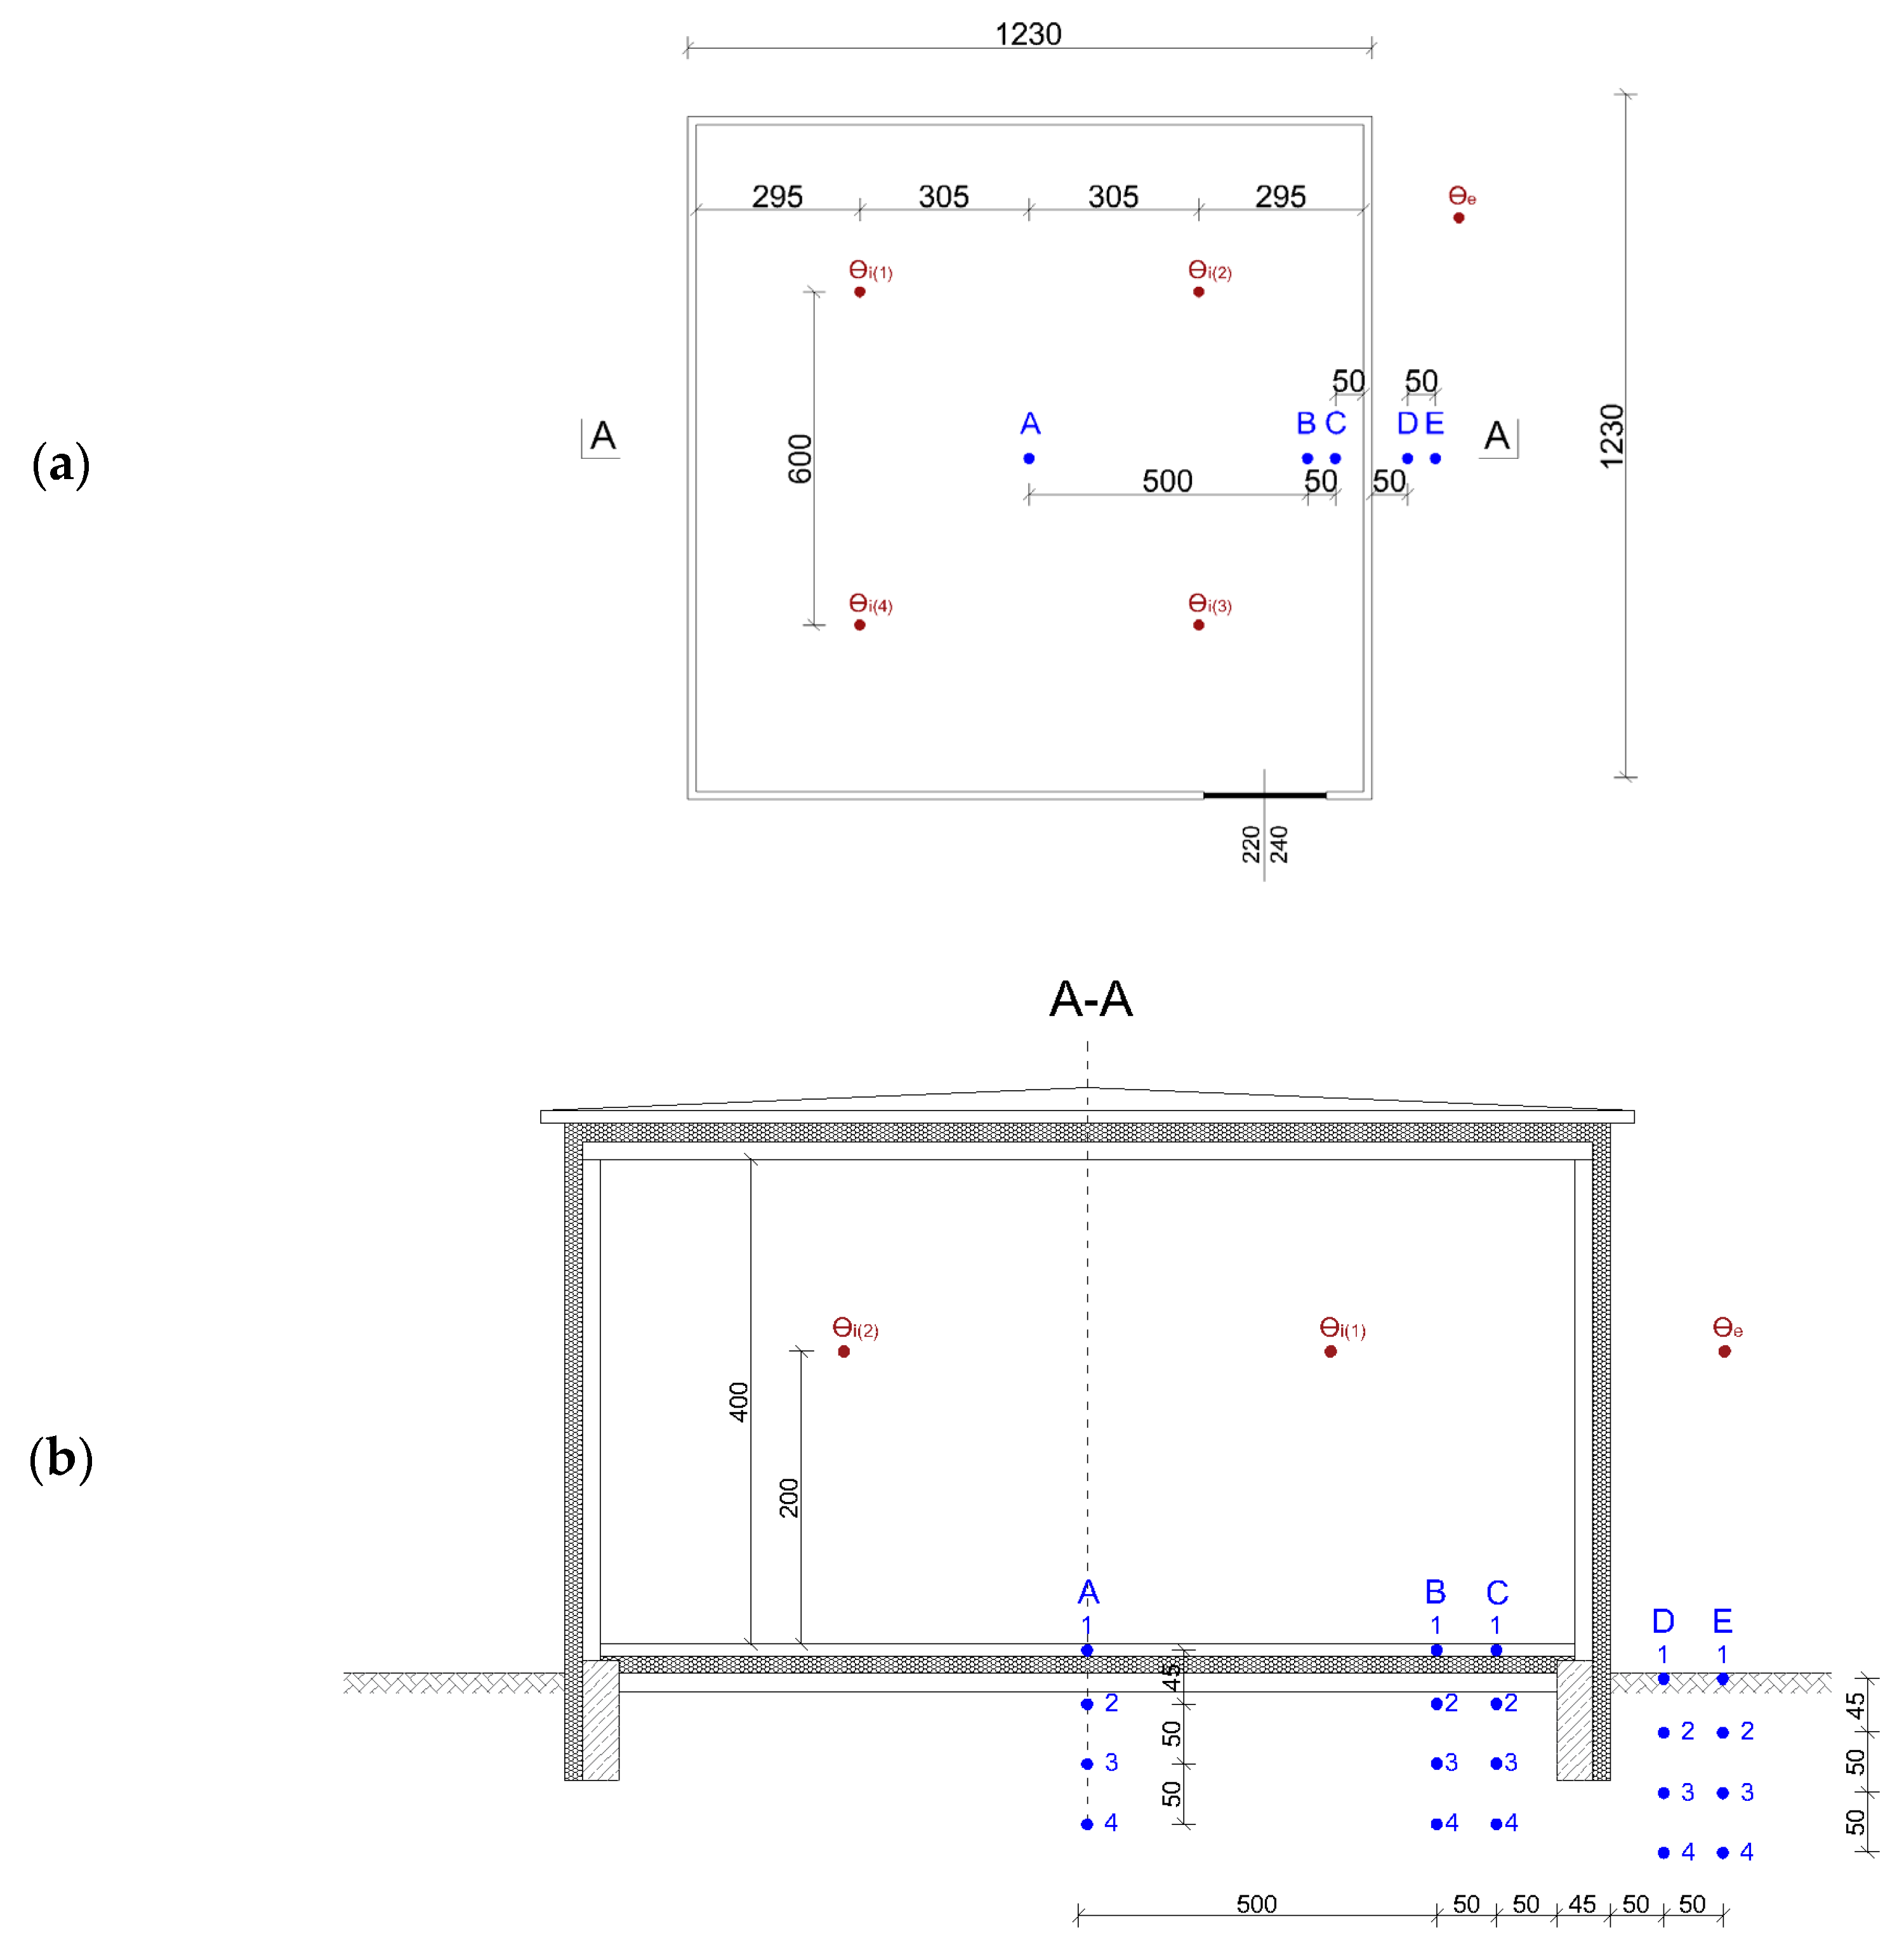
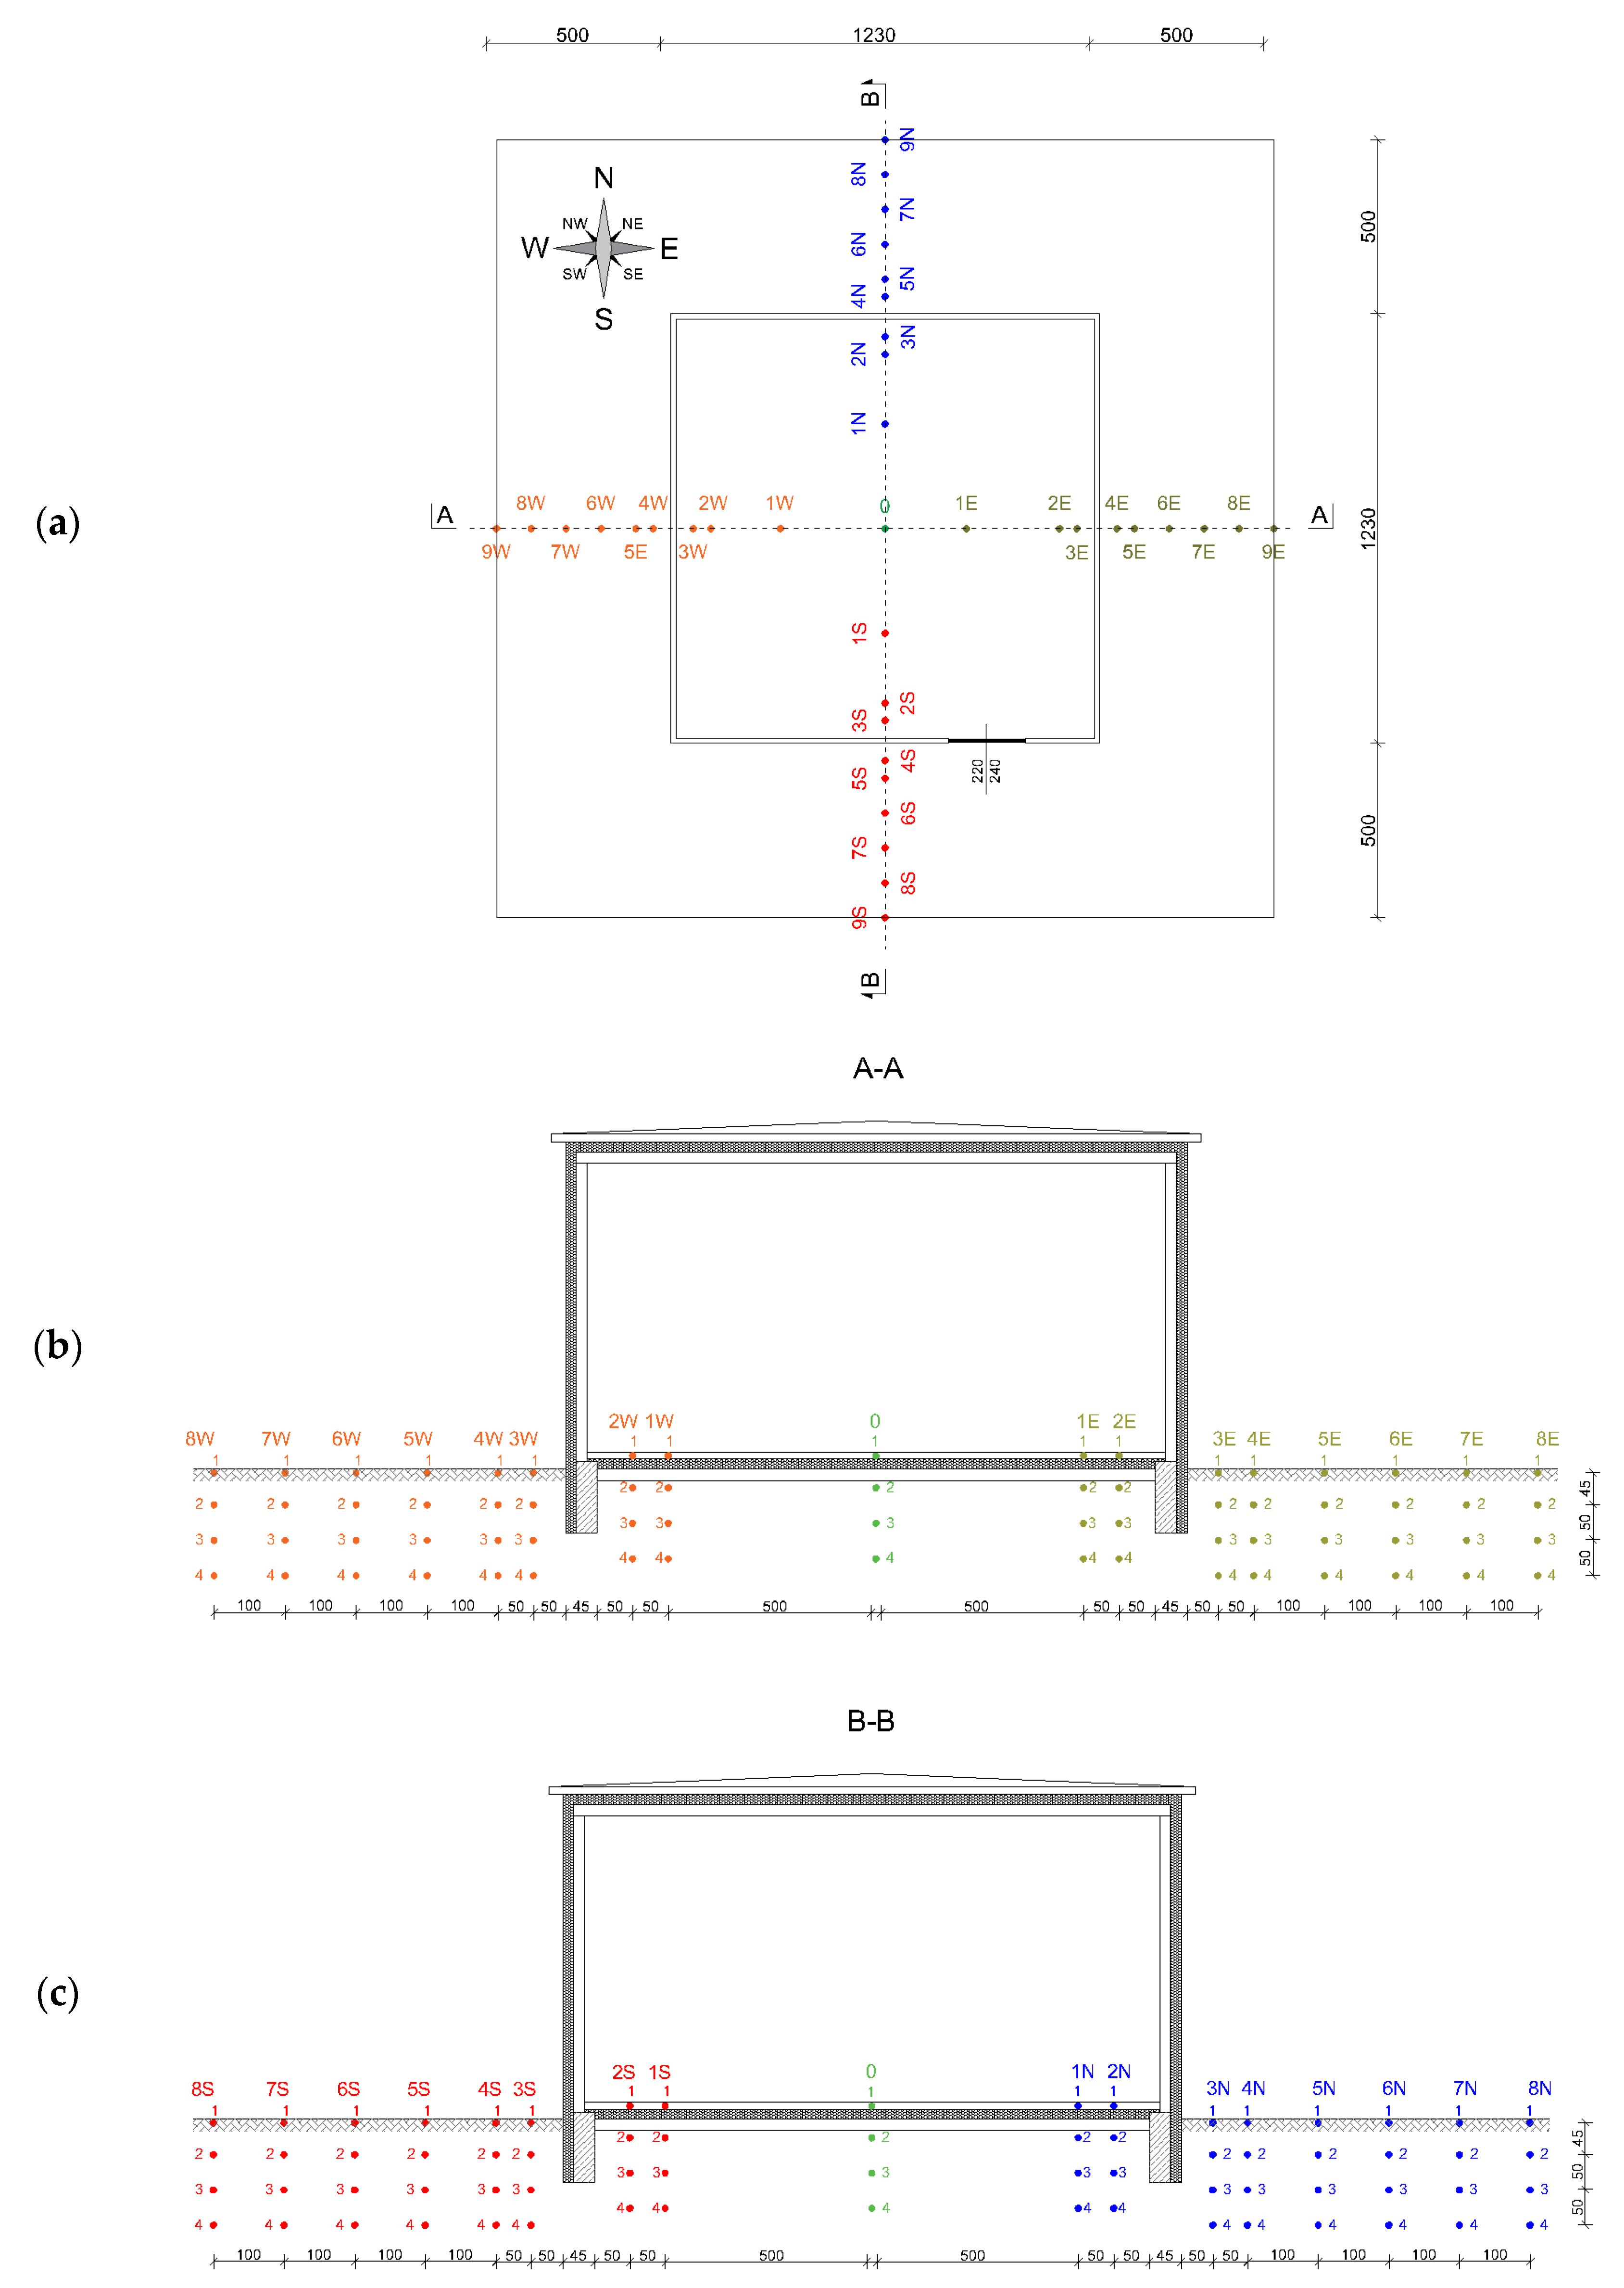
2.1. Description of the Facility and the Measuring Apparatus

In order to analyze the interaction between the surrounding ground and the cold store and to verify the extent of its impact on the surrounding ground, the results of field tests carried out at a vegetable cold store located in southern Poland were used. The usable area of the studied facility is 143.93 m2. The building has a steel frame structure, embedded on a 30 cm thick concrete foundation, set at a depth of 1.0 m below the ground level. The foundations are thermally insulated with 15 cm EPS (extruded polystyrene). The floors of the cooling chamber are made of cement screed with a thickness of 10 cm and have 15 cm EPS thermal insulation. Organoleptic soil analysis showed that there is a 15 cm layer of humus in the vicinity of the cooling facility, under which sandy clay with a thickness of 1.90 m is deposited. The groundwater table is located at 3.50 m below ground level. The outer walls and ceiling of the chambers are finished with sandwich panels made of steel sheet, which was galvanized and painted on both sides, with a 15 cm thick polystyrene core.
The measurements of the floor and ground temperature were made in 5 measurement columns (A–E). In each of the columns, 4 PT-100 sensors were installed (measurement resolution 0.1 °C, measurement error 0.1 °C). Indoor air temperature measurements were carried out at 4 points at a height of 2.00 m, relative to the floor level. The outdoor air temperature measurements were carried out at a distance of 5.00 m from the building in a meteorological cage. The height of the measurement was 2.00 m, relative to the ground level. The temperature of the indoor and outdoor air was measured using PT100 recorders (measurement resolution 0.1 °C, measurement error 0.1 °C). Measurements were carried out every 60 min (Figure 1). The results of the field studies were used to validate the numerical model.

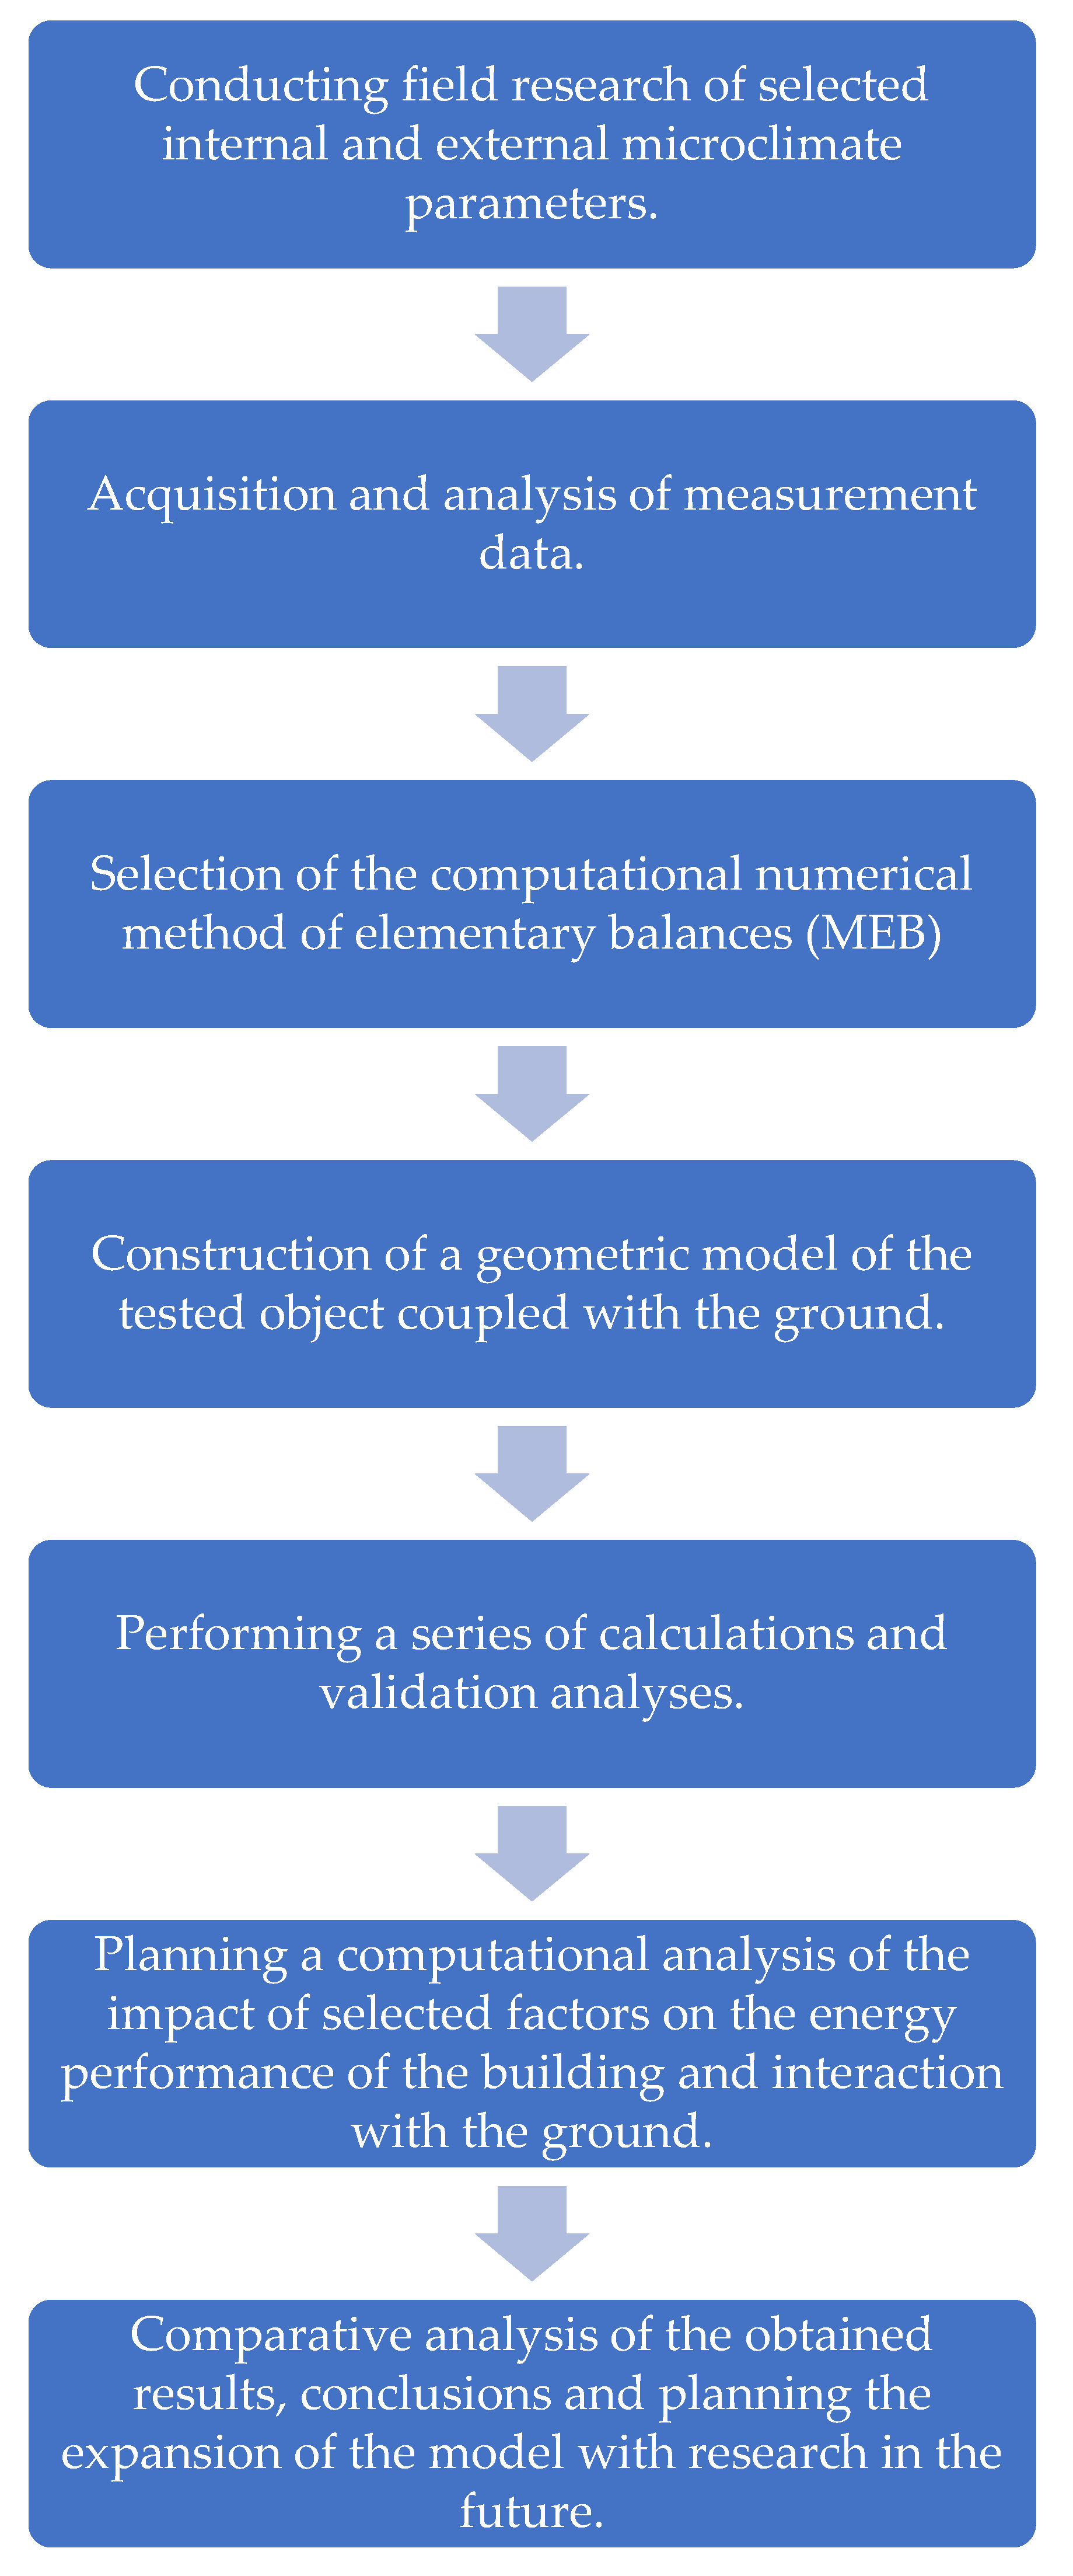
2.2. Numerical Analysis—Assumptions for Calculations

The computational analysis of the interaction between the cooling facility and the ground was based on the numerical elementary balance’s method. This is currently one of a group of very efficient and accurate calculation methods and is particularly recommended for calculations, taking into account three-dimensional and non-stationary heat flow in the ground and in adjacent structural elements of a building. The idea of the elementary balance method is to divide a complex area into rectangular balance-differential elements. This process is called model discretization. For each differential balance element, energy and temperature balance calculations were carried out assuming a time interval of 60 min. The heat flux flowing through the analyzed area was calculated in a non-stationary manner (1), assuming the time step Δτ, where i—the number of elements, Φixiyiz,…—the energy flux flowing between the balance-differential elements (W).
Δ Q = Δ τ ( Φ i x i y i z , i x + 1 i y i z + Φ i x i y i z , i x 1 i y i z + Φ i x i y i z , i x i y i z + 1 + Φ i x i y i z , i x i y i z 1 + Φ i x i y i z , i x i y + 1 i z + Φ i x i y i z , i x i y 1 i z
In the analysis, calculations of the energy flow through the floor to the ground were made based on the relationship (2), where: Θi—the temperature of the internal air [°C], Θg—the floor temperature interpolated in a linear fashion, [°C], λs—the heat exchange co-efficient of the ground, where a value of 1.9 W/mK, [EN ISO 6946] was assumed; Rsi—penetration resistance, where a value of 0.14 m2K/W was assumed. Calculations were performed based on the floor temperature measured at a depth of 0.05 m below the surface and the actual course of internal air temperature measured at 4 installed sensors. For the calculations, the internal air temperature was averaged from all measurement points. Subsequently, the unit results (W/m2) were summed up and presented in kWh.
q = Θ i Θ g ( 0.05 λ s ) + R s i   [ W · m 2 ]
In order to carry out the calculation analysis, appropriate physical parameters of the ground and cooling facility partitions were adopted based on a technical inventory of the facility and the standard values of the materials (Table 1).
In the first stage of the analysis, the calculation model was validated, including:
  • Selection of the values of technical parameters for the ground and external partitions of the cooling facility;
  • Adoption of a six-month period preceding the relevant calculation period, which eliminated the initial error;
  • Determination of the values of the ventilation and air infiltration streams;
  • Conduct of a simulation of cases where a constant ground temperature was assumed at a depth of 10 m below the cooling facility;
  • Determination of the initial temperature of the ground;
  • Verification of the conformity of the theoretical data obtained with the actual data.
The validation of the calculation model was based on the measured temperature inside and outside the cooling facility. In relation to the temperature of the ground, this was a boundary condition of the third kind. An initial ground temperature of 8.8 °C was also assumed, which corresponds to the average annual outdoor air temperature for Kraków (Poland) (TRY). The statistical significance of differences between theoretical and actual data were checked using the non-parametric Kruskal–Wallis test (p < 0.05). The obtained model calibration results were also subjected to analysis of the mean arithmetic difference, compared to the measurement data. The mean value of this error was determined based on Relationship (3), where: Δθ—mean error, θp—measured temperature, θo—calculated temperature, N—number of measurements.
Δ θ =   | θ p θ o | N
After completing the validation process, a significant extension of the measuring range in the facility and in its surroundings was made (Figure 2). A total of 33 measurement columns and 4 measurement levels were adopted for the depths 0.05 m, 0.50 m, 1.00 m, and 1.50 m below the floor and ground level. The measuring range covered up to 5.00 m for each building facade. Due to the much more stable conditions of the internal microclimate of the cooling facility, compared to the external microclimate, a lower density of measurement points in the floor layer and the underlying ground was assumed. In this case, the measurement monitors were arranged in 3 measurement columns for each of the analyzed depths. The adopted assumptions were intended to determine the temperature distribution of the cooling facility floor, the underlying ground, and the ground in the vicinity of the building as accurately as possible. The obtained results were used to determine the range of thermal impact of this type of building on the surrounding environment.
The calculation procedure performed in this work is shown in Figure 3.
Calculations for the analyzed variants were carried out on the basis of a geometric model of the cold store built in the WUFI®®plus program (ver. 3.2.0) software (Fraunhofer Institut fur Bauphysik, Holzkirchen Branch, Germany), corresponding to the actual dimensions.

3. Results

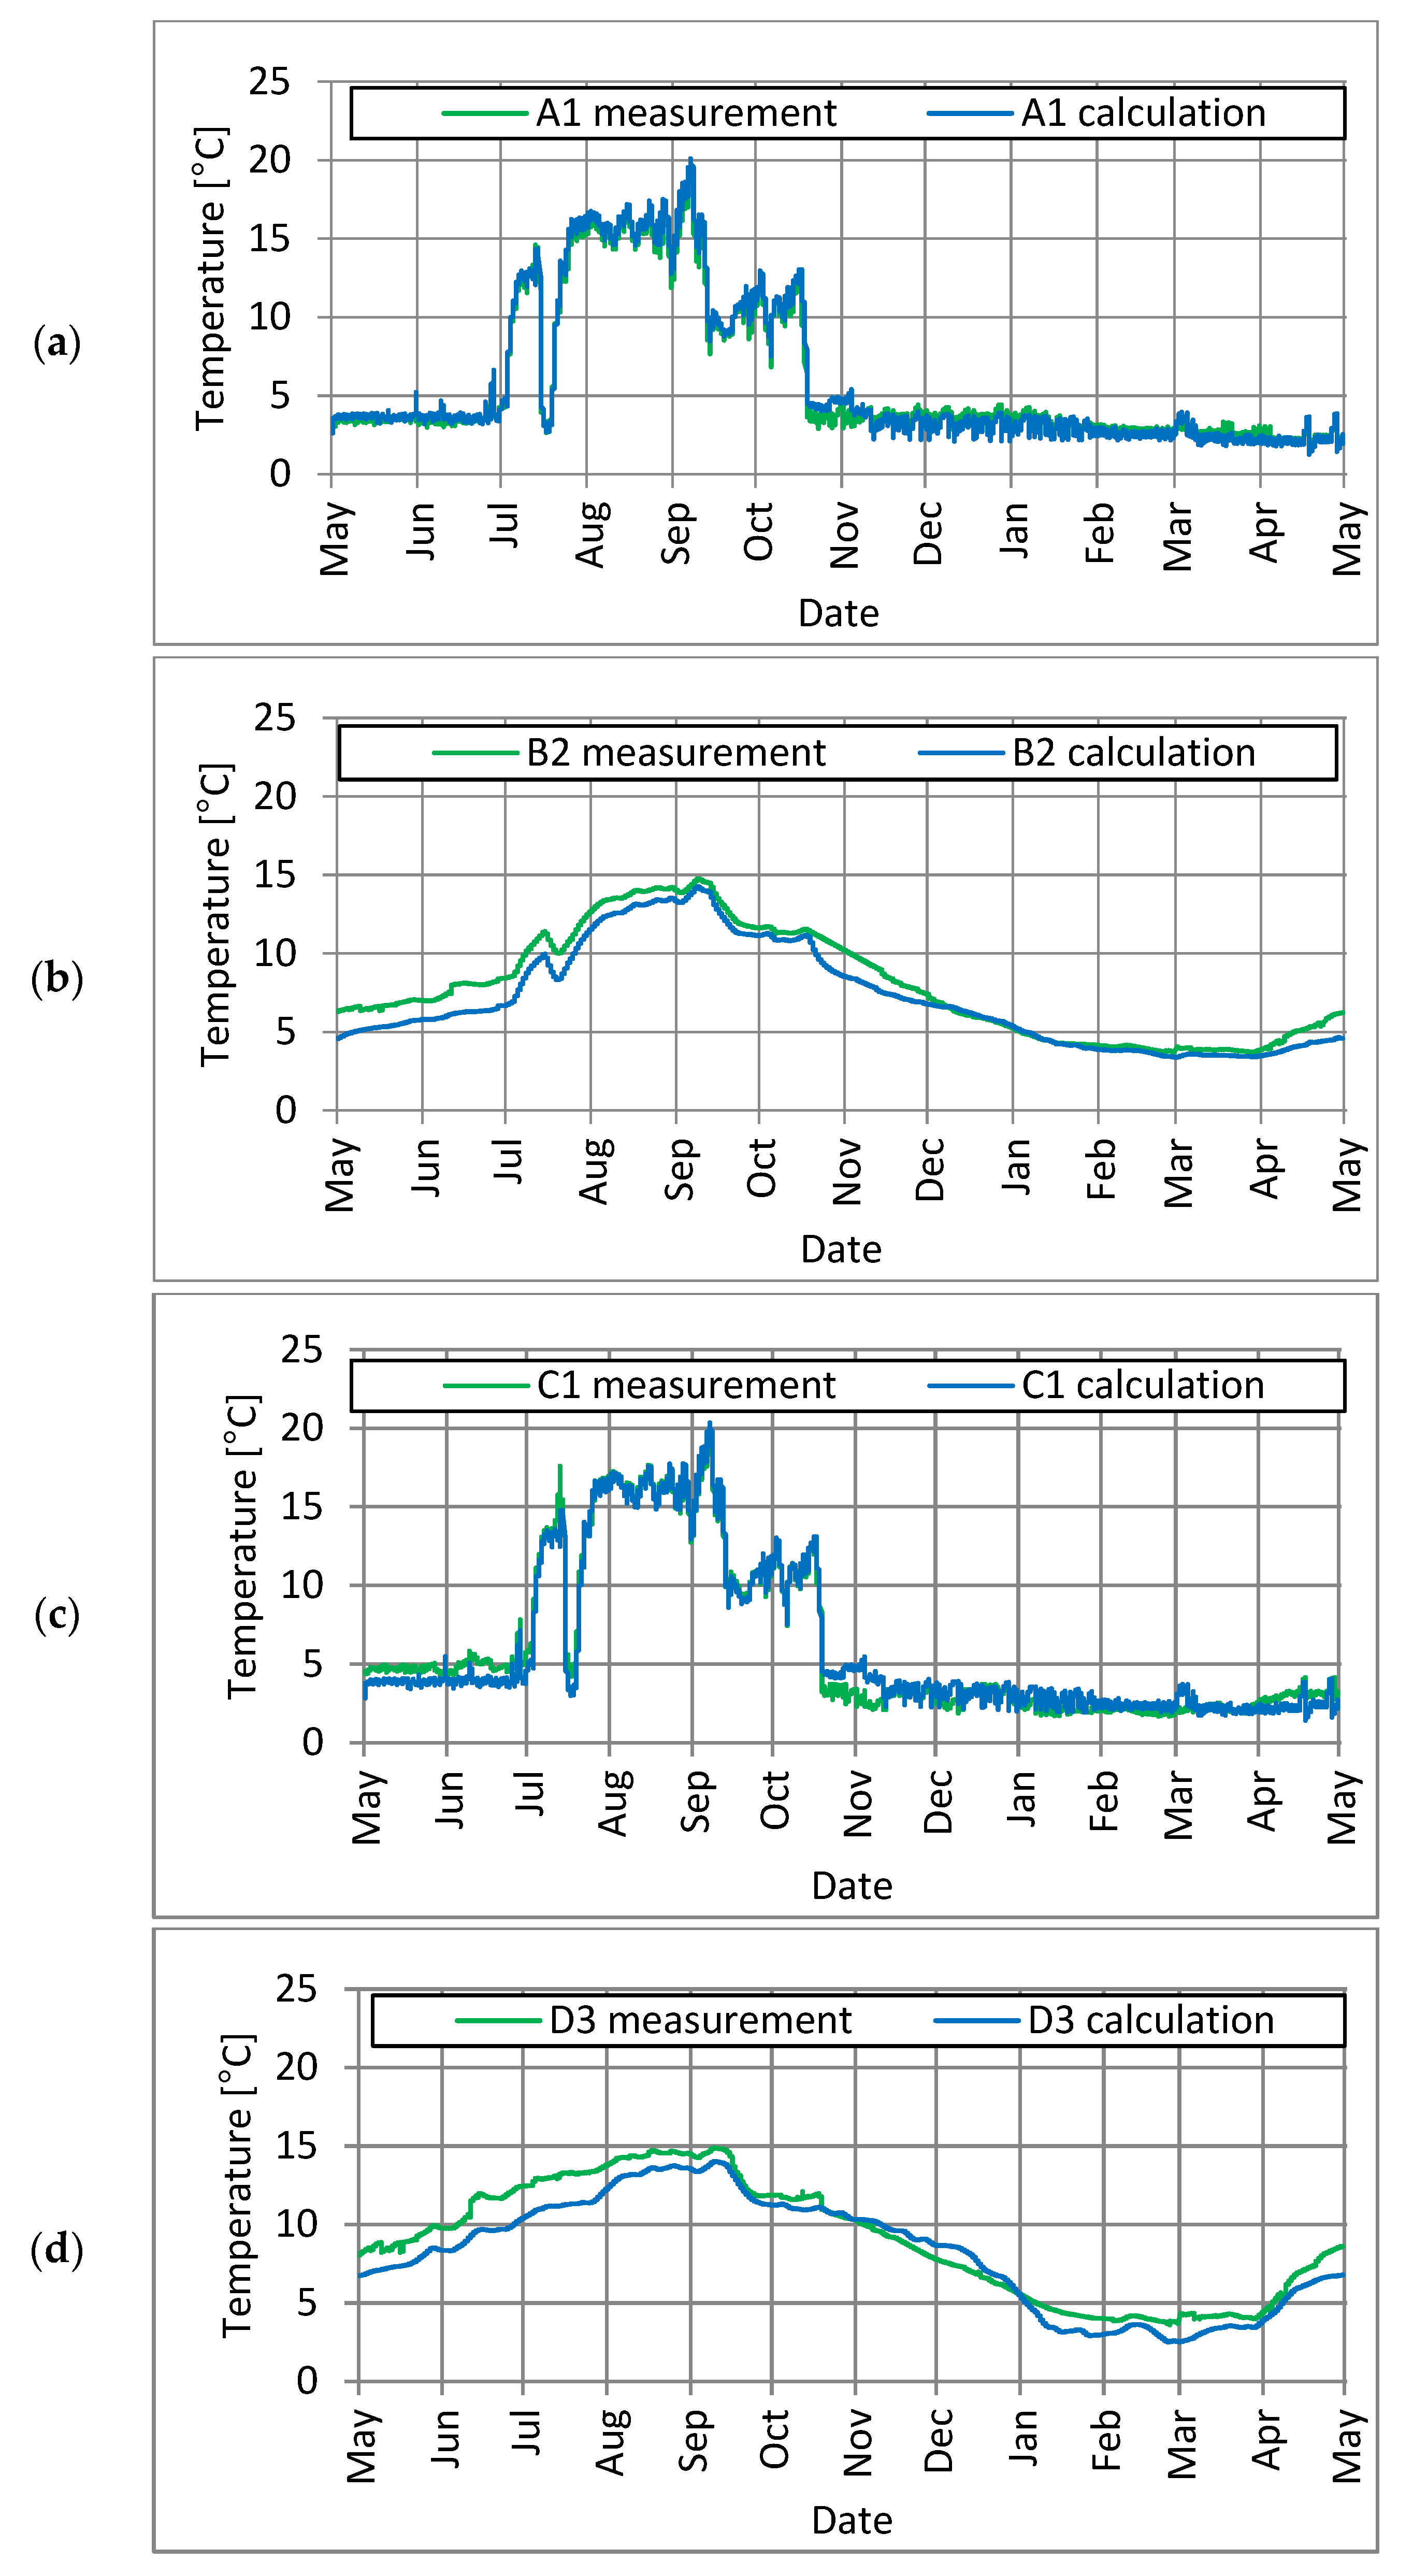
3.1. Validation of the Calculation Model

The results of the actual studies of the internal and external air temperature, as well as the temperature of the floor and the ground, which were used to validate the model, were collected throughout the year (May 2020–April 2021). During the analyzed period, the cooling cycle lasted from 1 May 2020 to 30 June 2020 and from 18 October 2020 to 30 April 2021. In the period from 1 July to 17 October 2020, there was a technological break in the cold store, during which no harvests were stored. The analysis of the results of the calculations at various levels showed clear differences in the formation of the ground temperature between the points inside the cooling facility and in its surroundings. The annual amplitude of soil temperature at point E1 was 29.4 °C, while at point D1 it was very similar and amounted to 29.2 °C. At the points located in the ground under the cooling facility, the values of the annual amplitude of the ground temperature ranged from 13.9 °C to 14.3 °C. At a depth of 1.5 m, a greater impact of the soil on the stabilization of thermal conditions could already be seen. At a depth of 0.50 m, the annual fluctuations in soil temperature decreased almost double that of a depth of 0.05 m. The influence of the cooling facility on the temperature distribution in the ground decreased with depth. At the points located in the vicinity of the studied facility, the annual amplitude of the soil temperature ranged from 14.5 °C (point D2) to 15.1 °C (point E2) (Figure 4). Throughout the cooling cycle, the internal temperature was maintained in the range of 0–4 °C.
The analysis of the validation results showed a very strong correlation of measurement and theoretical data (0.88–0.95). There were no statistically significant differences (p < 0.05) between the measurement data and those obtained as a result of calculations (Figure 5).

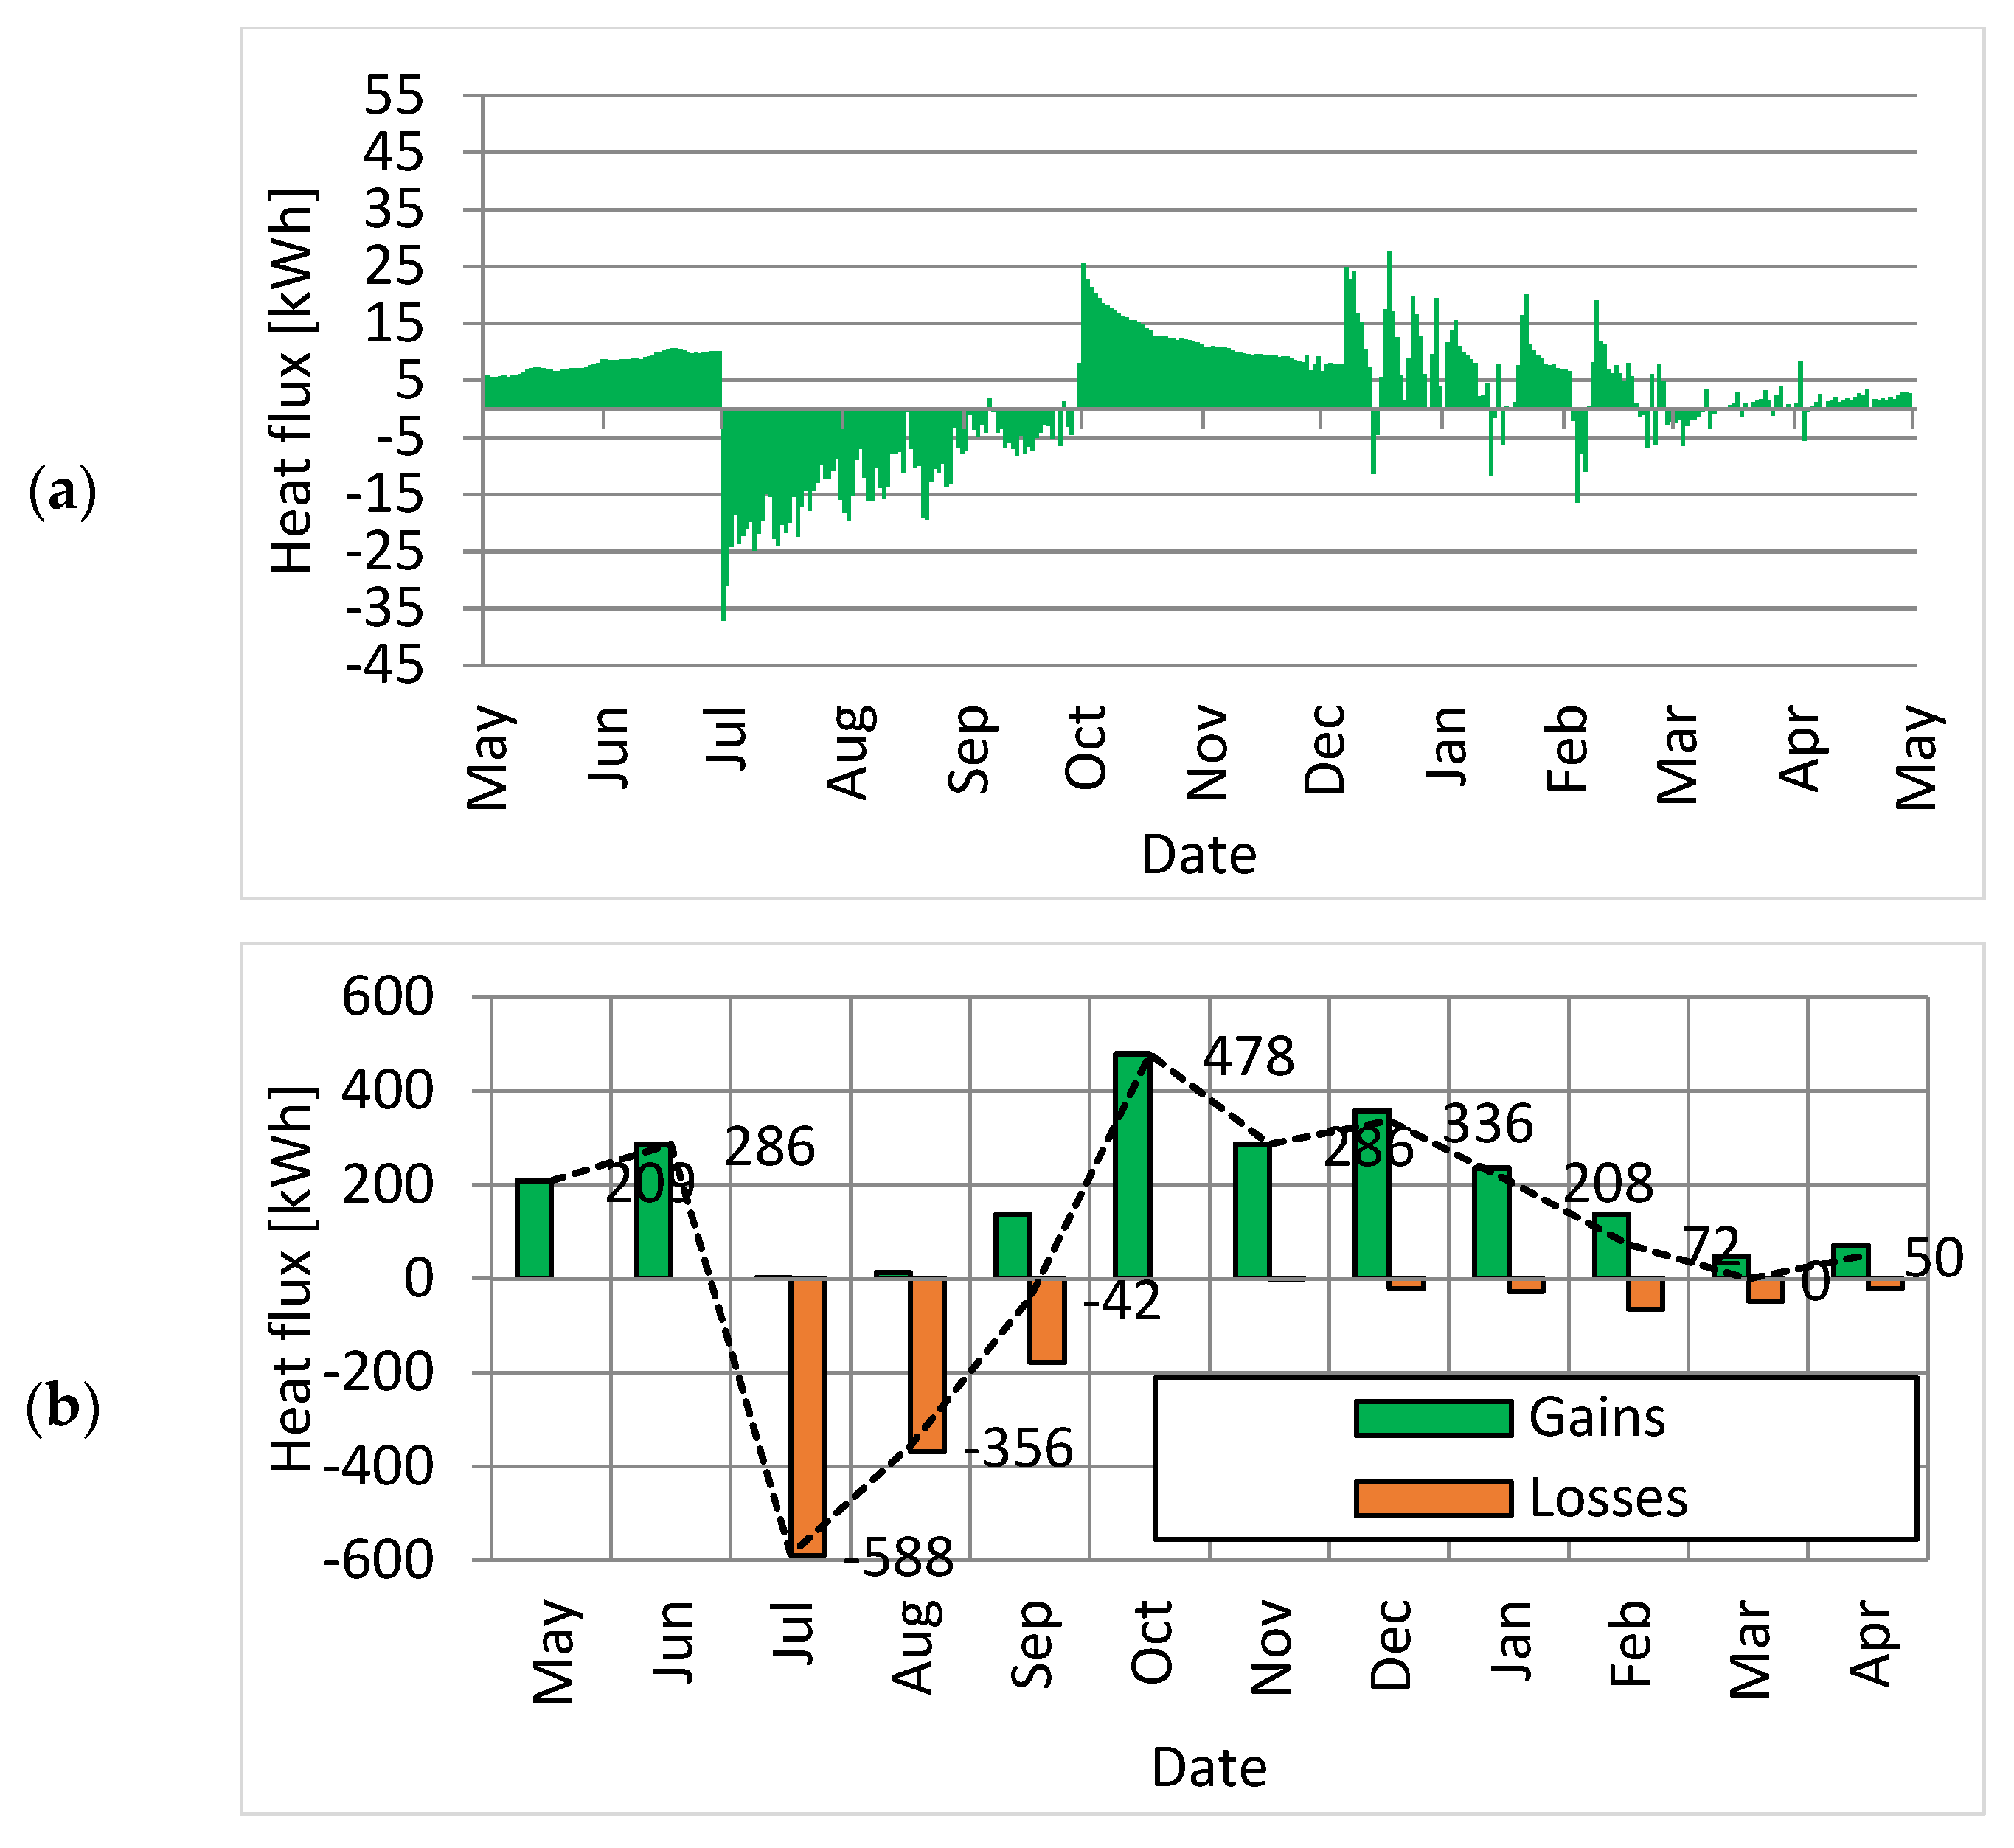
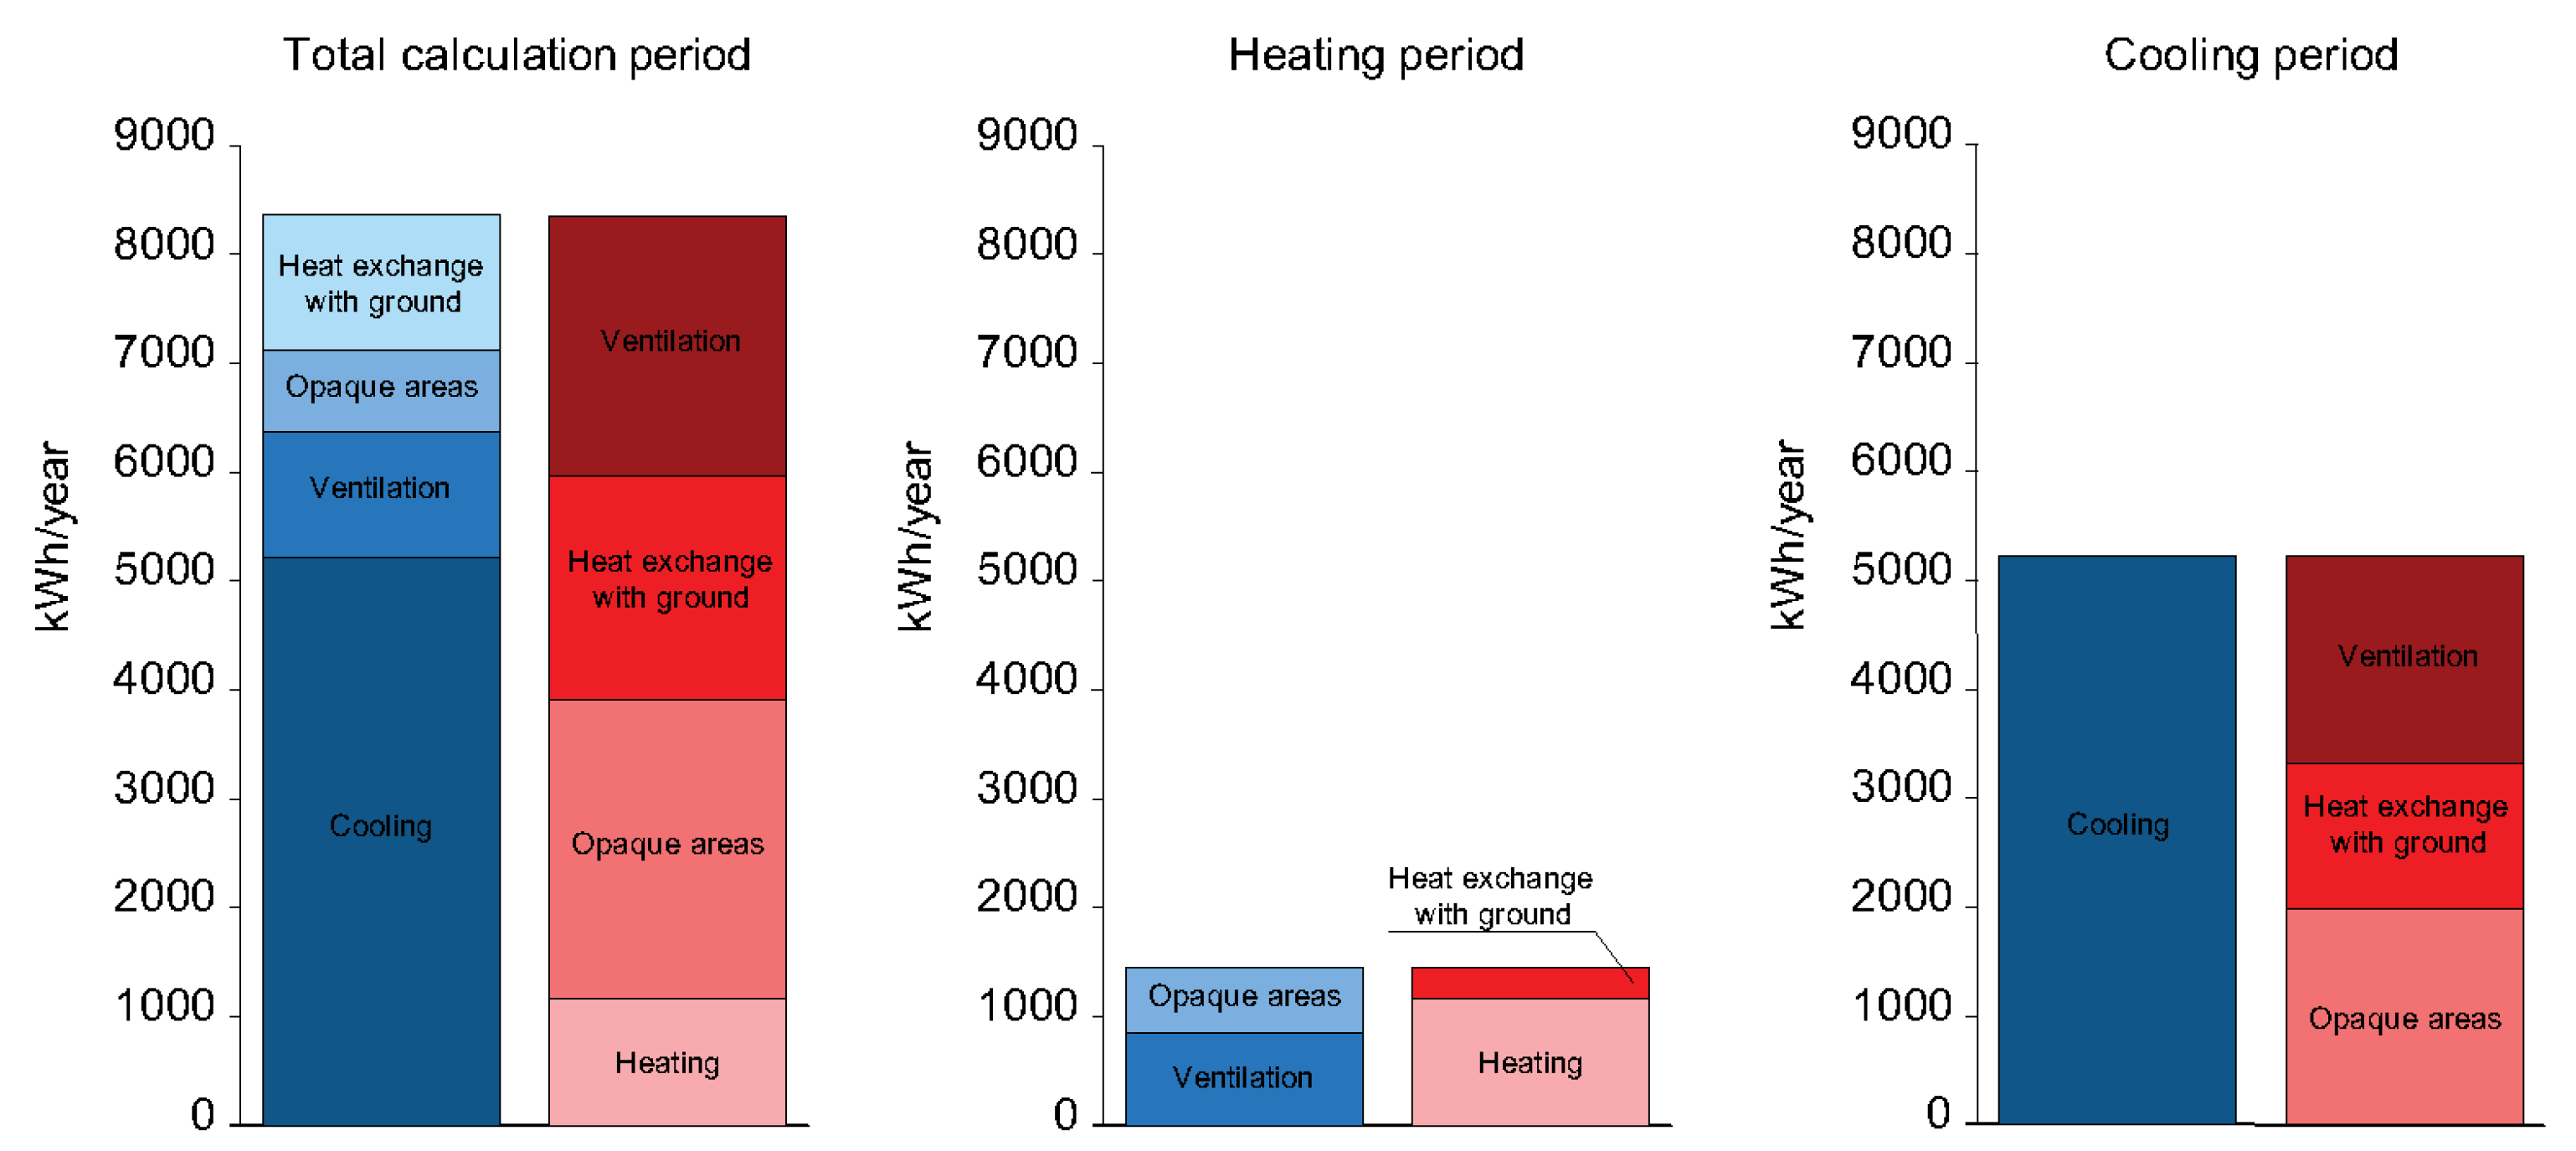
3.2. Heat Exchange with the Ground and Energy Management of the Cooling Facility

The analysis of the heat exchange with the ground showed that the total demand for cooling energy in the period considered amounted to 5150 kWh. Due to the fact that the cooling cycle also took place in winter, it was necessary to supply energy for heating purposes (530 kWh) in order to ensure a minimum temperature of 0 °C. In the summer, when the cooling units were shut down, the heat flow to the ground was 590 kWh. Total energy gains from the ground amounted to 2260 kWh, while losses amounted to 1320 kWh per year (Figure 6). Taking into account the energy demand for cooling and heating purposes and the energy balance through other partitions, it was determined that the percentage of land in the energy management of this type of facility is 8.2%.
Aside from the ground, the energy flow in the studied building was analyzed for external partitions, air infiltration, and the cooling system. The analysis of energy flow as a result of ventilation (0.3/h) and infiltration (0.2/h) showed total energy gains of 2394.3 kWh/year. Through the external walls to the interior of the cooling facility, a flow of energy was found amounting to 1434 kWh/year, while heat losses amounted to 421 kWh/year. The ceiling above the cooling chambers had a smaller share in the energy flow in relation to the outer walls. The total heat loss through this partition was 325 kWh/year, while the gains were 1327 kWh/year (Figure 7). A detailed analysis of the functioning of active systems (cooling and heating) showed that the total cooling period lasted 155 days, while additional heating of the chambers was necessary for 27 days during the entire cooling cycle.

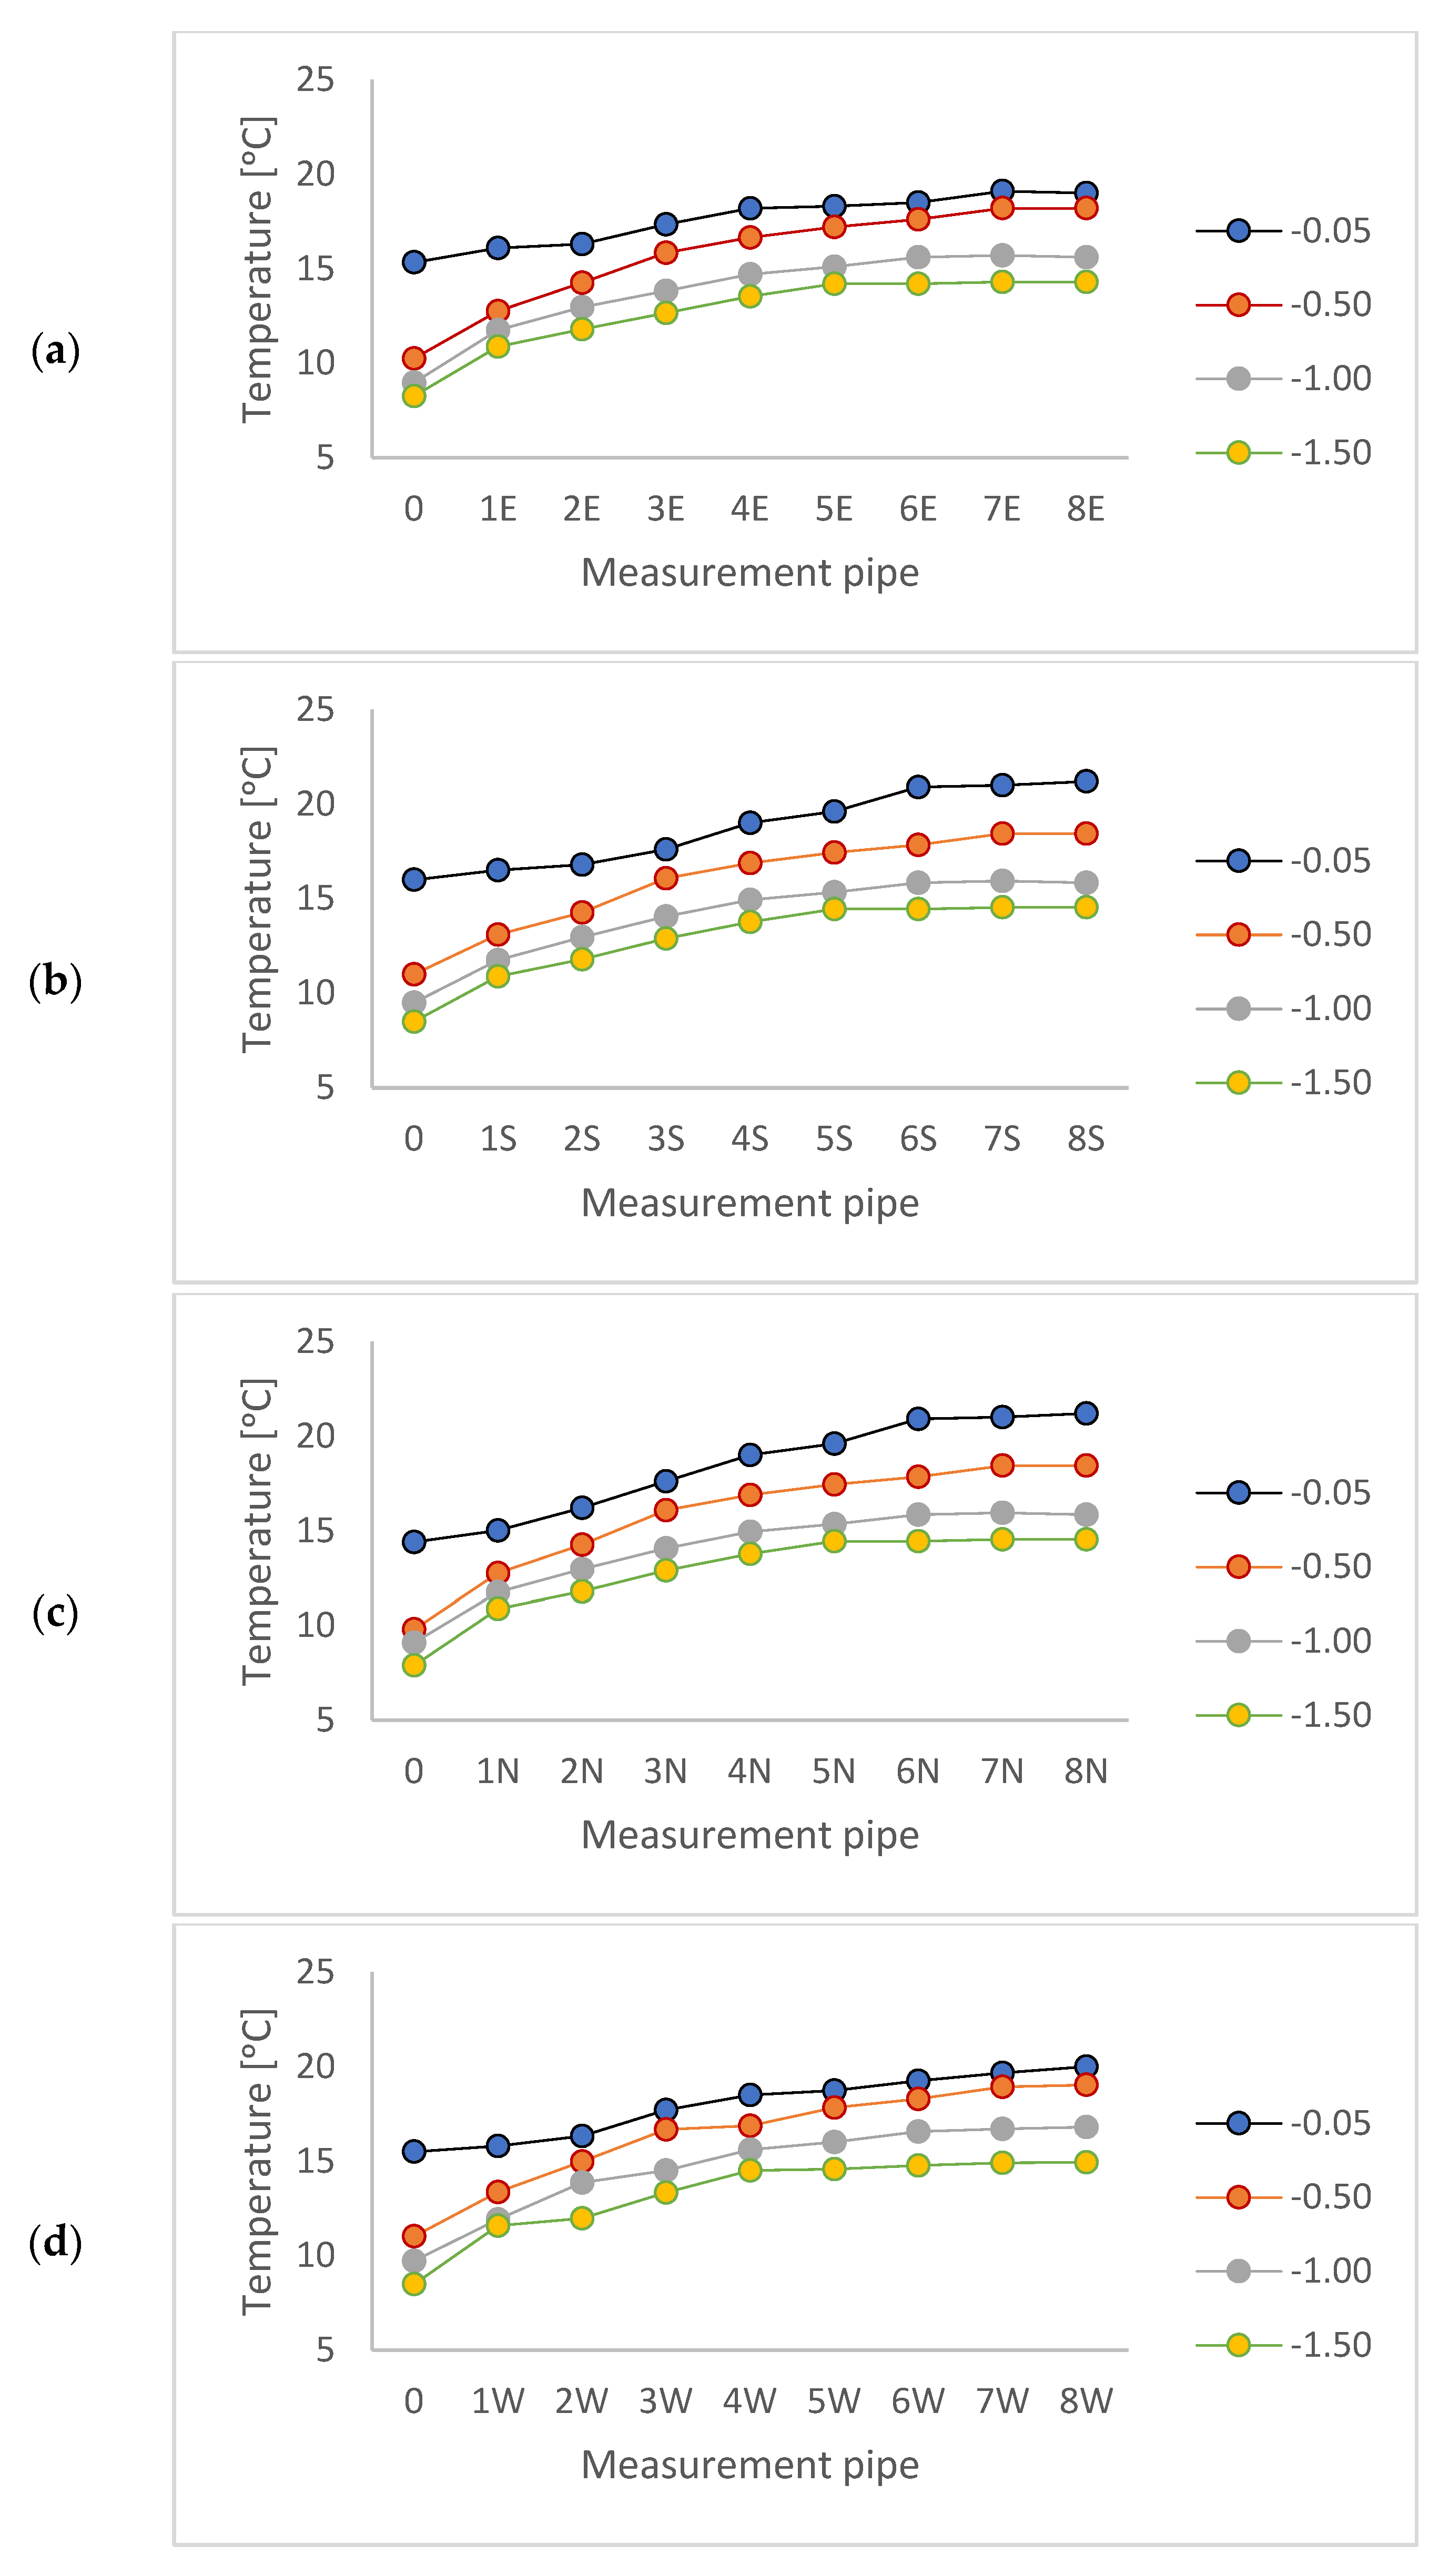
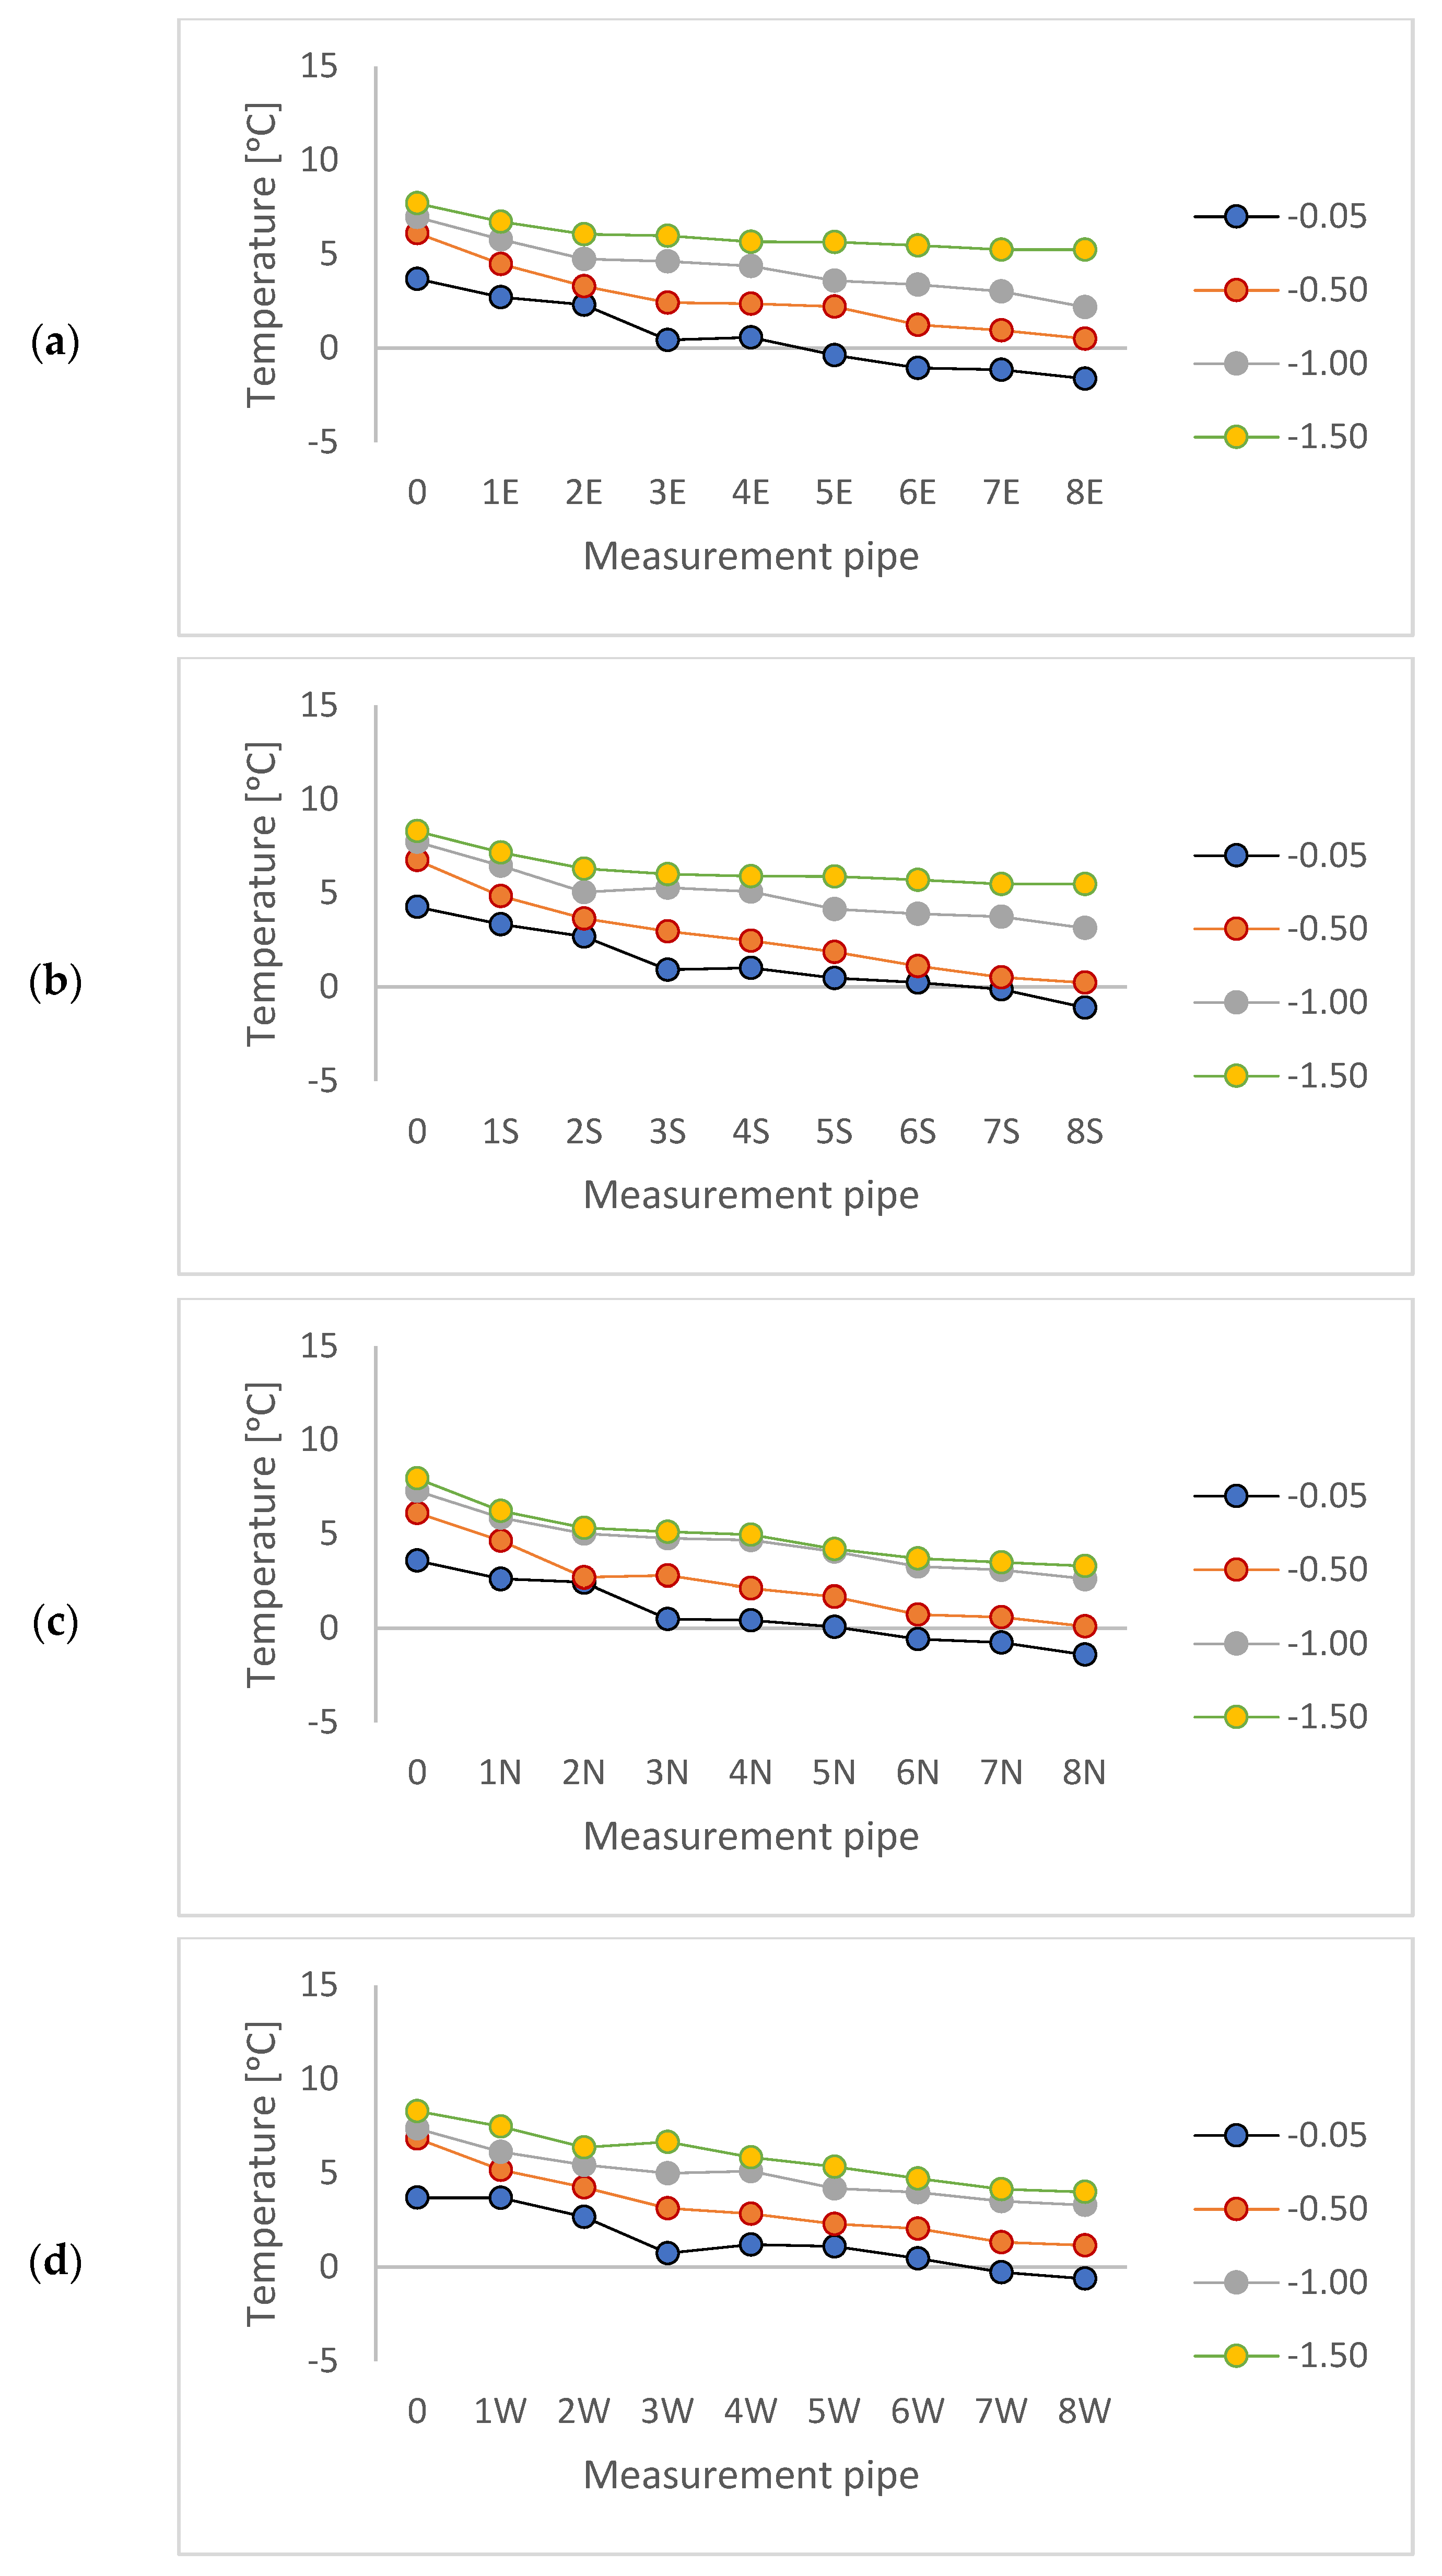
3.3. Thermal Interaction with Ground

The range of the impact of the building on the surrounding ground was analyzed taking into account the orientation of the cooling tower, in relation to cardinal direction. A total of 148 measuring monitors were adopted at depths of 0.05 m, 0.50 m, 1.00 m, and 1.50 m. The monitors were located in 10 measurement columns for each cardinal direction. The results of the numerical analysis allowed the extent of the impact of the studied building on the environment to be determined. The thermal interaction between the building and the ground in the summer and winter for selected days was also analyzed.
For the summer period, the analysis of the simulation results from the eastern side of the cold store showed that the range of impact on the surrounding soil did not exceed 4.00 m (Figure 8a). The internal temperature during this period was maintained at 4.0 °C. On the south side, the range of impact of the studied cooling facility did not exceed 3.00 m. In the 6S column, 3.00 m from the external wall of the building, a ground temperature stabilization was found in the range of 14.4–20.9 °C, depending on the depth (Figure 8b). The analysis of the thermal conditions prevailing in the ground to the western side of the building showed similar values as for the area located to the eastern side (Figure 8c). To the north side (Figure 8d), the range of impact of the studied building on the ground was 4.00 m. Beyond 4.00 m from the building, the ground temperature at a depth of 0.50 m to 1.50 m was stabilized in the range of 14.0–20.5 °C. To the north, to a depth of 0.50 m, lower values of ground temperature by 0.4–0.7 °C were found, relative to the southern orientation of the building.
In winter, the average temperature inside the cooling facility ranged from 1.0 °C to 1.6 °C. Due to the high value of the daily amplitude in this period (20.3 °C) and the periodic retention of the snow cover, the measurement level located at a depth of 0.05 m was not taken into account to assess the range of impact on the surrounding soil. The analysis of measurement data from points located at depths of 0.50 m, 1.00 m, and 1.50 m showed a reduced range of the building’s impact in the winter, compared to the summer period. On the eastern side (Figure 9a) and the southern side (Figure 9b), the observable thermal impact of the building on the surrounding ground did not exceed 2.00 m. In the case of the areas located to the north (Figure 9c) and west (Figure 9d), the range of impact of the studied building was up to 3.00 m. The ground located on the north side, at depths of 1.00 m and 1.50 m, also showed very similar temperature values in all studied measurement columns. The differences between the measurements for the mentioned depths did not exceed 0.6 °C.

4. Discussion

The current state of knowledge shows that the share of the ground in the total energy balance of residential and industrial buildings is about 5–10% [25,26] in relation to the flow of heat through external partitions and ventilation losses. However, buildings intended for an agricultural purpose are characterized by a different specificity of their internal conditions, particularly the temperature and relative humidity of the air [27,28]. Depending on the structure of the building, the surface of its external partitions and, above all, its purpose, the percentage share of partitions in contact with the ground in its energy gains and losses may significantly affect the energy economy of this type of building [29,30,31]. The numerical method used in the research allowed for accurate matching of the model to the actual conditions. The validation of the model proved that conducting an extended energy and environmental analysis will allow results to be obtained that are strongly correlated with actual measurements. Small agricultural buildings are not often studied in terms of construction physics. The conducted research is an original case study of a given building with specific material, construction, and technological solutions. Computational models can be adapted and modified for many factors in terms of construction, materials, as well as boundary conditions, such as external and internal microclimate [32,33,34,35]. The results obtained in this work are the result of a piece of pilot work on the precise determination of the range of thermal impact on the environment of buildings used for agricultural purposes. This is particularly important in these times, when rational energy management, including in agriculture, is very important [36,37]. In order to optimize the energy consumption of agricultural buildings, the most effective solution is to check a given case in real conditions through long-term polygon measurements and to conduct simulations based on numerical methods that will allow the adoption of the most advantageous material, construction, and technological solutions. In the case of areas with a high density of buildings, it is also possible to determine the impact of buildings used for different purposes on the thermal conditions prevailing in the ground and their interaction with each other.

5. Conclusions

Heat transfer between the surroundings and the ground depends primarily on the physical properties of the ground, such as heat conduction coefficient, heat capacity, and specific density. The size of the surface of the partitions in contact with the ground or the surrounding air is also important. The validation of the calculation model was carried out on the basis of the results of field measurements of the temperature of both outside and internal air and the temperature of the ground in five measuring columns at depths of 0.05, 0.50, 1.00, and 1.50 m. The obtained validation results showed a very high correlation of measurement data with calculated data and the absence of statistically significant differences. The aim of the simulations carried out in the next step was to obtain information on the extent of the impact of the examined cooling facility on the surrounding ground. A quantitative analysis of the energy balance for building partitions and the cooling and ventilation systems was also carried out. Analyzing the obtained results, it was found that the tested cooling facility affects the surrounding ground for no more than 4.00 m, in relation to the external foundation walls. The results of the research showed that the range of the thermal impact of the building changes depend on the location of the studied ground area in terms of cardinal direction. The external and internal microclimate characteristics also affect the range of the impact of the cooling facility on the surrounding ground. Under the assumption of stable values of Θi within the range of 0.0–4.0 °C, the largest range of influence (4.0 m) occurs in the summer. To the south side, the impact range of the building was smaller and amounted to 3.00 m. The analysis of the energy balance of the studied facility showed that the share of energy flow through the floor to the ground constitutes 8.2% of all energy flows through other partitions and the ventilation system. In order to maintain the set air temperature inside the studied building, intensive cooling was required with an energy demand of 5184.5 kWh/year. In winter, when the outside air temperature dropped well below 0.0 °C, the facility required periodic heating, which required the need to provide 1147.3 kWh of energy during the entire research year. In order to reduce the energy demand for cooling purposes, partial embedding in the ground can be considered for facilities of this type. This solution will allow for an increase in the area of partitions having direct contact with the ground, which is characterized by far more stable thermal conditions than outside air. In this case, the variability of the range of impact of the partially embedded building on the surrounding ground and the impact on the energy management of such facilities should be analyzed.

Author Contributions

Conceptualization, P.S., G.N., T.J. and V.L.; Methodology, P.S., G.N., T.J. and E.P.; Software, P.S. and E.P.; Validation, P.S. and G.N.; Formal analysis, P.S., G.N., T.J., E.P., V.L. and A.A.; Investigation, G.N.; Data curation, P.S. and G.N.; Writing–original draft, P.S. and G.N.; Writing–review & editing, P.S., G.N., T.J., E.P., V.L. and A.A.; Visualization, P.S.; Supervision, G.N., T.J., V.L. and A.A. All authors have read and agreed to the published version of the manuscript.

Funding

This research was funded by Faculty of Environmental Engineering, University of Agriculture in Krakow, through project “Subvention 030001-D014 Environmental Engineering, Mining and Energy”.

Conflicts of Interest

The authors declare no conflict of interest.

References

  1. Albanese, D.; Cinquanta, I.; Di Matteo, M. Effects of an innovative dipping treatment on the cold storage of minimally processed Annurca apples. Food Chem. 2007, 105, 1054–1060. [Google Scholar] [CrossRef]
  2. Sokolowski, P.; Nawalany, G. Numerical Analysis of the Impact of the Cooling Cycle Length in Vegetable Cold Stores on the Heat Exchange with Soil. J. Ecol. Eng. 2019, 20, 162–170. [Google Scholar] [CrossRef]
  3. Olveira-Bouzasa, V.; Pita-Calvo, C.; Vázquez-Odériz, M.L.; Romero-Rodríguez, M.A. Evaluation of a modified atmosphere packaging system in pallets to extend the shelf-life of the stored tomato at cooling temperature. Food Chem. 2021, 364, 130309. [Google Scholar] [CrossRef]
  4. Sokolowski, P.; Nawalany, G. Experimental study of the impact of the vegetable cold store floor location on heat exchange with the soil. Appl. Ecol. Environ. Res. 2019, 17, 8179–8189. [Google Scholar] [CrossRef]
  5. Ali, S.; Khan, A.; Malik, A.U.; Anjum, M.A.; Nawaz, A.; Shoaib Shah, H.M. Modified atmosphere packaging delays enzymatic browning and maintains quality of harvested litchi fruit during low temperature storage. Sci. Hortic. 2019, 254, 14–20. [Google Scholar] [CrossRef]
  6. Nincevic, G.; Djakovic, A.; Bosiljkov, S.; Halambek, T.; Zoric, J.; Dragovic-Uzelac, Z.; Rimac, V.; Brncic, S. Valorisation of tomato peel waste as a sustainable source for pectin, polyphenols and fatty acids recovery using sequential extraction. Waste Biomass Valorization 2020, 11, 4593–4611. [Google Scholar] [CrossRef]
  7. Sokolowski, P.; Nawalany, G. Analysis of Energy Exchange with the Ground in a Two-Chamber Vegetable Cold Store, Assuming Different Lengths of Technological Break, with the Use of a Numerical Calculation Method—A Case Study. Energies 2020, 13, 4970. [Google Scholar] [CrossRef]
  8. Ambaw, A.; Delele, M.A.; Defraeye, T.; Ho, Q.T.; Opara, L.U.; Nicolai, B.M.; Verboven, P. The use of CFD to characterize and design post-harvest storage facilities: Past, present and future. Comput. Electron. Agric. 2013, 93, 184–194. [Google Scholar] [CrossRef] [Green Version]
  9. Jakubowski, T.; Krolczyk Jolanta, B. Method for the reduction of natural losses of potato tubers during their long-term storage. Sustainability 2020, 12, 1048. [Google Scholar] [CrossRef] [Green Version]
  10. Mazzeo, T.; Paciulli, M.; Chiavaro, E.; Visconti, A.; Pellegrini, N. Impact of the industrial freezing process on selected vegetables—Part II. Colour and bioactive compounds. Food Res. Int. 2015, 75, 89–97. [Google Scholar] [CrossRef] [PubMed]
  11. Nawalany, G.; Sokołowski, P. Impact of Selected Technical Soil Parameters on the Greenhouse Energy Management. J. Ecol. Eng. 2019, 20, 245–252. [Google Scholar] [CrossRef]
  12. Zhao, B. Study on heat transfer of ground heat exchanger based on wedge let finite element method. Int. Commun. Heat Mass Transf. 2016, 74, 63–68. [Google Scholar] [CrossRef]
  13. Kim, H.K.; Kang, G.C.; Moon, J.P.; Lee, T.S.; Oh, S.S. Estimation of Thermal Performance and Heat Loss in Plastic Greenhouses with and without Thermal Curtains. Energies 2018, 11, 578. [Google Scholar] [CrossRef] [Green Version]
  14. Akkurt, G.G.; Aste, N.; Borderon, J.; Buda, A.; Calzolari, M.; Chung, D.; Costanzo, V.; Del Pero, C.; Evola, G.; Huerto-Cardenas, H.E.; et al. Dynamic thermal and hygrometric simulation of historical buildings: Critical factors and possible solutions. Renew. Sustain. Energy Rev. 2020, 118, 109509. [Google Scholar] [CrossRef]
  15. Majidi, H.; Minaei, S.; Almassi, M.; Mostofi, Y. Tomato quality in controlled atmosphere storage, modified atmosphere packaging and cold storage. J. Food Sci. Technol. 2014, 51, 2155–2161. [Google Scholar] [CrossRef] [Green Version]
  16. Nawalany, G.; Lendelova, J.; Sokołowski, P.; Zitnak, M. Numerical Analysis of the Impact of the Location of a Commercial Broiler House on Its Energy Management and Heat Exchange with the Ground. Energies 2021, 14, 8565. [Google Scholar] [CrossRef]
  17. Kharseh, M.; Altorkmany, I. How global warming and building envelope will change energy use in central Europe. Appl. Energy 2012, 97, 999–1004. [Google Scholar] [CrossRef]
  18. Verboven, P.; Flick, D.; Nicolai, B.M.; Alvarez, G. Modeling transport phenomena in refrigerated food bulks, packages and stacks: Basics and advanced. Int. J. Refrig. 2006, 29, 985–997. [Google Scholar] [CrossRef]
  19. Nawalany, G.; Sokołowski, P. Building–Soil Thermal Interaction: A Case Study. Energies 2019, 12, 2922. [Google Scholar] [CrossRef] [Green Version]
  20. Kaushal, K.G.; Ramesh, S.; Anantha, K.H.; Singh, A.K.; Akuraju, V.R.; Barron, J.; Dev, I.; Tewari, R.K.; Wani, S.P.; Dhyani, S.K.; et al. Building climate resilience in degraded agricultural landscapes through water management: A case study of Bundelkhand region, Central India. J. Hydrol. 2020, 591, 125592. [Google Scholar]
  21. Zou, S.; Li, H.; Liu, L.; Wang, S.; Zhang, X.; Zhang, G. Experimental study on fire resistance improvement of wheat straw composite insulation materials for buildings. J. Build. Eng. 2021, 43, 103172. [Google Scholar] [CrossRef]
  22. Winkler, M.; Antretter, F.; Radon, J. Critical discussion of a shading calculation method for low energy building and passive house design. Energy Procedia 2017, 132, 33–38. [Google Scholar] [CrossRef]
  23. Xu, G.; Hu, L.; Luo, Y.; Tian, Z.; Deng, J.; Yuan, G.; Fan, J. Numerical modeling and parametric analysis of thermal performance for the large-scale seasonal thermal energy storage. Energy Build. 2022, 275, 112459. [Google Scholar] [CrossRef]
  24. Federico, B.; Giovanni, P.; Andrea, G. A shoeboxing algorithm for Urban Building Energy Modeling: Validation for stand-alone buildings. Sustain. Cities Soc. 2022, 104305. [Google Scholar] [CrossRef]
  25. Larwa, B.; Kupiec, K. Heat transfer in the ground with a horizontal heat exchanger installed—Long-term thermal effects. Appl. Therm. Eng. 2020, 164, 114539. [Google Scholar] [CrossRef]
  26. Chow, T.; Long, H.; Mok, H.Y.; Li, K.W. Estimation Of soil temperature profile in Hong Kong from climatic variables. Energy Build. 2011, 43, 3568–3575. [Google Scholar] [CrossRef]
  27. Zhang, Z.; Sun, D.W. Effect of cooling methods on the cooling efficiencies and qualities of cooked broccoli and carrot slices. J. Food Eng. 2006, 77, 320–326. [Google Scholar] [CrossRef]
  28. Nawalany, G.; Sokolowski, P. Analysis of hygrothermal conditions of external partitions in an underground fruit store. J. Ecol. Eng. 2016, 17, 75–82. [Google Scholar] [CrossRef]
  29. Maia, J.; Ramos, N.M.M.; Veiga, R. Evaluation of the hygrothermal properties of thermal rendering systems. Build. Environ. 2018, 144, 437–449. [Google Scholar] [CrossRef]
  30. Chanchangi, Y.N.; Ghosh, A.; Sundaram, S.; Mallick, T.K. An analytical indoor experimental study on the effect of soiling on PV, focusing on dust properties and PV surface material. Sol. Energy 2020, 203, 46–68. [Google Scholar] [CrossRef]
  31. Nawalany, G.; Sokolowski, P. Numerical Analysis of the Effect of Ground Dampness on Heat Transfer between Greenhouse and Ground. Sustainability 2021, 13, 3084. [Google Scholar] [CrossRef]
  32. Chuah, J.W.; Raghunathan, A.; Jha, N.K. ROBESim: A retrofit-oriented building energy simulator based on EnergyPlus. Energy Build. 2013, 66, 88–103. [Google Scholar] [CrossRef]
  33. Crawley, D.B.; Lawrie, L.K.; Winkelmann, F.C.; Buhl, W.; Huang, Y.J.; Pedersen, C.O.; Strand, R.K.; Liesen, R.J.; Fisher, D.E.; Witte, M.J.; et al. EnergyPlus: Creating a new-generation building energy simulation program. Energy Build. 2001, 33, 319–331. [Google Scholar] [CrossRef]
  34. Künzel, H.M.; Radoń, J. Building envelope design by hygrothermal simulations—Experience and guidelines. Build. Phys. Theory Pract. 2005, 1, 230–238. [Google Scholar]
  35. Gielzecki, J.; Jakubowski, T. The Simulation of Temperature Distribution in a Ground Heat Exchanger-GHE Using the Autodesk CFD Simulation Program. In Proceedings of the 4th International Conference on Renewable Energy Sources (ICORES), Nagoya, Japan, 19–21 September 2018. [Google Scholar]
  36. Ahmad, T.; Chen, H.; Guo, Y.; Wang, J. A comprehensive overview on the data driven and large scale based approaches for forecasting of building energy demand: A review. Energy Build. 2018, 165, 301–320. [Google Scholar] [CrossRef]
  37. Catrini, P. Improving energy efficiency of commercial buildings by combined heat cooling and power plants. Sustain. Cities Soc. 2020, 60, 102157. [Google Scholar] [CrossRef]
Figure 1. Diagram of the studied facility and arrangement of the measurement points of the floor, soil, and internal and external air temperatures: (a) projection; (b) cross-section.
Energies 15 09338 g001
Figure 2. Distribution of the measurement points of the floor and ground temperature: (a) projection, (b) cross-section A-A, (c) cross-section B-B.
Energies 15 09338 g002
Figure 3. Scheme of the analysis procedure.
Energies 15 09338 g003
Figure 4. The course of the measured temperature of the indoor air (a) and outdoor air (b) and the temperature of the ground in measurement points E1–E4 and D1–D4 (c).
Energies 15 09338 g004
Figure 5. The course of the measured and calculated temperature of the floor and the ground for the selected measurement points: (a) point A1, (b) point B2, (c) point C1, (d) point D3.
Energies 15 09338 g005
Figure 6. The course of heat exchange between the studied vegetable cold store and the ground: (a) hourly course, (b) monthly balance.
Energies 15 09338 g006
Figure 7. Energy balance for the tested cold store in annual terms, the period when reheating was required and in the cooling period.
Energies 15 09338 g007
Figure 8. Ground temperature in the studied measurement columns at depths of 0.05 m, 0.50 m, 1.00 m, and 1.50 m to the: (a) east, (b) south, (c) north, and (d) west. Summer period (June 25, Θe = 27.7 °C; Θi = 4.0 °C).
Energies 15 09338 g008
Figure 9. Ground temperature in the studied measurement columns at depths of 0.05 m, 0.50 m, 1.00 m, and 1.50 m to the (a) east, (b) south, (c) north, and (d) west. Winter period (January 12, Θe = −2.7 °C; Θi = 0.5 °C).
Energies 15 09338 g009
Table 1. Physical parameters of ground and construction materials of the cooling facility partitions used in calculations.
SpecificationUnitValue
Claydensitykg·m−31600
specific heatJ·kg−1·K−11000
thermal conductivity coefficientW·m−1·K−11.8
Humusdensitykg·m−31800
specific heatJ·kg−1·K−11260
thermal conductivity coefficientW·m−1·K−10.9
Styrofoamdensitykg·m−320
specific heatJ·kg−1·K−11500
thermal conductivity coefficientW·m−1·K−10.04
Concretedensitykg·m−32300
specific heatJ·kg−1·K−11000
thermal conductivity coefficientW·m−1·K−12.3
Gravel beddingdensitykg·m−31800
specific heatJ·kg−1·K−1840
thermal conductivity coefficientW·m−1·K−10.9
Steeldensitykg·m−37900
specific heatJ·kg−1·K−1460
thermal conductivity coefficientW·m−1·K−117
Source: based on PN-EN ISO 6946:2008.
Publisher’s Note: MDPI stays neutral with regard to jurisdictional claims in published maps and institutional affiliations.

