1. Introduction
District heating (DH) systems have the potential to become the cleanest form of thermal energy generation. The application of heat pumps and renewable energy sources in DH systems helps to improve air quality and reduce energy dependence. However, there are also barriers to upgrading DH systems for privately owned multifamily buildings on the path to decarbonization [
1]. The European Commission has adopted a Green Deal and aims to become a climate-neutral continent by 2050. The goal is to fully decarbonize the energy sector. Energy production and use are responsible for more than 75% of greenhouse gas emissions in the EU. Buildings are responsible for 40% of energy consumption. Replacing fossil fuels with renewable energy sources (RES) plays a key role in decarbonizing the energy sector [
2]. Preventing emissions of fluorinated greenhouse gases from refrigeration equipment and heat pumps into the atmosphere is also very important to preventing global warming and further ozone damage. As for synthetic refrigerants, it is necessary to reduce the average global warming potential (GWP) from 2000 in 2015 to 400 by 2030 [
3]. There are no legal requirements for natural refrigerants. Heat pumps with natural refrigerants can be used instead of heat pumps with synthetic refrigerants. Their impact on the environment is minimal or negligible. Thus, the global GWP for ammonia (R717) is 0, the GWP for carbon dioxide (R744) is 1, and the GWP for propane (R290) is 3 [
4].
Replacing fossil fuel-fired boilers with heat pumps in existing systems reduces CO
2 emissions. It has the potential to avoid the present 600 million tons of CO
2 emissions by 2050, which is equivalent to 15% of all EU greenhouse gas emissions [
5]. The use of high-efficiency heat pumps that operate with electricity from RES has even greater potential for the reduction in CO
2 emissions. The Heat Roadmap Europe studies [
6] predict that the share of large electric heat pumps (over 1 MW) in future district heating supplies will be between 25 and 30% by 2050. A large potential lies in the use of wastewater and groundwater as heat sources for heat pump operation. Large heat pumps operating with natural refrigerants can achieve temperatures high enough for existing district heating systems but lowering temperatures in the pipe networks is necessary to increase efficiency and reduce heat loss.
Retrofitting 3rd-generation DH to 4th-generation DH reduces losses in the piping network and enables the use of low-temperature heat sources. The benefits achieved exceed the investment costs of the retrofit. In buildings well thermally insulated during retrofit, existing radiators and heat exchangers can provide sufficient heat if operated at lower temperatures [
7]. To introduce the 4th-generation DH system, it is required to reduce energy consumption, which would enable the operation of the heating system at low temperatures (average 50/20 °C), maintaining the comfort of the end user. Low supply temperature in DH systems results in higher efficiency of heat pumps. All those benefits are welcome and obvious, but how to reduce the high heat demand in existing buildings within a reasonable time frame and how to accelerate the conversion process to low-energy buildings have not yet been fully explored [
8]. In [
9], the transition from 2nd- and 3rd-generation to 4th-generation DH systems was performed in a case study for the city of Trondheim, Norway. Dynamic simulation in the Dymola program was used to evaluate the effects of the supply temperature reduction to 55 °C, resulting in a decrease in heat losses by one-third. In the research conducted for a case study in Sweden [
10], a new concept of heat distribution with lower temperatures for sparsely populated areas is proposed to achieve better utilization of solar energy. The proposed distribution concept reduces the initial cost by 1/3 compared to the conventional concept. In the study optimizing the DH for the city of Zagreb, it was found that the interconnection of the DH system and the implementation of heat pumps and electric boilers reduced CO
2 emissions by 15.3% compared to the reference case [
11].
It is well known that district heating and cooling (DHC) systems can offer great benefits, but more efforts are needed to analyze and realize all the benefits of those systems [
12]. A heat supply network that uses water as a heat carrier and serves as a heat source or heat sink for heat pumps placed in heat substations is called a 5th generation DHC [
13]. That is an already well-known water loop heat pump (WLHP) system [
14]. The low temperature of the heat carrier allows the use of waste heat and RES for heating. There are similarities and differences between 4th- and 5th-generation DH in terms of goals and opportunities. The designation of the 5th generation DHC system does not imply that it is superior to the 4th-generation DH but is considered a complementary technology [
15].
Low-carbon, RES, and thermal energy storage technologies can be easily integrated into DH systems to improve overall system efficiency and reduce greenhouse gas emissions. The integration of heat pumps into DH systems is considered to be the implementation of a renewable energy technology that can achieve European energy and climate goals [
16]. A group of authors compared centralized and semi-centralized DH systems using the dynamic simulation software Trnsys for a case study in Finland. The study showed that the area of solar collectors, the volume of domestic hot water (DHW) tanks and heat losses in decentralized systems can be smaller than in a centralized system [
17]. A group of authors investigated the possibility of implementation of R744 heat pumps and photovoltaic (PV) power plants in the DH system using Trnsys simulations on the case studies for the cities of Turin and Naples in Italy. In the case study for Naples, primary energy consumption was reduced by 58%, with a payback period of 4 years. In the case study for Turin, primary energy consumption was reduced by 76%, with a payback period of 10.6 years compared to the reference case [
18]. The optimization model was developed for the sizing and operation of the district heating system in the case study for the city of Zagreb in Croatia. The optimal scenario with economic and environmental benefits, which includes a heat pump, gas-fired boiler and thermal energy storage, achieves a 10.14% reduction in the heating price and a 54.7% reduction in CO
2 emissions compared to the reference scenario [
19]. The integration of high-temperature heat pumps in 3rd-, 4th- and 5th-generation district heating and cooling systems have been analyzed in [
20]. Depending on where the heat pumps are placed in the district heating and cooling system, the COP of heat pumps is determined for twelve different scenarios. When a combination of heat sources is used to operate a heat pump, a better COP is obtained. A study of heat pump use in district heating systems in Finland [
21] shows that the greatest potential for the introduction of heat pumps is in small district heating systems, which helps to reduce the use of fossil fuels. Sustainable heat production by heat pumps in district heating systems in Finland is approximately 10–25%. A comparative analysis of different scenarios for connecting energy communities with district heating systems was carried out to obtain better energy and economic results in a case study in the town of Corticella in Italy [
22]. It was pointed out that surplus electrical energy generated by photovoltaic systems can be used to run heat pumps. The best-case scenario of that study achieves a reduction in energy consumption of approximately 11% and a reduction in CO
2 emissions of 12% compared to the reference case. The integration of temperature high-temperature heat pumps (HTHP) into the DH system is shown in the research on the case study of the DH system in Stockholm [
23]. The DH system is heated by HTHP, which uses waste heat from supermarkets as a heat source. In addition, the DH system is used as a heat source for an HTHP that provides heat for industry. It was pointed out that such an approach can reduce CO
2 emissions in Sweden by up to 98% compared to natural gas-fired boilers. The optimization of the existing heat generation system by integrating an air-to-water heat pump, ground source heat pump and condensing boilers in the DH system is presented based on a case study for Padua, Italy [
24]. Results indicate that lowering the working temperature in the DH network and reducing the thermal load to maintain the energy demand of the users is crucial. The proposed system achieves savings in primary energy consumption of 14%.
The integration of heat pumps into existing DH systems will play a key role in the supply of heating energy. Thermal networks can be divided according to temperature regimes: high temperature 100/50 °C, low temperature 80/40 °C, very low temperature 60/30 °C, ultra-low temperature 45/30 °C and thermal grids 28/8 °C applicable for the 5th generation DH systems. There are several approaches to the integration of heat pumps into DH systems. Barriers to faster integration of heat pumps into DH systems are low heat source temperatures, high existing building’s heating system temperatures and lack of experience of district heating providers [
25]. To increase the use of RES, temperature reduction in the piping network is required. Oversized heating systems in older existing buildings and energy renovations of buildings allow the use of a lower heating temperature. In most cases, the district heating supplier does not know the required temperatures in the building distribution and emission subsystems, so their exact calculation is required [
26].
Low-temperature distribution is the biggest challenge in DH system retrofit. Recommendations for improving 3rd- to 4th-generation DH systems include avoiding recirculation between the supply and return pipe of the distribution network, measuring individual consumption, monitoring all parameters of the pipe network and installation in buildings, increasing the capacity of heat exchangers in substations, increasing the capacity of radiators, hydraulic balancing of piping in buildings, and protecting against Legionella in DHW systems [
27].
The transformation of existing DH into new sustainable district heating systems and the transition to new generations requires new planning methods [
28]. Dynamic modeling is required to predict the behavior of complex DH systems. Heat pumps are environmentally friendly as they reduce greenhouse gas emissions and energy consumption. More case studies with energy and economic analysis of heat pump systems in DH are needed, which would increase transparency and applicability compared to conventional heating systems [
29]. Dynamic simulation using general-purpose modelling tools is considered a key method for developing new DH systems. Causal modelling using Trnsys software allows faster model development, while acausal modelling using Modelica has an advantage in terms of physical modelling. An insufficient number of studies were conducted yet on modelling of large DH to conclude which modelling approach is more favorable [
30].
In this paper, a case study is conducted for the complete renovation of the DH system considering the production, distribution, and consumption subsystems. This study aims to determine the renovation potential of the building envelope for the reduction in the heat supply temperature in the DH system, followed by the implementation of heat pumps using natural refrigerants to reduce fossil fuel consumption and CO2 emissions. The required energy for building and DHW heating was determined by dynamic simulations.
Compared to previous research addressing the conversion of 3rd- to 4th-generation DH, this work provides a detailed approach to modelling the complete DH system, which includes the production, distribution, and consumption of thermal energy for building and DHW heating. Such a comprehensive approach has not been used in previously mentioned studies.
2. Materials and Methods
This paper presents a case study of the complete refurbishment of the Kozala district heating system in the city of Rijeka, Croatia, considering the generation, distribution and consumption subsystems. Dynamic simulations were performed using Trnsys software for three variants of heat generation systems and three energy price scenarios. Using the geometry and physical properties of buildings connected to the DH system, thermal models of consumers were created. Simulations were performed for two cases, first with the present characteristics of buildings’ envelopes and second with all the building’s energy retrofitted by improved thermal insulation. The DHW heating system is considered as well. DH pipeline network simulation model was created to calculate heat losses in the pipe network. Validation by comparison with long-term measured values was performed for the models of building heat consumption, DHW consumption, DH pipe network losses and present heat generation system efficiency and fuel consumption.
The minimum required supply temperatures of the DH network differ from the original design temperatures and were calculated considering two cases, first with the present state of the installed radiators which was changed since the original construction and design and in the second case with all radiators kept according to the original design when the buildings were built. Two new systems for generating thermal energy were proposed, comprising water-to-water heat pumps using natural refrigerants. Energy efficiency analysis was performed for all three systems.
2.1. Method
The purpose of this case study is to compare energetic and economic indicators of analyzed DH systems. The energetic indicators include primary energy consumption, renewable energy share, and CO2 emissions. The possibility of making the system fully renewable by covering the non-renewable share of energy consumption is also considered.
2.1.1. Energy Performance Calculation
The consumption of an energy carrier of the DH system expressed in energy units Es,cons,i can be estimated by numerical dynamic simulation of the system or by experimental measurements. In this study, it is estimated by numerical dynamic simulation.
The output data from the simulations are the consumption of thermal energy (DH system thermal energy production) and input energy necessary for DH system operation. The costs are calculated from the input energy which was integrated over one year.
Generally, for systems which consume and produce energy (electric or thermal) to satisfy consumer’s needs, the energy imported into the system
Es,imp,i is calculated by subtracting the energy consumed
Es,cons,i from the energy produced
Es,prod,i:
The total primary energy consumption
EP is calculated with the factor for nonrenewable energy
fimp,nren,i for each carrier of imported energy:
For non-renewable energy sources such as natural gas, the calculation is simple because these energy sources cannot contain renewable energy. For electricity, the situation is different since the sources of electricity may vary from country to country. Using the national share of non-renewable energy (
fee,nren), which is hereby evaluated using the structure of electric energy use for Croatia [
31,
32] non-renewable part of consumed electricity linked to carbon dioxide emissions can be calculated with an approximate value of
fee,nren = 0.5 as:
To compensate the amount of non-renewable electric energy consumed PV systems should be sized to produce enough electricity to cover it.
The indicator of primary energy consumption
EPI is derived using a net usable building area.
The renewable energy share
RES is determined as
Here, Es,cons,res is the renewable energy used in the system, which is zero for a system completely powered by a non-renewable energy source (e.g., natural gas), or equal to the thermal energy from the heat source for the DH system operating with heat pump.
2.1.2. Cost Performance Calculation
Global costs are accounted for by investment, operating, and maintenance costs. By applying the discount rate using a discount factor, the global costs are expressed as a value in the initial year:
where
τ is the calculation period,
CI is the initial investment cost for HVAC and PV system,
Ca is the annual operating cost multiplied by
Rd which is the average discount factor calculated for each year of the evaluation period, and
Vf,τ is the average residual value at the end of the evaluation period. This calculation procedure is repeated for each year of the calculation period. The discount factor is calculated as:
where
p is the number of years from the starting period and
r is the real discount rate.
The indicator of global cost
CI is derived using a net usable building area.
2.1.3. Emissions
CO
2 emissions
mCO2,i are calculated for each energy source using emission factors
fem,i set at the national level:
2.2. Case Study District Heating System
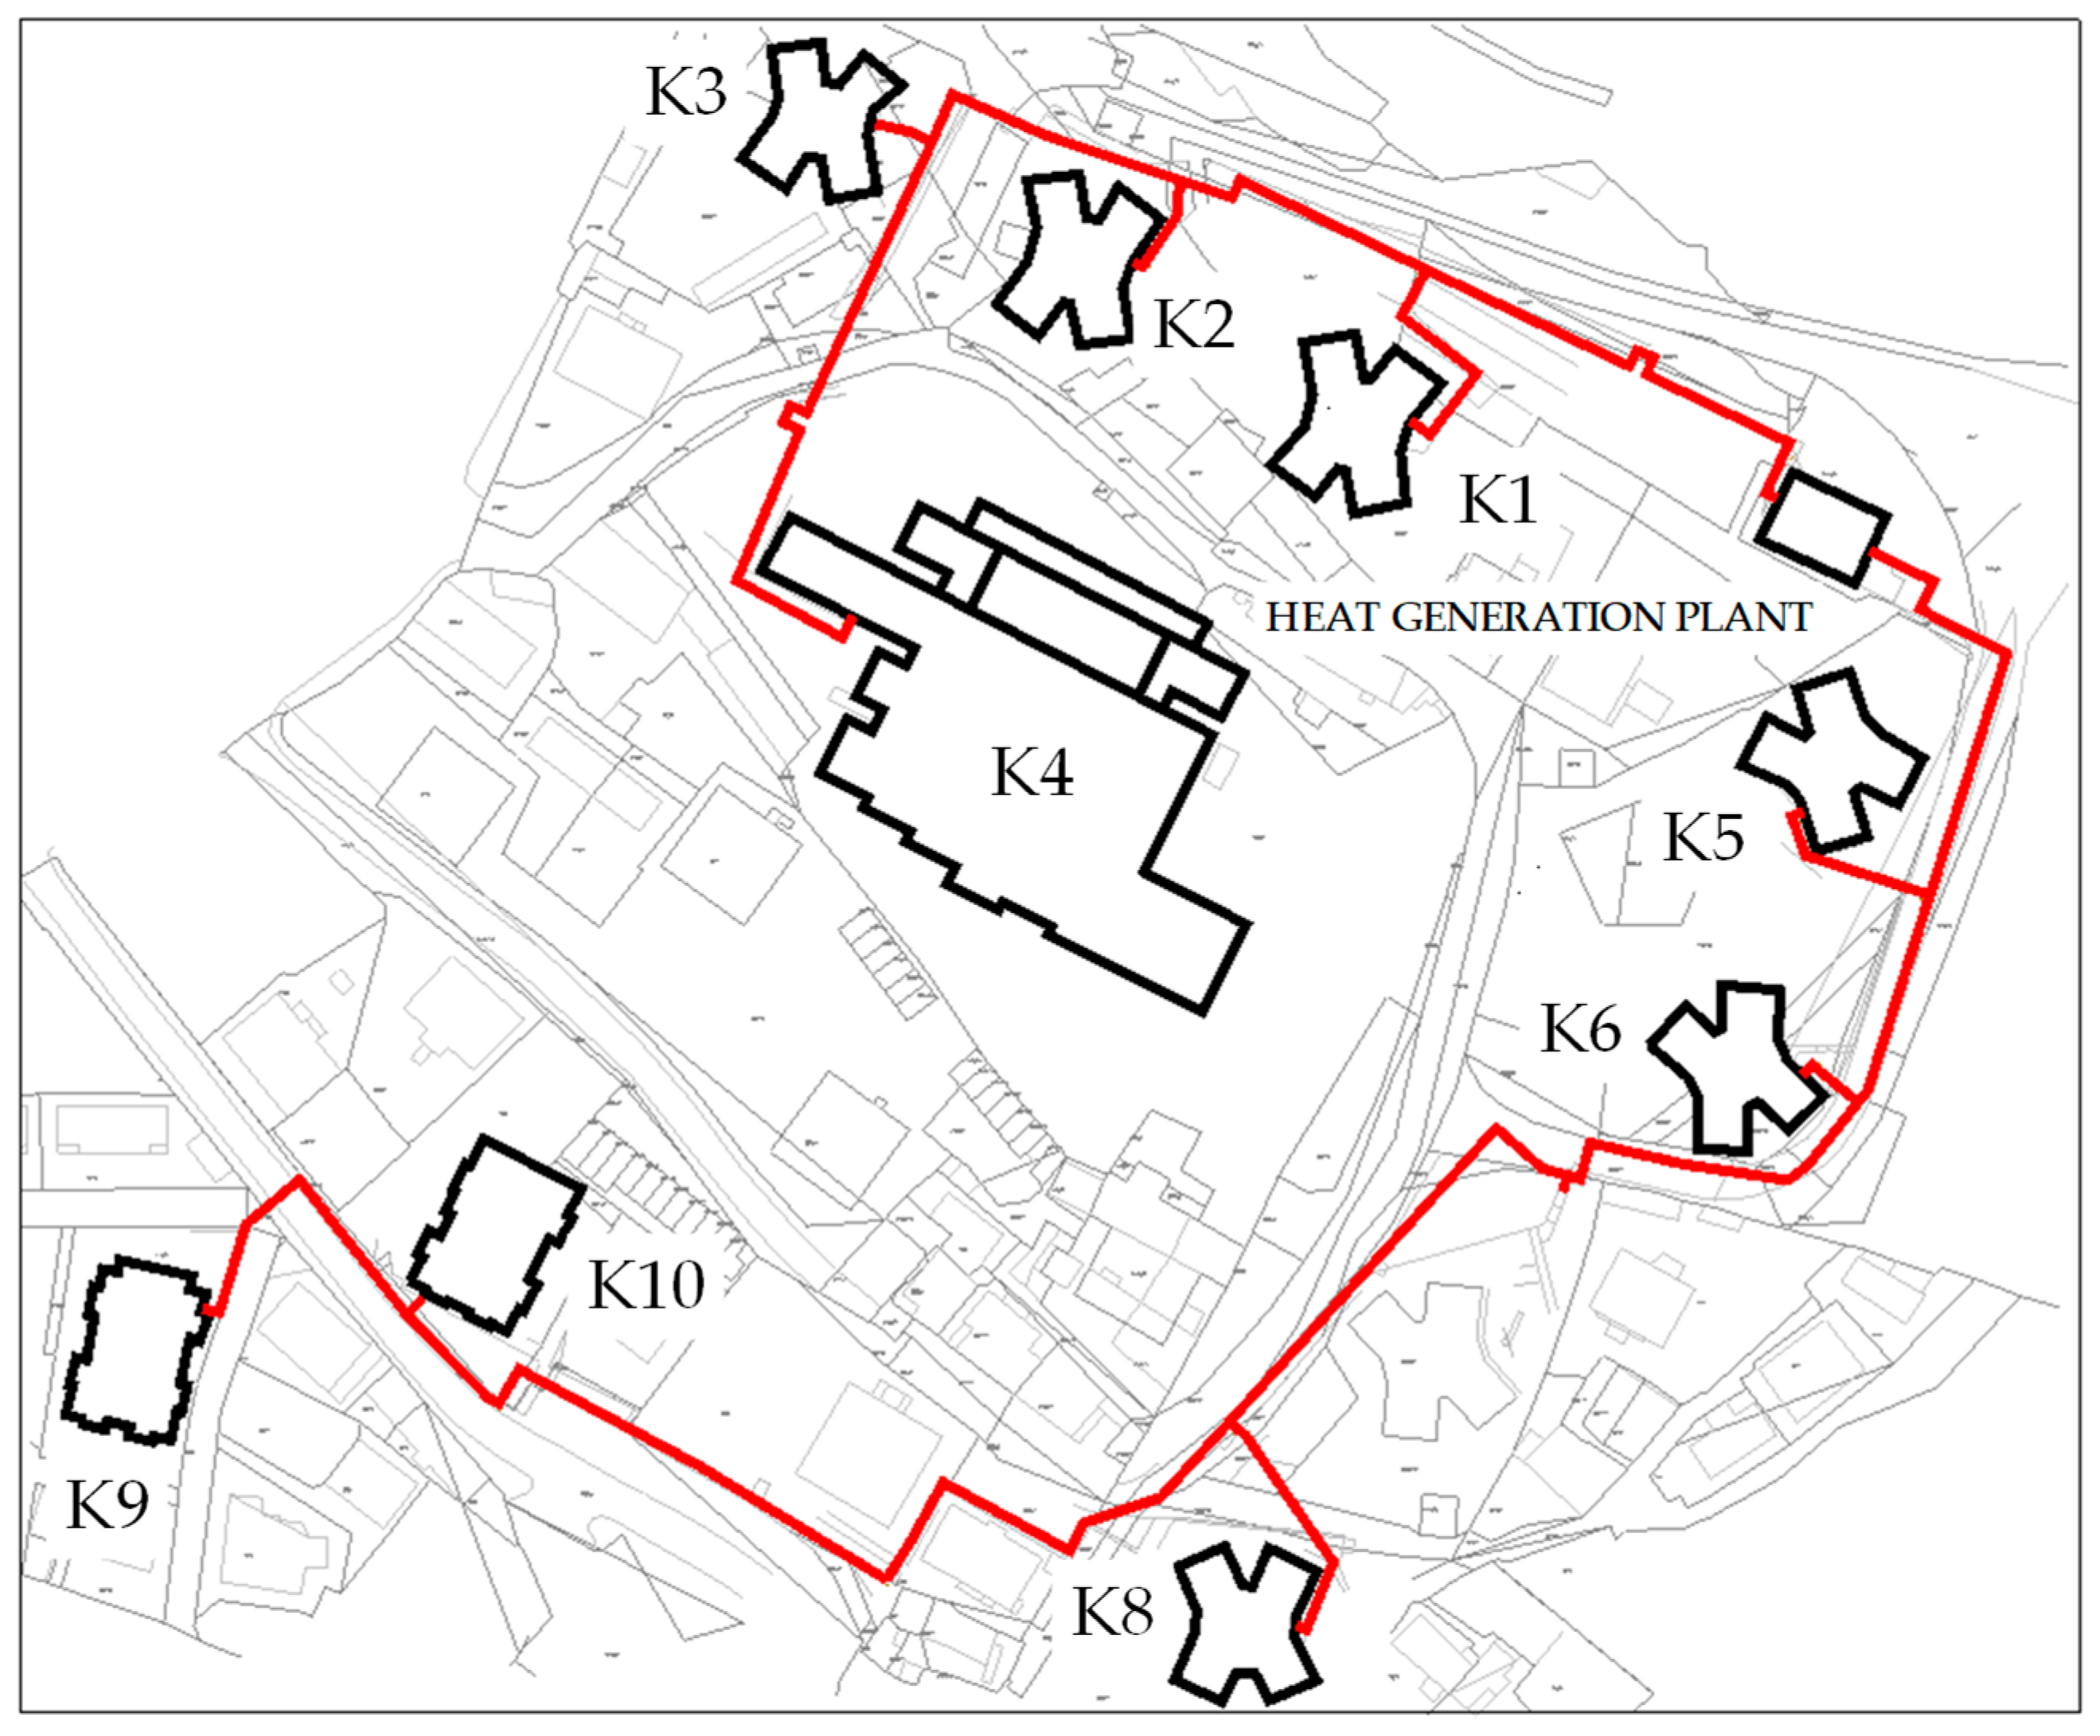
The Kozala is a district in the city of Rijeka, Croatia. The Kozala DH system was built in the period between 1969 and 1973. In the period from 1969 to 1987, a total of 10 buildings were built and connected to the DH system. Between 1969 and 1973, three buildings with 22 floors (K1, K2 and K3) and four buildings with 13 floors (K5, K6, K7 and K8) were built. The elementary school (K4) was built in 1970. In 1984, the 16 floors building (K9) was built and in 1987 the 18 floors building (K10) was built. Each building has its thermal substation where thermal energy is exchanged between the DH system and the building or DHW heating subsystems. The heating plant was constructed as a separate building near the K5 building. The peculiarity of the system under consideration is that the heat supplier (the municipal company Energo) owns the heating plant and the distribution network, while the apartment owners own the substations in the buildings, the building internal distribution network and the radiators.
2.2.1. DH in Present State
Considering the technology used and the period in which the Kozala district heating system was built, according to [
8] it belongs to the 3rd-generation of the district heating system. The ground plan is shown in
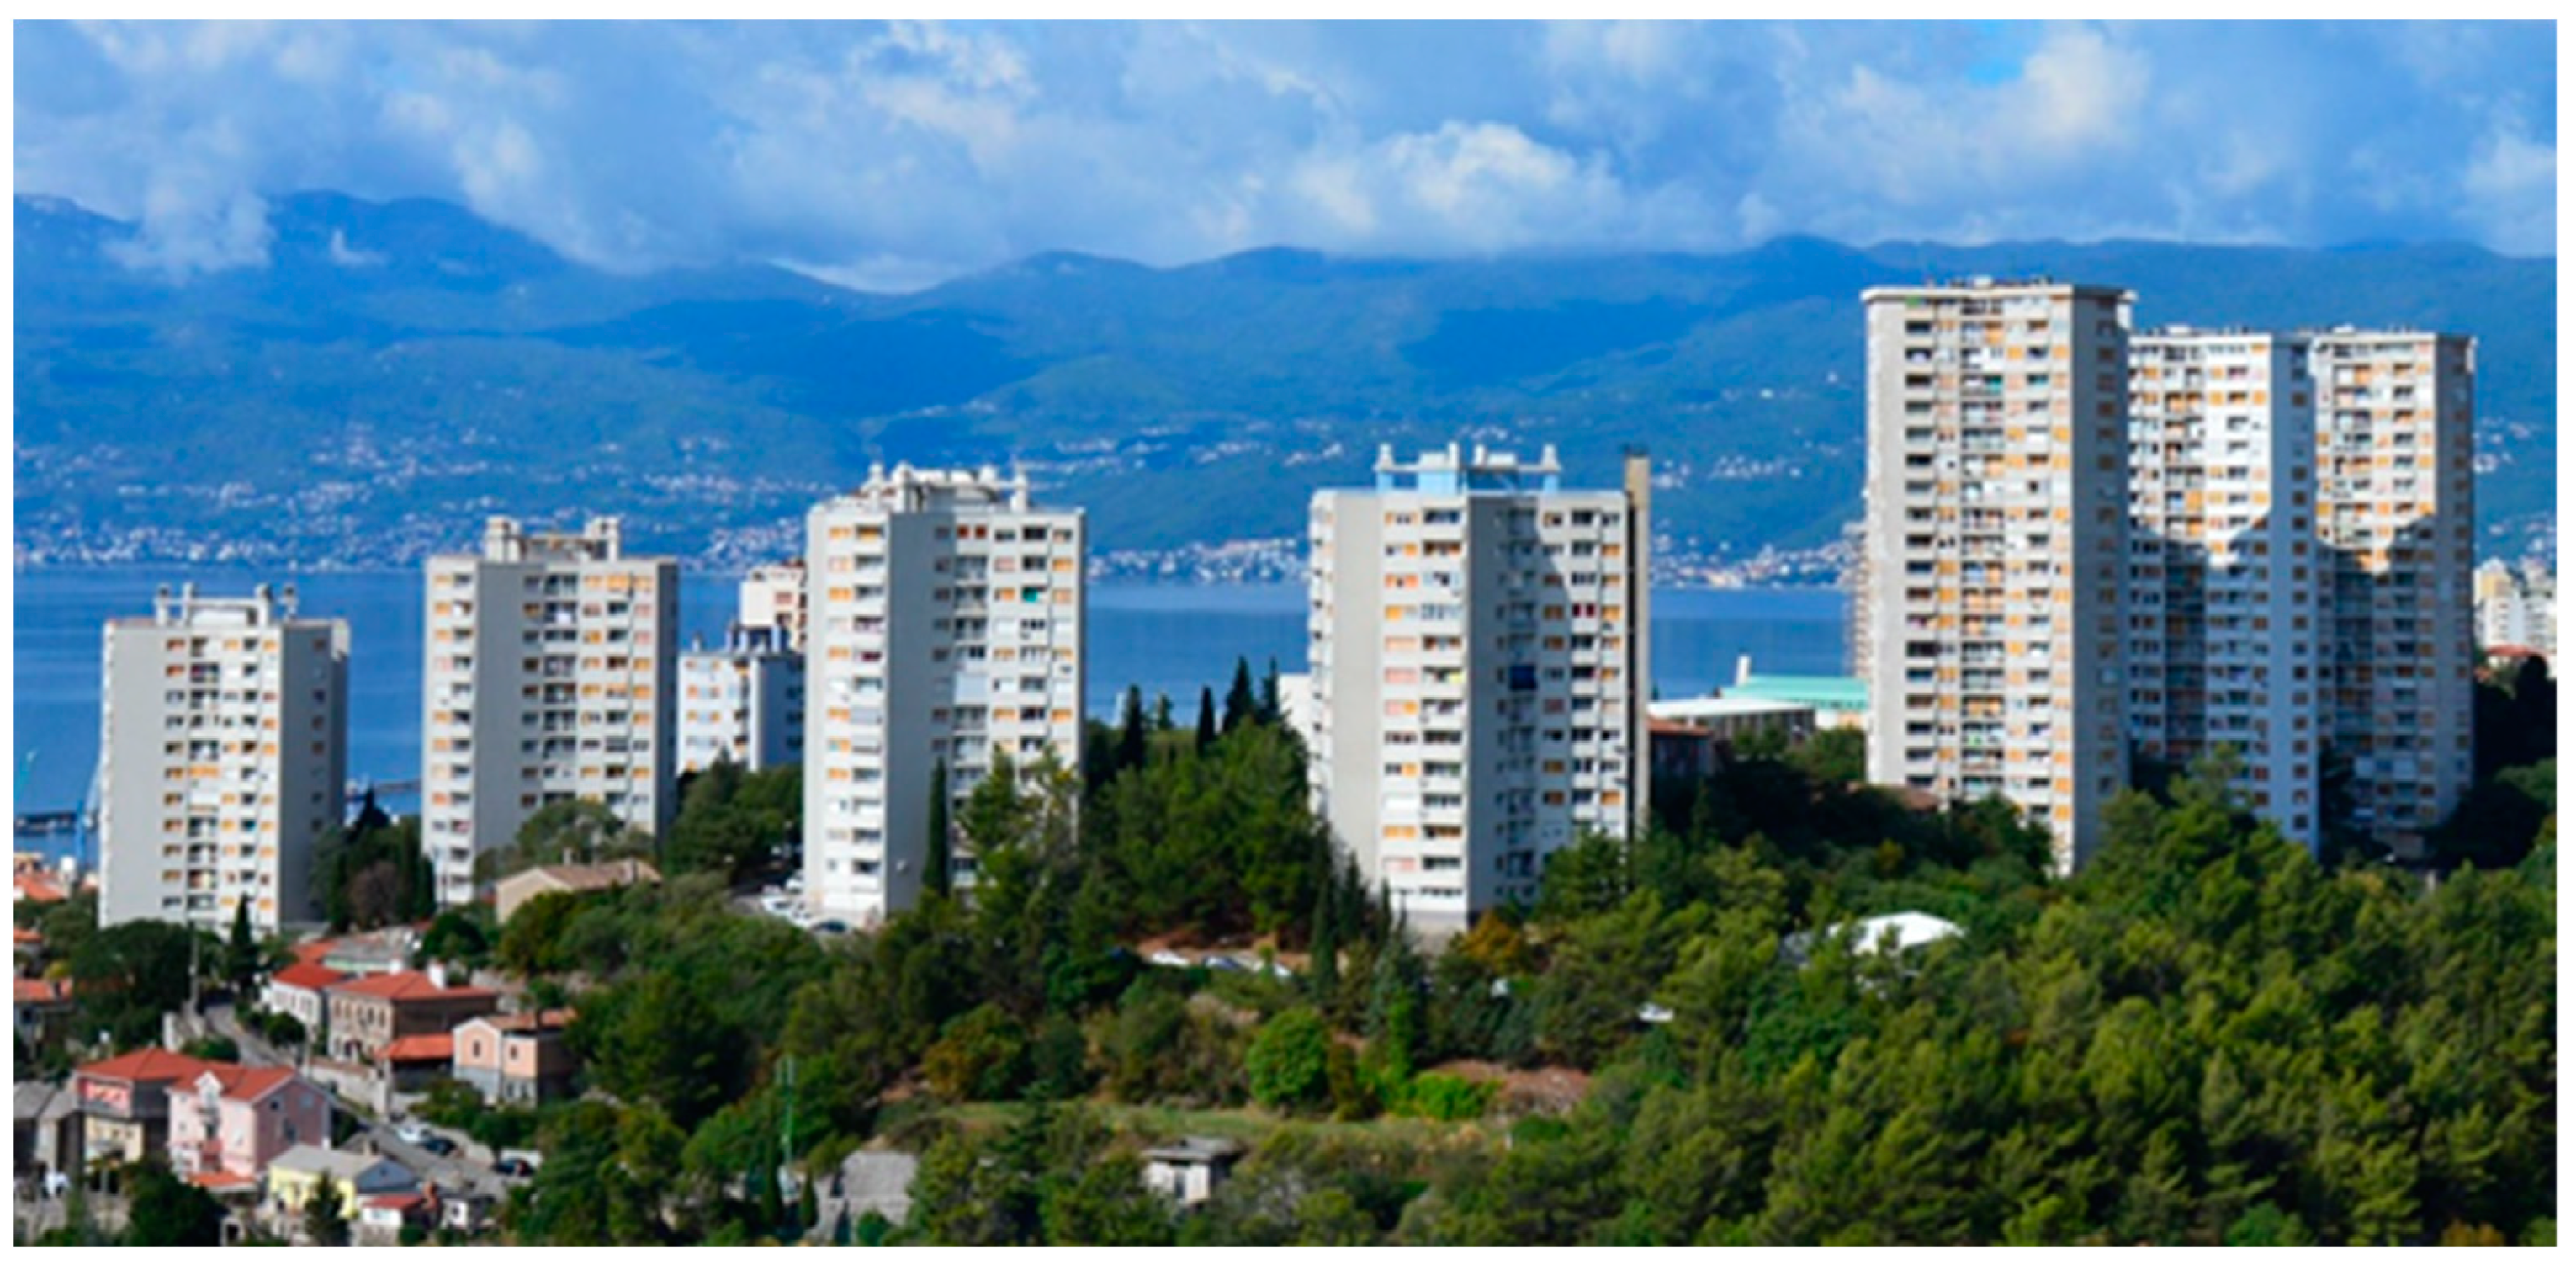
Figure 1. Buildings connected to the DH system are shown in
Figure 2.
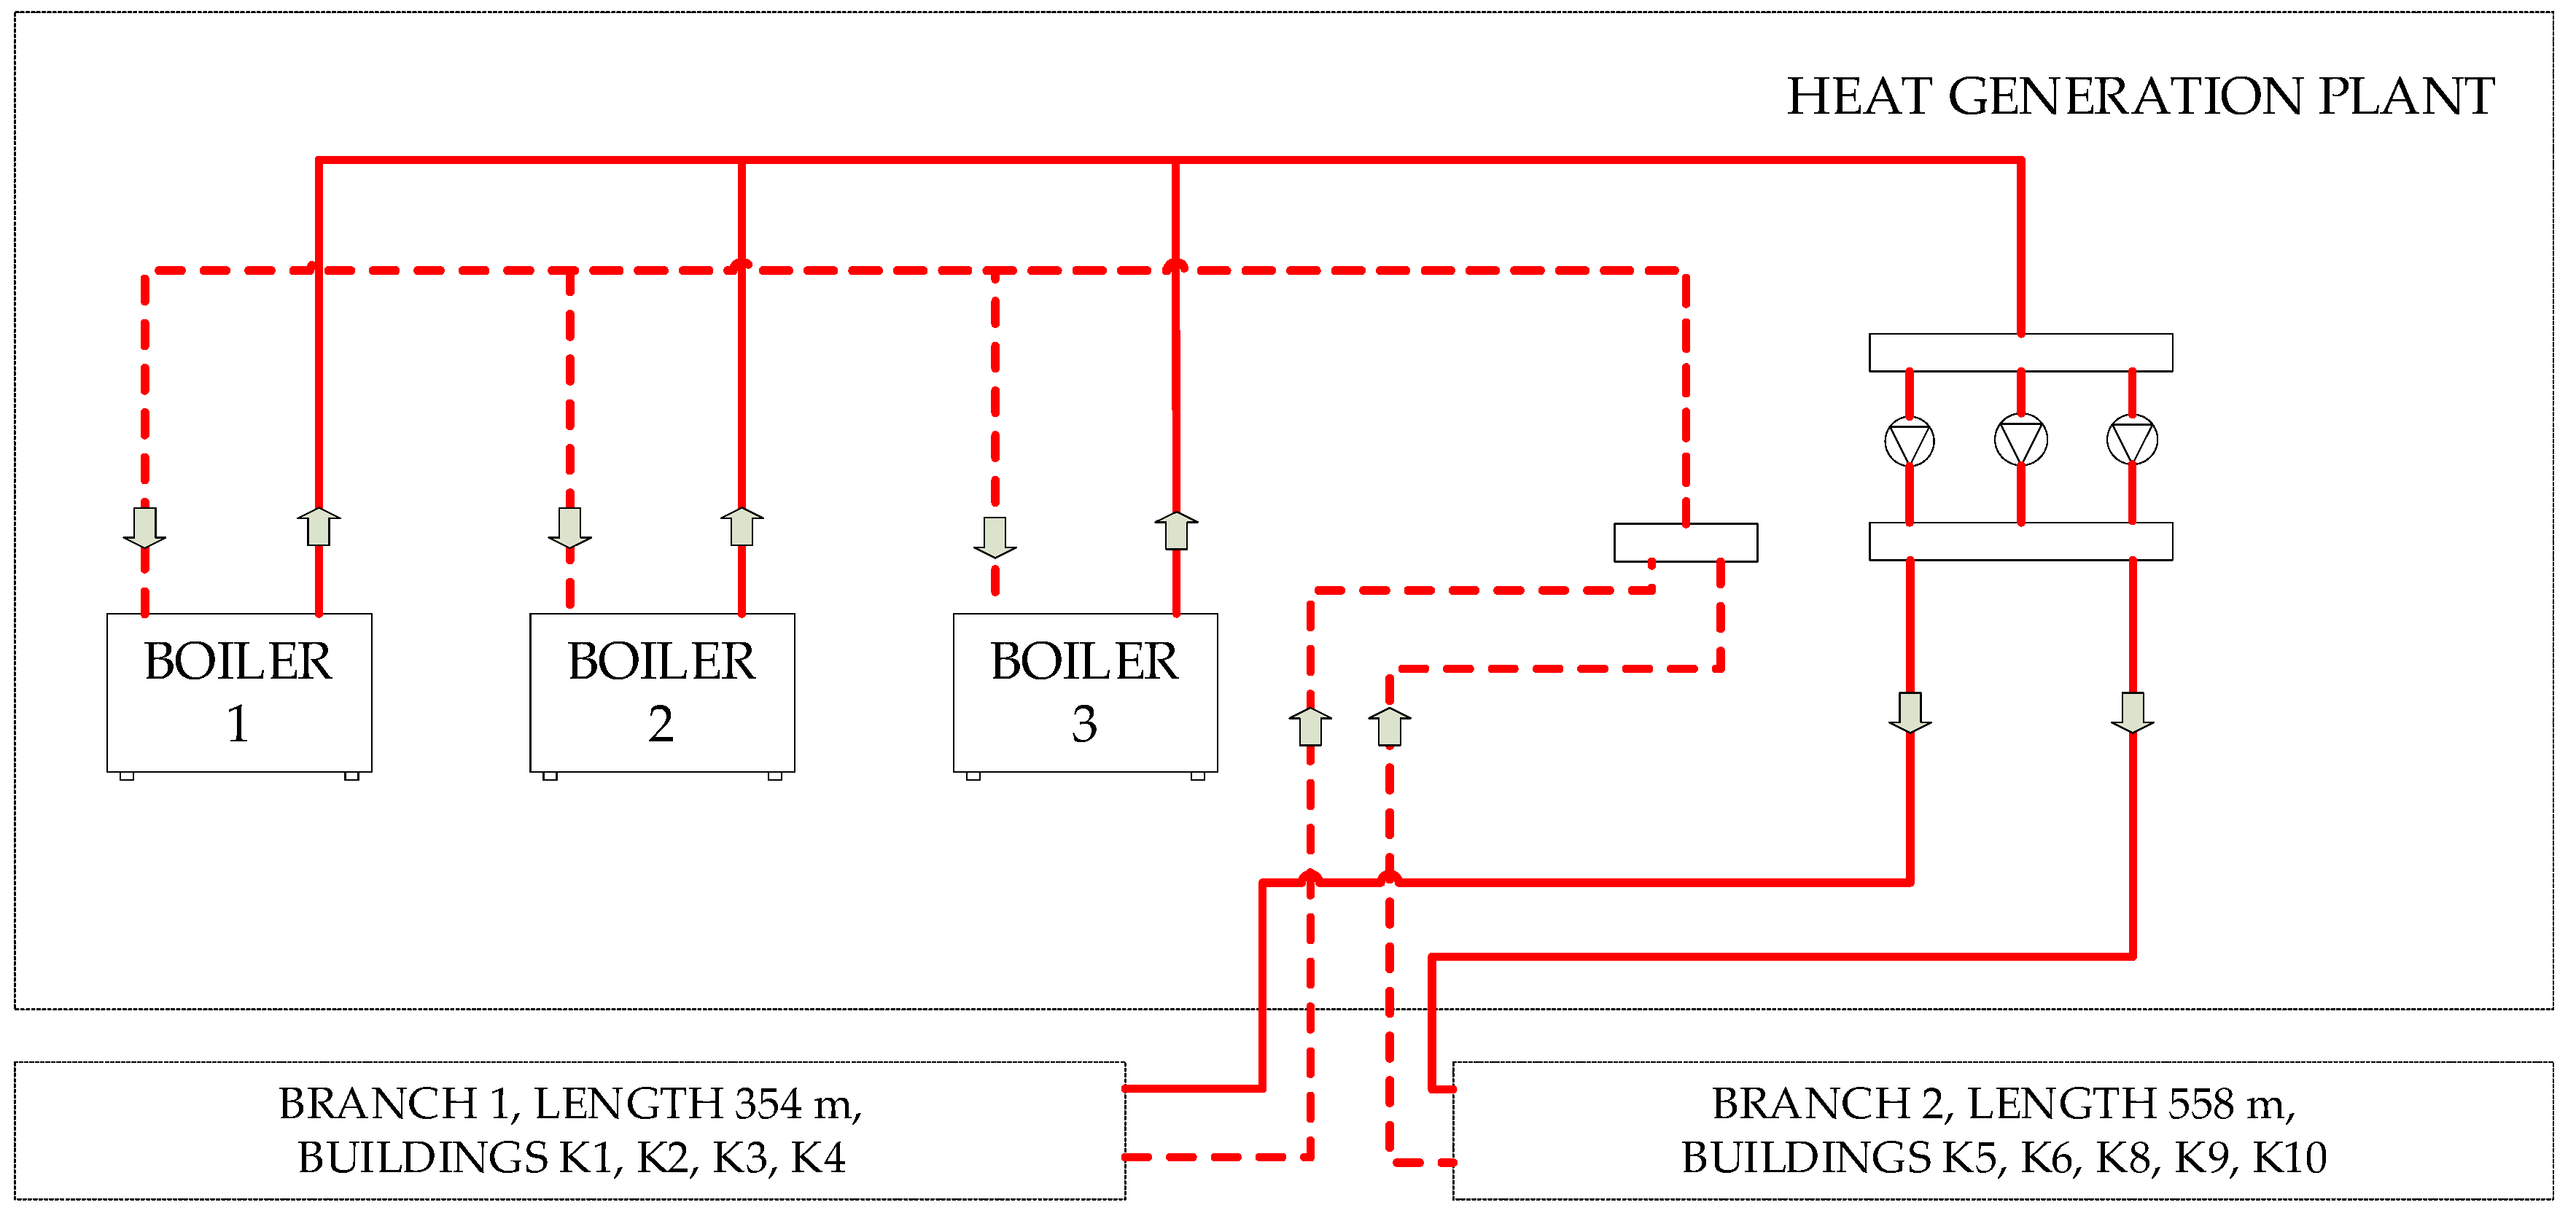
The heating plant provides a centralized supply of thermal energy. In the initial phase of its operation, fuel oil was used. The system is designed as a hot water system with a temperature regime of 130/70 °C with temperature glide adjusted according to ambient temperature. In 2001, it was reconstructed to allow the use of mixed gas (LPG-air) and natural gas, which is used today. Three boilers are in operation and provide a total output of 9240 kW. Today, all three boilers operate with a variable supply temperature that occasionally, in the coldest weather, reaches 105 °C. The schematic of the existing heating plant is shown in
Figure 3.
Hot water is distributed from the boiler room to the heating substations via distribution pumps. Three distribution pumps with a total electrical power of 22.4 kW were installed.
The distribution system consists of two branches. Buildings K1, K2, K3 and K4 are connected to the first branch with a 354 m long footprint. Buildings K5, K6, K8, K9 and K10 are connected to the second branch with a 558 m long footprint. In 2018, both branches of the piping system were replaced with a new pre-insulated twin pipe system which reduced heat losses. After that piping reconstruction in 2019, measured heat losses were equal to 10.6% of produced thermal energy, which is considerably less compared to heat losses in 2018, which were 19.7% of produced thermal energy.
Energy consumption in the DH system has been permanently monitored by heat meters positioned in the central heating plants as well as by heat meters positioned in substations. The measured data were obtained from the heat supplier, processed, and presented in
Table 1. The average annual heating water temperature was 90/70 °C.
The heating period begins when the outdoor air temperature falls below 12 °C at 9 P.M. for three consecutive days. The heating period ends when the outside temperature rises above 12 °C at 9 P.M. for three consecutive days. The beginning and the end of this period differ from year to year, but on average the heating period begins around October 15 and ends around May 15, so this is the period used in simulations. There are two types of substations: combined substations for the building and DHW heating (K1, K2, K3, K4, K9, and K10) and substations for the building heating (K5, K6, and K8). An indirect system is provided by heat exchangers. In 2019, building K7 was excluded from the district heating system on consumers’ demand as they were not satisfied with the prices of energy supply and has not been included in this study. The apartments in the buildings are heated by radiators. The pipe system in the buildings consists of horizontal pipes on the ground floor of the building and vertical pipes to the radiators on the upper floors of the building. The supply temperature is controlled depending on the outdoor air temperature.
Table 2 shows the main features of the considered district heating system. Consumption data were obtained from the heat supplier for the year 2019 which presents the state with the renewed pipeline distribution system.
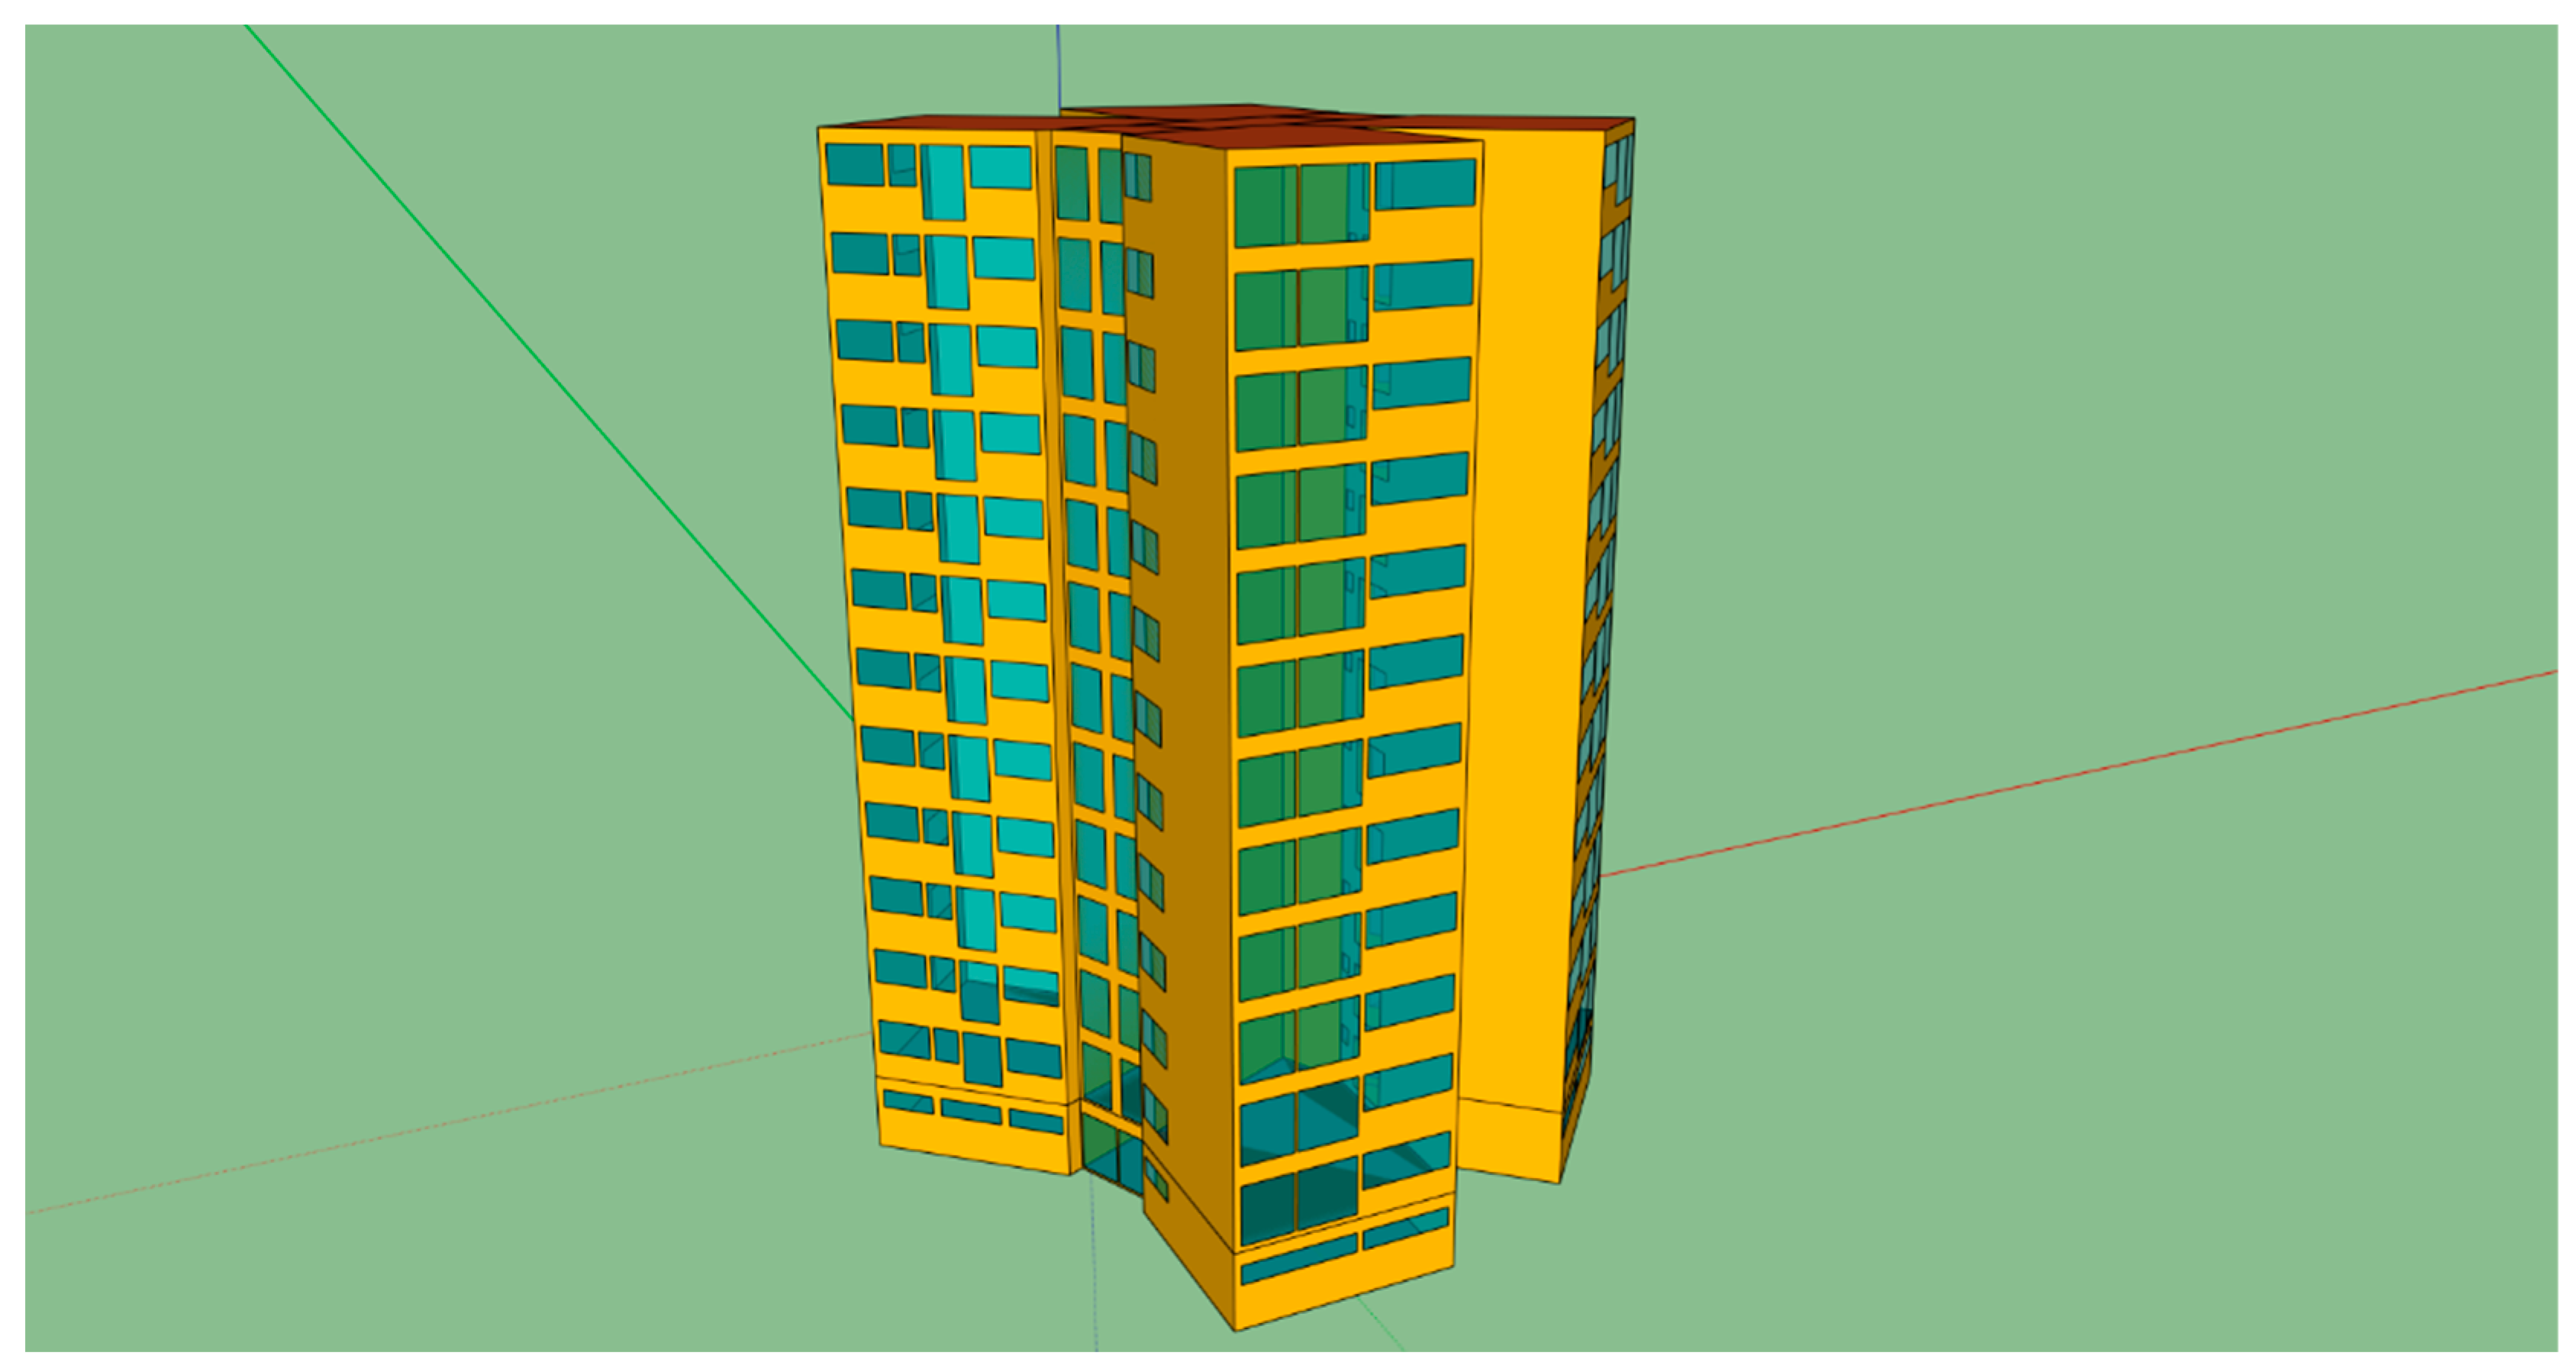
2.2.2. Data Collection and Building Simulation
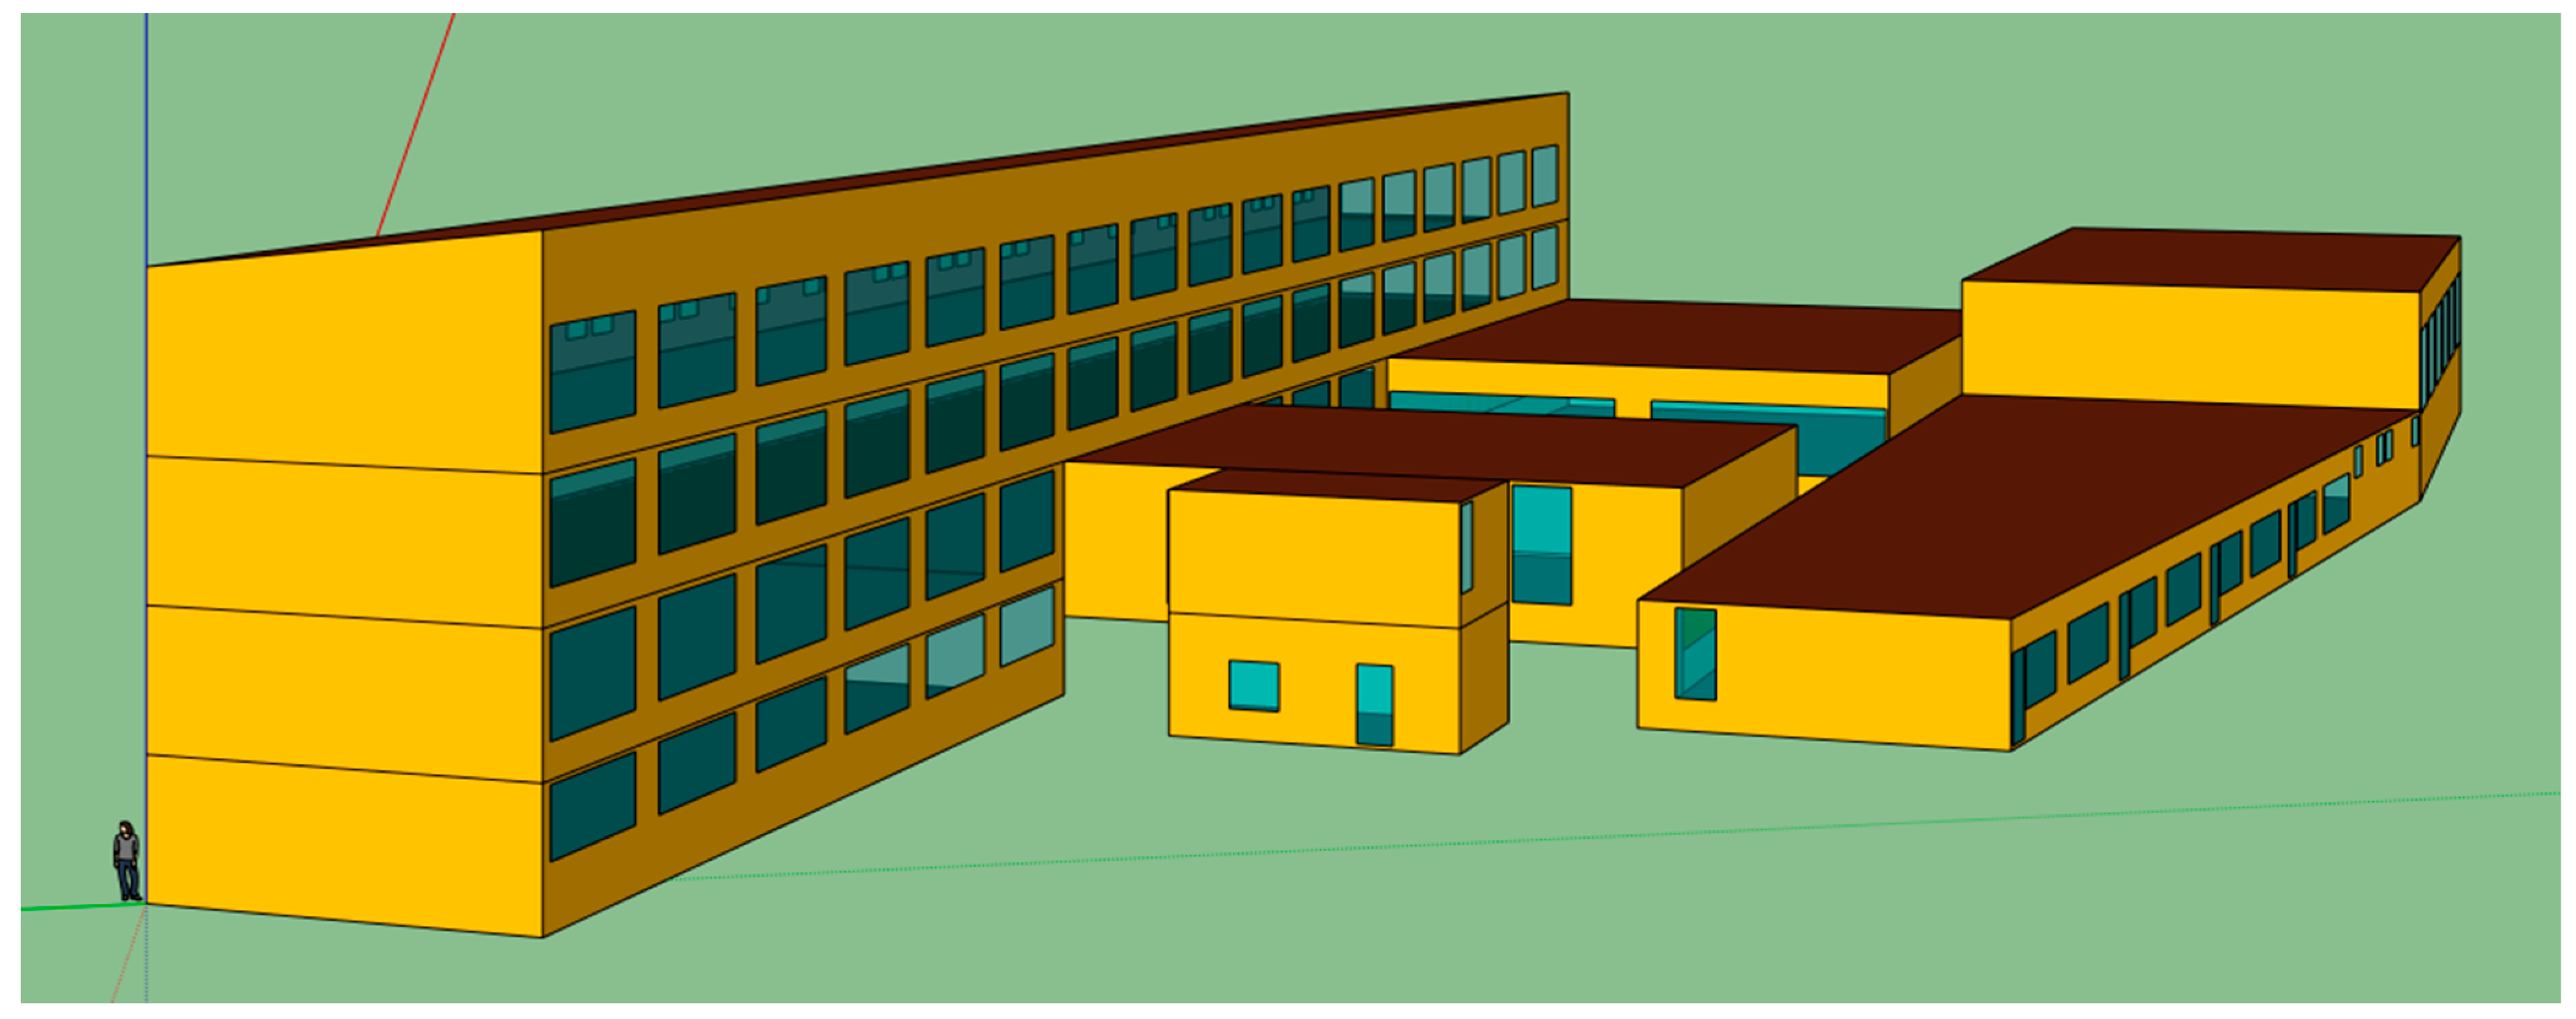
Developing a realistic DH system simulation model required collecting and processing relevant data from heat suppliers. Original designs of buildings connected to the DH system were collected, as well as data on actual radiators installed in the buildings (some owners arbitrarily changed radiators in their apartments during the period of system operation). Data on monthly heat consumption of natural gas and distributed thermal energy for building and DHW heating were obtained from the heat supplier. Based on the building geometry, simulation models were created to simulate the heat consumption of the DH system. These models were first drawn using the program Google Sketchup [
33] with the Trnsys3D plugin [
34] shown in
Figure 4 and
Figure 5, and later imported, developed, and calibrated using Trnsys Type 56 multizone building model [
35]. Buildings K1, K2, and K3 have the same shape and physical characteristics, so the same model is used for those buildings. Buildings K5, K6 and K8 are also identical, which also resulted in a single model for those buildings.
Internal heat gains, infiltration and minimal ventilation are calculated according to present Croatian regulations [
36]. Meteorological test reference year (TRY) data for the city of Rijeka are created using Meteonorm software [
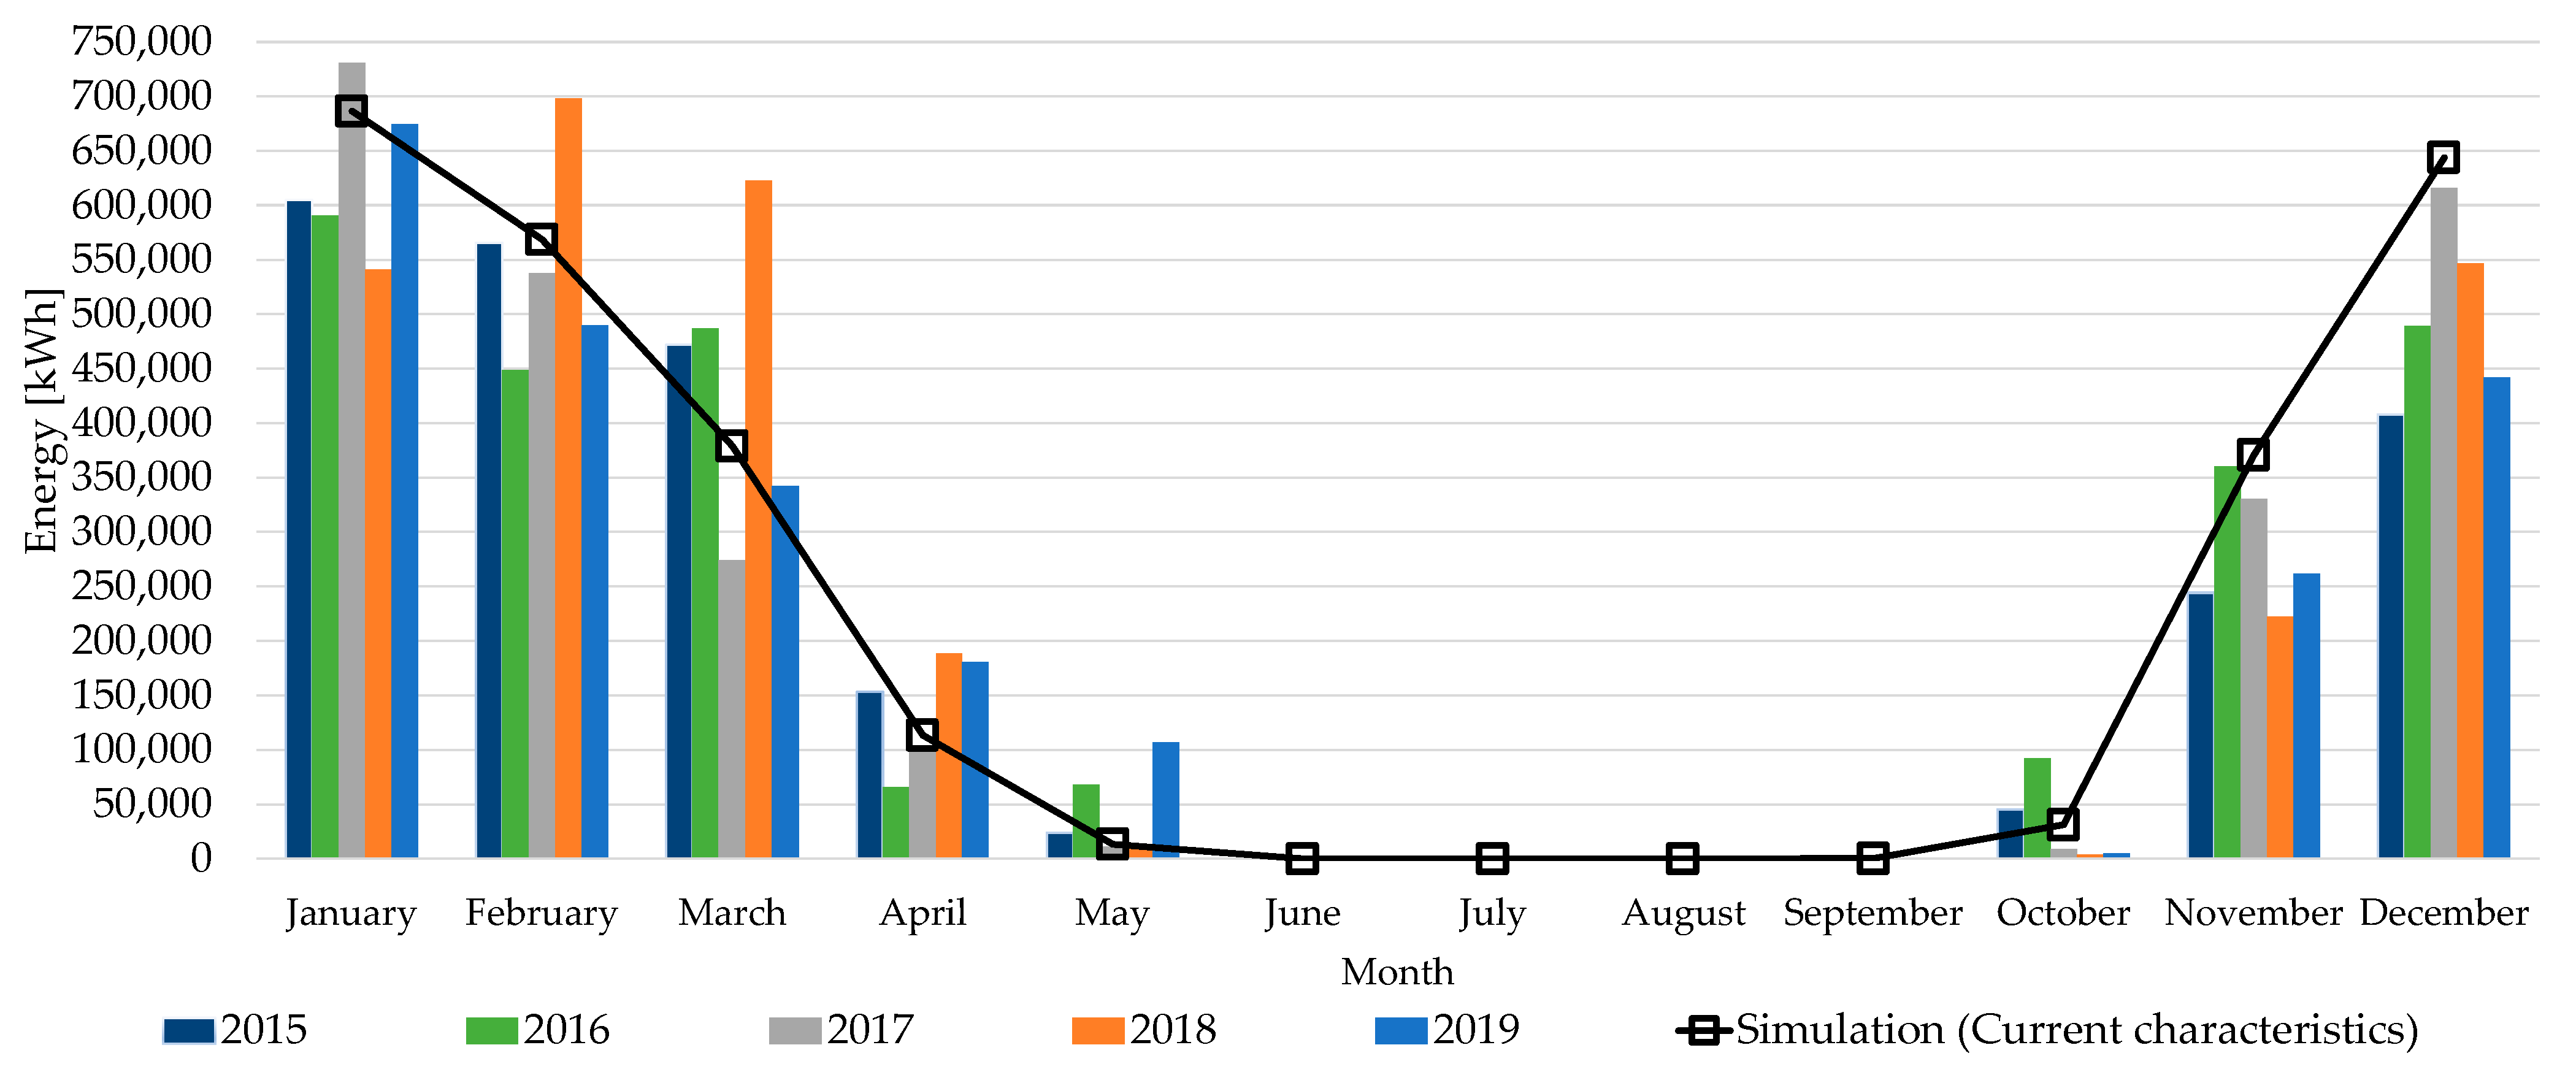
37]. The present physical properties of the building envelope were used to define boundary elements. This state of the building is referred to as PB (present state of the building) in the rest of this paper. A year-round simulation of the useful energy for heating was performed with a time step of one hour. To evaluate the whole model, the first step was to analyze the building models in the present state and to validate them to be a reliable representation of the actual buildings connected to the DH system. For validation of baseline models, the simulated useful energy consumption values were compared to the actual energy consumption reported by the heat supplier. Satisfactory agreement was found between simulated and actual heat consumption. The difference between the simulated results and the annual average of the considered period is 11%, which is due to the different meteorological conditions between the considered period and TRY data, as well as to energy renovations in the considered period. A comparison of the measured and simulated results of heat consumption for heating buildings is shown in
Figure 6.
After the design and validation of the thermal models, a case of reduced thermal energy consumption in the DH system is considered. In this case, the building envelope of all buildings connected to the DH system was refurbished. Energy refurbishment means the implementation of the physical characteristics of the building envelope (improved thermal insulation) according to the current national regulation [
38] which is in accordance with the EU directives. This state of the building is in the further text referred to as RB (energy renovated building).
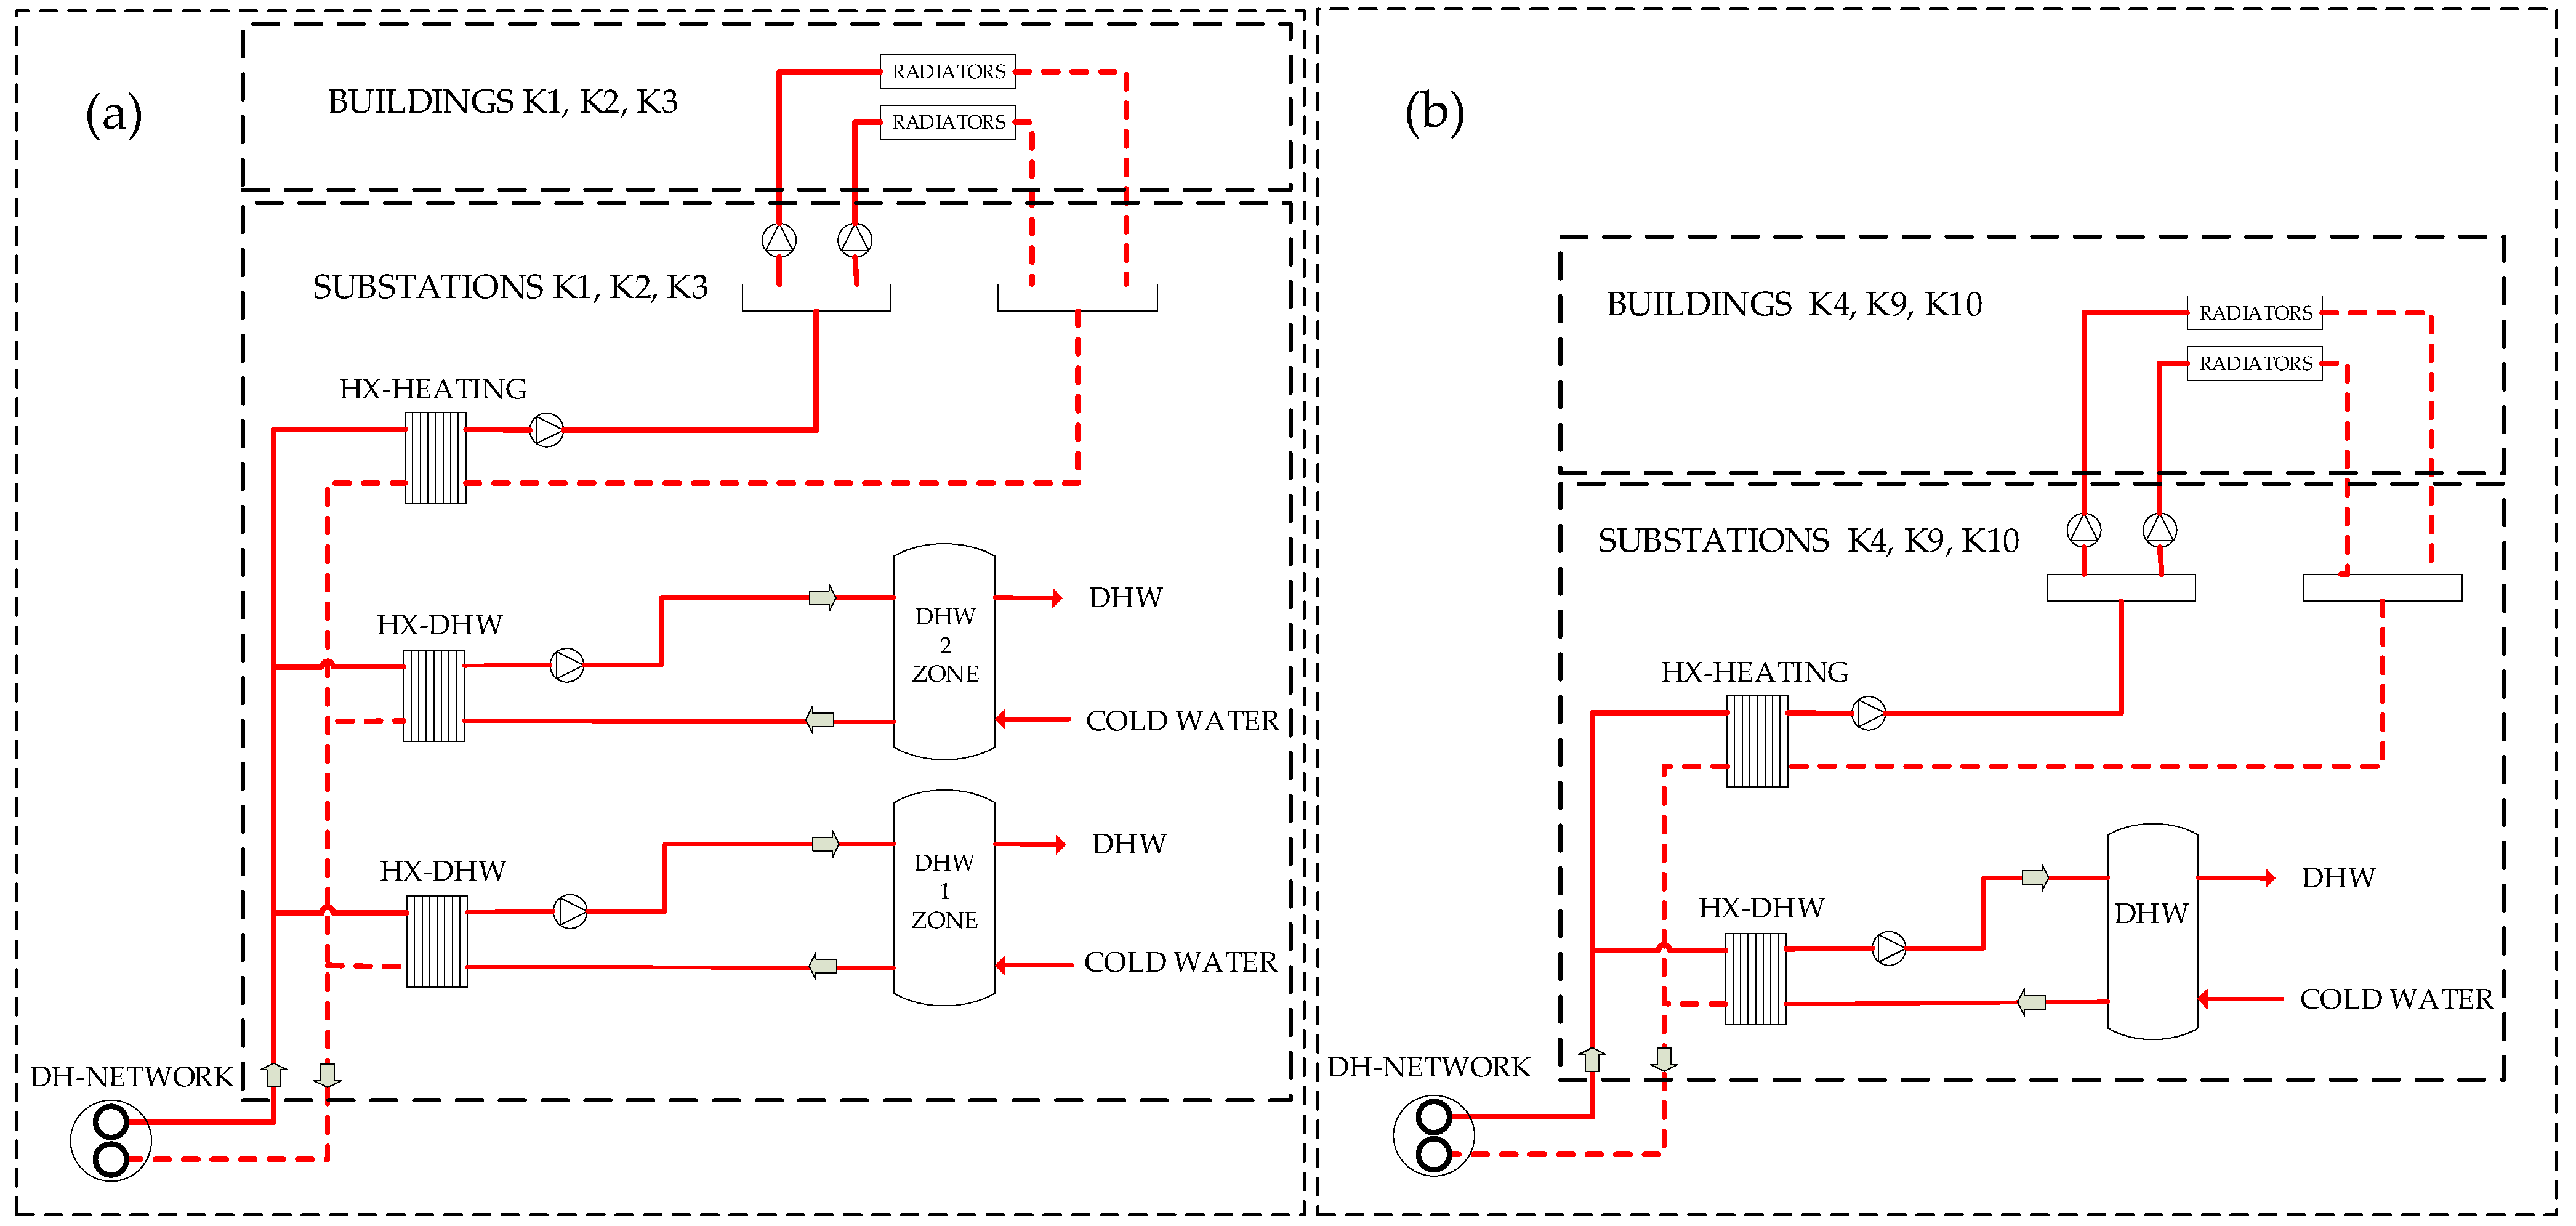
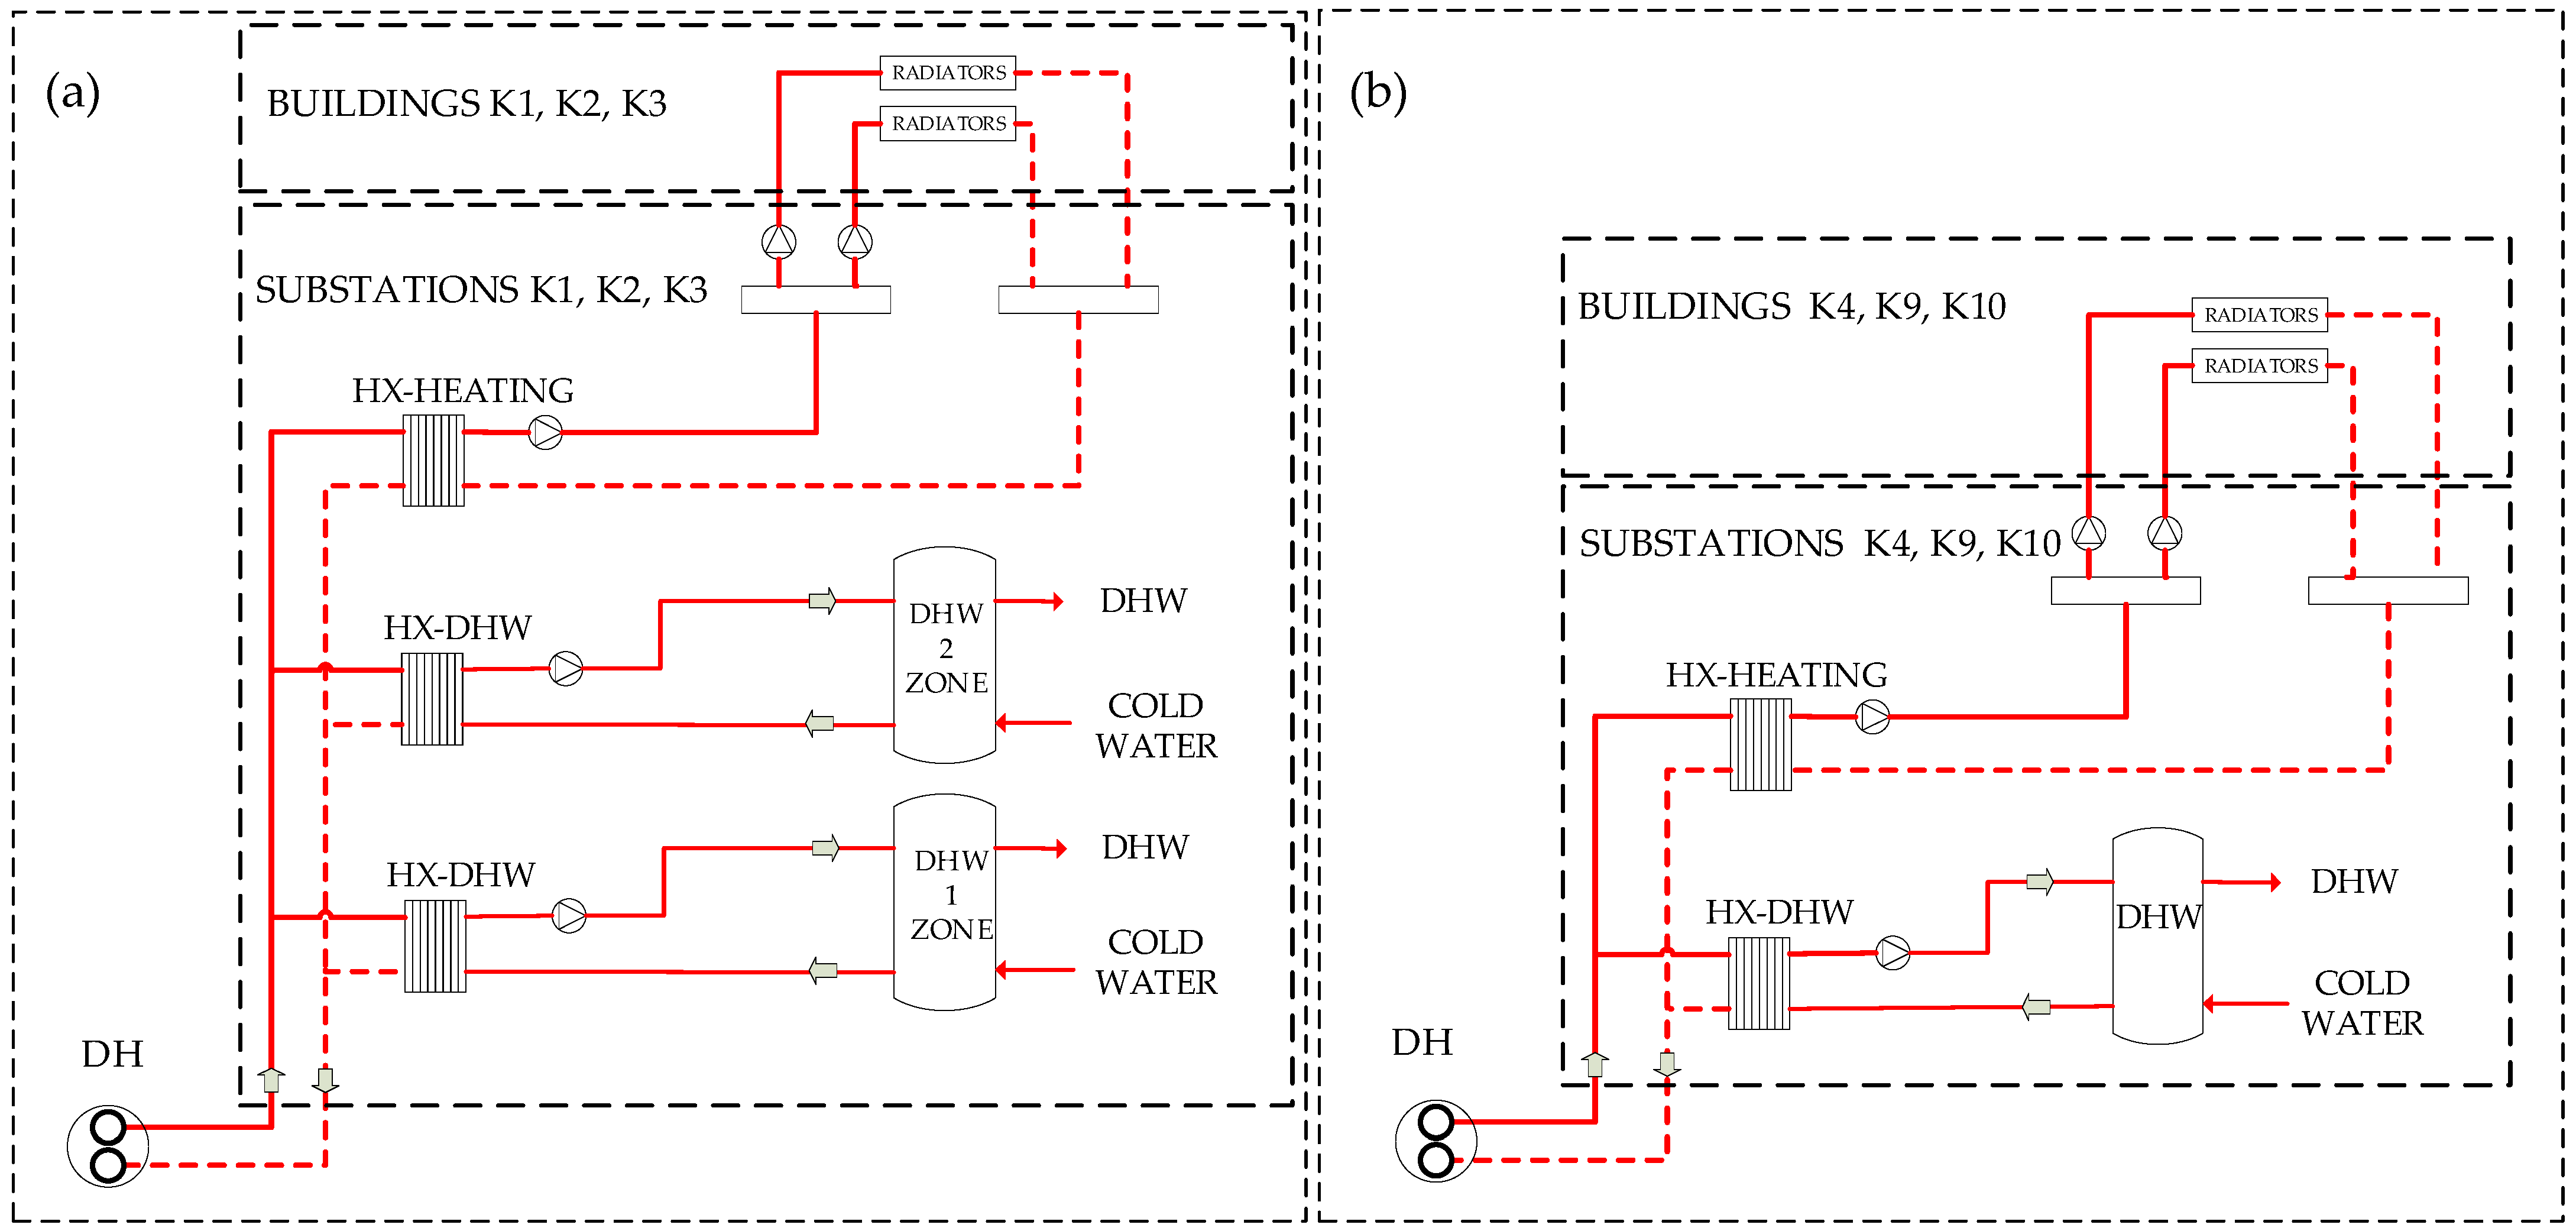
2.2.3. Central DHW System-Consumption and Simulation
For buildings that have centralized DHW heating where the necessary heat is provided by the DH system, models of the sub-stations are created. Such a model consists of storage tanks, heat exchangers, pumps, piping, and control equipment. Buildings K1, K2 and K3, due to their height of 63 m, have the heating of DHW in two zones to prevent high pressures in installation. Buildings K4, K8 and K9 are lower than 60 m and have DHW heating in one zone. The basic functional scheme of the DHW substation is shown in
Figure 7. Based on the monitoring data, the daily DHW consumption profile was created. It corresponds to the actual habits of the users and the specific DHW consumption in residential buildings, defined in [
36].
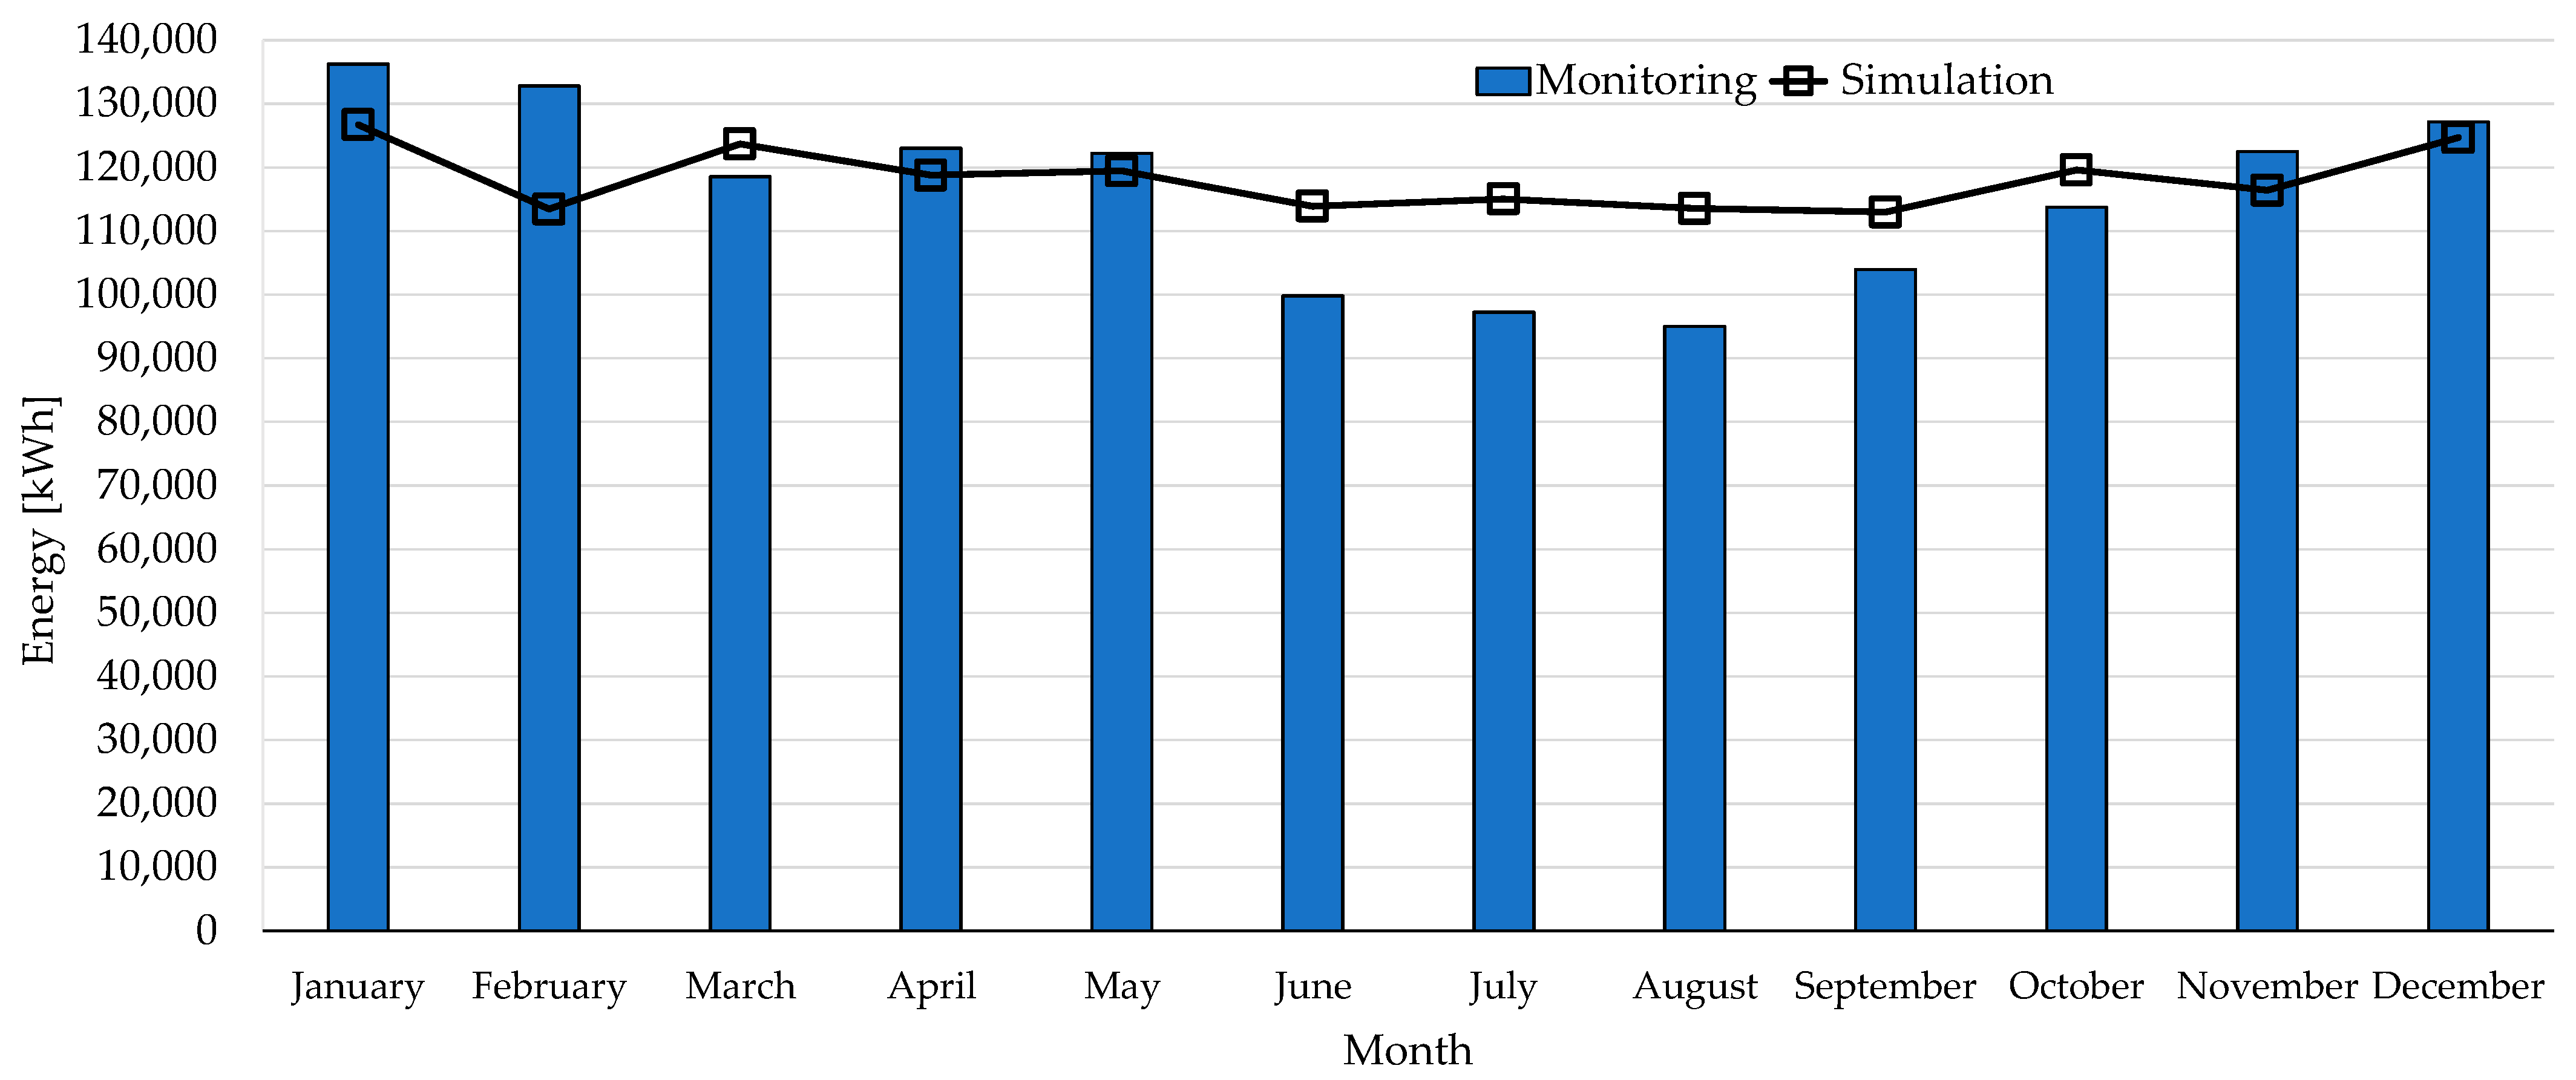
Monitoring of thermal energy consumption for DHW heating was extracted from the data for the complete DH system in 2019. Thermal energy consumption for DHW does not vary with meteorological conditions, nor does it vary in larger percentages from year to year, which is the case for useful energy for heating. The comparison of the energy consumption for DHW heating from the simulations and the monitoring data provided by the heat supplier are shown in
Figure 8. The difference between the simulated results and the annual average of the considered period is 2%.
The calculated values of thermal energy consumption in buildings for heating the building and DHW are used as heat load in simulations of the DH system which follow.
2.2.4. The Calculation of the Required Minimum Water Temperature in Radiators for Building Heating
In the 1970s and early 1980s when DH and heating systems were designed, heat loss calculations were performed according to DIN 4701 norm dating from 1959. The calculation consisted of the transmission and ventilation heat loss calculations. The capacity reserve supplements provided by the norm were added to the radiator capacities to cover for the heating interruptions, unfavorable orientation, and the impact of building height. The designer often arbitrarily increased calculated capacity to a higher value, which further oversized the radiators and that was found to be the case in all design projects of considered buildings.
The comparison between the design projects and the actual state of the thermal system in the buildings shows that major changes have occurred. Over the years, and especially during the crises in the heating sector, which were accompanied by unfavorable heating energy prices, users often removed radiators by themselves and even sometimes with the consent of the heating supplier. The removal of radiators resulted in single-speed pumps being oversized, heating networks not being hydraulically balanced due to a lack of balancing valves, and the remaining radiators overheating rooms due to a lack of thermostatic radiator valves (TRV). All of this led to unnecessary energy consumption and thermal discomfort. As mentioned above, building K7 was completely excluded from the Kozala heating system, which caused similar problems for the entire heating system.
To date, envelope refurbishment work has been carried out for buildings K4, K5, K6 and K8.
Due to the capacity supplements resulting from the standard DIN 4701 and the energy refurbishments that have been carried out, existing radiators in buildings have a significant capacity reserve, which enables the heating system to operate with lower water temperatures. The calculation of the minimum required water temperature is performed at a constant flow rate. The equations for determining the heat capacity of the radiator [
39] are the heat transfer from the heating water to the radiator (11) and the heat transfer from the radiator to the ambient air (12). Bodies with different temperatures try to equalize their temperatures and establish a thermal equilibrium [
40]. By equating (11) and (12), the supply and return temperatures of radiators can be calculated.
Proper control of radiators with thermostatic radiator valves leads to a reduction in return temperature and consumption savings of 14% to 16% without intervention in the thermal envelope of buildings [
41]. Reducing the return temperature has a positive effect on the efficiency of the district heating system.
2.2.5. DH Systems
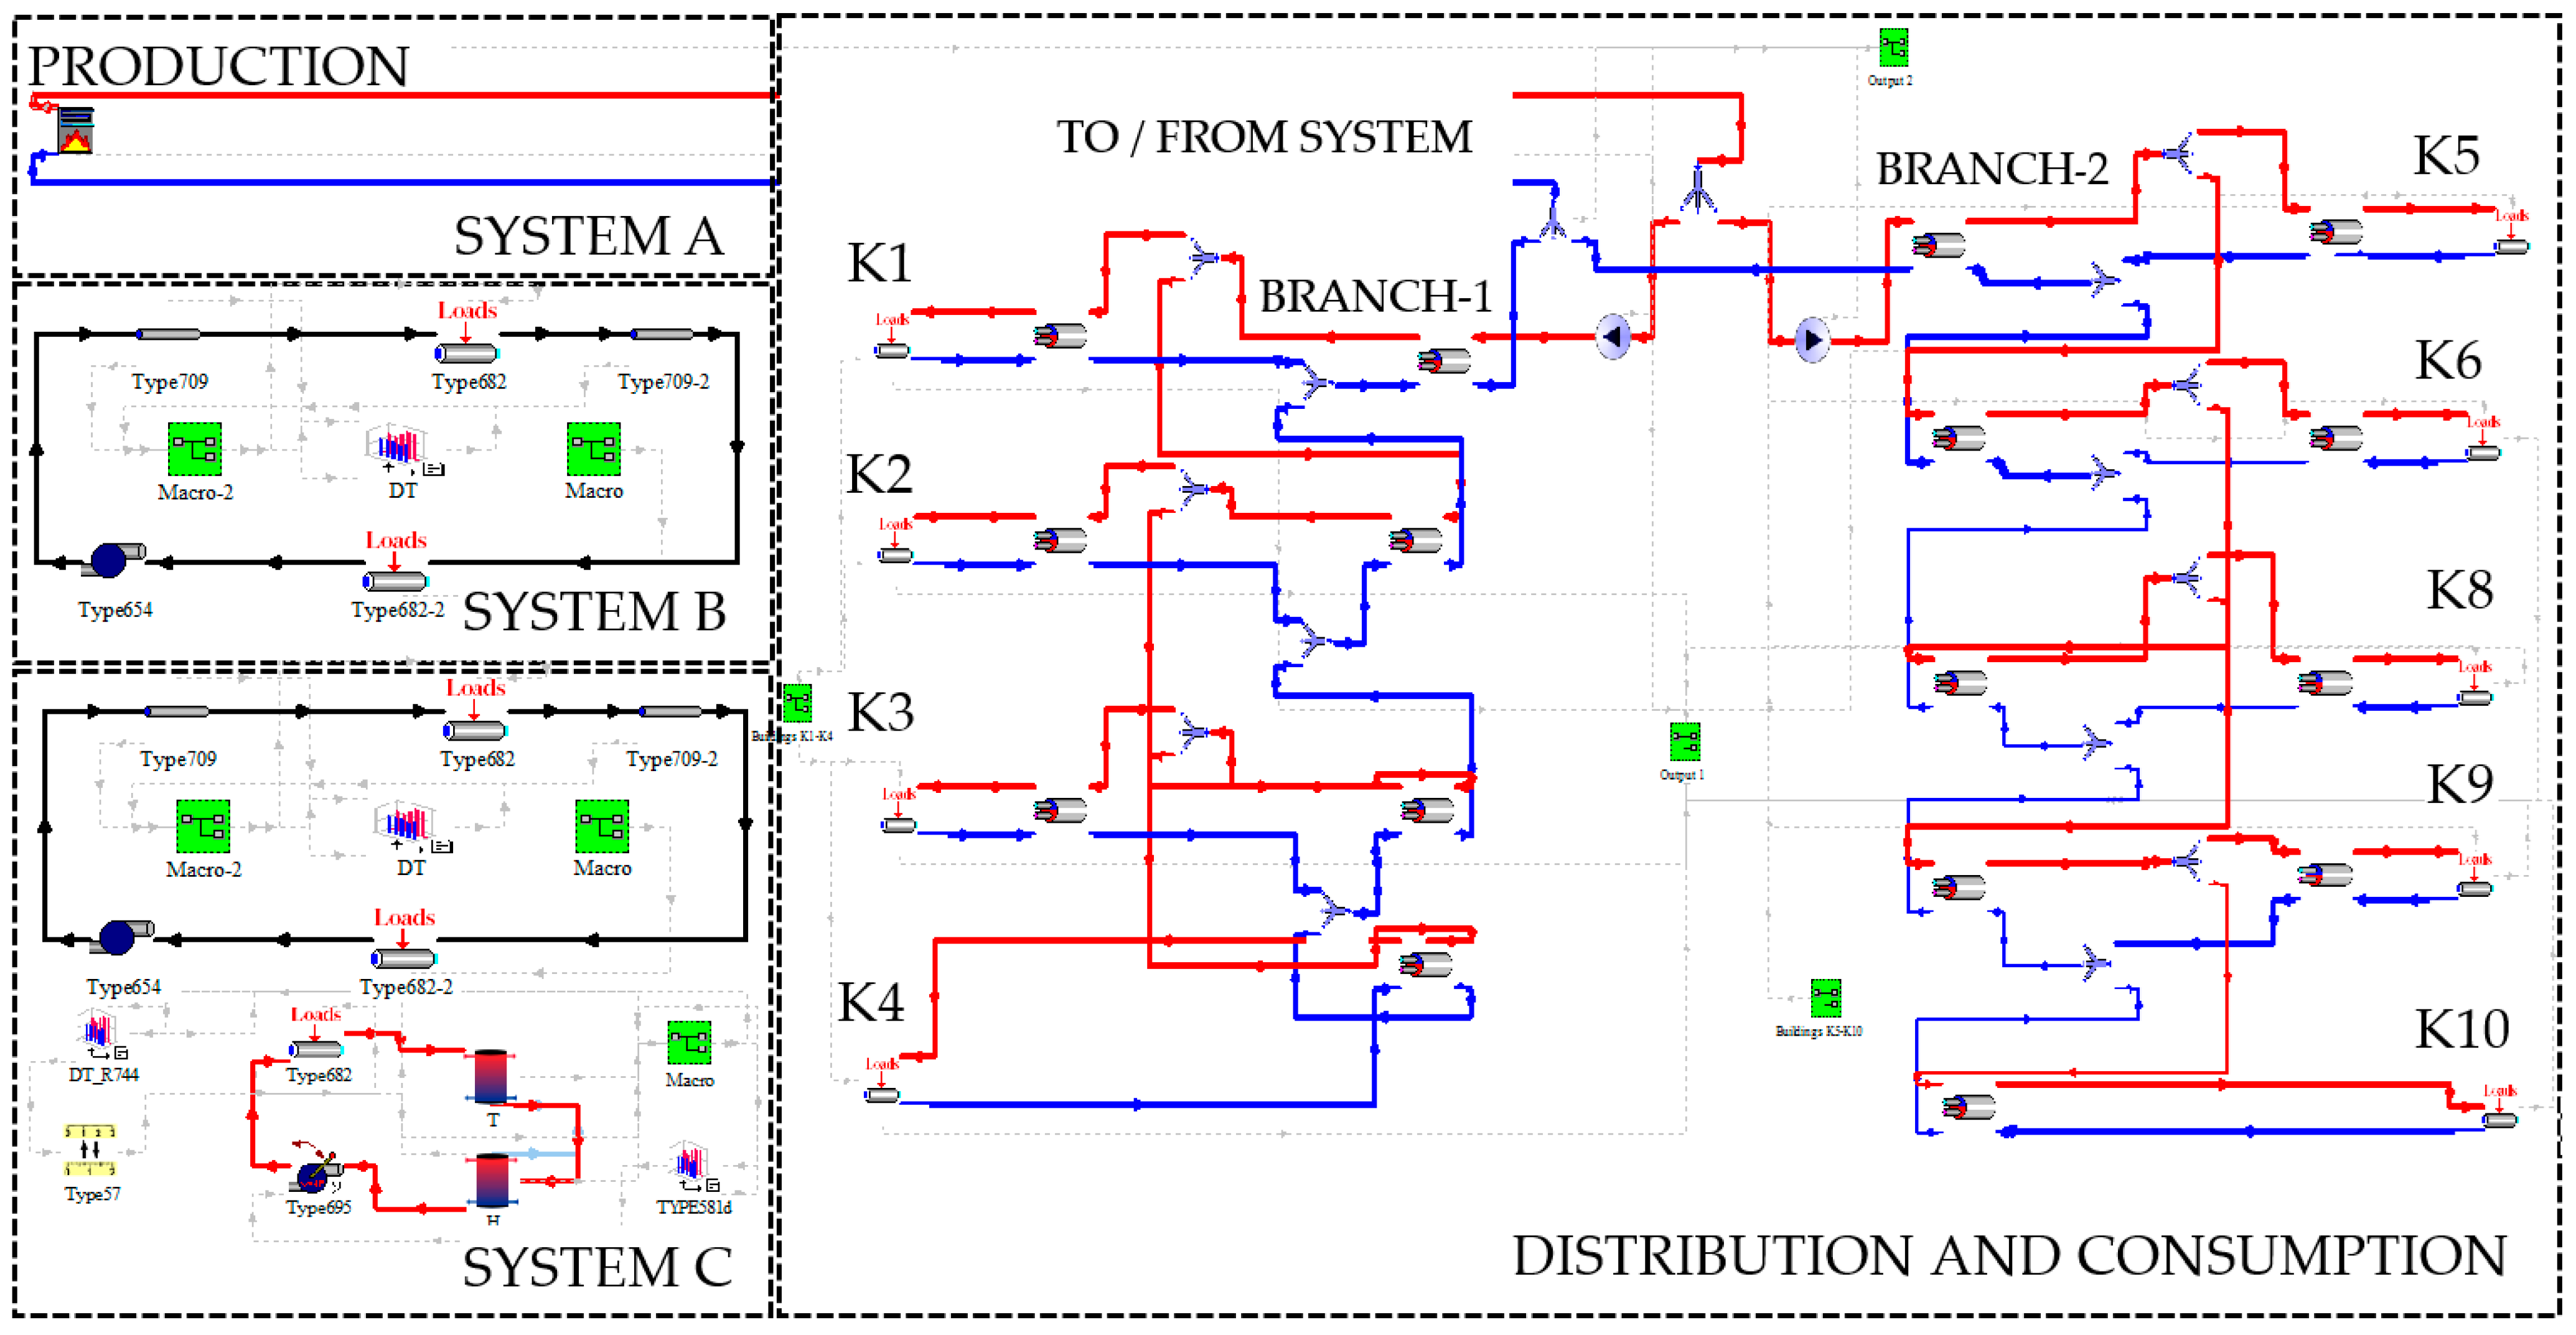
A comprehensive analysis of all parts of the DH system was conducted. The analysis includes the production, distribution, and consumption subsystems of the entire DH system. The models of system A, system B, and system C for dynamic simulation are shown in
Figure 9. Calibration of the baseline model (system A) was performed using measured data obtained from the heat supplier.
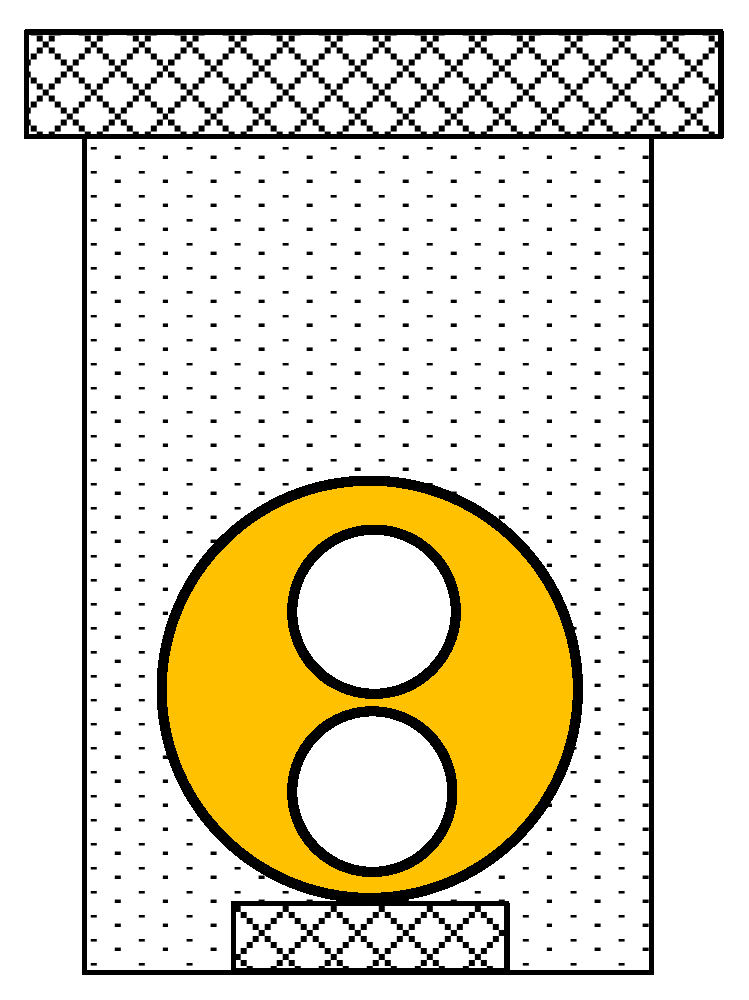
A dynamic simulation model of the DH system with a distribution network and boiler room with gas boilers was created. It will be referred to as system A in the following. It was used to calibrate the base model of DH system. Type 751 was used for the boiler. The total installed heating capacity is 9240 kW. Simulation of DH pipe network is based on Trnsys Type 951 model for buried twin pipe system and comprises thermal energy losses in the DH system pipe network. The DH pipe network were determined and compared with the data calculated with the Logstor calculator [
42]. Logstor is a manufacturer of pre-insulated twin pipe systems installed during the 2018 DH distribution rebuild. The cross-section of the pre-insulated twin pipe system is shown in
Figure 10.
The technical data of the DH pipe network with the measured heat losses, the heat losses calculated by the manufacturer and the heat losses determined by dynamic simulation are shown in
Table 3.
A comparison of the measured and simulated fuel energy of natural gas for heat production in boilers is shown in
Table 4.
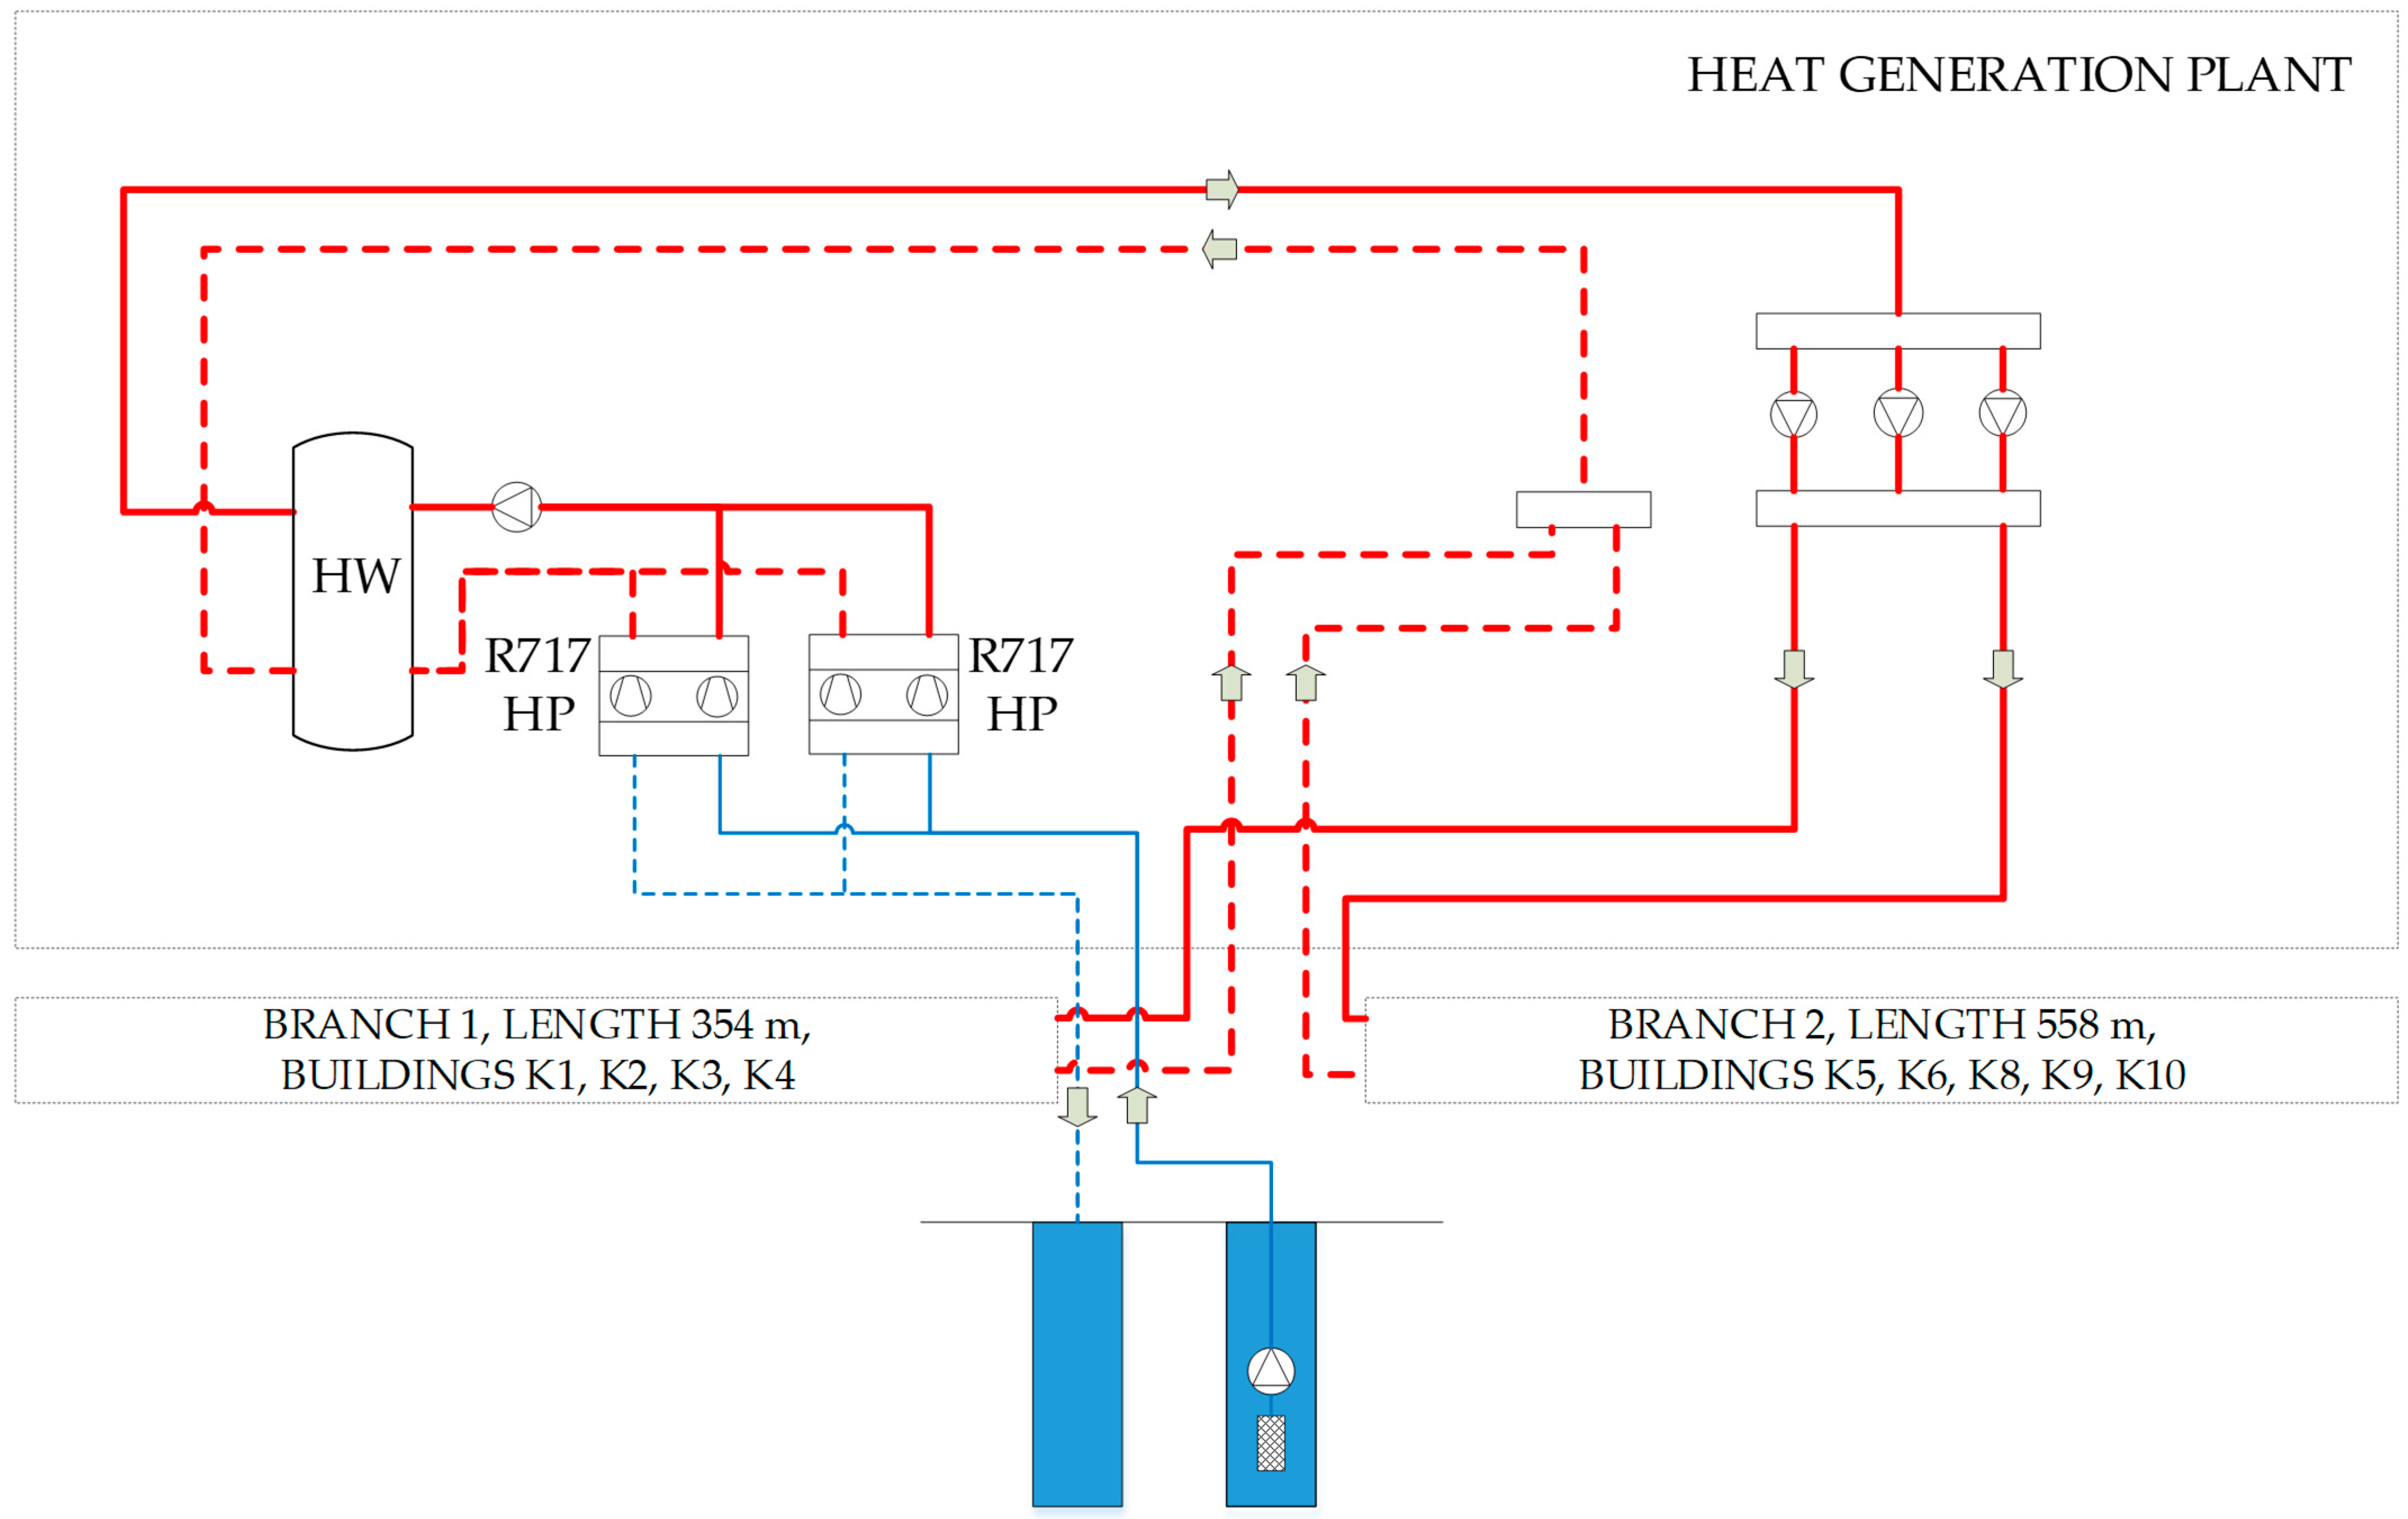
Based on the calibrated DH model with natural gas boilers, additional two models which operate with heat pumps are developed. The Trnsys model was created with a central water-to-water heat pump with natural, environmentally friendly refrigerant NH
3 (ODP = 0, GWP = 0), referred to as system B. The river Rječina, which is 200 m away and 50 m below the heating plant, is considered a heat source. The water temperature of the river, which at this point is very close to the underground tributary Zvir, is almost constant and is 8 °C all year round. Among natural refrigerants, ammonia (R717) is the most favorable refrigerant for medium and large heat pumps. Two-stage or cascade heat pumps operating with ammonia can provide heat up to a temperature of 90 °C. Carbon dioxide (R744) is also used as a refrigerant. Due to its properties, heat pumps with R744 operate in transcritical cycle, have significant temperature glide, and are suitable for operation at high-temperature differences between source and sink [
6]. The toxicity of R717, as a natural refrigerant, is an obstacle to use in household and automotive applications, while its thermodynamic characteristics as well as energy efficiency are excellent in applications in industrial and commercial buildings [
43]. In the present study, a central R717 heat pump was applied, which needs to be designed, constructed, and installed in accordance with the European standard EN 378-2:2016/A1, which determines the safety and environmental requirements for refrigeration systems and heat pumps.
In the present study, data for commercial heat pumps using R717 as the refrigerant were used for the central heat pump in the heating plant. The installation of two central units is proposed, as shown in
Figure 11. The capacity of the units is 2 × 1400 kW in the case of existing buildings (PB) or 2 × 1100 kW in the case of all buildings undergoing energy retrofits (RB). The unit is a cascade heat pump, consisting of a low-temperature and a high-temperature stage, connected with a cascade heat exchanger. The cascade heat exchanger is an evaporator or liquid separator for the heat temperature stage and a condenser for the low-temperature stage in a compact vessel that minimizes the temperature difference between condensing and evaporating and thus the drive power of the compressors.
Type 581 was used to simulate the operation of the heat pump [
44]. This component allows multidimensional interpolation of manufacturer’s data between one to four independent variables and one to five dependent variables. In this case, two independent variables and two dependent variables were chosen. The independent variables chosen were the degree of loading and the input temperature of the water. The heat output and the electrical power of the heat pump were chosen as dependent variables. Type 81 was used to set the water output temperature of the heat pump. The data obtained from the heat pump manufacturer are entered through an external file and simulates the operation of the heat pump. Type 9 and type 682 were used.
Figure 11 shows the scheme of system B. Substations for system B are the same as the original, presented in
Figure 7.
The Trnsys model has been developed to simulate the operation of heat pumps using R744 (CO2) refrigerant for DHW heating in substations, hereafter referred to as system C. System C consists of two central heat pumps with refrigerant R717, which have the same characteristics as in system B, and R744 heat pumps for DHW heating in substations.
R744 heat pumps operate in a transcritical cycle. The recent increase in research and production of heat pumps operating in the transcritical cycle is obvious worldwide. It is expected that R744 heat pumps will soon become an acceptable option for a wide range of applications, with low cost, high efficiency, and no negative environmental impact [
45]. The advantages of R744 over other refrigerants are that it is non-flammable, non-toxic, and not subject to regulation. In this work, data from commercial R744 heat pumps for DHW were used. In the substations of buildings K1, K2, K3, K9 and K10, the installation of R744 heat pumps with a capacity of 100 kW is planned. In building K4 it is planned to install one R744 heat pump with a capacity of 20 kW. The connection of the R744 water-to water heat pump for DHW to the existing system is shown in
Figure 12.
Type 581 was used to simulate the operation of a heat pump with R744 refrigerant. The temperature of the hot water at the inlet of the tank was chosen as an independent variable. The heating power and the electrical power of the heat pump were chosen as dependent variables. The data obtained from the manufacturer of the heat pump are read through an external file and simulates the operation of the pump. Type 695 was used for the pump. The hourly heat consumption values for heating buildings and the required evaporative heat of the heat pumps installed in the substations are entered via type 9 and type 682. The difference between the thermal substation presented in
Figure 7 and the thermal substation presented in
Figure 12 is the serial connection of DHW tanks in
Figure 12, which is implemented due to the high temperature glide of R744 in a gas cooler of the transcritical heat pump.
2.2.6. Simulation of the Operation of a PV Plant
A simulation of the operation of a photovoltaic power plant to generate electricity for system B and system C was performed. The PV collectors produced by the Croatian manufacturer Solvis are placed on the roof of the heat generation plant for system B. The PV collectors for system C are placed on the roofs of buildings K1, K2, K3, K4, K9 and K10. The number of modules is set to cover the amount of non-renewable electricity needed to run the heating and DHW systems. The modules are monocrystalline and have a declared efficiency of 18%. Type 562c was used for the simulation.
2.2.7. Costs
The cost for the thermal energy generation system includes the cost for procurement and installation of equipment and electricity generation system. The procurement costs include investment in all the major equipment (e.g., heat pumps, pumps, pipelines, fittings, insulation). Those data are taken from suppliers. The cost of installation and supporting works was estimated at 20% of the equipment cost. Equipment is selected from catalogues of manufacturers. The investment costs, based on an assessment according to market prices at the present time, of system A, system B, and system C for the present state of the building characteristics are shown in
Table 5.
The investment costs for systems A, B and C for the state with completely renovated buildings are shown in
Table 6.
Electricity and gas prices are set for three scenarios. According to energy price scenario 1 (ES1), prices are from 2021 in Croatia. According to energy price scenario 2 (ES2), prices have increased due to the ongoing energy crisis in the EU. The gas price on the Central European Gas Hub (CEGH) gas market on 02 October 2022 was 162.89 EUR/MWh [
46]. The electricity price on the power market (EEX-PXE) was 489.44 EUR/MWh in the fourth quarter of 2022 [
47]. According to energy price scenario 3 (ES3), gas and electricity prices increase by 50% compared to scenario 2. A concession fee for the use of water for the operation of heat pump systems is the same for all three energy price scenarios. These prices are shown in
Table 7.
The annual maintenance cost for heat energy production systems is estimated at 5% of the investment value, while for PV systems it is estimated at 2.5% of the investment value. The annual maintenance cost of existing system A is calculated from the record acquired from the heat supplier (EUR 99,542).
2.2.8. Primary Energy and CO2 Emission Factors
Primary energy factors and CO
2 emission factors defined at the national level [
48] are shown in
Table 8.
2.2.9. Scope of the Research
Simulations are performed for 18 different scenarios which comprise 2 building envelope variants (building envelope in the present state-PB and building envelope in energy renovated state-RB), the present state of radiators in buildings (PR), 3 different heating systems (A, B and C), 3 scenarios of energy prices (ES1, ES2 and ES3).
3. Results and Discussion
3.1. Energy for Space and DHW Heating
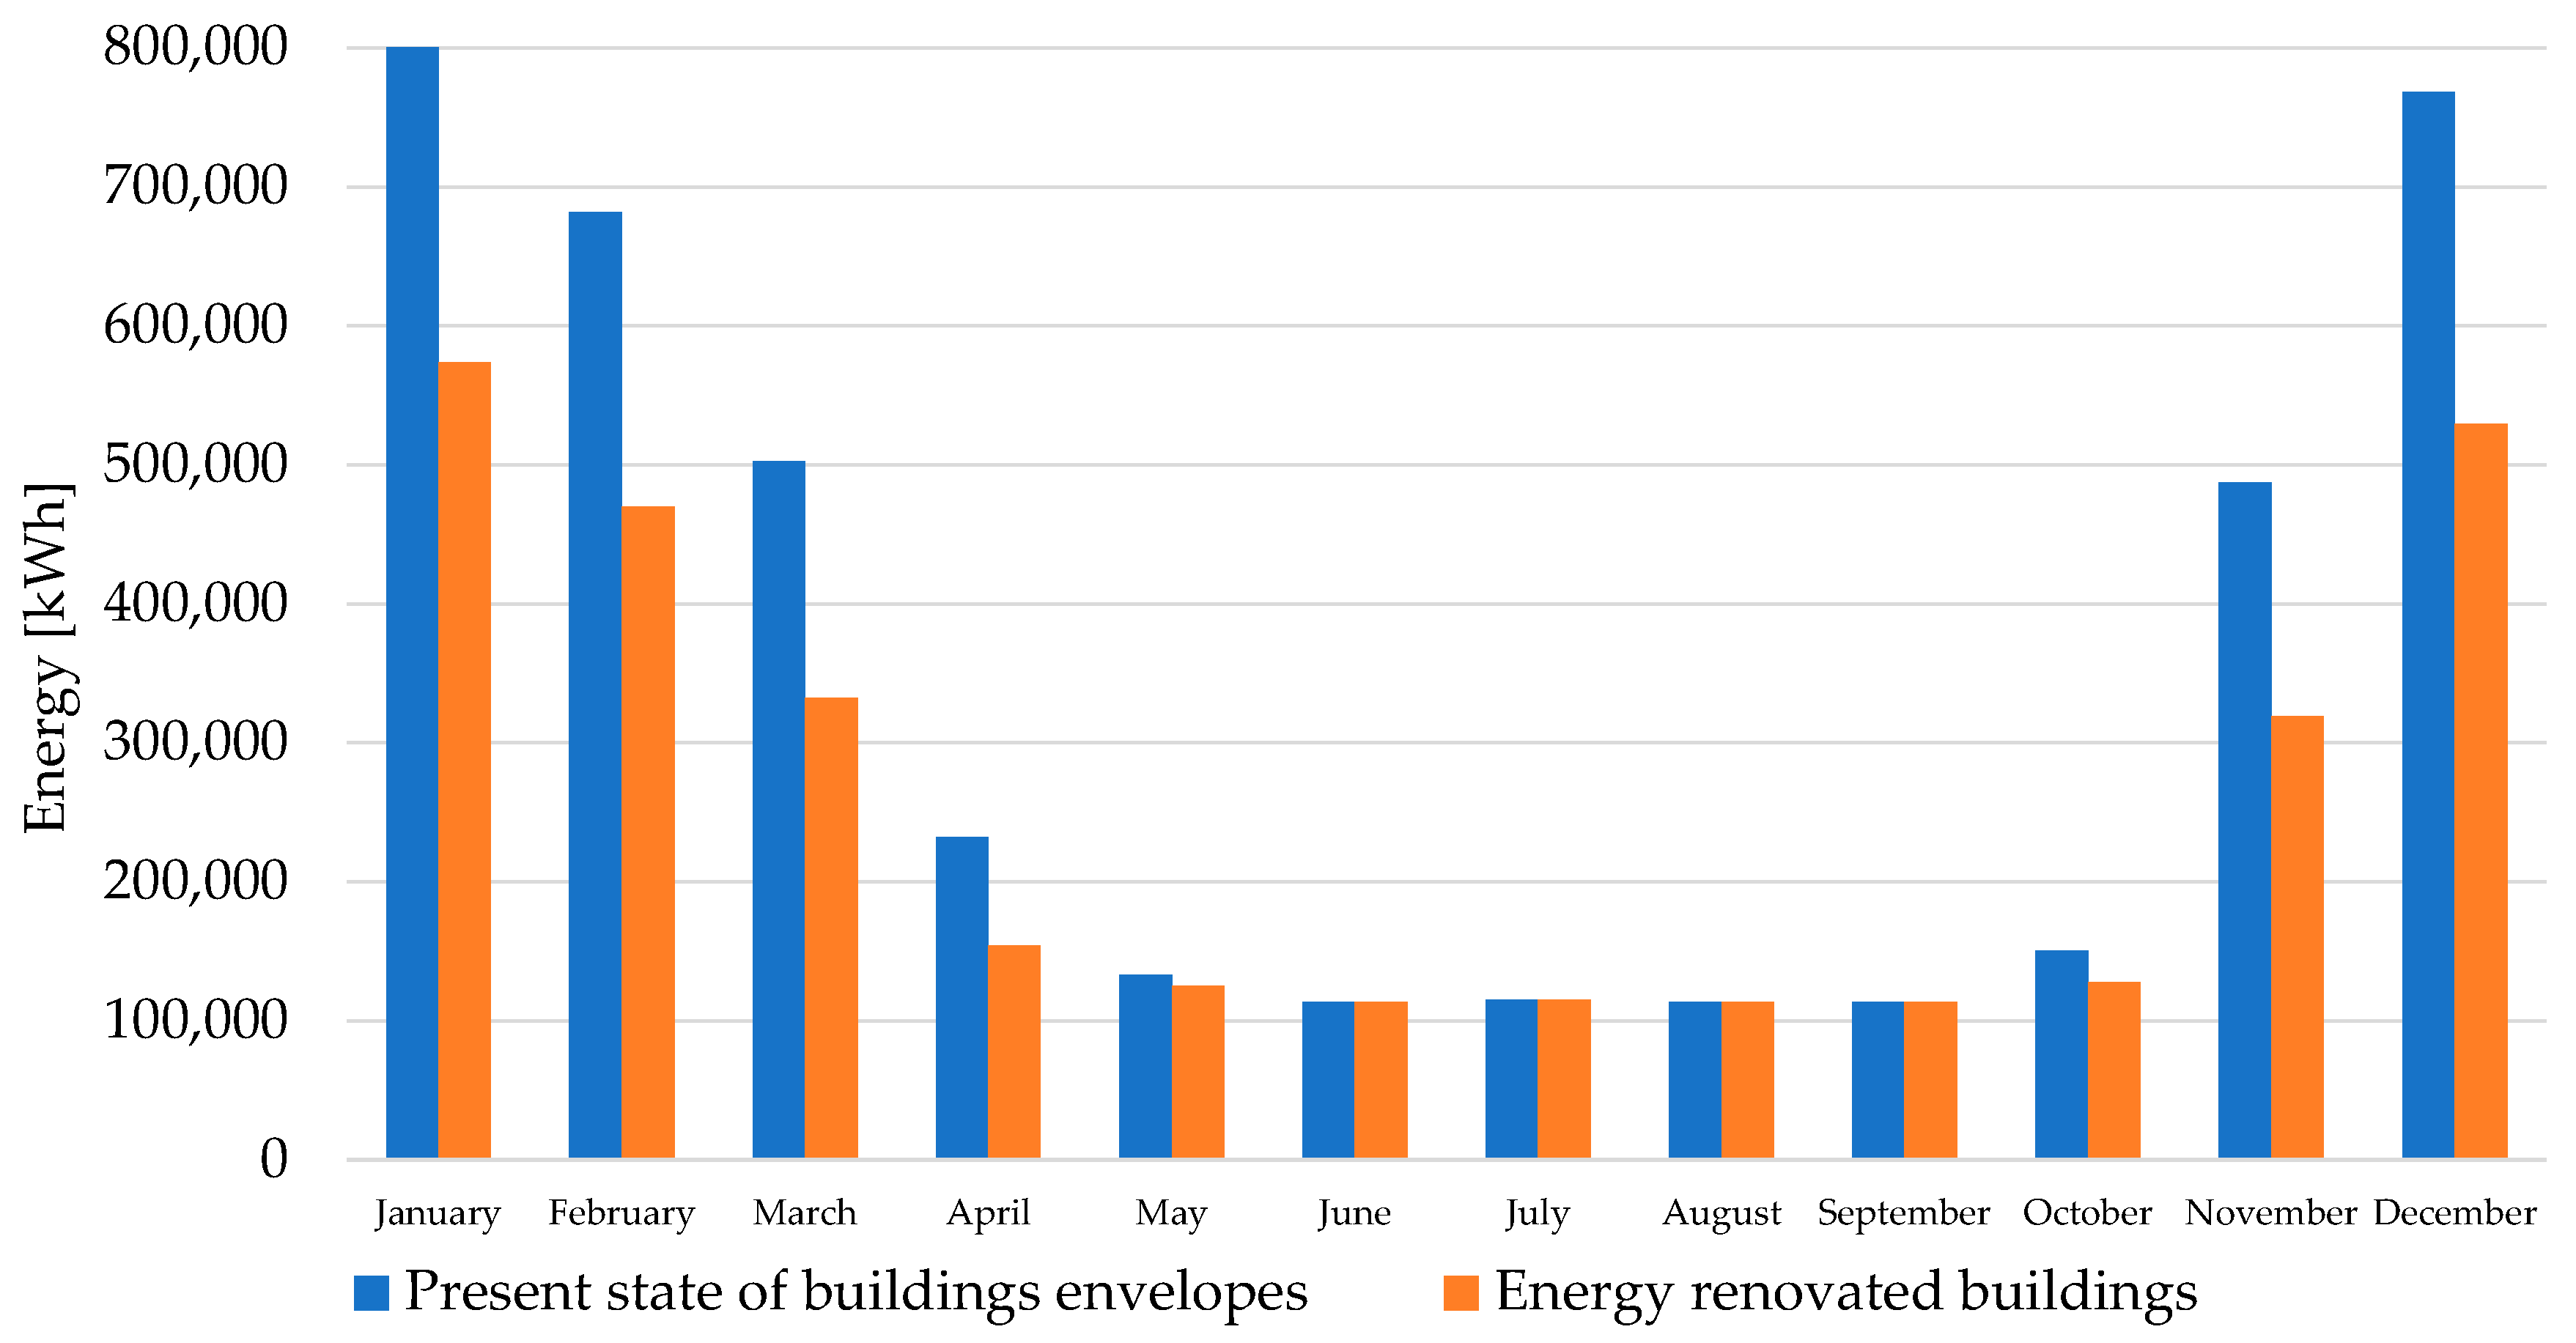
The results of the year-round simulations of heat consumption for buildings and DHW heating in the substations according to the current characteristics of the buildings and for the case when all the buildings are renovated are shown in
Figure 13, summarized for months.
The energy renovation of the buildings that have not yet been renovated (K1, K2, K3, K9 and K10) has the potential to reduce thermal energy for heating by 27% (from 4,225,427 to 3,088,106 kWh).
3.2. Calculation of the Required Minimum Water Supply Temperature for Radiators
The calculation of the required design load for heating buildings and the minimum required water supply temperature for radiators was performed for four scenarios which represent the state of the building envelope and installed radiators. At the minimum water temperature, the installed radiators can provide adequate heating capacity under design conditions. The design load for heating is calculated in Trnsys software simulation under steady-state conditions, which is by the standard EN ISO 12831. The design loads for heating buildings and the minimum required water temperature in the radiators are shown in
Table 9. Return temperatures were calculated for the condition of maintained constant water flow.
In the case of the present state of buildings (PB), the total load required capacity for heating buildings is 2844 kW, while in the case of all renovated buildings (RB), the total required capacity can be lowered to 2195 kW, which is a reduction of 23%.
The energy renovation of buildings K1, K2 and K3 can reduce supply temperature from 71 to 59 °C. For the case of the radiators kept in the same state according to the original project, the supply temperature could have been reduced from 71 to 54 °C. In the case that the radiators were retained according to the original design project and buildings K1, K2, and K3 were energy retrofitted, the supply temperature could be reduced from 71 to 46 °C. A significant reduction in the supply temperature can also be possible in other buildings. The supply temperature in the DH network must be 5 °C higher than in the worst case building due to the surface of the heat exchanger in substations. The supply temperatures in the DH network for different cases of the state of the building envelope and the state of the radiators in buildings at an outside temperature of −8 °C are shown in
Table 10. The supply temperature in the DH network changes depending on the outside air temperature. The supply temperature at the outside temperature 12 °C is calculated according to the required heating capacity for heating and installed radiators. Original state OR is hereby presented to show the potential for the reduction in supply temperature, and why it was not good to remove radiators in apartments. The present state is the current state of installed radiators and the one which will be used in further calculations.
3.3. Simulations of the Systems A, B and C
In the following, the results of the dynamic simulations for the operation of DH production systems A, B and C in the scenario with the present building envelope and the currently installed radiators (PB-PR) and in the scenario with the renovated building envelope and the present installed radiators (RB-PR) are presented.
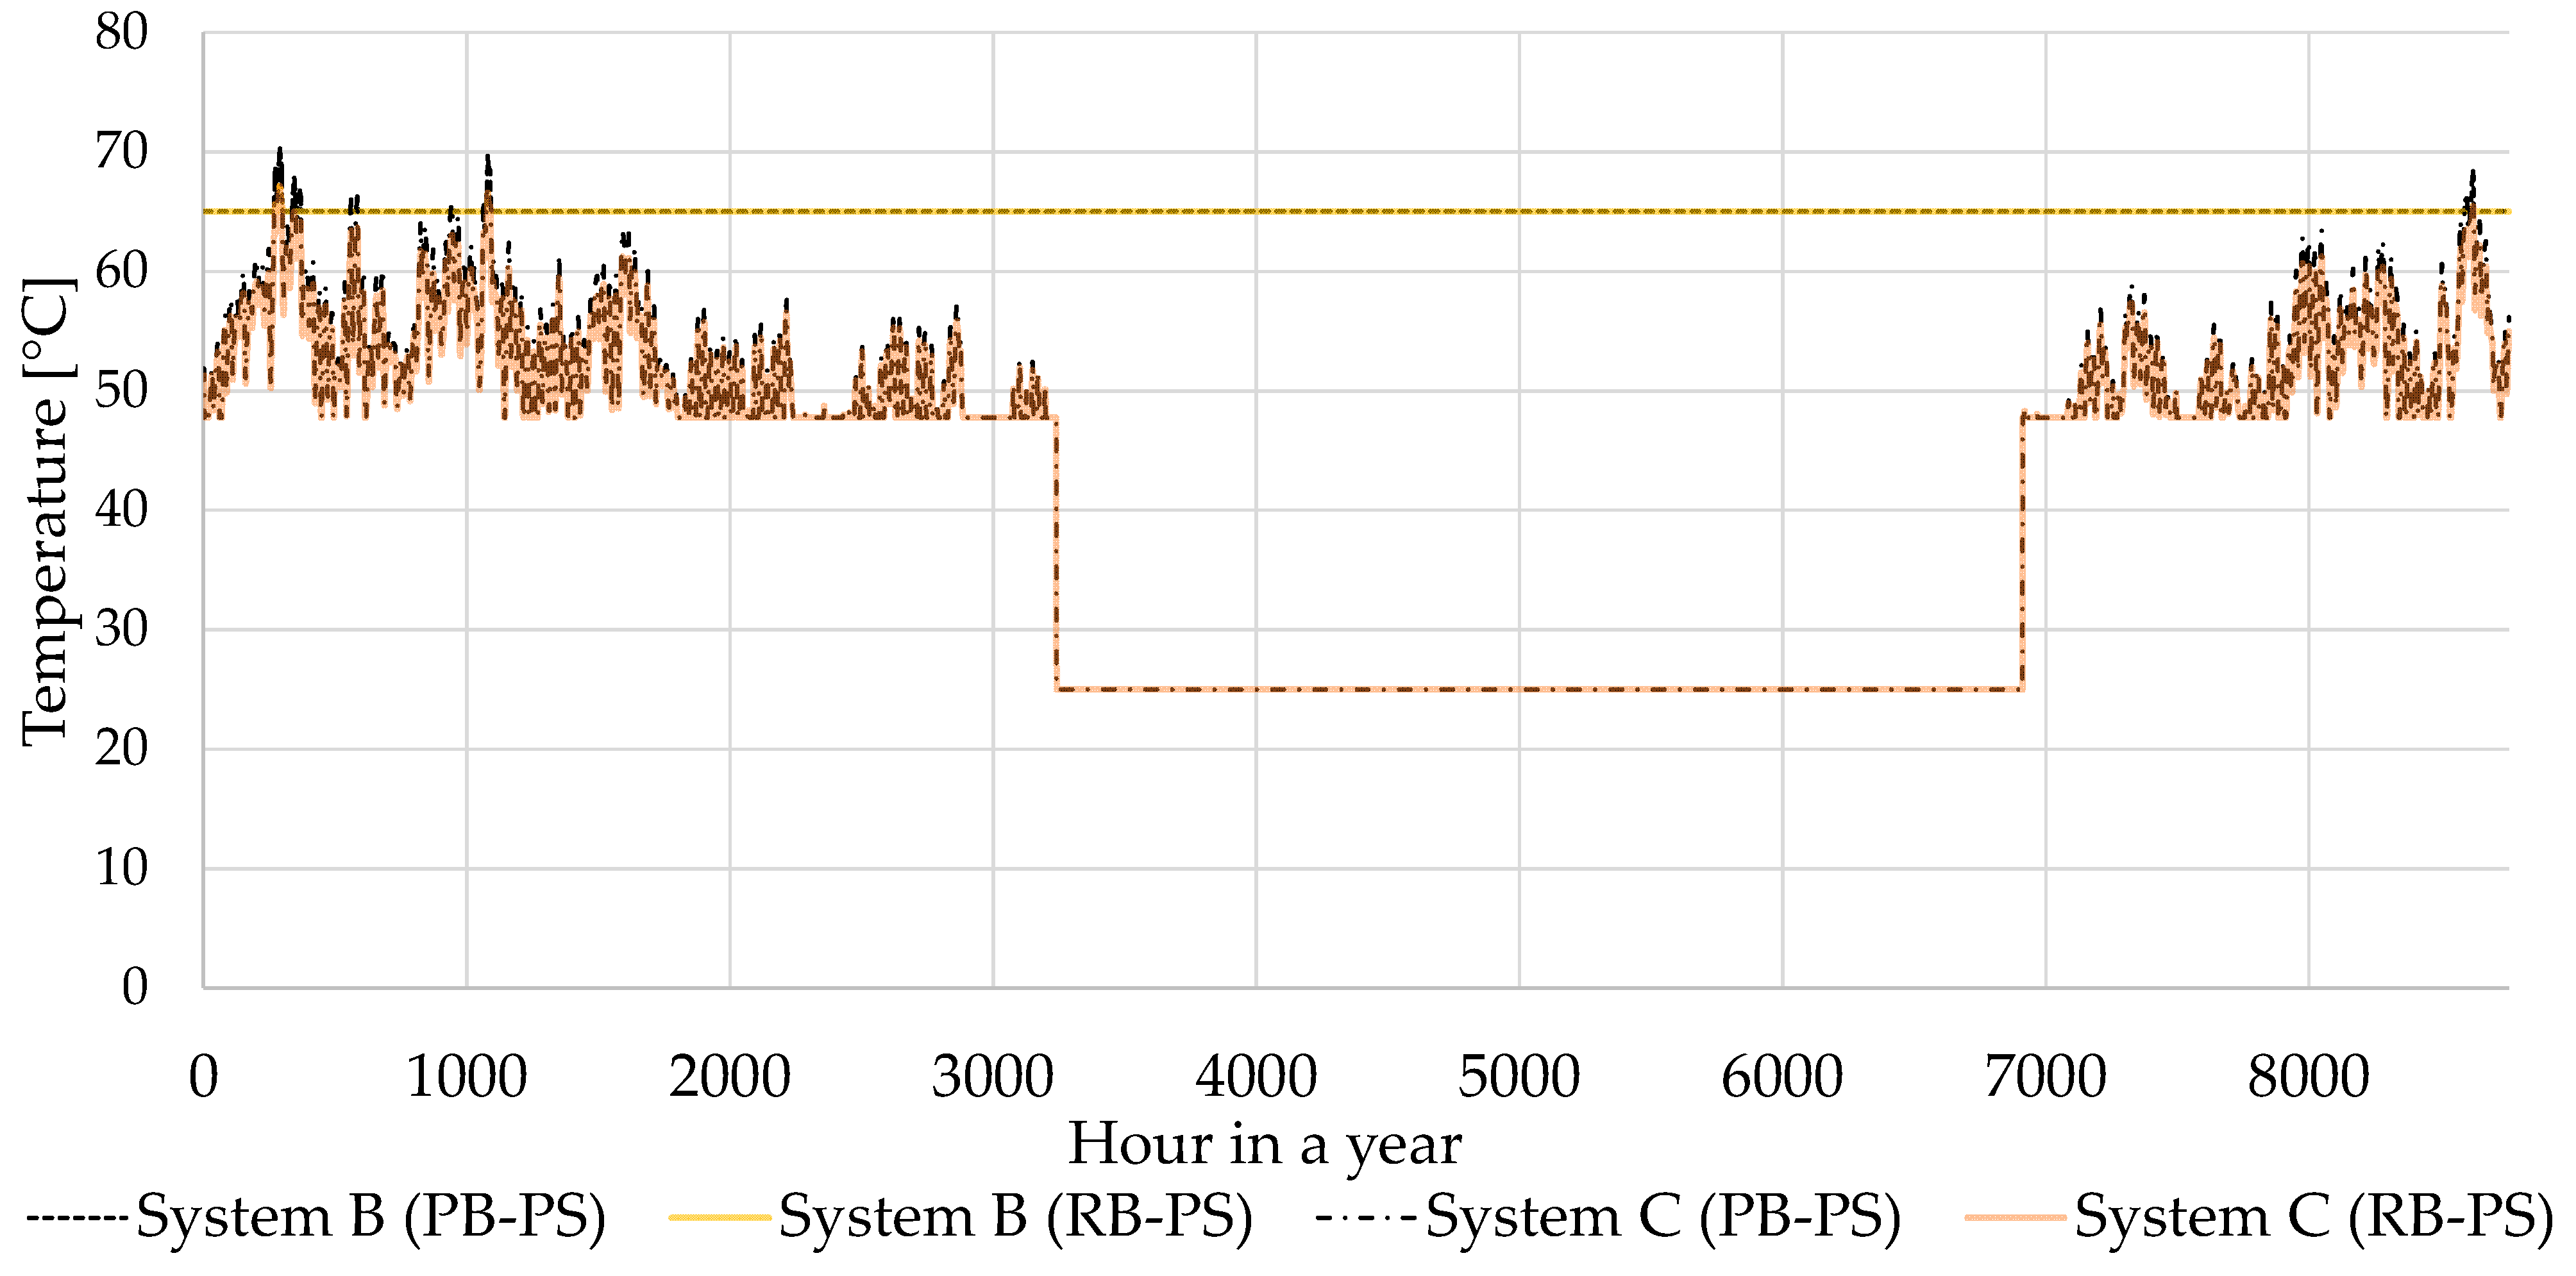
System A with hot water boiler is operated with a temperature glide between 90 and 80 °C, depending on the ambient temperature, which is controlled in the distribution center. System B consists of two central heat pumps with R717 refrigerant that provide all the heating and hot water needs of the building. During the heating season, the supply temperature in the pipe network changes depending on the outside air temperature, but never drops below 65 °C. At the end of the heating season, the supply temperature in the DH network is a constant 65 °C to heat up DHW. System C consists of two central heat pumps with R717 refrigerant for building heating and R744 heat pumps for DHW heating in substations. During the heating season, the supply temperature in the pipe network changes depending on the outside air temperature. At the end of the heating season, the supply temperature in the DH network is maintained at 25 °C which is a suitable temperature for the heat source for R744 heat pumps for DHW heating. The annual change in supply temperature in the DH network for systems B and C operating in PB-PR and RB-PR scenarios, obtained by dynamic simulation, is shown in
Figure 14.
The results of the simulations of systems A, B and C for buildings in the present state and the present installed radiator (PB-PR) are shown in
Table 11.
With the present building envelope and presently installed radiator (PB-PR) pipeline, heat losses are reduced by 13% in system B and 55% in system C compared to system A. Systems B and C have lower operating costs than system A for all three energy price scenarios. For energy price scenario 1 (ES1), cost reduction in system B is 59% and 56%in system C. For energy price scenario 2 (ES2), cost reduction in system B is 47% and 43% in system C. For energy price scenario 3 (ES3), cost reduction in system B is 54% and 60% system C.
The results of the simulations of systems A, B and C for buildings with renovated building envelopes and presently installed radiator (RB-PR) are shown in
Table 12.
With the renovated building envelope and presently installed radiator (RB-PR) it is possible to reduce the supply water temperature and maintain thermal comfort in the buildings. Therefore, pipeline heat losses of system A given in
Table 12 are lower than those shown in
Table 11. Pipeline heat losses are reduced by 8% in system B and 52% in system C compared to system A. As expected, all three systems have lower operating costs than those in the scenario with the present state of the buildings (PB-PR). Systems B and C have lower operating costs than system A for all three energy price scenarios. For energy price scenario 1 (ES1), cost reduction in system B is 58% and 53% in system C. For energy price scenario 2 (ES2), cost reduction in system B is 51% and 55% in system C. For energy price scenario 3 (ES3), cost reduction in system B is 53% and 58% in system C.
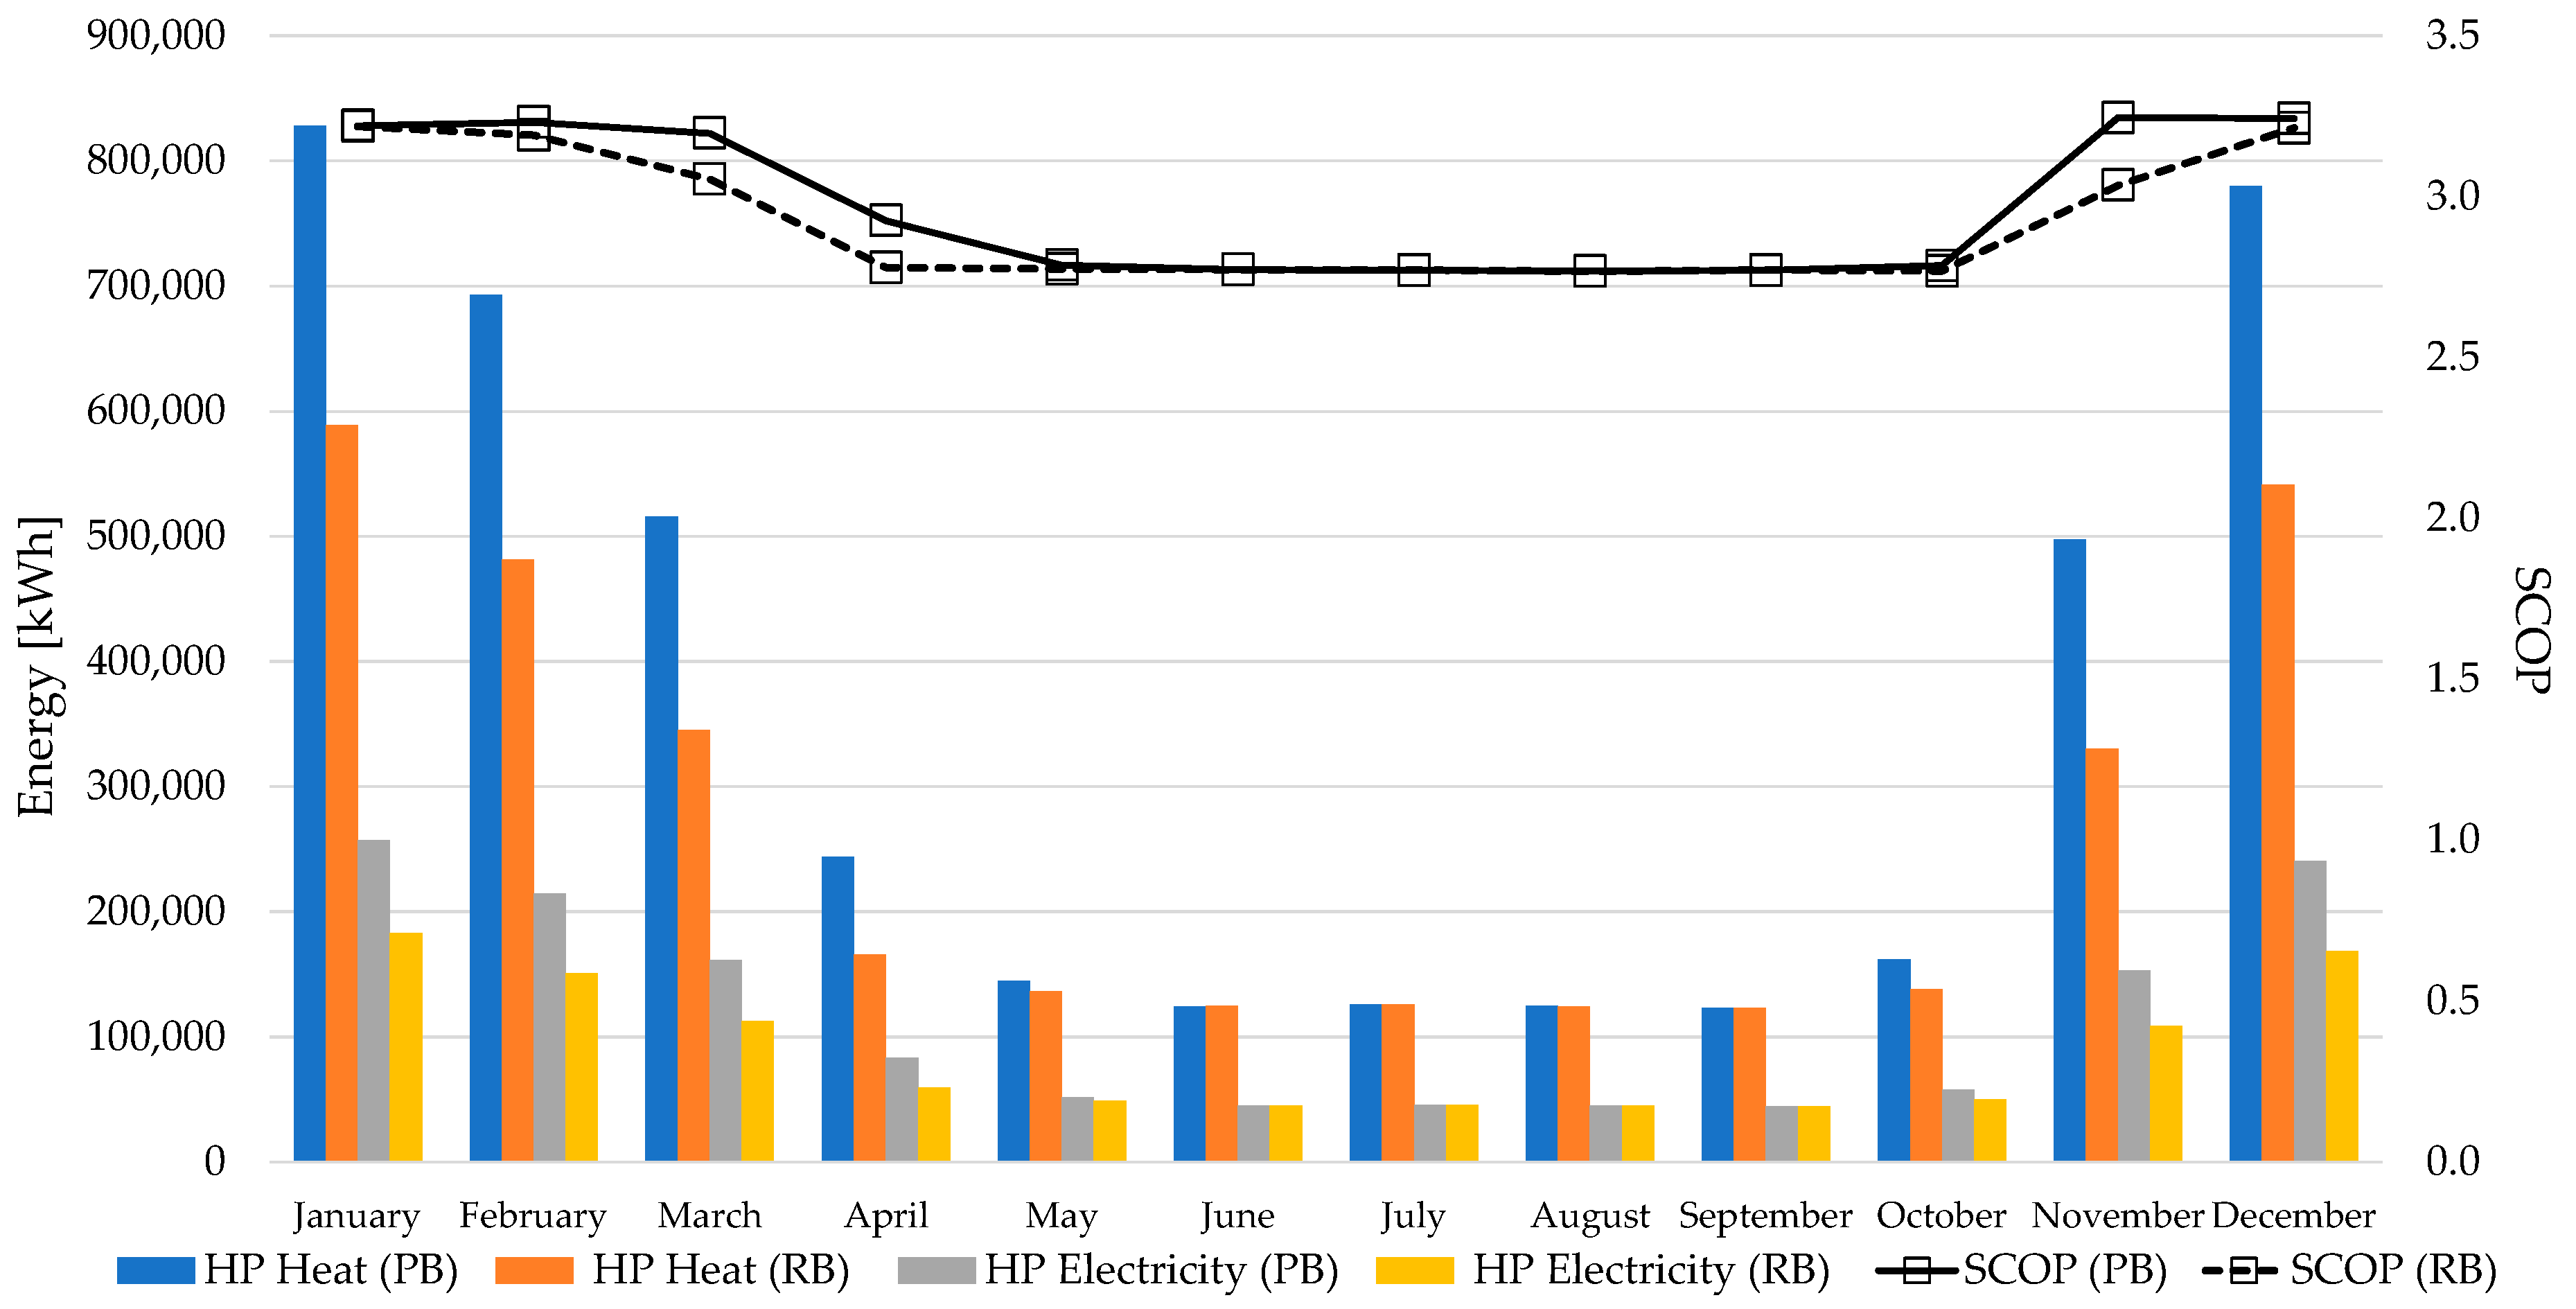
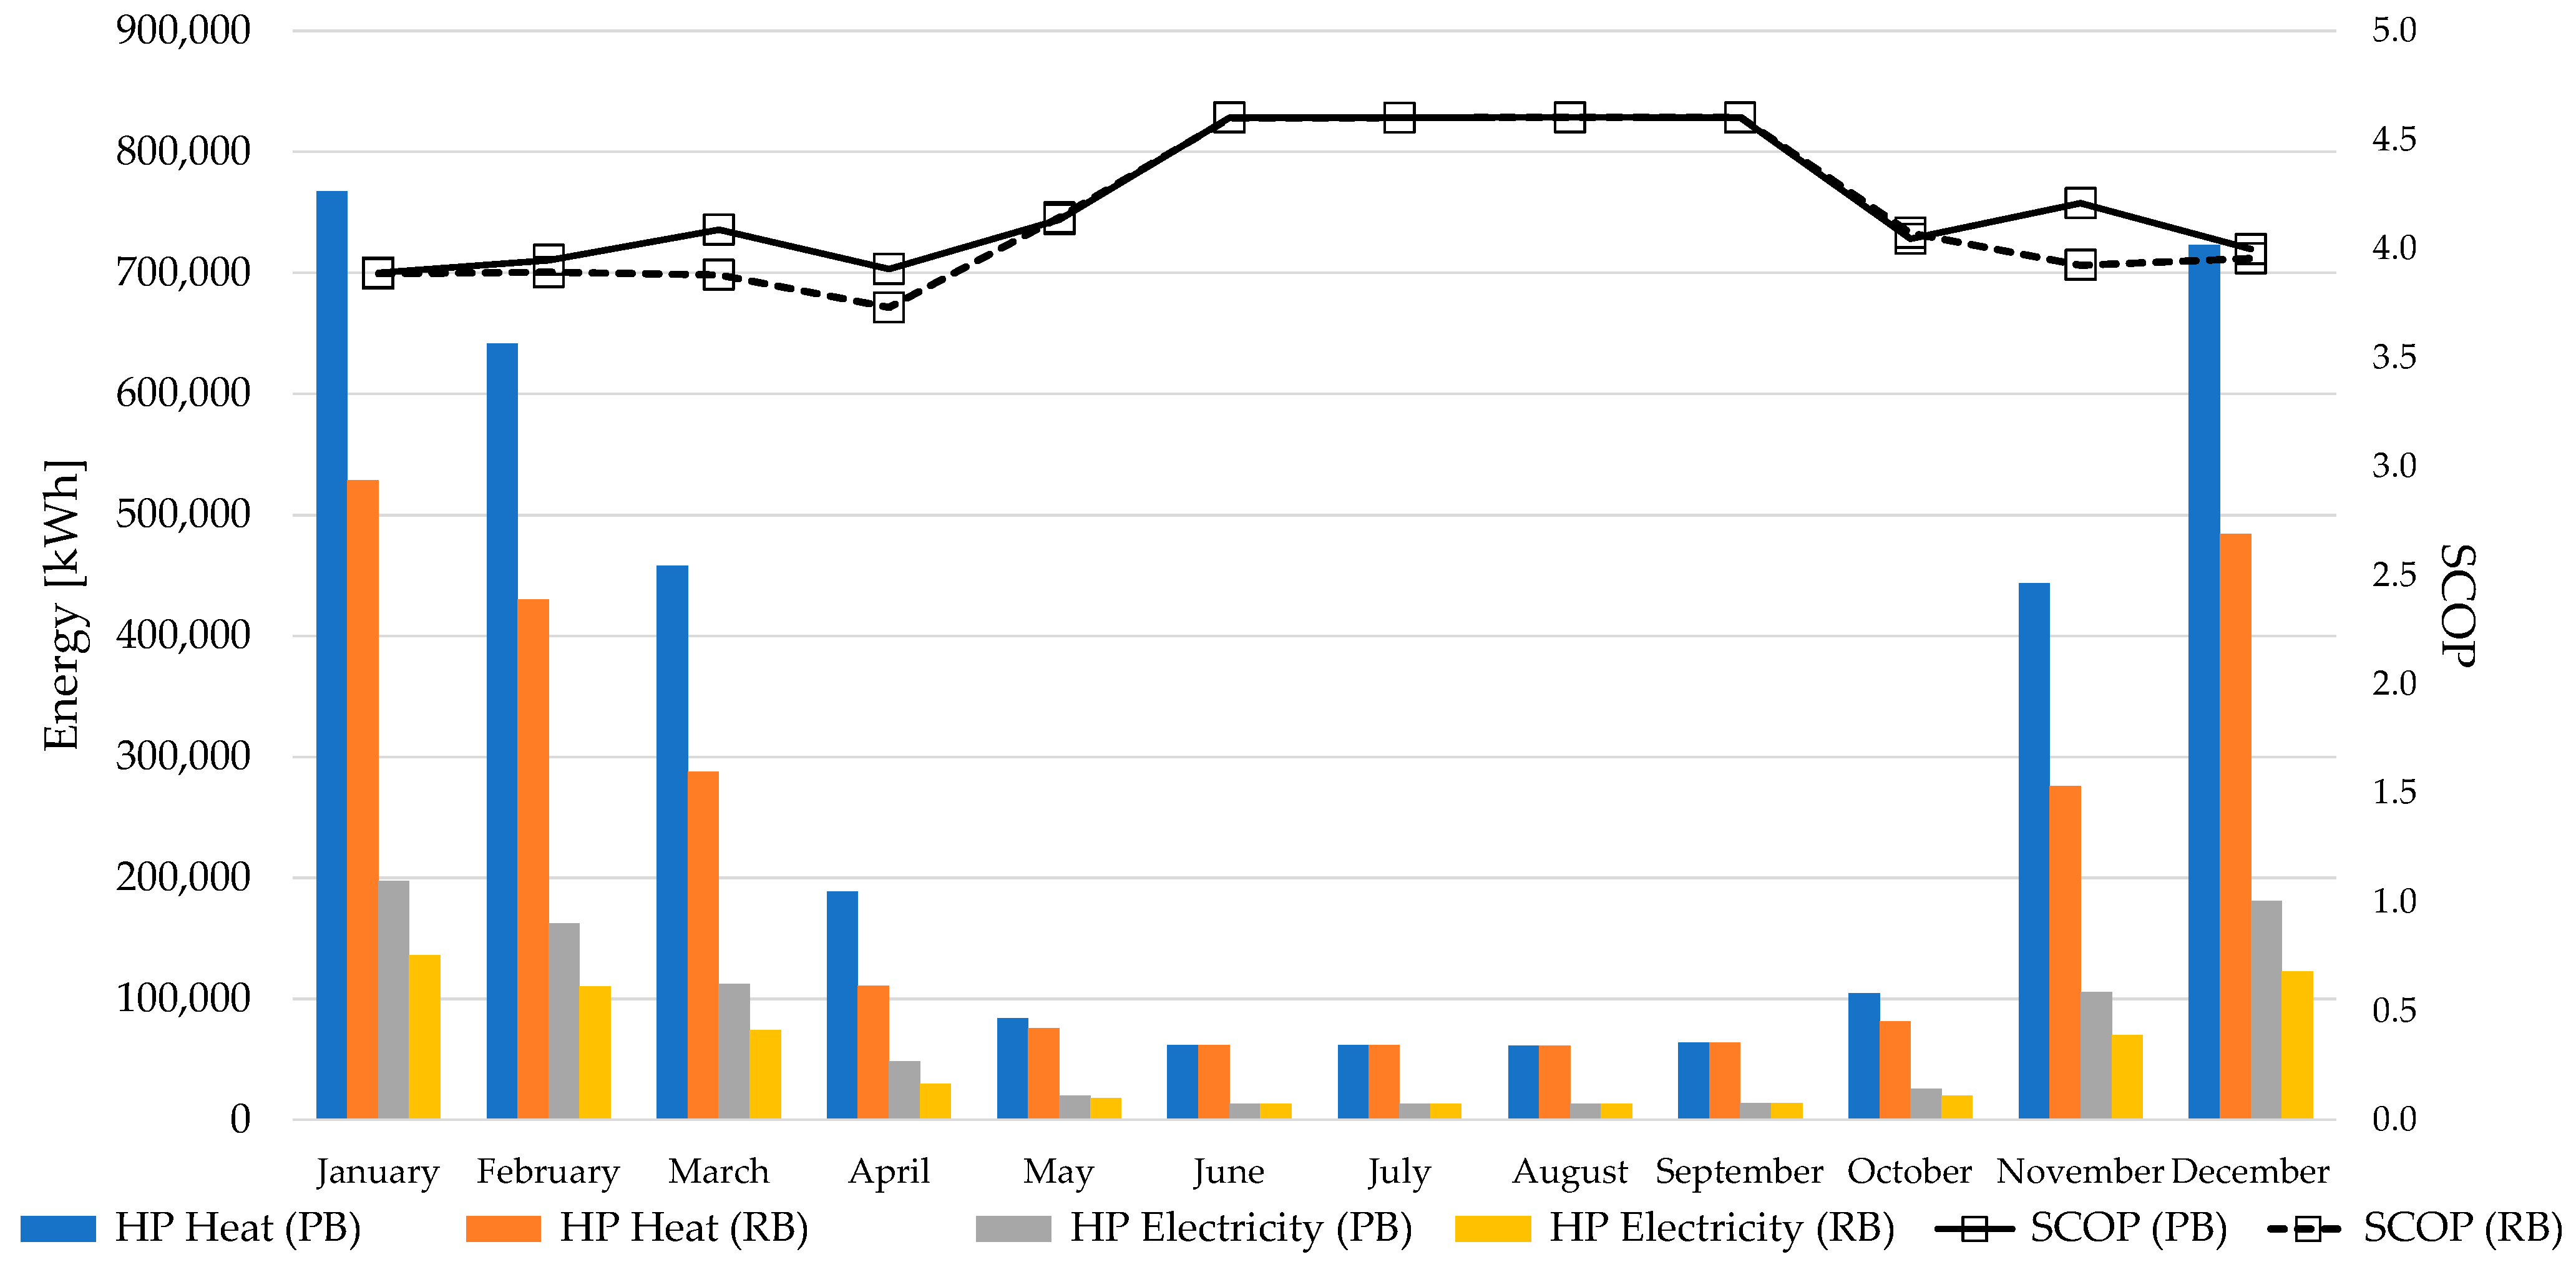
The monthly thermal energy for heating produced by system B, electricity for running heat pumps, and seasonal efficiency factor (SCOP) for the present state (PB-PR) and renovated state (RB-PR) of buildings are shown in
Figure 15.
Production of thermal energy for heating is reduced by 26%, while electricity consumption for heat pump operation is reduced by 24% on an annual basis for renovated buildings (RB-PR) compared to the present state of the buildings (PB-PR).
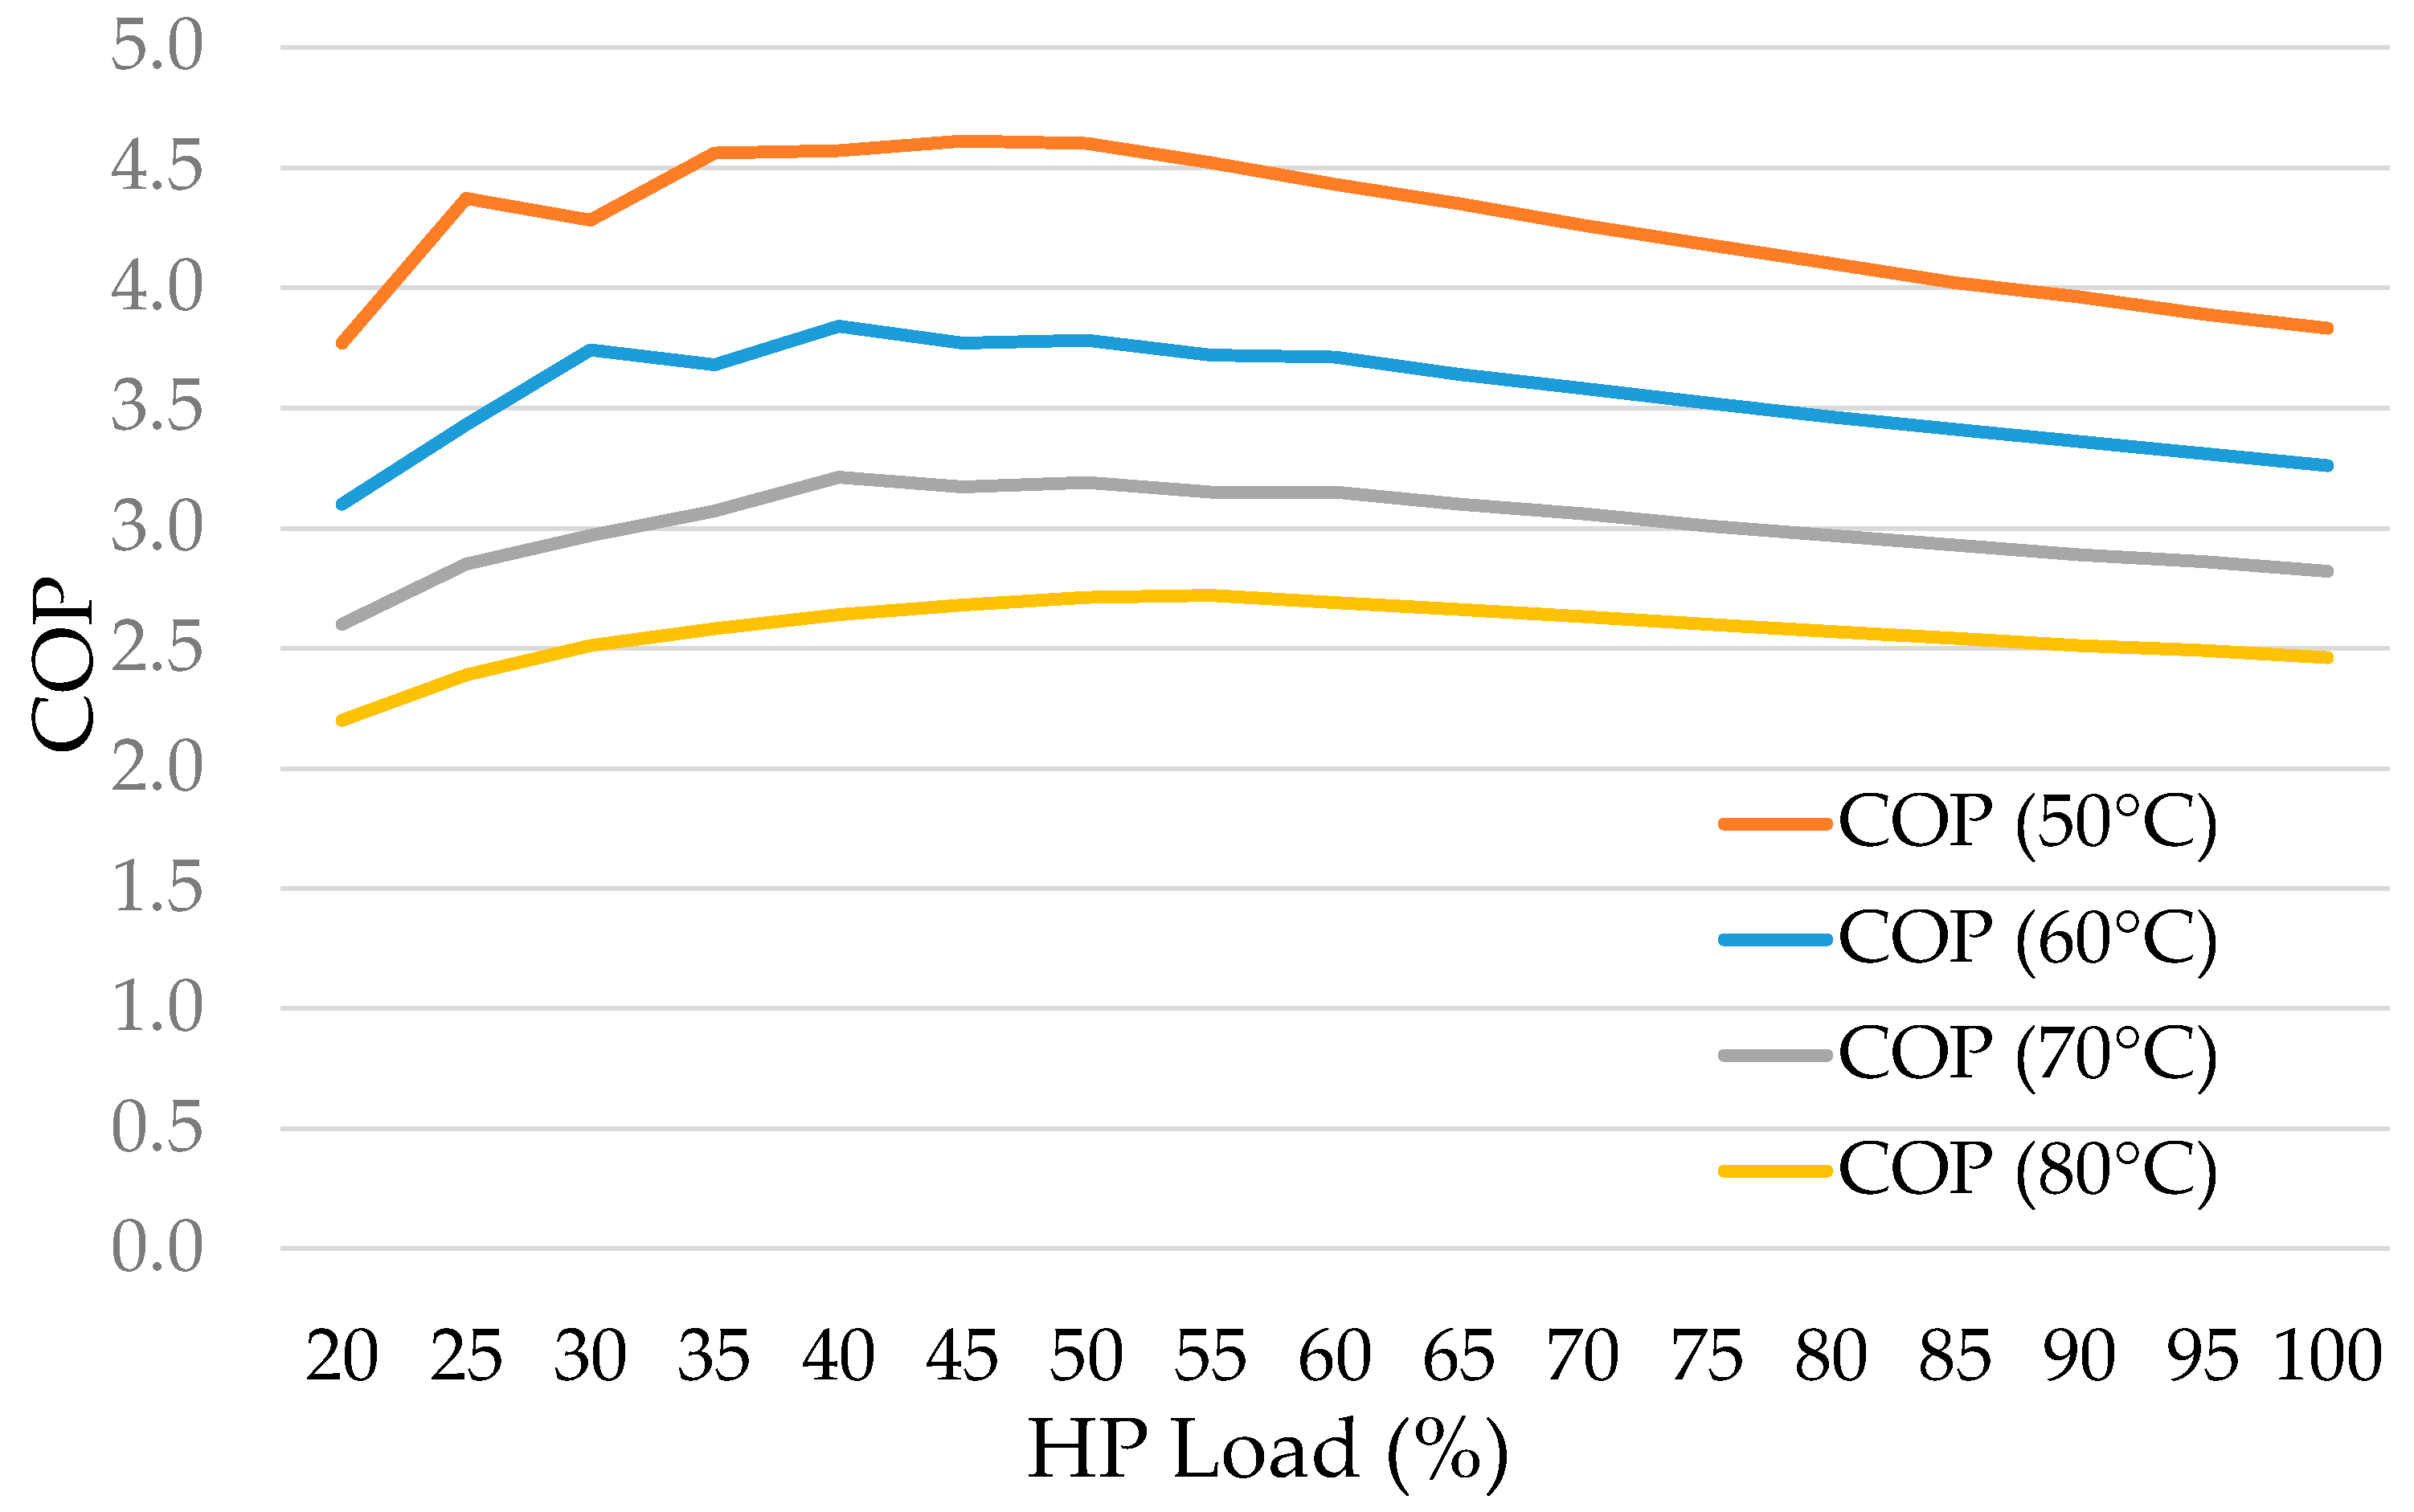
There is a drop in SCOP present during the summer period for system B, which can be addressed to the operation of the central heat pump at partial load. COP of the R717 heat pump changes depending on the operating load and the output temperature of the heat pump, as shown in
Figure 16.
The monthly thermal energy for heating produced by system C, with central R717 heat pump, electricity to run the heat pump, and monthly value for SCOP for the present state (PB-PR) and renovated state (RB-PR) of buildings is shown in
Figure 17.
HP heat production is reduced by 31%, while electricity consumption for heat pump operation is reduced by 30% on an annual basis in the case of renovated buildings (RB-PR) compared to the present state of buildings (PB-PR).
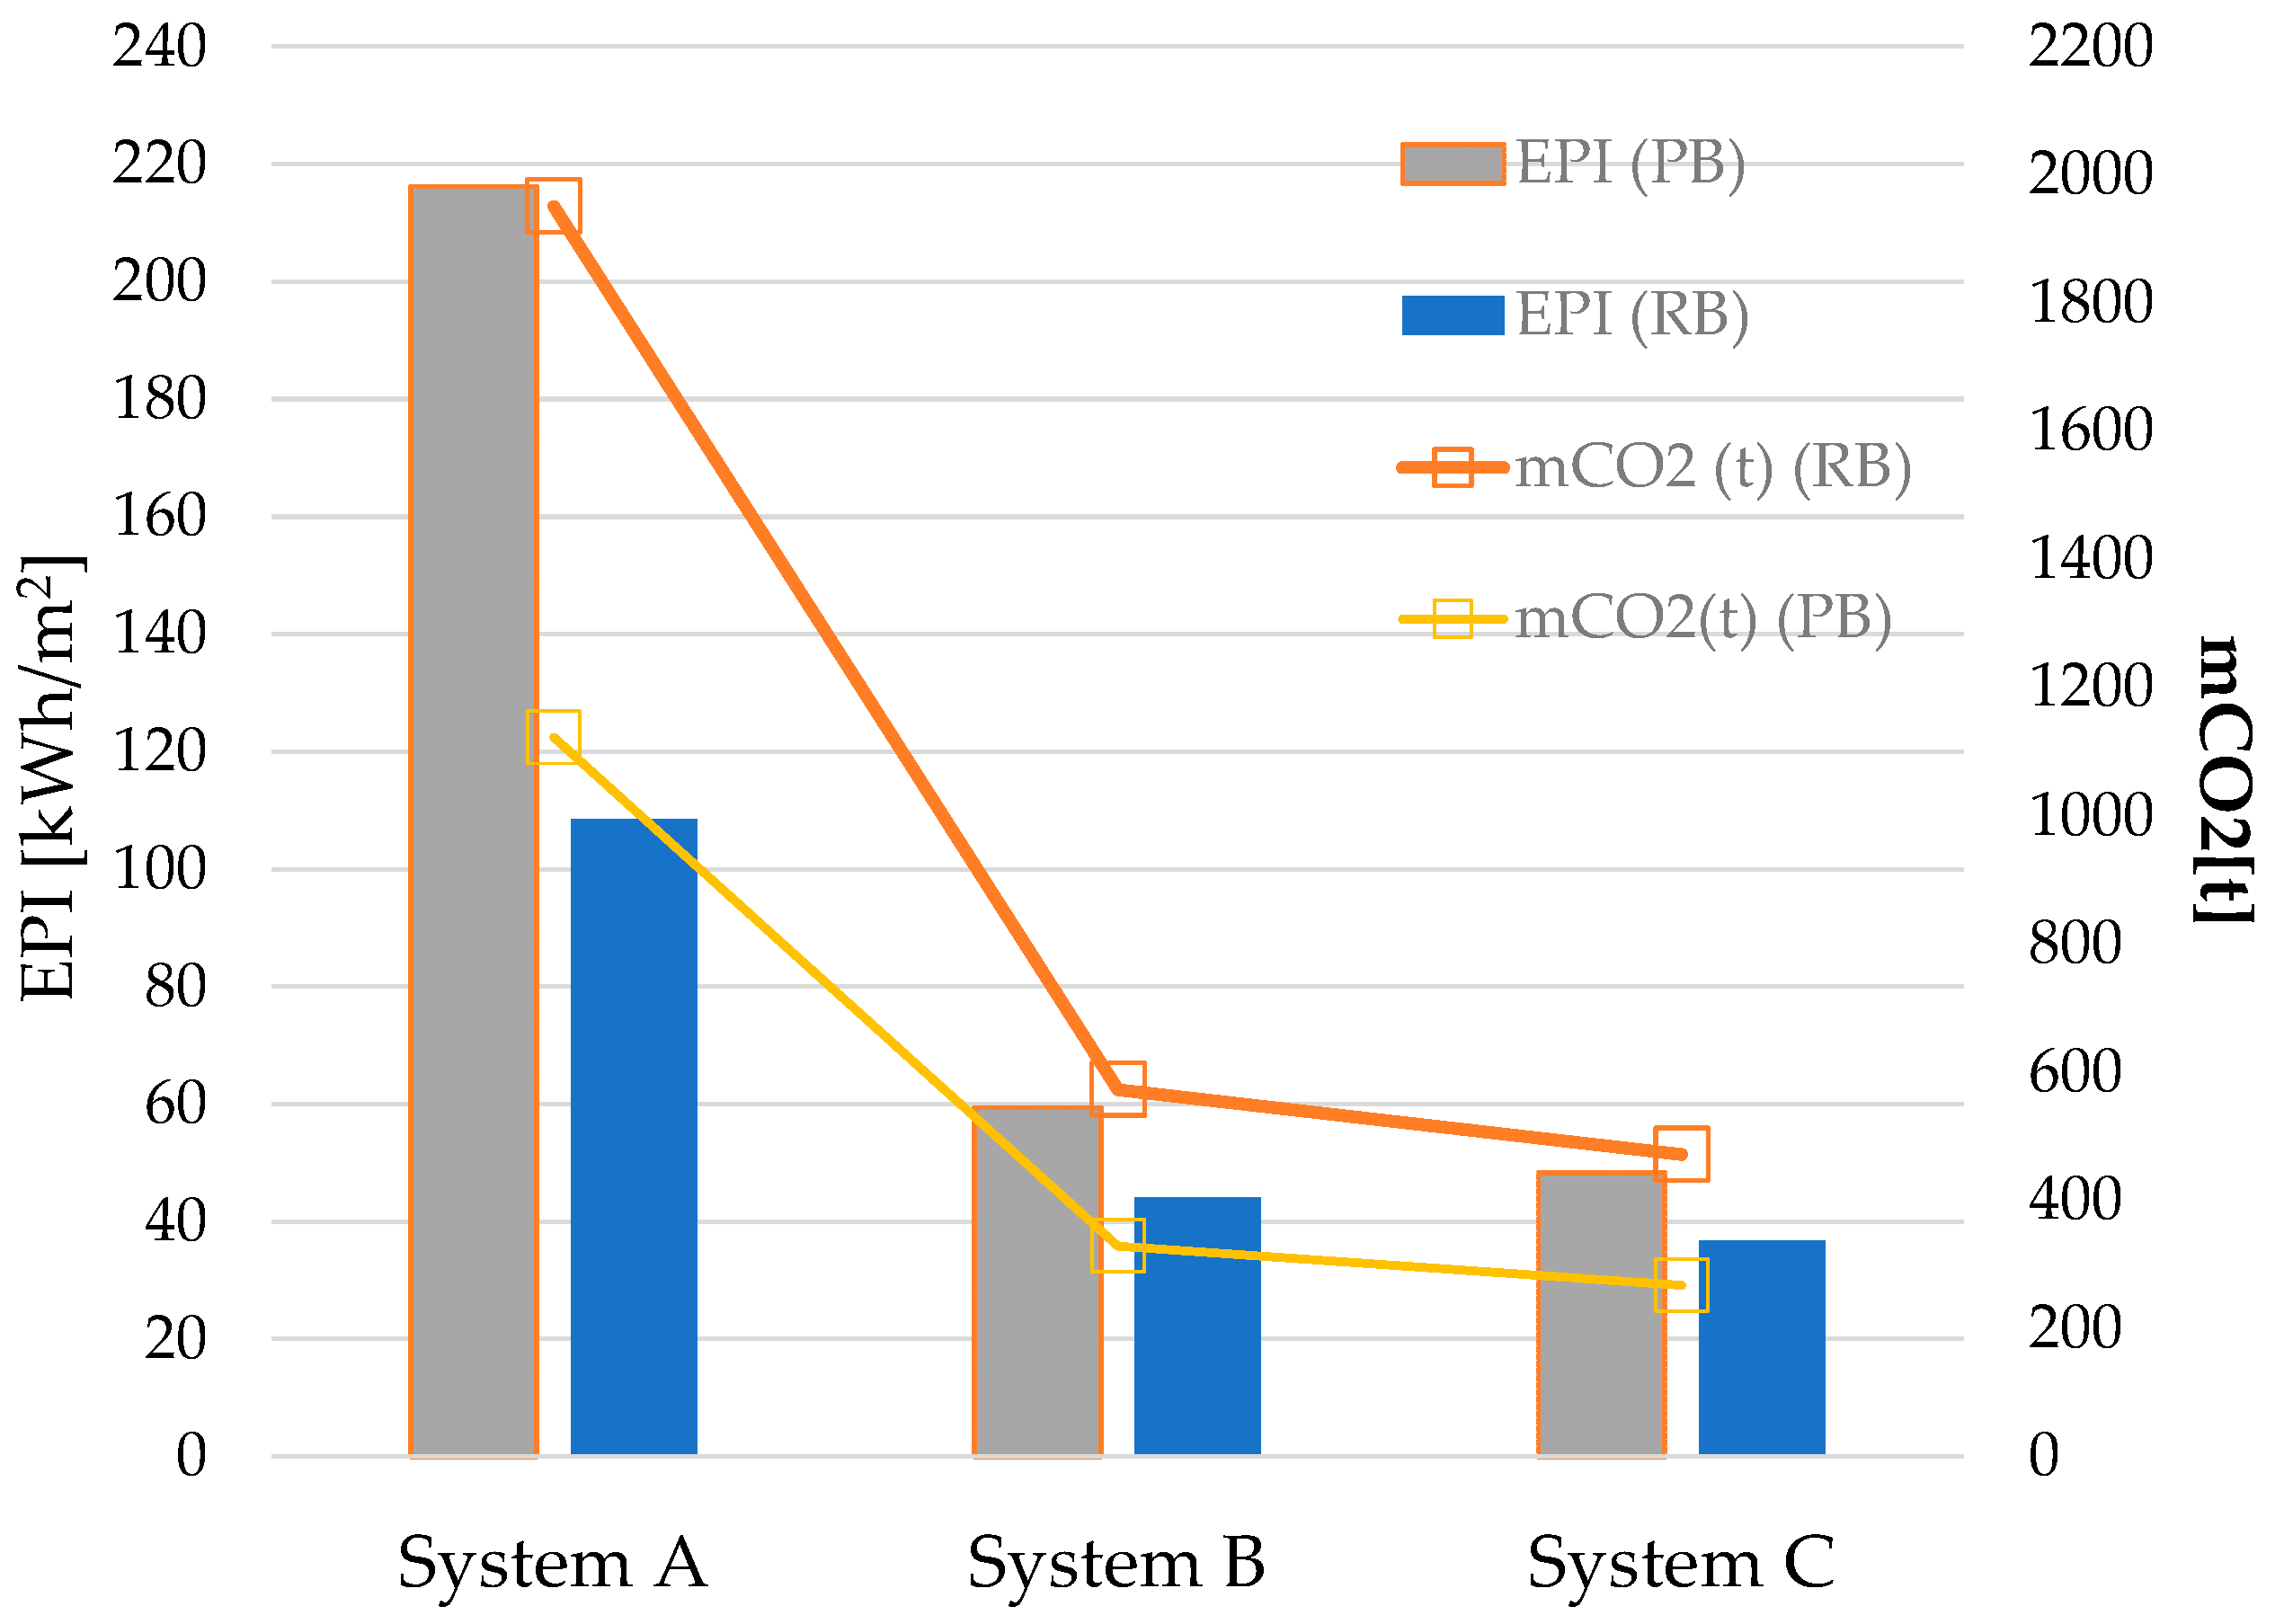
3.4. Indicator of Primary Energy and CO2 Emission
Indicators of primary energy and CO
2 emission for the present state (PB) and renovated state (RB) of buildings are shown in
Figure 18.
For the present state of buildings (PB-PR) of buildings, primary energy consumption of system B is reduced by 73% compared to system A, while the primary energy consumption of system C is reduced by 78% compared to system A.
In the case of energy renovation of buildings (RB-PR), the primary energy consumption of system B is reduced by 58% compared to system A, while the primary energy consumption of system C is reduced by 66% compared to system A.
For the present state (PB-PR) of buildings, the CO2 emission of system B is reduced by 71% compared to system A, while the CO2 emission of system C is reduced by 76% compared to system A.
In the case of energy renovation (RB-PR) of buildings, the CO2 emission of system B is reduced by 70% compared to system A, while the CO2 emission of system C is reduced by 75% compared to system A.
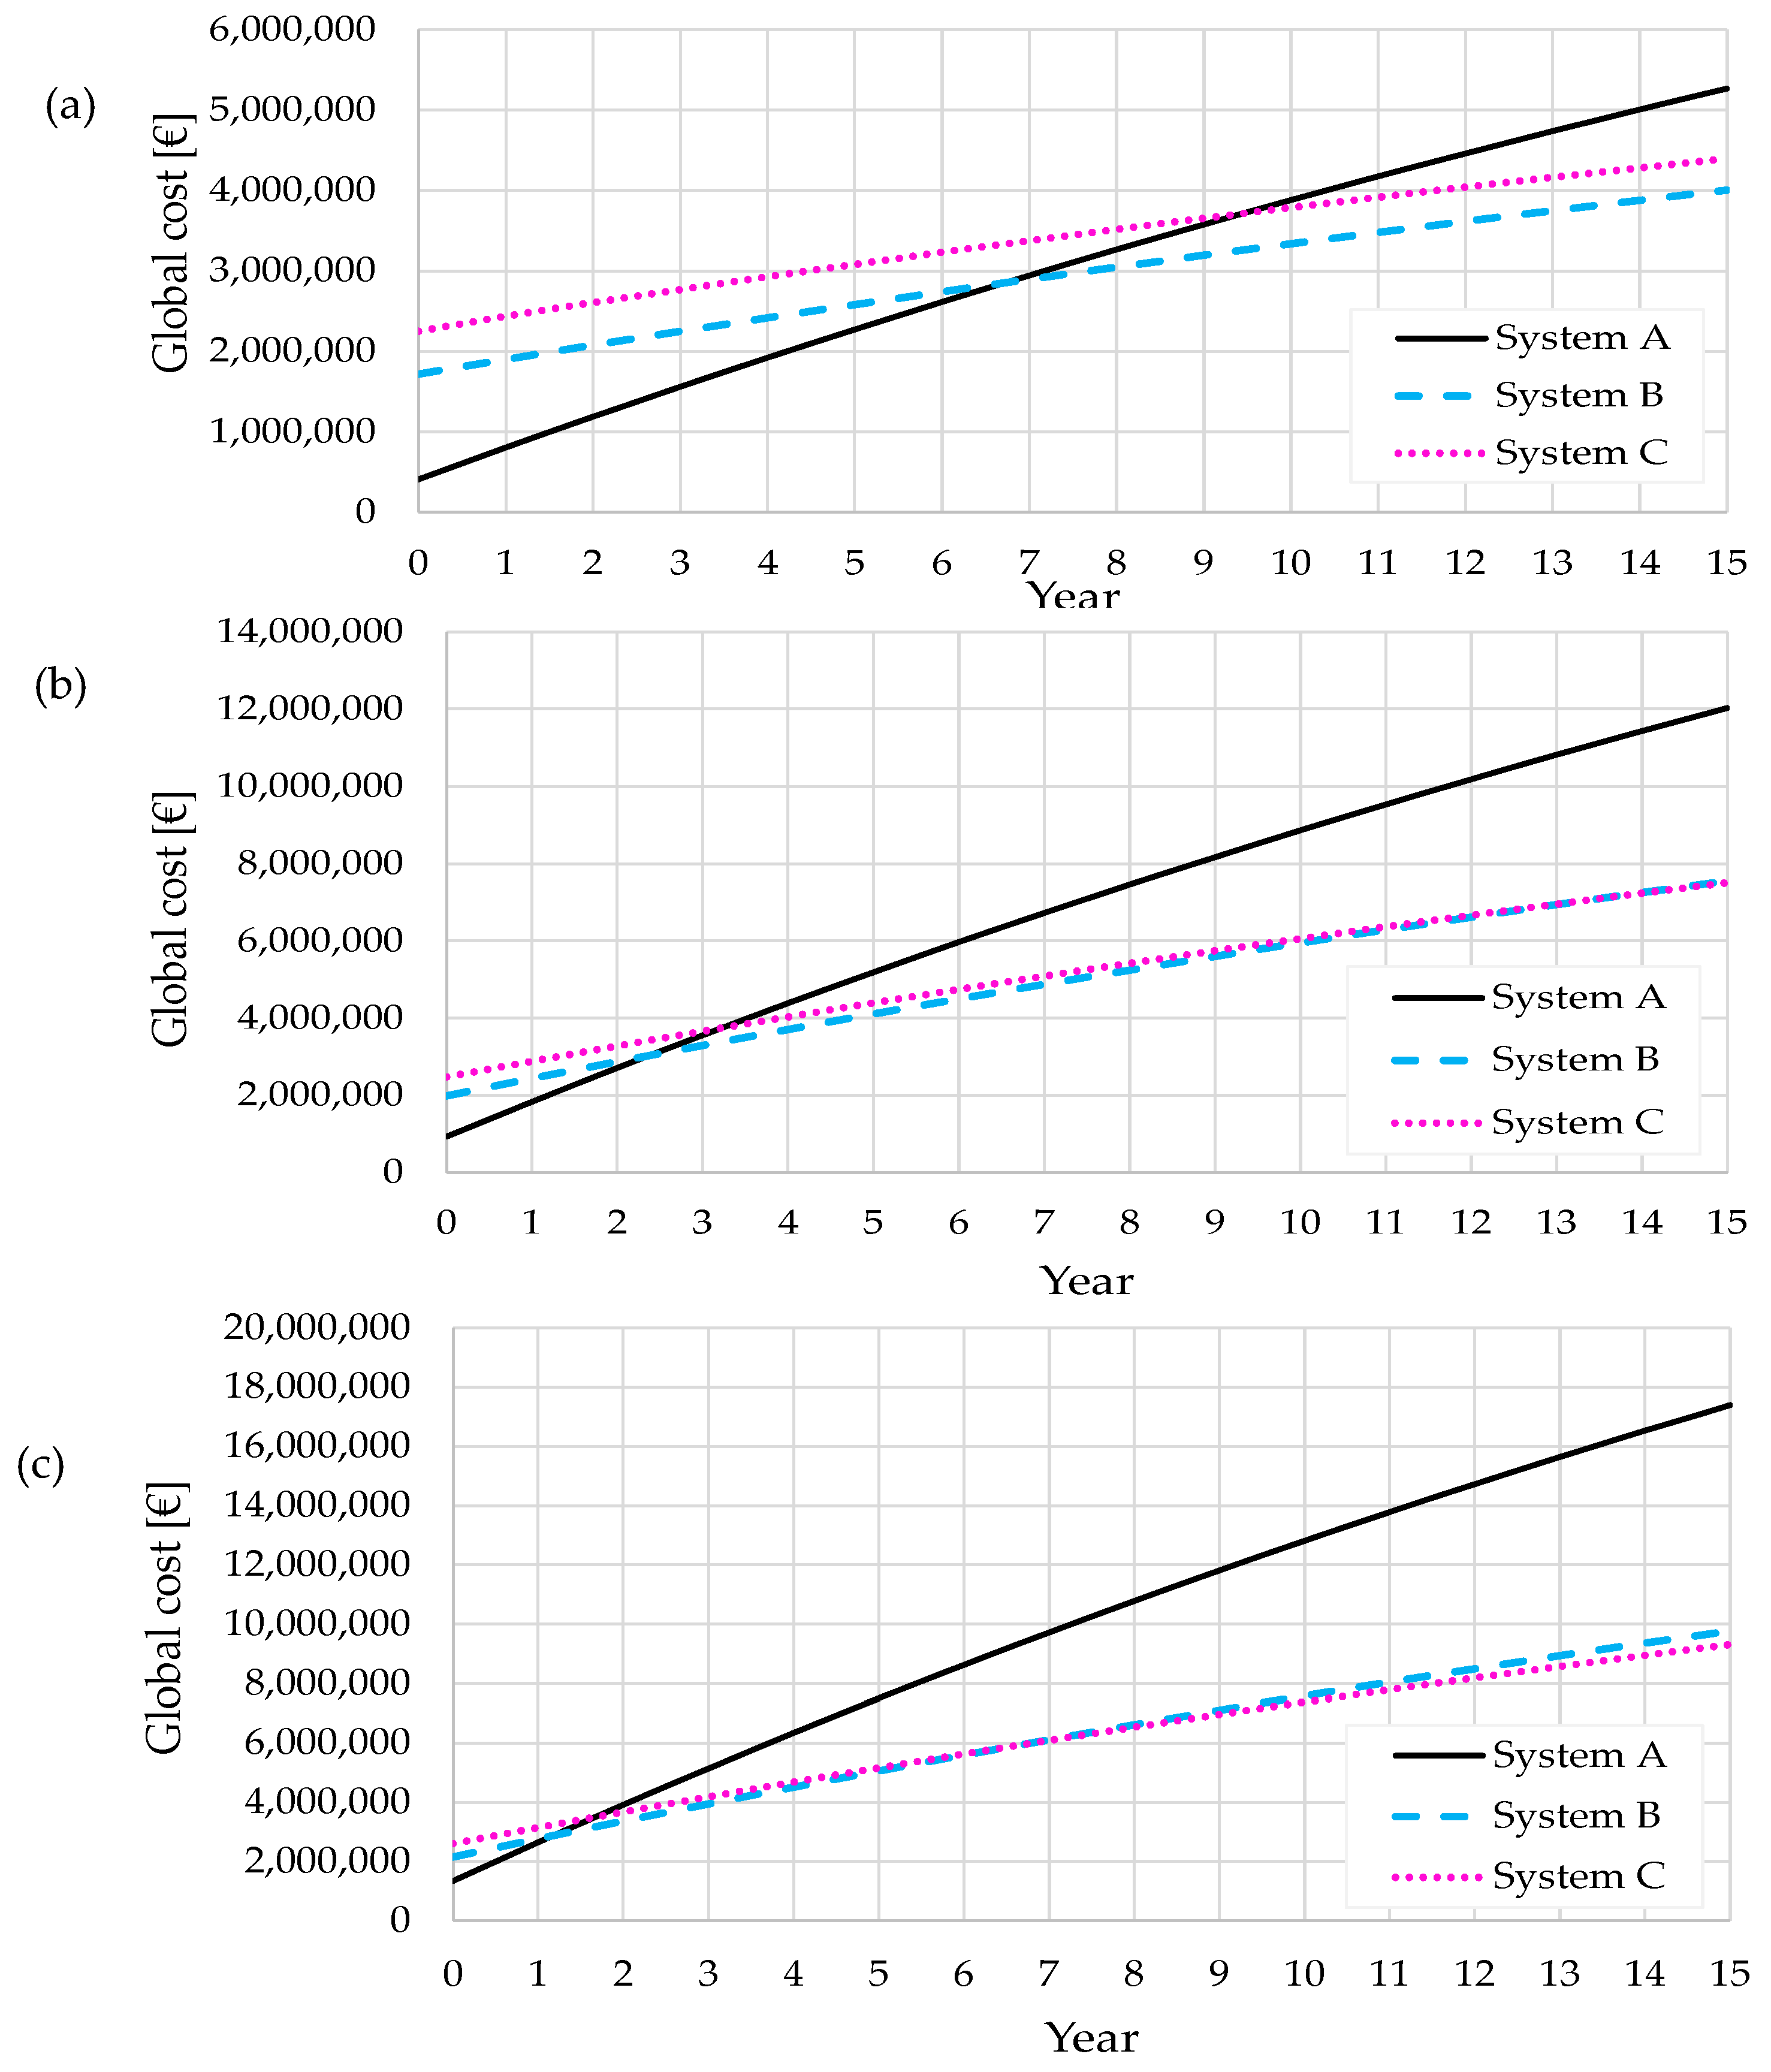
3.5. Cost Performance Results
The global costs of systems A, B and C for the present state of the building envelope (PB-PR) and three scenarios of energy prices (ES1, ES2, ES3) are shown in
Figure 19.
According to the present state of building envelope (PB-PR) and energy prices scenario 1 (ES1), the payback period of system B is 7 years, while that of system C is 9.5 years compared to existing system A. According to energy prices scenario 2 (ES2), the payback period of system B is 2.5 years, while that of system C is 3 years compared to existing system A. According to energy prices scenario 3 (ES3), the payback period of system B is 1.5 years, while that of system C is 2 years compared to existing system A. According to energy prices scenario 1 (ES1), it is not cost-effective to install system C instead of system B. According to energy prices scenario 2 (ES2), the payback period of system C is 14 years according to system B. According to energy prices scenario 3 (ES3), the payback period of system C is 7 years according to system B.
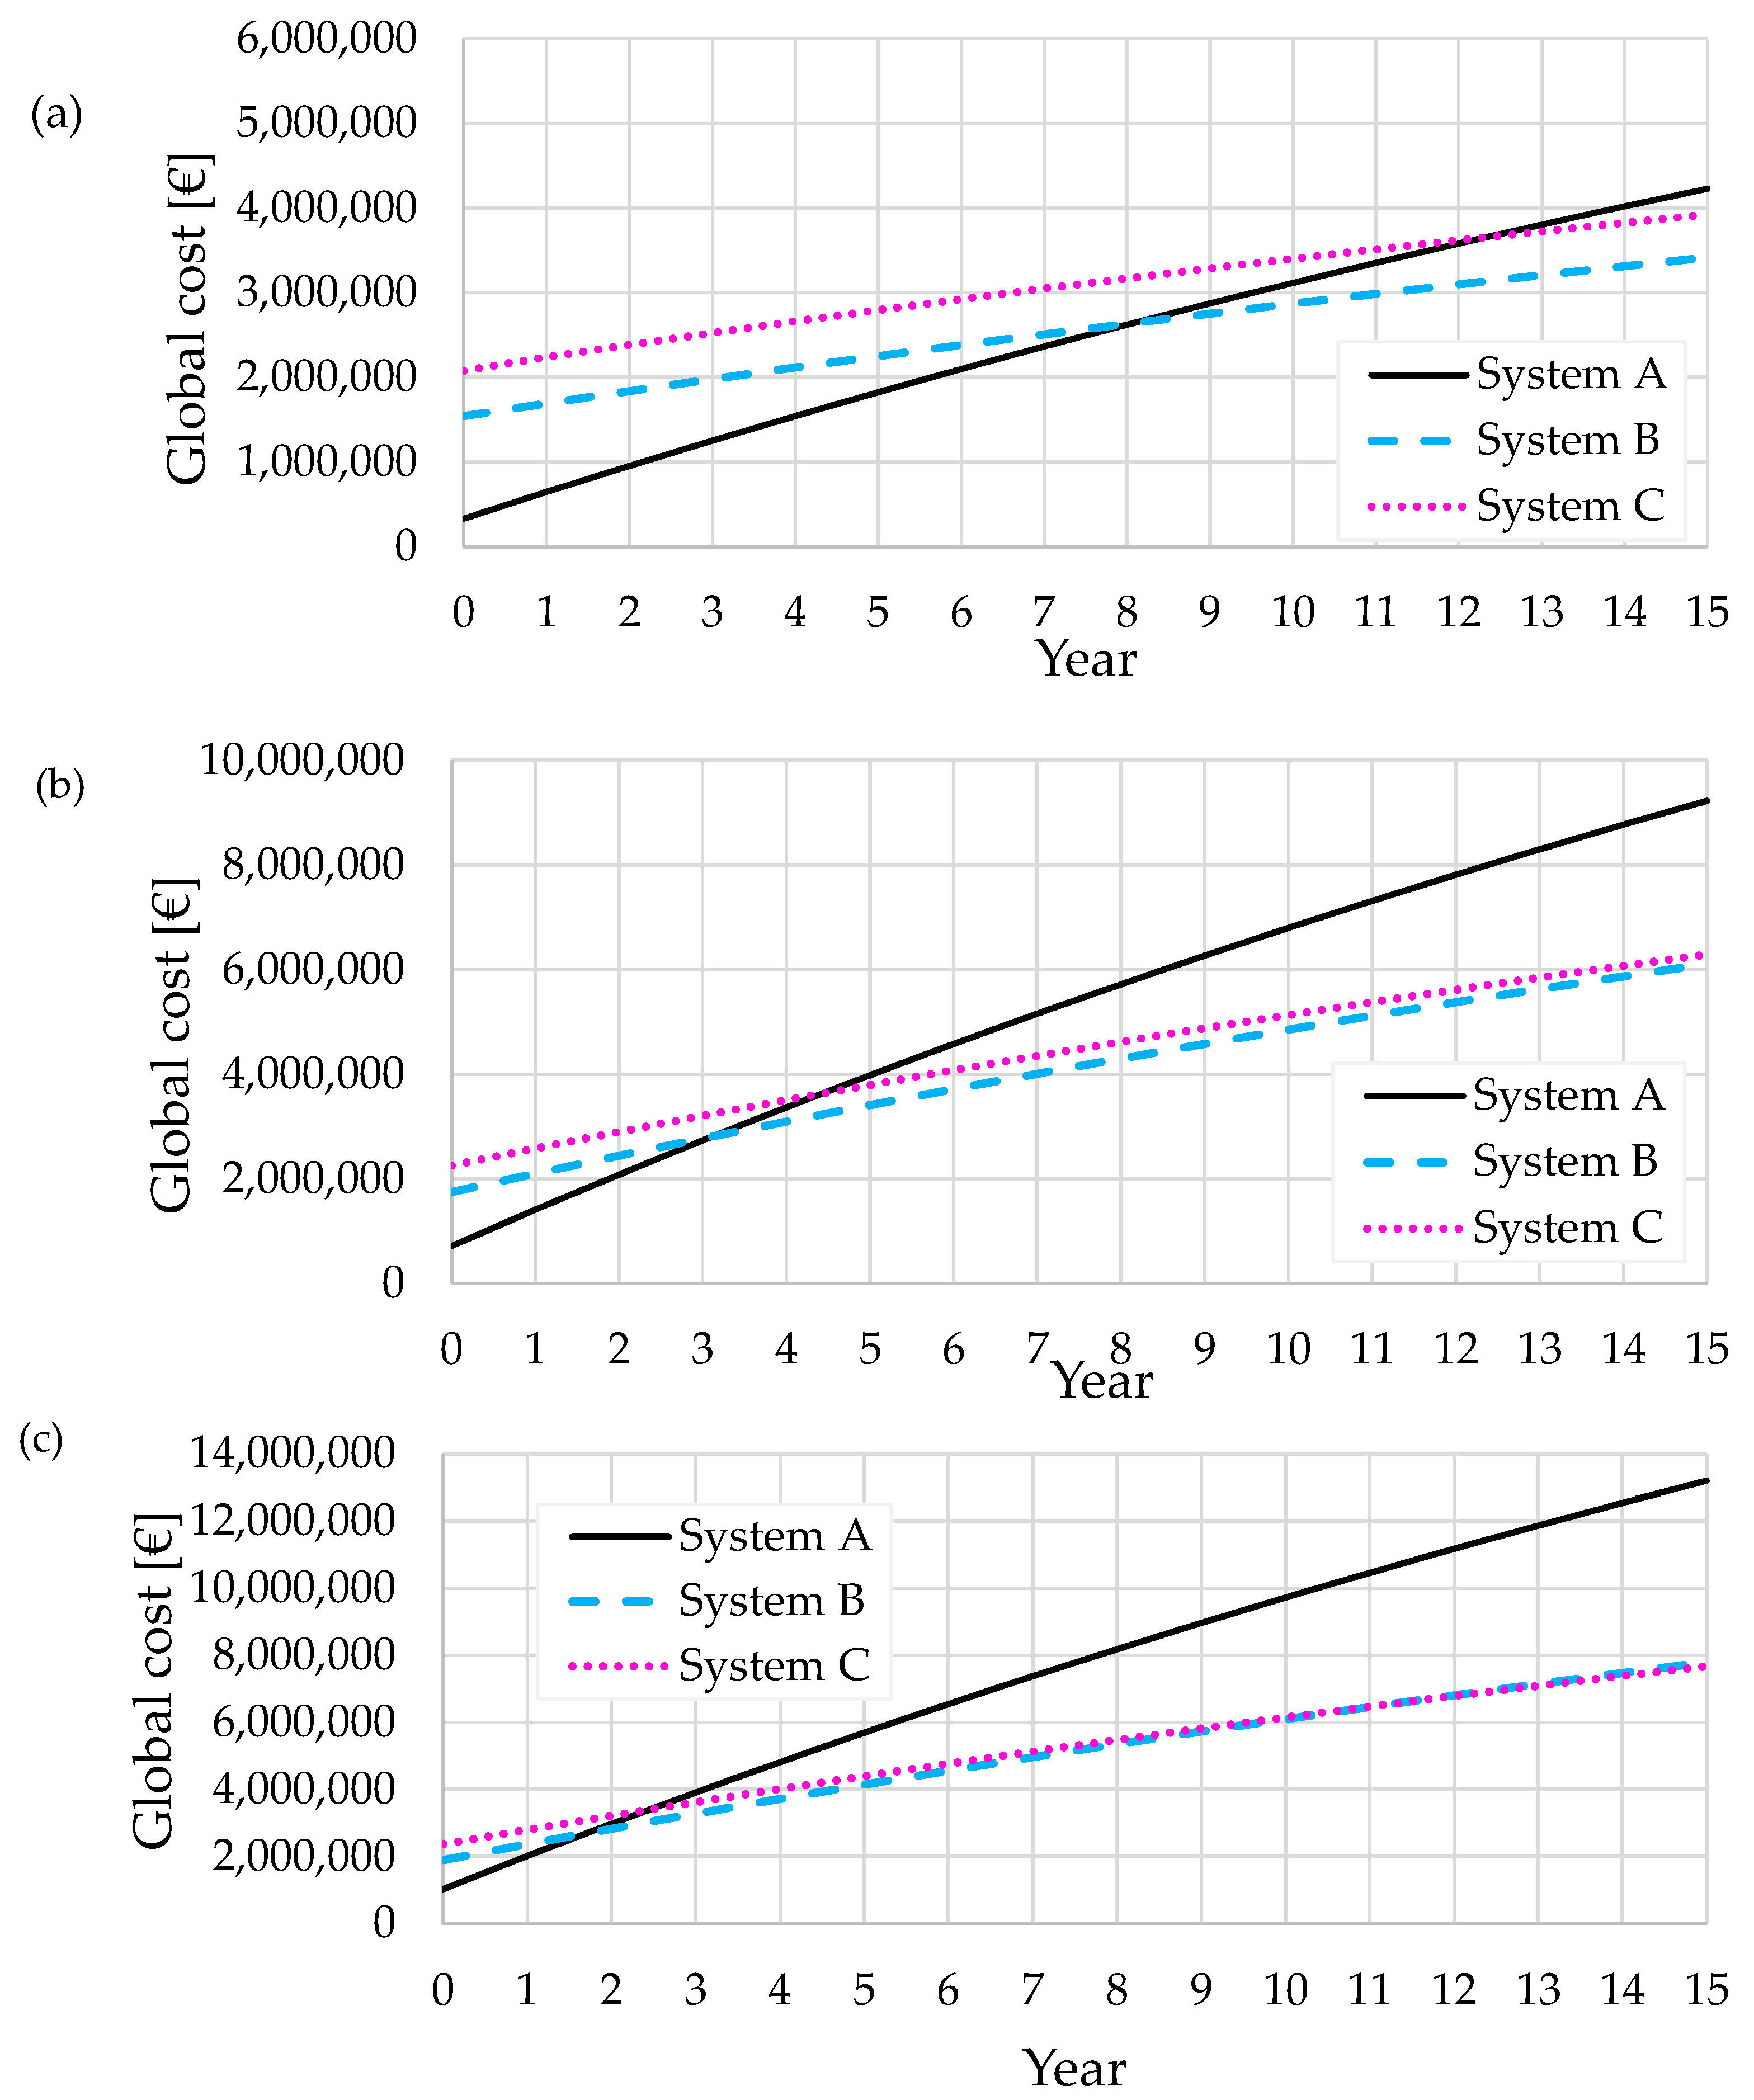
The global costs of systems A, B and C for the renovated state of the building envelope and three scenarios of energy prices are shown in
Figure 20.
According to the renovated state of the building envelope and scenario 1 of energy prices (ES1), the payback period of system B is 8 years, while that of system C is 12.5 years compared to existing system A. According to scenario 2 of energy prices (ES2), the payback period of system B is 3 years, while that of system C is 4.5 years compared to existing system A. According to scenario 3 of energy prices (ES3), the payback period of system B is 1.5 years, while that of system C is 2 years compared to existing system A.
According to energy prices scenario 1 (ES1), and scenario 2 (ES2), it is not cost-effective to install system C instead of system B. According to energy prices scenario 3 (ES3), the payback period of system C is 14 years according to system B. According to energy prices scenario 3 (ES3), the payback period of system C is 11 years according to system B.
4. Conclusions
The main goal of the presented work was the implementation of RES and heat pumps with natural refrigerants in the existing 3rd-generation DH system and the analysis of possible improvements through the conversion to the 4th-generation DH system. A case study of the complete refurbishment of a district heating system has been performed.
A comprehensive analysis of the transition from the 3rd- to the 4th-generation of the DH system was performed using a numerical dynamic simulation of all subsystems of the DH system considering production, distribution, and consumption.
Based on the performed case study of the DH system Kozala in the city of Rijeka, it can be concluded that this approach is applicable to smaller DH systems. However, this approach can also be applied to larger DH systems, but the process is more time-consuming due to the larger number of interdependent variables.
Dynamic simulations and energy efficiency analysis were performed using Trnsys software for three different systems and three different energy price scenarios. The application of heat pumps with natural refrigerants, described as system B and system C, in combination with own electricity generation through a PV system, leads to a significant reduction in carbon dioxide emissions, considering the share of renewable energy in the electricity grid in Croatia.
Energy renovation of buildings can reduce the supply temperature in the DH network from 90 to 72 °C. A further temperature reduction to 60 °C would be possible if all the radiators were left intact in the buildings according to the original design project.
The best variant for the present state of the building envelope (PB-PR) is system C with R717 water-to-water heat pumps operating for space heating and R744 heat pumps positioned in buildings for DHW heating, which achieves 78% primary energy consumption, 76% CO2 reduction, and 60% operating cost reduction with a payback period of 2 years for energy price scenario 3 (ES3), compared to the present state of the DH system.
The use of heat pumps and a PV system significantly reduces heat losses, energy input, primary energy consumption, and the CO2 emissions for systems B and C compared to system A, taking into account the present and retrofitted condition of the building envelope.
In case of a significant increase in the price of natural gas (ES3), the payback period of systems B and C becomes very short, less than 2 years compared to the present state of the DH system.
The retrofitting of the DH system based on the application of the heat pumps operating with natural refrigerants can be performed in two phases, called as system B and system C. In the construction of system B, there are no obstacles due to private property [
1], which allows a smooth path to decarbonization. After the realization of system B, system C can be implemented, which requires the consent of all co-owners of the buildings and can therefore be slowed down.
This study demonstrates the practical importance of performing dynamic simulations of the existing district heating systems to reduce the primary energy consumption, CO2 emissions, and operating costs while considering a favorable payback period.


