Article

Analysing the Economic Viability of Implicit Demand Response Control of Thermal Energy Storage in Hot Water Tanks

1
Division of Energy and Building Design, Department of Building and Environmental Technology, Lund University, 221 00 Lund, Sweden
2
Division of Building Services, Department of Building and Environmental Technology, Lund University, 221 00 Lund, Sweden
*
Author to whom correspondence should be addressed.
Energies 2022, 15(24), 9314; https://doi.org/10.3390/en15249314
Submission received: 11 October 2022 / Revised: 23 November 2022 / Accepted: 30 November 2022 / Published: 8 December 2022
(This article belongs to the Section G: Energy and Buildings)

Abstract

:
Demand-responsive control of electrically heated hot water storage tanks (HWSTs) is one solution, already present in the building stock, to stabilise volatile energy networks and markets. This has been put into sharp focus with the current energy crisis in Europe due to reduced access to natural gas. Furthermore, increasing proportions of intermittent renewable energy will likely add to this volatility. However, the adoption of demand response (DR) by consumers is highly dependent on the economic benefit. This study assesses the economic potential of DR of centralised HWSTs through both an analysis of spot price data and an optimisation algorithm approximating DR control. The methods are applied to a case study apartment building in Norway using current pricing models and examine the effect of the demand profile, electricity prices, heating power and storage capacity on energy cost and energy flexibility. Unit cost savings from DR are closely linked to the variation in unit energy price during the optimisation period. Increasing the storage capacity or the heating power increases the flexibility with a diminishing rate of return. However, increasing storage capacity does not result in cost savings as additional heat losses are greater than the saving from shifting demand, except for during highly volatile electricity price periods. Changing the minimum setpoint temperature improves the cost curve as a greater thermal storage capacity can be achieved without increasing heat loss. Systems utilising a smaller heating power are more economical due to the dominant role of the monthly price related to the peak energy demand of the system.

1. Introduction

The European energy market has experienced an extreme period of high prices and price volatility between 2021 and 2022, initially due to economies reopening after the COVID-19 pandemic and then due to the supply squeeze of natural gas as a biproduct of the Russia–Ukraine war [1]. In response, there are increased calls to transition from fossil fuel-derived energy to renewable sources [2]. However, the increased intermittency of renewable energy, particularly solar and wind, requires greater energy flexibility to balance supply and demand within energy grids [3]. The energy system must move from one where supply matches demand (supply side management) to one where demand matches supply (demand side management). Shifting energy demand to another point in time, termed demand response (DR), has the potential to both mitigate the current volatility in the energy market and balance the future energy grid powered by renewables. DR is achieved through either directly shifting processes or by short-term storage of energy for later use. Traditionally, DR has been managed centrally by energy companies in order to balance the energy grid. Shifting of processes is administered via contracts with large industrial and office buildings. Storage is provided by a centralised energy storage, such as pumped hydro, thermal storage pits and, increasingly, grid batteries. Direct management of residential buildings, with their many units and small demands, has not been practical [4].
The marketisation of the electricity market and the introduction of smart meters improves the feasibility for smaller scale DR. The wider adoption of small-scale DR could potentially reduce CO2 emissions from energy generation, as high energy prices often represent periods of higher demand than supply, which require the use of peaking power plants or importing electricity, often with higher CO2 emissions [5]. Similarly, DR can take advantage of periods of excess renewable energy generation, where energy prices are low. There are already examples of explicit DR where suppliers manage certain appliances on behalf of their customers, such as domestic hot water tanks [6]. The supplier acts as an aggregator of many customer demands passing on a portion of the savings [7]. Implicit DR is also possible with individual consumers responding to real time pricing (RTP), shifting their energy use to when energy is cheaper [8]. For implicit DR to be widely adopted, there must be a clear financial benefit to the consumer [9]. Where RTP is used, DR can help to reduce electricity bills, which have received a greater focus due to recent increases in energy prices. Additionally, incentives for DR could be offered by energy companies as paying for consumer DR could be more cost effective than centralised storage [10] or peaking power plants [9].
Consumer RTP requires a market-based power system and smart meters to measure energy use in smaller timesteps, commonly one hour. The smart meter roll-out across the EU has been uneven, with only Spain, Italy, Estonia, Finland, Sweden and Norway at or near 100% coverage [11]. Norway was the first country to implement a market-based power system in 1991 [12] and completed the installation of smart meters in all properties in 2019 [11]. This has been accompanied by a wide availability of “spot price” electricity contracts which charge the consumer the cost of electricity based on the hourly RTP of the Nord Pool electricity exchange. Over 75% of households are now on this type of contract [13]. Furthermore, some electricity providers are encouraging manual load shifting by providing alerts to customers via their apps for periods of high prices [14,15]. Therefore, Norway is well positioned to be a testbed for innovative technologies within DR.
Consumer DR requires more intelligent controls such as rule-based control (RBC) and model predictive control (MPC) than the widely used PID (proportional–integral–derivative) control [16]. PID control is a responsive control, which steers a system towards a setpoint value based on formulas that use measured values as inputs. The combination of proportional, integral and derivative terms in the formula minimises the delay and overshoot of the response. RBC utilises a set of predefined rules with upper and lower setpoints, allowing for different responses depending on input data. MPC is a predictive control, employing a dynamic building model, which can generate an optimised control strategy that takes the future state of the system into account. The future state is modelled using the current state of the system and forecast information such as weather, occupancy and energy pricing [17]. Electricity pricing is a good proxy for the level of imbalance between supply and demand within the energy grid. The optimisation can be for a combination of factors, such as thermal comfort and energy cost, and can include constraints on the controlled variables. Due to dependency on simulation and the computing power required, the practical use of MPC has only become relevant during the past decade [18].
Energy storage within residential buildings offers greater DR potential than the direct shifting of demands as these are limited to deferable loads (appliances where the time of operation can be shifted without negatively impacting the resident), such as fridges, freezers, dishwashers and washing machines. Consumer management of these loads has been shown to produce insignificant results [19], while automated control may not suit all residents [20]. In addition, the potential savings to the individual are small as the shifted energy use is relatively small. Electricity can be stored either chemically or as thermal energy. The economic feasibility of chemical storage (batteries) is highly dependent on the initial costs of batteries, which are currently too high [21]. The batteries in electric vehicles could be utilised instead, as they stand idle for long periods [4]. However, the pricing model and technology are still in development. The extra wear placed on the battery through increased charging and discharging cycles could mean that price responsive charging of the vehicle is preferred by most owners, which can offer similar savings through load shifting.
In heating dominant climates such as Norway, space heating and domestic hot water (DHW) represent the largest proportion of energy demand, meaning thermal energy storage (TES) offers considerable potential for DR in residential buildings. Thermal energy can be stored in hot water storage tanks (HWSTs) or in the building’s thermal mass [22]; however, they are not optimised for DR. In northern Europe, HWSTs are a common element in DHW systems and as buffering elements in heating systems, especially those utilising solar collectors, heat pumps or district heating [23]. The heating element can be a separate element or integrated in the HWST [24]. HWSTs are currently sized according to rules-of-thumb. Thermal mass is present in all buildings but usable storage depends on the type of construction and the level of envelope insulation [25]. The utilisation of thermal mass is limited by thermal comfort requirements and higher heat losses [22]. Additionally, DR of thermal mass requires a more complicated control which accounts for thermal comfort and the heating system [26].
HWSTs buffer heating and DHW demand peaks, reducing the required capacity of the heating source and allowing more efficient operation for longer periods at the nominal power [27]. HWSTs are also good stores for the unregulated supply from solar thermal collector systems [28] and offer the most cost-effective form of storage for excess electricity produced by photovoltaic panels, increasing self-consumption [29]. HWSTs have greater DR potential than building thermal mass due to their higher thermal capacity by volume [22]. By charging the tank (increasing its temperature), it is possible to store energy for later use. Tank stratification and mixing values allow for the average tank temperature to vary without affecting the output temperature delivered to heating or DHW, minimising the impact of DR on the consumer. The variation of setpoint temperature of HWSTs would not affect the end user as is the case with setpoint variation of room temperatures, where thermal comfort has to be factored in [30]. Therefore, the control for HWSTs only needs to meet the energy required for heating and DHW, simplifying the model. Furthermore, where HWSTs are heated by electrical heaters, they offer a significant demand–flexibility potential, with the current stock of electric water heaters in Europe estimated to have a flexible capacity equivalent to the entire installed power generation capacity of the Czech Republic [31]. In Norway, the historically low electricity prices have resulted in almost 100% of water heaters being electric, the highest in Europe.
Research into the control of electrically heated HWSTs has focused on the accuracy of the tank model and the correct functioning of the control. Kepplinger et al. [32] developed and simulated a DR control for an electrically heated HWST which showed cost and energy savings of up to 12% relative to conventional operation. This was then field tested over 18 days, resulting in 3.6% energy cost savings without affecting user comfort [33]. The control used a bulk model for the HWST which was shown to be robust enough when used with a stratified HWST. More recently, Ritchie et al. have developed more detailed models of the HWST which better account for predicted demand and legionella prevention while minimising energy use [34].
Several studies have investigated DR control of HWSTs using RTP in Norway. Olivera et al. [35] found DR control strategies provided worthwhile savings over a constant setpoint strategy especially where hourly prices become more volatile. As the energy price pattern had predictable peaks and troughs, a less complicated control could achieve similar savings with a control strategy to charge during the night resulting in similar savings to a complex strategy. The study used spot prices from February, which are often higher than the rest of the year, potentially leading to a favourable result. Furthermore, the study just used spot prices, as consumer RTP contracts were not available when the research was undertaken. Nord et al. [36] showed that the cost optimal tank size for price responsive control is highly dependent on the additional fees that make up electricity pricing. A strategy with a fixed grid fee had a cost optimal tank three times the reference size. A strategy with a variable fee, based on the system’s peak power, had a cost optimal tank six times the reference size. The study used measured DHW profiles recorded for 50 days. Sørensen et al. [37] further developed this research by applying four rule-based control strategies to the measured data using a simplified tank model based on energy capacity. The four control strategies were peak power limitation; spot price saving where each day was divided into low, medium and high price periods; flexibility sale with no heating in peak periods; and maximising self-consumption of a photovoltaic system. The reduced peak power and flexibility-sale strategies were effective in reducing cost, although the price paid for flexibility was purely hypothetical as no such schemes exist in Norway. Spot prices provided limited savings when using 2019 prices, matching when the measured data were recorded. The savings were improved when using price data from 2021 showing a need to analyse year-on-year variation. Furthermore, Sørensen et al. noted that spot price savings could have been improved by using an MPC.
All these studies are successful in showing the marginal benefit of DR over an existing reference case but have not fully investigated the parameters which impact the economic viability of the technology in the current electricity market. The parameters include the demand profile, energy price profile, heating power capacity and the storage capacity. Furthermore, there is a need for a better understanding of electricity price patterns over multiple years. This is particularly important for DR with TES, as the total energy use is often higher due to the additional heat losses from energy storage [38]. To the authors’ knowledge, there is also a lack of simple analysis tools which can be used to quickly assess the feasibility of DR in an electricity market before investing time in the technical development of the control. Such tools would also help in developing future price structures to increase the use of DR.
The focus of this research is on assessing the economic potential of implicit DR of HWSTs under current pricing policies by approximating the savings achieved by an optimal control using a simplified analysis method. An optimal control strategy represents a best-case scenario for DR. A pair of algorithms were written to create a charging profile to minimise the unit cost of energy which was then adapted to the available capacity of HWSTs. Each analysis used a full year of historic electricity prices, including fees and taxes split into 24-h periods, as this is the availability of price data from the day-ahead Nord Pool market. The past nine years of electricity spot prices were compared to determine the potential variation in savings. Based on this analysis, three years were chosen to represent average spot prices (2019), volatile spot prices (2018) and highly volatile spot prices (2021). Three different demand profiles were optimised to three different years of electricity spot prices for a range of heating powers. The resulting charging profiles were then used to parametrically study the effect of varying the number of HWSTs and their minimum setpoint temperature. The energy cost and energy flexibility in each case were calculated against a reference system for the demand profiles. The results of this study are used to discuss the effect of each parameter on the potential cost savings from DR and the measures to improve the economic viability of DR.

2. Methodologies

2.1. Inputs

2.1.1. Electricity Prices

The electricity price varies for each hour based on the Nord Pool energy market. The end-user price consists of the spot price, grid tariff, electricity tax and VAT. In addition, there can be small fees for the electricity provider and electricity certificates. The electricity provider fee can be applied as a monthly fixed cost, a fee per kWh or a combination of both. The electricity certificate fee is a fixed fee applied per kWh. These fees are dependent on contracts and represent a very small component of the electricity price. Therefore, they were not included in this analysis. The build-up of the unit cost of electricity is shown in Table 1 using the 2021 energy tax. Hourly spot prices for the Oslo region for the nine years between 2012 and 2021 were acquired from Nord Pool [39]. The grid tariff varies seasonally, and the spot price fluctuates hourly. In addition, there is a monthly cost comprising a fixed grid tariff and a variable grid tariff based on the peak electricity demand in that month, shown in Table 2. Small private customers currently pay a lower fixed cost price and no variable part, although this is changing from 1st of July 2022 [40]. As the case study’s heating system is a large centralised system, a business grid tariff for 2021 is used.

2.1.2. Thermal Energy Demand Profile

For the purpose of this study, the demand profiles were taken from a building energy simulation of a proposed affordable apartment complex in Sørumsand (59°58′54″ N, 11°14′25″ E), Norway, roughly 20 km east of Oslo. It is proposed that four blocks will be built, four floors high, providing 68 units and a total of 3450 m2 of heated living area. Figure 1 shows their arrangement. The blocks are built on top of an unheated basement which contains parking and the technical room for the buildings. Three thermal energy profiles were generated using the building energy simulation software SIMIEN 7 [42], which meets European Standard EN ISO 13790 [43] and is validated according to EN 15265 [44].
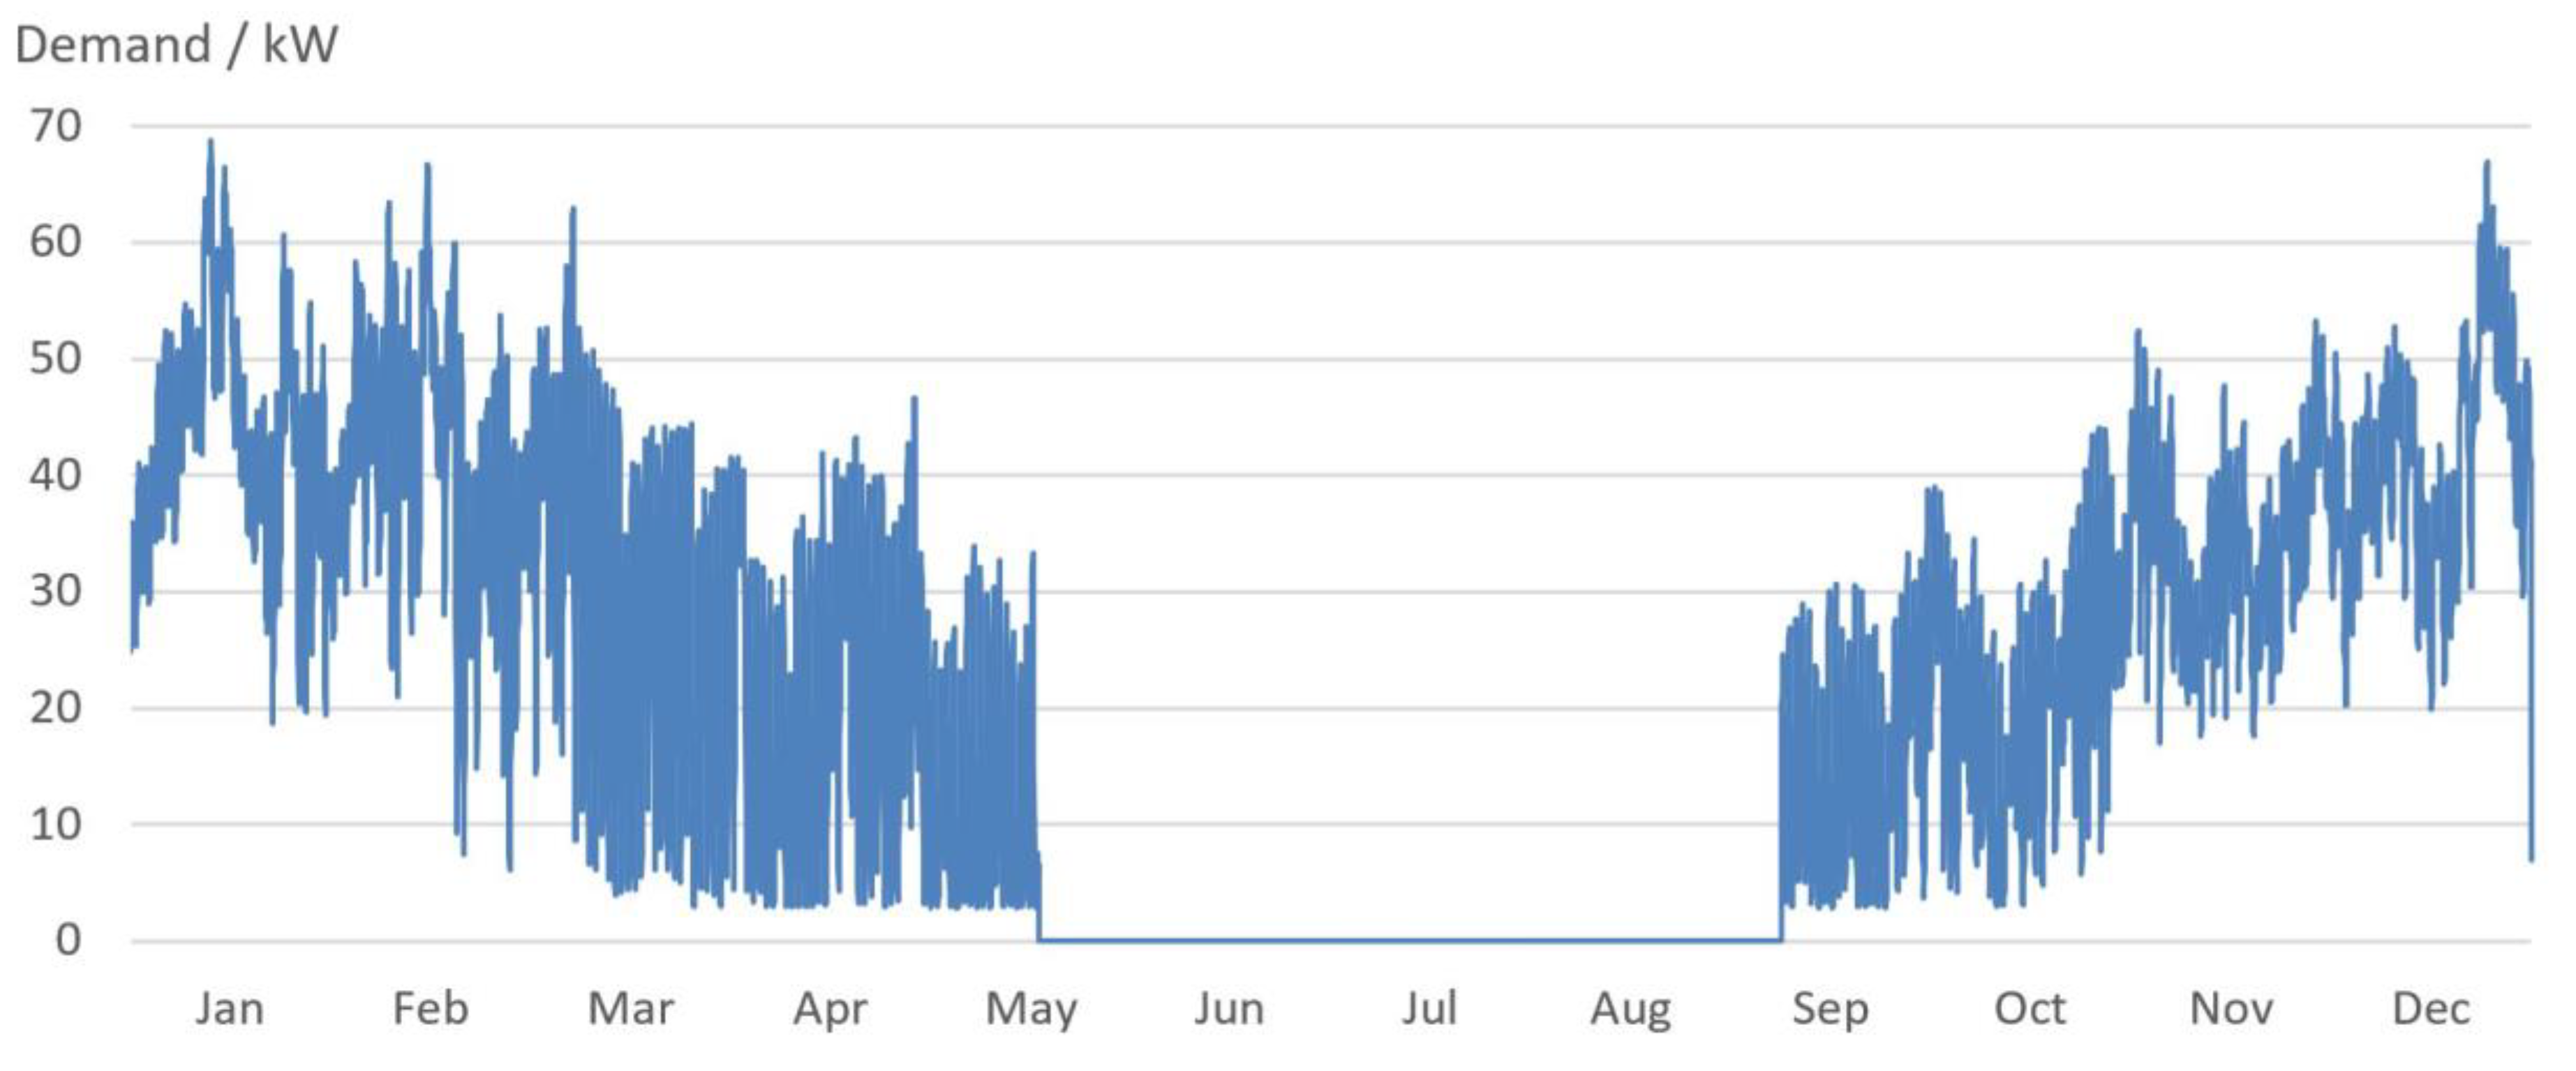
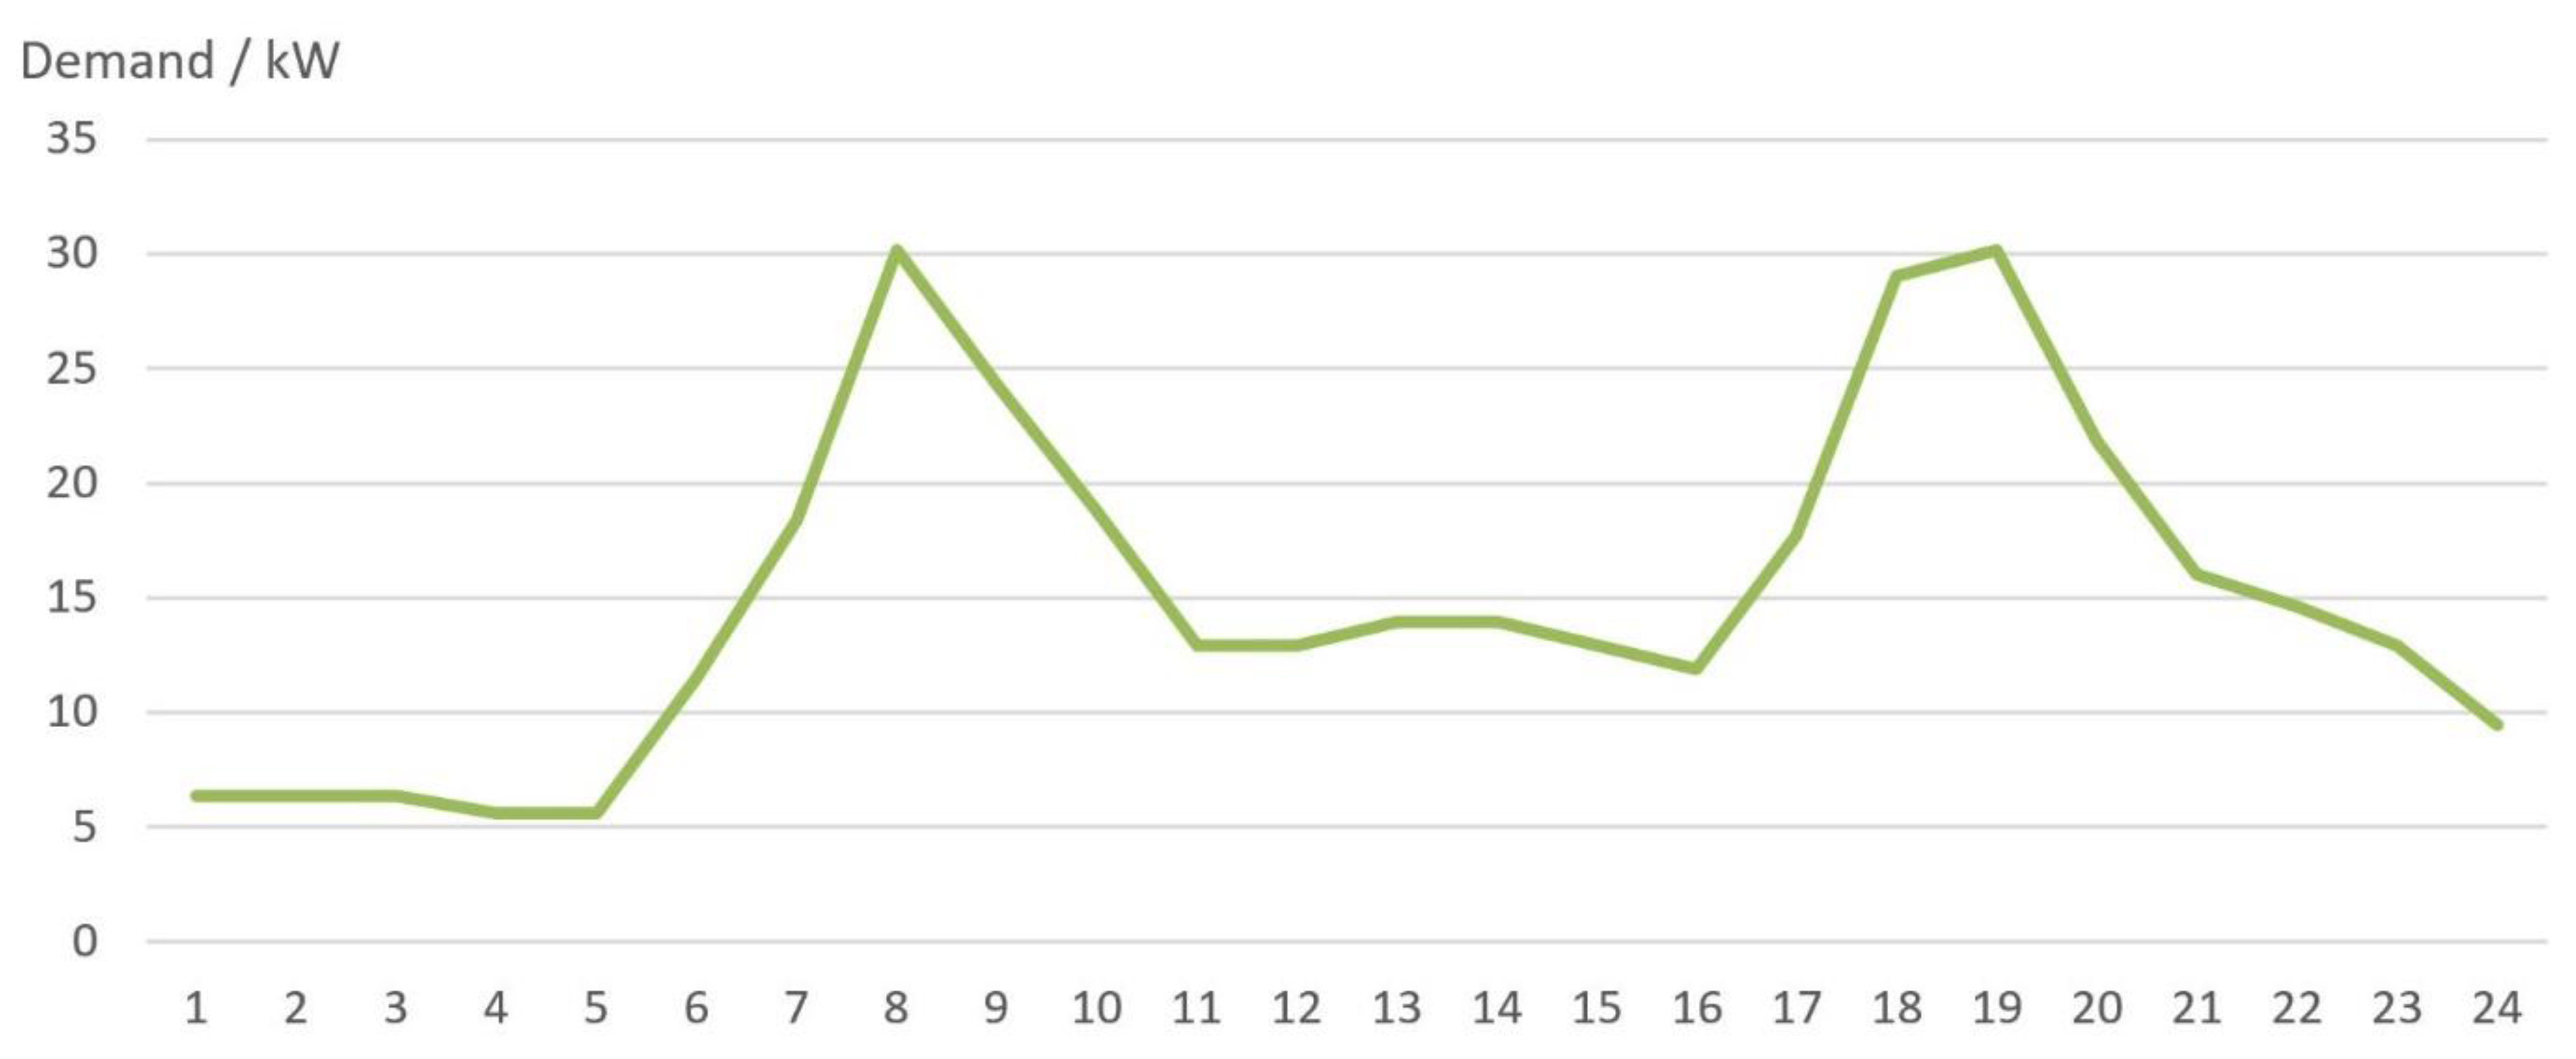
Two heating strategies based on NS 3431 (Norwegian standard) were examined: a variable setpoint strategy, with a setpoint of 22 °C (7:00 to 23:00) and setback of 20 °C (23:00 to 7:00); and a constant setpoint of 22 °C. The heating system was deactivated during the summer (19 May to 8 September). The resulting demand profiles are shown in Figure 2 and Figure 3. The DHW profile is according to Norwegian energy simulation standard SN-NSPEK 2020:3031 [45] and is the same for each 24 h period. The demand profile is shown in Figure 4. Similar standardised profiles have been shown to be accurate where the demands of multiple residential units were combined [46]. The resulting monthly demand profiles of the heating strategies and DHW are shown in Figure 5. All the profiles include the energy required for the simulated distribution losses.

2.1.3. HWST

The number of tanks and the setpoints were varied from starting conditions based on common praxis for the project. For heating, this was one 1000 L tank with a 55 °C setpoint. For DHW, this was three tanks with a 65 °C setpoint. Tank sizes were varied in 1000 L increments and setpoints (Tsetpoint) were decreased in 5 °C increments down to 45 °C for heating and 55 °C for DHW. A maximum tank temperature of 95 °C was assumed. The heating elements supplying the system were varied in 5 kW increments. The initial cost of one 1000 L HWST (including electric heating element) according to the Norwegian Pricebook was 42,000 (≈4200 EUR) with a 20-year lifetime [47].
The key parameter for determining the charging profile is the heat loss associated with the storage of energy. A high heat loss makes load shifting difficult over long time periods. The HWST was based on a commercially available 1000 L tank, modelled as a cylinder 2.2 m high and 1 m in diameter. It was assumed to have 100 mm of insulation with a thermal conductivity of 0.037 W/(m·K). The internal dimensions were thus 2 m high and 0.8 m in diameter. The resulting surface area was 6.03 m2. In addition, a 0.2 W/K loss was assumed for each of the four connection points based on the findings of Steinweg et al. [48]. The specific heat loss, Hs, for each tank was therefore 3.03 W/K. The heat loss of storing an additional kWh of thermal energy was calculated as:
H s · T s + 1 T a H s · T s T a C T + 1 C T = H s C T + 1 C T ,       W / kWh ,
where Ts is the tank temperature and Ta is the ambient temperature around the tank (assumed constant at 18 °C). The volumetric heat capacity of water (CT) was defined as:
C T = c p , w · ρ w 3600 ,     kWh / ( m 3 · K ) .
The values used for the heat capacity (Cp,w) and density (ρw) of water are those for a constant pressure equivalent to atmospheric pressure at sea level. As Cp,w and ρw vary with temperature, the resulting range of heat loss within the working range of 45 °C to 95 °C was from 2.99 W/kWh to 3.27 W/kWh. In order to simplify the model, a heat loss of 3.13 W/kWh (equivalent to 65 °C) was taken as the first value. The effect of this simplification has been expanded upon in the discussion section.

2.2. Cost Saving Analyses

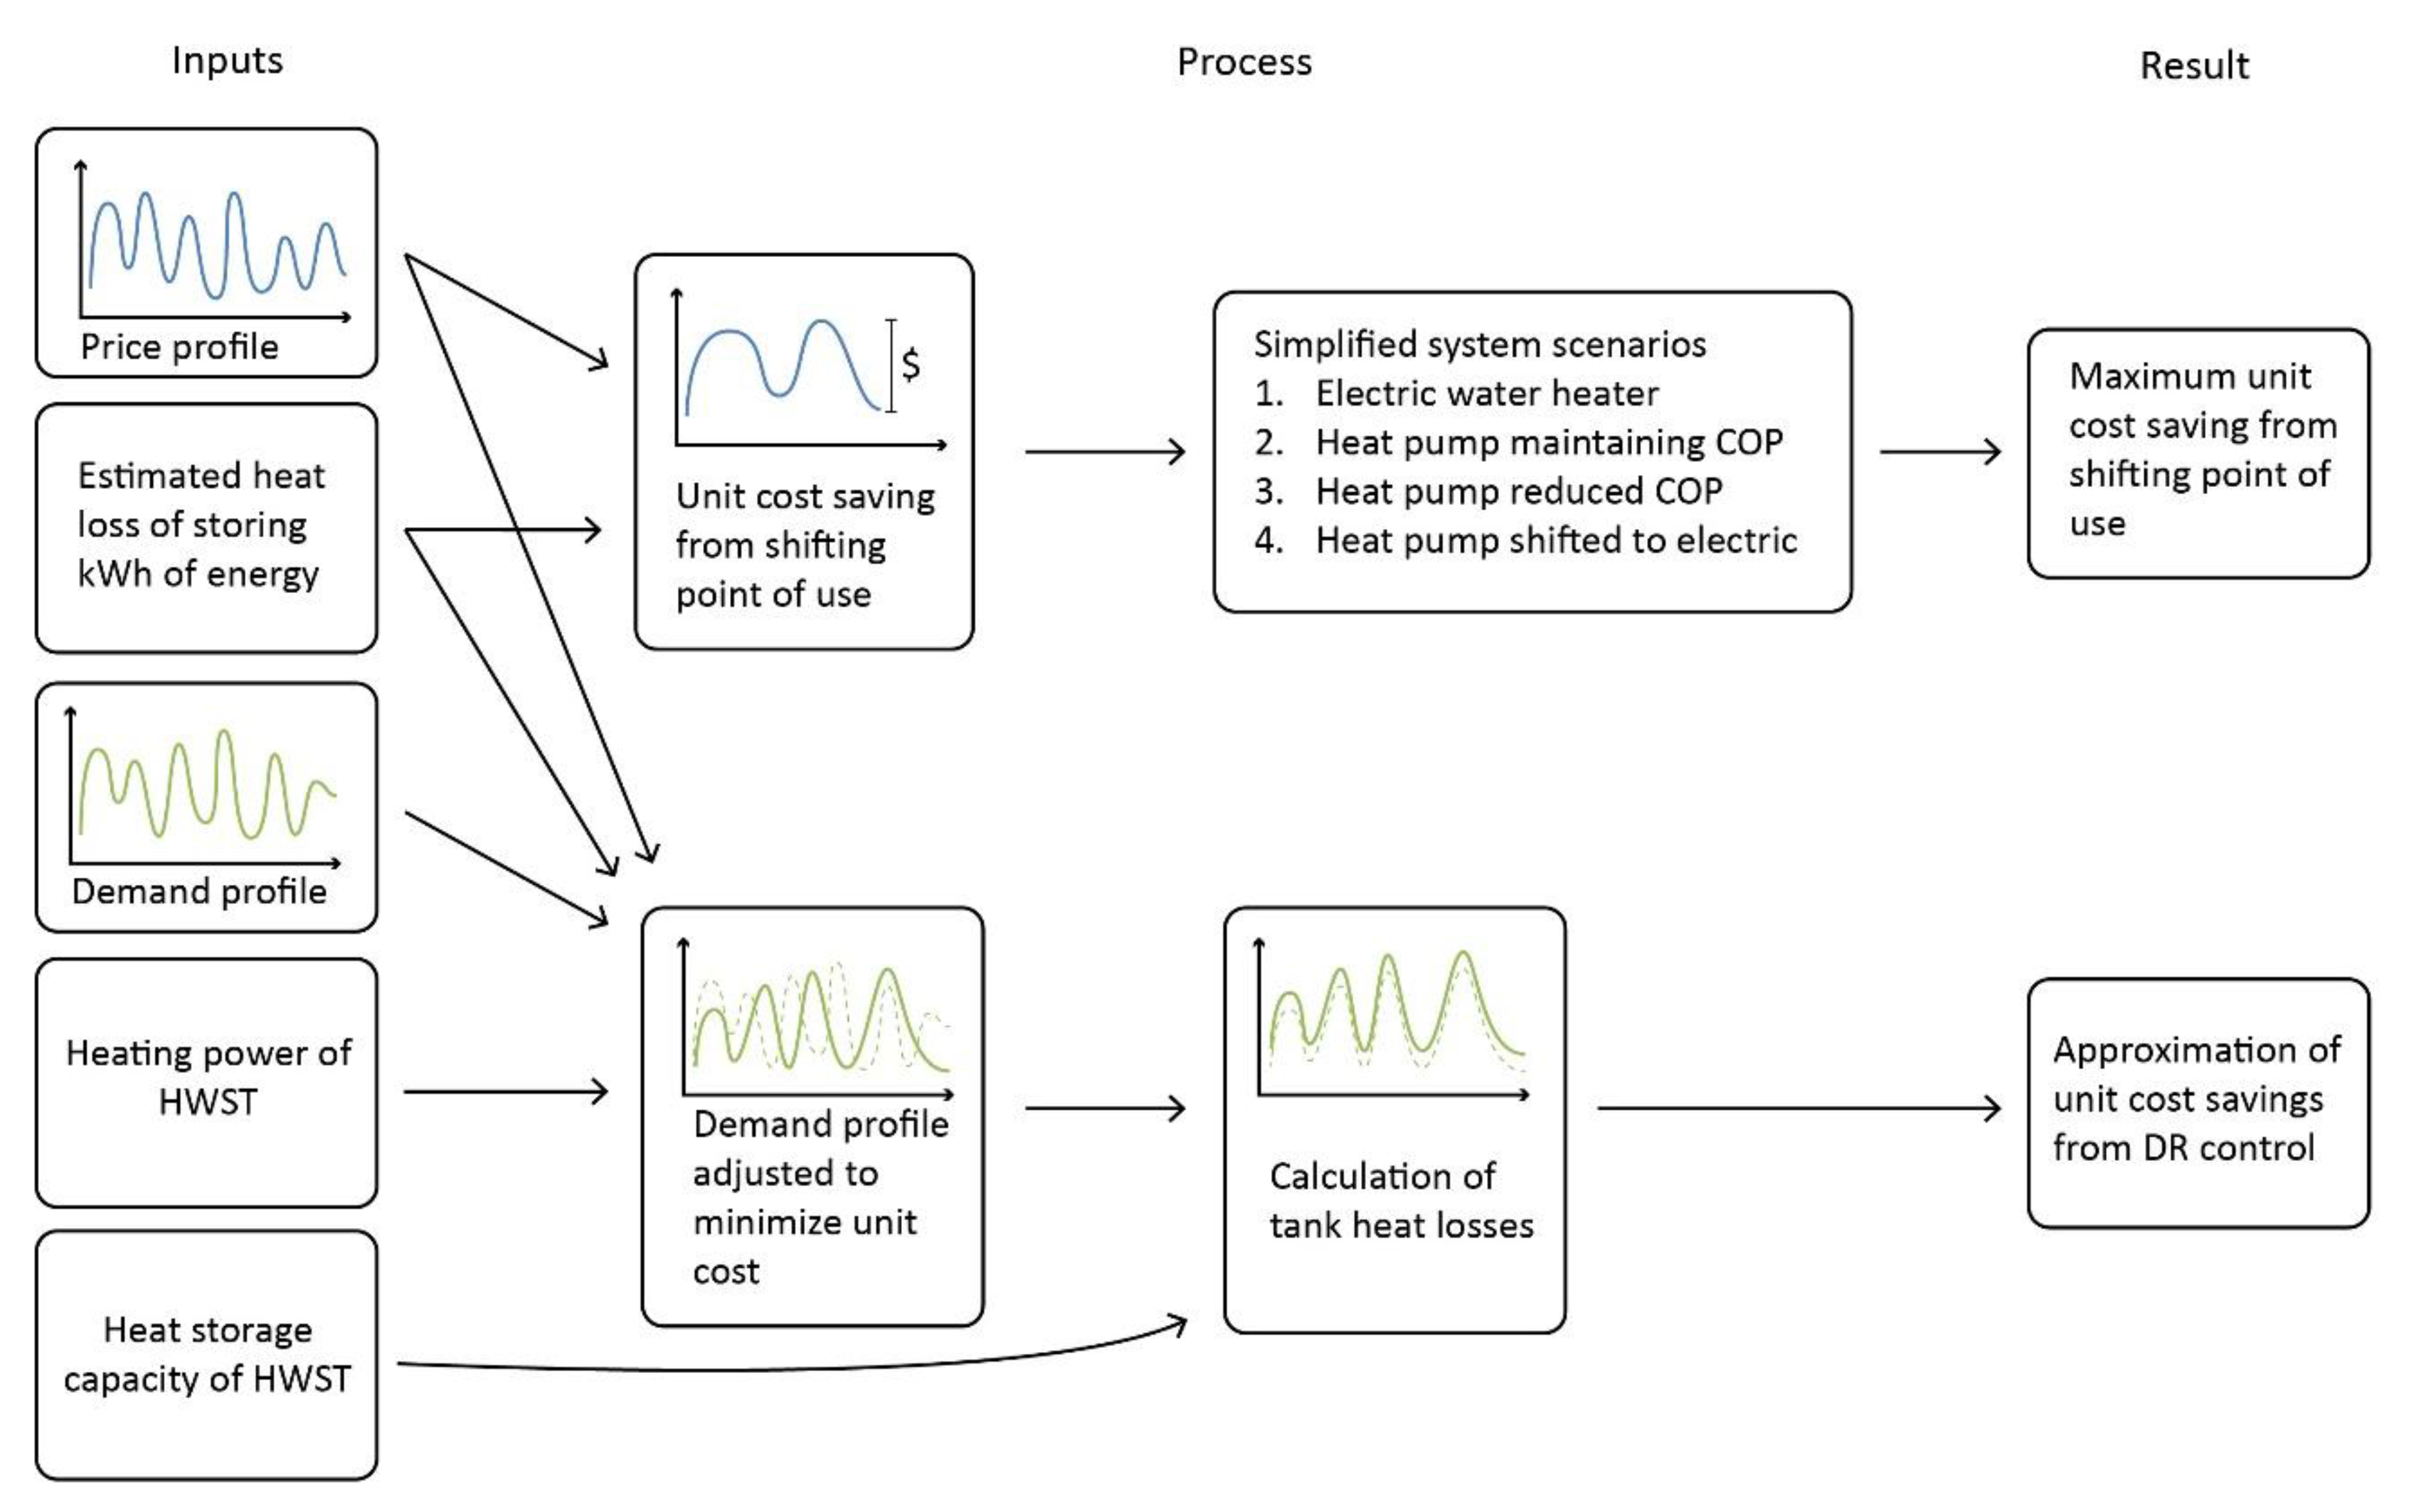
The potential economic benefit of DR of HWSTs was examined through two analyses, outlined in Figure 6. The first was a simple analysis of energy price data. The second utilised a set of algorithms that created an HWST charging strategy to minimise unit energy cost based on electricity price, heating power and a thermal energy demand profile, which was then adapted with a second algorithm to the available storage capacity. Although an optimal strategy is unlikely in practice, this simplified model delivers a best-case result to quickly evaluate the potential economic benefit. It is then possible to further analyse chosen scenarios in detail using simulation of a control system.
Both analyses worked on an end-of-day time horizon with price information available from 14:00 on the previous day. The Nord Pool auction closes at 12:00 with price data available within the following hour [12]. An additional hour was assumed to mitigate potential communication problems. This meant that the charging profile would be optimised in 34-h iterations. Both analyses worked on the principle that the control would only charge the tank when necessary, preloading it with the required energy to meet the heating demand for future hours. Otherwise, the HWST was kept at the lower setpoint temperature to minimise heat loss.

2.2.1. Analysis of Unit Cost Savings Using Electricity Price Data

A simple analysis of the electricity price data was first undertaken to assess the potential for savings from DR. The last nine years of electricity price data were analysed to find the possible year on year variation. The analysis did not consider any system limits for the heating element or HWST capacity. Therefore, the results represent the maximum energy savings possible from shifting heating energy within the time horizon. For each timestep, the electricity price was compared to the price in the preceding hours until 14:00 the previous day. The price for each preceding hour was calculated as:
P r i c e 0 n = P r i c e n   ·   A d d i t i o n a l   H e a t   L o s s n , NOK / kWh ,
where n is the number of hours preceding the current timestep. The price for each preceding hour factors in the additional heat loss from the longer storage. The potential saving was then found by subtracting the lowest found price from the timestep price. The process was repeated for each timestep. The resulting timestep savings were then multiplied by the hourly thermal energy demand profile. Four scenarios for the delivery of the demand were analysed which represent common electric heating solutions:
  • Scenario 1: Electric water heater.
  • Scenario 2: Shifting from heat pump to heat pump, maintaining COP. Unit cost savings are divided by the heat pump COP. For both heating profiles, a COP of 4 was used. For DHW, a COP of 3 was used. These values were fixed and based on measured seasonal values [49] as a simplification for this analysis.
  • Scenario 3: Shifting from heat pump to heat pump with reduced COP. As the storage of thermal energy for later use often requires higher tank temperatures, the performance of the heat pump will likely be reduced. The reduced COP is half of those used in scenario 2.
  • Scenario 4: Shifting from heat pump to electricity. Extending scenario 3 to a situation where the heat pump is no longer able to provide hot enough water temperature to charge the HWST and so an electric heating coil must be used. In other words, the COP is reduced to 1.

2.2.2. Approximation of an Optimal DR Control to Minimise Energy Cost

An algorithm was written to create a charging profile to minimise unit energy cost according to the available heating power, the demand profile and the electricity price over the 34-h iteration time. The algorithm was limited to heating systems with a constant system efficiency independent of the outside conditions or load on the system. Based on the analysis of historic electricity spot prices, three years were chosen to represent average electricity prices (2019), volatile electricity prices (2018) and highly volatile electricity prices (2021).
The potential cost saving for each timestep was found by multiplying the timestep’s demand by each of the electricity prices for the timestep hour and the preceding hours until 14:00 the previous day, using Equation (3). These were ranked (Ranktimestep) by cost saving. This was repeated for all 24 timesteps in the iteration, which were ranked (Rankhour) by their maximum cost saving.
The demand for the highest Rankhour was then placed at the timestep which had the highest Ranktimestep for that Rankhour. If this exceeded the capacity of the heating power, the demand to fill that capacity was placed at the highest Ranktimestep and the remaining demand was placed at the next highest Ranktimestep. This process was repeated for each hour in descending order of Rankhour, as shown in Figure 7. The available heating power at each timestep was equal to the maximum capacity of the heating element minus any demand assigned to that timestep. This included the demands assigned in the previous iteration which overlap the first 10 h of the 34-h optimisation period. Where it was not possible to distribute all of an hour’s demand within its preceding timesteps, any remaining demand was added to the next proceeding timestep which did not create a deficit in the energy balance. This, in essence, moves a higher ranked hour’s demand to a later point to make space for the lower ranked hour’s demand.
The resulting charging profile was then applied to a second algorithm which adjusted the charging profile according to the available heat storage capacity and resulting heat losses. The energy stored in the HWSTs at each timestep (qtank) was calculated using the following formula:
q t a n k , n =   q t a n k , n 1 + Q c h a r g e , n Q d i s c h a r g e , n ,     kWh ,
where Qcharge is the heat added according to the optimised charging profile and Qdischarge is heat used according to the demand profile. For the reference system, it is assumed that Qcharge was equal to Qdischarge at each timestep. The temperature and additional heat losses of the HWSTs for each timestep were calculated as:
T t a n k =     T m i n + q t a n k q m a x   · T m a x T m i n ,     [ ° C ] .
The maximum temperature (Tmax) is set at 95 °C. The minimum temperature (Tmin) is defined from the starting condition and decreased in 5 °C increments. Here, the relationship between energy storage and the water temperature is simplified to a linear correlation. The energy storage capacity of the tank (qmax), defined in kWh, is calculated based on the temperature range and number of tanks:
q m a x = V t a n k · T m a x · C T , m a x T m i n · C T , m i n , kWh ,
where CT is calculated according to Equation (2). The heat capacity (cp,w) and density (ρw) of water are set based on the minimum and maximum tank temperatures. Finally, the heat loss at each timestep was calculated as:
q S , L o s s = H S · T t a n k T a · n t a n k ,     W ,
where HS is the specific heat loss for each 1000 L tank (3.03 W/K) and ntank is the number of tanks. The heat loss was then added to the charging profile. In hours which were already utilising the maximum heating power, the heat loss was placed at the next hour with available heating power. When the available storage capacity was full, any additional charging of the tank was placed at the next available hour. These simplifications were chosen to allow variation of the tank size and temperature without having to run the first algorithm again. A potential impact is that in cases with small storage capacity and heating power it is possible that the resulting demand profile is slightly suboptimal.

2.3. Performance Indicators

According to Pallonetto et al. [50], three different dimensions need to be considered in the assessment of energy flexibility: technical (volume of energy shifted or available instantaneous capacity), economic (operational cost) and environmental (carbon dioxide emissions or primary energy). The specifics of these dimensions are dependent upon the chosen perspective studied (supplier, grid operator or consumer). These indicators show the difference in a chosen parameter between the altered energy demand profile and its reference.
The amount of shifted energy was quantified in line with the that proposed by IEA EBC Annex 67 for available electric energy flexibility (AEEF) [50]:
A E E F = 0 T P e , D R P e , R · d t , kWh ,
where Pe,DR is the optimised profile, Pe,R is the unoptimised profile and T is the length of the optimisation period, which was 8760 h in this study. AEEF was then averaged to an hourly value for comparison.
The economic benefit was calculated by multiplying the optimised profile by the electricity price data. The monthly peak power was also found to calculate the monthly fees. These were then compared with the cost of the unoptimised profile.
U n i t   c o s t   s a v i n g s = n = 0 T P r i c e n ( P e , D R . n P e , R . n ) ,   N O K .
M o n t h l y   c o s t   s a v i n g s = J a n D e c M o n t h l y   c o s t P e , D R . m a x   P e , R . m a x ,   N O K .
For this study, no assessment of primary energy or carbon dioxide was undertaken, due to the DR of a single building having little effect on macro energy decisions. Furthermore, the CO2eq. intensity in the Oslo regional grid is low with minimal variation [5]. It is unclear if DR would help to reduce carbon dioxide emissions in Norway, as the correlation between price and CO2eq. intensity has been shown to be the opposite of most other countries, with higher intensities at low prices. This is because Norwegian hydropower favours operating at higher prices during energy peaks and so more energy is imported (with higher CO2eq. intensity) when prices are low.

3. Results

3.1. Analysis of Spot Prices

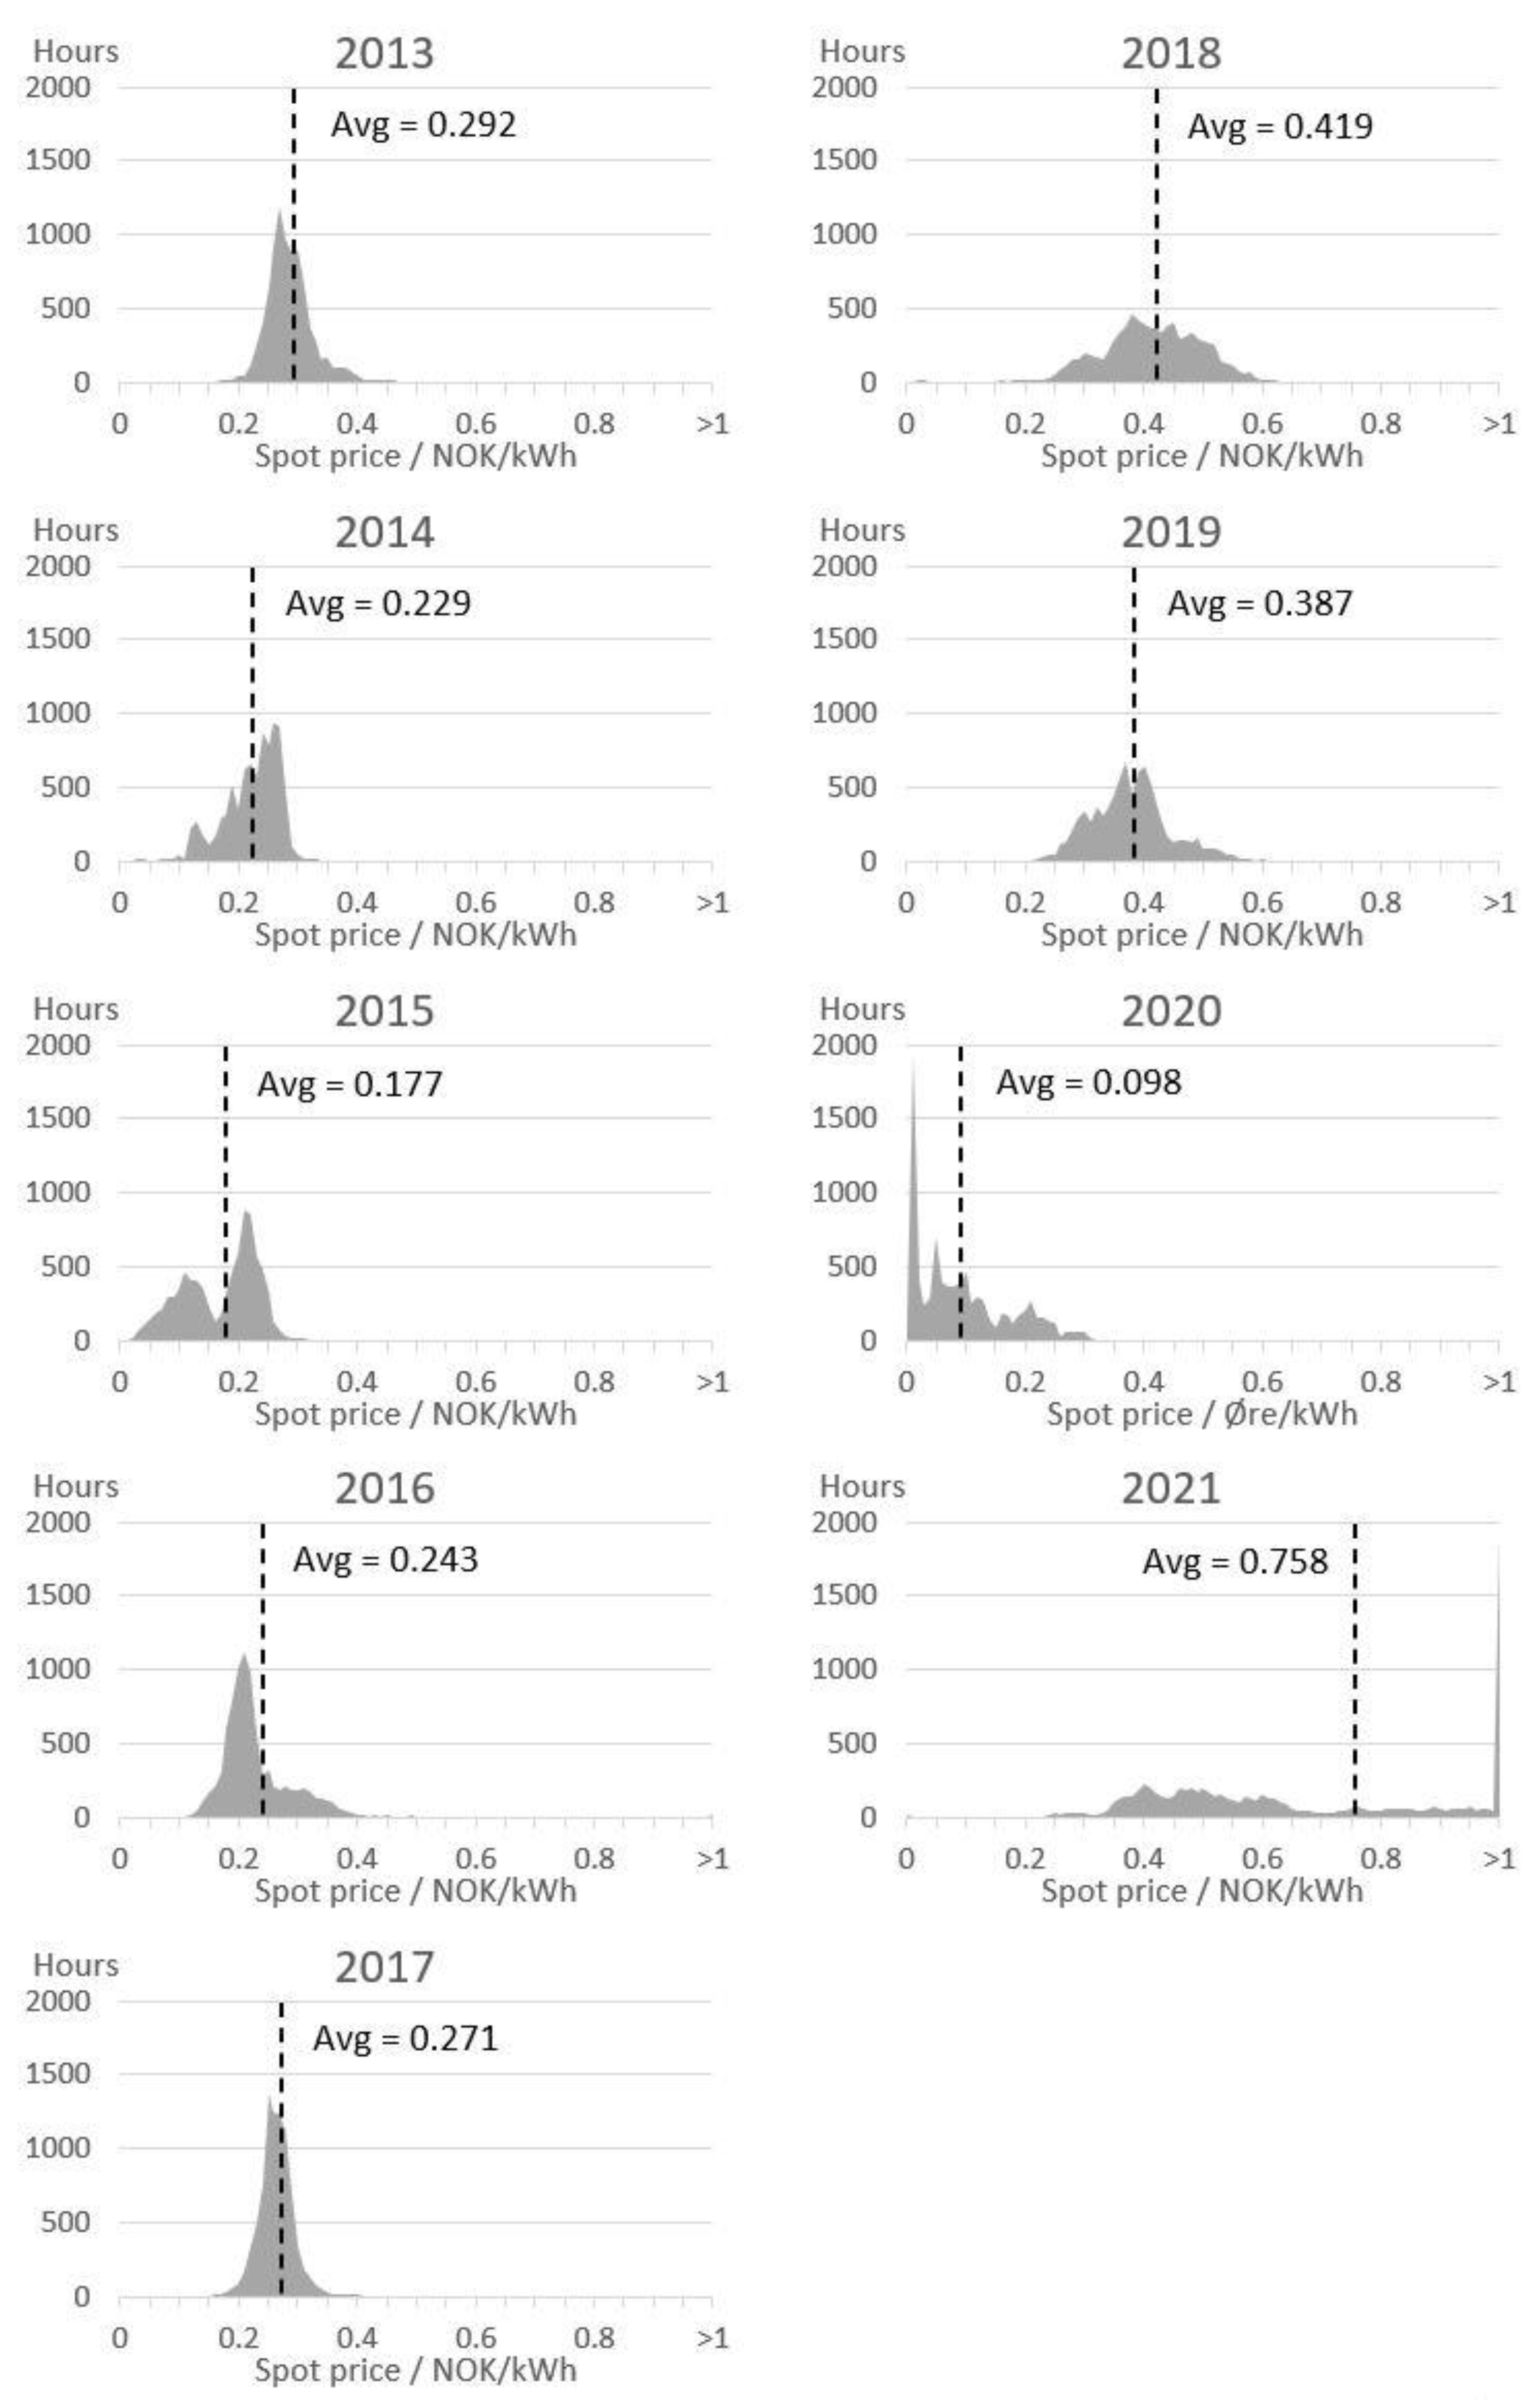
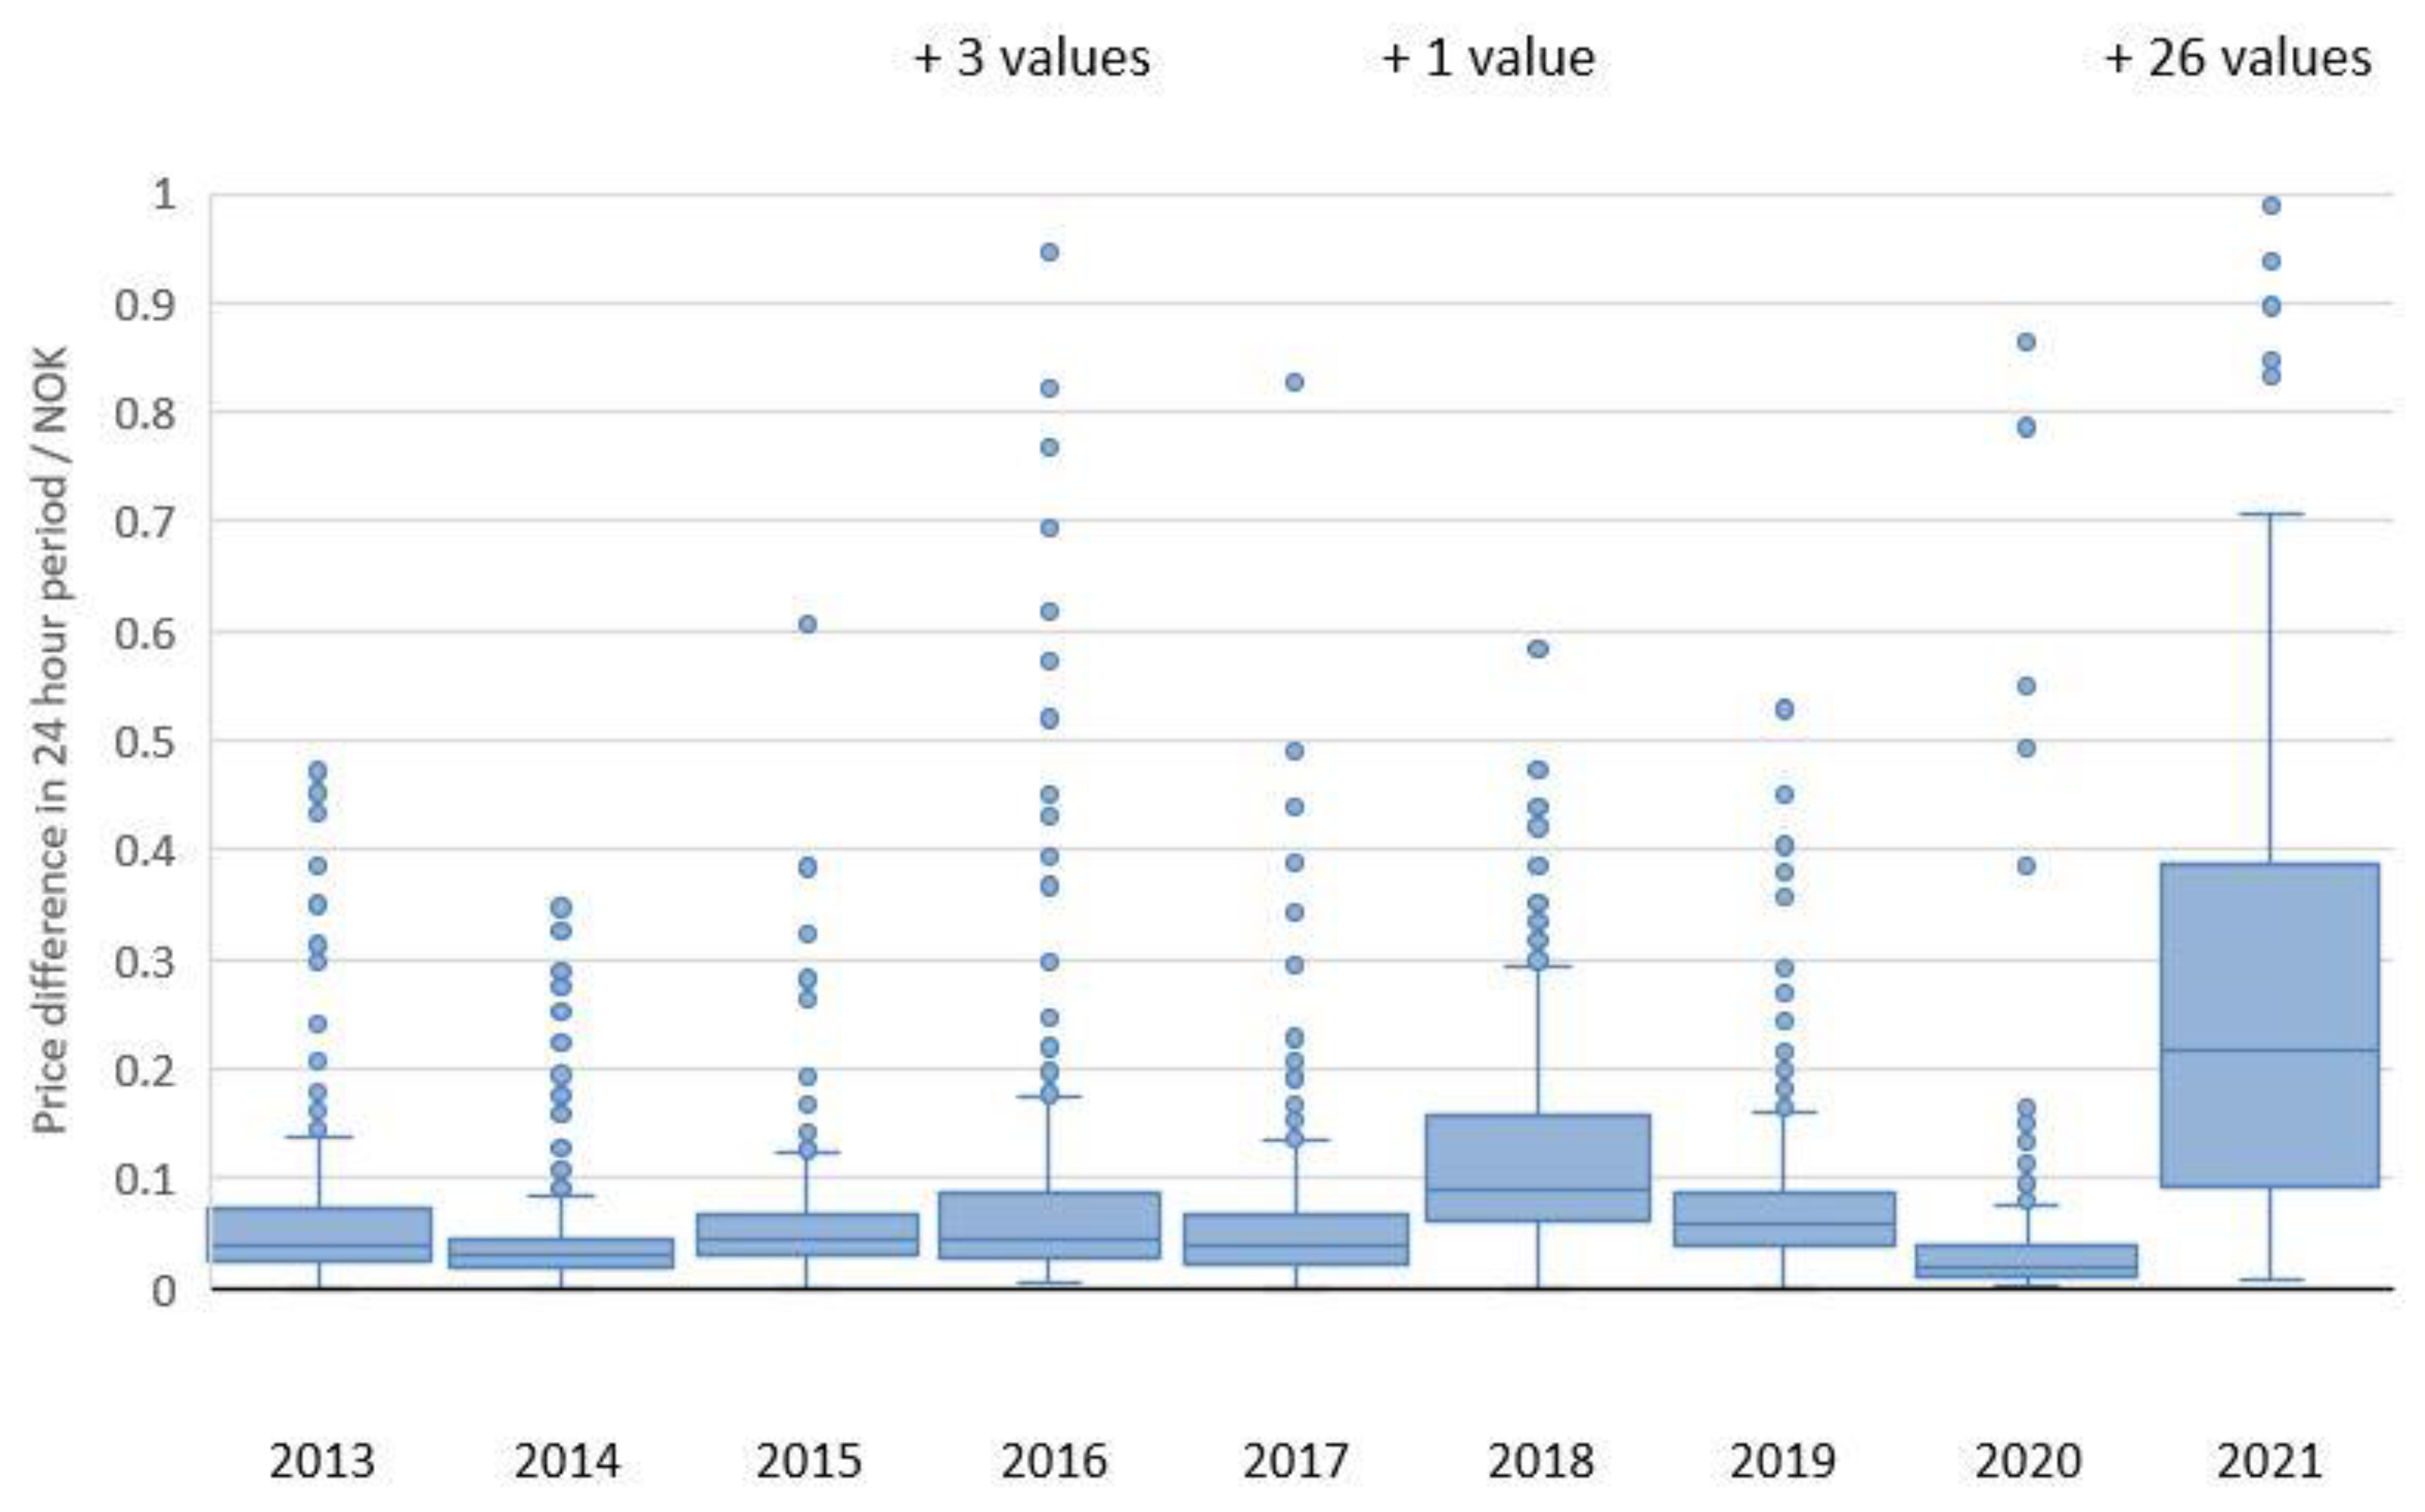
The past nine years of electricity price data were analysed for price distribution over the year, shown in Figure 8, and price variation in a 24-h period, shown in Figure 9. Prices are given in NOK (1 NOK ≈ 0.1 EUR). Box plots in Figure 9 show the 1st, 2nd and 3rd quartile of the 365 values for each year. Whiskers show the range of values within 1.5 times the interquartile range below the 1st quartile and above the 3rd quartile. Dots are values outside this range. For 2016, there are three points which lie beyond the chart range (1.23 NOK, 1.28 NOK and 1.82 NOK). For 2018, there is one point (2.08 NOK). For 2021, there were 26 points with a maximum difference of 4.07 NOK on the 22nd of December. The general variation of prices was less than 0.1 NOK in all years except for 2018 and 2021. This small variation is due to the high proportion of hydropower in the Norwegian electricity mix, as it is possible to regulate the generation capacity of hydropower without affecting efficiency.
The electricity price has had greater variation in the past four years. Average prices and price variation were higher than average in 2018, due to a lack of precipitation constricting the supply of hydropower combined with increased prices for imported energy due to higher CO2 taxes [51]. Prices were also slightly volatile in 2016, although this was due to a few extreme 24 h periods, of which three were over 1 NOK in difference (outside the range of Figure 9). The interquartile range and mean spot price for 2016 were similar to the other “normal” years before 2018, with a mean spot price of around 0.25 NOK/kWh. There was increased variation in 2019 due to the increasing number of grid interconnections [12]. When prices are high in other countries, it is appealing for Norwegian energy producers to sell their electricity abroad, in turn raising prices nationally. As both CO2 taxes and grid interconnections will exist in the coming years, 2019 is considered a good example of a typical year. Electricity prices were extremely low, sometimes below zero, in 2020 due to the depressed demand caused by the coronavirus pandemic. There were significantly higher prices in 2021, due to the combination of high demand from economies reopening from the pandemic and a shortage of fossil fuels [52]. During 2021, Norway exported large quantities of energy at peak times which resulted in significantly more price variation within a 24 period than in the preceding nine years. There was also the largest range in prices over the year with a minimum of 0 NOK and a maximum of 6.12 NOK.

3.2. Potential Unit Cost Saving

The maximum potential unit cost savings from shifting the energy for all nine years was calculated using Equation (3). The results are shown in Table 3 for the three demand profiles and four scenarios. For comparison, the leap day was removed from 2020 and 2016 data.
The results indicate that the variable setpoint heating schedule had the most to gain from DR. The constant setpoint heating and DHW schedules produced similar savings, but neither was consistently better than the other over the nine years. There was no clear correlation between the price distribution and the difference between these schedules. For all three schedules, there was a good correlation between the price variation over a 24 h period (Figure 9) and the energy savings for scenario 1 and 2. The correlation for scenario 1 is shown in Figure 10. Scenario 2 has the same R2 value as the savings are scaled. The high price variation in 2021 resulted in the largest savings. The low price variation in 2014 and 2020 resulted in the lowest savings. Under scenarios 3 and 4, these patterns were skewed in favour of years with large price variations (2016, 2018 and 2021), due to the decreased COP requiring a greater electricity price saving to warrant shifting energy.
The potential savings were greatest for scenario 1. Where a heat pump is used for DR, maintaining its COP (scenario 2), the possible savings were divided by that COP. In Table 3 the savings are a quarter of the electricity savings, as the COP is 4. Therefore, the higher the heat pump COP, the lower the potential savings from load shifting. This was even more pronounced for scenarios 3 and 4, where the COP at the shifted time is reduced. As the energy has to be stored, it will likely require a higher temperature than at the point of demand, reducing the COP of the heat pump. Under these scenarios, the savings are reduced to a few hundred NOK. Under scenario 4, there were no savings in six of the nine years.
The savings mirror the potential benefit to the electricity grid. As the COP of the heat pumps already reduces the load on the grid, shifting it to another point in time has less benefit. Flexibility control should therefore be focused on direct electrical systems. These are well suited to control as they can be started and stopped nearly instantly with little energy loss.

3.3. Demand Profile Optimisation

The potential for electrical systems was further analysed, accounting for the power of the electric water heater and the HWST characteristics. The monthly cost for the electrical peak power was also considered. Based on the analysis of historic electricity spot prices, three years were chosen to represent average spot prices (2019), volatile spot prices (2018) and highly volatile spot prices (2021).
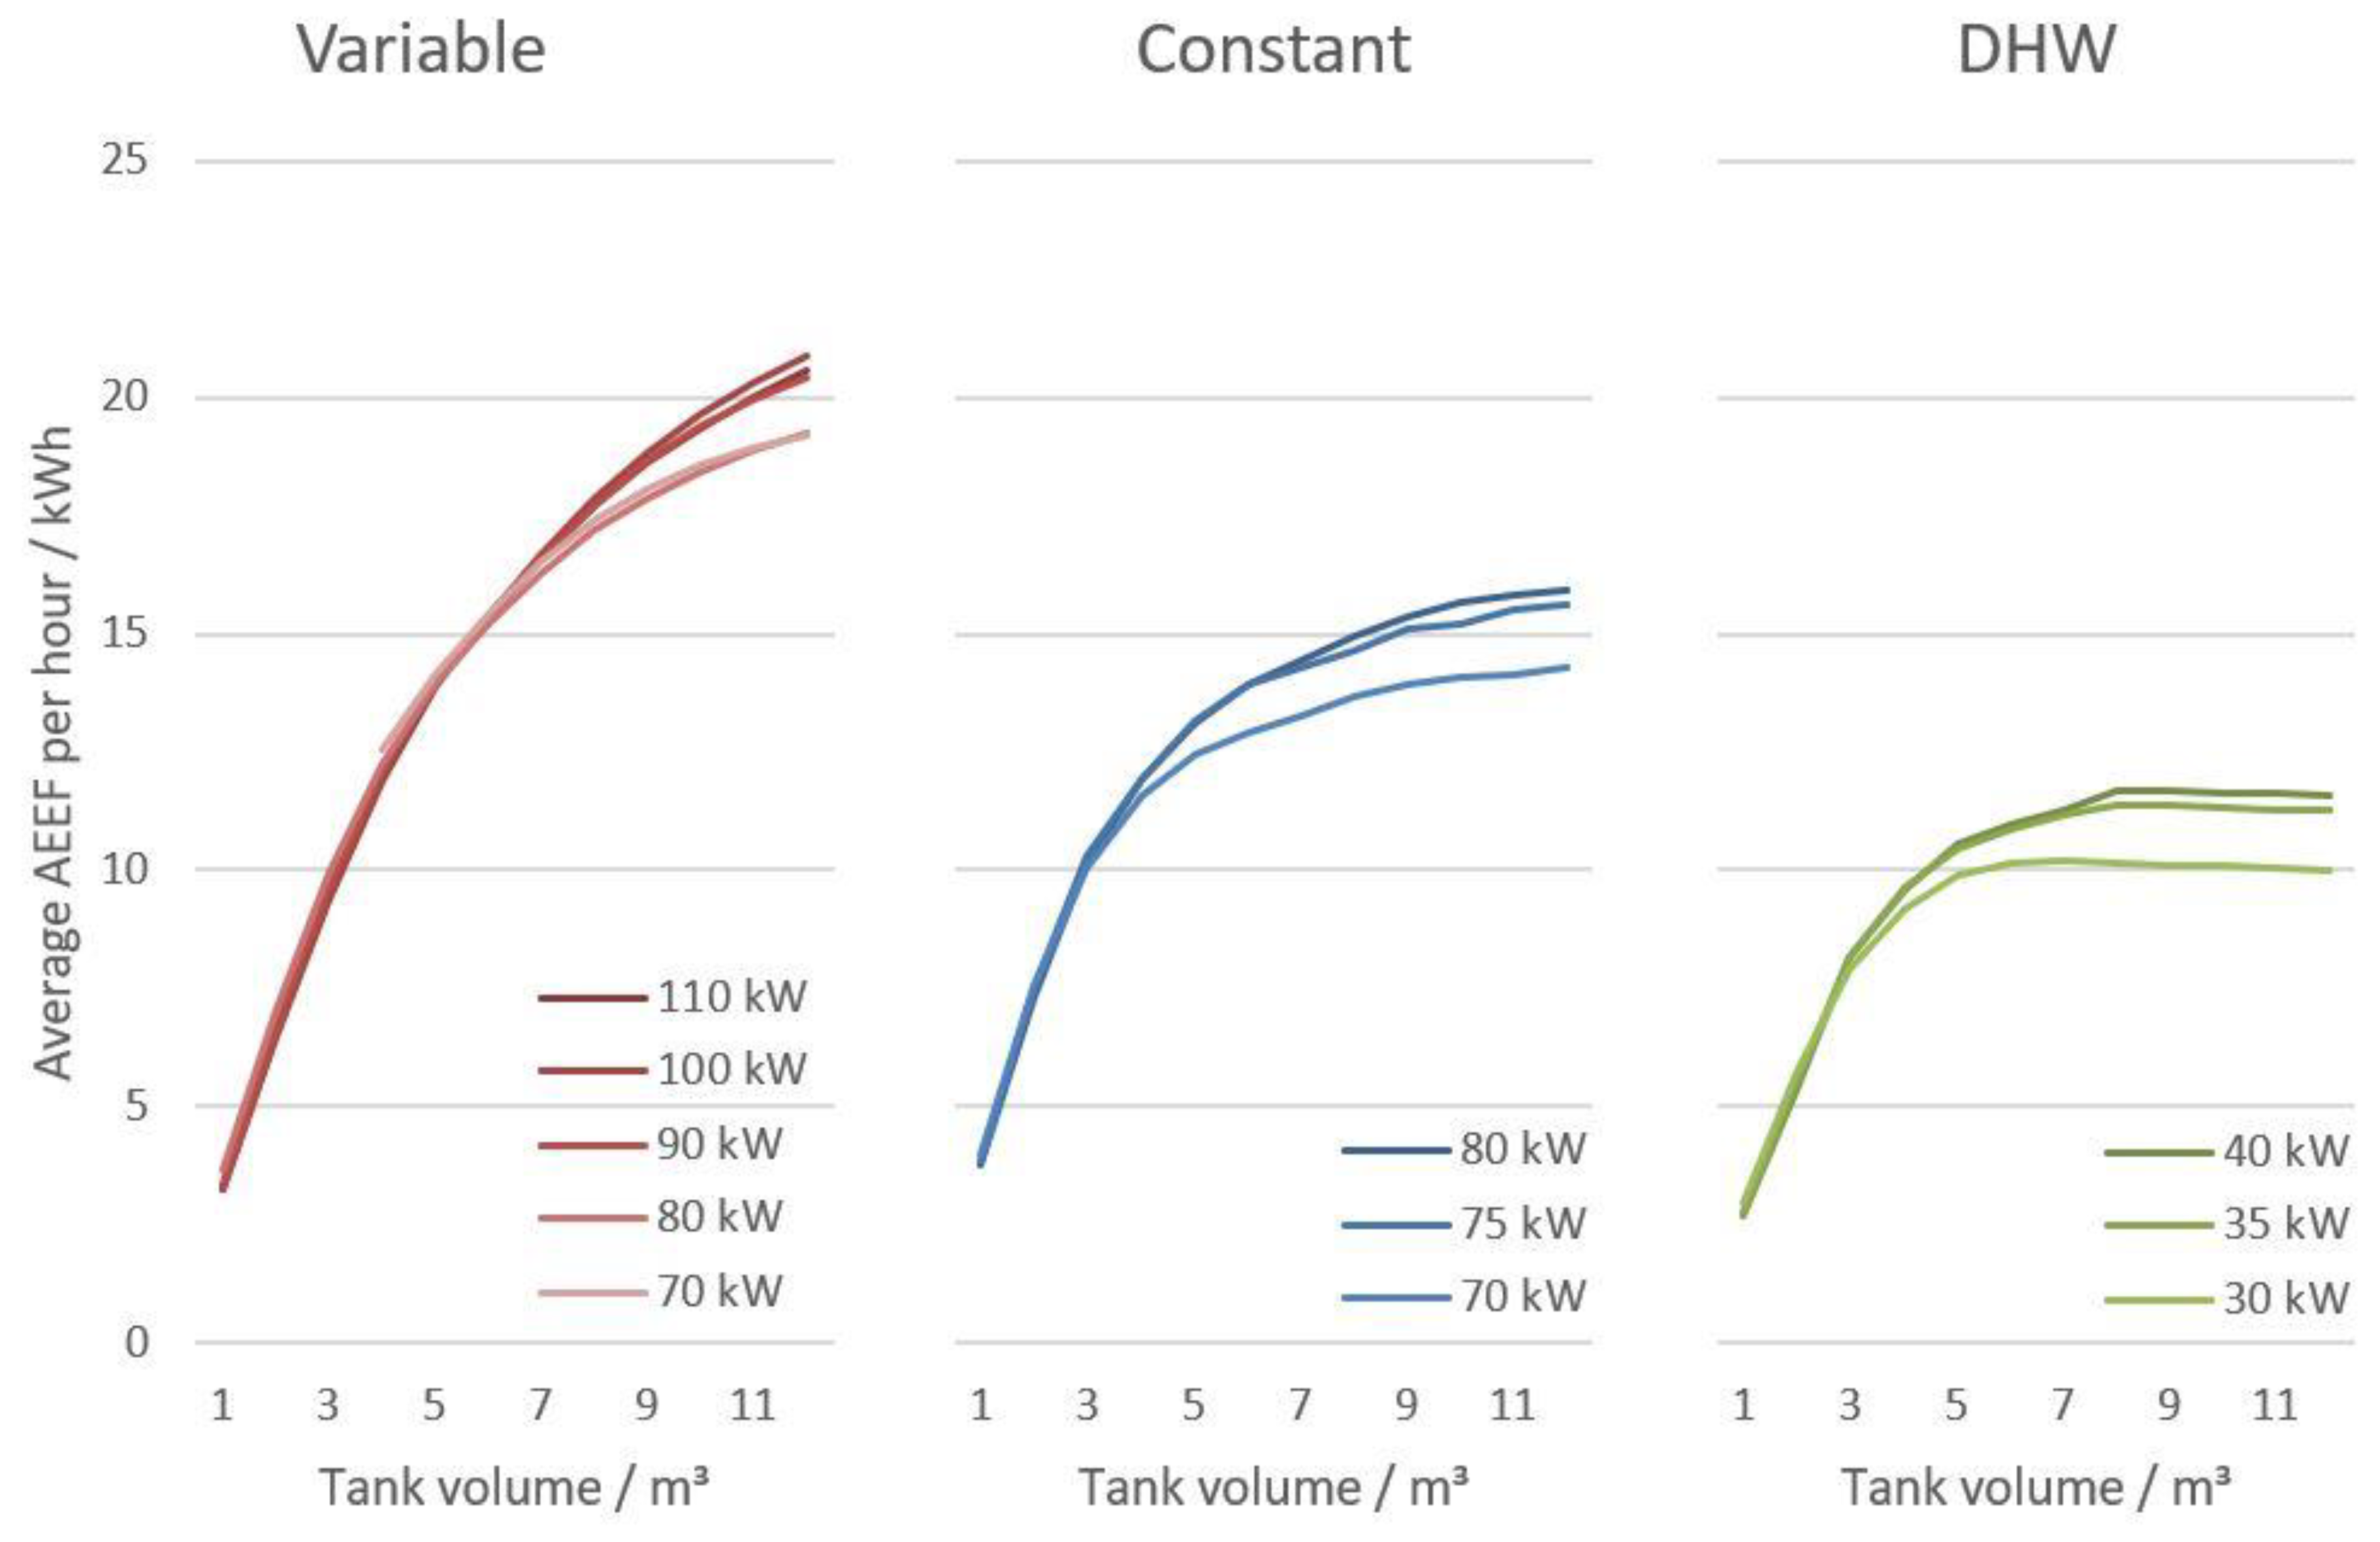
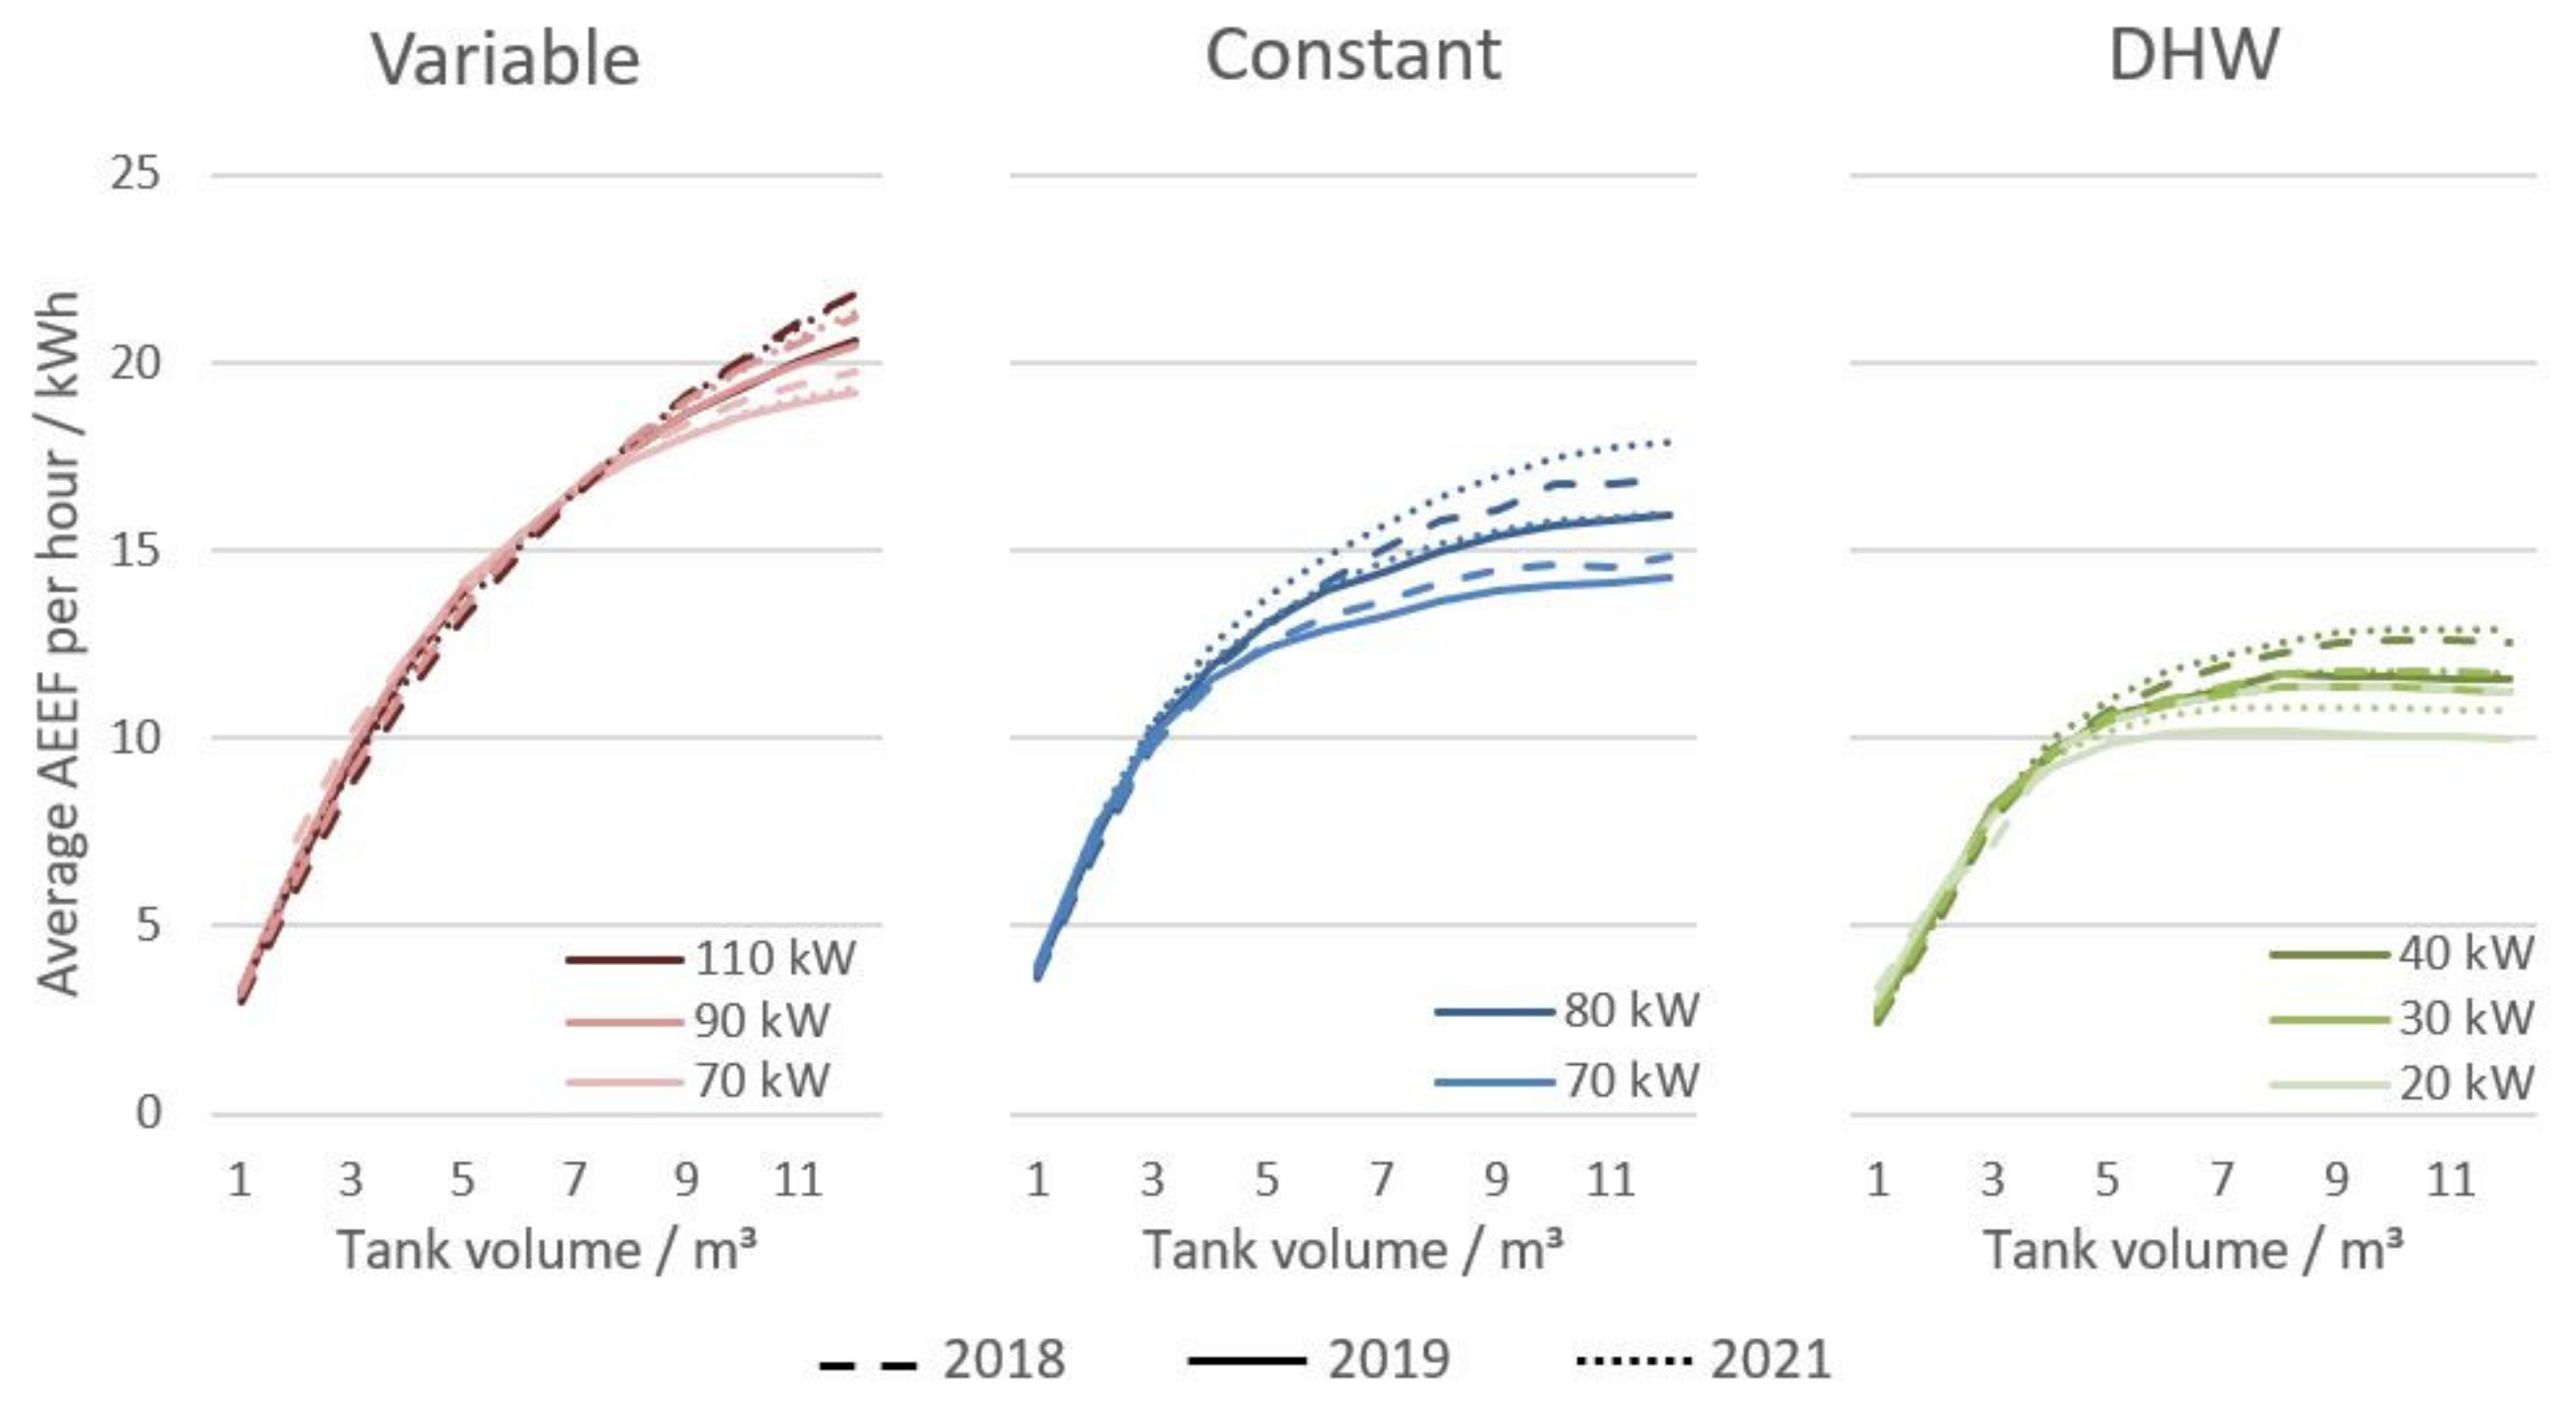
The energy flexibility as a function of the tank volume for the three demand profiles at different maximum heating powers is shown in Figure 11, using 2019 spot prices. The flexibility increases with tank size and heating capacity; however, both factors are subject to a diminishing rate of return as shown by the plateauing of flexibility as the tank size increases. The variable heating schedule had the highest flexibility potential and DHW had the lowest. As the metric is created by the difference between the optimised charging profile and the reference demand profile, it is affected by the amount and distribution of the reference demand. The lower potential of DHW is in part due to the lower total demand. DHW requires 133 MWh annually compared to 179 MWh for constant setpoint heating and 165 MWH for variable setpoint heating. Conversely, the higher total demand of the constant heating does not lead to more flexibility due to the distribution of the demand which is fairly constant over a 24-h period. The peaks of the DHW and variable demand coincide with the daily peaks in electricity prices. Therefore, this demand is often shifted and so leads to a higher flexibility result. Part of the increased flexibility score with the increased number of tanks is due to the higher energy use due to additional heat losses from more tanks.
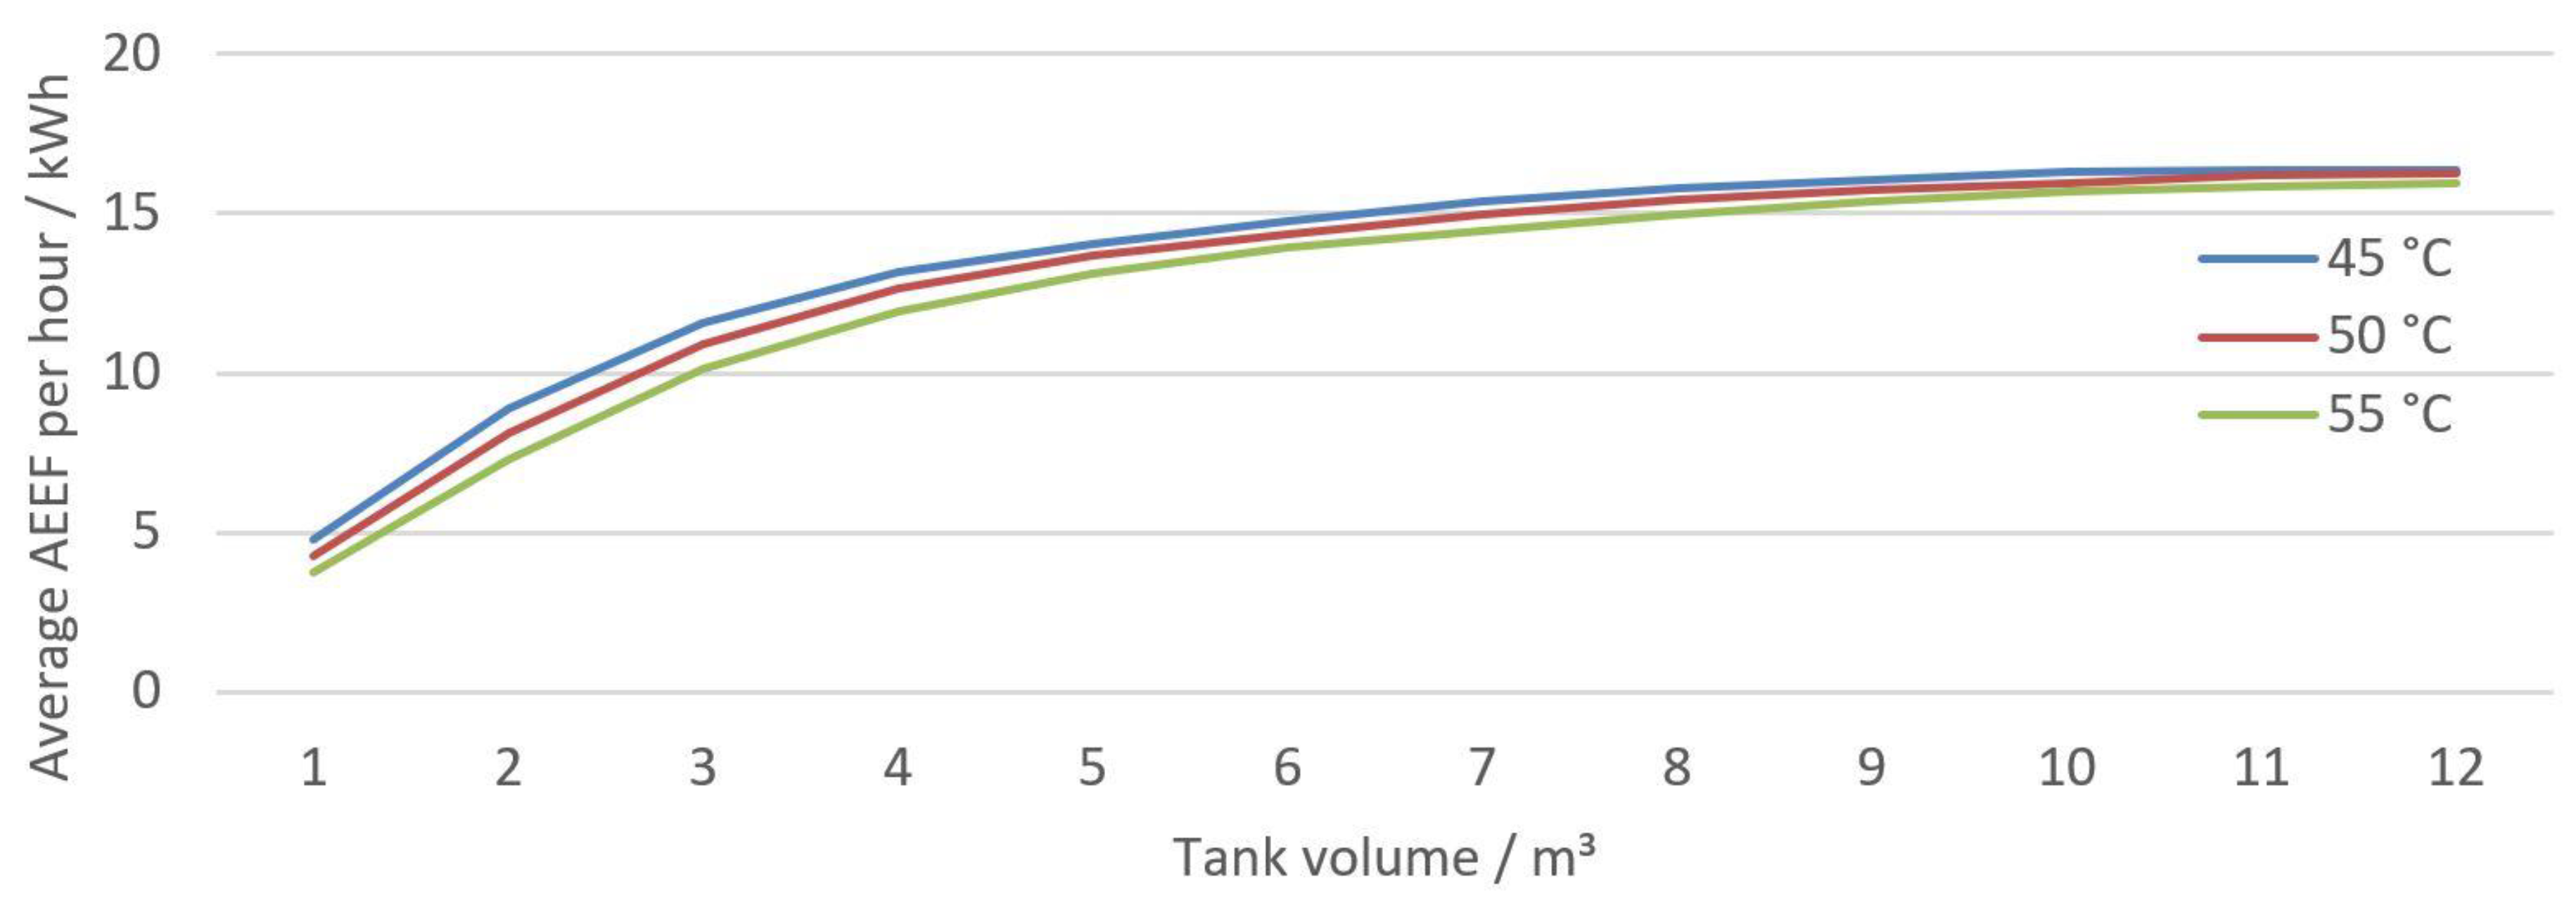
Changing the minimum setpoint temperature alters the energy storage capacity of each HWST. This affects the steepness of the flexibility curve but has little effect on the maximum level of flexibility achieved, as shown in Figure 12.
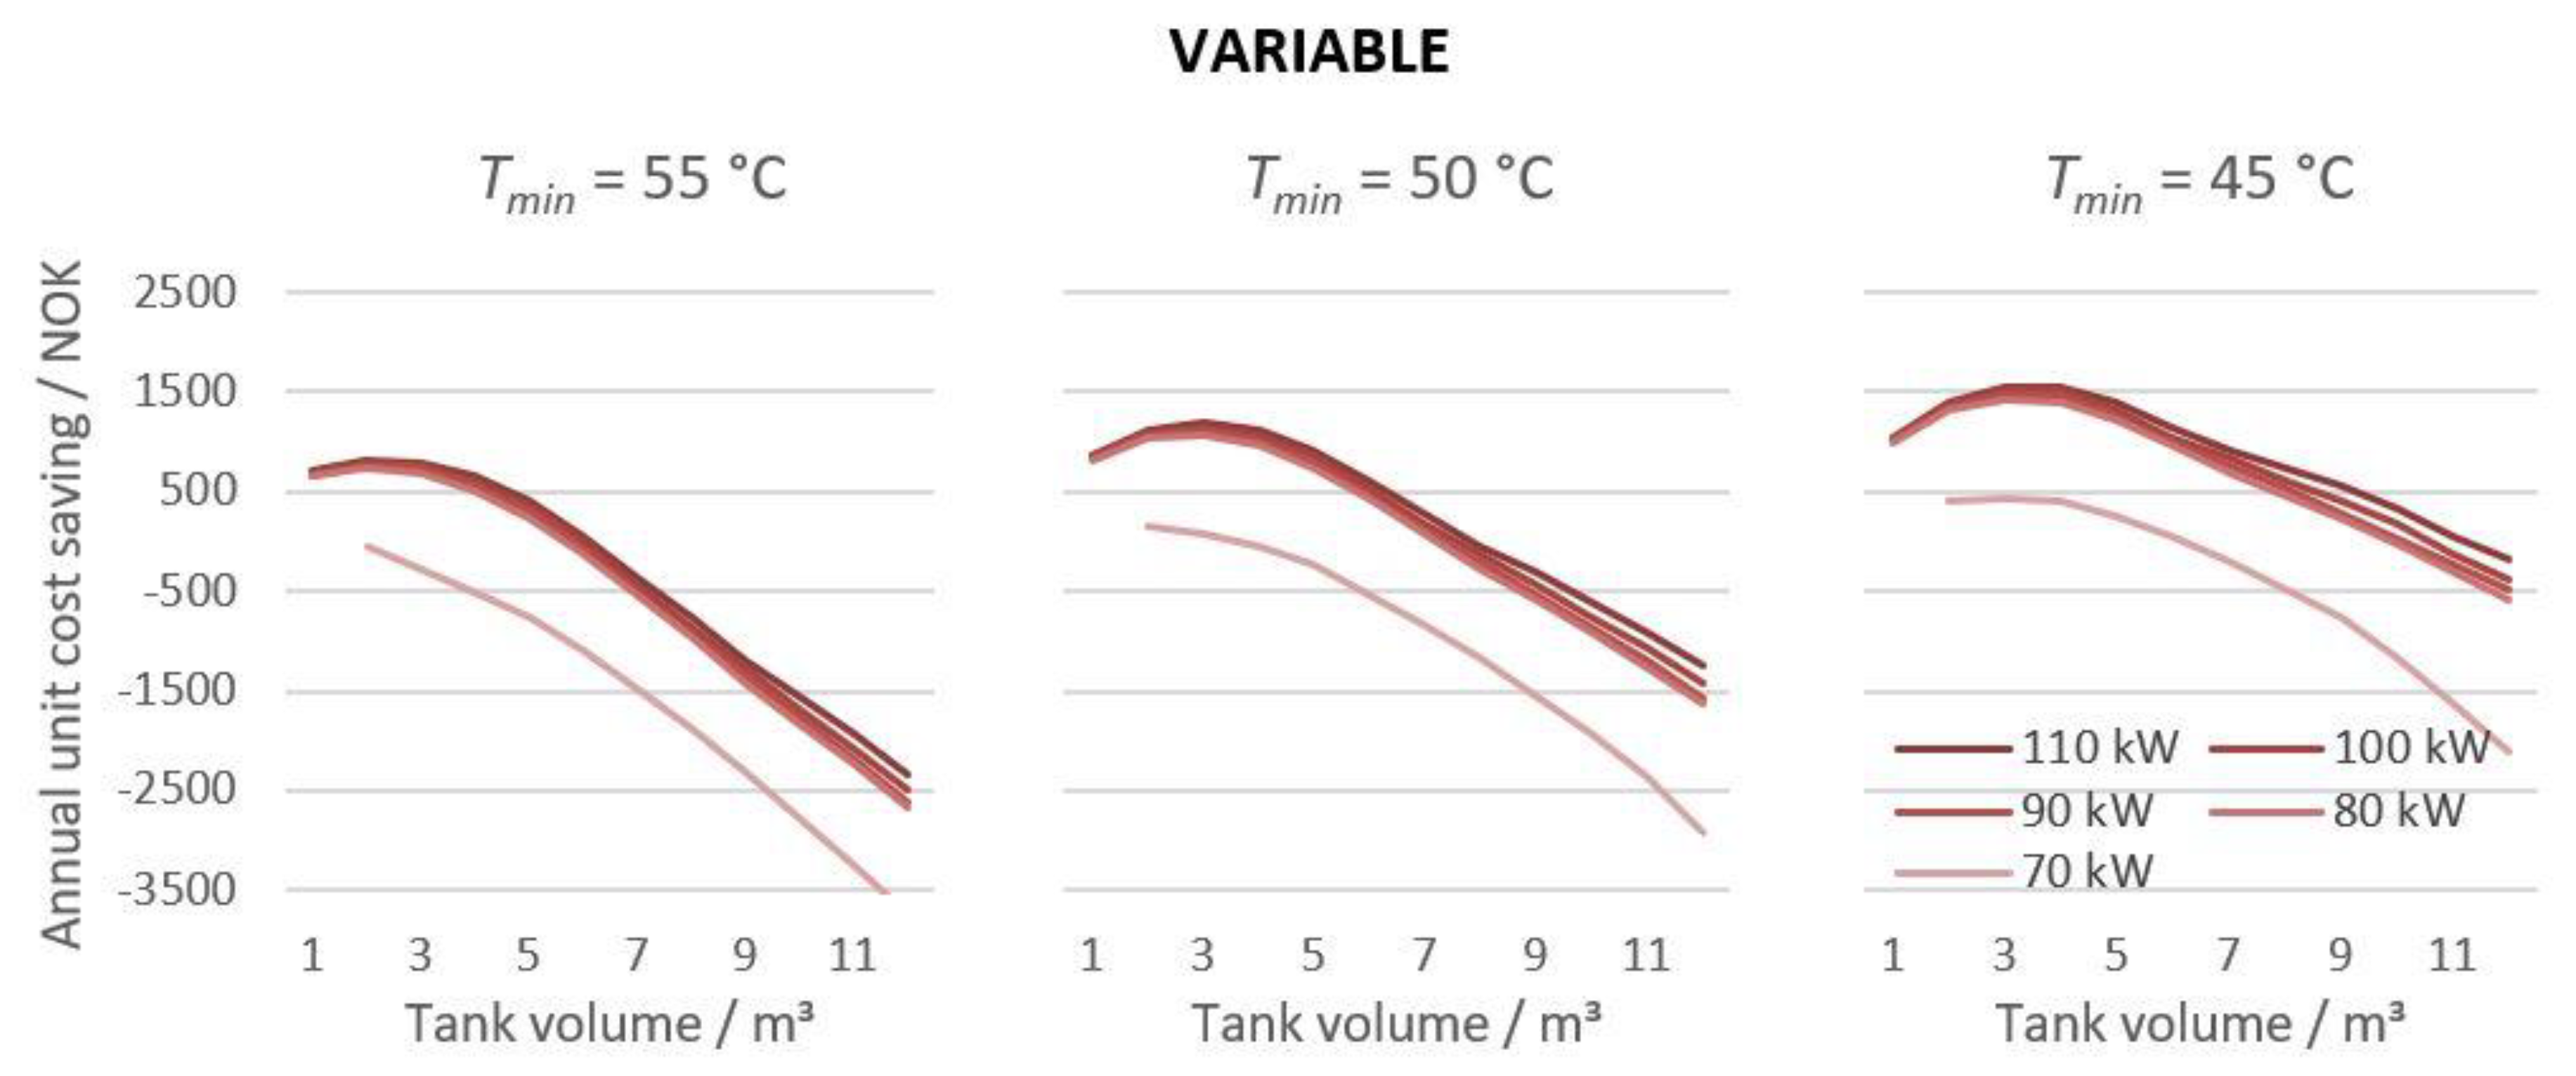
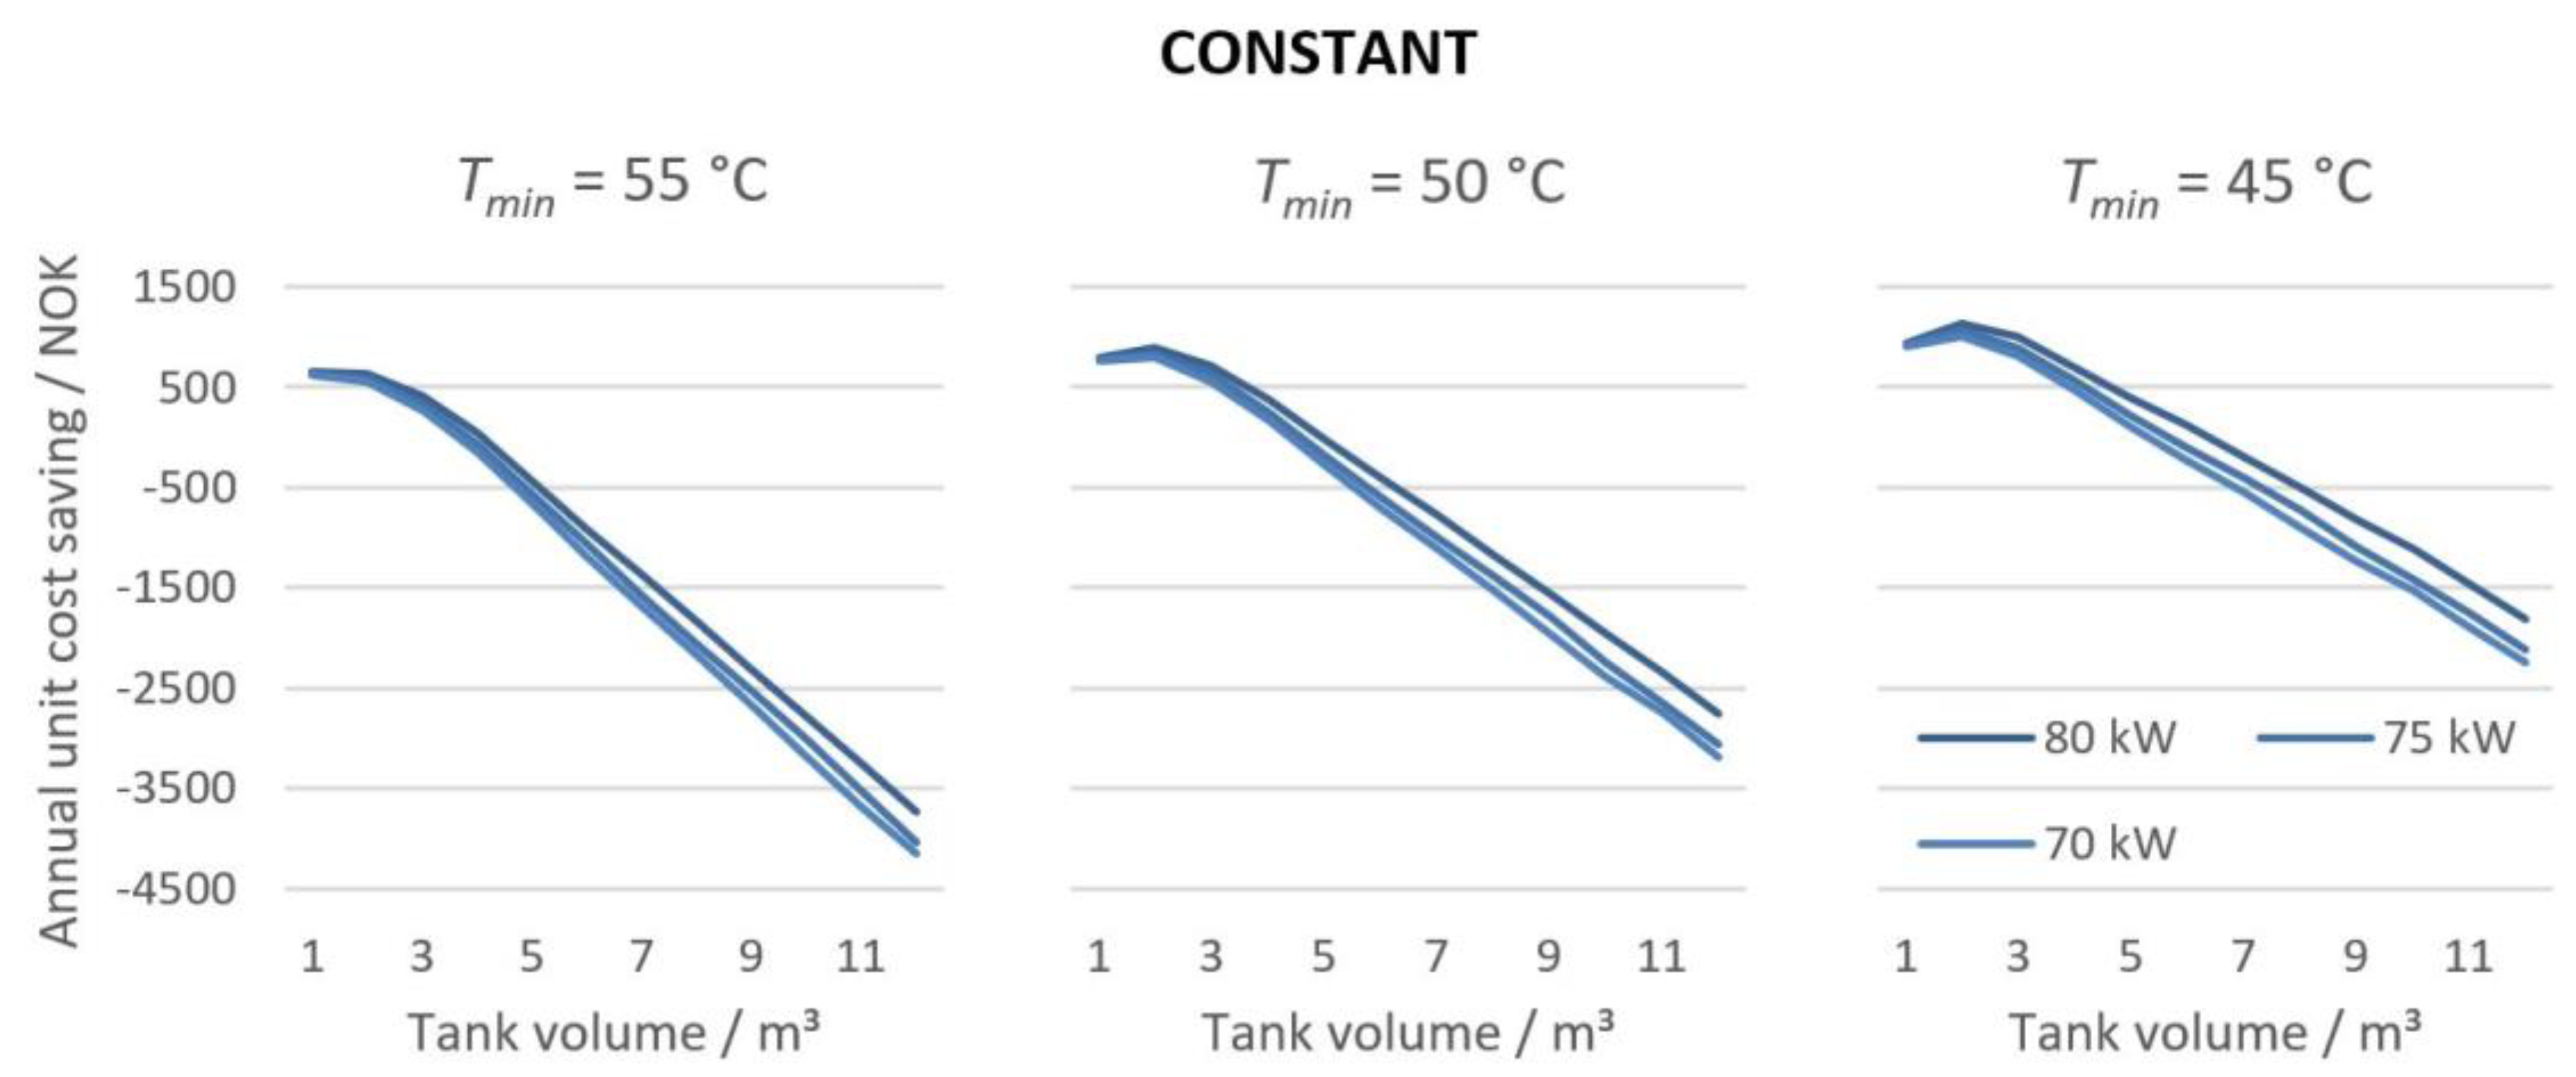
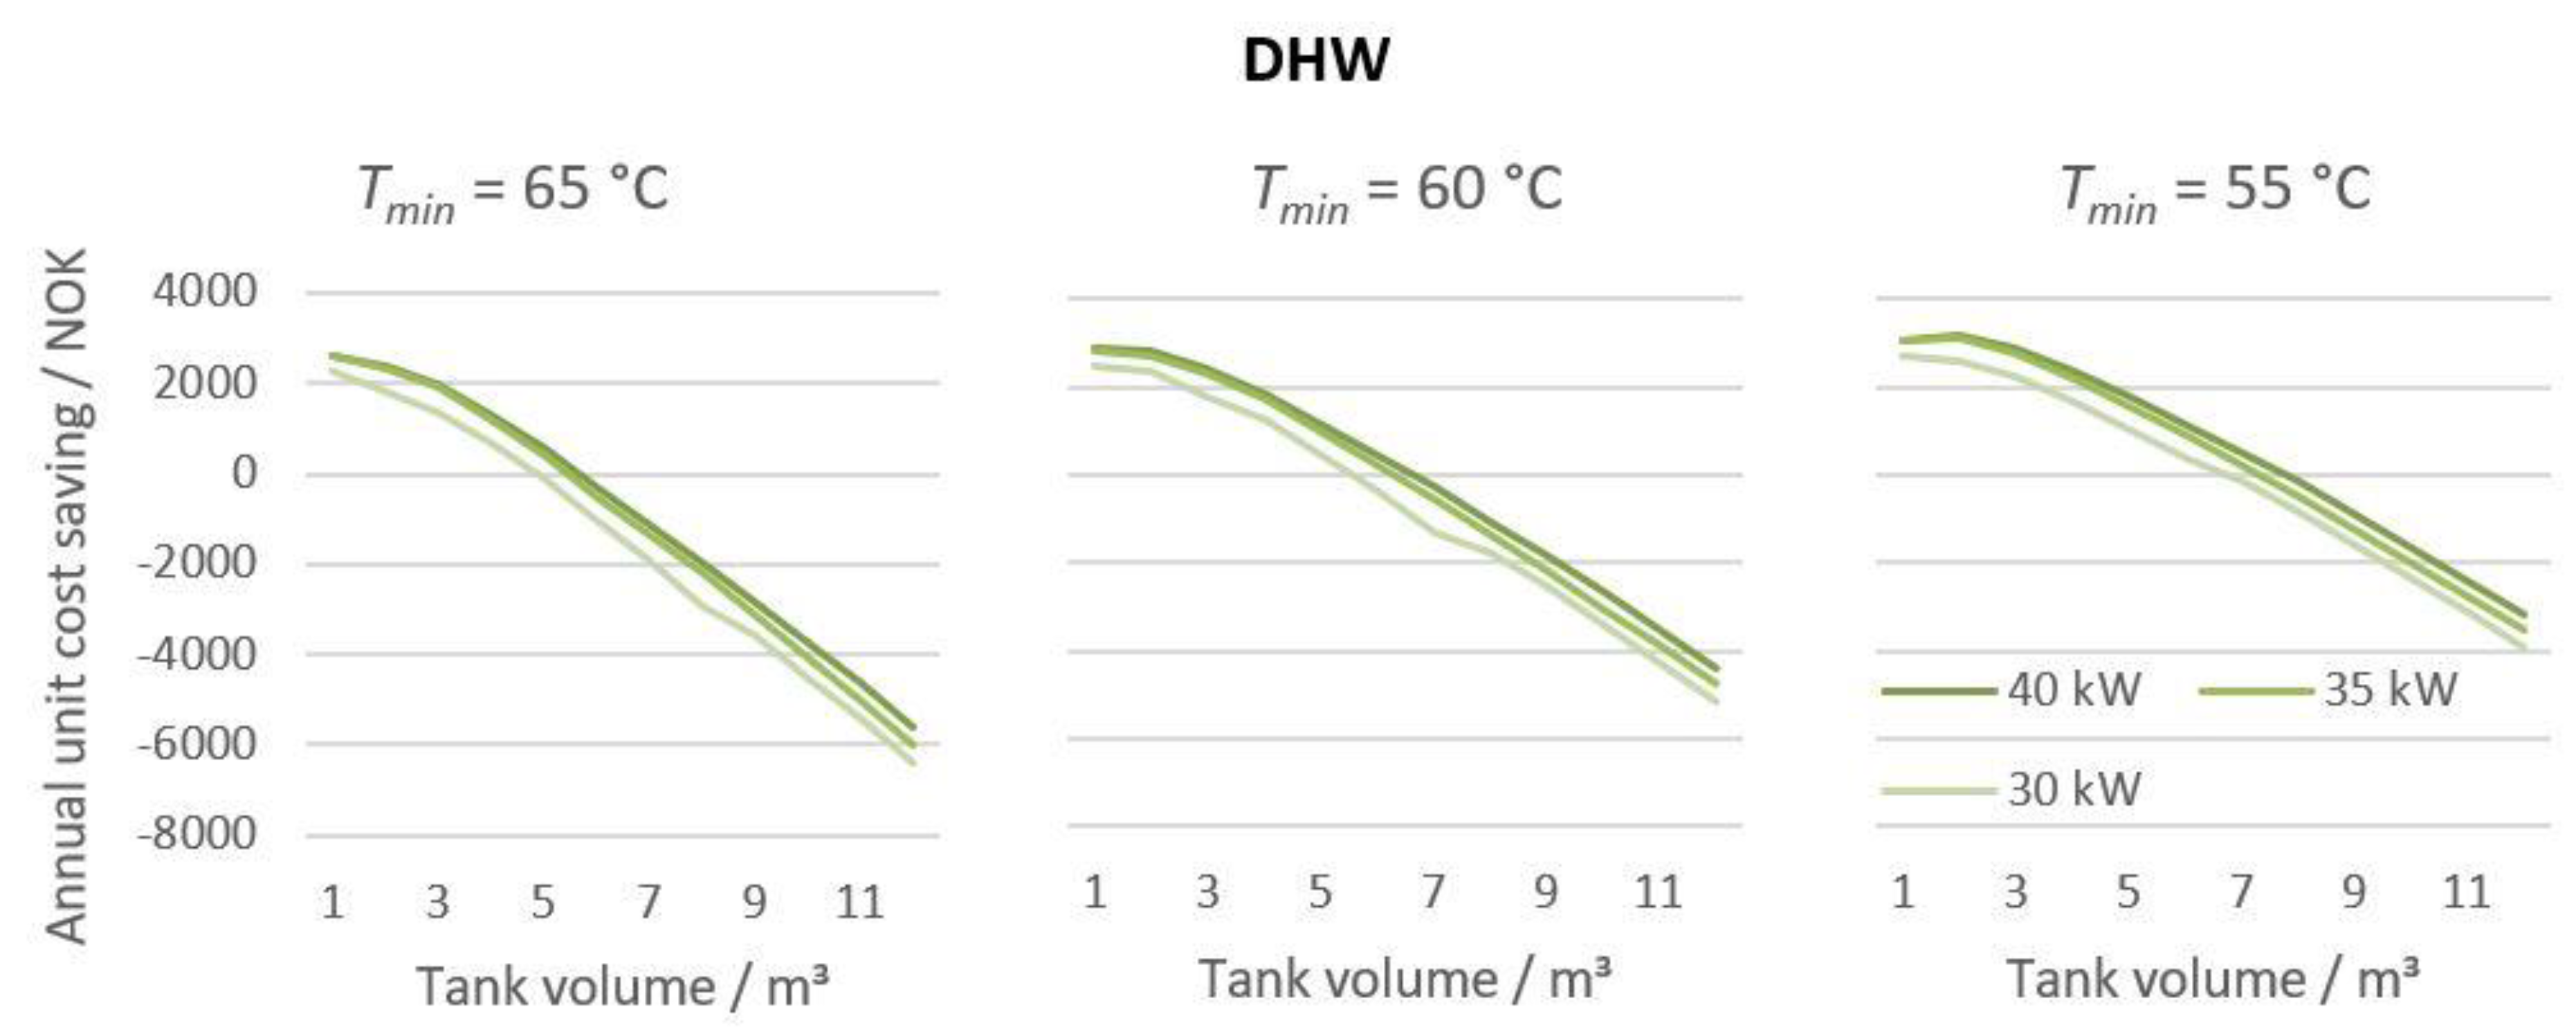
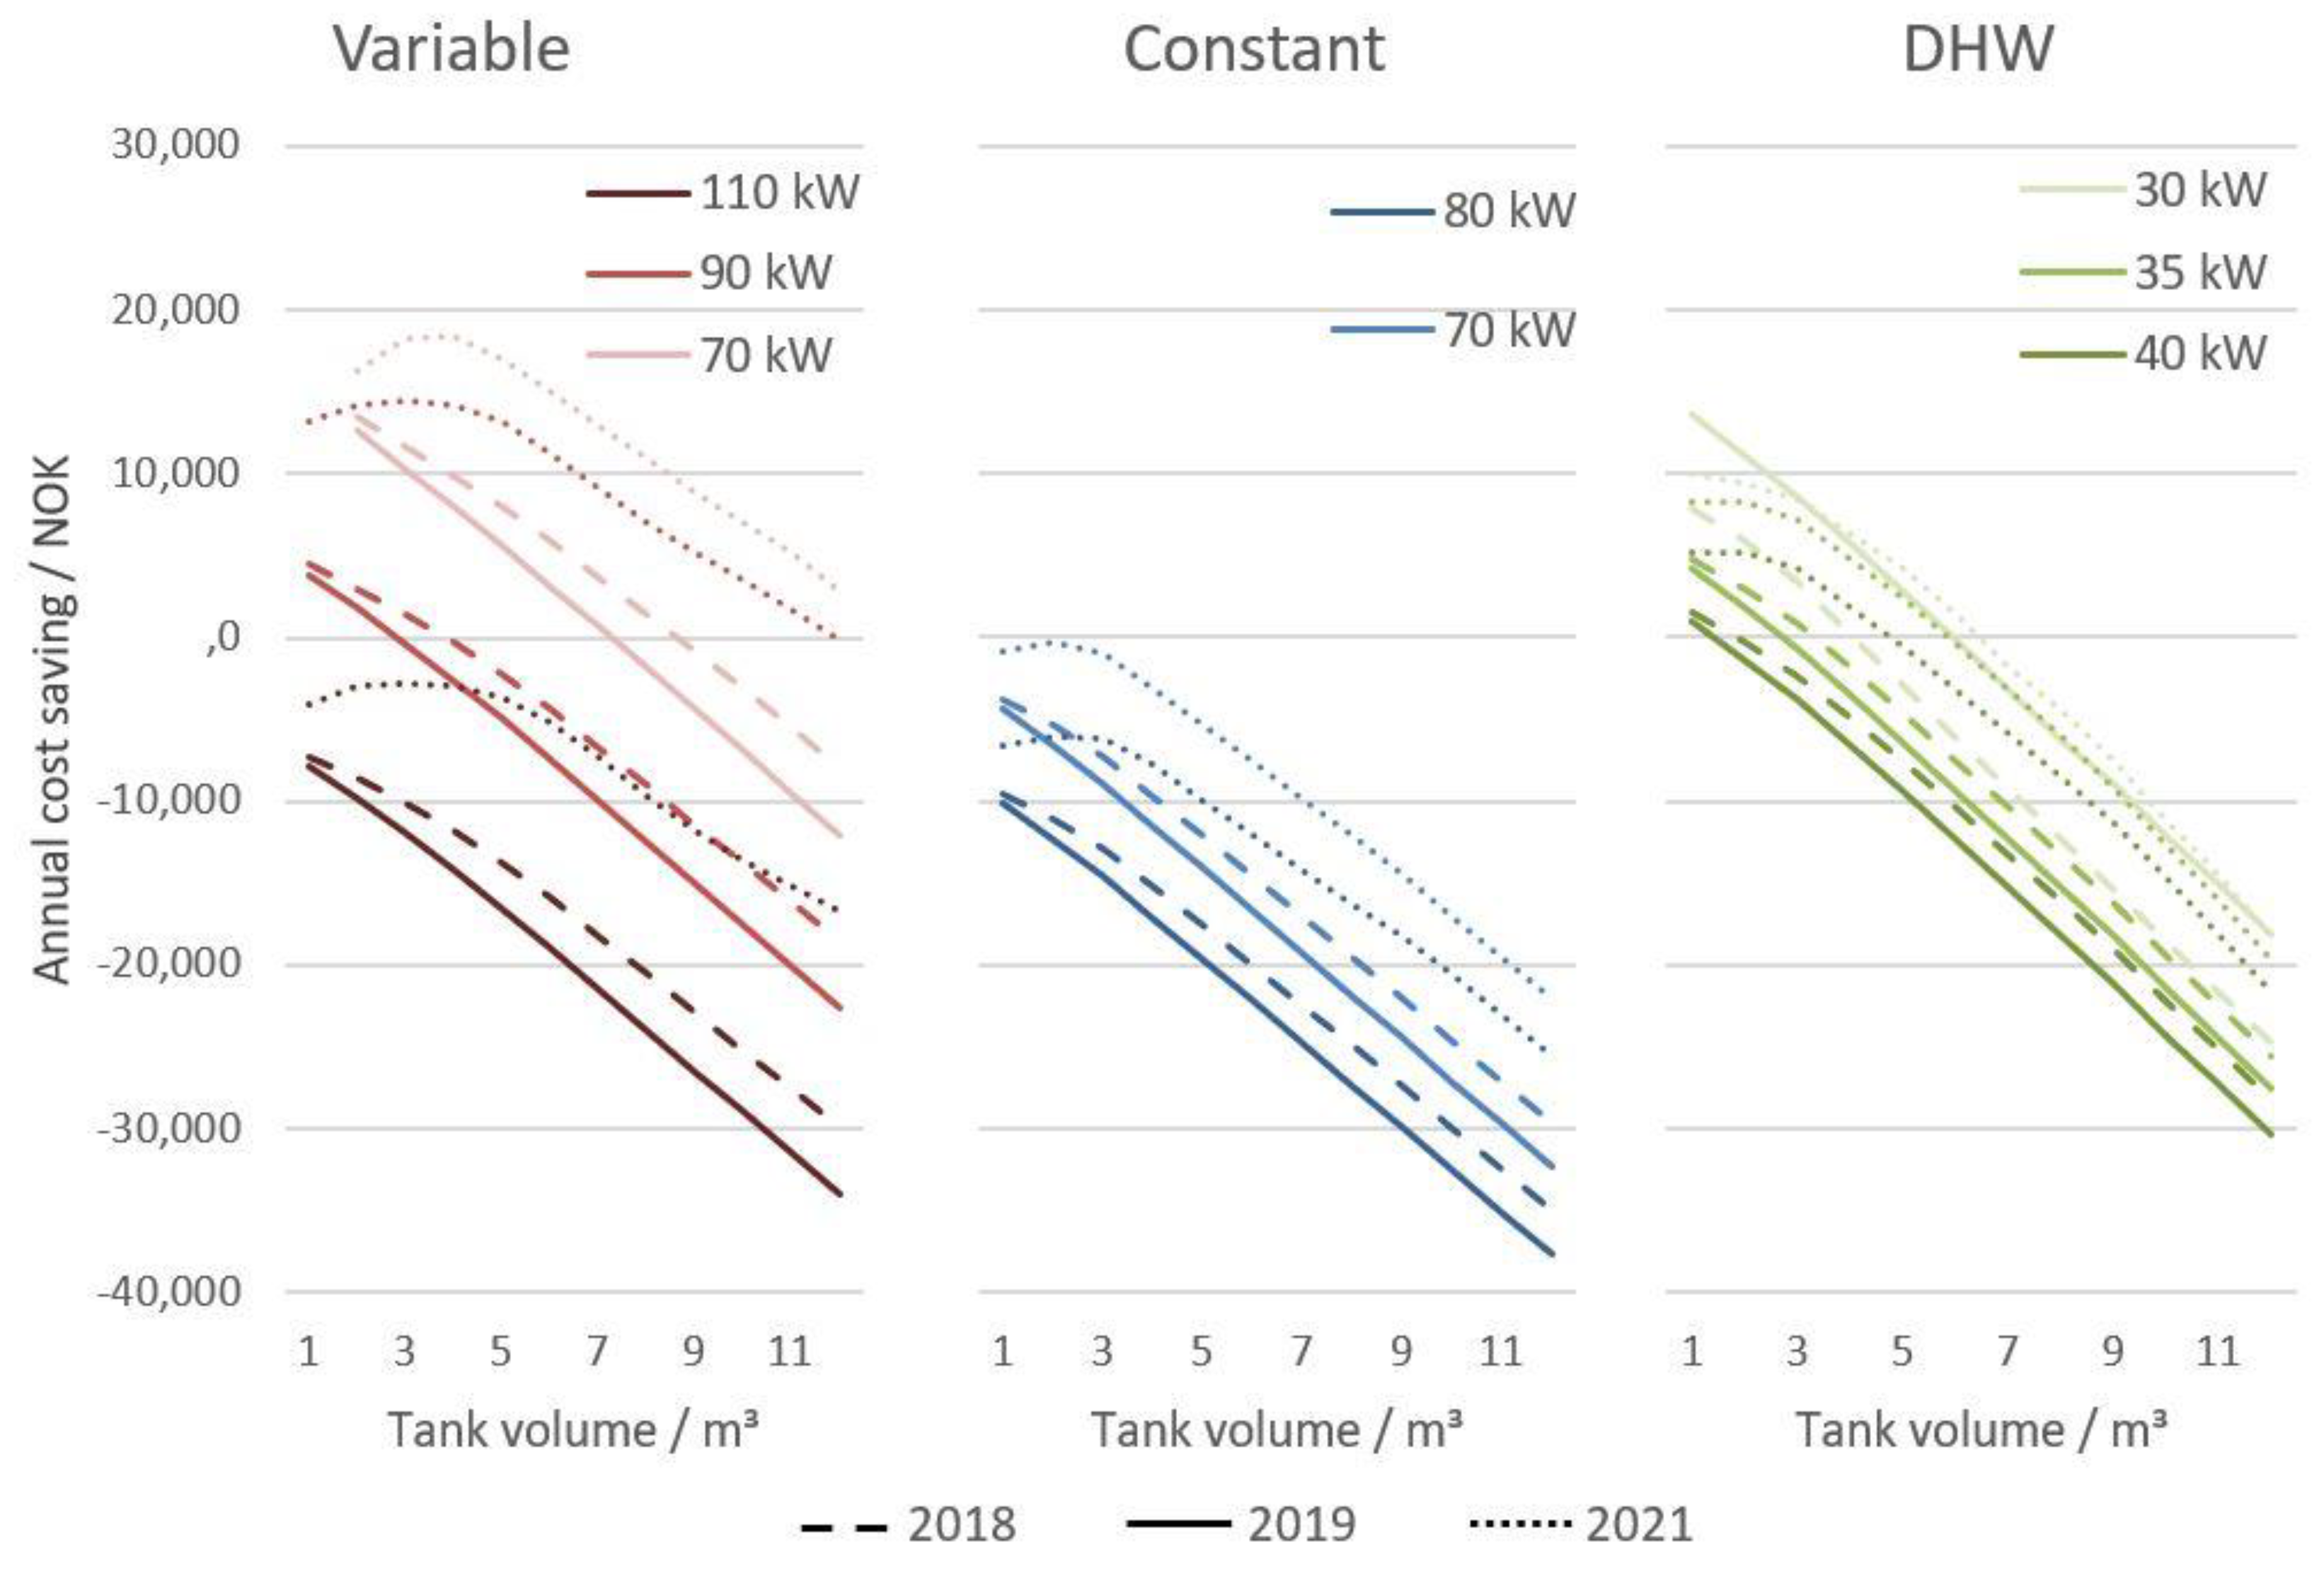
The unit cost savings curves as a function of the tank volume for the three demand profiles at different powers and minimum tank temperatures using 2019 spot prices are shown in Figure 13, Figure 14 and Figure 15.
Increasing the heating power increases the unit cost savings but with a diminishing rate of return, as shown with the flexibility. However, increasing the storage capacity by increasing the number of tanks results in lower cost savings as the additional heat losses more than outweigh the gains from greater flexibility. Increasing the storage capacity by lowering the minimum tank temperature shows improved cost savings, as storage capacity is increased without increasing heat losses. The AEEF and unit cost savings for 2018, 2019 and 2021 are compared in Figure 16 and Figure 17, respectively.
The amount of flexibility was similar between the three years, while the unit cost savings varied considerably, correlating to the energy price variation shown in Figure 9. The volatile prices of 2018 resulted in five tanks giving increased unit cost savings for the variable schedule. Here, the benefit of more flexibility outweighs the additional energy cost of heat losses. The high volatility of the 2021 spot prices makes greater tank volumes worthwhile for all three demand profiles when considering unit cost savings. For this spot price, there was a clear optimum tank volume, which increased with higher heating power. For the DHW demand, the optimum number of tanks was three. The optimums for the heating profiles were between three and five tanks. The savings were significantly lower than those predicted using the simple model, as the simple model did not factor in the increased baseline heat losses from the increased storage volume required to maximise the shifted load.
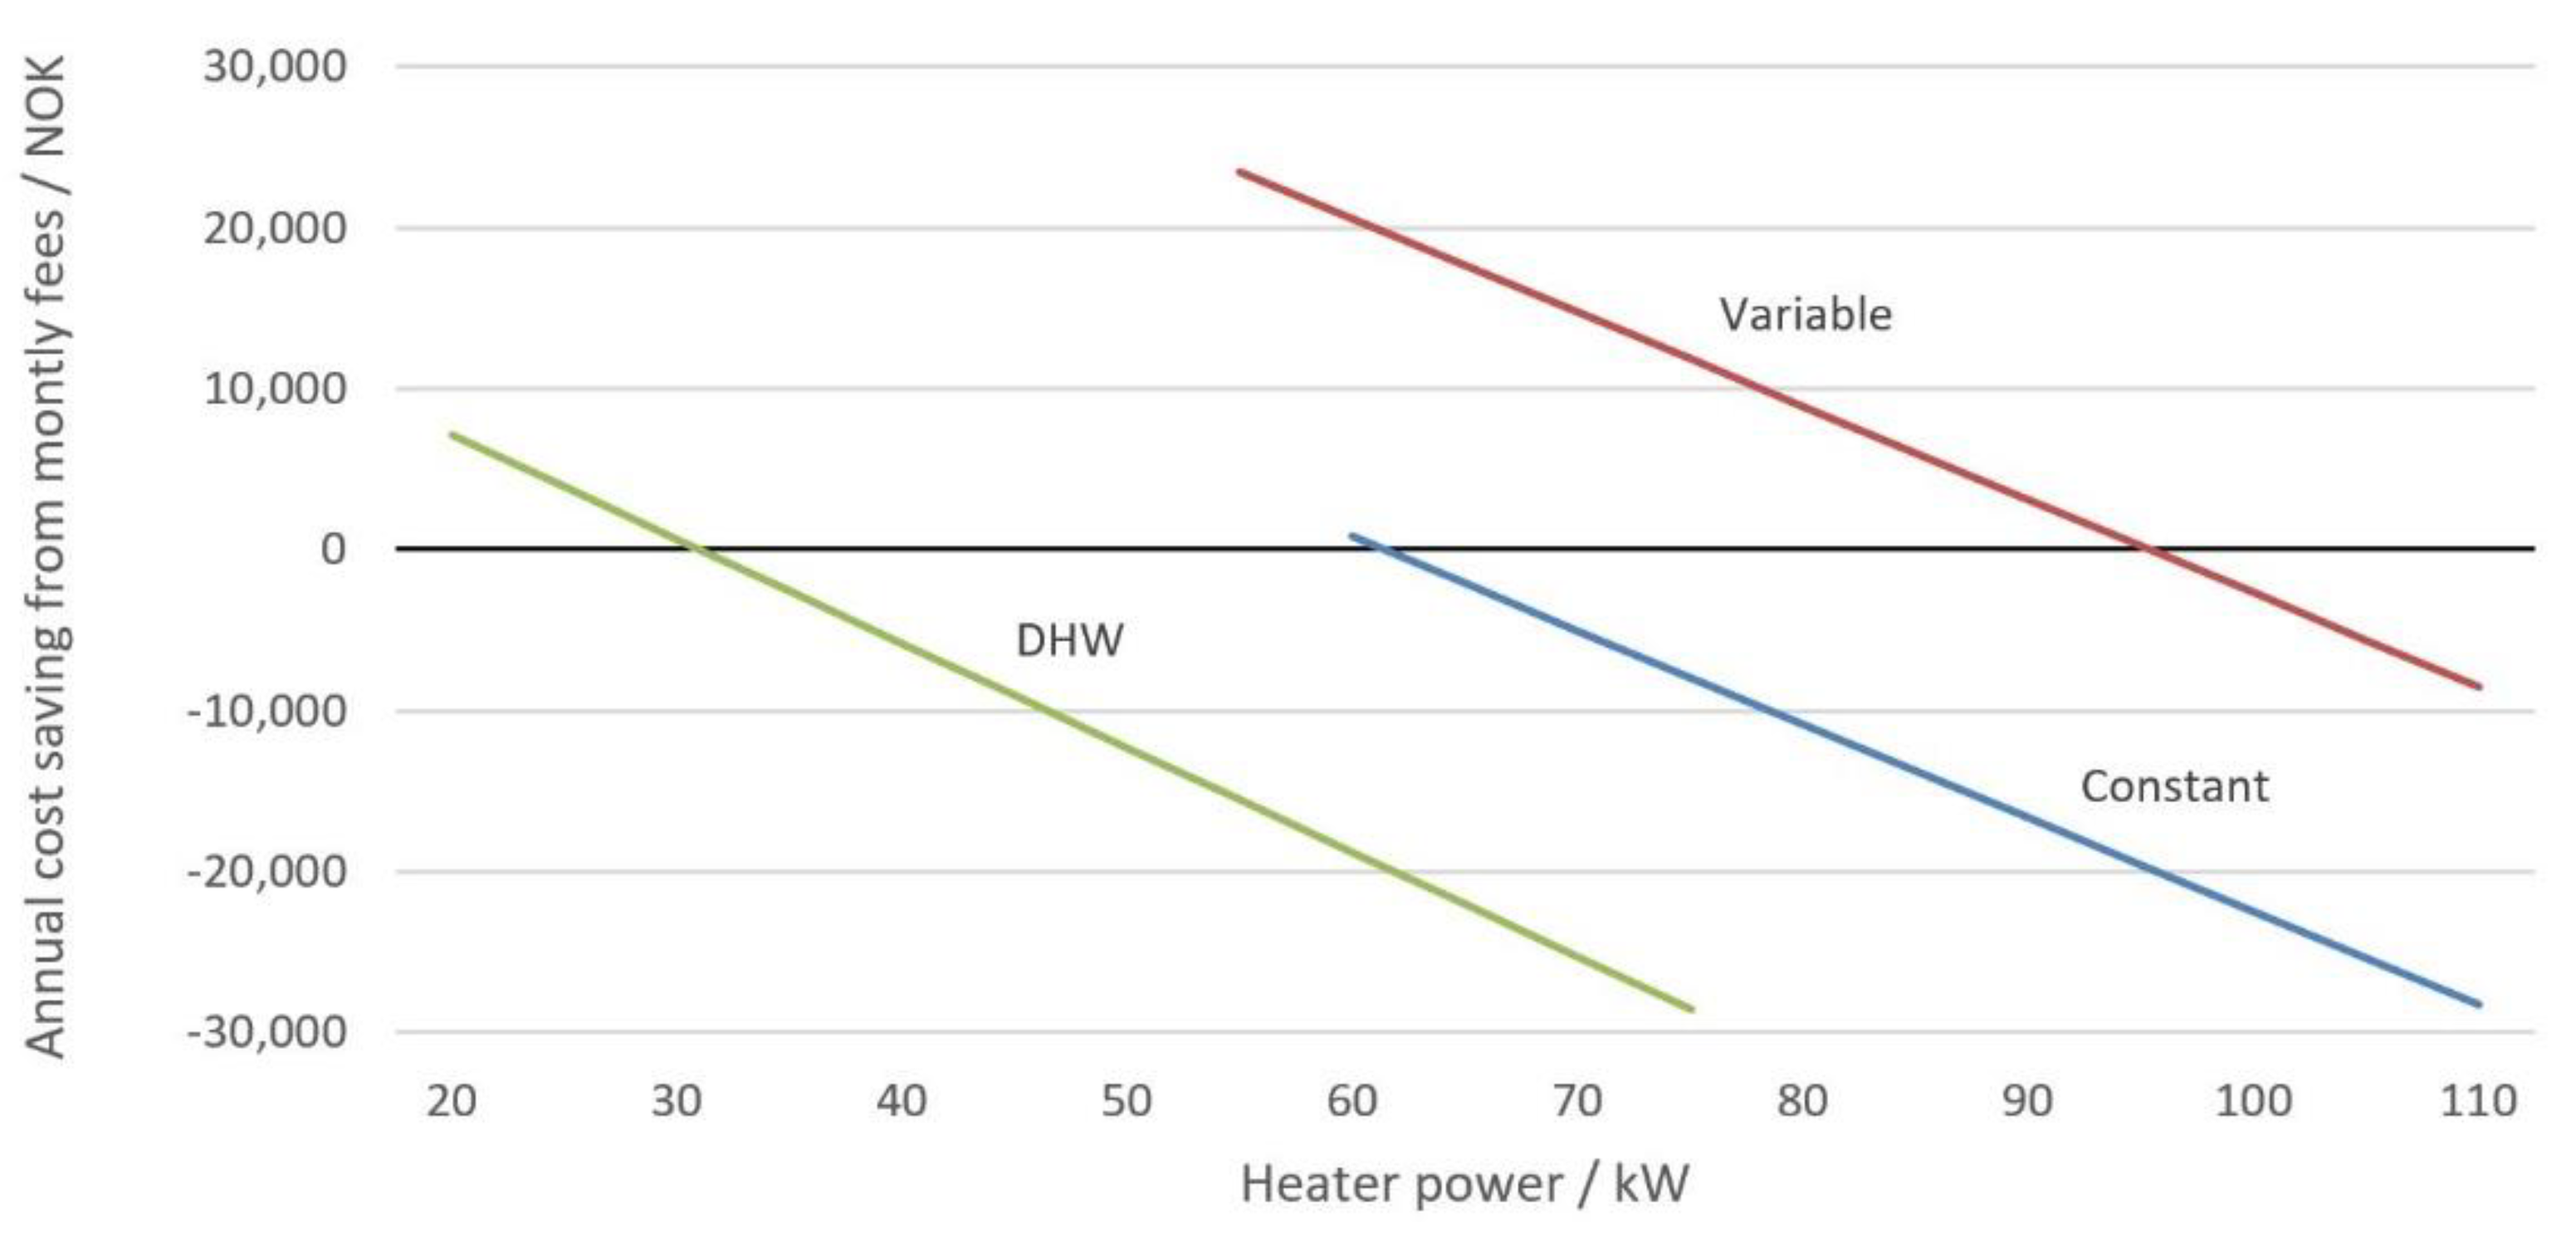
The monthly cost saving is shown in Figure 18. The peak load of each month would equal the defined maximum heating power as the algorithm would always assign the maximum capacity where electricity prices were lowest. For each 10 kW increase in heater power, the peak electricity cost increased by 6480 NOK (≈648 EUR) for DHW and by 5820 NOK (≈582 EUR) for heating (as there is no heating in the summer months).
When the monthly cost and the capital cost of additional tanks are factored in, the unit cost savings are dwarfed and the yearly variation appears minimal. The total cost savings are shown in Figure 19. The capital cost of each tank (42,000 NOK ≈ 4200 EUR) was divided by its expected lifespan (20 years) to give a simple annual cost based on a straight-line depreciation. Under all scenarios, the most cost-effective approach was to minimise the tank volume and heating power. These savings are sensitive to the starting parameters for the number of tanks and tank setpoint. The savings for DHW are relatively high as the reference system consisted of three tanks compared to just one tank for the heating systems. There were little cost savings for the constant profile as this heating strategy already minimises the peak power required. The variable setpoint gives the greatest cost savings as the electric heater size can be dramatically decreased.

4. Discussion

When all system factors were considered, the use of DR of HWSTs gave operational cost savings, but this was from minimising the peak power of the heating element and storage volume rather than shifting the load to hours with a lower spot price, as shown in Figure 19. Under this strategy, an intelligent control is required to proactively charge the HWST over several hours at a low power to meet the heating/DHW demand. Even when the monthly cost and tank investment cost are excluded, it was more economical to minimise the storage volume in most cases. The spot prices from 2021 had enough price variation to warrant increased storage volume for all three demand profiles, as shown in Figure 17. Greater unit cost savings were possible through increasing the heating power or reducing the setpoint temperature, as shown in Figure 13, Figure 14 and Figure 15. Increasing the heating power was subject to a diminishing rate of return and the unit cost savings were outweighed by the dominant role of the monthly price related to the peak energy demand of the system. Reducing the minimum setpoint temperature reduces heat losses while increasing storage capacity. For DHW, this must be balanced with periodically achieving a high enough temperature to prevent the growth of legionella [53]. Furthermore, a lower setpoint decreases the resilience of the HWST to short demand peaks, with an increased risk of not meeting demand. For this study, the minimum setpoint temperature was not reduced below the required supply temperature of the demand profile, to guarantee the quality of heat was always enough. As the algorithm uses the average temperature in the HWST, a stratified HWST could allow for the minimum setpoint temperature to be further reduced as the top of the tank can be hotter than the average.
The results are an indication of the economic benefits of DR of HWSTs; however, they are subject to methodological and practical limitations which mean that real-world returns would likely be lower than found with this method. The algorithms approximate a control with a charging strategy to minimise unit cost, whereas an actual control would deviate from this profile as it responds to other system parameters and unforeseen disturbances. Additionally, the heating control requires a finer temporal resolution [54] than the hourly values simulated here and a degree of safety to cover these unforeseen disturbances. Although the time horizon was limited by the electricity price data, short horizons on the order of one day are only marginally suboptimal relative to a strategy that is optimal over the entire simulation horizon [55]. Similarly, it has been shown that MPCs can achieve near optimum performance [36]. This study assumed that there were no limits to the amount of energy used to charge and discharge the HWSTs. Measured data shows that large demand variations can occur within the hour for DHW [37], which define the peak discharge and so the minimum system size. Therefore, there is a limit to how much the size of a DHW system can be reduced. Another issue with small storage volumes is a greater temperature fluctuation which requires a control valve to provide consistent delivered temperatures, adding an additional cost to the system. The optimisation is sensitive to the chosen storage heat loss parameter, with a higher value resulting in less shifting. If the average tank temperature is significantly higher or lower than the one used to define the heat loss parameter, the algorithm can deliver a suboptimal charging strategy. Running the optimisation using the upper and lower limits for the heat loss parameter showed a maximum variation of 0.08% in the calculated cost, equivalent to less than 200 NOK (≈20 EUR) in annual savings. This error could be reduced by running several whole-year iterations of the algorithms where the average tank temperature of the previous iteration is used for determining the heat loss value.
The benefit of DR is also dependent on the demand profile. A demand profile with little variation, such as the constant heating profile, benefits less from both the unit cost savings and the monthly cost savings. The savings potential of the variable setpoint heating was the highest of the three demands, as the profile peaks during the morning electricity price peak. Distributing this load to the night before gives good unit cost savings and reduces the peak load to that of constant setpoint heating. However, the practical use of DR for heating is limited. Although electric heating is common in Norway, a large proportion are electrical panel radiators, which limits the flexibility of the energy storage capacity of the thermal mass that does not affect thermal comfort. Where water-based heating is used, central heating systems with heat pumps offer greater savings in energy use and peak power demand than the optimised electrical water heaters in this study. The use of an intelligent control may still be relevant for heat pumps in order to increase the operation of the heat pumps at nominal power. This improves the seasonal COP and can reduce the size of the required heat pumps, reducing costs. If the price variation increased, load shifting would become more relevant for heat pump systems [56,57]. A study of a HWST with a heat pump reached a similar conclusion that the most cost-effective solution occurs at small tank sizes [58].
DR of DHW systems is more practical both for new systems and retrofitting of existing systems. DHW represents an increasing share of the total energy use in low-energy Norwegian apartment buildings [59]. A study of existing HWSTs used for DHW in Norway showed that they are dimensioned with a large margin of safety [60] offering good flexibility potential. DHW systems also have a greater potential to reduce the setpoint temperature than heating systems. Electric heating of DHW is still common as the performance difference between heat pumps and electric heating is smaller due to the higher temperatures required.
There is a degree of uncertainty in the results as the demand profiles were generated through simulation using a typical meteorological year, whereas the electricity pricing is based on historic data. Both heating demand and electricity prices are influenced by the weather with higher energy prices often coinciding with higher heating demand such as in sustained cold periods. Real DHW profiles for Norwegian apartment buildings have been found to be less volatile than the standardised profile [60,61], which could result in smaller cost savings. However, the measured profiles also showed variation seasonally and between weekdays and weekends, which could offer other opportunities for load shifting.
The presented approach allows for a simple economic analysis of the potential for DR control in an energy market. The method is applicable to other building typologies and DR technologies. There was good correlation between the potential energy savings from DR and the simple energy price analysis, shown in Figure 9 and Table 3. However, the results of the algorithmic model were significantly lower than the simple analysis predicted due to the extra heat losses from the additional HWSTs required to shift enough electricity. This discrepancy would be smaller for DR technologies with lower additional losses, for example, shifting of electric vehicle charging. Such simple analysis tools could be further developed to better predict savings and so quickly find the most cost-effective applications of DR based on RTP signals. Smaller systems, such as those in single family houses and apartment-based systems, could also be analysed. However, these would likely give less flexibility and savings, as the higher variation in demand [62] makes prediction more difficult and increases the safety margin required. Furthermore, the control must be inexpensive to be worthwhile in small systems [63].
The results indicate that the current electricity pricing policies in Norway encourage DR to reduce peak power use. The societal benefit of this strategy is a reduced need to expand grid infrastructure. This will be further reinforced by a new grid tariff model in July 2022, where small residential customers pay monthly fees according to the peak power of their energy use [40]. There is little benefit to the consumer from load shifting as electricity prices are relatively cheap with little variation compared to other European countries [64], due to the large proportion of hydropower (and pumped storage) in the Norwegian energy mix, which can respond well to changes in demand [65].
An alternative price model is required, if grid operators and governments want to encourage consumer demand side management in order to balance the more intermittent renewable energy. In Norway, this would require reducing the dominant role of peak pricing, which is particularly present in Norway and the Netherlands [11], in favour of spot prices. Days ahead, electricity spot prices can provide a clear price signal of supply in the grid. However, the cost of electricity for consumers is not determined solely by the wholesale electricity price. A large proportion (averaging 40% across the EU) of the unit cost is made up of fixed price taxes, which blunt the price signal to the consumer [11]. In the studied case, the fixed part of the unit cost averaged 35% for 2018 price data, 37% for 2019 and 26% for 2021. In years with low spot prices, the fixed part exceeded 50%. Regulation of electricity prices to protect consumers from market fluctuations also disconnects consumer prices from the market price signal required for DR. Although not present in Norway, some form of price intervention was present in 13 EU countries in 2018, although it is an aim of the EU commission to phase out such price regulation [66].
In the long term, wide adoption of DR could reduce the clarity of spot prices as the price signal, as more DR devices would stabilise electricity prices, making further adoption less economically attractive [67]. Further price incentives may be required to stimulate load shifting. Peak pricing could be changed so that it acts as a short-term price signal. For example, the peak pricing could be lower at night to encourage greater electricity use in this period. Another possibility is to allow DR devices to trade on the intraday market which can be more volatile than the day ahead market [68]; however, this would require additional metering infrastructure. Alternatively, energy companies can pay a flexibility bonus per kWh of shifted demand. It has been shown that such incentives can greatly improve the return on investment [37,69]. However, too many incentives without regulation can lead to the use of less efficient technologies which offer greater flexibility.

5. Conclusions

The use of demand-responsive electrically heated hot water storage tanks (HWSTs) is one of many interesting solutions to stabilise future energy networks with higher proportions of intermittent renewable energy. HWSTs are already present in a large proportion of the building stock; however, the adoption of demand response (DR) by consumers is highly dependent on the economic benefit. This study assessed the economic potential of DR of HWSTs under current pricing models which were applied to a Norwegian case study building with three different demand profiles. The analysis found the maximum possible cost savings from shifting electricity within a 24-h time horizon using energy price data and the demand profile as inputs. A charging profile was created for each demand profile and optimised to three different years of electricity spot prices, each representing three levels of price volatility. The optimisation was repeated for different heating powers, varying by 5 kW increments. The resulting charging profiles were then used to parametrically study the effect of varying the number of HWSTs and their minimum setpoint temperature. The energy cost and energy flexibility of each case was calculated against a reference for each of the demand profiles.
Increasing the number of HWSTs or the heating power increased the flexibility with a diminishing rate of return. Increasing heating power also increased unit cost savings with a diminishing rate of return. However, increasing the number of tanks resulted in lower unit cost savings as the cost of additional heat losses was greater than the savings from shifting demand, except for the highly volatile price data from 2021. Changing the minimum setpoint temperature has little effect on flexibility but improves the cost savings, as a greater thermal storage capacity can be achieved without increasing heat loss. Overall, systems utilising smaller heating power and fewer HWSTs were more economical when the monthly price was included, which is related to the peak energy demand of the system in each month. The year-on-year variation in savings is small as the monthly price is dominant over the hourly spot prices. The savings potential from DR is reduced when a heat pump is used, especially when the shifting of energy leads to reduced heat pump performance. The total cost savings are sensitive to the reference system used. Where the reference system utilises several HWSTs, there are greater savings available from using a smaller optimised system.
The possible savings from DR are closely linked to the variation in unit energy price during the optimisation period. The small variation in Norwegian spot prices meant that adopting DR for load shifting offers little economic benefit to consumers, despite Norway being one of the few countries with the infrastructure required to implement it. Cost savings are best achieved from redistributing energy demand to flatten demand peaks and thus minimise the peak heating power required, the pricing of which is dominant in the energy cost under the current price structure. With the current importance of peak pricing, the method presented in this study should be further developed to include all building electricity loads when creating the charging profile. The charging profile can then be used to smooth out the building’s demand profile in order to minimise the peak power. Under such a method, the available capacity for heating a HWST would vary throughout the day depending upon other loads. Alternatively, it is possible for energy companies or governments to encourage load shifting by changing this price structure so that the unit cost has greater importance for the total energy cost. This can be achieved by minimising the fixed parts of the unit cost or introducing bonuses for shifting energy use away from certain times.

Author Contributions

L.G. conceptualisation (equal); data curation (lead); formal analysis (lead); investigation (equal); methodology (lead); project administration (supporting); resources (equal); visualisation (lead); writing—original draft (lead); writing—review and editing (supporting). S.J. conceptualisation (equal); formal analysis (supporting); funding acquisition (lead); investigation (equal); methodology (supporting); project administration (lead); resources (equal); writing—original draft (supporting); writing—review and editing (lead). All authors have read and agreed to the published version of the manuscript.

Funding

The research reported in this article was partly funded by the Research Council of Norway (Norges Forskningsråd) through their national program ENERGIX (research grant: SynHouse, 310121).

Data Availability Statement

The data presented in this study are available on request from the corresponding author.

Conflicts of Interest

The authors declare no conflict of interest. The funding source had no involvement in the study design; the collection, analysis, and interpretation of data; or in the decision to submit the article for publication.

Abbreviations

AEEFAvailable Electric Energy Flexibility
COPCoefficient of Performance
DHWDomestic Hot Water
DRDemand Response
HWSTHot Water Storage Tank
MPCModel Predictive Control
RTPReal Time Pricing
TESThermal Energy Storage

References

  1. Market Observatory for Energy. Quarterly Report on European Electricity Markets (Q1 2022); European Commission: Brussels, Belgium, 2022; Volume 15. [Google Scholar]
  2. European Commission, Communication from the Commission to the European Parliament, the European Council, the Council, the European Economic and Social Committee and the Committee of the Regions Repowereu Plan REPowerEU Plan. 2022. Available online: https://eur-lex.europa.eu/legal-content/EN/TXT/?uri=COM%3A2022%3A230%3AFIN&qid=1653033742483 (accessed on 30 September 2022).
  3. Jensen, S.Ø.; Marszal-Pomianowska, A.; Lollini, R.; Pasut, W.; Knotzer, A.; Engelmann, P.; Stafford, A.; Reynders, G. IEA EBC Annex 67 Energy Flexible Buildings. Energy Build. 2017, 155, 25–34. [Google Scholar] [CrossRef] [Green Version]
  4. Lund, P.D.; Lindgren, J.; Mikkola, J.; Salpakari, J. Review of energy system flexibility measures to enable high levels of variable renewable electricity. Renew. Sustain. Energy Rev. 2015, 45, 785–807. [Google Scholar] [CrossRef] [Green Version]
  5. Clauß, J.; Stinner, S.; Solli, C.; Lindberg, K.B.; Madsen, H.; Georges, L. A generic methodology to evaluate hourly average CO2eq. intensities of the electricity mix to deploy the energy flexibility potential of Norwegian buildings. In Proceedings of the 10th International Conference on System Simulation in Buildings, Liege, Belgium, 10–12 December 2018. [Google Scholar]
  6. Mixergy. Mixergy Hot Water Tanks. 2021. Available online: https://www.mixergy.co.uk/ (accessed on 10 May 2021).
  7. SEDC. Explicit and Implicit Demand-Side Flexibility—Complementary Approaches for an Efficient Energy System. Smart Energy Demand Coalition. 2016. Available online: https://www.smarten.eu/wp-content/uploads/2016/09/SEDC-Position-paper-Explicit-and-Implicit-DR-September-2016.pdf#:~:text=Implicit%20Demand-Side%20Flexibility%20is%20the%20consumer%E2%80%99s%20reaction%20to,is%20often%20referred%20to%20as%20%E2%80%9Cprice-based%E2%80%9D%20Demand-Side%20Flexibility (accessed on 3 May 2021).
  8. Grünewald, P.; McKenna, E.; Thomson, M. Keep it simple: Time-of-use tariffs in high-wind scenarios. IET Renew. Power Gener. 2015, 9, 176–183. [Google Scholar] [CrossRef] [Green Version]
  9. Nolan, S.; O’Malley, M. Challenges and barriers to demand response deployment and evaluation. Appl. Energy 2015, 152, 1–10. [Google Scholar] [CrossRef]
  10. Smart Energy Demand Coalition (SEDC). Explicit Demand Response in Europe—Mapping the Markets 2017; Smart Energy Demand Coalition (SEDC): Brussels, Belgium, 2017. [Google Scholar]
  11. Pinto-Bello, A. The smartEn Map—Network Tariffs and Taxes; smartEN: Brussels, Belgium, 2019; Available online: https://smarten.eu/mapping-the-markets/ (accessed on 3 May 2021).
  12. Energifakta Norge. The Power Market. 2021. Available online: https://energifaktanorge.no/en/norsk-energiforsyning/kraftmarkedet/ (accessed on 3 May 2021).
  13. Statistisk sentralbyrå. 09364: Kraftpriser i sluttbrukermarkedet, etter kontraktstype, kvartal og statistikkvariabel. Statistikkbanken. 2021. Available online: https://www.ssb.no/statbank/table/09364 (accessed on 29 September 2021).
  14. lavere strømpris så langt i 2020 | Tibber Magazine. Available online: https://tibber.com/no/magazine/power-hacks/lavere-strompris-i-2020 (accessed on 29 September 2021).
  15. Wattever | Forstå strømprisene. Available online: https://www.wattever.no/forsta-stromprisene (accessed on 29 September 2021).
  16. Kathirgamanathan, A.; De Rosa, M.; Mangina, E.; Finn, D.P. Data-driven predictive control for unlocking building energy flexibility: A review. Renew. Sustain. Energy Rev. 2021, 135, 110120. [Google Scholar] [CrossRef]
  17. Afram, A.; Janabi-Sharifi, F. Theory and Applications of HVAC Control systems–A Review of Model Predictive Control (MPC). Build. Environ. 2014, 72, 343–355. [Google Scholar] [CrossRef]
  18. Prívara, S.; Cigler, J.; Váňa, Z.; Oldewurtel, F.; Sagerschnig, C.; Zacekova, E. Building modeling as a crucial part for building predictive control. Energy Build. 2013, 56, 8–22. [Google Scholar] [CrossRef]
  19. Nilsson, A.; Bergstad, C.J.; Thuvander, L.; Andersson, D.; Andersson, K.; Meiling, P. Effects of continuous feedback on households’ electricity consumption: Potentials and barriers. Appl. Energy 2014, 122, 17–23. [Google Scholar] [CrossRef]
  20. Ahlbom, H. Smarta fiaskot för prestigebygget i Norra Djurgårdsstaden. Ny Teknik. 14 February 2015. Available online: https://www.nyteknik.se/nyheter/smarta-fiaskot-for-prestigebygget-i-norra-djurgardsstaden-6336033 (accessed on 11 May 2021).
  21. O’Shaughnessy, E.; Cutler, D.; Ardani, K.; Margolis, R. Solar plus: A review of the end-user economics of solar PV integration with storage and load control in residential buildings. Appl. Energy 2018, 228, 2165–2175. [Google Scholar] [CrossRef]
  22. Romanchenko, D.; Kensby, J.; Odenberger, M.; Johnsson, F. Thermal energy storage in district heating: Centralised storage vs. storage in thermal inertia of buildings. Energy Convers. Manag. 2018, 162, 26–38. [Google Scholar] [CrossRef]
  23. Belz, K.; Kuznik, F.; Werner, K.; Schmidt, T.; Ruck, W. Thermal energy storage systems for heating and hot water in residential buildings. In Advances in Thermal Energy Storage Systems; Woodhead Publishing: Cambridge, UK, 2015; pp. 441–465. [Google Scholar] [CrossRef]
  24. Kemna, R.; van Elburg, M.; Aarts, S. Water heaters and storage tanks—Ecodesign and energy label. In Task 1 Scope—Policies & Standards; 2019; Available online: https://www.ecohotwater-review.eu/downloads/Water%20Heaters%20Task%201%20final%20report%20July%202019.pdf (accessed on 15 June 2022).
  25. Johra, H.; Heiselberg, P.; Le Dréau, J. Influence of envelope, structural thermal mass and indoor content on the building heating energy flexibility. Energy Build. 2019, 183, 325–339. [Google Scholar] [CrossRef]
  26. Hou, J.; Li, H.; Nord, N. Nonlinear model predictive control for the space heating system of a university building in Norway. Energy 2022, 253, 124157. [Google Scholar] [CrossRef]
  27. Medved, S.; Domjan, S.; Arkar, C. Sustainable Technologies for Nearly Zero Energy Buildings; Springer: Cham, Switzerland, 2019. [Google Scholar] [CrossRef]
  28. Hadorn, J.-C. Thermal Energy Storage for Solar and Low Energy Buildings—State of the Art; Servei de Publicacions de la Universitat de Lleida: Lleida, Spain, 2005. [Google Scholar]
  29. Cao, S.; Hasan, A.; Sirén, K. Analysis and solution for renewable energy load matching for a single-family house. Energy Build. 2013, 65, 398–411. [Google Scholar] [CrossRef]
  30. Avci, M.; Erkoc, M.; Rahmani, A.; Asfour, S. Model predictive HVAC load control in buildings using real-time electricity pricing. Energy Build. 2013, 60, 199–209. [Google Scholar] [CrossRef]
  31. Tennbakk, B.; Ryssdal, M.B.; Fiksen, K.; Ådnanes, O.-K.; Christiansen, C.H. Value of Flexibility from Electrical Storage Water Heaters; Thema: Oslo, Norway, 2020. [Google Scholar]
  32. Kepplinger, P.; Huber, G.; Petrasch, J. Autonomous optimal control for demand side management with resistive domestic hot water heaters using linear optimization. Energy Build. 2015, 100, 50–55. [Google Scholar] [CrossRef]
  33. Kepplinger, P.; Huber, G.; Petrasch, J. Field testing of demand side management via autonomous optimal control of a domestic hot water heater. Energy Build. 2016, 127, 730–735. [Google Scholar] [CrossRef]
  34. Ritchie, M.; Engelbrecht, J.; Booysen, M. Practically-Achievable Energy Savings with the Optimal Control of Stratified Water Heaters with Predicted Usage. Energies 2021, 14, 1963. [Google Scholar] [CrossRef]
  35. De Oliveira, V.; Jäschke, J.; Skogestad, S. Optimal operation of energy storage in buildings: Use of the hot water system. J. Energy Storage 2016, 5, 102–112. [Google Scholar] [CrossRef]
  36. Nord, N.; Ding, Y.; Ivanko, D.; Walnum, H.T. DHW tank sizing considering dynamic energy prices. E3S Web Conf. 2021, 246, 07005. [Google Scholar] [CrossRef]
  37. Sørensen, L.; Walnum, H.T.; Sartori, I.; Andresen, I. Energy flexibility potential of domestic hot water systems in apartment buildings. E3S Web Conf. 2021, 246, 11005. [Google Scholar] [CrossRef]
  38. Henze, G.P. Trade-Off Between Energy Consumption and Utility Cost in the Optimal Control of Active and Passive Building Thermal Storage Inventory. In Proceedings of the International Solar Energy Conference 2004, Portland, OR, USA, 11–14 July 2004; pp. 111–119. [Google Scholar] [CrossRef]
  39. Nord Pool. Market Data. 2022. Available online: https://www.nordpoolgroup.com/en/Market-data1/ (accessed on 13 February 2022).
  40. Elvia. Alt du må vite om ny nettleie for 2022. 2022. Available online: https://www.elvia.no/nettleie/alt-du-ma-vite-om-ny-nettleie-for-2022/ (accessed on 15 June 2022).
  41. Elvia. Nettleiepriser og effekttariff bedrift. 2021. Available online: https://www.elvia.no/nettleie/alt-om-nettleie/nettleiepriser-og-effekttariff-for-bedrifter-i-oslo-og-viken (accessed on 15 May 2021).
  42. ProgramByggerne. SIMIEN7; ProgramByggerne ANS: Skollenborg, Norway, 2021. [Google Scholar]
  43. EN ISO 13790:2008; Energy Performance of Buildings—Calculation of Energy Use for Space Heating and Cooling. CEN—European Committee for Standardization: Brussels, Belgium, 2008.
  44. EN 15265:2007; Energy Performance of Buildings—Calculation of Energy Needs for Space Heating and Cooling Using Dynamic Methods—General Criteria and Validation Procedures. CEN—European Committee for Standardization: Brussels, Belgium, 2007.
  45. Standard Norge. SN/NS 3031:2020—Bygningers energiytelse Beregning av energibehov og energiforsyning. 2020. Available online: https://www.standard.no/no/Nettbutikk/produktkatalogen/Produktpresentasjon/?ProductID=1124340 (accessed on 8 October 2021).
  46. Ahmed, K.; Pylsy, P.; Kurnitski, J. Hourly Consumption Profiles of Domestic Hot Water for Finnish Apartment Buildings. In Proceedings of the CLIMA 2016: 12th REHVA World CongressAt, Aalborg, Denmark, 22–25 May 2016. [Google Scholar] [CrossRef]
  47. Norconsult Informasjonssystemer AS. Norsk prisbok. 2021. Available online: https://www.norskprisbok.no/Home.aspx (accessed on 8 October 2021).
  48. Steinweg, J.; Kliem, F.; Rockendorf, G. Pipe Internal Recirculation in Storage Connections—Characteristics and Influencing Parameters. Energy Procedia 2014, 48, 664–673. [Google Scholar] [CrossRef] [Green Version]
  49. Stene, J.; Justo Alonso, M. Field Measurements—Heat Pump Systems in NZEB. SINTEF. 2016. Available online: https://www.sintef.no/en/publications/publication/1359179/ (accessed on 13 June 2022).
  50. Pallonetto, F.; De Rosa, M.; D’Ettorre, F.; Finn, D.P. On the assessment and control optimisation of demand response programs in residential buildings. Renew. Sustain. Energy Rev. 2020, 127, 109861. [Google Scholar] [CrossRef]
  51. NVE. Kraftåret 2018: Fra tørke- og nedbørsrekord til forbruksrekord og høy kraftpris—NVE. 21 January 2019. Available online: https://www.nve.no/nytt-fra-nve/nyheter-energi/kraftaret-2018-fra-torke-og-nedborsrekord-til-forbruksrekord-og-hoy-kraftpris/ (accessed on 14 May 2021).
  52. NVE. Kraftsituasjonen—Andre kvartal 2021; NVE: Oslo, Norway, 2021. [Google Scholar]
  53. Armstrong, P.M.; Uapipatanakul, M.; Thompson, I.; Ager, D.; McCulloch, M. Thermal and sanitary performance of domestic hot water cylinders: Conflicting requirements. Appl. Energy 2014, 131, 171–179. [Google Scholar] [CrossRef]
  54. Bagge, H.; Johansson, D. Measurements of household electricity and domestic hot water use in dwellings and the effect of different monitoring time resolution. Energy 2011, 36, 2943–2951. [Google Scholar] [CrossRef]
  55. Henze, G.P.; Dodier, R.H.; Krarti, M. Development of a Predictive Optimal Controller for Thermal Energy Storage Systems. HVAC&R Res. 1997, 3, 233–264. [Google Scholar] [CrossRef]
  56. Ahmed, A.M.A.; Mihet-Popa, L.; Agert, C.; Zong, Y.; Bruna, J.; Xiao, X. Potential Energy Flexibility for a Hot-Water Based Heating System in Smart Buildings via Economic Model Predictive Control. In Proceedings of the 2017 International Symposium on Computer Science and Intelligent Controls, Budapest, Hungary, 20–22 October 2017; pp. 1–5. [Google Scholar] [CrossRef]
  57. Arteconi, A.; Hewitt, N.J.; Polonara, F. Domestic demand-side management (DSM): Role of heat pumps and thermal energy storage (TES) systems. Appl. Therm. Eng. 2013, 51, 155–165. [Google Scholar] [CrossRef]
  58. Alimohammadisagvand, B.; Jokisalo, J.; Kilpeläinen, S.; Ali, M.; Sirén, K. Cost-optimal thermal energy storage system for a residential building with heat pump heating and demand response control. Appl. Energy 2016, 174, 275–287. [Google Scholar] [CrossRef]
  59. Gibbons, L.; Javed, S. A review of HVAC solution-sets and energy performace of nearly zero-energy multi-story apartment buildings in Nordic climates by statistical analysis of environmental performance certificates and literature review. Energy 2021, 238, 121709. [Google Scholar] [CrossRef]
  60. Walnum, H.T.; Sørensen, Å.L.; Stråby, K. Energibruk til varmt tappevann—Resultater fra prosjektet varmtvann2030; Sintef: Oslo, Norway, 2021. [Google Scholar]
  61. Ivanko, D.; Walnum, H.T.; Sørensen, L.; Nord, N. Analysis of monthly and daily profiles of DHW use in apartment blocks in Norway. E3S Web Conf. 2020, 172, 12002. [Google Scholar] [CrossRef]
  62. Berge, M.; Mathisen, H.M. Post-Occupancy Evaluation of Low-Energy and Passive House Apartments in the Løvåshagen Cooperative—Occupant Behavior and Satisfaction; Passivhus Norden: Gothenburg, Sweden, 2013; pp. 52–65. [Google Scholar]
  63. Killian, M.; Kozek, M. Ten questions concerning model predictive control for energy efficient buildings. Build. Environ. 2016, 105, 403–412. [Google Scholar] [CrossRef]
  64. Clauß, J.; Stinner, S.; Sartori, I.; Georges, L. Predictive rule-based control to activate the energy flexibility of Norwegian residential buildings: Case of an air-source heat pump and direct electric heating. Appl. Energy 2019, 237, 500–518. [Google Scholar] [CrossRef]
  65. Pitorac, L.; Vereide, K.; Lia, L. Technical Review of Existing Norwegian Pumped Storage Plants. Energies 2020, 13, 4918. [Google Scholar] [CrossRef]
  66. European Commission. ANNEX to the Report to the European Parliament, the Council, the European Economic and Social Committee and the Committee of the Regions—2020 Report on the State of the Energy Union pursuant to Regulation (EU) 2018/1999 on Governance of the Energy Union and Climate Action. 2020. Available online: https://webapi2016.eesc.europa.eu/v1/documents/com950-2020_part2_ext_EN.docx/content (accessed on 10 March 2022).
  67. Arteconi, A.; Patteeuw, D.; Bruninx, K.; Delarue, E.; D’Haeseleer, W.; Helsen, L. Active demand response with electric heating systems: Impact of market penetration. Appl. Energy 2016, 177, 636–648. [Google Scholar] [CrossRef]
  68. Hedegaard, R.E.; Pedersen, T.H.; Petersen, S. Multi-market demand response using economic model predictive control of space heating in residential buildings. Energy Build. 2017, 150, 253–261. [Google Scholar] [CrossRef]
  69. Peeters, M.; Compernolle, T.; van Passel, S. Simulation of a controlled water heating system with demand response remunerated on imbalance market pricing. J. Build. Eng. 2020, 27, 100969. [Google Scholar] [CrossRef]
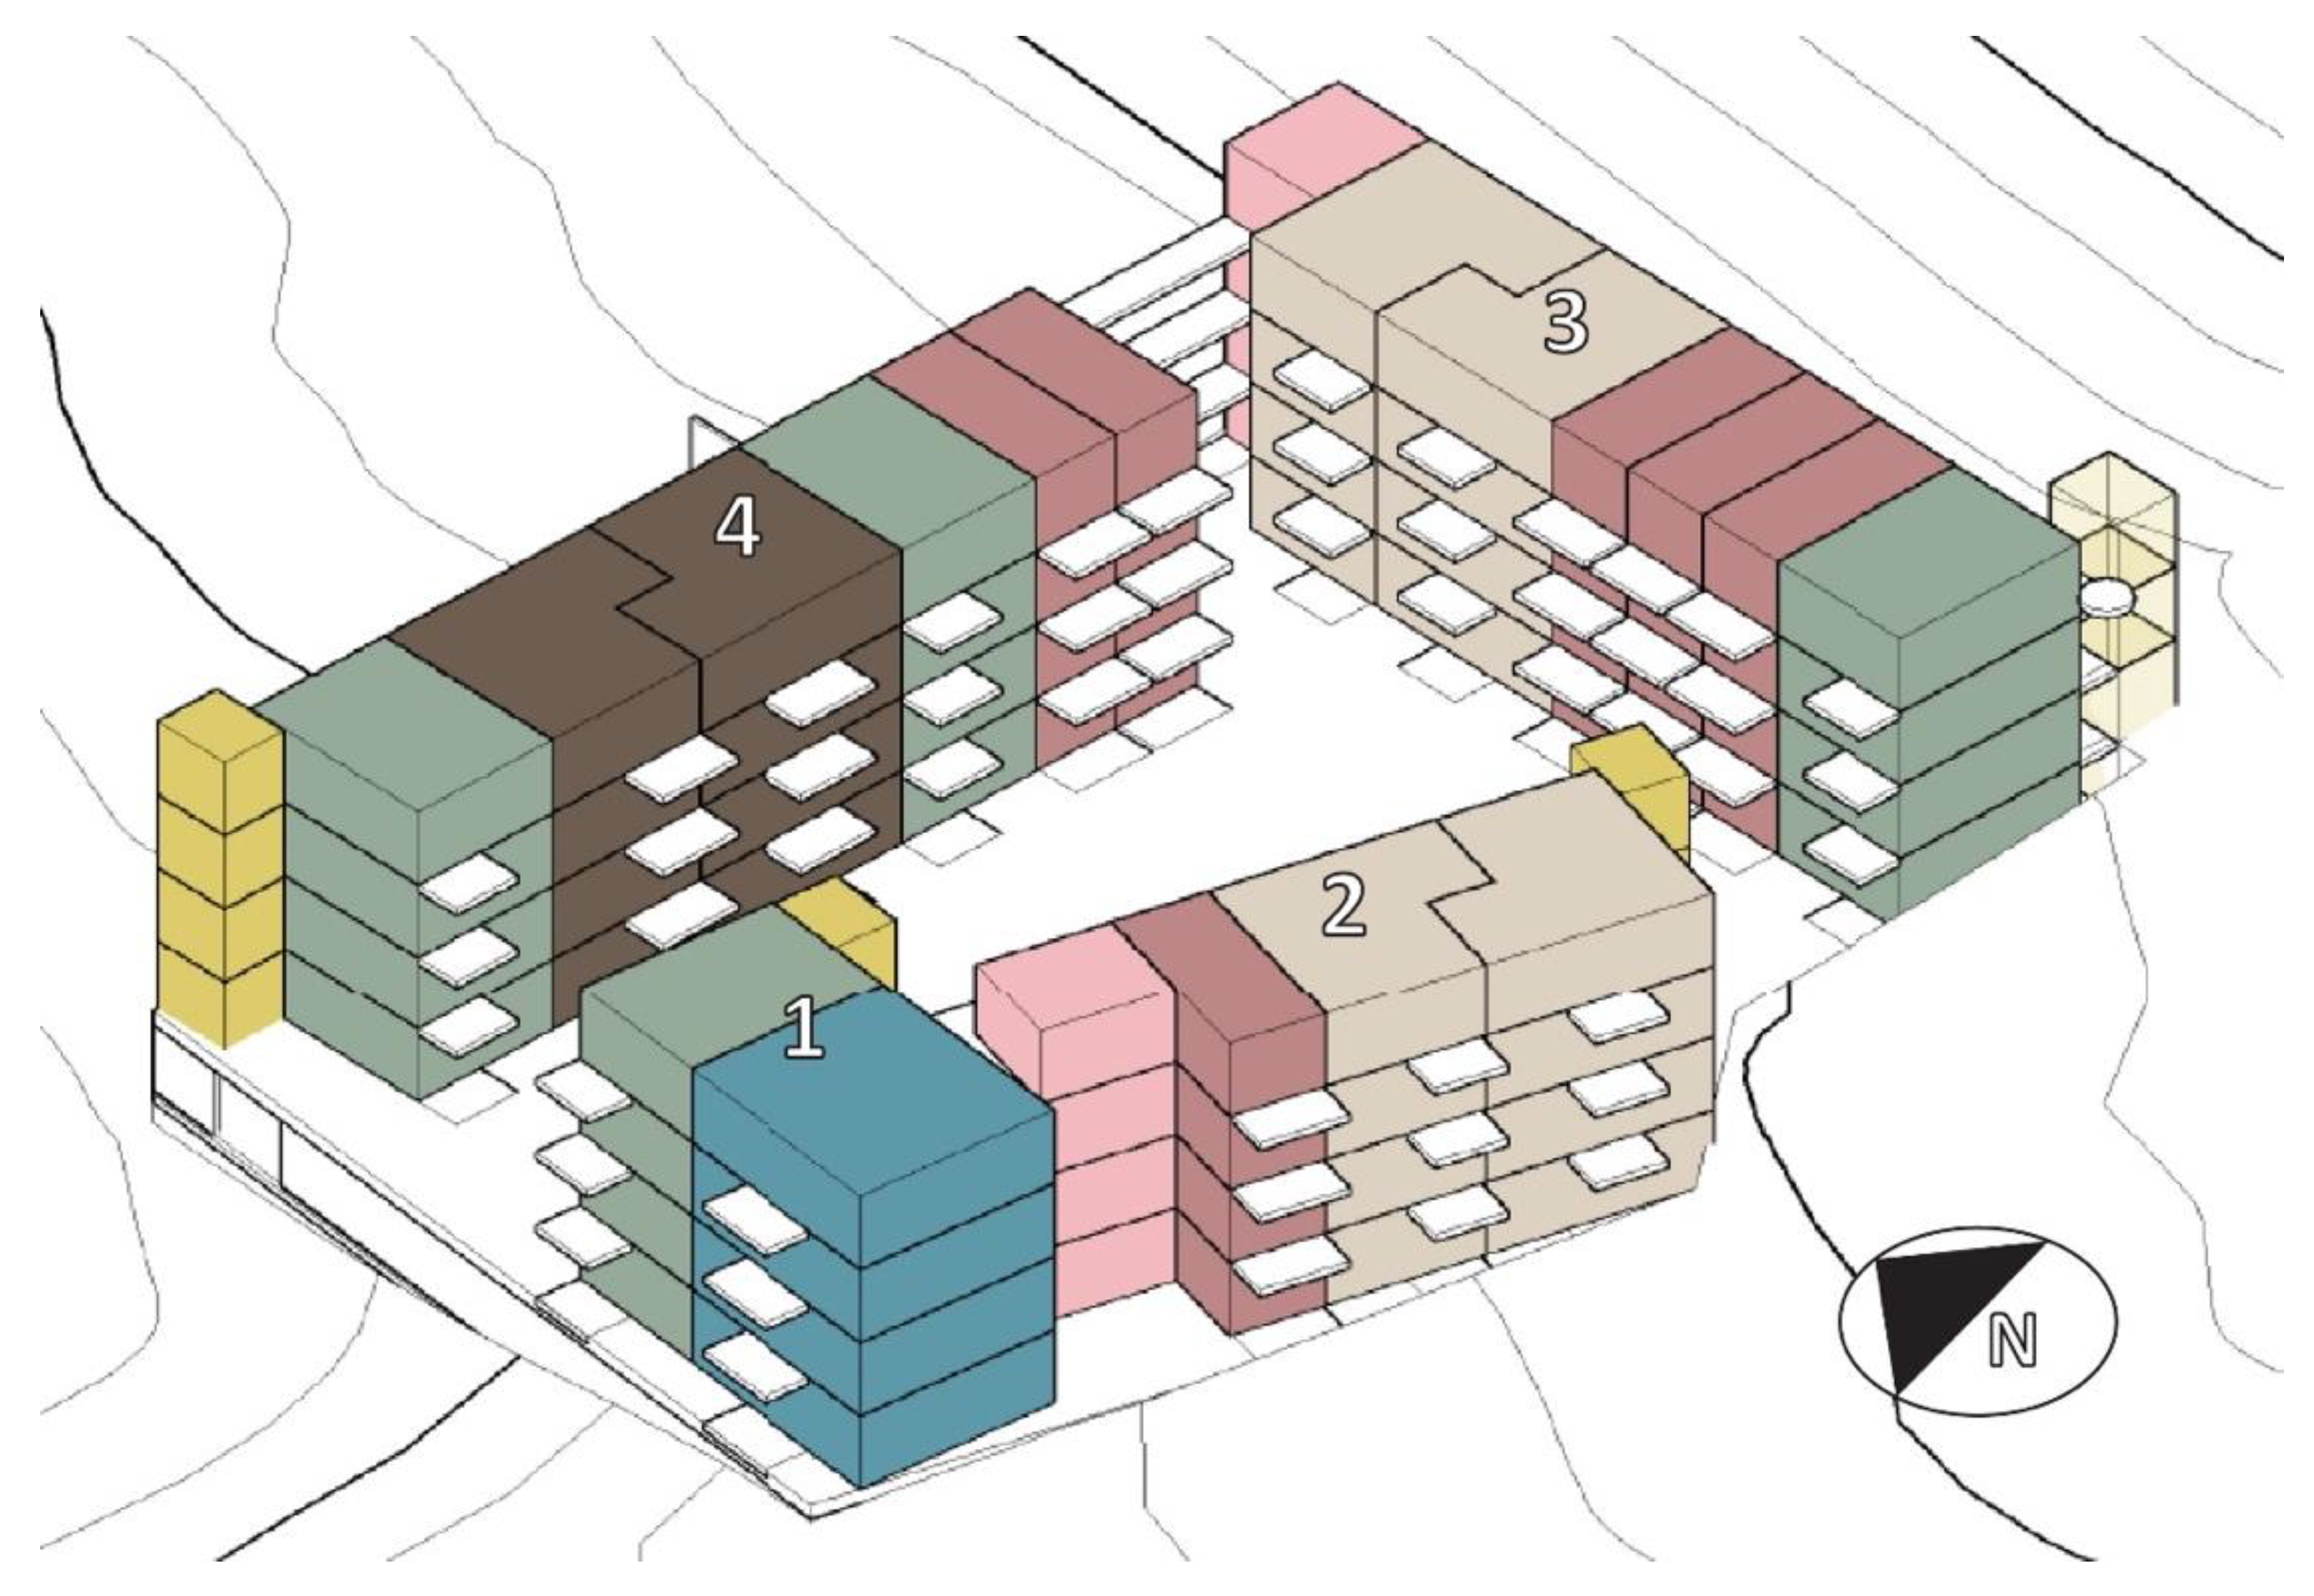
Figure 1. Perspective view of BoKlok Sørumsand development from the southeast. Image provided by BoKlok Norway.
Energies 15 09314 g001
Figure 2. Annual demand profile of heating with a variable setpoint temperature from annual simulation.
Energies 15 09314 g002
Figure 3. Annual demand profile of heating with a constant setpoint temperature from annual simulation.
Energies 15 09314 g003
Figure 4. Hourly demand profile for domestic hot water for 24 h (repeated).
Energies 15 09314 g004
Figure 5. Monthly demand profile from annual simulation of the three tested demands.
Energies 15 09314 g005
Figure 6. Flowchart of cost saving analyses.
Energies 15 09314 g006
Figure 7. Graphical representation of demand profile optimisation for a simple example of a heating element with a 5 kW capacity. Green shows placement of an hour’s demand at that timestep. Red shows where demand placement is not possible as the capacity of that timestep has already been reached.
Energies 15 09314 g007
Figure 8. Distribution of Nord Pool spot prices for the Oslo region for the last nine years. Average spot price indicated by the dashed line. 1 NOK ≈ 0.1 EUR.
Energies 15 09314 g008
Figure 9. Distribution of the price difference between the highest and lowest spot price in each 24 h period in a year, for the last nine years of spot price data. 1 NOK ≈ 0.1 EUR.
Energies 15 09314 g009
Figure 10. Correlation between price variation over a 24 h period and savings for scenario 1, excluding 2021. 1 NOK ≈ 0.1 EUR.
Energies 15 09314 g010
Figure 11. Average AEEF per hour as a function of tank volume for the three demand profiles at different maximum heating power using 2019 spot prices.
Energies 15 09314 g011
Figure 12. Effect of minimum setpoint temperature on AEEF as a function of tank volume. Result for constant setpoint heating and 80 kW heating power using 2019 spot prices.
Energies 15 09314 g012
Figure 13. Unit cost saving as a function of the tank volume for variable setpoint demand profile at different maximum heating power and minimum tank temperature using 2019 spot prices. 1 NOK ≈ 0.1 EUR.
Energies 15 09314 g013
Figure 14. Unit cost saving as a function of the tank volume for constant setpoint demand profile at different maximum heating power and minimum tank temperature using 2019 spot prices. 1 NOK ≈ 0.1 EUR.
Energies 15 09314 g014
Figure 15. Unit cost saving as a function of the tank volume for DHW demand profile at different maximum heating power and minimum tank temperature using 2019 spot prices. 1 NOK ≈ 0.1 EUR.
Energies 15 09314 g015
Figure 16. Average AEEF per hour as a function of tank volume for the three demand profiles at different maximum heating power using 2018, 2019 and 2021 spot prices.
Energies 15 09314 g016
Figure 17. Unit cost saving as a function of the tank volume for the three demand profiles at different maximum heating power using 2018, 2019 and 2021 spot prices. 1 NOK ≈ 0.1 EUR.
Energies 15 09314 g017
Figure 18. Annual cost saving from monthly fees as a function of maximum heating power for the three demand profiles. 1 NOK ≈ 0.1 EUR.
Energies 15 09314 g018
Figure 19. Total annual cost saving as a function of the tank volume for the three demand profiles at different maximum heating power using 2018, 2019 and 2021 spot prices. 1 NOK ≈ 0.1 EUR.
Energies 15 09314 g019
Table 1. Unit cost model for 1 kWh of electricity. 1 NOK ≈ 0.1 EUR.
Spot PriceGrid TariffEnergy TaxVAT
ElectricityHourly spot price0.070 NOK
(November through March)
0.039 NOK
(April through October)
0.1669 NOK+25%
Table 2. Monthly cost model for electricity [41]. 1 NOK ≈ 0.1 EUR.
PeriodFixed Cost/NOKPeak Cost (Max kW in the Month)/NOK/kW
December through February340120
March and November67
April through October22
Table 3. Annual savings in unit energy cost from shifting demand to lowest price within a 24 h period. Prices in NOK. 1 NOK ≈ 0.1 EUR.
201320142015201620172018201920202021
Scenario 1: Shifting from electricity to electricity
Constant3665371439247596402688594540347735,835
Variable4564443547379144492710,9165646400340,291
DHW4125265041075402379891545049209225,272
Scenario 2: Shifting from heat pump to heat pump maintaining COP
Constant (COP = 4)91692998118991006221511358698959
Variable (COP = 4)1141110911842286123227291412100110,073
DHW (COP = 3)1375883136918011266305116836978424
Scenario 3: Shifting from heat pump to heat pump with reduced COP
Con. (COP: 4 →2)10012035981238709
Var. (COP: 4 → 2)110224451301444827
DHW (COP: 3 → 1.5)140215641221724818
Scenario 4: Shifting from heat pump to electricity
Con. (COP: 4 → 1)00010030018
Var. (COP: 4 → 1)00014040016
DHW (COP: 3 → 1)0005301600126
Publisher’s Note: MDPI stays neutral with regard to jurisdictional claims in published maps and institutional affiliations.