Article

Exploring the Impacts of Banking Development, and Renewable Energy on Ecological Footprint in OECD: New Evidence from Method of Moments Quantile Regression

by
Magdalena Radulescu
1,2,*,
Daniel Balsalobre-Lorente
3,4,*,
Foday Joof
5,
Ahmed Samour
6 and
Turgut Türsoy
7
1
Department of Finance, Accounting and Economics, University of Pitesti, 110040 Pitesti, Romania
2
Institute for Doctoral and Post-Doctoral Studies, University Lucian Blaga Sibiu, 550024 Sibiu, Romania
3
Department of Applied Economics I, University Castilla La-Mancha, 13071 Cuenca, Spain
4
Department of Applied Economics, University of Alicante, 03690 Alicante, Spain
5
Centre for Financial Regulation and Risk Management, Banking and Finance Department, Eastern Mediterranean University, Famagusta 99628, Turkey
6
Department of Accounting, Dhofar University, Salalah 211, Oman
7
Banking and Finance Department, Near East University, Lefkosa 99040, Turkey
*
Authors to whom correspondence should be addressed.
Energies 2022, 15(24), 9290; https://doi.org/10.3390/en15249290
Submission received: 27 October 2022 / Revised: 23 November 2022 / Accepted: 3 December 2022 / Published: 7 December 2022

Abstract

:
Although previous related studies illustrate several factors that reduce and eliminate ecological pollution, empirical evidence that examines the impact of banking development on footprint ecological quality is missed. This study explores the impact of banking development, renewable energy consumption, and economic growth on the ecological footprint of 27 OECD countries spanning data from 1990 to 2018. Using the method of moments quantile regression (MMQR), the results indicated that a 1% increase in banking expansion is projected to augment the ecological footprint in the OECD nations across all quantiles (first to ninth). Thus, the results affirm that banking development dampens ecological sustainability in the OECD nations. In contrast, the results indicate that renewable energy promotes ecological sustainability in the OECD nations across all quantiles (first to ninth). The empirical findings suggest that OECD policymakers should regard banking and economic development as a “green energy fostering mechanism” while designing policies to promote ecological friend energy sources. Moreover, as part of their core mandates, central banks, and regulatory authorities should promote financial innovation in the banking sector to mobilize the required capital to facilitate nature conservation and restoration.

1. Introduction

The “2015 Paris Climate Conference (COP21)” put finance at the heart of the zero-emission scenario on environmental deprivation. Accordingly, global leaders have intended to scale up the “so-called green finance initiatives” to invest in low-carbon infrastructure and innovations [1]. For instance: the “burgeoning market for green bonds” (which finances projects that are less energy intensive and are friendly to the environment). The other initiatives entail the creation of a new development bank and forming a “green-credit department” at ICBC-China, the world’s biggest bank. These initiatives revealed the critical role of the development of the banking sector in the fight against ecological deprivation. However, to date, no empirical study that studied the link between banking sector development and ecological footprint in a panel context.
On the other hand, some scholars have narrowed it down by studying the consequences of FD (financial development) on the environment [2,3,4,5,6,7]. At this point, we beg to ask the question, are well-developed banking sectors harmful or beneficial to environmental sustainability? It is reasonable to believe that a flourishing banking industry will result in more investment and production of fossil fuels (non-renewable energy sources) in an unregulated sector, thus increasing environmental deprivation. Furthermore, the development of banking can also trigger ecological disasters since the financial market promotes economic expansion, enabling households to buy homes, cars, and appliances. These activities pressure the environment through the non-renewable energy demand and consumption channel [8].
Furthermore, the banking sector promotes industrialization by financing new factories and plants, which can trigger more water toxins and ecological deprivation [9]. However, banking development may promote a quality environment: a well-functioning financial market may promote and finance intensive investments in R&D and eco-friendly ventures [10,11]. Vis-à-vis, banks may increase lending to high-polluting sectors; this transition may incentivize corporations to shift to green innovations.
Furthermore, the environmental social and governance (ESG) classification and incentives may induce firms to embrace less energy-intensive ventures, thus improving air quality. Therefore, a better understanding of the link between the banking sector and the environment is critical because “global transition to a low-carbon economy will need to be funded by the private financial sector if international climate goals are to be met on time” [12]. Therefore, the intuition on the effects of banks on the environment is of utmost importance to assist authorities in gauging the ability of banking sector shocks to reduce pollution. Based on these two conflicting channels via which the banking sector may augment or decline ecological deprivation, as discussed above, the authors are motivated to investigate the potential effect of the banking sector on ecological footprint.
On the other hand, OECD economies have doubled their effect to accelerate renewable energy to abate unprecedented ecological degradation. In this sense, the OECD embraced the “technology push proposal Mission Innovation”, “announced in November 2015 at the United Nations Framework Convention on Climate Change’s 21st session of the Conference of the Parties”. The initiative aims to acutely augment public and private global renewable energy technology to tackle global warming, ensure relatively cheaper clean energy to consumers, and produce an avenue for commercial clean energy. This initiative has induced OECD nations to double their respective clean energy R&D (research and development) investments over the next five years [13].
Based on the arguments above, the authors are motivated to examine the link between baking development, renewable energy, and ecological footprint in OECD economies. Thus, the paper makes the following contributions: first, it is the first article to examine the effect of the banking sector on the ecological footprint in OECD countries. The OECD members are chosen based on the following: The OECD members are one of the main drivers of global warming, contributing about 35% of worldwide CO2 emissions [14]. Furthermore, they account for over 18% and 65% of the worldwide population and GDP, respectively [15]. Although the OECD has signed the 2015 Paris agreement, they are still heavily dependent on fossil fuels accounting for 80% of their total energy use.
Moreover, OECD nations recorded per capita emissions of 8.9 tons in 2018, whereas the rest of the globe has 4.3 tons [16]. Thus, pollution cannot be curbed without the OECD countries. Second, few articles concentrated on the effect of the banking sector on CO2 emissions [17] but focused on country-specific. However, to bridge this gap, we use footprint ecological as a broader proxy of the environment, which incorporates diverse scopes of indicators affecting the environment entailing “built-up land, forest land, carbon footprint, grazing land, cropland, and ocean” unlike CO2 emissions which measure only air pollution. Thirdly, the present work used panel Methods of Moments Quantile Analysis from 1990 to 2018. Finally, examining this relationship in the OECD nations provides new and substantial proof to help authorities benchmark and develop appropriate initiatives to combat ecological deprivation.
The residual of this paper is as follows: Following the data and models in part three, the second portion introduces an exhaustive literature study. Then, following the conclusion and policy implications in the final part, the empirical data and discussion are provided in Section 4.

2. Literature Review

2.1. Banking Development and Ecological Footprint Nexus

Multiple studies looked into how shifting financial markets affected carbon emissions, for example: [18,19,20,21]. They looked at how financial progress affected the rate of economic expansion and carbon emissions. Their research shows that increasing domestic lending to the private sector increased energy consumption, raising CO2 emissions. Consequently, these articles have shown that growth in the financial industry predominantly affects CO2 emissions. Moreover, Shahbaz et al. [22] looked at the connection between CO2 and the growth of Malaysia’s banking industry. The results demonstrated that financial progress and CO2 emissions are significantly correlated. By using “A panel vector autoregressive analysis (PVAR)”, Charfeddine and Kahia [23] found that financial development (FD) and CO2 levels in the MENA area from 1971 to 2011 were strongly correlated [24]. The United States used the “Autoregressive Distributed Lag (ARDL) model” to analyze the association of FD with control variables, including trade, energy utilization, and urbanization. The outcome revealed that financial development harms environmental quality through harmful pollutants due to increased CO2 emissions.
Recent empirical investigations that looked at the connection between FD and CO2 emissions include [25] G7 members, Majeed et al. [26] Pakistan, Rafique et al. [27] BRICS, Khezri et al. [28] Asia-specific countries, Yao and Tang [29] G20 members, Abid et al. [30] G8, and Battol et al. [31] East and South Asia, and [4] various developed and emerging countries. They used multiple techniques and periods to establish that financial development reduces CO2 emissions. A few studies, nevertheless, have concentrated on the role of the banking sector in CO2 emissions such as [32], that examined the significance of the banking industry’s growth in G7 and N-11 member countries. They revealed a positively significant connection in the N-11 member states but a negative connection in the G7 economies. Additionally, Samour [33] Turkey, Obiora et al. [34] developed, developing, and emerging countries, and Samour et al. [17] South Africa demonstrated that credit given to the commercial sectors plays a significant role in determining factors of CO2 emissions.

2.2. Renewable Energy and Ecological Footprint

The relationship between renewable energy (REC) and ecological footprint has received considerable attention, Abid et al. [30] explored the influence of REC on the EF in Saudi Arabia from 1980 to 2017. From the outcomes, renewable energy and human capital improve environmental quality, while economic growth and trade openness increase ecological footprint. Similar results have been presented by [35] in Asian Emerging countries, Usman et al. [36] Pakistan, Kahouli et al. [37] Saudi Arabia, [38,39] China, Kihombo et al. [5] Middle East nations, Rafique et al. [40] top ten economic complex countries, and Sarkodie [41] top global EF hotspot countries such as the USA, China, Russia, India, and Japan; Çakmak and Acar [42] conducted parallel research in oil-producing countries utilizing a two-step generalized moment of method (GMM) econometric approach. Their findings support the Pollution Haven Hypothesis by showing a considerable impact of economic expansion on ecological footprint while showing no significant impact of using renewable energy sources. Similar studies have been carried out [43] that explored the effect of fossil fuel, primary energy, economic growth, and renewable energy on the ecological footprint in China from 1971 to 2016. They found a positive effect of renewable energy on ecological footprint at a lower tail (0.1–0.40) and higher tail (0.70–0.95). However, fossil fuel, primary energy, and economic growth positively affect EF.

2.3. Economic Growth and Ecological Footprint

Scholars have also linked economic growth and EF. For instance, Balsalobre-Lorente et al. [44] affirmed the validity of a U and N-shaped between economic complexity and ecological footprint in PIIG nations. Similarly, Numan et al. [45] 85 countries also affirmed an N-Shaped link amid the economic activities and ecological footprint; Nawaz et al. [46] found a U-shaped in BRICS and OECD member nations [47], and MINT nations, indicating the absence of a U-shaped association amid economic expansion and environmental quality; Maranzano et al. [48] established a U-shaped relationship in the case of 17 European OECD nations. Moreover, 24 OECD countries [49] affirmed the validity of a U-shaped link between income and the environment. Additionally, 28 OECD nations [50] used a panel quantile from 1990 to 2014 to study the effect of EC on CO2 emissions. The outcome revealed that economic complexity tends to reduce air pollution. Using the GMM and the quantile model from 1990 to 2015 in OECD members, [51] investigated the “diversity of export products on carbon intensity”. They affirmed that economic expansion is detrimental to CO2.

3. Empirical Methodology

The current study deals with the empirical effects of banking development, renewable energy consumption, and economic growth, quadratic term of economic growth on the ecological footprint in 27 OECD countries from 1990 to 2018. The data were obtained from world bank development indicators and the global footprint network. We use ecological footprint as a more comprehensive proxy of ecological sustainability, which incorporates diverse scopes of indicators affecting the environment, such as “built-up land, forest land, carbon footprint, grazing land, cropland, and ocean”. Thus, a decline in ecological footprint will signify a reduction in ecological sustainability. All the variables were transformed into their natural logarithmic form as formulated below:
InEF   i t = f   ( InBD i t , InEG i t ,   InEG 2 i t , InREC i t )
InEF   i t = InBD i t , InEG i t , InEG 2 i t ,   InREC i t + ε i t
In Equations (1) and (2), where i = 1 , 2 , . . ,   N ,   number   of   countries . t = 1 , 2 , 3 ,   T   is   time ,   InEF   i t denotes log of ecological footprint, InBD i t is the log of banking development, InEG i t is economic growth, InEG 2 i t is the log of the squared term of economic growth and InREC i t is the log of renewable energy utilization. The description of the variables and the sample OECD countries are shown in Table 1 and Table 2 below:

3.1. Parameter Estimation Using AMG and CCEMG Approach

The study used the augmented mean group (AMG) assessment proposed by [55,56] and the common correlated effects mean group (CCEMG) method as suggested by [57] to assess the long run among the tested variables. The AMG tackles two main concerns of panel analysis (CD and heterogeneity) [58]. Moreover, the AMG also provides specified cross-sectional estimation parameters. The CCEMG also possesses similar merits and provides robust results for non-stationary series [59]. The manner they handle CD is the key difference between these two estimators. The AMG has annual dummy variables whilst the CCEMG has unobserved common factors that are proxied by averages (cross-sectional average) to tackle CD. Equation (2) is the CCE (Common Correlated Effects), and Equations (3) and (4) denote the CCEMG is estimated by taking the average of individual CCE results.
I n E F i , t = α i + γ i Χ i , t + i x ¯ t + ζ i I n E F ¯ t + ε i , t   f o r   i = 1 , . . N   a n d   t = 1 , . . T
Υ ^ C C E M G = N 1 i = 1 N Υ ^ C C E i    
S E ( Υ ^ C C E M G ) = N 1   [ i = 1 σ ( Υ ^ C C E i ) ]
where Υ ^ C C E i   denotes   the   results   from   Equation   3 .
Υ ^ C C E M G   is   the   coefficient ,   and   S E ( Υ ^ C C E M G )   is   the   standard   deviations   of   the   CCEMG
A M G S t a g e   i Δ I n E F i , t = ϕ i   + β i x i , t + t = 2 T c i Δ D t + e i , t c t = μ ^ t o
A M G S t a g e   i i   I n E F i , t = ϕ i   + β i x i , t + c i , t + d i μ ^ t o + e i , t
β ^ A M G = N 1 1 β ^ i
where ϕ i   is   constant , and e i , t is the error-term of stage (i) and stage (ii). β ^ A M G stands for cross-sectional group-specific AMG estimations.

3.2. Distributional Heterogeneity Analysis Using MMQR Approach

Due to limitations in the mentioned testing models, the MMQR (Method of Moments-Quantile-Regression) propounded by [60] is applied to evaluate the heterogeneous and distributional impacts across each quintile in the tested model. This approach helps uncover the covariance impacts under conditional heterogeneity as a primary determinant the energy consumption. In addition, the MMQR approach allows the individual effects to influence the whole distribution.
The location-scale variant of various quantiles estimates Q y ( τ|X ) is formulated as below:
Y i t = α i t + X i t   β + δ i + Z i t   γ μ i t
The probability and parameters P δ i + Z i t   γ > 0 } = 1 .   α ,   β ,   δ i ,   γ are to be measured. The i signifies discrete, and the fixed effect is captured by α i   ,   δ i .   i = 1 ,   ,   n ,   and   Z is K-vector examined components of X, which are differentiable transformations formulated based on cross-sections and across time
Z i = Z i X ,   i = 1 , 2 . , k
X i t is identically and separately disposed of across fixed ( i ) and time ( t ). μ i t represents distributed fixed cross-sections and via time (t), and it is orthogonal to X i t it is also standardized to accomplish the moment conditions. This is formulated and presented as follows:
Q y ( τ | X i t ) = ( α i t + δ i q   T ) + X i t   β + Z i t   γ q   T
X i t Symbolizes vectors of the regressors that augmented In E G , In R E C ,   I n B D , InEG2. Q y ( TX ) symbolizes the quantile allocation of the Y i t . X i t .   α i t T =   α i t + δ i q   T represents the coefficient of scalar, which is significant for the   quantile   T   fixed   impact   for   i   individual . Unlike the statistical “fixed least-squares” outcomes. The discrete impact indicates no intercept shift. The T t h e   s a m p l e   q u a n t i l e is represented by q T , which is formulated in the following equation.
ρ τ   Q = τ 1   Q I   Q 0 + τ Q I   Q > 0  
To assess the causal linkage among the focused variables, the present research utilized Dumitrescu and Hurlin causality test [61]. In this test, the non-homogeneous causality hypothesis H 0 is compared by two options: The first categorizes the interlink among two variables that have significant causal interlink, while the second is estimated by two examined variables with no important causal linkage.

4. Empirical Results

4.1. Cross-Sectional Dependence and Unit Root Test

First of all, we used cross-sectional dependence (CSD) assessment to assess cross-sectional dependence amid the explored variables. The outcomes of the CSD assessment are presented in Table 2. The findings showed that the null hypothesis of “no CSD” is not accepted. However, CSD results provide remarkable empirical evidence of CSD in InEF, InEG, InREC, and InBD at varying levels. We also employed two unit root assessments to determine whether the tested variables are integrated at level I(0) or first difference I(1). In this context, we have employed CIPS and IPS unit root assessments. The results of these assessments are shown in Table 3 and Table 4, which state that selected variables of the current work are stationary at the first difference; after confirming that our variables are either I(0) or I(1), we can now apply MMQ.

4.2. Cointegration Test Results

In Table 5, we tested for the long cointegration between the variables, propounded by [62]. Based on the cointegration test of Pedroni, the intercept and trend statistics suggest that five out of seven statistics rejected the H0 (null hypothesis) of no cointegration at 1% significance and accepted H1(alternative hypothesis) “The combination of the parametric (ADF-statistic) and panel nonparametric (t-statistic) is more reliable in constant plus time trend” [63]. Furthermore, we performed the Westerlund cointegration assessment [64] to assess the cointegration amid the variables. The outcomes of the Westerlund cointegration assessment (Table 6) illustrate that the series (InEF, InEG, InEG2 InREC, and InBD) are cointegrated in the long run. This is evidenced by the rejection of the H0 hypothesis of no cointegration at a 1% significance level.

4.3. Panel Analysis

After confirming cointegration, we utilized the CCEMG and AMG estimation tests. The empirical findings of these models are displayed in Table 7. These findings illustrated that economic growth positively and significantly affects the ecological footprint. These findings illustrated that 1% growth in economic expansion led to an increase in the ecological footprint of OECD economies by 2.013% and 1.186% in CCEMG, and AMG estimation models, respectively. This finding coincides with [65]. Hence, economic expansion triggers high energy consumption, which is the main driver of ecological deprivation. On the other hand, the squared term of economic growth was found to exhibit a negative relationship with the ecological footprint. Thus, this study confirms the validity of the environmental Kuznets curve hypothesis in OECD countries.
Moreover, the findings of CCEMG, and AMG tests illustrated that REC negatively and significantly affects ecological footprint. The empirical findings illustrated that a 1% growth in REC led to a decline in the ecological footprint in OECD economies by 0.395% and 0.365% in CCEMG, and AMG estimation models, respectively. The finding coincides with [17], who investigated the relationship in South Africa. This result explains that an increase in investment and production from green energy sources leads to a boost in ecological quality.
In addition, this finding showed that banking development positively and significantly affects the ecological footprint in OECD economies. A 1% growth in banking development raises the level of environmental pollution in OECD economies by 0.178% and 0.081% in CCEMG, and AMG tests, respectively. This evidence promotes the results verified by [17,33,66], who explored the impact of banking development on environmental quality in South Africa, G7 and N-11 economies, commonwealth countries, and Turkey, respectively. This result can be attributed to the fact that a flourishing banking industry will result in more investment and production of fossil fuel (non-renewable energy sources) in an unregulated sector, thus increasing environmental deprivation. Furthermore, the development of banking can also trigger ecological disasters since the financial market promotes economic expansion, enabling households to buy homes, cars, and appliances. Furthermore, the banking sector promotes industrialization by financing new factories and plants, which can trigger more water toxins and ecological deprivation [9]. These activities pressure the environment through the non-renewable energy demand and consumption channel [8].
The findings of the MMQR test are displayed in Table 8. The findings demonstrated that economic expansion has a positive influence on increasing environmental pollution in OECD economies. For all quantiles from the first to the ninth, the findings clearly show an upsurge in ecological footprint is triggered by an increase in economic growth from 1.3245 in the first quantile to 1.089 in the ninth quantile. Contrarily, the findings revealed that the quadratic term of economic growth improves ecological sustainability; this finding confirms the results from the CCEMG and AMG approach.
In contrast, the findings displayed that REC improves ecological quality in OECD economies. The results showed that the effect of REC increased from 0.471 in the first quantile to 0.714 in the ninth quantile. For all quantiles (1 to 9), the findings clearly show an upsurge in ecological footprint because REC is an important factor in improving the environmental quality in OECD economies. In addition, the outcomes demonstrated that banking sector development positively affected the level of environmental pollution in these economies. The outcomes demonstrated that increased banking development is detrimental to the environment. The results show an upsurge in ecological footprint from 0.121% to 0.064% between the first and ninth quantiles. The findings of the MMQR test affirm the analysis of the CCEMG and AMG estimation models.
Finally, as suggested by [61], the heterogeneous causality testing approach is unitized to assess the causality between the focused variables. The outcomes of this assessment are displayed in Table 9. The findings showed a unidirectional causality moving from InEG, InEG2, InREC, and InBD, to InEF. These findings affirmed the findings of CCEMG, AMG, and MMQR assessments. The analysis from the CCEMG, AMG and the MMQR are graphical repreentated in Figure 1 below:

5. Discussion of Findings

This paper aims to assess the consequences of banking and economic expansion and renewable energy consumption on the ecological footprint of 27 OECD countries spanning data from 1990 to 2018. The findings of the “CCEMG and AMG” tests illustrated that REC negatively and significantly affects EF. The findings demonstrated that growth in REC led to a decline in the ecological footprint in OECD. The finding coincides with [17], who investigated the relationship in South Africa.
However, banking development positively and significantly affects the ecological footprint in OECD economies, revealing that an increase in banking development raises the level of ecological deprivation in OECD economies. According to [67], banks produce more than 700 times of carbon emissions from their loan portfolios than their offices. Moreover, banks provide loans for businesses that may invest in the production of fossil fuel-related activities (non-renewable energy sources) and new factories and plants, especially in an unregulated sector, thus increasing environmental deprivation. Similarly, the development of banking can also trigger ecological disasters via financing household purchases such as cars and other hazardous appliances. These activities pressure the environment through the non-renewable energy demand and consumption channel [8].
In addition, the analysis showed that economic growth has a detrimental effect on ecological quality. This evidence is in line with the study of [47], who established a positive association between economic expansion and ecological deprivation in the case of OECD nations. This finding can be attributed to the fact that most OECD countries are fossil fuel-dependent nations and an increase in economic expansion augments energy utilization, which in turn triggers high ecological pollution and deprivation. Similarly, most OECD countries lack the resources to embrace green technologies; as such, their existing technologies are obsolete in abating ecological deprivation. However, the quadratic term of economic growth was found to enhance ecological sustainability, thus validating the EKC hypothesis. This suggests that in the initial phases of economic expansion (scale effect), pollutions increase due to high energy demand, leading to declining ecological quality. Eventually, economic growth reaches a turning point in the second phase called the composition effect, in which production processes are transformed from the agricultural and industrial sectors to the service sector. This transformation promotes ecological sustainability due energy efficient technologies. This finding affirmed the study of [48], who established a U-shaped relationship in the case of 17 European OECD nations, and [49], who also affirmed the validity of a U-shaped link between income and the environment in 24 OECD countries.
The findings of the MMQR also demonstrated that REC improves ecological quality in OECD economies. It revealed that the effect of REC increased from 0.471 in the first quantile to 0.714 in the ninth quantile. For all quantiles (1 to 9), the findings clearly show an upsurge in ecological footprint because REC is an important factor in improving the environmental quality in OECD economies. This result can be explained by the fact that an increase in investment in green energy sources leads to a decrease in the consumption of fossil fuel sources, which eventually promotes environmental quality by decreasing the negative influence of fossil fuel pollution on the environment. Moreover, oil prices are considered one of the main triggers of economic expansion and energy use at the detriment of ecological quality [67]. Thus, the unprecedented rising oil prices and declining cost of wind and solar energy might result in switching to cheaper and cleaner energy substitutes, thereby triggering a potential reduction in ecological risk.
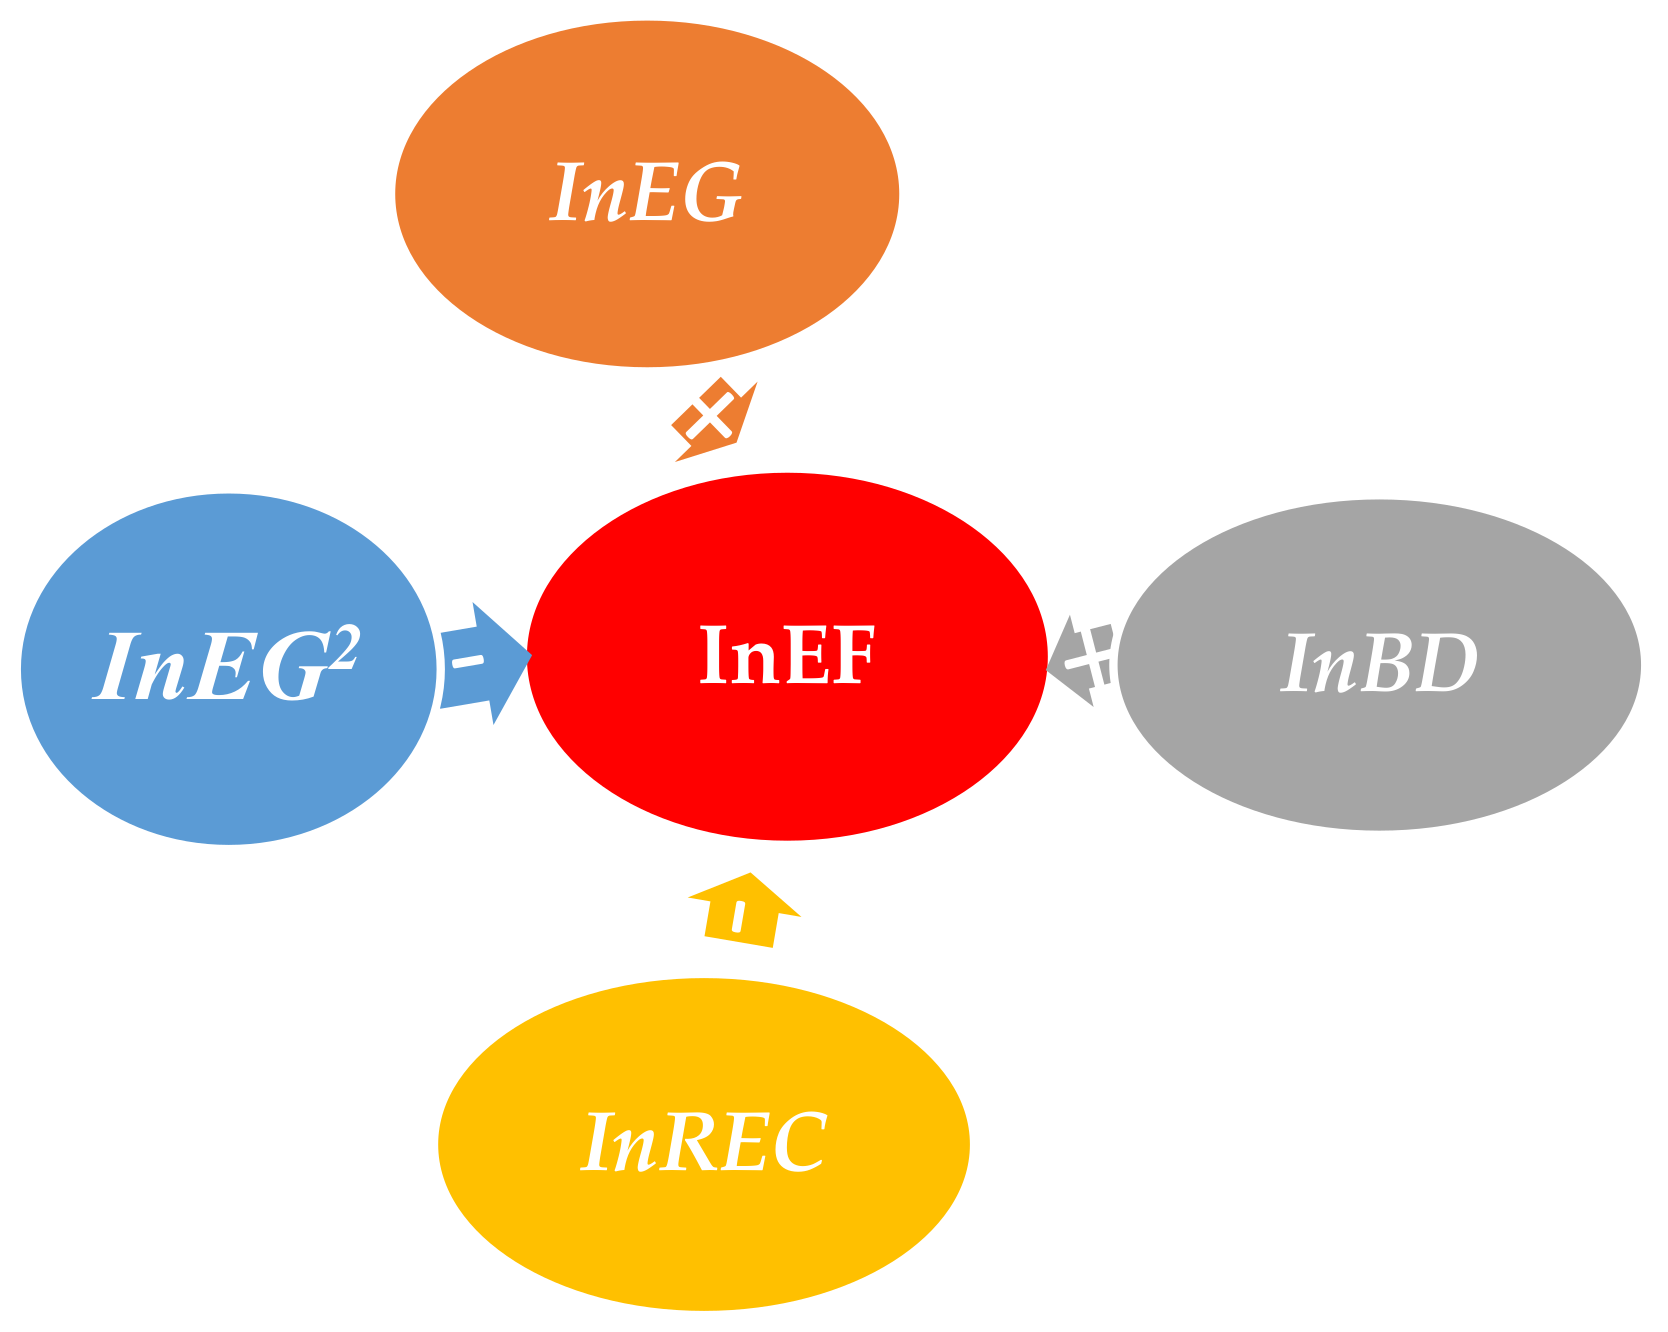
On the other hand, banking sector development positively affected the level of environmental pollution in these economies in all the quantiles. The outcomes demonstrated that increased banking development is detrimental to the environment. Likewise, economic expansion positively influences increasing environmental pollution in OECD economies. The findings indicated an upsurge in ecological footprint is triggered by an increase in economic growth from 1.3245 in the first quantile to 1.089 in the ninth quantile. Finally, as suggested by [61], the heterogeneous causality testing approach is unitized to assess the causality between the focused variables. The outcome of this is a unidirectional causality moving from InEG, InEG2, InREC, and InBD, to InEF. However, the study suggests that the banking sector has an influential role in promoting environmental quality by monitoring those corporations which accept funds from the banking sector to ensure ecologically friendly investments. The corporations that fail to abide by ecological standards and cause ecological pollution must be fined based on “environmental corporate social responsibility” and by increasing the interest rate allocated on such loans. Furthermore, the policymaker in OECD must promote the clean energy sector to promote energy efficiency and ecological sustainability.

6. Conclusions & Policy Implications

The OECD economies rely heavily on fossil fuels as their major power source, which has increased their environmental pollution over the past decades. On the other hand, the banking development in these economies has improved significantly over the last decades. The “2015 Paris Climate Conference (COP21)” put finance at the heart of the zero-emission scenario on environmental deprivation. Global leaders have intended to scale up the “so-called green finance initiatives” to invest in low-carbon infrastructure and innovations [1]. Are well-developed banking sectors harmful or beneficial to environmental quality? In this context, the paper investigated the effect of banking sector development and renewable energy on ecological footprint from 1990 to 2018 using moment quantile regression and the cointegration panel regressions (CCEMG and AMG). Through advanced quintile panel techniques, the empirical findings showed that a 1% surge in banking expansion is projected to augment EF across all quantiles (first to ninth).
Similarly, the findings showed % increase in economic growth is projected to increase ecological footprint across all quantiles (first to ninth). These results confirmed that banking development and economic growth dampen ecological sustainability in the OECD nations. In contrast, the empirical findings showed that a 1% surge in REC is projected to decline ecological deprivation across all quantiles (first to ninth). These results affirmed the positive influence of renewable energy on ecological sustainability in the OECD nations.
Having noted the banking sector in these countries was found to exhibit a detrimental effect on the environment, it is important to note that the banking sector has great potential in facilitating the pathway to low carbon emission. Banking development may promote a quality environment by financing intensive investments in R&D and eco-friendly ventures [10,11]. Vis-à-vis, banks may increase lending to high-polluting sectors; this transition may incentivize corporations to shift to green innovations. This must be supported by a transition plan that guides their customers towards greater sustainability. For this transition to be credible and effective, the Central Banks and regulatory authorities in these economies have to implement and supervise it by continuously assessing the effect of banks on the environment and the vulnerabilities of their portfolio to climate-related risk.
Therefore, policymakers should initiate and facilitate environmental risk capacity development for banks to be able to measure and assess their own risk. Moreover, regulatory authorities should develop a framework incorporating climate-related financial risk into the risk management function of the banks. Thus, this will enable banks to analyze their own carbon footprints and that of potential investors [68]. Likewise, the Basel Committee on Banking Supervision and Financial Stability Board should develop an international framework and risk matrix on climate-related risk to ensure harmonized policy coordination in abating ecological deprivation. Furthermore, as highlighted by Dasgupta’s Review of the Economics of Biodiversity notes, a significant portion of the responsibility for helping us to shift course will fall on the global financial system [69,70,71,72]. In light of this, as part of their core mandates, central banks, and regulatory authorities should promote financial innovation in the banking sector to mobilize the required capital to facilitate nature conservation and restoration. For example, this could be by offering green bond investment opportunities to the banks. Moreover, policymakers in these economies must use financial initiatives to promote ecological sustainability by providing lower finance costs for green investment. These financial initiatives will increase the productivity of green investment and improve energy efficiency, eventually mitigating the level of environmental pollution in the examined economies.
The lack of data for several studied items beyond 2018 is the main shortcoming of this study. However, the present study provided novel empirical evidence on the link between banking development and ecological pollution for high-emissions economies. Furthermore, the study provided significant implications to the examined economies that are on the way to reducing ecological pollution. Future empirical research should examine how the banking industry affects the degree of ecological sustainability using various panel approaches.

Author Contributions

M.R. conceptualization, writing original draft; D.B.-L.: supervision, reviewing and editing; F.J.: data curation, software; A.S.: analysis; T.T.: investigation. All authors have read and agreed to the published version of the manuscript.

Funding

This research received no external funding.

Data Availability Statement

The data presented in this study are openly available in [WDI] This data can be found here: [https://databank.worldbank.org/source/world-development-indicators, accessed on 25 September 2022].

Conflicts of Interest

The authors declare no conflict of interests.

References

  1. De Haas, R.; Popov, A. Working Paper Series Finance and Carbon Emissions; European Central Bank: Frankfurt, Germany, 2021. [Google Scholar] [CrossRef]
  2. Al-Silefanee, R.R.; Mamkhezri, J.; Khezri, M.; Karimi, M.S.; Khan, Y.A. Effect of Islamic Financial Development on Carbon Emissions: A Spatial Econometric Analysis. Front. Environ. Sci. 2022, 10, 850273. [Google Scholar] [CrossRef]
  3. Mesagan, E.P.; Olunkwa, C.N. Heterogeneous analysis of energy consumption, financial development, and pollution in Africa: The relevance of regulatory quality. Util. Policy 2021, 74, 101328. [Google Scholar] [CrossRef]
  4. Habiba, U.; Xinbang, C. The impact of financial development on CO2 emissions: New evidence from developed and emerging countries. Environ. Sci. Pollut. Res. Int. 2022, 29, 31453–31466. [Google Scholar] [CrossRef] [PubMed]
  5. Kihombo, S.; Ahmed, Z.; Chen, S.; Adebayo, T.S.; Kirikkaleli, D. Linking financial development, economic growth, and ecological footprint: What is the role of technological innovation? Environ. Sci. Pollut. Res. 2021, 28, 61235–61245. [Google Scholar] [CrossRef]
  6. Yu, B.; Fang, D. Decoupling economic growth from energy-related PM2.5 emissions in China: A GDIM-based indicator decomposition. Ecol. Indic. 2021, 127, 107795. [Google Scholar] [CrossRef]
  7. Bui, D.T. Transmission channels between financial development and CO2 emissions: A global perspective. Heliyon 2020, 6, e05509. [Google Scholar] [CrossRef]
  8. Baloch, M.A.; Zhang, J.; Iqbal, K.; Iqbal, Z. The efect of fnancial development on ecological footprint in BRI countries: Evidence from panel data estimation. Environ. Sci. Pollut. Res. 2019, 26, 6199–6208. [Google Scholar] [CrossRef]
  9. Wang, B.; Wang, Z. Imported technology and CO2 emission in China: Collecting evidence through bound testing and VECM approach. Renew. Sustain. Energy Rev. 2018, 82, 4204–4214. [Google Scholar]
  10. Zhao, J.; Shahbaz, M.; Dong, X.; Dong, K. How does financial risk afect global CO2 emissions? The role of technological innovation. Technol. Forecast. Soc. Chang. 2021, 168, 120751. [Google Scholar] [CrossRef]
  11. Shahbaz, M.; Jam, F.A.; Bibi, S.; Loganathan, N. Multivariate granger causality between CO2 emissions, energy intensity and economic growth in portugal: Evidence from cointegration and causality analysis. Technol. Econ. Dev. Econ. 2016, 22, 47–74. [Google Scholar] [CrossRef]
  12. United Nations Environment Programme (UNEP). Towards a Green Economy: Pathways to Sustainable Development and Poverty Eradication; United Nations Environment Programme (UNEP): New York, NY, USA, 2011. [Google Scholar]
  13. Baldwin, S.; Battey, H.; Bindewald, G., III; Bleich, N.; Birky, A.; Boedecker, E.; Bowen, M.; Boyd, E.; Boyd, L.; Capanna, S.; et al. Energy CO2 Emissions Impacts of Clean Energy Technology Innovation and Policy; U.S. Department of Energy: Washington, DC, USA, 2017.
  14. OECD. Environment at a Glance Indicators. 2019. Available online: https://oecd.org/environment/environment-at-a-glance/Climate-Change-Archive-December-2019.pdf (accessed on 25 September 2022).
  15. World Bank. World Development Indicators; World Bank: Washington, DC, USA, 2019. [Google Scholar]
  16. OECD Environmental Data and Indicators. Innovation in Environment-Related Technologies. 2020. Available online: https://stats.oecd.org/Index.aspx?DataSetCode=PAT_DEV (accessed on 25 September 2022).
  17. Samour, A.; Moyo, D.; Tursoy, T. Renewable energy, banking sector development, and carbon dioxide emissions nexus: A path toward sustainable development in South Africa. Renew. Energy 2022, 193, 1032–1040. [Google Scholar] [CrossRef]
  18. Park, Y.; Meng, F.; Baloch, M.A. The effect of ICT, financial development, growth, and trade openness on CO2 emissions: An empirical analysis. Environ. Sci. Pollut. Res. Int. 2018, 25, 30708–30719. [Google Scholar] [CrossRef] [PubMed]
  19. Ngoc, B.H.; Awan, A. Does financial development reinforce ecological footprint in Singapore? Evidence from ARDL and Bayesian analysis. Environ. Sci. Pollut. Res. 2022, 29, 24219–24233. [Google Scholar] [CrossRef] [PubMed]
  20. Shahbaz, M.; Solarin, S.A.; Mahmood, H.; Arouri, M. Does financial development reduce CO2 emissions in Malaysian economy? A time series analysis. Econ. Model. 2013, 35, 145–152. [Google Scholar] [CrossRef] [Green Version]
  21. Xu, Z.; Baloch, M.A.; Meng, F.; Zhang, J.; Mahmood, Z. Nexus between financial development and CO2 emissions in Saudi Arabia: Analyzing the role of globalization. Environ. Sci. Pollut. Res. Int. 2018, 25, 28378–28390. [Google Scholar] [CrossRef] [PubMed]
  22. Shahbaz, M.; Tiwari, A.; Nasir, M. The effects of financial development, economic growth, coal consumption and trade openness on CO2 emissions in South Africa. Energy Policy 2013, 61, 1452–1459. [Google Scholar] [CrossRef] [Green Version]
  23. Charfeddine, L.; Kahia, M. Impact of renewable energy consumption and financial development on CO2 emissions and economic growth in the MENA region: A panel vector autoregressive (PVAR) analysis. Renew. Energy 2019, 139, 198–213. [Google Scholar] [CrossRef]
  24. Dogan, E.; Turkekul, B. CO2 emissions, real output, energy consumption, trade, urbanization and financial development: Testing the EKC hypothesis for the USA. Environ. Sci. Pollut. Res. 2015, 23, 1203–1213. [Google Scholar] [CrossRef]
  25. Raheem, I.D.; Tiwari, A.K.; Balsalobre-Lorente, D. The role of ICT and financial development in CO2 emissions and economic growth. Environ. Sci. Pollut. Res. Int. 2019, 27, 1912–1922. [Google Scholar] [CrossRef] [Green Version]
  26. Majeed, M.T.; Samreen, I.; Tauqir, A.; Mazhar, M. The asymmetric relationship between financial development and CO2 emissions: The case of Pakistan. SN Appl. Sci. 2020, 2, 827. [Google Scholar] [CrossRef]
  27. Rafique, M.Z.; Li, Y.; Larik, A.R.; Monaheng, M.P. The effects of FDI, technological innovation, and financial development on CO2 emissions: Evidence from the BRICS countries. Environ. Sci. Pollut. Res. Int. 2020, 27, 23899–23913. [Google Scholar] [CrossRef] [PubMed]
  28. Khezri, M.; Karimi, M.S.; Khan, Y.; Abbas, S. The spillover of financial development on CO2 emission: A spatial econometric analysis of Asia-Pacific countries. Renew. Sustain. Energy Rev. 2021, 145, 111110. [Google Scholar] [CrossRef]
  29. Yao, X.; Tang, X. Does financial structure affect CO2 emissions? Evidence from G20 countries. Finance Res. Lett. 2020, 41, 101791. [Google Scholar] [CrossRef]
  30. Abid, A.; Mehmood, U.; Tariq, S.; Haq, Z.U. The effect of technological innovation, FDI, and financial development on CO2 emission: Evidence from the G8 countries. Environ. Sci. Pollut. Res. Int. 2022, 29, 11654–11662. [Google Scholar] [CrossRef]
  31. Batool, Z.; Raza, S.M.F.; Ali, S.; Abidin, S.Z.U. ICT, renewable energy, financial development, and CO2 emissions in developing countries of East and South Asia. Environ. Sci. Pollut. Res. Int. 2022, 29, 35025–35035. [Google Scholar] [CrossRef] [PubMed]
  32. Zafar, M.W.; Zaidi, S.A.H.; Sinha, A.; Gedikli, A.; Hou, F. The role of stock market and banking sector development, and renewable energy consumption in carbon emissions: Insights from G-7 and N-11 countries. Resour. Policy 2019, 62, 427–436. [Google Scholar] [CrossRef]
  33. Samour, A. Testing the impact of banking sector development on turkey’s CO2 emissions. Appl. Ecol. Environ. Res. 2019, 17, 6497–6513. [Google Scholar] [CrossRef]
  34. Obiora, S.C.; Bamisile, O.; Opoku-Mensah, E.; Kofi Frimpong, A.N. Impact of banking and financial systems on environmental sustainability: An overarching study of developing, emerging, and developed economies. Sustainability 2020, 12, 8074. [Google Scholar] [CrossRef]
  35. Saqib, N. Nexus between the renewable and nonrenewable energy consumption and carbon footprints: Evidence from Asian emerging economies. Environ. Sci. Pollut. Res. Int. 2022, 29, 58326–58340. [Google Scholar] [CrossRef]
  36. Usman, M.; Jahanger, A.; Radulescu, M.; Balsalobre-Lorente, D. Do Nuclear Energy, Renewable Energy, and Environmental-Related Technologies Asymmetrically Reduce Ecological Footprint? Evidence from Pakistan. Energies 2022, 15, 3448. [Google Scholar] [CrossRef]
  37. Kahouli, B.; Hamdi, B.; Nafla, A.; Chabaane, N. Investigating the relationship between ICT, green energy, total factor productivity, and ecological footprint: Empirical evidence from Saudi Arabia. Energy Strat. Rev. 2022, 42, 100871. [Google Scholar] [CrossRef]
  38. Afshan, S.; Yaqoob, T. The potency of eco-innovation, natural resource and financial development on ecological footprint: A quantile-ARDL-based evidence from China. Environ. Sci. Pollut. Res. Int. 2022, 29, 50675–50685. [Google Scholar] [CrossRef] [PubMed]
  39. Xu, L.; Wang, X.; Wang, L.; Zhang, D. Does technological advancement impede ecological footprint level? The role of natural resources prices volatility, foreign direct investment and renewable energy in China. Resour. Policy 2022, 76, 102559. [Google Scholar] [CrossRef]
  40. Rafique, M.Z.; Nadeem, A.M.; Xia, W.; Ikram, M.; Shoaib, H.M.; Shahzad, U. Does economic complexity matter for environmental sustainability? Using ecological footprint as an indicator. Environ. Dev. Sustain. 2022, 24, 4623–4640. [Google Scholar] [CrossRef]
  41. Sarkodie, S.A. Environmental performance, biocapacity, carbon & ecological footprint of nations: Drivers, trends and mitigation options. Sci. Total Environ. 2021, 751, 141912. [Google Scholar] [CrossRef]
  42. Çakmak, E.E.; Acar, S. The nexus between economic growth, renewable energy and ecological footprint: An empirical evidence from most oil-producing countries. J. Clean. Prod. 2022, 352, 131548. [Google Scholar] [CrossRef]
  43. Alola, A.A.; Adebayo, T.S.; Onifade, S.T. Examining the dynamics of ecological footprint in China with spectral Granger causality and quantile-on-quantile approaches. Int. J. Sustain. Dev. World Ecol. 2021, 29, 263–276. [Google Scholar] [CrossRef]
  44. Balsalobre-Lorente, D.; Ibáñez-Luzón, L.; Usman, M.; Shahbaz, M. The environmental Kuznets curve, based on the economic complexity, and the pollution haven hypothesis in PIIGS countries. Renew. Energy 2022, 185, 1441–1455. [Google Scholar] [CrossRef]
  45. Numan, U.; Ma, B.; Meo, M.S.; Bedru, H.D. Revisiting the N-shaped environmental Kuznets curve for economic complexity and ecological footprint. J. Clean. Prod. 2022, 365, 132642. [Google Scholar] [CrossRef]
  46. Nawaz, M.A.; Hussain, M.S.; Kamran, H.W.; Ehsanullah, S.; Maheen, R.; Shair, F. Trilemma association of energy consumption, carbon emission, and economic growth of BRICS and OECD regions: Quantile regression estimation. Environ. Sci. Pollut. Res. Int. 2021, 28, 16014–16028. [Google Scholar] [CrossRef]
  47. Joof, F.; Isiksal, A.Z. Do Human Capital and Export Diversification Decline or Augment CO2 Emissions? Empirical Evidence from the MINT Countries. J. Environ. Account. Manag. 2021, 9, 111–125. [Google Scholar] [CrossRef]
  48. Maranzano, P.; Cerdeira Bento, J.P.; Manera, M. The Role of Education and Income Inequality on Environmental Quality: A Panel Data Analysis of the EKC Hypothesis on OECD Countries. Sustainability 2022, 14, 1622. [Google Scholar] [CrossRef]
  49. Soberon, A.; D’Hers, I. The Environmental Kuznets Curve: A Semiparametric Approach with Cross-Sectional Dependence. J. Risk Financ. Manag. 2020, 13, 292. [Google Scholar] [CrossRef]
  50. Doğan, B.; Driha, O.M.; Lorente, D.B.; Shahzad, U. The mitigating effects of economic complexity and renewable energy on carbon emissions in developed countries. Sustain. Dev. 2021, 29, 1–12. [Google Scholar] [CrossRef]
  51. Bashir, M.A.; Sheng, B.; Doğan, B.; Sarwar, S.; Shahzad, U. Export product diversification and energy efficiency: Empirical evidence from OECD countries. Struct. Chang. Econ. Dyn. 2020, 55, 232–243. [Google Scholar] [CrossRef]
  52. Im, K.S.; Pesaran, M.; Shin, Y. Testing for unit roots in heterogeneous panels. J. Econ. 2003, 115, 53–74. [Google Scholar] [CrossRef]
  53. Pesaran, M.H. A simple panel unit root test in the presence of cross-section dependence. J. Appl. Econ. 2007, 22, 265–312. [Google Scholar] [CrossRef] [Green Version]
  54. Pesaran, M.H. General diagnostic tests for cross section dependence in panels. Empir. Econ. 2021, 60, 13–50. [Google Scholar] [CrossRef]
  55. Eberhardt, M.; Teal, F. Productivity Analysis in Global Manufacturing Production. 2010. Available online: https://ora.ox.ac.uk/objects/uuid:ea831625-9014-40ec-abc5-516ecfbd2118/download_file?file_format=pdf&safe_filename=paper515.pdf&type_of_work=Working+paper (accessed on 15 September 2022).
  56. Eberhardt, M.; Bond, S. Cross-Section Dependence in Non-Stationary Panel Models: A Novel Estimator; MPRA Paper 17692; University Library of Munich: Munich, Germany, 2009. [Google Scholar]
  57. Pesaran, M.H. Estimation and Inference in Large Heterogeneous Panels with a Multifactor Error Structure. Econometrica 2006, 74, 967–1012. [Google Scholar] [CrossRef] [Green Version]
  58. Dogan, E.; Ulucak, R.; Kocak, E.; Isik, C. The use of ecological footprint in estimating the Environmental Kuznets Curve hypothesis for BRICST by considering cross-section dependence and heterogeneity. Sci. Total Environ. 2020, 723, 138063. [Google Scholar] [CrossRef]
  59. Guzel, A.E.; Okumus, I. Revisiting the pollution haven hypothesis in ASEAN-5 countries: New insights from panel data analysis. Environ. Sci. Pollut. Control Ser. 2020, 1–11. [Google Scholar] [CrossRef] [PubMed]
  60. Machado, J.A.; Silva, J.S. Quantiles via moments. J. Econom. 2019, 213, 145–173. [Google Scholar] [CrossRef]
  61. Dumitrescu, E.I.; Hurlin, C. Testing for Granger non-causality in heterogeneous panels. Econ. Model. 2012, 29, 1450–1460. [Google Scholar] [CrossRef] [Green Version]
  62. Pedroni, P. Purchasing Power Parity Tests in Cointegrated Panels; Department of Economics Working Papers No 1; Williams College: Williamstown, MA, USA, 2001. [Google Scholar]
  63. Pedroni, P. Critical values for cointegration tests in heterogeneous panels with multiple regressors. Oxf. Bull. Econ. Stat. 1999, 61 (Suppl. 1), 653–670. [Google Scholar] [CrossRef]
  64. Westerlund, J. Testing for error correction in panel data. Oxf. Bull. Econ. Stat. 2007, 69, 709–748. [Google Scholar] [CrossRef] [Green Version]
  65. Isiksal, A.Z.; Assi, A.F.; Zhakanov, A.; Rakhmetullina, S.Z.; Joof, F. Natural resources, human capital, and CO2 emissions: Missing evidence from the Central Asian States. Environ. Sci. Pollut. Res. 2022, 29, 77333–77343. [Google Scholar] [CrossRef] [PubMed]
  66. Isiksal, A.Z.; Joof, F. Impact of bank performance on energy consumption: Evidence from selected commonwealth member states. Int. J. Glob. Energy Issues 2021, 43, 402–418. [Google Scholar] [CrossRef]
  67. Bloomberg 2021. Available online: https://www.bloomberg.com/news/articles/2021-04-27/banks-produce-700-times-more-emissions-from-loans-than-offices?leadSource=uverify%20wall (accessed on 1 November 2022).
  68. Joof, F.; Samour, A.; Tursoy, T.; Ali, M. Climate change, insurance market, renewable energy, and biodiversity: Double-materiality concept from BRICS countries. Environ. Sci. Pollut. Res. 2022, 1–14. [Google Scholar] [CrossRef]
  69. Dasgupta, P. The Economics of Biodiversity: The Dasgupta Review; Abridged Version; HM Treasury: London, UK, 2021. [Google Scholar]
  70. Zhang, L.; Li, Z.; Kirikkaleli, D.; Adebayo, T.S.; Adeshola, I.; Akinsola, G.D. Modeling CO2 emissions in Malaysia: An application of Maki cointegration and wavelet coherence tests. Environ. Sci. Pollut. Res. 2021, 28, 26030–26044. [Google Scholar] [CrossRef]
  71. Kartal, M.T.; Samour, A.; Adebayo, T.S.; Depren, S.K. Do nuclear energy and renewable energy surge environmental quality in the United States? New insights from novel bootstrap Fourier Granger causality in quantiles approach. Prog. Nucl. Energy 2022, 155, 104509. [Google Scholar] [CrossRef]
  72. Wang, C.; Raza, S.A.; Adebayo, T.S.; Yi, S.; Shah, M.I. The roles of hydro, nuclear and biomass energy towards carbon neutrality target in China: A policy-based analysis. Energy 2022, 262, 125303. [Google Scholar] [CrossRef]
Figure 1. Graphical abstract for summarizing results of CCEMG, AMG, MMQR approach & causality test.
Energies 15 09290 g001
Table 1. Description and sources of data.
Variables Description Source
lnEF i t global hectares per capita(GFN)
  lnBD i t domestic credit provided by the banking sector as share of GDP (WB)
InEG 2 i t Squared term of GDP(WB)
InREC i t Renewable energy (wind, solar, hydropower, bioenergy) share of total energy consumption. (WB)
InEG i t GDP (constant 2015 US$)(WB)
Source of the data World-Bank(WB) and Global Footprint Network (GFN).
Table 2. Sample OECD countries used in this study.
Austria Denmark Hungary MexicoSpain USA
Australia Finland İtaly Netherlands Sweeden Ireland
Belgium France Japan New zealand Switzerland UK
Canada Germany South Korea Norway Turkiye Poland
Czech Greece Luxembourg
Source: authors Before evaluating the nexus among the focused variables, the study employed Im, [52], and (IPS) unit root and Cross-sectionally augmented Im-Pesaran-Shin (CIPS) Panel as suggested by [53] to assess the level of the station among the tested variables. Furthermore, the study employed cross-sectional dependence (CD) to evaluate cross-sectional dependence in the focused panel data [54].
Table 3. The findings of Im, Pesaran, and Shin unit root test.
VariableI(0)I(0)I(1)I(1)
CC&TCC&T
InEF −0.689−0.655−7.651 ***−7.951 ***
InEG −0.778−1.794−6.975 ***−8.298 ***
InREC −0.401−0.620−7.487 ***−9.364 ***
InBD −1.344−1.117−8.089 ***−8.112 ***
*** represents 1% significance level.
Table 4. The findings of CD and CIPS unit root tests.
VariableCD Testp-Value CIPS Test
Level1st Difference
InEF 19.741 0.00 −0.346−8.980 ***
InEG 21.458 0.00 −1.117−7.655 ***
InREC 18.320 0.00 −0.335−7.711 ***
InBD 18.441 0.00 −1.851−7.468 ***
*** represents 1% significance level.
Table 5. The findings of the Pedroni cointegration test.
Stats.Prob.
InEF = f (InEG, InEG2, InREC, InBD)
Pane l v 1.0250.125
Pane l rho −3.411 ***0.000
Pane l PP −6.558 ***0.000
Pane l rho −6.487 ***0.000
Alternative hypothesis: individual AR coefficient
Group P0.5110.305
Group PP−9.975 ***0.000
Group ADF−11.428 ***0.000
*** represents 1% significance level.
Table 6. The findings of the Westerlund cointegration test.
StatisticsValueZ Valuep-Value
Gt−9.235 ***−4.3350.00
Ga−7.708 ***−3.1180.00
Pt−5.581 ***−4.3760.00
Pa−8.775 ***−5.6520.00
*** represents 1% significance level.
Table 7. The outcomes of CCEMG and AMG.
CCEMG TestAMG
VariableCoeff.t-StatsProbCoeff.t-StatsProb
In EG 1.618 ***5.7680.0001.986 ***4.7650.000
InE G 2 −0.895 ***−4.8470.000−0.821 ***−3.1680.000
InREC −0.268 ***−3.4560.000−0.236 ***−4.3510.000
InBD 0.091 ***4.9650.0000.078 ***4.6580.000
*** represents significance level at 1%.
Table 8. The findings of the MMQR approach.
Quantiles
Variables 0.10 0.20 0.30 0.40 0.50 0.60 0.70 0.80 0.90
InEG 2.975 ***2.780 ***2.686 **2.321 ***2.201 ***2.065 ***1.963 ***1.758 ***1.685 ***
InE G 2 −0.752 ***−0.795 ***−0.797 ***−0.832 ***−0.865 ***−0.870 ***−0.908 ***−0.944 ***−0.985 ***
InREC −0.110 **−0.117 **−0.196 **−0.201 **−0.215 **−0.236 **−0.244 **−0.265 *−0.287 *
InBD 0.117 **0.113 **0.109 **0.108 *0.103 *0.099 *0.091 *0.089 *0.081 *
*, **, *** represents significance level at 10%, 5%, and 1%.
Table 9. The results of Panel Causality assessments.
Null HypothesesZ-Barp-Value
InEG does not homogenously cause InEF 8.841 ***0.000
InEF does not homogenously cause InEG 0.3500.897
InE G 2 does not homogenously cause InEF 0.9760.481
InEF does not homogenously cause InE G 2 1.7310.186
InREC does not homogenously cause InEF 7.965 ***0.000
InEF does not homogenously cause InREC 0.8750.538
InBD does not homogenously cause InEF 7.084 ***0.000
InEF does not homogenously cause InBD 0.4800.871
*** represent the significance of the focused variables at 1% level.
Publisher’s Note: MDPI stays neutral with regard to jurisdictional claims in published maps and institutional affiliations.

