Article

Study on the Performance of a Newly Designed Cooling System Utilizing Dam Water for Internet Data Centers

1
Graduate School of Department of Mechanical Engineering, Hanbat National University, Daejeon 34158, Republic of Korea
2
Lucky Core Insulating Materials Manufacturing, LLC, Dubai, United Arab Emirates
3
Department of Mechanical Engineering, Kwame Nkrumah University of Science and Technology, PMB, Kumasi AK-039-5028, Ghana
4
Department of Architecture, Korea University, Seoul 02841, Republic of Korea
5
Department of Mechanical Engineering, Hanbat National University, Daejeon 34158, Republic of Korea
*
Author to whom correspondence should be addressed.
Energies 2022, 15(24), 9274; https://doi.org/10.3390/en15249274
Submission received: 31 October 2022 / Revised: 1 December 2022 / Accepted: 5 December 2022 / Published: 7 December 2022

Abstract

:
A novel energy-saving hybrid cooling system that combines a forced-cooling cycle and a free-cooling cycle was developed to increase the energy efficiency of cooling systems in year-round operation of an internet data center with high heat loads. This system effectively utilizes a dam deep water source to reduce energy consumption in internet data centers. The hybrid cooling system operates in forced-cooling mode when the entering water temperature exceeds the mode change temperature of 9 °C, but switches to free-cooling mode when the ambient temperature falls below the mode change temperature. In this paper, the cooling performance of the hybrid system was assessed under various operating conditions based on entering water temperature fluctuation. Because the cooling effectiveness of this type of system is highly dependent on the outside climate, its usefulness and suitability for different periods and zones must be investigated. The annual energy saving performance of the new system was estimated and compared to a conventional cooling system in terms of the integrated coefficient of performance, based on the hourly weather air temperature and water temperature bin data collected from 16 cities of different climate zones in South Korea. The experimental findings revealed that the novel hybrid internet data center cooling system showed a 67% annual operating performance over a conventional air source internet data center cooling system due to the adoption of a dam deep water source.

1. Introduction

Internet data center (IDC) refers to a complex infrastructure that accommodates information technology (IT) and electronic equipment, cooling, and power systems to collect, store, process, and transmit massive amounts of data for economic and social networking. The IDC facility serves as a secure and reliable working environment to ensure better performance and stability of IT equipment [1,2].
As a consequence of the rapid optimization of electronic components coupled with the daily demanding operation of the IDC for cloud service, a significant amount of heat is discharged by the electronic devices, raising the facility’s temperature and potentially affecting the performance of the IT equipment [3]. Therefore, an energy-efficient cooling system is required to withdraw the heat produced to ensure efficient thermal management and the reliable and safe working condition of the IDC by controlling air temperature, humidity, and particle density within the facility. The cooling system must have a stable and efficient cooling capacity to operate throughout the year [3,4]. According to reports and studies in open literature, cooling systems account for 30–50% of total energy consumption in a typical IDC infrastructure; therefore, lowering cooling energy consumption is critical to reducing the overall energy consumption in an IDC [5,6].
The conventional air source IDC cooling system requires a constant power supply for year-round cooling [7]. The inefficient energy performance of these traditional cooling systems encourages system design engineers to research sustainable solutions to optimize the overall performance of the IDC [8]. With the increasing demand for server performance, the energy efficiency and reliability of high-density data centers are improving through hybrid cooling systems integrating free-cooling technology and mechanical vapor compression refrigeration systems [9]. Free-cooling technology removes heat from the interior by using natural free sources (air or water). If the IDC is completely cooled using a free-cooling cycle, the operating hours of vapor compression refrigeration can be reduced or turned off, resulting in lower energy consumption and improved power usage effectiveness (PUE) [10].
Most of the studies conducted on the hybrid cooling system for IDCs have focused on the utilization of air-source. However, studies on IDC hybrid cooling systems utilizing natural cold water as a common heat source for both free-cooling and forced-cooling are very limited in open literature. With the improvement of IT equipment, and the increasing number and size of IDCs, there has been a challenge in utilizing air as a heat source to meet the cooling requirements of electronic chips and servers [3]. Therefore, to enhance the cooling performance and reliability of the hybrid cooling system, this paper proposed a novel IDC hybrid cooling system operating in two modes: free-cooling mode and forced-cooling mode utilizing a deep water source from a dam as a heat sink. Furthermore, a quantitative analysis is carried out to investigate the performance of the proposed cooling system according to the variation of deep-water source temperature (entering water temperature). Finally, the energy consumption of the new system is evaluated and compared with that of a conventional cooling system in a selected region. The use of circulating natural water is anticipated to help reduce energy consumption of the cooling system by reducing the operating hours of the vapor compression mode as compared to the conventional cooling system; therefore, the PUE, which considers power usage in the data center without external energy input or output, is predicted to improve due to the improvement in energy savings for the novel hybrid cooling system.

2. Literature Review

As mentioned previously, increasing the efficiency of the application of the IDC cooling system is a critical concern. Most integrated cooling systems adopt air as a natural heat source to investigate the performance according to variations of the outdoor (OD) temperature. Wang et al. [11] proposed a predictive control model to explore the energy savings potential of hybrid cooling technology for telecommunication stations. The hybrid cooling system operates in both ventilation cooling mode and air conditioning cooling mode. Han et al. [12] built a model to predict the transient performance of a hybrid evaporative cooling system with heat pipe. The results showed that the innovative integrated cooling system had a better energy efficiency, a reduction of 31.31% of energy consumption, and a gain of 29.49% of the coefficient of performance (COP) as a result of the implementation of the evaporative condenser. Zhang et al. [9] developed an energy consumption model for data centers using a hybrid system of thermosyphon-free cooling and vapor compression refrigeration; they discovered that the hourly energy usage varies with OD temperature and is significantly lower in the winter.
Yan et al. [8] presented a new energy-saving cooling system for data centers that incorporates a liquid refrigerant pump cycle and a vapor compressor cycle. When the ambient temperature is quite low, it was discovered that the hybrid cooling system has a greater energy efficiency ratio (EER) than the typical vapor compression system. Sun et al. [13] designed and experimentally tested an integrated cooling system for data centers. The system operates in three different modes: vapor compression mode, dual refrigeration mode, and heat pipe mode, according to OD temperature variation. Their study noted that the lower the OD air temperature, the greater the reduction in its annual energy use.
Liu et al. [14] conducted an analytical study on the energy-saving potential of a designed heat pipe-dew point evaporative cooler hybrid cooling system utilizing natural cold air as heat source and compared it to a traditional vapor compression refrigeration system. The results demonstrated that the optimum hybrid refrigeration system has average annual COP of 3.3 and 3.4, resulting in yearly energy savings of more than 90% compared to vapor compression refrigeration. Wang et al. [7] suggest a data center hybrid cooling system that combines a heat pipe cooling cycle and a vapor compression cycle that operates in response to variations in ambient temperature. Ma et al. [15] experimentally investigated a cooling system that integrated a vapor compression cycle and refrigerant pump-driven two-phase cycle for a data center to evaluate the energy efficiency ratio in both modes. Meng et al. [16] developed a novel hybrid system and measured its performance and energy consumption for a 5G telecommunication base station.
For the application of OD cold water as a heat source for IDC hybrid system, Wang et al. [17] developed a model to experimentally analyze the reliability and operational availability of a hybrid cooling system in Chenzhou, China, that uses cold lake water to cool the data center. The authors concluded that in free-cooling mode, the lake water sink can fully recover the cooling load, and the overall system’s failure rate lowers by 64.22%, giving it a greater reliability performance than a traditional chiller cooling system. In addition, Wang et al. [18] looked at the effects of various faults on the control performance of the data center water-source hybrid cooling system in Chenzhou, China.

3. Experimental Setup and Procedure

Figure 1 is a schematic of the conventional IDC cooling system that runs on a vapor compression cycle. It consists of a compressor, electronic expansion device (EEV), fin type heat exchangers for evaporator, and condenser units. The packaged indoor (ID) system consists of the compressor, EEV, and evaporator, while the condenser makes up the OD unit. The refrigerant R407C used in this system serves as the primary fluid, while the ID and OD air serve as the source and sink secondary fluids, respectively. The cycle operates in cooling mode annually irrespective of the OD air temperature changes. The refrigerant absorbs heat from the data center via the evaporator, changes phase to saturated vapor, and rejects the absorbed heat to the OD air via the condenser. During operation, the refrigerant absorbs heat from the data center ID space via the evaporator, changes phase to saturated vapor, and rejects the absorbed heat to the OD air via the condenser. It changes phase to saturated liquid and the cycle repeats.
Figure 2 shows the schematic diagram of the novel hybrid IDC cooling system utilizing a deep water source from a dam. The hybrid IDC cooling system operates in two modes—namely, forced-cooling and free-cooling—according to the entering water temperature. The forced-cooling mode consists of a multifunction heat exchanger operating as an evaporator, a plate heat exchanger operating as a condenser, a compressor, and an electronic expansion valve. A constant temperature bath representing a deep-water source from a dam and a pump to circulate the water from the bath is used in the study. In forced-cooling mode, refrigerant R407C absorbs heat from the IDC space and enters the compressor at a superheated state, where it is compressed to a high temperature-high pressure state. The refrigerant then rejects the heat in the plate heat exchanger with the circulating water from the bath. It is subcooled, then expands through the expansion valve and to the evaporator. The water is circulated through the plate heat exchanger as the secondary fluid to exchange heat with the refrigerant flowing through the plate heat exchanger. The solid black and red line represents the refrigerant line and secondary water loop, respectively. In free-cooling mode, the water is circulated directly through the multifunction evaporator to exchange heat directly with the ID air. The free-cooling mode only utilizes the circulating pump and multifunction heat exchanger for heat exchange. The dotted line represents the water flow loop for the free-cooling mode.
The experiments were carried out in a psychrometric chamber according to ISO 1356-2 [19], at standard test conditions for a water-source heat pump. ANSI/ASHRAE standard 127 [20] and AHRI standard 1361 [21] were used to calculate the performance rating of the data center cooling system and the air enthalpy capacity, respectively. The performance of the system was measured under various ID and OD air temperature conditions and at entering water temperature (EWT). The air handling unit (AHU) was used to set the required temperatures in the ID room, while refrigeration and heating units were used for the water bath. The flow rate of air across the evaporator was measured by an air flow chamber according to the ANSI/AMCA 210 [22] standard, while a mass flow meter was used to measure the rate of water flowing across the plate heat exchanger. Temperature and pressure sensors were also set to measure experimental data at various points of the system. Steady state was maintained for 30 min, and the Yokogawa MX100 data logger was used to record average data after every 5 min. The optimum refrigerant charge test for the forced-cooling mode, operating on the vapor compression cycle, was first determined at standard rated conditions of 35 °C and 26.7 °C OD and ID temperatures, respectively, at a water flow rate of 42 lpm, according to the AHRI 1361 Standard for Performance Rating of Computer and Data Processing Room Air Conditioners [21]. The refrigerant charge corresponding to the highest COP was 2.8 kg at a water flow rate of 42 L per minute (lpm), and this was determined as the optimum refrigerant charge of the forced-cooling mode system. Performance characteristics of the forced- and free-cooling mode according to the entering water temperature (EWT) across an annual temperature condition was analyzed and compared with the conventional IDC cooling system performance. Specifications for test unit components and sensors are shown in Table 1 and Table 2, respectively. Table 3 shows the test condition range of the experiments conducted, and Figure 3 shows a flow chart of the experimental procedure.
The air enthalpy method was used to calculate the cooling capacity Q, which is determined by the mass flow rate of air, ma, and the difference in the enthalpies of the inlet and outlet, ha, in and ha, out, respectively, of air temperatures to the evaporator, as shown in Equation (1). The power input for the forced-cooling mode is comprised of the compressor, fans, and circulating pump power. The total power input for forced-cooling is shown in Equation (2). The power input for the free-cooling mode was by the circulating pump and fans and is shown in Equation (3). The COP relation for both modes was calculated according to Equation (4), with Wtotal (forced, free) representing total power for either forced- or free-cooling.
Q = ma ∗ (ha, out − ha, in)
Wforced, total = Wcompressor + Wcond fan + Wevap fan + Wpump
Wfree, total = Wevap fan + Wcond fan + Wpump
COP = Q W total ( forced ,   free )  
The uncertainty analysis for the cooling capacity and COP was calculated according to the ASHRAE Standard 127 [20], with uncertainties for the capacity at 2.5%, 2.54%, and 2.86%, while COP uncertainties are 2.96%, 3.01%, and 3.23% for the conventional system, forced- and free-cooling, respectively (Table 4).

4. Experimental Results and Discussion

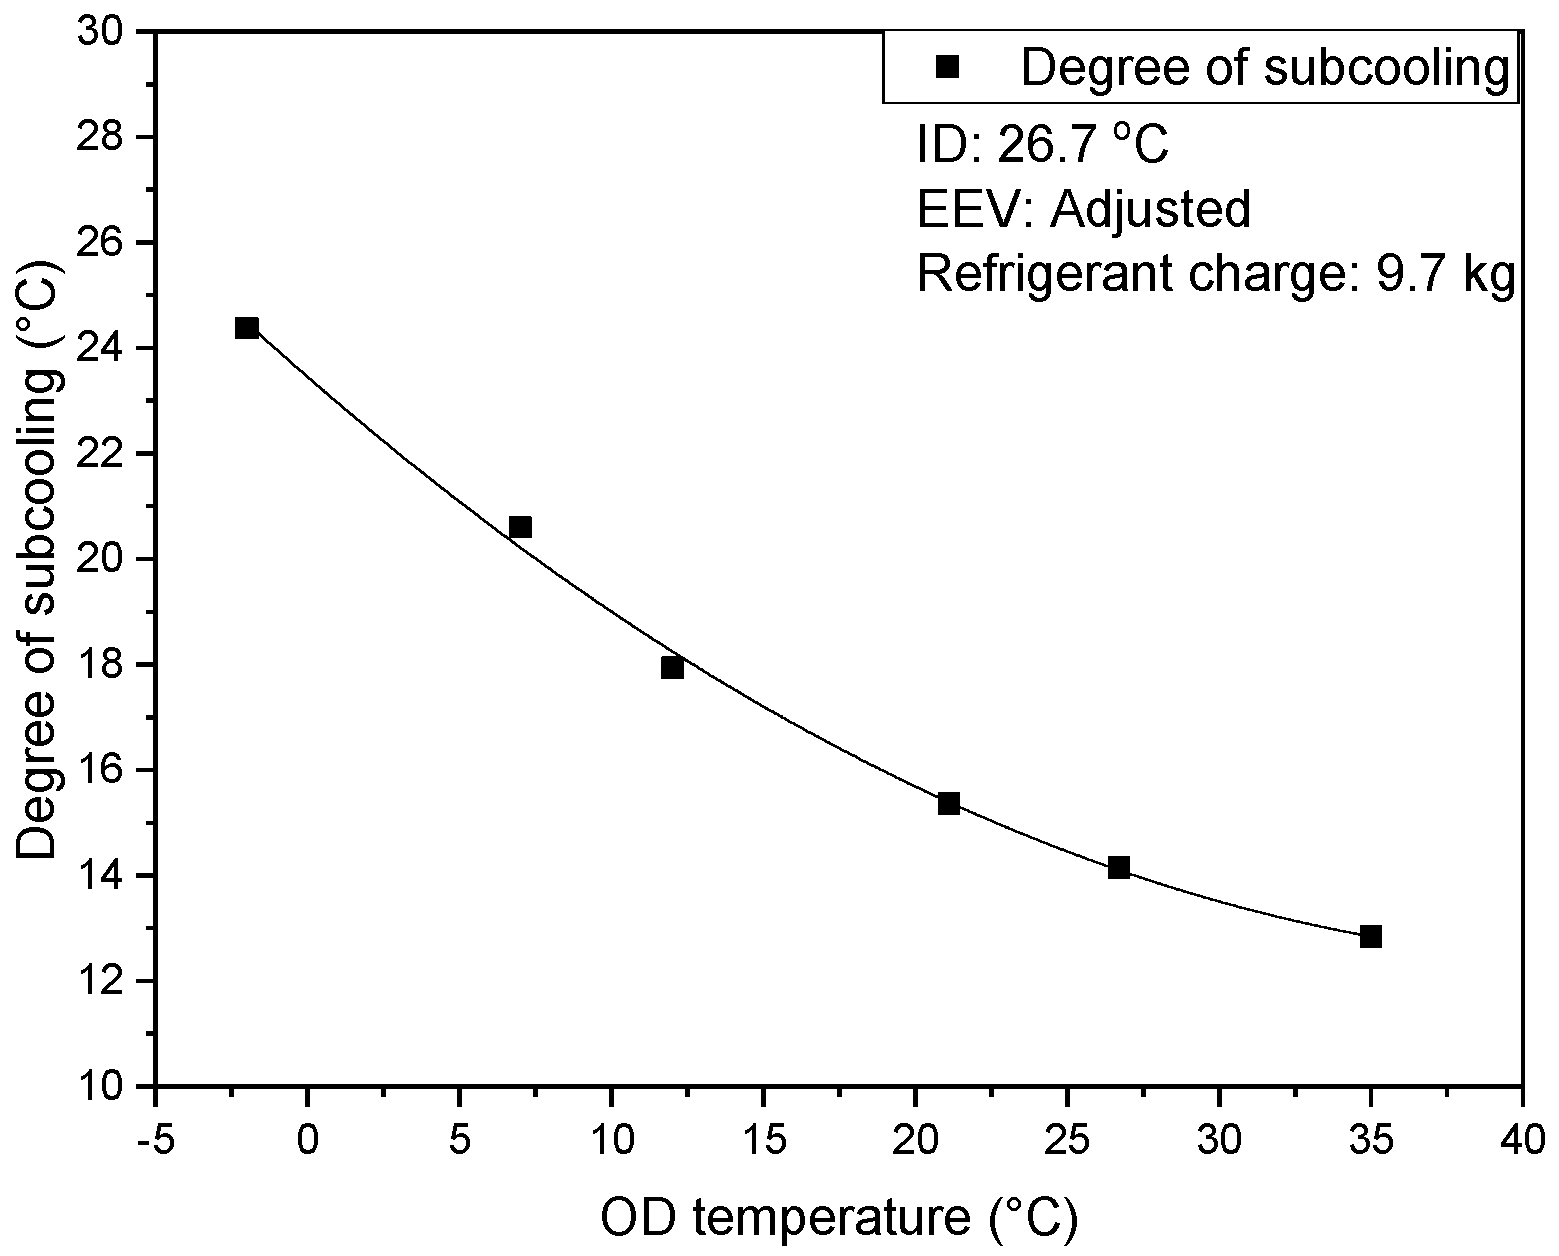
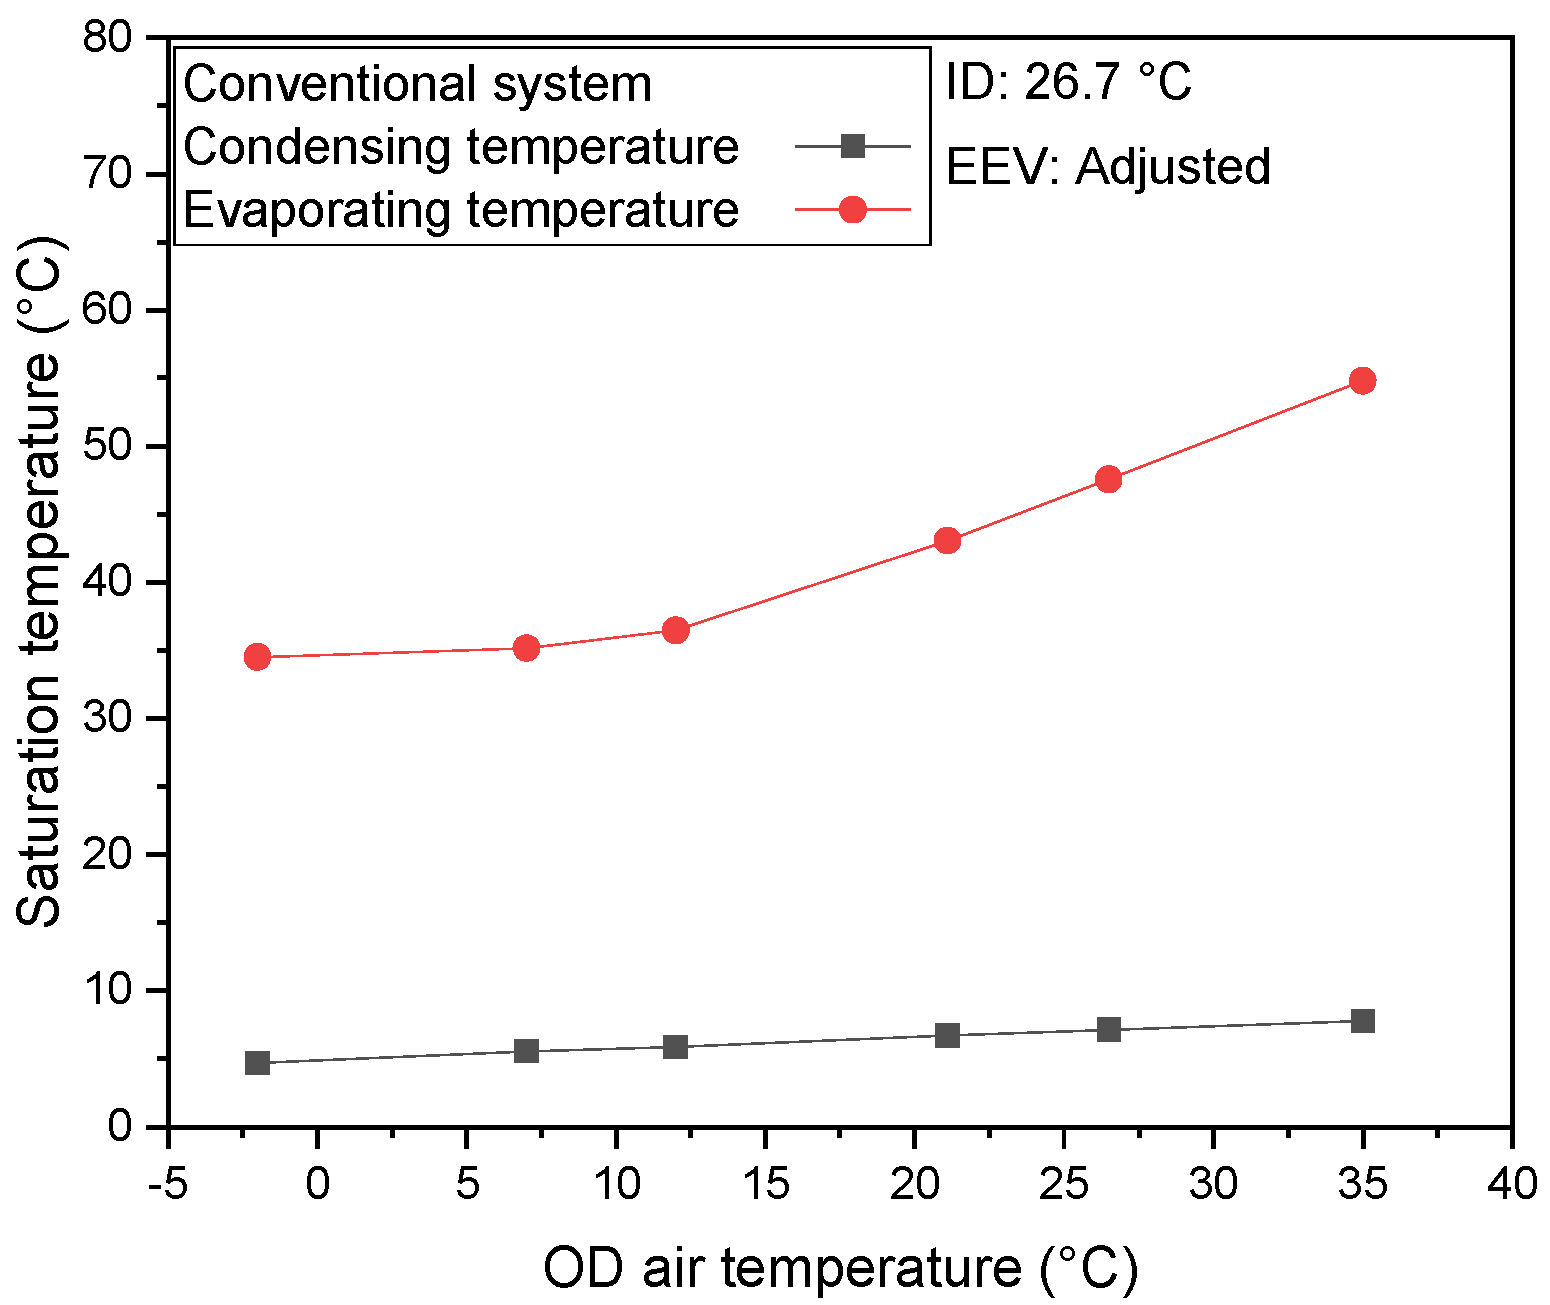
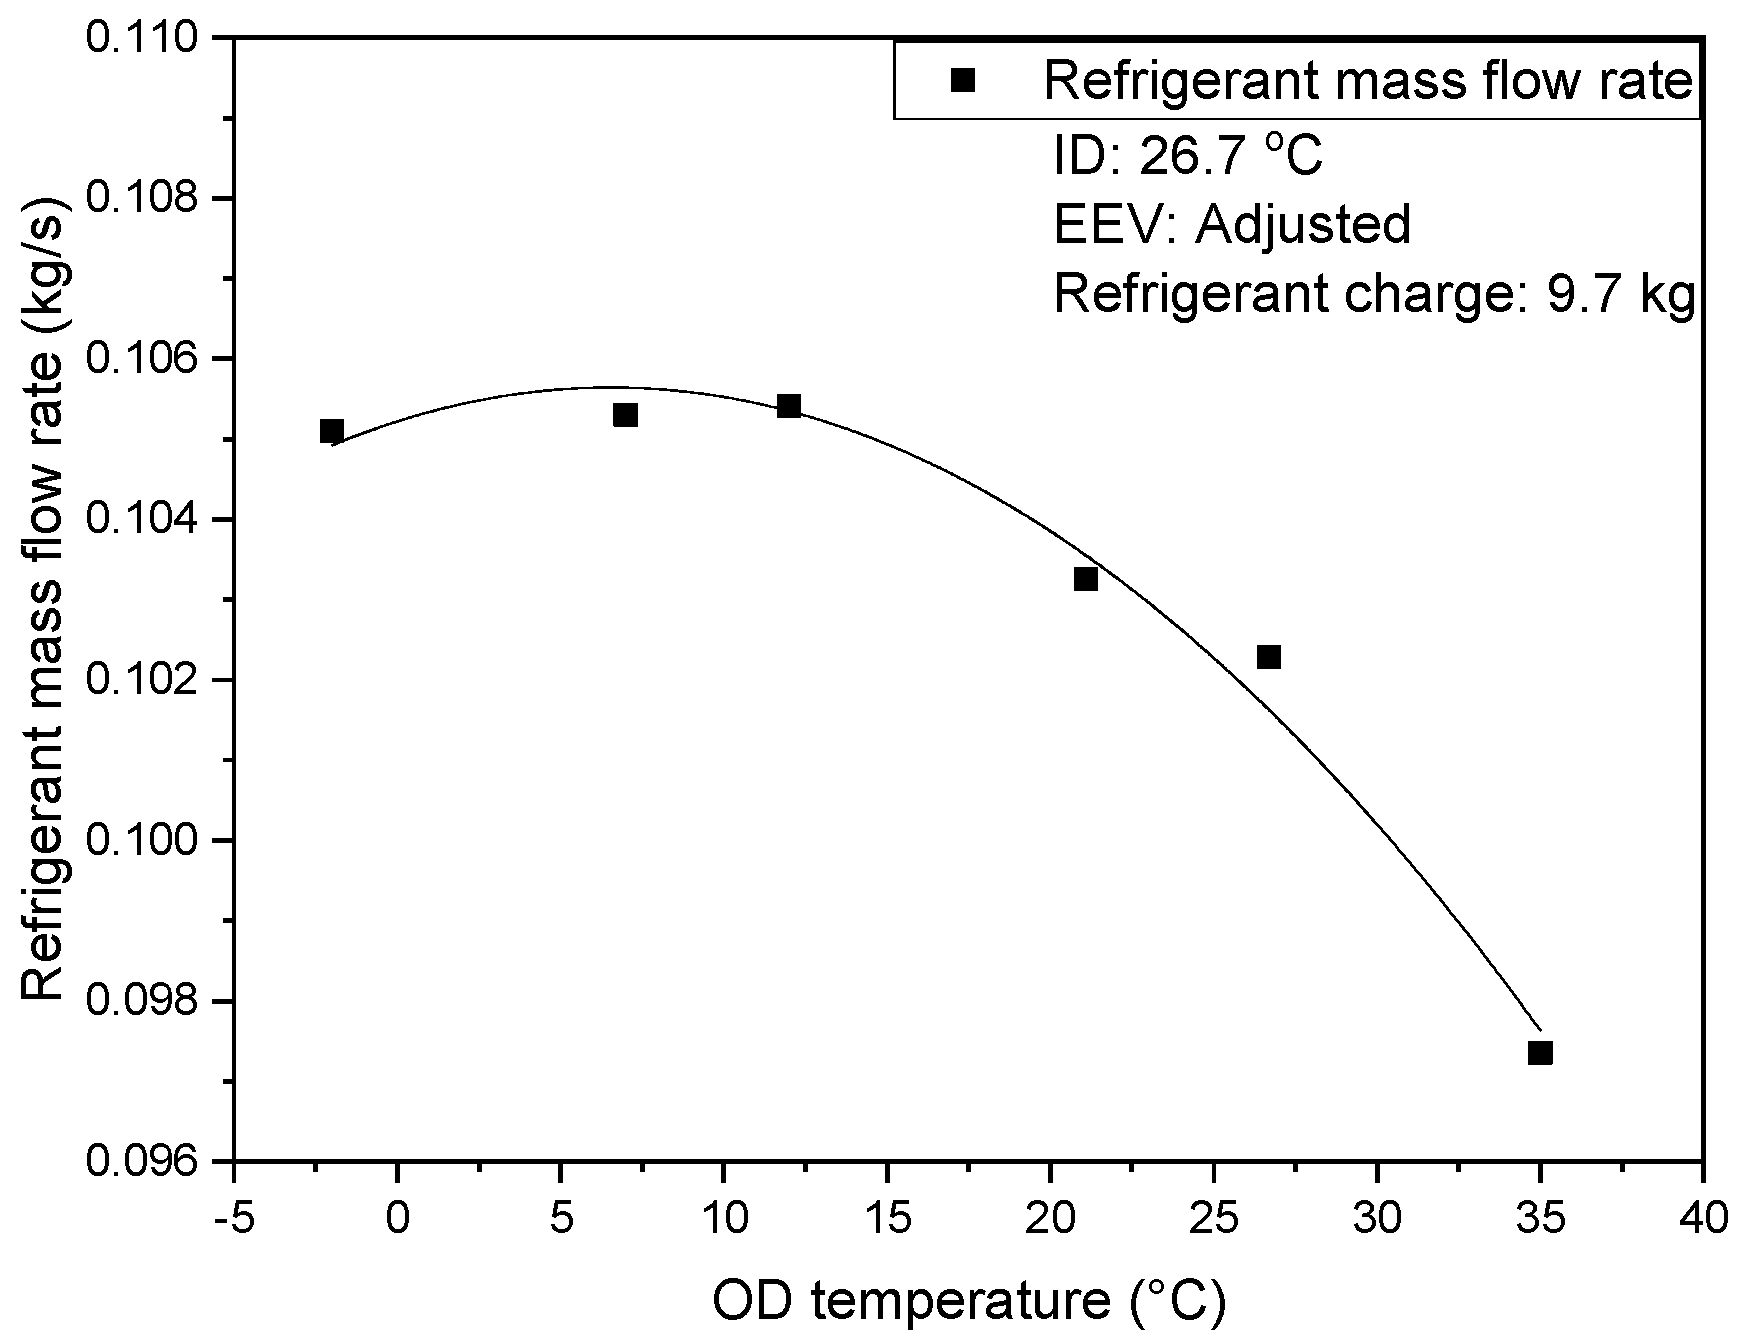
4.1. Performance Characteristics of an Air Source Conventional IDC Cooling System

The performance characteristics of an optimized air source conventional ID cooling system was used in this study for the purpose of comparison to the novel hybrid IDC cooling system utilizing a deep water source from a dam. The conventional system was operated in cooling mode throughout the year at an annual optimized refrigerant charge of 9.7 kg, based on the integrated coefficient of performance (ICOP) method as undertaken by Anka et al. [23]. The performance parameters COP, cooling capacity, and power consumption for the conventional IDC cooling system according to the annual OD air temperature is shown in Figure 4.
From the graph, the COP and cooling capacity of the system increases with increases in OD temperature, while the power consumption decreases. The decrease in OD air temperature increases the mean temperature difference across the condenser of the cooling system, and this increases the heat rejection rate across the condenser between the refrigerant and secondary air fluid. This results in an increase in subcooled refrigerant, as shown in Figure 5. The condensing and evaporating temperatures decrease as a result, from Figure 6, hence the mean temperature difference across the evaporator coupled with the subcooled refrigerant results in an increase in cooling capacity. The cooling capacity increases from 15.24 kW to 20.86 kW as the OD air temperature decreases from 35 °C to −2 °C.
The power consumption rate decreases as the OD air temperature decreases due to the decrease in the condensing temperature and pressure of the cooling system. The refrigerant mass flow rate, as shown in Figure 7, along with the compression ratio across the compressor reduces, resulting in a decrease in the power consumption of the conventional IDC cooling system as the OD air temperature decreases. As the OD air temperature decreases from 35 °C to −2 °C, the power consumption decreases from 4.89 kW to 2.76 kW. The overall COP of the system increases as a result of the increase in cooling capacity and the decrease in power consumption. The COP increases from 3.11 to 7.57 as the OD air temperature decreases from 35 °C to −2 °C.

4.2. Performance Characteristics of a Hybrid IDC Cooling System Utilizing Deep Water Dam Source

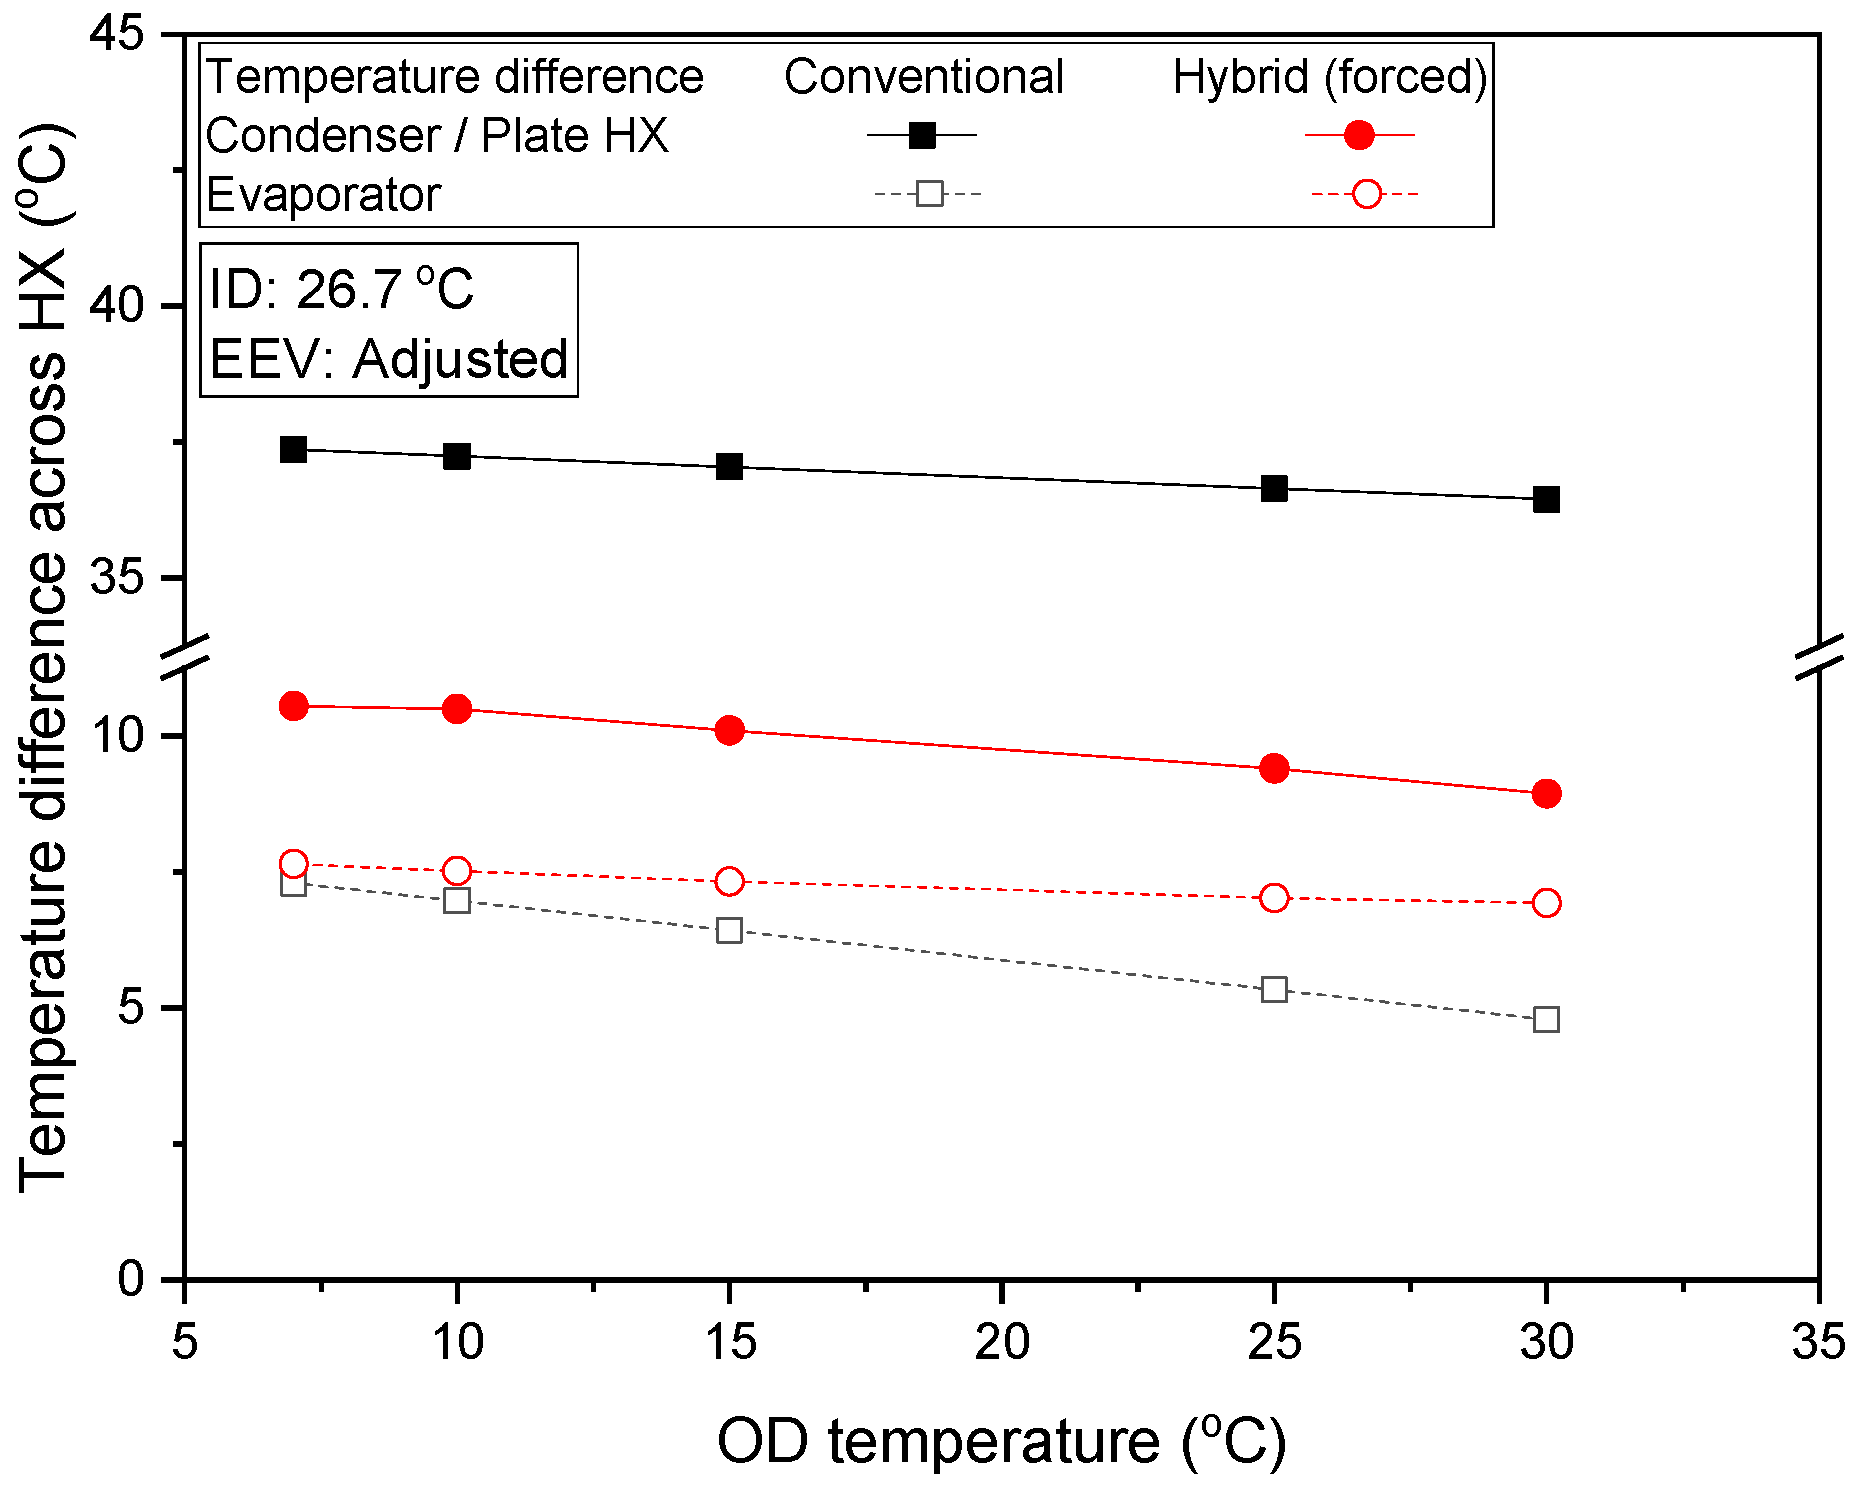
4.2.1. Hybrid IDC Cooling System Utilizing Deep Water Dam Source Forced-Cooling Mode

The increase in EWT at a fixed flow rate results in a decrease in cooling capacity, as shown in Figure 8. This effect is a result of the decrease in the heat transfer rate between the refrigerant and secondary air temperature around the evaporator, as shown in Figure 9. This is due to the decrease in the mean temperature difference between the refrigerant and the higher EWT to the plate heat exchanger, resulting in an increase in evaporating and condensing temperatures, as shown in Figure 10. As the EWT decreases at a fixed flow rate, however, the mean temperature difference between the refrigerant and secondary fluid across the plate heat exchanger increases, resulting in a decrease in condensing and evaporating temperatures, as shown in Figure 10. This increases the mean temperature difference across both the plate heat exchanger and the evaporator, resulting in more heat rejection and absorption, respectively, and an increase in cooling capacity. The refrigerant mass flow rate, however, is fairly constant for both cases due to the superheat condition being maintained at a fixed temperature, and its effect on the cooling is masked by the temperature difference across the heat exchangers.
Comparing the cooling capacity of the novel hybrid IDC cooling system to the conventional cooling system, the cooling capacity at a fixed EWT to that of a corresponding OD air temperature showed the forced-cooling mode of the hybrid IDC cooling system cooling capacity to be higher than the conventional IDC cooling system. For both systems, the decrease in OD temperature conditions showed an increase in cooling capacity. However, the heat transfer rate for the forced-cooling mode across the plate heat exchanger was higher than that of the condenser for the conventional system due to the higher evaporative cooling effect of the water over the ambient air. At a similar lower relative humidity, water has a colder effect than ambient air; hence, a higher heat rejection rate across the plate heat exchanger is observed, and this increases the degree of subcooling in the hybrid cooling system, further reducing the evaporating temperature across the evaporator and increasing cooling capacity. As the OD temperatures decreased from 30 °C, 25 °C, 15 °C, 10 °C, and 7 °C, the cooling capacity percentage difference between the novel hybrid IDC cooling system and conventional IDC cooling system was 1.82%, 3.37%, 3.5%, 2.9%, and 2.4%, respectively.
The power consumption, as shown in Figure 11, increased with the increase in EWT to the plate heat exchanger. This effect is a result of the increase in condensing pressure, which affects the refrigerant mass flow rate increase. The evaporating pressure increases alongside the condensing pressure. However, the rate of increase for the condensing pressure is much higher, as well as the temperature. Hence, the compression ratio across the condenser increases significantly, resulting in the higher power draw of the compressor. The decrease in EWT to the system, however, showed a reduced power draw due to the reduction of the saturated pressures and temperature. The added increase to the system’s total power stems from the circulating pump power input addition.
In the operation of the vapor compression cycle for the forced-cooling mode for the novel IDC cooling system and conventional IDC cooling system, the condensing and evaporating temperatures showed lower values as the OD temperatures decreased. However, the novel hybrid IDC cooling system showed lower values than that of the conventional IDC cooling system due to the higher heat rejection rate in the plate heat exchanger. The decrease in the saturated temperatures and the refrigerant mass flow rate resulted in a relatively lower compression ratio across the compressor and a lower power draw for the novel hybrid cooling. However, the addition of the pump power to the overall power consumption of the novel hybrid cooling system resulted in an overall system power increase over the conventional IDC cooling system. As the OD temperatures decreased from 30 °C, 25 °C, 15 °C, 10 °C, and 7 °C, the power consumption percentage difference between the novel hybrid IDC cooling system and the conventional IDC cooling system was 1.16%, 2.1%, 2.9%, 0.67%, and 1.41%, respectively.
The system COP, which is the quotient effect of the cooling capacity, showed an increasing value as the EWT to the plate heat exchanger decreased, as shown in Figure 12. This is as a result of the increase in cooling capacity and relative decrease in power consumption as the EWT to the system decreases, showing higher system performance in the decreased OD temperature condition. When the OD temperature reduced from 30 °C, 25°C, 15 °C, 10 °C, and 7 °C, the percentage difference between the novel hybrid IDC cooling system and conventional IDC cooling system was 0.77%, 2.9%, 6.69%, 5.22%, and 5.8%, respectively.

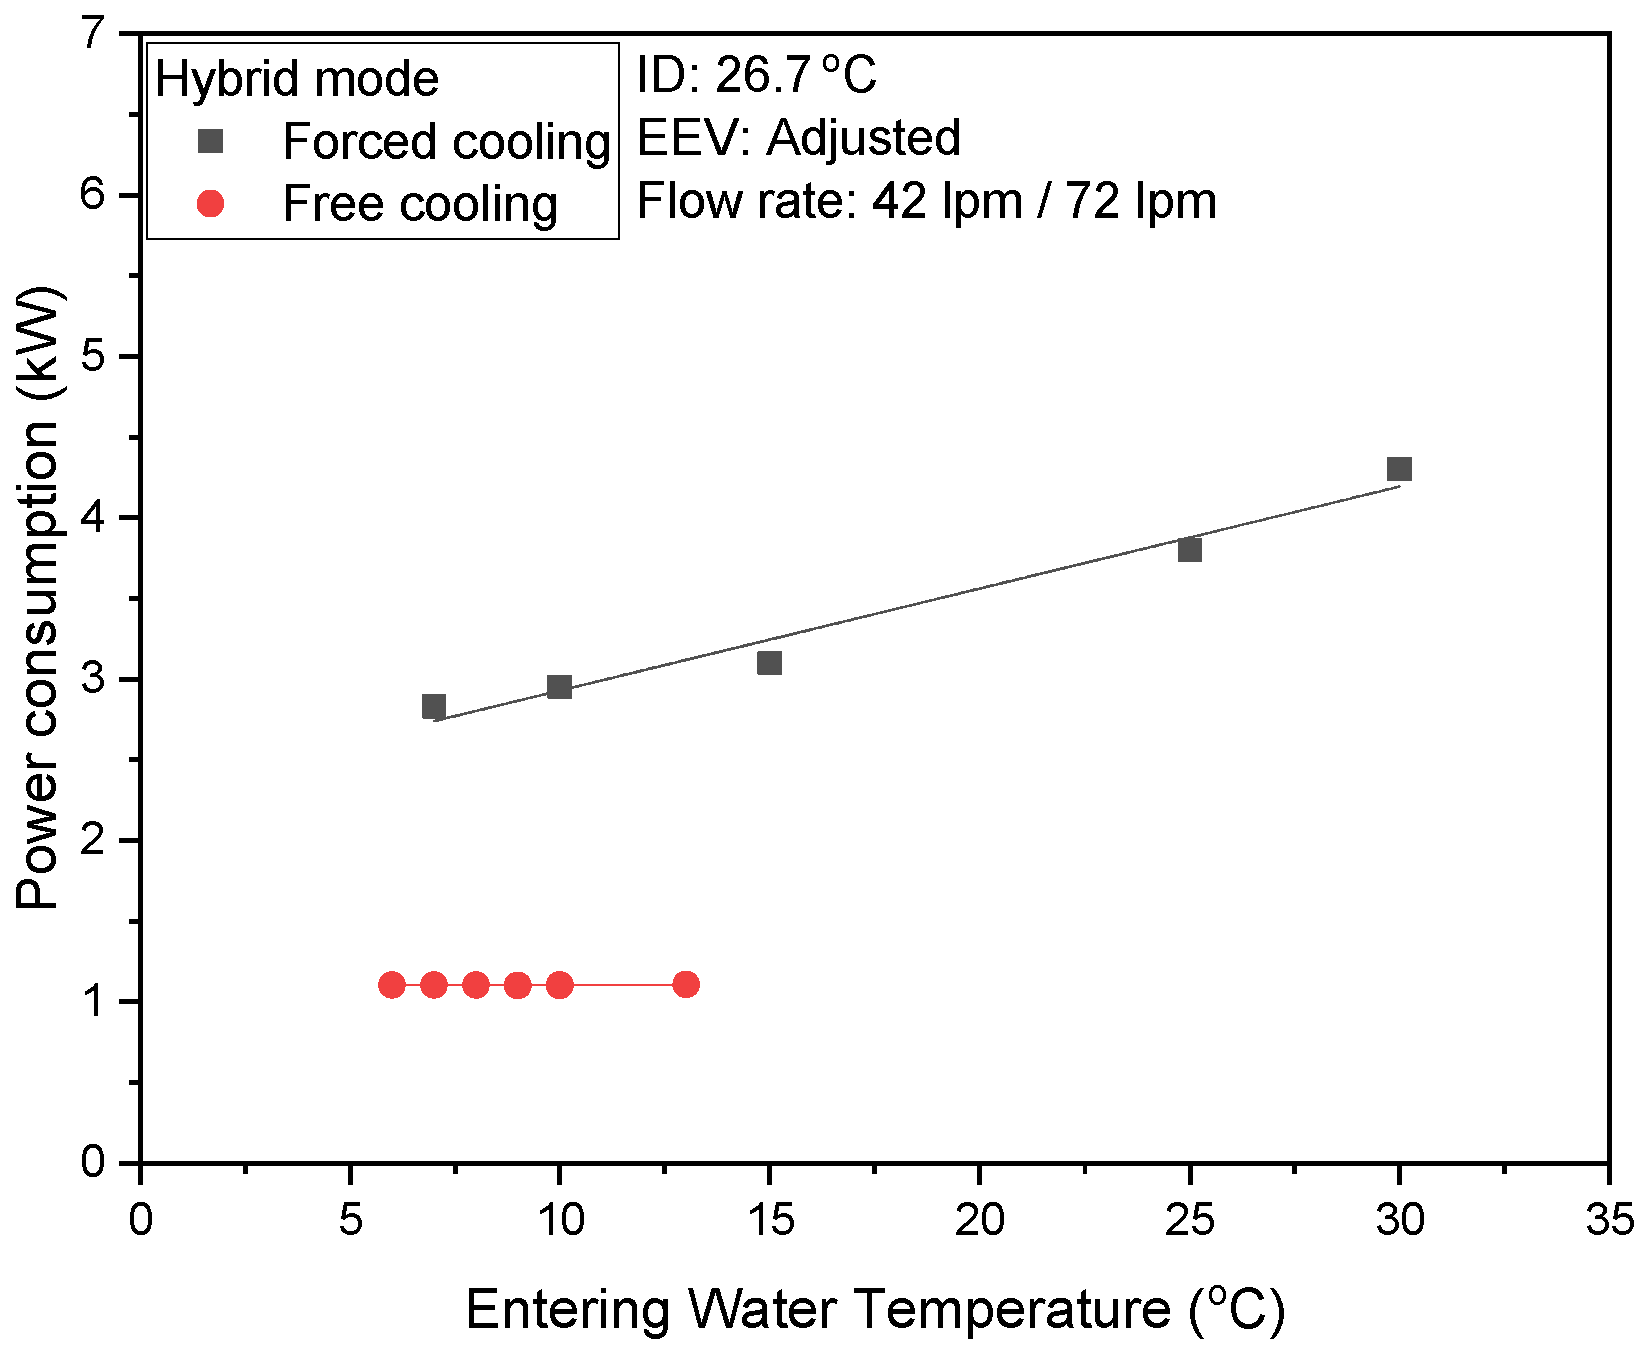
4.2.2. Hybrid IDC Cooling System Mode Change Temperature (MCT) and Hybrid Mode Performance

The design and operation of the hybrid IDC cooling system utilizing a deep water source from a dam is purposely to have a high cooling performance coupled with energy saving potential. The hybrid mode operation, which is the operation of either the forced-cooling or free-cooling mode as the operating conditions are satisfied, as well as the effect of deep-source dam water as a secondary fluid source, is exploited to satisfy the cooling requirement of the IDC space while saving energy. The forced-cooling mode relies on the use of a vapor compression cycle and circulating water as a heat sink, while the use of natural convection in the free-cooling mode to meet cooling demand by circulating dam water through the evaporator to remove heat shows a significant energy saving potential as it requires the use of the circulating pump as the only major power input.
To switch to the free-cooling mode from the forced-cooling mode, the operation of the vapor compression cycle requires the mode change temperature (MCT), which is a temperature at which the free-cooling mode matches the rated cooling capacity determined by the forced-cooling mode and standard conditions of 26.7 °C and 25 °C ID temperature and EWT, respectively. At this temperature, the hybrid IDC cooling system can operate in free-cooling mode while meeting the cooling requirements.
To determine the MCT for the hybrid system, the dew point temperature for the ID temperature, 26.7 °C is considered. When the dew point temperature, which is 15.6 °C of the ID temperature, equals the MCT, the relative humidity of the air is 100%, which indicates the absence of dehumidification, resulting in no heat exchange across the evaporator. To determine the MCT, the water flow rate was varied between 42 lpm and 78 lpm, as shown in Figure 13. The corresponding temperature of the rated cooling capacity in forced-cooling mode, according to the varied flow rate were, 7.15 °C, 7.9 °C, 8.7 °C, 9.15 °C, 9.2 °C. In comparing COP, however, as shown in Figure 14, the highest COP peaked at 72 lpm, and though the flow rate of 78 lpm showed a higher MCT value, the cooling capacity rate reduced as a result of the reduced heat exchange across the plate heat exchanger due to the maximum flow rate, which is a limitation of the heat exchanger. The power consumption as a result of the increase in flow rate also increased, resulting in the decrease in COP at 78 lpm. The flow rate matching the rated cooling capacity and highest COP at standard conditions was 72 lpm, and it corresponded to 9.15 °C, and this was determined as the MCT for the hybrid IDC cooling system.
The determination of the mode change temperature (MCT), optimized for the hybrid IDC cooling system utilizing deep water source from dam, the free-cooling mode is operated when the EWT falls below the MCT of 9.15 °C at 72 lpm water flow rate. The free-cooling operation uses circulating water and the action of natural convection to maintain the cooling requirements in the IDC space. The operation of the free-cooling mode further increases the energy saving capability of the novel hybrid IDC cooling system due to its only major power consumption being the circulating pump.
Figure 15 shows the cooling capacity of the hybrid IDC cooling system operating in hybrid mode, forced-cooling mode, and free-cooling according to EWT variation. The cooling capacity in the free-cooling operating mode is affected directly by the EWT of the water, hence, a change in EWT greatly affects the cooling performance of the system. As the EWT decreases, the cooling capacity increases due to the increase in the mean temperature difference across the plate heat exchanger and the evaporator, as shown in Figure 16. This results in the decrease in evaporating temperature, hence, increasing the heat absorption rate and cooling capacity of the system. In forced-cooling mode, the capacity also shows an increasing trend as EWT decreases. The cooling capacity of the forced-cooling mode is observed however to be higher than that of the free-cooling mode. This is due to the lower evaporating temperature by action of the refrigerant, as shown in Figure 17, which is lower than the EWT of the circulating water in free-cooling mode. The mean temperature across the evaporator, hence, is increased, resulting in a higher cooling capacity in forced-cooling mode than the free-cooling mode.
The power input for free-cooling mode remains fairly constant as the EWT decreases, as shown in Figure 18. This is due to the circulating pump being the only major power input used, and also the pump being operated at a constant flow rate, hence, the energy saving potential realized in this mode is significant. The increase in cooling capacity and constant power consumption by the pump as EWT to the plate heat exchanger increases, leads to a higher COP. In free-cooling mode, the performance of the novel hybrid IDC cooling system increases significantly while saving on energy consumption. In forced-cooling mode, however, there is a decreasing trend as EWT decreases. As the EWT decreases, the condensing and evaporating temperatures decrease in the plate HX and evaporator, respectively. The subcooling increases; however, refrigerant mass flow rate does not increase due to the low system pressure and EEV action of maintaining superheat. This results in a low compression ratio and work done by the compressor, hence, the decrease in power consumption.
The operation of the hybrid IDC cooling system utilizing deep water source from dam shows a better performance if the operation considers free-cooling, as shown in Figure 19. This is as a result of an increase in cooling performance with the variation of EWT as a fairly constant power input, unlike the forced-cooling mode.

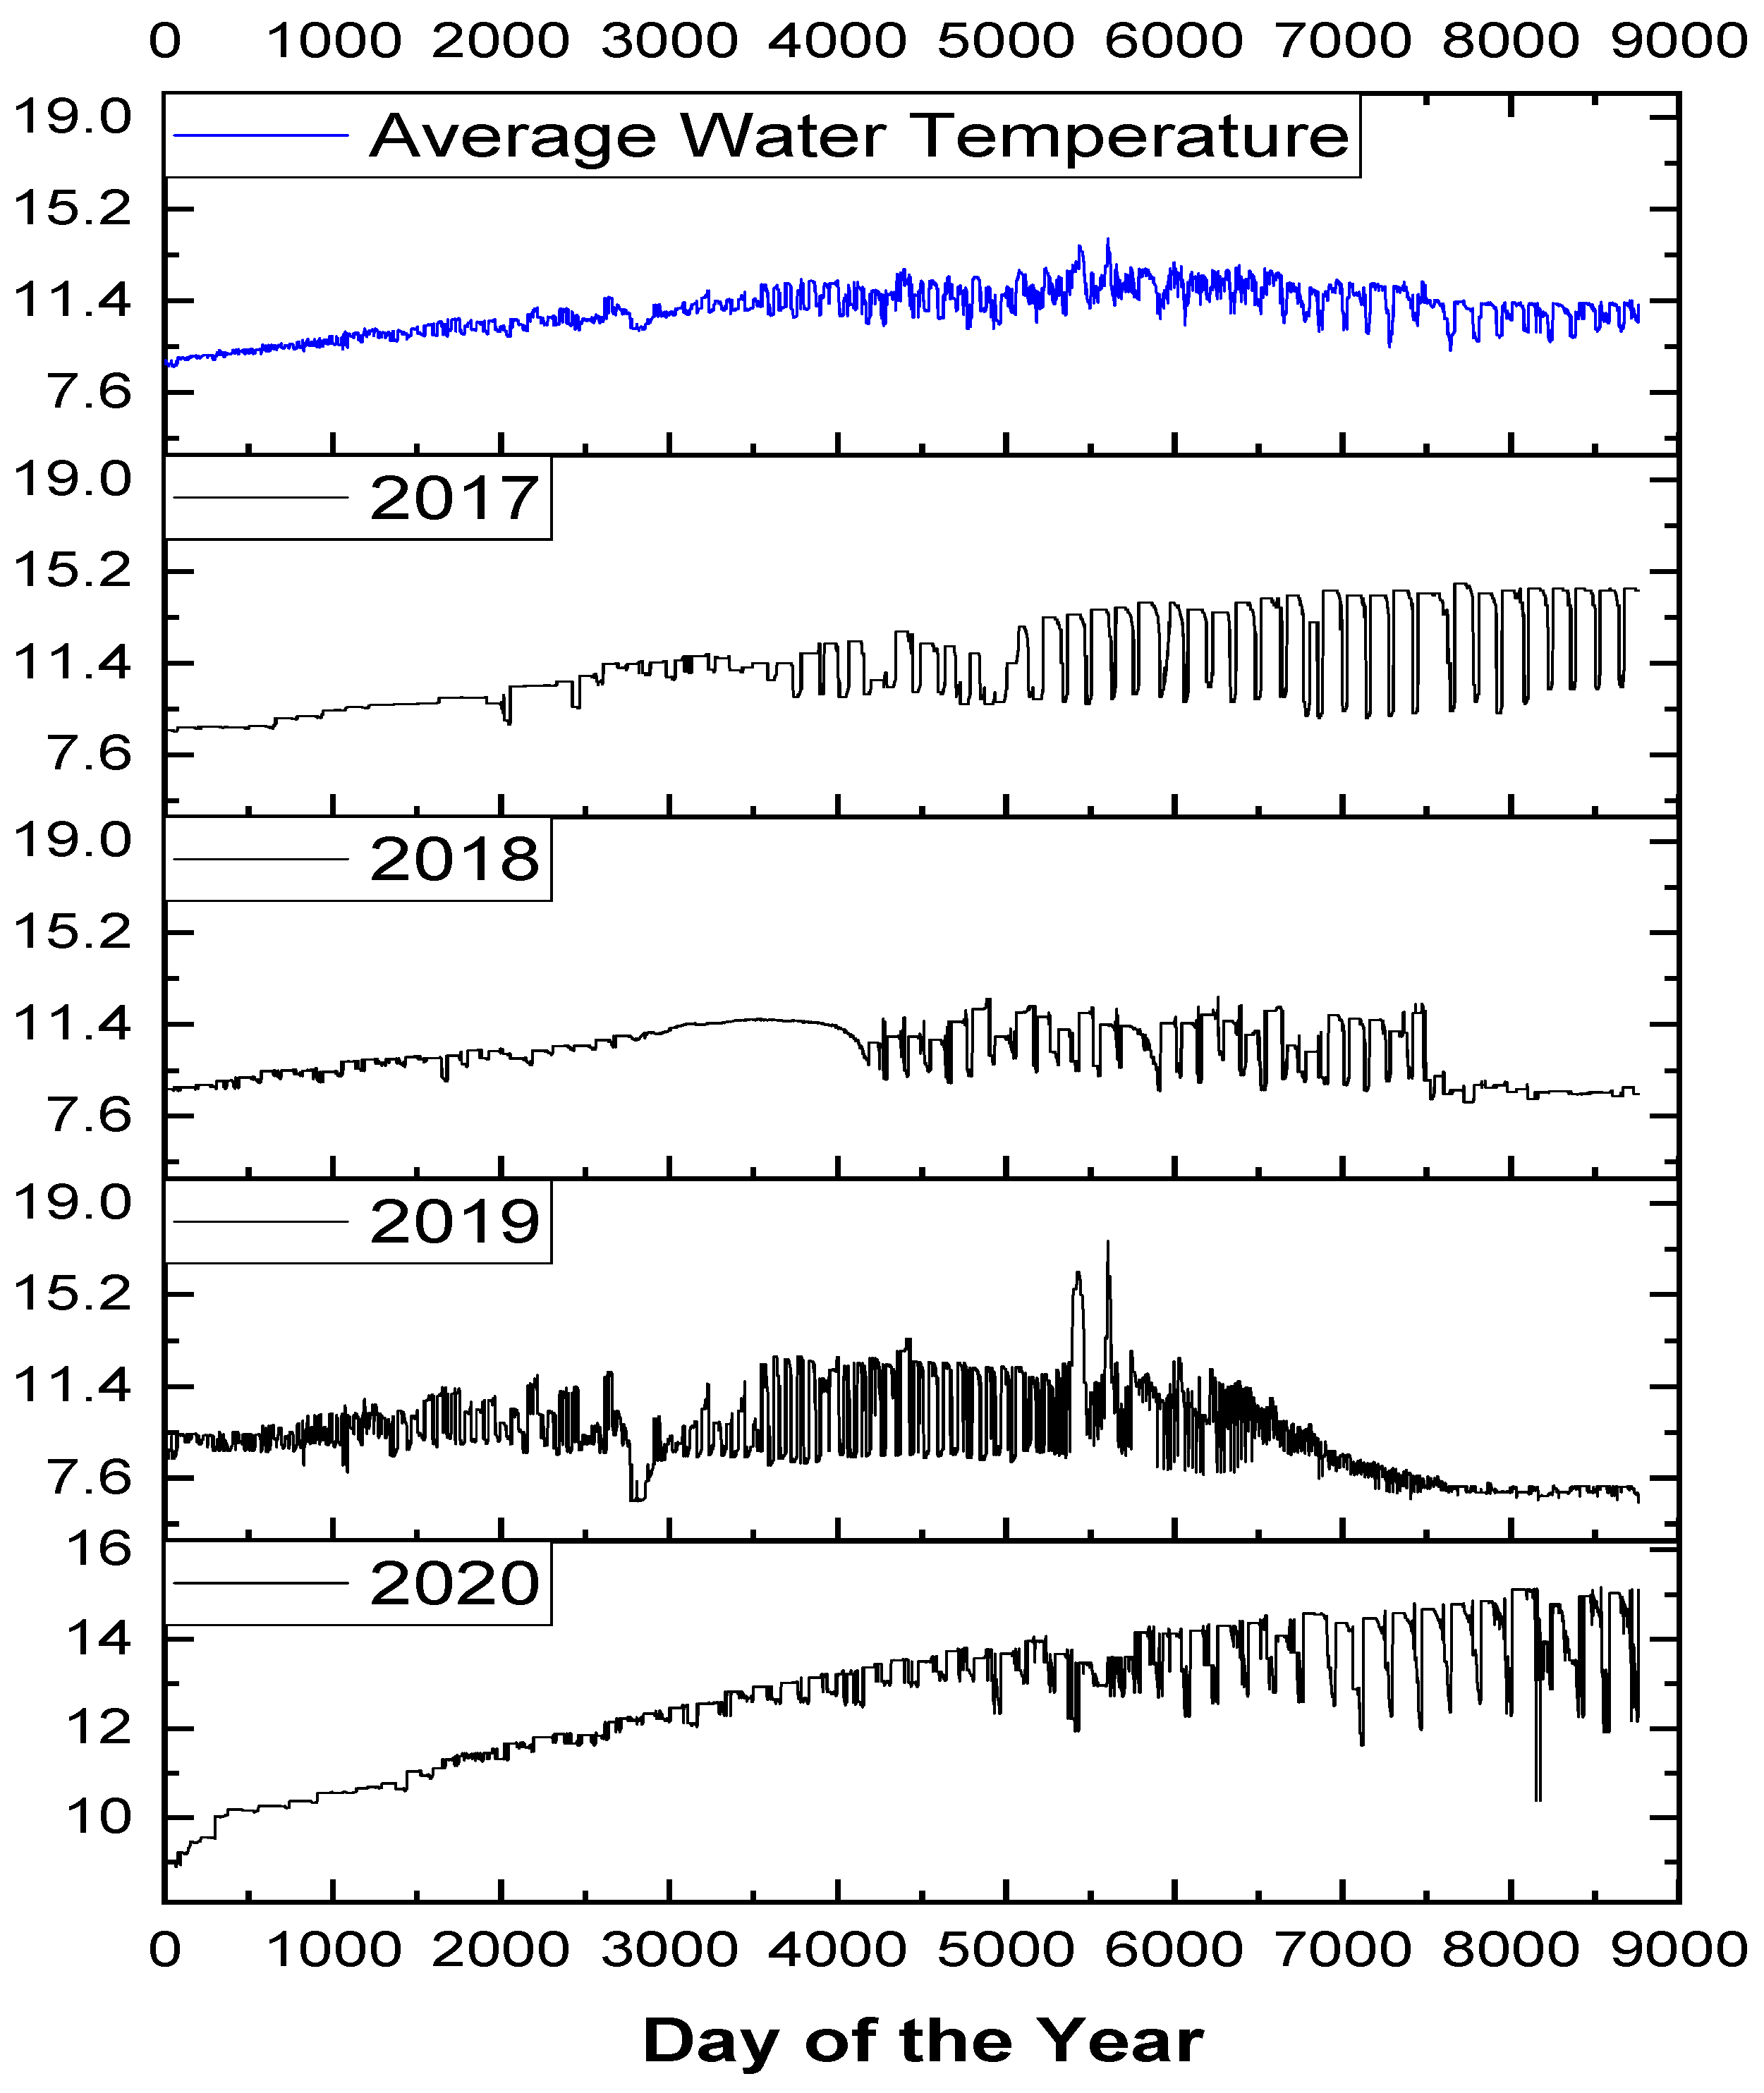
4.3. Performance Comparison of Conventional and Hybrid Cooling System Utilizing Dam Deep Water Based on External Zone Bin Data

The evaluation of the integrated coefficient of performance (ICOP) is needed to quantify and validate the merits of the novel hybrid IDC cooling system utilizing a deep water source from a dam. To accurately estimate the ICOP for the cooling system, the climate data of its geographic location are considered. Based on ANSI/ASHRAE 127 [20], it is recommended to classify climate temperatures in ranges, as shown in Table 5. For this study, the water temperature data from Soyang dam in Gangwon-do were used to develop a country-specific correlation for the ICOP calculation. The percentage-weighted averages were calculated based on temperature readings that fall within the specified temperature range, according to the standard using Equation (5). A, B, C, and D represent the percentage weighted averages according to the weather and water temperature ranges. The water temperature data for the Soyang dam from 2017 to 2020 are shown in Table 6, and Figure 20 shows the water temperature variation in that same period.
To compare the performance of the air source conventional IDC cooling system to the hybrid IDC cooling system utilizing a deep water source from a dam operating in only forced-cooling mode annually and operating in the hybrid mode, the percentage weighted averages A, B, C, and D were determined based on the weather temperature data from 16 representative cities in South Korea, using guidelines from ANSI/ASHRAE standard 127 [20]. The percentage weighted averages are shown in Table 7. Table 8 shows the climate bin temperature to obtain the weighted averages for the conventional system. Figure 21 represent the comparison of the ICOP for the conventional IDC cooling system and hybrid IDC cooling system operating in forced-cooling mode annually and the hybrid system operating in hybrid mode (forced-cooling and free-cooling) annually.
The air source conventional IDC cooling system, the annual operation of the system in cooling mode and vapor compression cycle, results in a higher power consumption due to the operation of the compressor, as well as air being utilized as a heat sink. The novel hybrid IDC cooling system operating in forced-cooling mode annually showed a better ICOP than the conventional system due to the better evaporative properties of water; hence, its cooling capacity was significant. The compressor power input was less than the conventional cooling system due to the relatively lower saturated temperatures at higher EWT that that of the ID air temperature. The novel hybrid cooling system operating in hybrid mode showed the best ICOP. This is because of the operation of the free-cooling mode, which only utilizes a circulating pump during its operation in lower temperatures below the MCT. Over an annual operating period, this saves the cooling system significant power consumption. The novel hybrid cooling system operating in hybrid mode showed a 67% performance increase over the air source conventional IDC cooling system and a 46.87% performance increase over the novel hybrid IDC cooling system operating in forced-cooling mode only.
ICOP water = ( A · TestA   COP ) + ( B · TestB   COP ) + ( C · TestC   COP ) + ( D · TestD   COP )
where ICOPwater, is the estimated integrated sensible Coefficient of Performance of a data center cooling unit utilized in Korea.

5. Conclusions

Due to the widespread usage of internet services, internet data centers (IDCs) have grown rapidly in recent years, causing significant energy consumption issues. Many cooling systems for (IDCs) have utilized ambient air as the most prevalent heat rejection sink over the years. A novel energy-saving hybrid cooling system that combines a forced-cooling cycle and a free-cooling cycle was proposed and experimentally tested for data centers. The system is operated in forced-cooling mode when the EWT conditions are above the MCT and the free-cooling mode is activated when the ambient temperature is below the MCT. The mode change temperature was set at 9.15 , which was determined solely based on the total cooling capacities under standard rated condition, COP, and EWT variation with uncertainties for the capacity at 2.5%, 2.54%, and 2.86%, while COP uncertainties are 2.96%, 3.01%, and 3.23% for the conventional system, forced- and free-cooling, respectively.
This study quantitatively conducted a performance analysis for the conventional cooling system and the hybrid cooling system utilizing a dam deep water for the IDC in annual forced-cooling operation and hybrid (forced- and free-cooling) annual operation. In addition, a comparative annual energy saving analysis was carried out using the bin hours technique based on South Korea’s climatic condition. The comparison was conducted in terms of the integrated coefficient of performance (ICOP). To appropriately calculate the annual rating that enables system comparisons, normalized annual weight factors are required. The normalized weight is dependent on the climate bin data for the present geographical location of the cooling system.
Raw water temperature data from Soyang dam were factored and used to generate a country-specific correlation for estimating the integrated coefficient of performance for the hybrid cooling system. The results showed the novel hybrid cooling system utilizing a deep water source from a dam and operating in hybrid mode showed a 67% performance increase over the air source conventional IDC cooling system and a 46.87% performance increase over the novel hybrid IDC cooling system utilizing a deep water source from a dam operating in forced-cooling mode only. This shows a better annual performance when the water source is considered as a heat sink for IDC cooling system.
Application of this system can be adopted in regions with fairly higher ambient air temperatures, as the use of air-source cooling systems will incur higher energy usage and cost as compared to water bodies that maintain a lower temperature all year round, serving as an efficient heat rejection medium.
The challenge of the availability and use of water bodies, such as rivers and lakes, as a heat rejection medium for the newly developed system due to its effect on flora and fauna in the water bodies, resulting from refrigerant leakage and subsequent carbon emission, as well as the impact of the leaving water temperature should be a focus for future research.

Author Contributions

Conceptualization, J.M.C.; Validation, K.M.; Data curation, N.L.B.; Writing—original draft, S.K.A.; Writing—review & editing, S.B. and K.H.L. All authors have read and agreed to the published version of the manuscript.

Funding

This work was supported by the National Research Foundation of Korea (NRF) grant funded by the Korea government. (MSIT: Ministry of Science and ICT) (No. 2022R1A2C2006469).

Conflicts of Interest

The authors declare no conflict of interest.

Nomenclature

COPCoefficient of Performance
DXDirect Expansion
DBDry Bulb
EEVElectronic Expansion Valve
EWTEntering Water Temperature
HXHeat Exchanger
IDIndoor
IDCInternet Data Center
ICOPIntegrated Coefficient of Performance
ISOInternational Standards Organization
LPMLiters per minute
MCTMode Change Temperature
PUEPower Usage Effectiveness
OD Outdoor
WBWet Bulb
QCapacity

References

  1. Zhang, Q.; Meng, Z.; Hong, X.; Zhan, Y.; Liu, J.; Dong, J.; Bai, T.; Niu, J.; Deen, M.J. A Survey on Data Center Cooling Systems: Technology, Power Consumption Modeling and Control Strategy Optimization. J. Syst. Archit. 2021, 119, 102253. [Google Scholar] [CrossRef]
  2. Gao, T.; Sammakia, B.G.; Geer, J.; Murray, B.; Tipton, R.; Schmidt, R. Comparative Analysis of Different in Row Cooler Management Configurations in a Hybrid Cooling Data Center; American Society of Mechanical Engineers: New York, NY, USA, 2015. [Google Scholar]
  3. Han, Z.; Wei, H.; Sun, X.; Bai, C.; Xue, D.; Li, X. Study on Influence of Operating Parameters of Data Center Air Conditioning System Based on the Concept of On-Demand Cooling. Renew. Energy 2020, 160, 99–111. [Google Scholar] [CrossRef]
  4. Amoabeng, K.O.; Choi, J.M. Review on Cooling System Energy Consumption in Internet Data Centers. Int. J. Air-Cond. Refrig. 2016, 24, 1–17. [Google Scholar] [CrossRef]
  5. Deymi-Dashtebayaz, M.; Namanlo, S.V. Potentiometric and Economic Analysis of Using Air and Water-Side Economizers for Data Center Cooling Based on Various Weather Conditions. Int. J. Refrig. 2019, 99, 213–225. [Google Scholar] [CrossRef]
  6. Gao, T.; Samadiani, E.; Sammakia, B.; Schmidt, R. Comparative Thermal and Energy Analysis of a Hybrid Cooling Data Center with Rear Door Heat Exchangers; American Society of Mechanical Engineers: New York, NY, USA, 2013. [Google Scholar]
  7. Wang, Z.; Zhang, X.; Li, Z.; Luo, M. Analysis on Energy Efficiency of an Integrated Heat Pipe System in Data Centers. Appl. Therm. Eng. 2015, 90, 937–944. [Google Scholar] [CrossRef]
  8. Yan, G.; Feng, Y.; Peng, L. Experimental Analysis of a Novel Cooling System Driven by Liquid Refrigerant Pump and Vapor Compressor. Int. J. Refrig. 2015, 49, 11–18. [Google Scholar] [CrossRef]
  9. Zhang, H.; Shao, S.; Zou, H.; Tian, C. Performance Analysis on Hybrid System of Thermosyphon Free Cooling and Vapor Compression Refrigeration for Data Centers in Different Climate Zones of China. Energy Procedia 2014, 61, 428–431. [Google Scholar] [CrossRef] [Green Version]
  10. Deymi-Dashtebayaz, M.; Valipour Namanlo, S.; Arabkoohsar, A. Simultaneous Use of Air-Side and Water-Side Economizers with the Air Source Heat Pump in a Data Center for Cooling and Heating Production. Appl. Therm. Eng. 2019, 161, 114133. [Google Scholar] [CrossRef]
  11. Wang, J.; Zhang, Q.; Yu, Y. An Advanced Control of Hybrid Cooling Technology for Telecommunication Base Station. Energy Build. 2016, 133, 172–184. [Google Scholar] [CrossRef] [Green Version]
  12. Han, Z.; Zhang, Y.; Meng, X.; Liu, Q.; Li, W.; Han, Y.; Zhang, Y. Simulation Study on the Operating Characteristics of the Heat Pipe for Combined Evaporative Cooling of Computer Room Air-Conditioning System. Energy 2016, 98, 15–25. [Google Scholar] [CrossRef]
  13. Sun, Y.; Wang, T.; Yang, L.; Hu, L.; Zeng, X. Research of an Integrated Cooling System Consisted of Compression Refrigeration and Pump-Driven Heat Pipe for Data Centers. Energy Build. 2019, 187, 16–23. [Google Scholar] [CrossRef]
  14. Liu, Y.; Yang, X.; Li, J.; Zhao, X. Energy Savings of Hybrid Dew-Point Evaporative Cooler and Micro-Channel Separated Heat Pipe Cooling Systems for Computer Data Centers. Energy 2018, 163, 629–640. [Google Scholar] [CrossRef] [Green Version]
  15. Ma, Y.; Ma, G.; Zhang, S.; Xu, S. Experimental investigation on a novel integrated system of vapor compression and pump-driven two phase loop for energy saving in data centers cooling. Energy Convers. Manag. 2015, 106, 194–200. [Google Scholar] [CrossRef]
  16. Meng, F.; Zhang, Q.; Lin, Y.; Zou, S.; Fu, J.; Liu, B.; Wang, W.; Ma, X.; Du, S. Field study on the performance of a thermosyphon and mechanical refrigeration hybrid cooling system in a 5G telecommunication base station. Energy 2022, 252, 123744. [Google Scholar] [CrossRef]
  17. Wang, J.; Zhang, Q.; Yoon, S.; Yu, Y. Reliability and Availability Analysis of a Hybrid Cooling System with Water-Side Economizer in Data Center. Build. Environ. 2019, 148, 405–416. [Google Scholar] [CrossRef]
  18. Wang, J.; Zhang, Q.; Yoon, S.; Yu, Y. Impact of Uncertainties on the Supervisory Control Performance of a Hybrid Cooling System in Data Center. Build. Environ. 2019, 148, 361–371. [Google Scholar] [CrossRef]
  19. ISO 13256-2; Water-Source Heat Pumps—Testing and Rating for Performance—Part 2: Water-to-Water and Brine-to-Water Heat Pumps. ISO: Geneva, Switzerland, 1998.
  20. ANSI/ASHRAE, 127; Method of Testing for Rating Air-Conditioning Units Serving Data Center (DC) and Other Information Technology Equipment (ITE) Spaces, 180 Technology Parkway NW. ANSI/ASHRAE: Peachtree Corners, GA, USA, 2020.
  21. AHRI Standard 1361 (SI); Performance Rating of Computer and Data Processing Room Air Conditioners. AHRI: Arlington, VA, USA, 2017.
  22. ANSI/AMCA 210-99; Laboratory Method of Testing Fans for Aerodynamic Performance Rating, 210. Air Movement and Control Association International Inc.: Arlington Heights, IL, USA, 1999.
  23. Anka, S.K.; Mensah, K.; Boahen, S.; Ohm, T.I.; Cho, Y.; Choi, J.W.; Choo, S.H.; Kim, H.Y.; Choi, J.M. Performance optimization of an air source HVAC system for an internet data center building using the integrated COP method. J. Build. Eng. 2022, 61, 105308. [Google Scholar] [CrossRef]
Figure 1. Schematic diagram for conventional cooling system for IDC.
Energies 15 09274 g001
Figure 2. Schematic diagram for a hybrid cooling system that uses dam water for data centers.
Energies 15 09274 g002
Figure 3. Flow chart of the experimental procedure.
Energies 15 09274 g003
Figure 4. Performance variation of conventional cooling system according OD air temperature.
Energies 15 09274 g004
Figure 5. Degree of subcooling of conventional cooling system according to OD air temperature.
Energies 15 09274 g005
Figure 6. Saturation temperatures of conventional system according to OD air temperature.
Energies 15 09274 g006
Figure 7. Refrigerant mass flow rate of conventional cooling system according to OD air temperature.
Energies 15 09274 g007
Figure 8. Cooling capacity comparison for novel hybrid IDC cooling and conventional IDC cooling system.
Energies 15 09274 g008
Figure 9. HX temperature comparison for novel hybrid IDC cooling and conventional IDC cooling system.
Energies 15 09274 g009
Figure 10. Saturation temperature comparison for novel hybrid IDC cooling and conventional IDC cooling system.
Energies 15 09274 g010
Figure 11. Power consumption comparison for novel hybrid IDC cooling and conventional IDC cooling system.
Energies 15 09274 g011
Figure 12. COP comparison for novel hybrid IDC cooling and conventional IDC cooling system.
Energies 15 09274 g012
Figure 13. MCT variation according to secondary fluid flow rate variation.
Energies 15 09274 g013
Figure 14. COP according to secondary fluid flow rate and OD air variation.
Energies 15 09274 g014
Figure 15. Cooling capacity according to EWT in hybrid mode.
Energies 15 09274 g015
Figure 16. Temperature difference across HX in free-cooling mode.
Energies 15 09274 g016
Figure 17. Saturation temperatures according to EWT in hybrid mode.
Energies 15 09274 g017
Figure 18. Power consumption according to EWT in hybrid mode.
Energies 15 09274 g018
Figure 19. COP according to EWT in hybrid mode.
Energies 15 09274 g019
Figure 20. Annual water temperature for Soyang dam in Republic of Korea.
Energies 15 09274 g020
Figure 21. Integrated COP comparison for cooling systems.
Energies 15 09274 g021
Table 1. Specification of both conventional and hybrid test unit.
ComponentsTypeSpecifications
CompressorScroll3.5 kW
Evaporator
(Multi-function HX)
Fin-tube heat exchanger
Countercurrent flow
15 kW
CondenserFin-tube heat exchanger
Countercurrent flow
20 kW
Plate HXKaori plate HXMax. working temperature: 200 °C
Max. working pressure: 30 bar
Expansion device
Pump
Electronic expansion valve
Centrifugal pump
Step motor-driven (500 steps)
Table 2. Sensor specification.
SensorsSpecification
ManufacturerModel or TypeAccuracy
Pressure transducerSetra System Inc.C206 ± 0.13 % of reading
ThermocoupleOmegaT-type ± 0.2  
RTDWatlowA class ± 0.05  
Volumetric flow rateMadger meterMagnetic ± 0.5 % of reading
Power meterYokogawaWT 330 ± 0.1 % of the full range
Table 3. Test Conditions.
ParametersConventional CycleForced-Cooling ModeFree-Cooling Mode
IDDB ( ) 26.719.426.719.426.719.4
WB ( ) 21.115.621.115.621.115.6
ODDB ( ) 30.6, 26.7, 16.7, 12, 7--
WB ( ) 24, 15.6, 6
EWT ( ) 30, 25, 15, 10, 713, 10, 9, 8, 7
EEV6 6 -
Table 4. Uncertainty analysis of experimental data.
ParameterUncertainty According to Operating Mode %
Conventional Forced-CoolingFree-Cooling
COP2.963.013.23
Capacity2.52.542.86
Table 5. Summarized water data for Soyang dam.
Water Temperature, °C
Year Min.Max. Average
20174.815.908.71
20185.0612.558.64
20195.5717.447.22
20206.1718.3511.66
Table 6. Water temperature data for average weighting in the Republic of Korea.
#ProvinceRepresentative YearHours 18.3 12.8 < Hours ≤ 18.3 7.2 < Hours ≤ 12.8Hours ≤ 7.2
Hours%Hours%Hours%Hours%
1Gangwon-Do (Soyang-Dam)202060.0181016,56449.98711,41134.43516215.57
2201900.000001740.5310,24630.9122,72368.56
3201800.0000000.0026,38279.60676120.40
4201700.0730822.015,53946.910,29631.1
TEST TYPE A B C D
AVERAGE20.0601218.115,89548.011,23633.9
Table 7. Performance of cooling systems.
SystemTest TypeTemperature ConditionWeighted AverageWater Flow Rate (lpm)MCT (°C)
Conventional air source IDC cooling systemA350.085N/AN/A
B26.70.306
C18.30.387
D4.40.222
Hybrid IDC cooling system utilizing deep water source from damA28.3042/729.15
B21.10.181
C12.80.48
D7.20.339
Table 8. Climate bin temperature data for normalized weighting.
#Representative City 26.7 °C18.3 °C–26.7 °C 4.4 °C–18.3 °C≤4.4 °C
Hours%Hours%Hours%Hours%
1Jeonju99511.2260429.2318435.8212123.8
2Seogwipo93410.5321936.2444349.93073.4
3Yeosu4465.0300633.8397744.7147516.6
4Cheongju 91110.2250528.1276131.0272730.6
5Cheonan7468.4251728.3289132.5275030.9
6Incheon4344.9288132.4336937.8222024.9
7Pohang7979.0286032.1369041.4155717.5
8Changwon6207.0297333.4393844.2137315.4
9Suwon6807.6268230.1315935.5238326.8
10Gwangju96910.9274630.8316035.5202922.8
11Cheolwon4394.9236326.5311235.0299033.6
12Busan-Gimhae7989.0275631.0386243.4148816.7
13Seoul 8449.5262529.5306634.4236926.6
14Daegu105111.8250428.1356640.0178320.0
15Daejeon7828.8263329.6310434.9238526.8
16Ulsan7278.2266429.9387943.6163418.4
TEST TYPE A B C D
AVERAGE7618.5272130.6344838.7197422.2
Publisher’s Note: MDPI stays neutral with regard to jurisdictional claims in published maps and institutional affiliations.

