Article

Urban Hydrogen Production Model Using Environmental Infrastructures to Achieve the Net Zero Goal

Green Energy Strategy Institute, 409, 1-Gwan, 22, Teheran-Ro 7 Gil, Seoul 06130, Republic of Korea
*
Author to whom correspondence should be addressed.
Energies 2022, 15(24), 9293; https://doi.org/10.3390/en15249293
Submission received: 26 October 2022 / Revised: 30 November 2022 / Accepted: 2 December 2022 / Published: 7 December 2022

Abstract

:
Land available for energy production is limited in cities owing to high population density. To reach the net zero goal, cities contributing 70% of overall greenhouse gas emissions need to dramatically reduce emissions and increase self-sufficiency in energy production. Environmental infrastructures such as sewage treatment and incineration plants can be used as energy production facilities in cities. This study attempted to examine the effect of using environmental infrastructure such as energy production facilities to contribute toward the carbon neutrality goal through urban energy systems. In particular, since the facilities are suitable for hydrogen supply in cities, the analysis was conducted focusing on the possibility of hydrogen production. First, the current status of energy supply and demand, and additional energy production potential in sewage treatment and incineration plants in Seoul, were analyzed. Then, the role of these environmental infrastructures toward energy self-sufficiency in the urban system was examined. This study confirmed that the facilities can contribute to the city’s energy self-sufficiency and the achievement of its net-zero goal.

1. Introduction

Cities intensively consume energy and are highly limited in energy self-sufficiency. Cities account for over 70% of global CO2 emissions, most of which come from industrial and motorized transport systems that use huge quantities of fossil fuels and rely on far-flung infrastructures constructed with carbon-intensive materials [1]. To maintain smooth functioning, many cities outsource much energy from a long distance [2].
Urban areas consume between 67% and 76% of global energy consumption [3]. Such characteristics of the urban energy system cause considerable inefficiencies in the entire national energy system. To reduce the inefficiency of long-distance energy supply networks, cities need to have adequate energy production capacities. The metropolitan areas in Korea consume more energy than other regions, causing challenges in investment and operation of the national energy system. Therefore, increasing the energy self-sufficiency levels of cities is crucial as it increases the efficiency of the entire system.
Cities recommend a reduction in energy demand as a priority measure to achieve carbon neutrality. Reducing energy consumption in urban energy systems could, therefore, profoundly contribute to achieving carbon neutrality. Moreover, considering available land limitations for construction of energy production facilities in cities, it is ideal to identify alternative energy sources by converting existing energy consumption to a more carbon-neutral way.
Meanwhile, as urbanization accelerates, energy consumption and various types of services and products increase rapidly. Previously, the environment has been poorly managed, but its role is becoming important as a large-scale source of embedded energy in cities. Environmental facilities, such as wastewater treatment plants and waste incinerators could be potential large-scale energy production facilities [4,5]. Oil, heat, and electricity are the main energy sources used [6]. Currently, oil accounts for the highest portion of energy consumption. As the global trend of internal combustion engine phase-out spreads, the demand for these engines will decrease. Furthermore, heat pumps will replace liquefied natural gas (LNG) for heating demand [7,8]. On-site produced hydrogen from environmental infrastructures can be used to meet transportation and electricity generation demands. This could contribute to improved urban energy system reliability; hence, the active promotion of use of hydrogen in major cities’ net zero plans [9].
Studies on various ways to utilize waste as an energy source are underway owing to its importance as an alternative energy source in cities. Biogas, which can be obtained from organic waste resources, has great benefits in that it can be converted into energy while addressing environmental problems. Song et al. [10] analyzed technological issues and development trends related to biogas-based extracted hydrogen and considered applications for its commercialization. Hong et al. [11] performed modeling and economic analysis of the hydrogen production process using food waste generated in cities. As a result, within 15 years, this process could be quite economical with a 20.25% internal rate of return. In addition, various studies have been conducted from the stages of technology development to its utilization, such as the environmental benefits of hydrogen production using waste resources in cities, socio-economic effects, and technological efficiency improvement [12,13,14,15]. Recognizing that securing public acceptance is essential for utilizing hydrogen in cities, several studies have been conducted, such as risk factor analysis and optimal location selection to ensure public safety [16].
In this context, this study estimated the potential energy embedded in environmental infrastructures as the main objective. Environmental infrastructures such as sewage treatment and incineration plants could potentially contribute to the energy self-sufficiency of the neighboring areas. In particular, this study focused on estimating potential hydrogen quantity production from methane generated from wastewater, which has a greater impact on global warming. Contribution to energy self-sufficiency was calculated assuming that the facility’s energy consumption can contribute to self-sufficiency and supply the remaining production to neighboring areas.
We selected Seoul as a case study and analyzed how much energy, specifically hydrogen, can be produced through Seoul’s sewage treatment and incineration plants. In Section 2, we introduce the methodologies of the study. For the analysis, the current state of energy consumption in Seoul was investigated and the energy consumption per unit area in Seoul was derived. Next, the systems that produce energy in the sewage treatment and incineration plants were identified, and the processes for calculating the energy potential were determined. The energy production systems did not reflect the difference in production efficiency seasonally and hourly but were designed as annual production systems.
In Section 3, based on the designed systems, the amount of energy production potential, especially potential hydrogen production, in Seoul is calculated and presented. It was assumed that hydrogen was produced by reforming methane gas at the sewage treatment plant and by water electrolysis at the incineration plant with the power of a cogeneration generator using waste as fuel. In addition, by comparing the energy consumption and potential energy production of each facility, the amount of surplus energy that can be supplied to the neighboring areas was calculated.
In Section 4, based on the results, we explain that cities could use environmental infrastructures as energy production facilities and utilize them in achieving carbon neutrality. Finally, we recommend policies that decision-makers can implement to realize these possibilities.

2. Materials and Methods

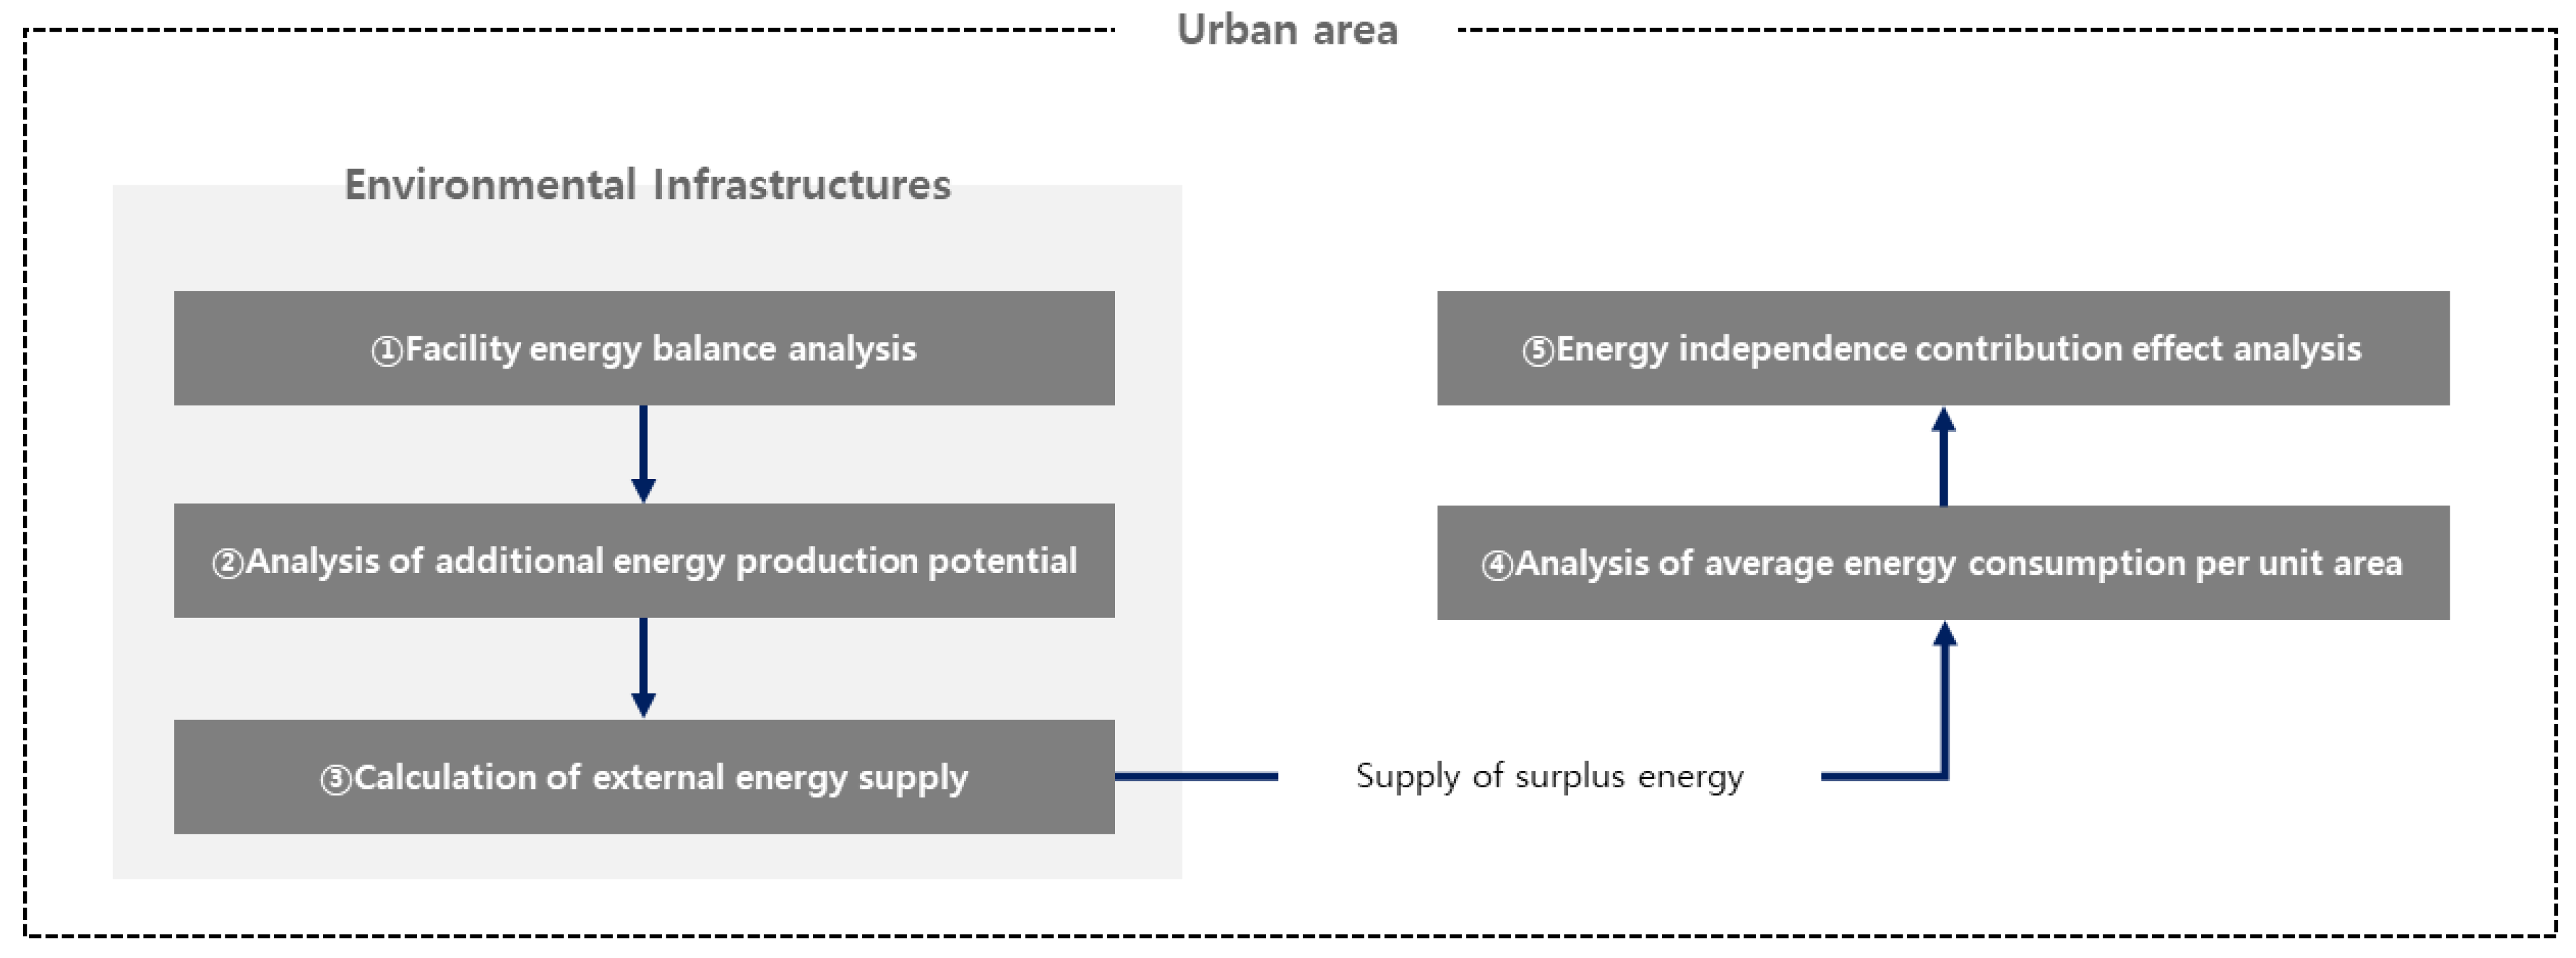
2.1. Research Methods

The energy demand and supply structure of sewage treatment and incineration plants, which are urban waste treatment facilities, was analyzed to determine their feasibility as urban energy production facilities.
For this purpose, the treatment process of each facility, as well as the energy flow and waste generation for each process, were assessed. Since there are no complete statistics that serve the purpose of this analysis, detailed data have been reconstructed using official and undisclosed internal data from central and local governments [17,18]. In addition, renewable energy sources that can be added to each facility were reviewed by considering the land area occupied by each facility and the facility’s improvement plan currently in progress. The process was designed so that fossil fuel and externally procured electricity currently consumed by each facility would be replaced by its own energy production. An investigation into excess energy that could be supplied to the surrounding areas was also conducted. Since the energy production of environmental infrastructure varies depending on the amount of sewage and waste to be treated, population and operation rate of the treatment facilities were considered in the analysis. Moreover, additional energy production was analyzed in view of increasing operational efficiency in the current facilities and expanding capacities.
Through the above series of analysis, the impact on the energy self-sufficiency of the city when energy production potential of the environmental infrastructure was used to the maximum was examined. To this end, the energy consumption per unit area was derived from the land planning, and the energy consumption status of Seoul, and the size of the area in which energy self-sufficiency is possible through excess energy supply, were analyzed quantitatively (see Figure 1).

2.2. Analysis of Energy Consumption Characteristics in Seoul

Seoul is the capital of Korea and the most representative city where energy consumption is significantly high. Seoul’s energy consumption is significant in the building and transport sectors. In particular, more than 60% of the total energy consumption is in the building sector. Oil, gas, and electricity account for approximately 30% of energy consumption by source, while heat energy, renewable, and other energy sources account for about 5% (see Table 1). Transportation fuel accounts for the majority of oil use, totaling about 63%, of which about 20% is used as aviation oil. More than 90% of power is used for heating and cooking purposes in buildings, and all of the heat energy is used in buildings. Seoul’s per capita energy consumption is much lower than the national average, in contrast to energy consumption per area, which is 22 times higher than the average. The city, which exhibits intensive energy consumption, requires effective use of land.
The city has various land uses, such as residential, commercial, industrial, and green areas, and various urban planning facilities are located to maintain the function of the city. The residential, commercial, industrial, and green areas of Seoul account for 53.8, 4.2, 3.3, and 38.6% of the total area, respectively. When classified by 26 land categories, the building site area is 219.8 km2, accounting for 36.3% of the total area of Seoul [20].
Land use in cities is very complicated depending on the composition and purpose of buildings, and consequently, energy consumption characteristics are very different. However, in this study, the energy consumption characteristics of cities were applied more simply. Assuming that the entire Seoul Metropolitan Government is divided by into certain areas, the proportion of the used districts in each area can be considered the same, and energy consumption can be assumed to be the same as the number of divisions.

2.3. Current Status of Seoul’s Environmental Infrastructure and Energy Production Capacity

Among urban infrastructures, sewerage and waste treatment facilities are representative environmental infrastructure (National Land Planning and Utilization Act). The purpose of these facilities is to maintain a pleasant environment by treating waste generated in the city. The main facilities for treating sewage and waste in Seoul are sewage treatment and incineration plants, respectively, which are operated in four locations each [15].
With the recent explosive population increase and energy consumption in cities, the use of large-scale waste resources has emerged as available energy is scarce [21]. Environmental infrastructure can produce energy by utilizing urban waste resources. The amount of energy that can be regenerated in these facilities is determined by the amount of sewage and waste emitted per capita. The sewage treatment and incineration plants, which are the subjects of this study, have different treatment processes, having significantly different characteristics such as the type or size of land use, energy use, and production. The amount of sewage and waste generated in Seoul is 4,180,275 m3/day, and 47,996 tons/day respectively, and the sewage treatment and incineration plants treat the entire waste [15].
The environmental infrastructure is built to maintain pleasant a quality of life through management of waste disposed. In general, due to the perception that waste is filthy, substantial local protests occur when such facilities are built in the area. Hence, most basic environmental facilities are often constructed outside of the city, and the land area occupied by these facilities is inevitably expanded as buffer areas with other land use areas. Recently, an improvement plan to relocate unpleasant facilities underground and open the ground to parks has been discussed. Therefore, not only energy can be produced through waste resources, but additional land use can also be recognized.

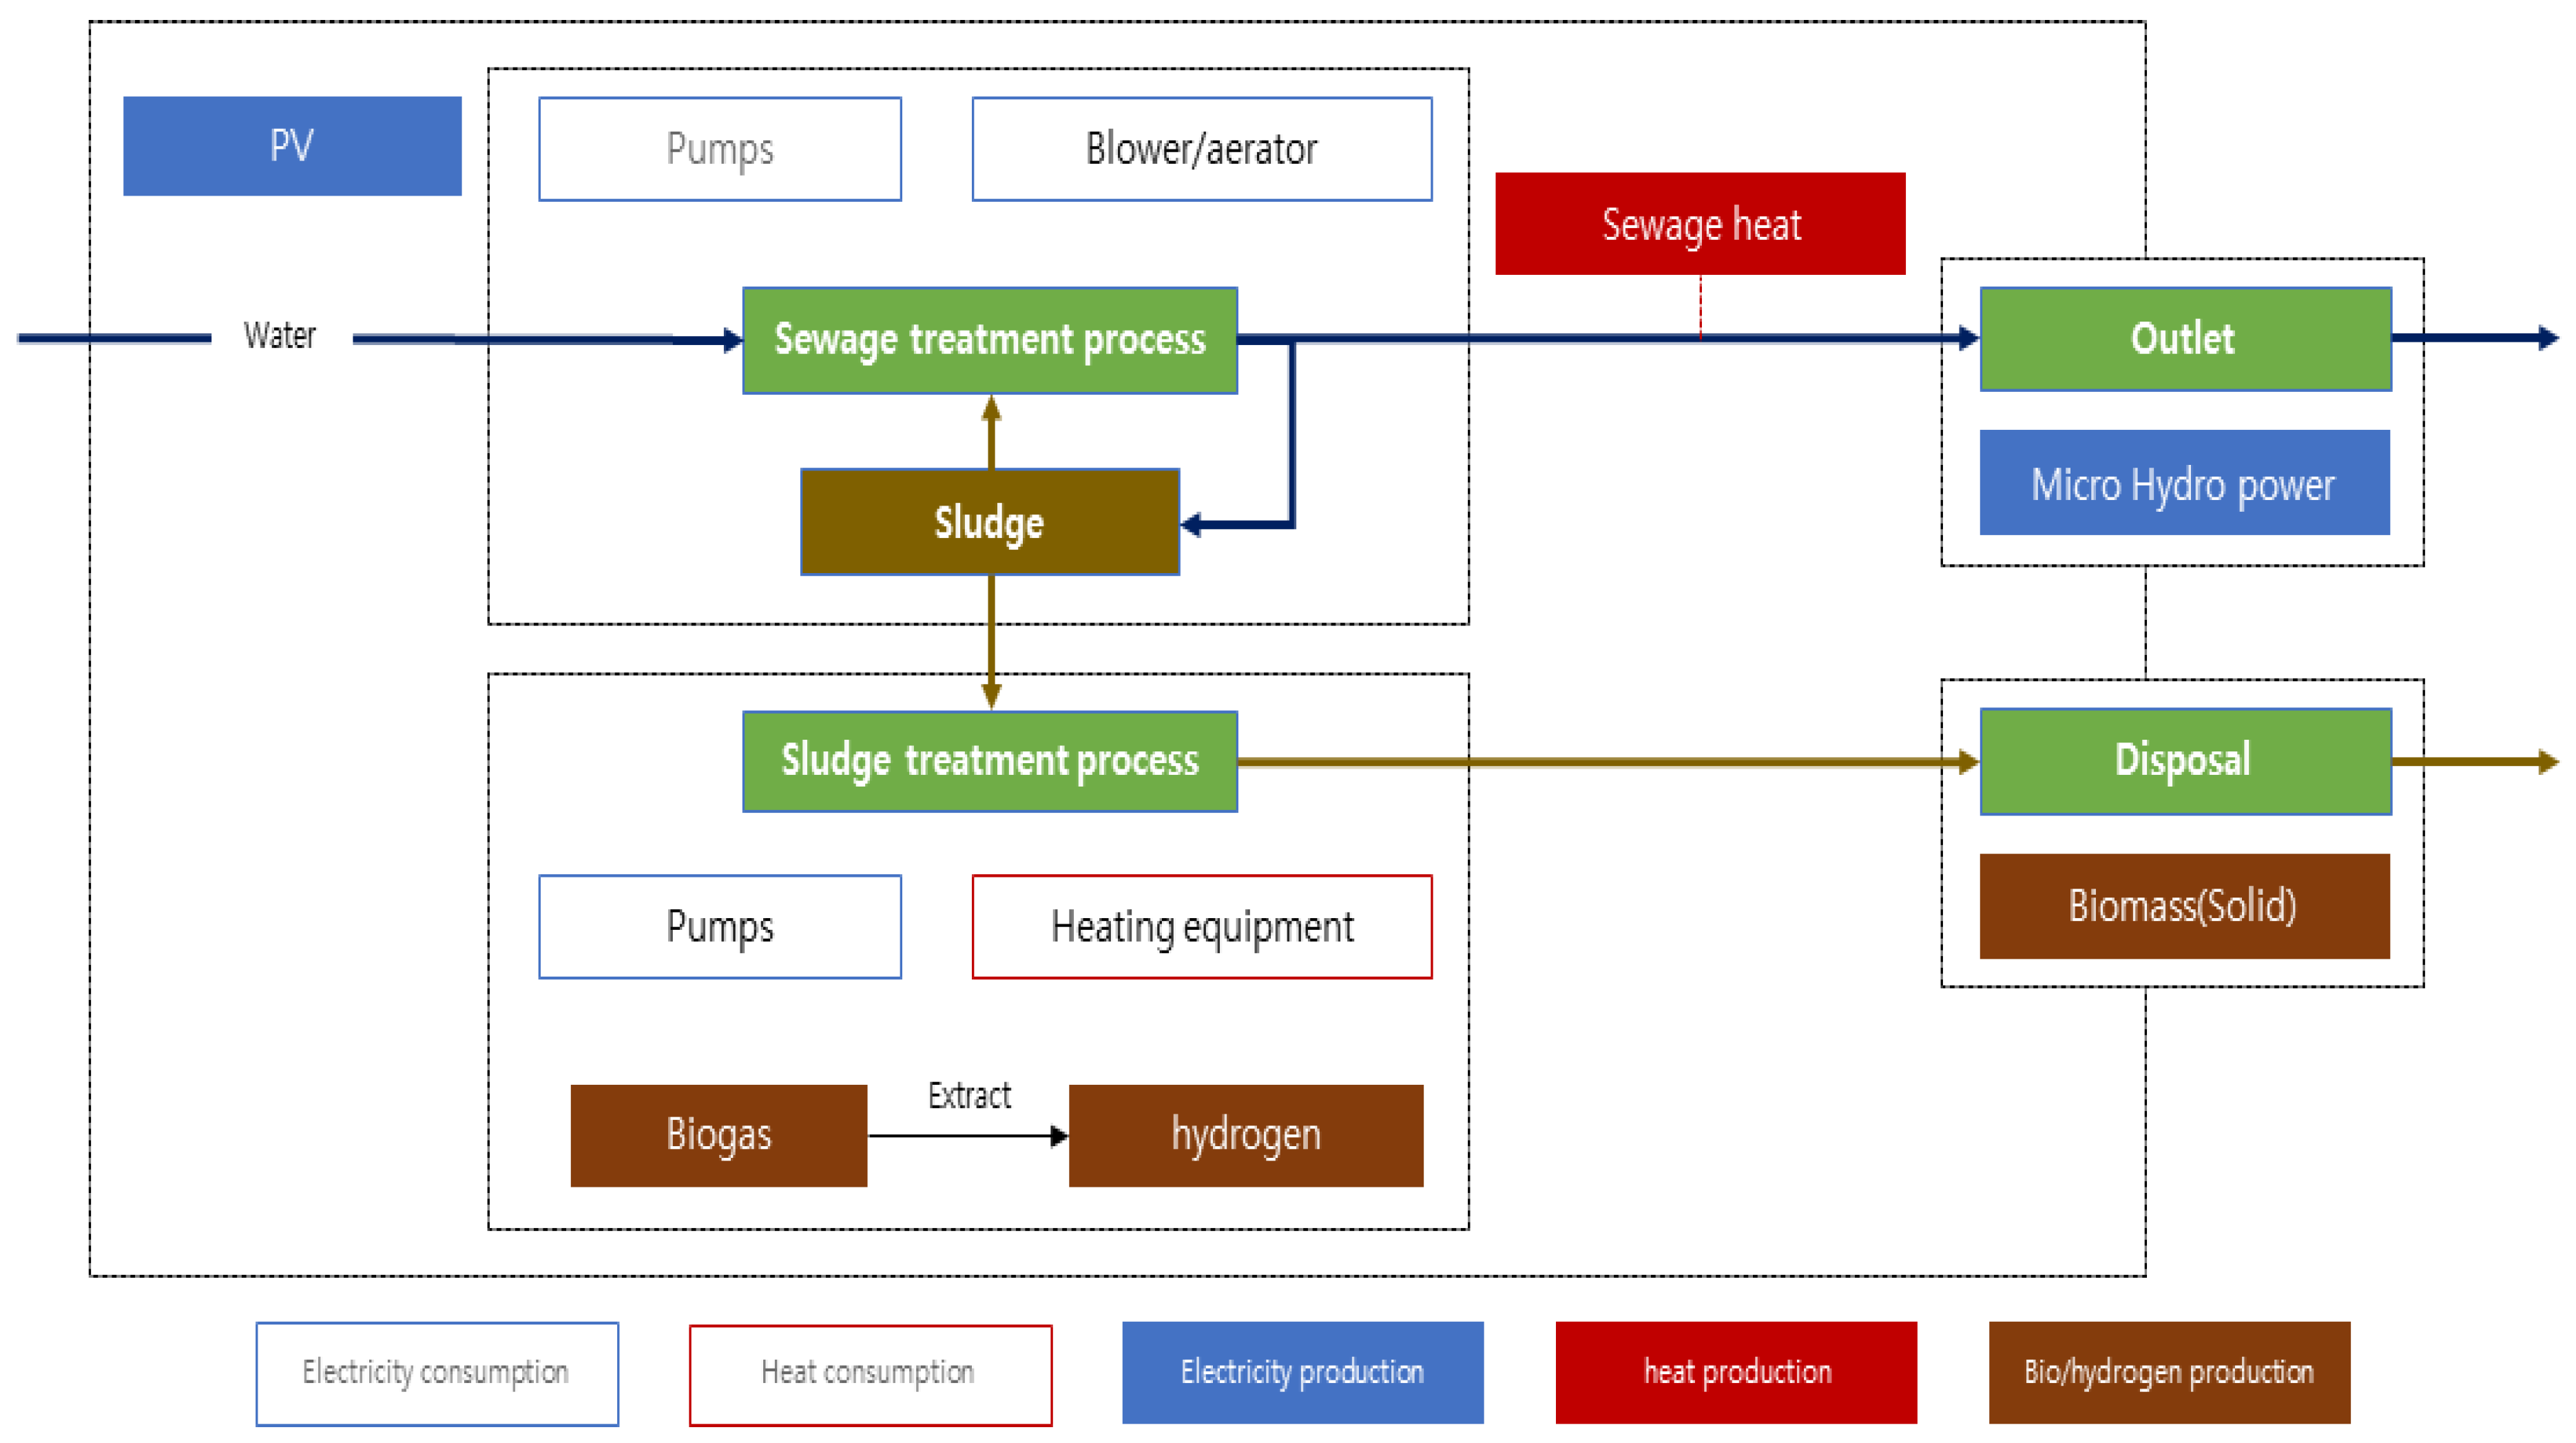
2.3.1. Sewage Treatment Plants

Sewage treatment plants are facilities that purify urban sewage. As a representative water treatment process, the Modified Ludzack Ettinger (MLE) method is used, and A2O, an active sludge method, biological membrane filtration, and four-stage Biological Nutrient Removal (BNR) are selectively applied for each facility [22]. Sewage treatment first separates heavy substances by a physical method and decomposes organic substances by a biological method. Methane gas is generated in the process of concentrating and re-decomposing the filtered organic material, and in this process, the organic material is dehydrated to produce solid biomass. In this way, the organic material contained in the sewage is regenerated as energy during the water treatment process. In this process, not only waste resources but also heat energy applied to water can be utilized. Even with low-temperature thermal energy, it is expected that the energy generated in proportion to the amount to be processed will be considerable. In addition, the finally purified water can be used for micro-hydroelectric power generation in the process of discharging it into a river. Sewage throughput does not fluctuate much throughout the year, so stable power generation is expected.
Recently, as sewage treatment plants have been renovated into underground water treatment facilities, additional energy production has also become possible depending on how to utilize the newly created unused land [23]. A method of installing solar power in a certain part of an unused site, or using the rooftop of a new building, is considered. Figure 2 below shows the energy production potential mentioned above, in addition to the energy consumption and waste generation of conventional treatment processes. In Table 2, the operation status of the drying and digester facility that converts waste into energy is shown. A large amount of produced biogas is not connected to demand and is, therefore, discarded.

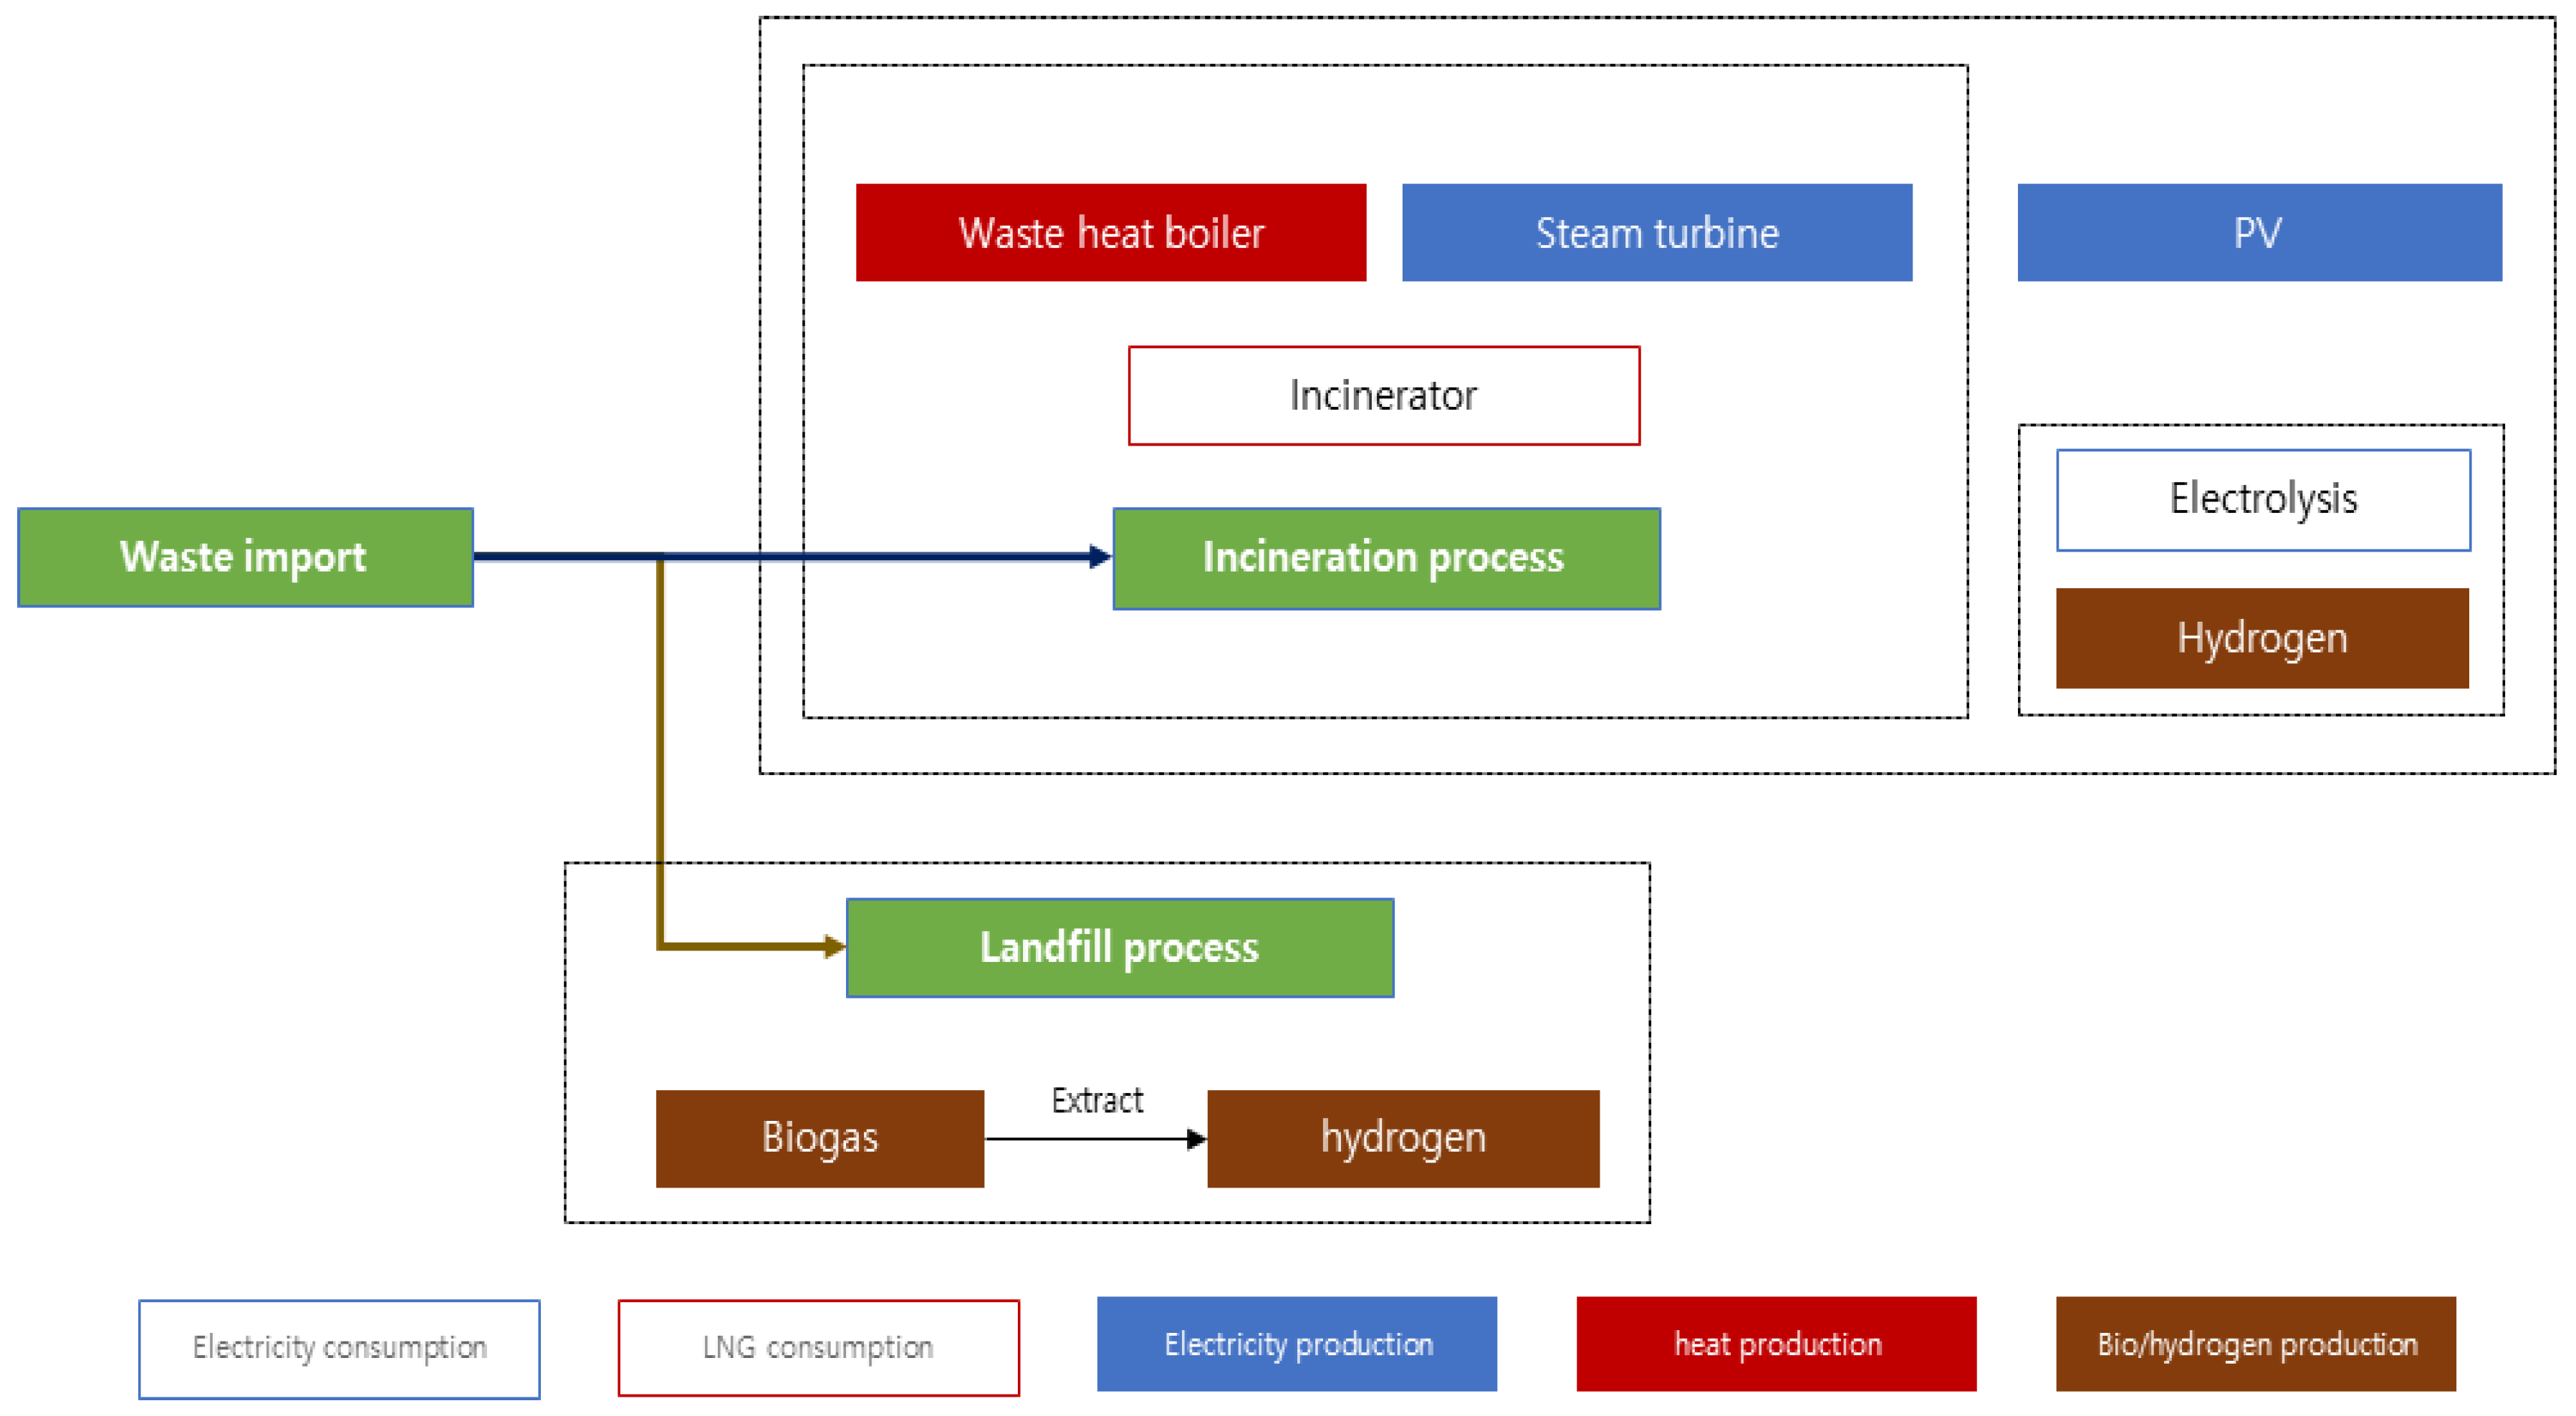
2.3.2. Incineration Plants

Incineration plants are increasingly important as facilities that incinerate waste generated in cities and resupply energy. Moreover, as waste in cities gradually increases, the need for energy supply through recycling and incineration is strengthening.
Recycling, incineration, and reclamation are typical waste disposal methods in cities. In the case of incineration, the treatment method can be distinguished between simple waste treatment and waste-to-energy. Methane gas from waste disposal is an important energy source for hydrogen production, mostly generated from landfills due to anaerobic decomposition of organic materials in landfill waste. Landfill gas is mainly composed of methane (CH4) and carbon dioxide (CO2) (45–60% and 40–60%, respectively), and other harmful substances including volatile organic compounds (VOCs) and hydrogen sulfide (H2S). Hydrogen production in landfills is conducted by first collecting landfill gas, pretreating the gas to remove moisture and impurities, and then reforming the extracted CH4.
Due to space limitation in cities, landfills that require large areas of land are very scarce. Currently, no landfill facilities are operating in Seoul, and about 4% of waste generated is transported to landfills outside the city [15]. In particular, the Seoul Metropolitan Government has been prohibited from using landfills for household waste disposal from 2026, through enforcement of the Waste Management Act, promulgated in 2021 [24]. For this reason, only the incineration treatment system was considered in this study, and the operation status of the incineration plant currently operated in Seoul is shown in Table 3.
Incineration plants destroy waste at a temperature of 850 °C or higher, and collect the waste heat (400 °C) produced in the process to generate electricity. After that, high-pressure steam, cooled to about 120 °C, is supplied as a local heating source around the incineration plants [25]. Recently, incineration plants, such as sewage treatment plants, have been actively renovated into underground incineration facilities and utilize space on the ground in three dimensions, enabling additional solar power generation on unused sites. In addition, although the land area occupied by the incineration plants is much smaller than that of the sewage treatment plants, the concentration of energy production generated through the incineration of waste is rather high, so hydrogen production by water electrolysis can be undertaken using the power and heat produced. High-efficiency hydrogen production can be performed with a heat source of 120 °C, which is generated in the treatment process [26]. As shown in Figure 3, waste generated in the city is converted into electricity and heat in the incineration system and, if necessary, is produced again as hydrogen.

3. Results

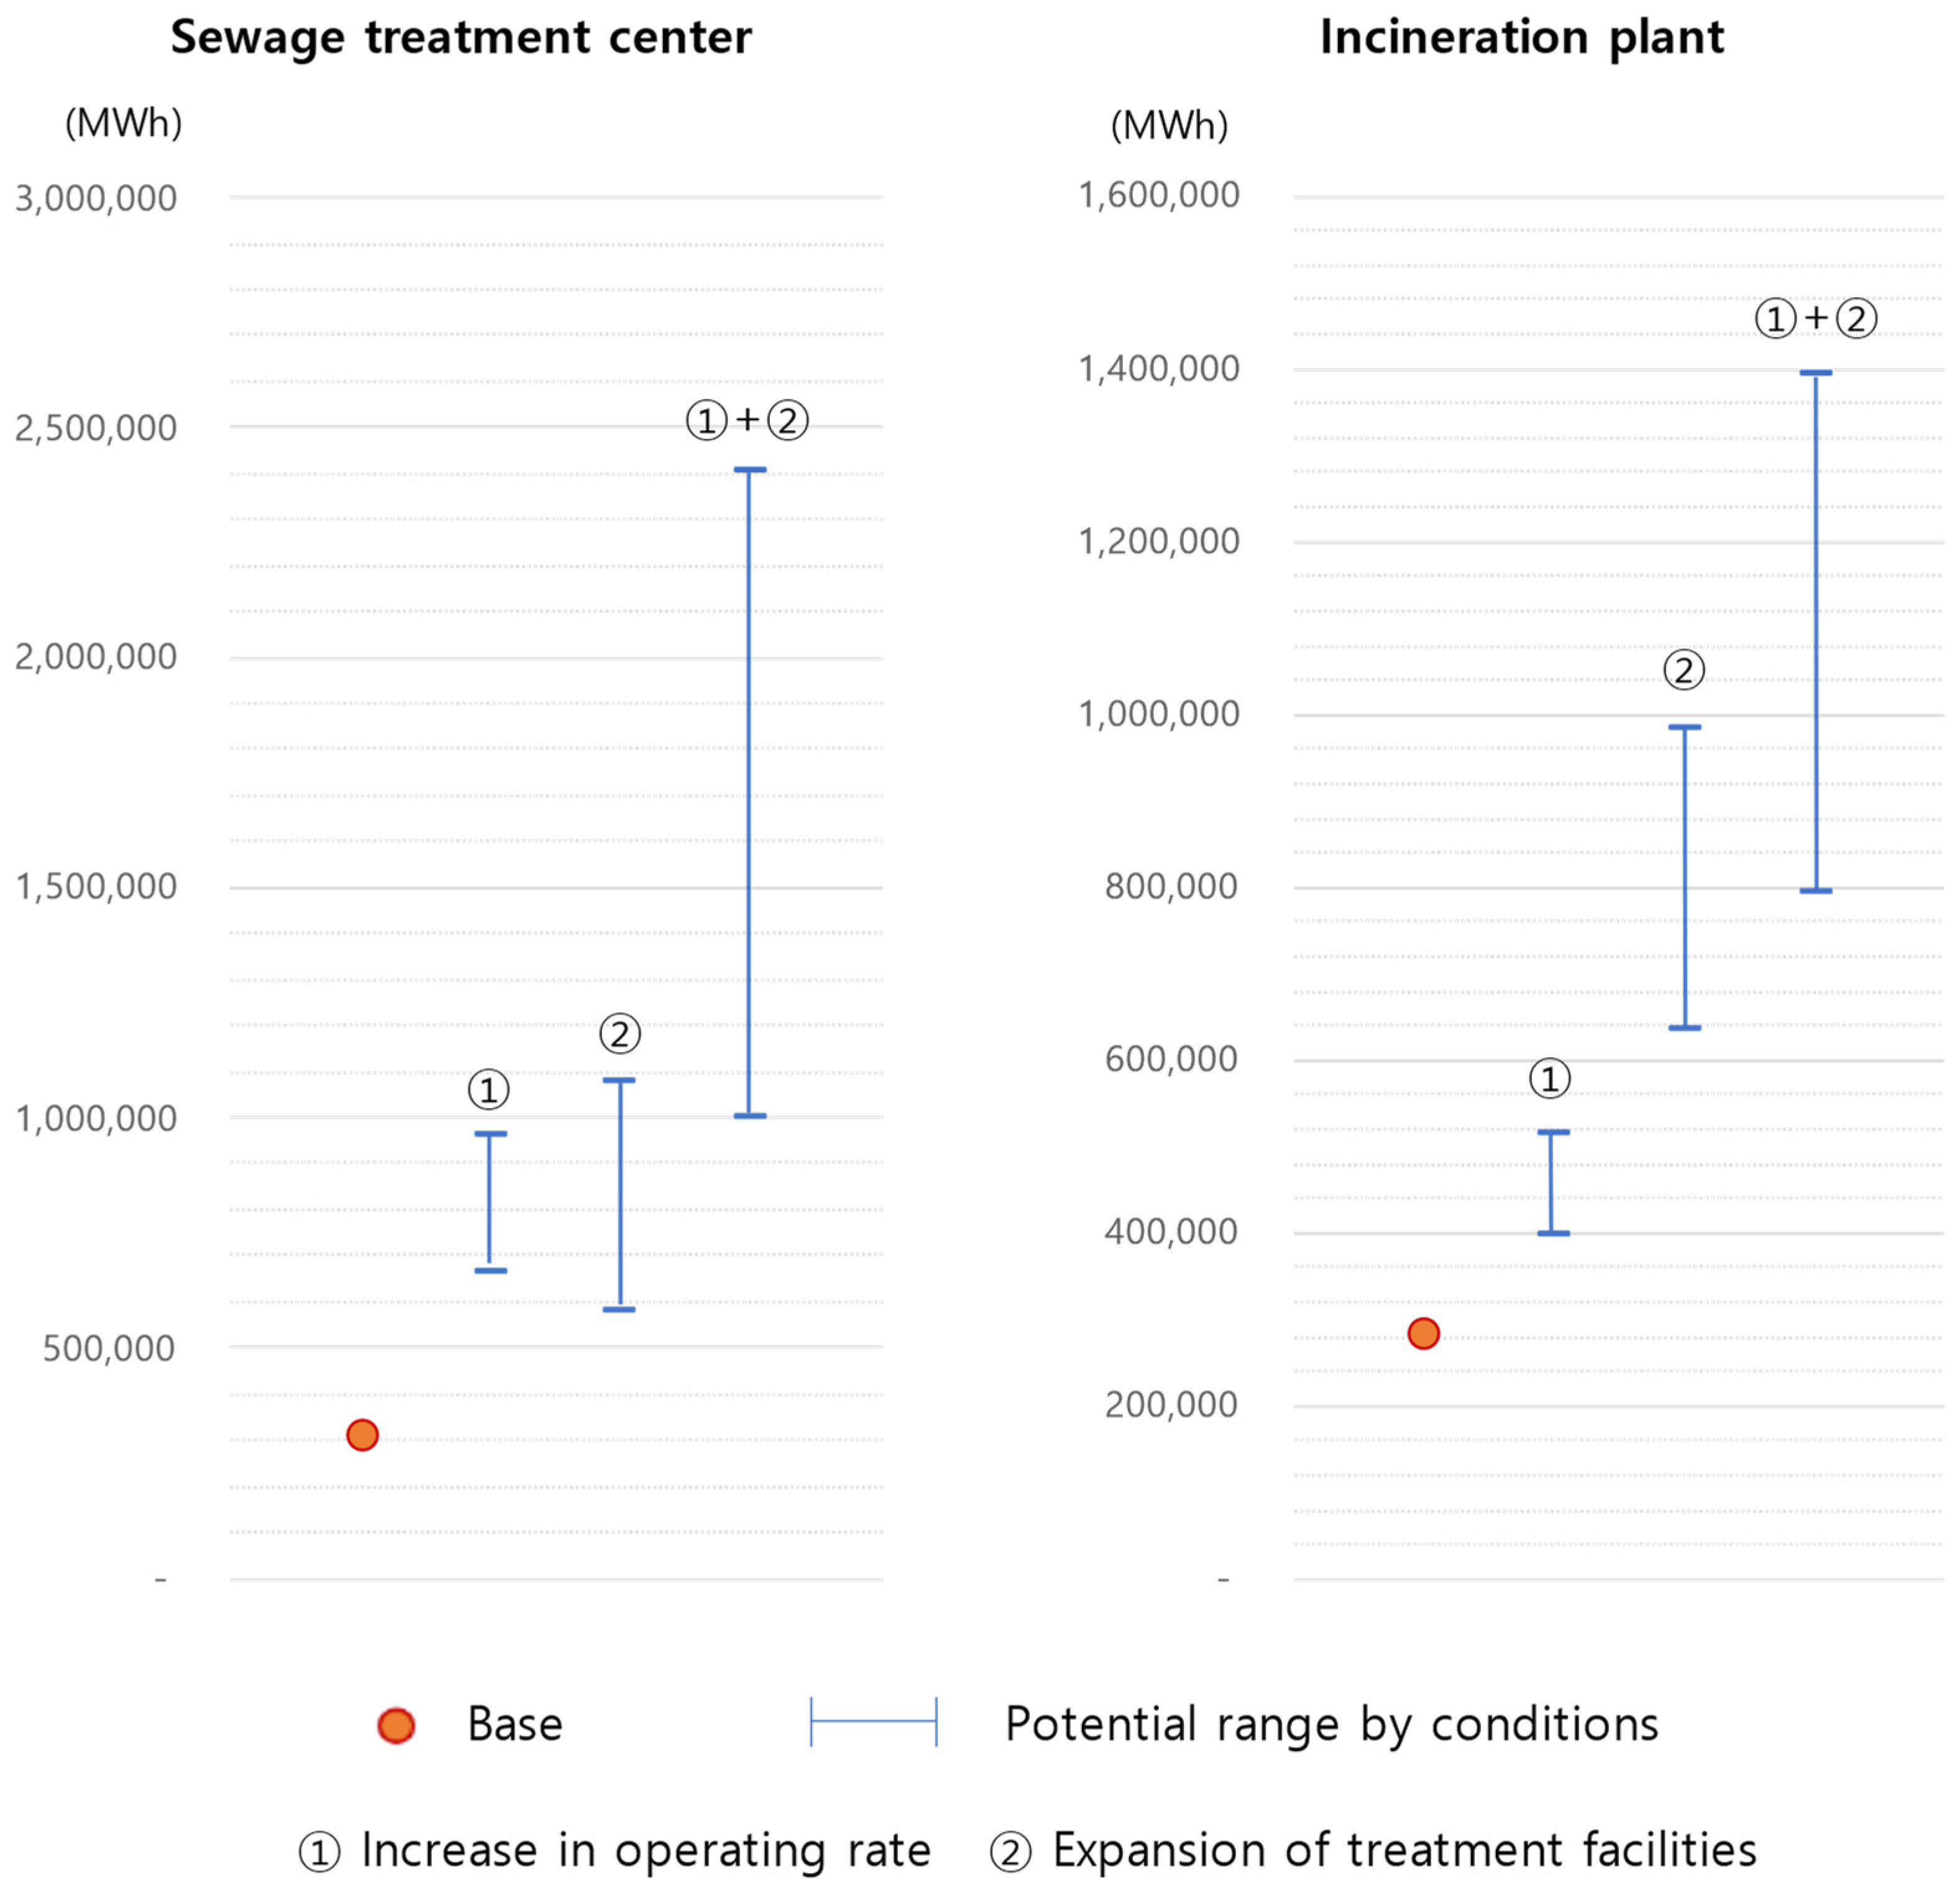
3.1. Energy Production Potential of Environmental Infrastructure

3.1.1. Sewage Treatment Plant

The energy self-sufficiency level of Seoul’s sewage treatment plants is very low, at approximately 23%. The government has various plans to improve the energy self-sufficiency of sewage treatment plants; however, energy self-sufficiency and energy supply outside the city can be achieved only when the energy consumption structure is changed, and production capacity is secured in facilities. In other words, it is more efficient to change the energy consumption structure rather than focusing on energy self-sufficiency itself. A total of 17% of the biogas produced in sewage treatment plants is still burned, and some of the remaining gases are flared. Therefore, the potential for energy production was investigated when the use of biogas and waste resources is increased by considering external factors.
Sludge and by-products generated in the water treatment process may be used in various ways. In particular, the advantage is that it can be supplied by reforming with hydrogen. Depending on how the water treatment process is operated, the amount of biogas and solid biomass varies. More biogas production can be expected by efficiently improving the operation of the digester. Currently produced biogas and solid biomass are first used in their processes, and some are sold outside, while the rest is discarded (see Table 2). Therefore, after using discarded energy as efficiently as possible, additional consideration should be given to how to replace energy sources that are utilized by themselves. For example, rather than using biogas to increase the temperature of the digestion tank, converting it into hydrogen and the necessary heat using sewage heat and heat pumps can be considered.
Biogas produced by sewage treatment plants is used as fuel in heating and incineration facilities in digestion tanks and drying facilities (see Table 4). However, rather than consuming biogas for heating, it is necessary to replace the gas with electricity and unutilized heat, and converting it into hydrogen and supplied where necessary. This is because the heating of the digestion tank is sufficient using water heat and heat pumps, and the remaining power can be supplied for small hydropower, solar power, and solid biomass incineration. Solar power can be installed using settling tanks, bioreactors, building rooftops, and vacant sites in sewage treatment plants. The installation can be at a scale of 9,900 m2 per MW on 15% of a sewage treatment facility area [17,27]. An average height of 2 m at the discharge opening was used for the generation of electricity from small hydroelectric power plants, and production increased in proportion to the amount of sewage treatment [28]. For biomass, energy production was calculated by applying the dry weight reduction rate based on 10% of the moisture content of the sludge during drying, reflecting the average actual calorific value [18,22,29]. Most of the oil and LNG fuels that are externally supplied are used in engine pumps and are, therefore, are easy to electrify. The additional output generated in each process is shown in Table 5.
Energy self-sufficiency for each facility can be achieved by converting additional energy production and consumption structures. Biogas generated in this process can be supplied outside the facility. In the current situation where some of the biogas is discarded, the remaining biogas can be reformed to produce and supply considerable hydrogen on-site in the city. The hydrogen production potential was calculated as follows:
P H 2 = R e f o r m a b l e   B i o g a s C o n t e n t   o f   CH 4 × E F F
where Reformable Biogas is the total amount of biogas generated minus essential demand. Essential demand includes biogas for sale and self-consumption which is difficult to replace with other energy sources. In general, about 60–70% of the biogas generated in the digester is composed of CH4. On the other hand, since LNG is composed of 80–99% CH4, the purity difference between them is reflected [33]. Finally, hydrogen production was calculated by applying a reforming efficiency of 76%, according to the specifications of the Osaka Gas HYSERVE-300 model [32].
Hydrogen production can be attained by increasing the operating rate of the digestion tank. Currently, the residence time at each facility is very widely set from 22.8 to 51.3 days. This is believed to be because there is no demand for a digestion tank, so the operation rate is not increased.

3.1.2. Incineration Plant

After collecting waste, the incineration plants identify the reusable/recyclable parts and incinerate the remaining waste to become energy. Other methods of energizing waste are to chemically recycle plastic or to manufacture and use solid molding fuels such as solid refuse fuel (SRF).
From the energy consumption status of the resource recovery facility, the LNG and electric power required for the facility are supplied from outside (Table 6). The incineration plants produce and supply power and heat through the incineration of waste, but do not recover the energy of all incinerated wastes. The amount of heat generated by the waste brought into the incineration facility is 2842 kcal/kg, which is higher than the design heat generated by the incineration facility of 2694 kcal/kg [29]. However, it is much lower than the average caloric value of 3992 kcal/kg of waste injected into a standard plastic garbage bag.
In this study, when the design caloric value of the incineration facility was applied, and the energy that could be recovered to the maximum from the current incineration amount was estimated as an additional production potential. In addition, it was assumed that solar power generation using unused land is feasible. Beyond consuming the energy needed for the facility, surplus energy can be used to produce hydroelectric hydrogen. This is because the heat energy of 200 °C or more generated in the process of the incineration plants can be used to increase the production efficiency of hydrogen.
Incineration plants are also actively promoting underground facilities. Fifty percent of the land area can be used as ground space, of which 2462 MWh of electricity can be generated annually, assuming that solar power is supplied to 15% of the area. Assuming that all energy from the waste being incinerated can be recovered without considering the loss of heat from the waste, the additional potential energy expected is 664,804 MWh. The additional power produced by the incineration plants is expected to reach 284,204 MWh of hydrogen (see Table 7).
P H 2 = ( E P r o d u c t i o n E C o n s u m p t i o n ) × R E l e c t r i c i t y × E F F
where Eproduction is the sum of the PV production and the energy produced by waste incineration, and the amount of energy generated by waste incineration was recalculated based on the design calorific value. Equation (2) means that the facility achieves energy independence, maintains the existing external energy supply, and uses the excess energy to produce hydrogen. It is assumed that the excess energy is produced in the same proportion of electricity and heat, and the produced electricity is used for water electrolysis to produce hydrogen.

3.2. Additional Utilization of Waste Resources and Contribution to Energy Self-Sufficiency

The proportion of energy produced using organic waste resources is currently very low. However, as the government plans to increase the proportion of energy sources, energy production through the facilities is expected to increase significantly. To make full use of existing facilities, it can be considered by expanding the method of increasing the operation rate or expanding the size of existing treatment facilities [34]. This is because the size of the current treatment facility is insufficient to treat (energy) generated waste. Therefore, it is estimated that the potential of waste resources can be strengthened by the following two-step plan: (1) strengthen the operation rate under the same facility size condition; (2) add new waste resources and facilities (integrated treatment of food waste, excrement, etc.)
In the case of sewage treatment plants, the operation rate is currently very low [23]. The amount of biogas thrown away after not being used is considerable. If hydrogen is to be produced and supplied smoothly through biogas, as in this study, it would be economical to increase the operation rate to meet the demand for hydrogen. Currently, the input amount of each sewage treatment plant compared to the digestive tank capacity varies from 1/22 to 1/51. In general, it can be seen that the facility is not fully utilized when comparing the stay period within 30 days in the digester tank. If the facility operates under the conditions of a stay of 30, 25, and 20 days, additional biogas production will occur, which can lead to hydrogen production potential.
Further analysis was conducted assuming that the expansion of the digestive tract to the level planned by the government was considered [16]. As shown in Table 8, it was calculated that hydrogen production would be 2.11–3.05 times and 1.83–3.41 times higher, respectively, in the two cases as follows. In addition, when both methods are applied simultaneously, hydrogen production can be increased by up to 7.61 times (see Figure 4).
A similar method was applied to incineration plants to review the additional use of waste. First, this study looked at the potential for additional energy production when the current incineration facility operation rate of 71–89% is increased to 100%. In addition, the potential amount when the proportion of landfill is reduced and the incineration is increased was examined. Currently, Seoul’s waste is treated at a rate of 88, 5.6, 4.2, and 2.1%, in the order of recycling, incineration, landfill, and others. Since reclamation is a concept of sending waste generated in cities to the outside for disposal, if waste is converted into resources it can be considered that internal resources are leaked to the outside. Therefore, it was considered to expand the proportion of incineration under the premise that all internally generated wastes are treated internally. As shown in Table 9 below, hydrogen production increases by 1.41–1.82 times when the utilization rate is increased, and by 2.24–3.47 times when incineration is expanded. In addition, hydrogen production is expanded up to 4.91 times through the combined application of these two factors. In addition to the production of hydrogen, the production of heat energy is also expanded at a similar rate (see Figure 4).
Seoul’s energy self-sufficiency level is about 5%, and most of the energy is externally supplied. The current environmental infrastructure has a high proportion of external energy supply. However, the potential energy production of environmental infrastructure is significant, and facility’s energy self-sufficiency, as well as the remaining energy, can be supplied to the surrounding area. In particular, since waste resources in cities are generated in proportion to the number of people, the potential for waste utilization in cities with high population density is higher.
This study classified the energy consumption of Seoul into a certain area scale (see Table 10) and investigated the effect on the surroundings through changes in the facility. In addition, it analyzed to what level the energy self-sufficiency rate could be improved through the use of additional waste resources.
The results of examining the energy self-sufficiency in a certain area where the basic environmental facilities are located are shown Table 11 below. Sewage treatment plants can produce about 2.8–4.3 times more energy than each facility needs, and incineration plants can produce 15.3–28.1 times more energy. The water treatment process at the sewage treatment plant takes approximately a month, and the size of the facility is inevitably increased due to the large volume of water, while the incineration plants can produce much energy in a relatively small area.
This increase in energy production has a significant impact on energy self-sufficiency in the surrounding area, and energy self-sufficiency is possible for an additional area of up to 5.6 times and 63.9 times compared to the facility area of each sewage treatment and an incineration plant.
Increased production of electricity, heat, and hydrogen in environmental infrastructures can contribute to achieving net zero in cities. This is because most of the oil consumption is concentrated on transportation fuel, and gas is used for heating buildings. The expansion of the supply of electric vehicles can dramatically increase the reduction of final energy consumption due to differences in efficiency, and the supply of thermal energy can also significantly reduce the use of gas. In addition, hydrogen is used as fuel for large passenger and cargo vehicles, which can have a significant carbon reduction effect, similar to electric vehicles.

4. Conclusions

Urban areas, which account for more than 70% of global greenhouse gas emissions, must promptly improve their energy systems to achieve their carbon-neutral goals by 2050. Efforts to reduce consumption by increasing energy efficiency are necessary, but it is also important to identify embedded energy sources and utilize them. This study discovered the possibility of implementing waste to energy.
Environmental infrastructures are sources of air pollution and odors, and citizens are reluctant to locate these facilities near their residences. However, since these infrastructures are essential facilities for maintaining healthy urban functions, it is necessary to use them and their sites to benefit residents. Sewage treatment and waste incineration plants consume, and also have abundant, embedded energy. Therefore, they can transmit abundant energy not only to the area where the facility is located but also to neighboring areas. Moreover, since developing a city’s circular economy system is important, “waste to energy” should be the main policy for the municipalities.
This study analyzed the case of Seoul. All major cities have sewage treatment and incineration plants as essential facilities. Installation of energy production facilities in the environmental infrastructure could achieve waste to energy.
There are additional benefits to reducing the total energy load on cities. Cities can produce more energy in an eco-friendlier manner if they change the operational modes and treatment methods. In this respect, the environmental infrastructure is suitable for urban net zero and various energy supply facilities. The progress of urbanization and the increase in resource consumption are factors that eventually increase the generation of waste, and it can be expected that the potential as an energy source for these facilities will gradually increase. The use of waste from cities as energy is ideal for resource circulation, and desirable for increasing energy self-sufficiency in cities.
Sewage treatment plants can produce biogas through fermentation tanks. Inside the complex, small-scale hydroelectric generators can be installed using waterfall height, as well as solar photovoltaic (PV). Hydrogen can be produced by reforming the produced biogas. Waste incinerators can produce heat and electricity through cogeneration generators that use waste as fuel. Electrolysis can use this electricity to produce hydrogen. When a city needs to provide hydrogen, the environmental infrastructures within cities can be the on-site hydrogen production facilities.
In the case of Seoul, the environmental infrastructure currently in operation can increase energy production through changing the operational mode or increasing the facility capacity. This would allow for delivery of excess energy to neighboring areas.
According to our results (Table 11), potential surplus energy from the sewage treatment plants is more than its self-consumption by 1.9 times (Jungnang plant) and up to 7.2 times (Seonam plant). The surplus energy production potential of the incinerator is much greater, ranging from a minimum of 24.5 times (Gangnam plant) to a maximum of 49.8 times (Nowon plant). Sewage treatment plants have high production potential, but the energy consumption required for the process of purifying water is much higher than that of waste incineration plants.
In this process, potential hydrogen production in sewage treatment plants is currently 316,183 MWh, but can be increased up to 1,079,063 MWh through process improvements or facility expansion (Table 8). In the incineration plant, the current 284,204 MWh potential can be increased to a maximum of 986,940 MWh through process improvements or facility expansion (Table 9).
With the aging of environmental infrastructure facilities in Seoul, plans to improve these facilities have been promoted recently. However, major discussions on the purpose of environmental improvement are limiting progress. It is desirable to change the direction of the discussion toward improving operational methods to produce more energy. Considering the long lifespan of environmental facilities, facility replacement is needed to take into consideration long-term policy targets. As discussed in this study, more investment is needed to achieve long-term targets such as contributing to carbon neutrality by 2050 while increasing self-sufficient energy production in the city.
Furthermore, this study highlighted the advantage of supplying hydrogen to the city center. Hydrogen can play an important role to respond to the intermittency of renewable energy. Depending on the demand for hydrogen, the facilities can decide what forms of energy are produced, including electricity, heat, and hydrogen. The role of environmental infrastructure, which has been limited to maintaining urban functions, can be expanded to energy supply as well.
Realizing this potential requires policies that implement them. First, we need to form a consensus with citizens on the importance of carbon neutrality and the role of cities [35]. Neither the carbon-neutral goal nor the energy self-sufficiency policy can be implemented without the consent of the citizens. Next, safety issues that may accompany hydrogen production should be considered most importantly, and accident prevention methods should be implemented as much as possible. Gas explosions are a potential threat, and citizens generally do not want gas facilities near their residences. In addition, various measures to increase the acceptance of residents should be developed and discussed with citizens. Transparent information disclosure is the key, and environmental infrastructure needs to be designed in a way that enhances the amenities of citizens. Policies implemented by the city must always be based on citizen participation in order to be sustainable. For example, providing more green areas and civic spaces using these facilities have the advantage of increasing citizens’ acceptability.
In this study, the analysis was focused on the aspect of energy consumption. We investigated approximate hydrogen production potential based on the current environmental infrastructure facility size and treatment status in Seoul. Under the circumstances assumed in this study, the theoretically possible production volume was explored, but uncertainty is inherent depending on changes in the detailed situation of the city. The city has already been maintained for a long time, and it is designed and operated as per the purpose of each area. Depending on the purpose of the area, the type of building and energy consumption characteristics may vary. That is, not only the energy consumption characteristics of the region, but also the method for achieving carbon neutrality, may vary depending on the type of basic infrastructure facilities discussed in this study. Therefore, in future studies, the boundaries of the study area should be widened to analyze a carbon-neutral model reflecting the use of land and buildings in a certain area.

Author Contributions

Conceptualization, Y.K., H.M. and H.L.; methodology, H.M.; software, H.M. and H.L.; validation, Y.K. and H.L.; formal analysis, H.M.; investigation, Y.K., B.K. and H.L.; resources, Y.K., H.M., B.K. and H.L.; data curation, Y.K. and H.L.; writing—original draft preparation, H.M.; writing—review and editing, Y.K., B.K. and H.L.; visualization, H.M.; supervision, Y.K.; project administration, Y.K.; funding acquisition, Y.K. All authors have read and agreed to the published version of the manuscript.

Funding

This research was funded by the Korea Institute of Energy Technology Evaluation and Planning (KETEP) and the Ministry of Trade, Industry & Energy (MOTIE) of the Republic of Korea (No. 20213030030270).

Informed Consent Statement

Not applicable.

Acknowledgments

This work was supported by the Korea Institute of Energy Technology Evaluation and Planning (KETEP) and the Ministry of Trade, Industry & Energy (MOTIE) of the Republic of Korea (No. 20213030030270).

Conflicts of Interest

The authors declare no conflict of interest.

Abbreviations

m2square meter
km2square kilometers
Nm3Normal cubic meter
kTOEKilo ton of oil equivalent
kcalKilocalorie
MWMegawatt
MWhMegawatt hour
tmetric ton = tonne = 1000 kg
MLEModified Ludzack Ettinger
A2OAnaerobic anoxic aerobic
SRFSolid refuse fuel
SOECSolid oxide electrolysis cell
LNGLiquified natural gas

References

  1. The World Bank. Available online: https://www.worldbank.org/en/topic/urbandevelopment/brief/climate-action-through-an-urban-lens (accessed on 14 September 2022).
  2. Day, J.W.; Hall, C. The Myth of Urban Self-Sufficiency: America’s Most Sustainable Cities and Regions; Copernicus: New York, NY, USA, 2016; pp. 25–36. [Google Scholar]
  3. Seto, K.C.; Dhakal, S.; Bigio, A.; Blanco, H.; Delgado, G.C.; Dewar, D.; Huang, L.; Inaba, A. Human settlements, infrastructure, and spatial planning. In Climate Change; Mitigation of Climate Change: Contribution of Working Group III to the Fifth Assessment Report of the Intergovernmental Panel on Climate Change; IPCC: Geneva, Switzerland, 2014; Chapter 12; pp. 923–1000. [Google Scholar]
  4. IRENA. Rise of Renewables in Cities: Energy Solutions for the Urban Future; International Renewable Energy Agency: Abu Dhabi, United Arab Emirates, 2020. [Google Scholar]
  5. CEENERGYNEWS, Solving Three Problems at Once: Waste-to-Hydrogen Solutions and Their Contribution in CEE. Available online: https://ceenergynews.com/hydrogen/solving-three-problems-at-once-waste-to-hydrogen-solutions-and-their-contribution-in-cee/ (accessed on 19 September 2022).
  6. IEA. Electrification Rates in Selected Countries and Regions in the New Policies Scenario, 2000–2030. Available online: https://www.iea.org/data-and-statistics/charts/electrification-rates-in-selected-countries-and-regions-in-the-new-policies-scenario-2000-2030 (accessed on 21 September 2022).
  7. The Climate Center. Available online: https://theclimatecenter.org/actions-by-countries-phase-out-gas/ (accessed on 1 September 2022).
  8. IEA. Heat Pumps; IEA: Paris, Italy, 2021; Available online: https://www.iea.org/reports/heat-pumps (accessed on 21 September 2022).
  9. Balta, M.Ö.; Balta, M.T. Development of a Sustainable Hydrogen City Concept and Initial Hydrogen City Projects. Energy Policy. 2022, 166, 113015. [Google Scholar] [CrossRef]
  10. Song, H.; Jung, H.S.; Uhn, S. Recent Progress for Hydrogen Production from Biogas and its Effective Applications. Appl. Chem. Eng. 2020, 31, 1–6. [Google Scholar] [CrossRef]
  11. Hong, G.I.H.; Song, H. Process Modeling and Economic Analysis of Hydrogen Production System on 500 kg-H2/d-Class Green Hydrogen Station Using Biogas. J. Kor. Inst. Gas 2021, 25, 19–26. [Google Scholar] [CrossRef]
  12. Park, S.; Ryu, J.Y.; Sohn, G. Techno-Economic Analysis (TEA) on Hybrid Process for Hydrogen Production Combined with Biomass Gasification Using Oxygen Released from the Water Electrolysis Based on Renewable Energy. J. Kor. Inst. Gas 2020, 24, 65–73. [Google Scholar] [CrossRef]
  13. Park, J.; Kim, C.-H.; Cho, H.s.; Kim, S.-K.; Cho, W.C. Techno-Economic Analysis of Green Hydrogen Production System based on Renewable Energy Sources. Trans. Korean Hydrog. New Energy Soc. 2020, 31, 337–344. [Google Scholar] [CrossRef]
  14. Yonsei University. Development of a Novel Process with Selective Pressure Control and Engineered Strain for Value-Added Hydrogen Production from Organic Waste. 2020. Available online: https://scienceon.kisti.re.kr/commons/util/originalView.do?cn=TRKO202000004145&dbt=TRKO&rn= (accessed on 14 September 2022).
  15. Kim, H.; Baek, Y. Wangyun won, Techno-Economic Analysis and Life-Cycle Assessment for the Production of Hydrogen from Biogas. Trans. Korean Hydrog. New Energy Soc. 2021, 32, 417–429. [Google Scholar] [CrossRef]
  16. Lee, J.Y.; Lee, J.; Song, H. A Study on the Analysis of Risk Factors for Hydrogen Fuel Stations Based on Quantitative Risk Assessment. J. Kor. Inst. Gas 2020, 24, 70–76. [Google Scholar] [CrossRef]
  17. Ministry of the Environment. Basic Plan for Energy Independence at Wastewater Utility. 2010. Available online: https://www.korea.kr/common/download.do?fileId=199716&tblKey=EDN (accessed on 5 September 2022).
  18. Seoul, Seoul Information Communication Plaza. Available online: https://opengov.seoul.go.kr/sanction/17329818 (accessed on 1 August 2022).
  19. KEEI. Yearbook of Regional Energy Statistics; Korea Energy Statistical Information System; KEEI: Ulsan, Republic of Korea, 2021; Available online: http://www.kesis.net/sub/sub_0003.jsp (accessed on 15 August 2022).
  20. Seoul. Seoul Statistical [Yearbook]. 2021. Available online: https://lib.seoul.go.kr/search/detail/CATTOT000001460712?briefLink=/main/searchBrief?st=KWRD_A_si=TOTAL_A_q=%EC%84%9C%EC%9A%B8%ED%86%B5%EA%B3%84%EC%97%B0%EB%B3%B4+2020 (accessed on 17 August 2022).
  21. Ministry of the Environment. Road Map for Expanding Bio and Water Energy Using Environmental Facilities. 2022. Available online: http://www.me.go.kr/home/web/board/read.do?boardMasterId=1&boardId=1532140&menuId=10525 (accessed on 5 August 2022).
  22. Ministry of the Environment. Sewer Statistics. 2021. Available online: https://me.go.kr/home/web/policy_data/read.do?pagerOffset=0&maxPageItems=10&maxIndexPages=10&searchKey=&searchValue=&menuId=10264&orgCd=&condition.toInpYmd=null&condition.code=A5&condition.fromInpYmd=null&condition.orderSeqId=6430&condition.rnSeq=110&condition.deleteYn=N&condition.deptNm=null&seq=7809 (accessed on 5 August 2022).
  23. Seoul. Sewage Treat. Plants Vis.; 3.0 Plan. 2019. Available online: https://news.seoul.go.kr/env/files/2021/03/policy-waterrotate-2021.pdf (accessed on 28 August 2022).
  24. Reliable Ministry of Government legislation, Korean law information center, Waste Management Act Enforcement Rules, <2021.7.6.>. Available online: https://www.law.go.kr/lsEfInfoP.do?lsiSeq=90900# (accessed on 1 September 2022).
  25. Seoul.go.kr. Seoul Incineration Plants. Available online: https://rrf.seoul.go.kr/content/bcrea211.do (accessed on 1 September 2022).
  26. Bloom Energy, Applications Electrolyzers. Available online: https://www.bloomenergy.com/bloomelectrolyzer/ (accessed on 11 August 2022).
  27. Carbon Neutrality and Green Growth Commission. Opinion from the Industry and Local Governments (Renewable Energy) Related to the Draft 2050 Carbon-Neutral Scenario. 2021. Available online: https://www.2050cnc.go.kr/base/board/read?boardManagementNo=4&boardNo=43&searchCategory=&page=2&searchType=&searchWord=&menuLevel=2&menuNo=15 (accessed on 11 September 2022).
  28. MFG Magazine, Energy-Saving Measures to Recover Energy from Small-Scale Hydroelectric Power Generation. Available online: www.ei.co.kr/content/view.asp?idx=13738/ (accessed on 13 August 2022).
  29. Ministry of the Environment. The 5th National Waste Statistical Survey. 2017. Available online: https://www.recycling-info.or.kr/rrs/stat/envStatDetail.do?menuNo=M13020302&pageIndex=1&bbsId=BBSMSTR_000000000002&s_nttSj=KEC011&nttId=867&searchBgnDe=&searchEndDe= (accessed on 11 September 2022).
  30. Boroomandnia, A.; Rismanchi, B.; Wu, W. A Review of Micro Hydro Systems in Urban Areas: Opportunities and Challenges. Renew. Sustain. Energy Rev. 2022, 169, 112866. [Google Scholar] [CrossRef]
  31. Yonhap News Agency, Seoul to Supply District Heating Using Sewage Heat from SEONAM Water Recycling Center. Available online: https://www.yna.co.kr/view/AKR20150610163500004/ (accessed on 13 August 2022).
  32. Osaka Gas. By Technology Classification. Available online: https://www.osakagas.co.jp/en/rd/technical/1198859_6995.html#anchor2 (accessed on 15 August 2022).
  33. Bnetech. Development of Pretreatment System for High Added Value of Biogas. 2012. Available online: https://scienceon.kisti.re.kr/commons/util/originalView.do?cn=TRKO201300025199&dbt=TRKO&rn= (accessed on 20 September 2022).
  34. Gim, B.; Yoon, W.L.; Seo, D.J. Analysis of the Economy of Scale for Domestic Steam Methane: Reforming Hydrogen Refueling Stations Utilizing the Scale Factor. Trans. Korean Hydrog. New Energy Soc. 2019, 30, 251–259. [Google Scholar] [CrossRef]
  35. Macedo, L.V.; Bellezoni, R.A.; de Oliveira, J.A.P.; Salehi, P.; Currie, P.; Jones, A. Innovating in Urban Green and Blue Infrastructure to Improve the Food Water Energy Nexus: An Implementation Guide for Cities and Subnational Governments. 2022. Available online: https://iclei.org/wp-content/uploads/2022/08/IFWEN-Implementation-Guide_2022_FINAL.pdf (accessed on 20 September 2022).
Figure 1. Research methodology flow diagram.
Energies 15 09293 g001
Figure 2. Major processes and energy flow in sewage treatment plants.
Energies 15 09293 g002
Figure 3. Major processes and energy flow in incineration plants.
Energies 15 09293 g003
Figure 4. Estimation of the potential for hydrogen production according to changes in key conditions.
Energies 15 09293 g004
Table 1. Final energy consumption by Sector in 2020 (Unit: kTOE) [19].
CoalOilGasElectricityHeatRenewables &
Others
Total
Industry090419129031055
Transportation029002501300773357
Residential & Commercial4233937243320477397941
Public & Others041903599178964
Total4245613993393848529713,316
Table 2. Operation status of Seoul’s sewage treatment plants.
NameExtent (m2)Sewage Treatment VolumeSewage DisposalBiogas Production and Utilization
IncinerationDryingSellingElectricity Generation
(Ton/Day)
Self-Utilization (Ton/Day)Surplus
(Discard)
Nanji929,084557.2130.1119.211.3011.014.2
Jungnang501,0001136.60459.519.1048.81.5
Seonam1,032,4231456.5123.6192.331.90.216.94.0
Tancheon393,000752.30126.702.319.62.6
Table 3. Operation status of Seoul’s incineration plant.
NamePopulationExtentTotal InputIncinerationRate of
Operation
Water Usage
(m2)(Ton/Year)(%)m3/year
Gangnam1,649,16963,818253,193247,90789209,139
Nowon1,052,19446,307170,229175,03471196,368
Mapo575,10258,435175,550172,57376149,239
Yangcheon632,32916,91499,114100,2968547,824
Table 4. Consumption of Sewage Treatment Plants by Energy Source.
Self-ProductionExternal SupplyTotal
ElectricityHeatBiogasElectricityOilLNG
Nanji3538,27545,58168,4223640152,678
Jungnang51942,664101,479180,759163027327,077
Seonam703228,15144,224146,541269252226,470
Tancheon326411,09151,24068,98452278134,909
Table 5. Production of Sewage Treatment Plants by potential energy source (Unit: MWh).
Solar Power 1Micro-Hydropower 2Biomass 3Sewage Heat 4Biogas 5Hydrogen 6Total
Nanji24,66388598,027236,49725,04568,667453,785
Jungnang13,2992008204,668536,28942,229136,894935,387
Seonam27,4062554149,595682,07570,50757,629989,766
Tancheon10,432119655,194319,32611,14552,993450,286
1 Solar power generation = Land area (m2) × Solar power area (15%)/Solar power installation area per MW (9900 m2/MW) × Power generation efficiency (20%) [27]. 2 Small hydro power generation = Sewage treatment volume (m3/s) × fall ahead from dewatering outlets (2 m) × Gravity acceleration (9.8 m/s2) × Efficiency (80%) [28,30]. 3 Biomass = throughput of residue (ton/year) × Dry weight reduction rate (based on the percentage of water content 10%) × Heat generation amount (3300 kcal/kg) [18,22]. 4 Sewage heat = Sewage treatment amount (m3/s) × Average temperature difference (1 degree) × Water heat (1000 kcal/degree/m3) [31]. 5 Existing external sales volume, usage to achieve energy self-sufficiency [22]. 6 Hydrogen extraction by modifying the remaining biogas except for external sales and self-consumption (Applying Osaka gas HYSERVE-300 specification, subtracting the amount of electricity required for hydrogen reforming) [32].
Table 6. Production of Incineration Plants by potential energy source (Unit: MWh).
Energy SalesUtility UsageTotal
Waste HeatElectricityLNGElectricity
Gangnam550,6380426825,685580,591
Nowon319,2100182017,122338,152
Mapo357,369307208519,438379,199
Yangcheon194,866221910,5829252216,919
Table 7. Energy self-sufficiency and Hydrogen Production in an incineration plant (Unit: MWh).
Self-ConsumptionProduction and Supply
Facility OperationWater ElectrolysisHeatHydrogen
90,252332,4021,754,485284,204
The water electrolysis facility uses SOEC technology developed by Bloom Energy, and when supplying an external heat source of 120 degrees, it can obtain a high hydrogen production efficiency of 85.5% [26].
Table 8. Hydrogen production potential of Sewage Treatment Plants according to operating conditions and treatment facilities (Unit: MWh).
Current
Status
(1) Increased Utilization
(Duration of Stay)
(2) Expansion of Processing Facilities
30252050%100%150%
Nanji68,66799,73899,738113,688118,410168,153217,896
Jungnang 136,894204,259245,110306,388231,323325,753420,183
Seonam57,629247,573297,087371,359129,825202,021274,217
Tancheon52,993114,282137,138171,423100,060133,414166,767
Total316,183665,851779,073962,857579,619829,3411,079,063
Table 9. Hydrogen production potential of Incineration Plants according to operating conditions and treatment facilities (Unit: MWh).
Current
Status
(1) Increased Utilization (Duration of Stay)(2) Expansion of Incineration Treatment (Reduction of Landfill Ratio)
90%100%−50%−100%
Gangnam83,78787,517124,819208,974334,161
Nowon89,840152,567185,581178,228266,616
Mapo68,997111,569141,977156,142243,288
Yangcheon41,58049,48165,28392,228142,875
Total284,204401,133517,660635,572986,940
Table 10. Consumption by energy source per km2 of Seoul. (Unit: MWh).
CoalOilGasElectricityThermal EnergyRenewables & etc.Total
798.787,576.376,668.475,608.59320.05698.8255,671
Table 11. Effect of energy self-sufficiency in surrounding areas based on increase in hydrogen energy production.
CategoryNameExtent
(km2)
Self-Consumption
(MWh)
External Supply (MWh)Additional Areas Where Energy
Self-Sufficiency Achieved (km2)
MinimumMaximumMinimumMaximum
Sewage treatment plantsNanji0.929152,678301,107516,6591.182.02
Jungnang0.501327,077608,3111,237,3862.384.84
Seonam1.032226,470763,2961,634,0642.996.39
Tancheon0.393146,054315,377690,9411.232.70
Incineration plantsGangnam0.06329,953732,421881,1552.863.45
Nowon0.04618,942514,126942,8212.013.69
Mapo0.05821,523507,064805,5841.983.15
Yangcheon0.01619,834285,078400,1871.121.57
Publisher’s Note: MDPI stays neutral with regard to jurisdictional claims in published maps and institutional affiliations.

