Article

FBG Sensing Technology for an Enhanced Microgrid Performance

Faculty of Engineering and Applied Science, Ontario Tech University, 2000 Simcoe St. North, Oshawa, ON L1G 0C5, Canada
*
Author to whom correspondence should be addressed.
Energies 2022, 15(24), 9273; https://doi.org/10.3390/en15249273
Submission received: 27 October 2022 / Revised: 1 December 2022 / Accepted: 3 December 2022 / Published: 7 December 2022

Abstract

:
Energy provided by microgrids should be considered, especially because their purpose is to supply loads from the available power source of the combined sources of energy, including the grid, optimally and efficiently to satisfy the load demand securely and economically. Sensing the accuracy of the different physical parameters of the combined power sources and energy storage plays a crucial part in the efficiency and resilience of microgrids. The present microgrids mostly use conventional sensors, which are greatly impacted by ambient conditions such as high-voltage (HV) and electromagnetic interference (EMI). So, this paper presents an enhanced microgrid based on replacing the conventional sensors with fiber Bragg grating (FBG) sensors renowned for their immunity to EMI and HV, in addition to the virtue of distributing sensing capability. The enhanced microgrid based on FBG sensing was tested experimentally at different potential points predefined on the microgrid and validated with a microgrid simulation model. Real-time measurements of FBG and conventional sensors were recorded at the potential points and applied to the Simulink model to compare the performance for both cases. The unit and integration tests showed an obvious improvement in the accuracy and resiliency of the microgrid by using FBG sensors.

1. Introduction

The key components of microgrids (MGs) such as switches, sensors, energy sources, and energy storage are integrated to allow the microgrid to function efficiently and securely [1]. Moreover, energy harvesting, and management of MGs can be realized by efficient energy extraction from renewable energy sources (RES) and storing excessive energy efficiently in energy storage devices [2,3,4]. In addition, loads of MGs can be controlled, and the energy consumption is managed based on conditional monitoring and remote control of MGs [5]. That means controlling loads, and managing energy sources and storage devices in MGs require accurate sensing devices combined with wire and wireless communication, as can be seen in many research works including what is presented in [6]. In that research, the authors tested their work on an ABB-distributed control system (DCS) based on conventional systems. Furthermore, several research works in the literature have shown how crucial it is to monitor the component of MGs accurately to secure the resiliency, reliability, and optimal economical operation of MGs [7,8,9,10,11]. Moreover, some research work has shown a remote control based on a human–machine interface (HMI) and conditional monitoring based on conventional sensors [3,4,5]. The conditional monitoring and remote control of MGs found in dozens of recent research works have been performed based on conventional sensors considering the specifications listed in datasheets, including accuracy and response speed. However, there has been no consideration for the environmental working conditions in which these conventional sensors are utilized, such as harsh weather conditions, high-voltage, and electromagnetic interference effects. Seeing conditional monitoring and remote control of MGs from the perspective that considers the anomalous conditions highlights a great problem because metrics and trends yielded by conditional monitoring are based on thousands of measurements and sensors’ readings of conventional sensors that could be affected by abnormal ambient operating conditions. All physical parameters of MGs, such as current, voltage, temperature, humidity, torque, strain, stress, and tilt are vulnerable to such effects when using conventional sensors [12]. As a result, all decisions taken by the control systems of MGs based on such sensors might be doubtable depending on the working environment conditions and how far these conventional sensors are affected by such conditions. In conclusion, the performance of MGs is affected by the type of utilized sensors and the same for the reliability, security, and resiliency of MGs [13]. This research aims not to describe the results of the conditional monitoring, and remote-control work of MGs presented in the literature. Instead, it aims to highlight the error margin that could be there in such work due to utilizing sensors that might be showing inaccurate behavior in anomalous working conditions. In addition, it presents a better replacement for a sensing technology that has shown robust immunity to high-voltage and EMI in addition to other features. However, first, it is important to prove the defects of the conventional sensors in MGs applications under such abnormal operating conditions. This can be proven in two ways: finding some experience presented in the literature or proving it experimentally. For the literature part, the USA loses USD 150 billion every year because of power outages mostly caused by defects in conditional monitoring and remote-control systems of MGs [14]. Surveying the literature also proves the secure operation of MGs; there should be expected a timely and accurate response that acts dynamically based on accurate conditional monitoring in energy applications such as tracking the maximum power point of PV power systems and battery charging systems that can be realized by having a highly accurate sensor with immunity to external conditions such as HV and EMI [15,16,17,18]. Furthermore, in large-scale MGs, when a balance between load demand and energy source capacity is required based on remote communications and conditioning monitoring of MGs, accurate and constantly accurate sensors at normal and anomalous conditions should be used [19,20]. The other way to prove the margin of error of using conventional sensors in MGs is to prove it experimentally, which is the aim of this paper, in addition to introducing a better replacement that could resolve that issue and enhance the performance, accuracy, efficiency, and operating security of MGs. The fiber Bragg grating (FBG) sensing technology was used in this research to enhance MGs thanks to the proven immunity to HV, EMI, and chemical effects [21]. On top of that, it provides the distribution or multiplexed sensing capability, which covers long distances and wide surface area. On the other hand, the conventional sensors cannot offer these unique features of the FBG sensors [22]. Therefore, FBG sensors have been utilized in various medical, civil, electrical, mechanical, aerospace, maritime, and hybrid energy power systems, and military applications [23,24,25,26]. The paper presents this improvement by implementing MG experimentally alongside MG Simulink for validation. Potential points at MG were defined and measurements were taken using conventional and FBG sensors at different operating scenarios. Then, readings were compared, showing the difference in accuracy. Lastly, all readings were applied to the MG Simulink to compare the performance parameters in two cases.
The paper is organized as follows: Section 2 presents the methodology and Section 3 describes the demonstrates the results. Ultimately, Section 4 concludes the work.

2. Materials and Methods

To achieve the objective of this research, which was a comparison of the performance of the conventional sensors and the FBG sensors in MGs, experimental and simulation-based models of MG were designed. The potential points were decided to install both types of sensors: conventional and FBG sensors. The dataset yielded by the taken measurements applied to testing scenarios including power sources, transformers, energy storage, DC, and AC loads. Two types of commercial temperature sensors were used: the LM35 analog sensor and the DS18b20 digital sensor. Moreover, a commercial FBG TSHH-S sensor with an interrogator ODAQ data acquisition box is used for testing.

2.1. FBG Sensing Background

This section introduces the basic principle of utilizing FBG sensors in measuring physical signals. Figure 1 depicts a basic scenario showing how the FBG temperature sensor works. When an optical source indicated on the left is applied to the FBG sensor with a structure and grating shown in the middle, that yields a transmitted light after passing through the FBG that shows a reflected Bragg wavelength of FBG was deducted from the source wave. The operation can be described as the Bragg grating inside the core reflecting a portion of the received light and transmitting the remaining, as shown in the right part of the Figure. The reflection occurs at and only at the grating condition realized as in Equation (1). The principle of measuring a physical signal such as temperature based on FBG is based on coupled mode theory which states the Bragg wavelength of FBG depends on the effective refractive index and the grating period [27]. Therefore, for every change that occurs to the measured physical signal, there is an equivalent change that happens to the refractive index of the core of FBG, which in turn causes a shift in the reflected Bragg wavelength of FBG, as depicted in Figure 1. It clearly shows the change in Bragg wavelength of FBG from λ 1 to λ 2 two changing the temperature from T 1 to T 2 .
λ B = 2   Δ   n e f f
where:
  • λ B : the   bragg   base   wavelength
  • Δ : grating period
  • n e f f :   the   refractive   index
The equation model is shown for deriving a relation between bandwidth, reflectivity, sidelobe and grating length, and the change in refractive index. The bandwidth can be determined as follows [20]:
Δ λ = 2 δ n 0   η   π
where:
  • δ n 0 : The variation in the refractive index;
  • η : The fraction of power in the core.
Moreover, the reflected power can be determined as follows:
P B λ = sin h 2 η V δ n 0 1 Г 2 N Δ λ cos h 2 η V δ n 0 1 Г 2 N Δ λ Г 2
Г λ = 1 η V δ n 0 λ λ B 1
where:
  • Δ : the grating periods;
  • V: the fringe visibility;
  • L g = N Δ : the grating length.
Using the above mathematical equations makes it reasonable to analyze the correlation between these input and output parameters.

2.2. Experimental Setup of MG

A complete experimental setup of MG was implemented including the basic parts of a typical hybrid MG with AC and DC bus. It included renewable energy sources PV arrays of power 250 W, battery bank storage (4 cells × 12 V 12 Ah), wind emulator, AC grid, AC-DC rectifier, DC-DC converter, and DC-AC inverter, variable load AC and DC as shown as a single line diagram in Figure 2.

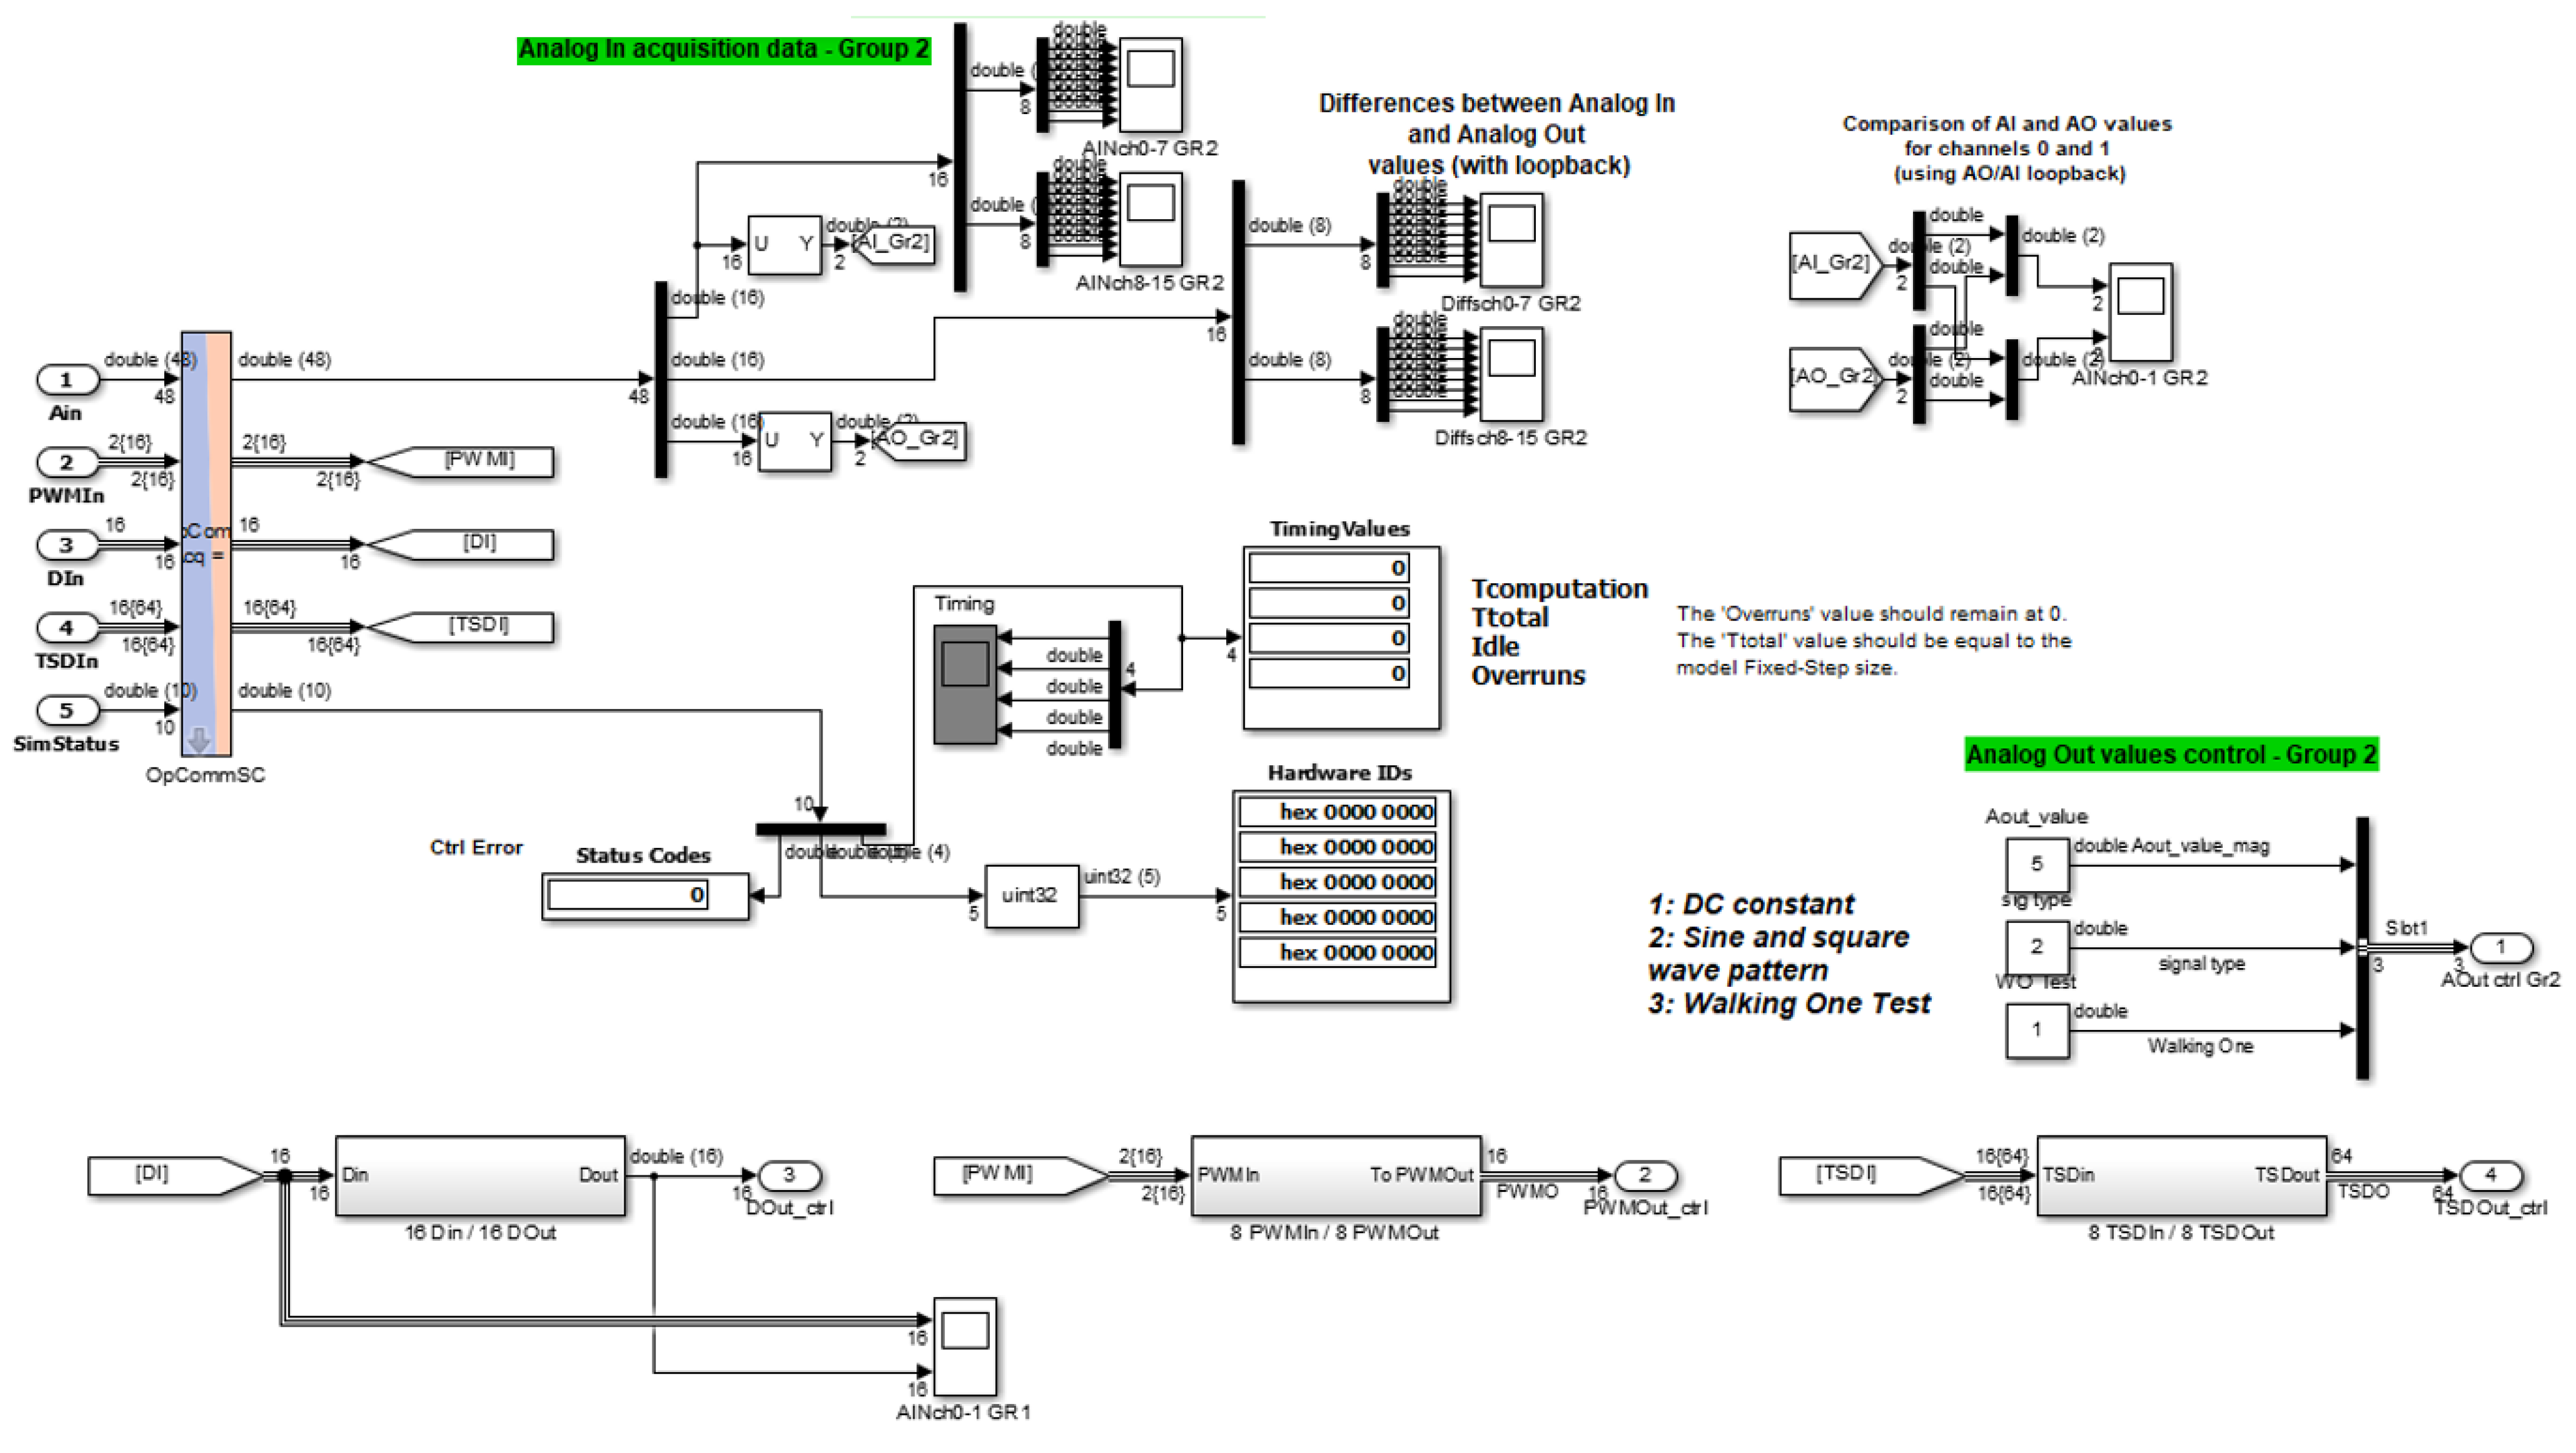
2.3. Simulink Model of MG

Because the experimental setup was limited to the specific size of power and components, a simulation model of MG was also designed as shown in Figure 3 reflecting the potential points at which the conventional and FBG sensors will be installed, i.e., the PV array, point of common coupling (PCC), transmission lines, buses, breakers, generators, and loads.

2.4. Real-Time Simulation

For integrating the collected data from measurements of the FBG and conventional sensors, a real-time simulator based on OPAL-RT 4510 was used to interface the measurements with the MG Simulink as designed in Figure 4. It shows the measurements collected from FBG and the conventional sensors were applied to the potential points predefined in the Simulink model via analog input ports of the OPAL-RT. Moreover, the output of the Simulink model was applied to the scopes via analog output channels of the Opal-RT. Moreover, Figure 5 depicts the connections and configurations between the Simulink variables and the input and output analog channels of the OPAL-RT.

3. Results

This section presents the results of the research testing results which were planned to be of twofold scenario: a unit testing part and integration testing as well. The unit testing aimed at comparing the accuracy of measurements between the conventional sensors and the FBG sensors at the named potential points. Table 1 lists the sensors used in the study and the kind of test cases. There were dozens of potential points in the MG to install sensors and there were many different physical signals to be measured for conditional monitoring and control of MG. However, it was fair enough for the research and to avoid lengthening the paper, temperature signal was selected to be measured at three of the potential points of MG which were in the test. Two types of conventional temperature sensors and one FBG temperature sensor were used at three selected potential points: the battery pack, PV array, and the PCC. In addition, because HV and EMI are the most effective harsh operating conditions, they were selected in addition to the normal operating condition to be tested in this study.

3.1. Unit Testing of MG Sensing

In these test cases, the measurements at the predefined potential points of MG were taken for the conventional sensors and FBG sensors to compare their accuracy.

3.1.1. Normal Condition at PV Array as an Energy Source

Figure 6 shows the results of measuring the temperature at the PV under normal operating conditions. Four sorts of measurements were taken, infrared (IR), FBG sensors, LM35, and DS18b20. The IR temperature sensor was of very high accuracy, so it was used as a reference. Based on the trends of temperatures shown on the right with legends, it is noticeable that the FBG sensors had with the most accurate readings compared with the two conventional sensors.

3.1.2. Normal Condition at the PCC

Figure 7 depicts the trends of temperature readings of the conventional sensors, the IR reference reading, and the FBG sensor at the point of common coupling PCC. It shows clearly the FBG was the most accurate reading and the closest to the reference readings, while the other two types of conventional sensors were not accurate and had a high perturbation.
Table 2 compares the readings for the normal condition at the PCC point for all conventional sensors, IR reference, and FBG, statistically. The numbers show clearly that the FBG had the lowest standard deviation which means it had the lowest variation to the mean value and was the most accurate as compared to other conventional sensors. In addition, a statistical analysis was conducted quantitively to compare the main and standard deviation of each sensing technology readings as represented in the third and fourth column in Table 2. The FBG mean was the closest one to the IR sensor reading mean, while other conventional sensors went further. Moreover, the standard deviation of the FBG and the reference IR sensors had the lowest values meaning they had the least fluctuation as compared to the conventional sensors that had a high deviation. In other words, the less the std the less the distance between the measured values and the mean values.

3.1.3. Battery Charging Test Case with All Sensors

Figure 8 depicts the trends of temperature readings in the case of battery charging for conventional sensors, IR reference, and the FBG sensor as well. It shows clearly the FBG sensors had the lowest variation and best accuracy by comparing them to the reference reading of the IR temperature sensor.
Table 3 compares the readings at charging the battery pack for all sensors conventional, IR reference, and FBG statistically. The numbers show clearly that the FBG had the lowest standard deviation which means it had the lowest variation to the mean value and was the most accurate as compared to other conventional sensors. The quantitative analysis represented in the mean and standard deviation in the third and fourth columns shows the mean of the FBG was the nearest one to the mean value of the reference IR sensor readings while other conventional sensors higher significantly higher than the reference. In addition, the FBG reading deviation was the lowest while other sensors had a high remarkable deviation.

3.1.4. Battery Discharging Test Case

Figure 9 depicts the trends of temperature readings for conventional sensors, FBG sensors, and IR sensors as a reference for accuracy. These readings were taken for the case of discharging the battery. FBG sensors still showed the most accurate readings with minimum fluctuations.
Table 4 compares the readings taken at discharging the battery pack for all sensors conventional, IR reference, and FBG, statistically. The numbers and statistical analysis represented in the mean and standard deviation represented by the third and fourth column in Table 4 show clearly that the FBG had the lowest standard deviation which means it had the lowest variation to the mean value and was the most accurate as compared to other conventional sensors.

3.1.5. Testing the Condition of EMI Effects at the PCC

Figure 10 compares the conventional sensors with the FBG sensor under the effects of EMI. It shows the most affected one was the analog sensor LM35, then the digital sensor DS18B20. However, the least effect was shown when using the FBG sensors.

3.1.6. Testing the Condition of HV Effects at the PCC

Figure 11 compares the conventional sensors with the FBG sensor under the effects of HV at the PCC point. It shows the most affected one was the analog sensor LM35, then the digital sensor DS18B20. However, the least effect was shown when using the FBG sensors.

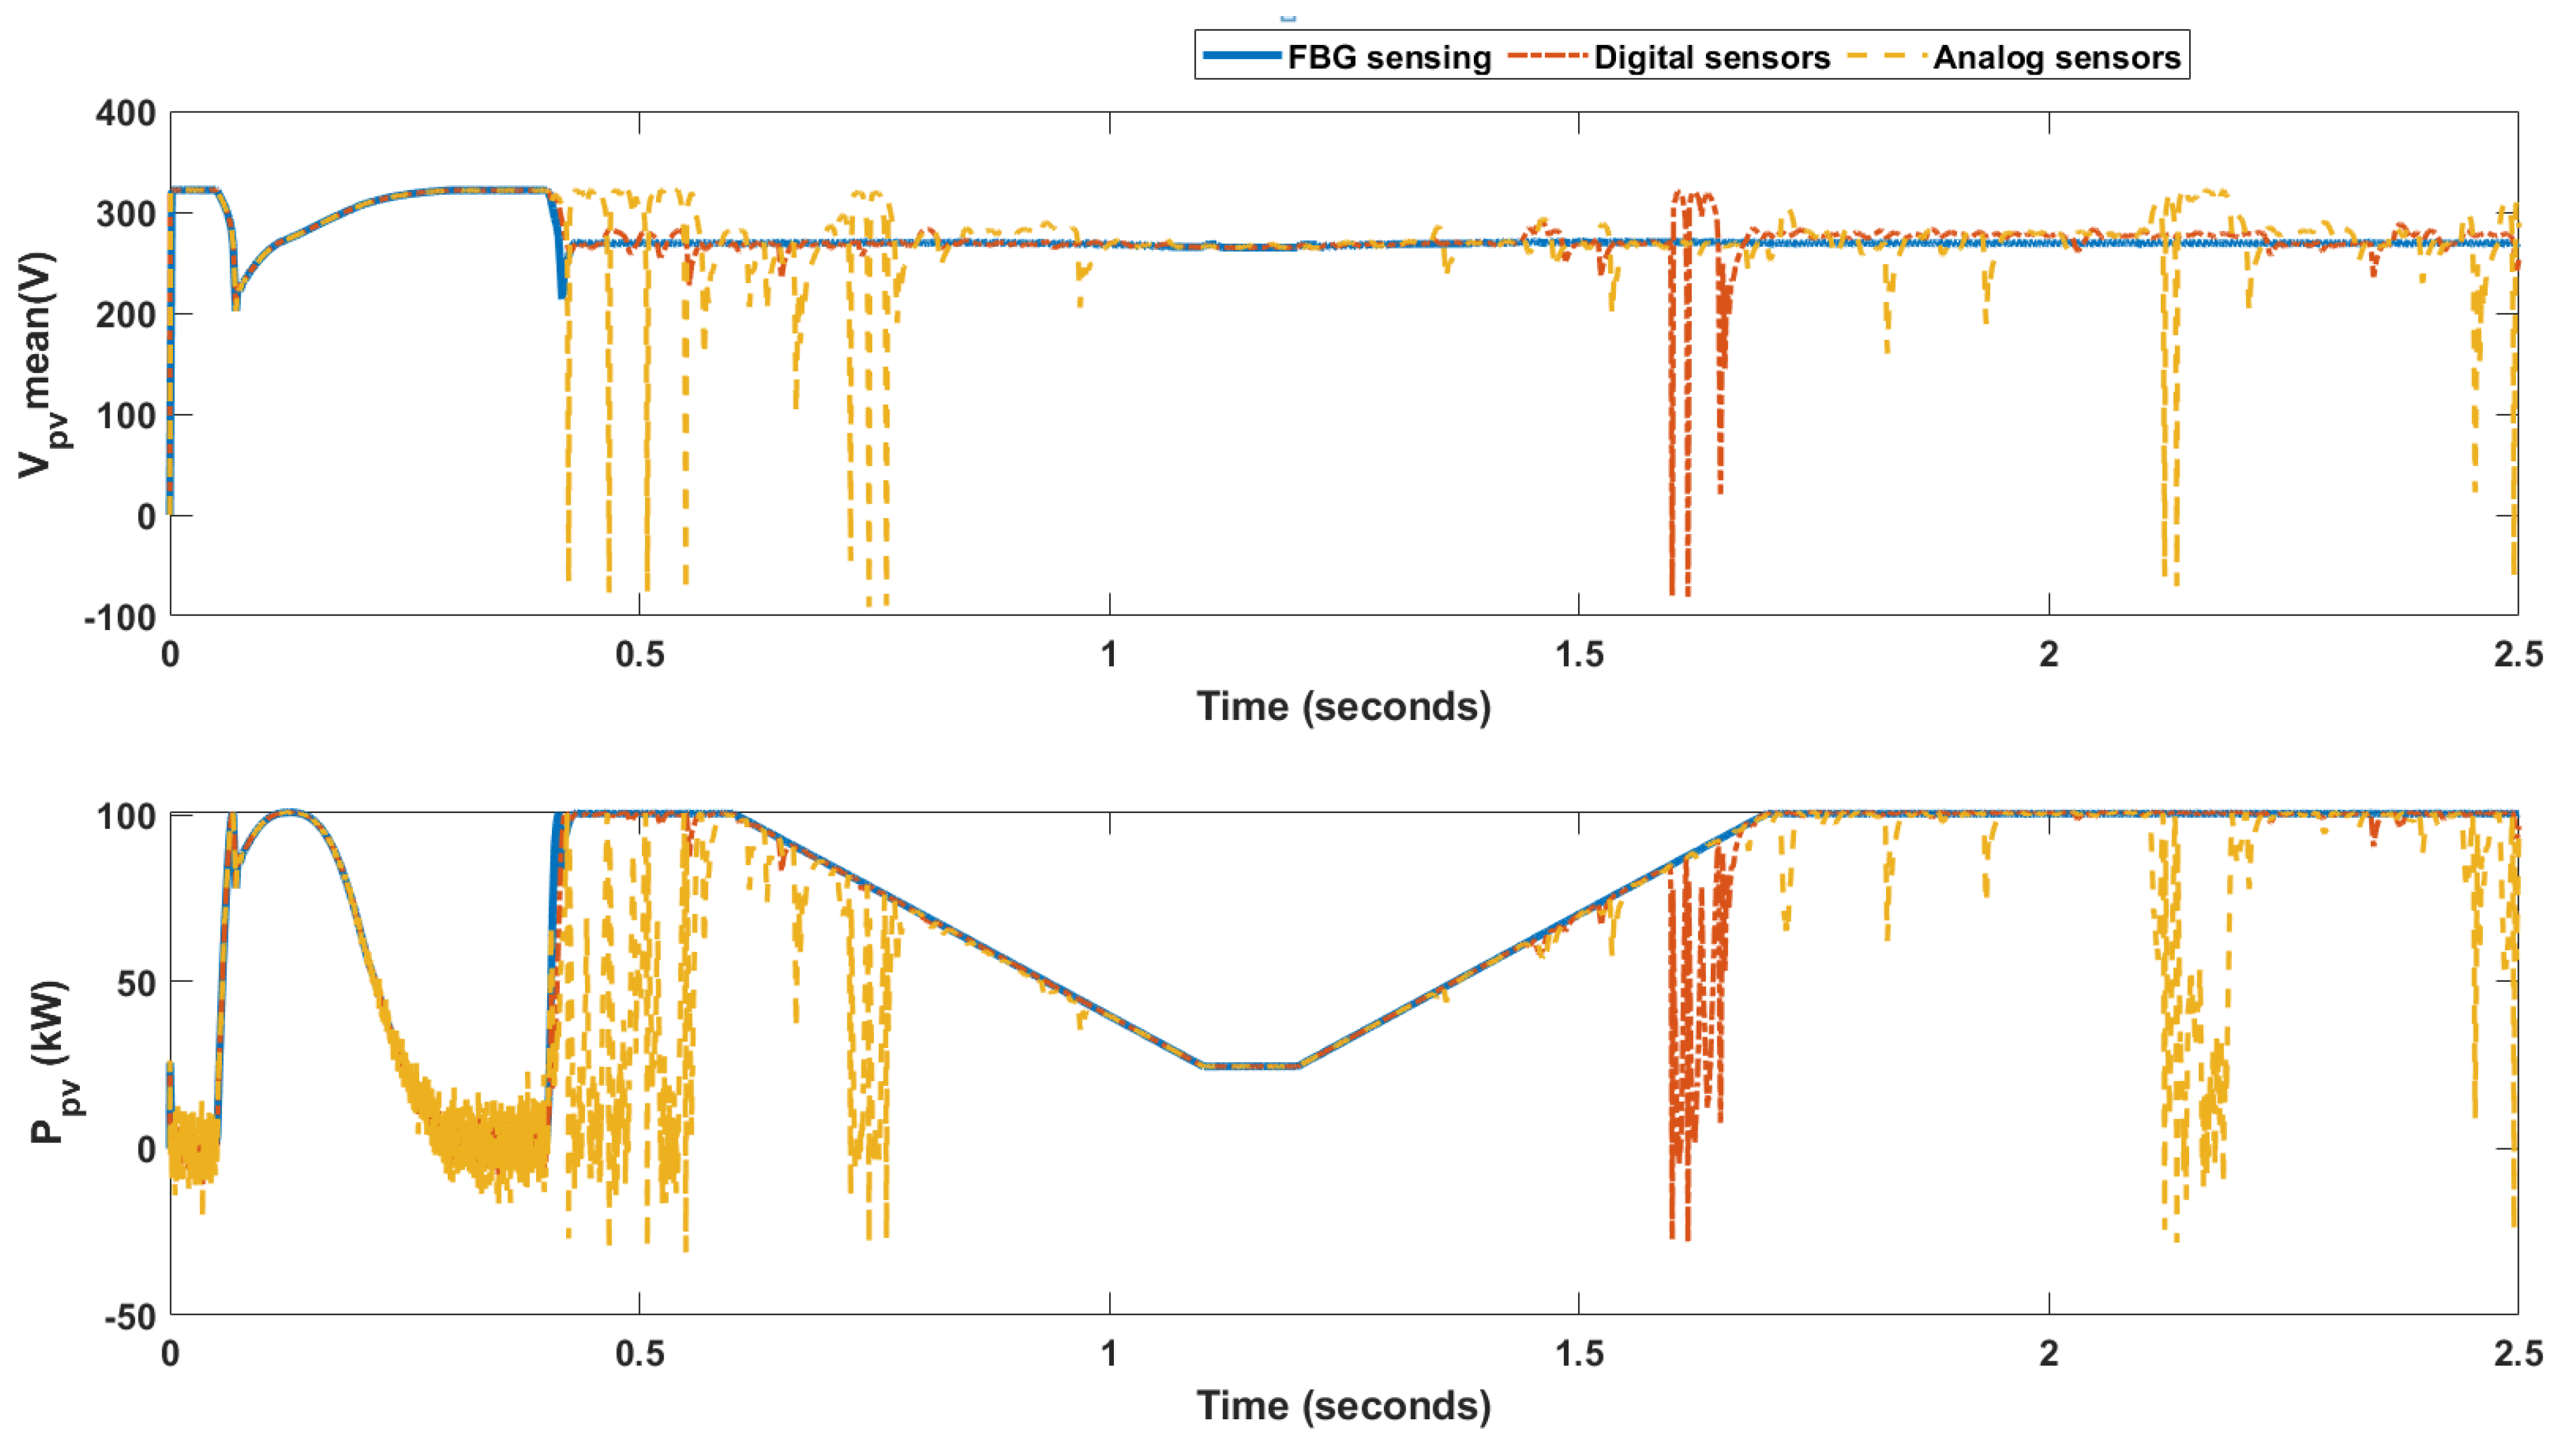
3.2. Testing the Effect of Sensing Accuracy on the MG Performance

After showing the difference in sensing accuracy between conventional sensors and the FBG sensors at different potential points marked in Figure 3 of the MG for different scenarios and under normal and anomalous operating conditions, the effects of the sensing accuracy on the MG performance were studied. For that purpose, the data collected from the experimental setup reading for all sensing technology digital and analogue conventional sensors and FBG sensors were applied to the Simulink model shown in Figure 12 to study the MG performance parameters with each sensing technology.

3.2.1. Testing at Normal Condition

Two tests were conducted at the normal operating condition which was the output from the PV array based on the sensed temperature using analog represented in yellow and digital conventional represented in brown sensors and based on FBG temperature sensor represented in blue color as well. Figure 13 depicts comparatively the mean of the measured voltage and the output power of the PV array at normal operating conditions. Considering the reference measured values of the mean voltage and power of the PV were 230 V and 100 kW at the standard conditions 25 °C and 1000 w / m 2 , the voltage and power of the PV array in the case of conventional sensors had a significant noise when the noise was very limited in the case of FBG sensors.
Considering the reference measured values of the voltage, current of the battery bank which are 670 V and 100 A, respectively, comparing battery voltage and the state of charge (SOC) of the battery bank as shown in Figure 14, some noise was shown in the case of conventional sensors and very tiny and limited noise came with using FBG sensors. Moreover, noticeably, the slopes of the SOC curve including charging and discharging cases were different in the case of conventional and FBG sensors. That means the decision of turning from charging to discharging or from discharging to charging was different. Thereby, the age of the battery will be affected by the accuracy of temperature readings.
Moreover, Figure 15 compares the mean output power at the point of common coupling (PCC) for the cases of using conventional analog and digital sensors and for utilizing the FBG sensor, showing fluctuation and noise with conventional sensors especially the analog sensors while the noise was very limited, and accuracy was the best when FBG sensors were used taking into consideration that the reference measured value of the power at the PCC was 147.7 kW.

3.2.2. Testing under EMI Effects

Two tests were conducted at abnormal operating conditions, working under EMI which was the output from the PV array based on the sensed temperature using analog represented in yellow and digital conventional represented in brown sensors and based on FBG temperature sensor represented in blue color as well. Figure 16 depicts comparatively the mean of the measured voltage and the output power of the PV array under EMI operating conditions. Voltage and power of the PV array in the case of conventional sensors had a dramatic noise while the noise was still very limited in the case of FBG sensors.
By comparing battery voltage and soc at the battery bank under EMI effects as shown in Figure 17, it showed a significant noise in the case of conventional sensors and very tiny and limited noise comes with using FBG sensors. Moreover, noticeably, the slopes of the SOC curve including charging and discharging cases were different in the case of digital conventional and FBG sensors, but it was significantly noisy for analog sensors. That means the decision of turning from charging to discharging or from discharging to charging was different. Thereby, the age of the battery will be affected by the accuracy of temperature readings.
Moreover, Figure 18 compares the mean output power at the point of common coupling (PCC) for the cases of using conventional analog and digital sensors and for utilizing the FBG sensor. In the case of EMI, it showed a fluctuation and noise with conventional sensors especially the analog sensors while the noise was very limited, and accuracy was the best when FBG sensors were used.

4. Conclusions

This research investigated the effects of changing the accuracy of the conventional sensors due to working under harsh operating conditions such as# EMI and HV effects on the MG performance and operation security. Moreover, it introduced FBG sensing technology as a better replacement for the conventional sensors in MGs. The paper proved based on experimental and simulation the significant negative impacts of the EMI and HV on the accuracy of the conventional sensors. On the contrary, it showed the high immunity of the FBG sensors to such effects. Then, the paper applied the measurement data to the potential points of MG in the experimental setup and Simulink model of MG to study the effects of replacing the conventional sensors with the FBG sensors on the performance, reliability, and security of MGs operation. The results clearly showed that FBG sensors were significantly more accurate and slightly affected by EMI and HV while the conventional sensors were highly impacted. Consequently, the performance of MGs based on FBG sensing was better than that of conventional sensors.

Author Contributions

Conceptualization, Y.E.; Methodology, Y.E.; Formal analysis, H.A.G.; Investigation, H.A.G.; Writing—original draft, Y.E.; Writing—review & editing, H.A.G.; Funding acquisition, H.A.G. All authors have read and agreed to the published version of the manuscript.

Funding

The research is funded by NSERC.

Data Availability Statement

Data will be available upon request and with permission from industrial partner.

Conflicts of Interest

The authors have no conflict of interests.

References

  1. Thomas, M.S.; Mcdonald, J.D. Power System SCADA and Smartgrid; Apple Academic Press Inc.: Burlington, ON, Canada, 2015. [Google Scholar]
  2. Kiritsis, N.; Khan, K.; Sachdeva, D. Preparing the Millennial Engineering Graduate to Join the Workforce. In Proceedings of the Presented in ABB Automation and Power World (APW) Digital Conference, Houston, TX, USA, 13–16 March 2017. [Google Scholar]
  3. Khan, K.R. Control of Energy Delivery System using Distributed Controller. In Proceedings of the SSECT16, New Orleans, LA, USA, 1 September 2017. [Google Scholar]
  4. Khan, K.R.; Nadeem, A.R.A.; Siddiqui, M.S.; Khan, R.A. Remote Monitoring and Control of Microgrid using Smart Sensor Network and Internet of Thing. In Proceedings of the ICAAIS Conference, Riyadh, Saudi Arabia, 4–5 April 2018. [Google Scholar]
  5. Khan, K.R.; Rahman, A.; Alghamdi, T.; Nadeem, A.; Siddiqui, M.S.; Khan, R.A. Smart Monitoring of Microgrid Critical Assets using Smart Sensors. MAGNT Res. Rep. 2018, 2, 439–446. [Google Scholar]
  6. Khan, K.R.; Siddiqui, M.S.; al Saawy, Y.; Islam, N.; Rahman, A. Condition Monitoring of a Campus Microgrid Elements using Smart Sensors. Procedia Comput. Sci. 2019, 163, 109–116. [Google Scholar] [CrossRef]
  7. Ipakchi, A.; Rahimi, F. Grid of the future. IEEE Power Energy Mag. 2009, 7, 52–62. [Google Scholar] [CrossRef]
  8. Venkatraman, K.; Reddy, B.D.; Selvan, M.P.; Moorthi, S.; Kumaresan, N.; Gounden, N.A. Online condition monitoring and power management system for standalone micro-grid using FPGAs. IET Gener. Transm. Distrib. 2016, 10, 3875–3884. [Google Scholar] [CrossRef]
  9. Pourramezan, R.; Seyedi, Y.; Karimi, H.; Zhu, G.; Mont-Briant, M. Design of an Advanced Phasor Data Concentrator for Monitoring of Distributed Energy Resources in Smart Microgrids. IEEE Trans. Ind. Inform. 2017, 13, 3027–3036. [Google Scholar] [CrossRef]
  10. Pal, D.; Meyur, R.; Menon, S.; Reddy, M.J.B.; Mohanta, D.K. Real-time condition monitoring of substation equipment using thermal cameras. IET Gener. Transm. Distrib. 2018, 12, 895–902. [Google Scholar] [CrossRef]
  11. Rana, M.M. Architecture of the Internet of Energy Network: An Application to Smart Grid Communications. IEEE Access J. 2017, 5, 4704–4710. [Google Scholar] [CrossRef]
  12. ISO/IEC 30101-2014; Information Technology—Sensor Networks: Sensor Network and Its Interfaces for Smart Grid System. ISO: Geneva, Switzerland, 2014.
  13. Grid Modernization Laboratory Consortium. Project 1.2.5: Sensing & Measurement Strategy, Task 2: Technology Roadmap Development Technology Review Draft Document; U.S. Department of Energy: Washington, DC, USA, 2016.
  14. The Smart Grid: An Introduction. 2012. Available online: https://www.energy.gov/sites/default/files/oeprod/DocumentsandMedia/DOE_SG_Book_Single_Pages%281%29.pdf (accessed on 1 August 2022).
  15. Elxayed, Y.; Saad, N.; Zekry, A. Enhancing the maximum power point tracking techniques for photovoltaic systems. Renew. Sustain. Energy Rev. 2014, 40, 505–514. [Google Scholar] [CrossRef]
  16. Elxayed, Y.; Saad, N.; Zekry, A. Enhancing the design of battery charging controllers for photovoltaic systems. Renew. Sustain. Energy Rev. 2016, 58, 646–655. [Google Scholar] [CrossRef]
  17. Elxayed, Y.; Saad, N.; Zekry, A. Enhancing the tracking techniques for the global maximum power point under partial shading conditions. Renew. Sustain. Energy Rev. 2017, 73, 1173–1183. [Google Scholar] [CrossRef]
  18. Elsayed, Y.; Gabbar, H.A. Enhancing FBG Sensing in the Industrial Application by Optimizing the Grating Parameters Based on NSGA-II. Sensors 2022, 22, 8203. [Google Scholar] [CrossRef] [PubMed]
  19. New York Independent System Operator. A Review of Distributed Energy Resources; Dnv, G.L., Ed.; New York Independent System Operator: Rensselaer, NY, USA, 2014. [Google Scholar]
  20. Wikipedia Contributors. “Fiber Bragg Grating.” Wikipedia, Wikimedia Foundation, 15 Dec. 2019. Available online: en.wikipedia.org/wiki/Fiber_bragg_grating (accessed on 1 August 2022).
  21. Hisham, H.K. Numerical Analysis of Thermal Dependence of the Spectral Response of Polymer Optical Fiber Bragg Gratings. Iraq J. Electr. Electron. Eng. 2016, 12, 85–95. [Google Scholar] [CrossRef]
  22. Hong, C.-Y. An optical fibre monitoring system for evaluating the performance of a soil nailed slope. Smart Struct. Syst. 2012, 9, 393–410. [Google Scholar]
  23. Inaudi, D.; Glisic, B. Fiber Optic Sensing for Innovative Oil & Gas Production and Transport Systems. In Proceedings of the 18th International Conference on Optical Fiber Sensors, Cancún, Mexico, 23 October 2006; pp. 1–4. [Google Scholar]
  24. Elsayed, E.; Zekry, A.; Saad, N. Enhancing the Optimization of Hybrid Renewable Energy Systems by Using Statistical Calculations and Data Mining Analysis. Int. J. Renew. Energy Res. 2019, 9, 868–886. [Google Scholar]
  25. Elsayed, E.; Zekry, A.; Saad, N. Assessing Wind Energy Conversion Systems Based on Newly Developed Wind Turbine Emulator. Int. J. Smart Grid 2020, 4, 139–148. [Google Scholar]
  26. Elsayed, E.; Zekry, A.; Saad, N. Enhancing the Energy Utilization of Hybrid Renewable Energy Systems. Int. J. Renew. Energy Res. 2019, 10, 1974–1987. [Google Scholar]
  27. Othonos, A.; Kalli, K.; Kohnke, G.E. Fiber Bragg Gratings: Fundamentals and Applications in Telecommunications and Sensing. Phys. Today 2000, 53, 61–62. [Google Scholar] [CrossRef] [Green Version]
Figure 1. An example of changing temperature and equivalent change in the Bragg wavelength of FBG [18].
Energies 15 09273 g001
Figure 2. The experimental setup of the proposed scheme of the MG.
Energies 15 09273 g002
Figure 3. Simulink model of MG.
Energies 15 09273 g003
Figure 4. Realtime simulation methodology.
Energies 15 09273 g004
Figure 5. Realtime OPAL RT components design.
Energies 15 09273 g005
Figure 6. Normal operating conditions at the PV panel.
Energies 15 09273 g006
Figure 7. Normal operating conditions at PPC.
Energies 15 09273 g007
Figure 8. Temperature reading trends of FBG, LM35, and DS18B20 sensors in the battery charging test case.
Energies 15 09273 g008
Figure 9. Temperature reading trends of FBG, LM35, and DS18B20 sensors in battery discharging test case.
Energies 15 09273 g009
Figure 10. EMI effects on the FBG, LM35, and DS18B20 sensors.
Energies 15 09273 g010
Figure 11. HV effects on the FBG, LM35, and DS18B20 sensors.
Energies 15 09273 g011
Figure 12. Applying the measurements of sensor reading on the MG.
Energies 15 09273 g012
Figure 13. Output metrics at the potential point of PV array output.
Energies 15 09273 g013
Figure 14. Output metrics at the potential point of the battery bank.
Energies 15 09273 g014
Figure 15. Output metrics at the potential point of PCC output.
Energies 15 09273 g015
Figure 16. Output metrics at the potential point of PV array output under EMI.
Energies 15 09273 g016
Figure 17. Output metrics at the potential point of the battery bank under EMI.
Energies 15 09273 g017
Figure 18. Output metrics at the potential point of PCC output under EMI.
Energies 15 09273 g018
Table 1. The testing data.
SensorsTest CasesPotential Points
MTS FBG Temperature sensors, Normal caseBattery pack
DS18b20 digital temperature sensorHV EffectsPCC
LM35 analog temperature sensorEMI EffectsPV array
Table 2. Statistics of the measurements at PCC point.
minmaxAvgstd
IR24.1521724.2583624.187380.021523
LM3523.1226.6425.188180.7772
DS182024.5626.3825.548790.512773
FBG24.1499924.2111924.160560.011033
Table 3. Statistics of the measurements of all sensors for charging the battery.
SensorMinimumMaximumMeanstd
LM3523.1227.5925.636666670.843662
DS18B2024.5627.5626.108383840.719801
FBG24.1499887224.3924.264634710.084516
IR23.9636371724.3718692224.160262720.103179
Table 4. Statistics of the measurements of all sensors for discharging the battery.
MinimumMaximumMeanstd
IR29.0768829.4550729.267420.100912151
LM3528.2672832.7427630.735320.843199771
DS182029.1551729.4650229.316070.094830821
FBG29.5817332.5639331.163550.724598182
Publisher’s Note: MDPI stays neutral with regard to jurisdictional claims in published maps and institutional affiliations.

