Article

CO2-Water-Rock Interaction and Pore Structure Evolution of the Tight Sandstones of the Quantou Formation, Songliao Basin

1
School of Energy Resources, China University of Geoscience (Beijing), Beijing 100083, China
2
Research Institute of Petroleum Exploration and Development, CNPC, Beijing 100083, China
3
Aerospace Information Research Institute, Chinese Academy of Sciences, Beijing 100094, China
4
National Energy Tight Oil and Gas R&D Center, Beijing 100083, China
5
CNPC Key Laboratory of Oil and Gas Reservoirs, Beijing 100083, China
6
Daqing Oil Field Co., Ltd., Daqing 163712, China
*
Author to whom correspondence should be addressed.
Energies 2022, 15(24), 9268; https://doi.org/10.3390/en15249268
Submission received: 10 November 2022 / Revised: 26 November 2022 / Accepted: 27 November 2022 / Published: 7 December 2022

Abstract

:
As an important part of carbon dioxide capture, utilization and storage (CCUS), the progress of injecting CO2 into oil reservoirs could increase the recovery rate and achieve large-scale carbon storage. It has become one of the most important carbon storage methods around the world. This paper selected the tight sandstone of the fourth member of the Quantou Formation in the southern Songliao Basin to carry out a CO2 storage physical simulation experiment. Representative samples were collected at 24 h, 72 h, 192 h and 432 h to study the CO2 water-rock interaction and to analyze the mineral composition, pore structure and the evolutionary characteristics of physical reservoir properties over time. Physical property analysis, Ion analysis, X-ray diffraction mineral analysis, QEMSCAN mineral analysis, scanning electron microscopy and high-resolution CT scanning techniques were adopted. The main points of understanding were: (i) It shows a differential evolution of different minerals following the storage time of CO2, and carbonate minerals are mainly dissolved with ankerite as a typical representation; a small amount of calcite is formed in 24 h, and dissolved in the later period; feldspar and quartz were partially dissolved; clay mineral precipitation blocked the pores and gaps; (ii) The evolution in mineral variation leads to the complexity of pore structure evolution, following a trend of “small pores decreasing and large pores increasing” with extending storage time. The final porosity and permeability ratios gradually increase from 4.07% to 21.31% and from 2.97% to 70.06% respectively; (iii) There is a negative correlation between the increasing ratio and the original physical properties of the tight stones due to the dissolution of ankerite. Relevant research could provide scientific guidance and technical support for the geological storage of CO2 in lacustrine tight continental sandstones and the development of CCUS technology.

1. Introduction

In recent years, peak carbon and carbon neutral goals have been proposed by the world’s major economies, and solutions to the problem of carbon emissions have become a global topic [1,2]. Geological storage has become one of the most important methods to carbon neutral goals around the world [3,4,5,6]. While injecting CO2 into oil and gas reservoirs for geological storage, supercritical CO2 can be used to improve oil and gas recovery [6,7,8]. Under formation conditions, CO2 is dissolved in weak acidic fluid formed by the formation water, and it dissolves some sensitive minerals and cements in the reservoir, accompanied by the precipitation of secondary minerals and the migration of particles, which ultimately leads to changes in the reservoir pores and directly affects oil displacement efficiency, geological storage potential, and storage safety [8,9,10,11]. Therefore, supercritical CO2-formation water-rock interaction has become a focus of attention.
In recent years, research on the evolution of CO2-water-rock interaction minerals has mainly focused on mineral dissolution and mineral capture mechanisms [12,13,14]. Fischer (2010) conducted CO2 water-rock experiments on the Stuttgart sandstone samples in the Ketzin region of eastern Germany, and found that gypsum and some feldspar minerals had been dissolved and precipitated, but the albite tended to be stable. Wu (2019) designed a CO2 displacement experiment to study the differential evolution of different minerals under the influence of supercritical CO2 on the tight sandstone of the Yanchang Formation in the Ordos Basin. The results showed that all of the feldspar, albite and calcite minerals experienced different degrees of dissolution, and the dissolution process of chlorite and the migration and precipitation of kaolinite and montmorillonite had a significant influence on the pore structure. Yu (2019) studied the CO2-formation water-rock interaction in the process of CO2 storage using physical simulation experiments and numerical simulations. Both methods showed that carbonate minerals (such as dolomite, calcite) dissolve easily, while there is no obvious dissolution for the silicate minerals (such as quartz, potash feldspar, albite). Wang (2020) studied the CO2 storage in the Eocene sandstone reservoirs in Dongying Sag, Bohai Bay Basin, China, and concluded that Ca2+ in the formation water was very important for CO2 capture ability. Sandstones with high feldspar content and formation water containing CaCl2 in the depleted oil reservoirs are favorable for long-term stable CO2 geological storage. Yu (2015) studied the diagenetic symbiosis sequence and fluid inclusion characteristics of dawsonite-bearing sandstone in the southern Songliao Basin, and realized that the dawsonite, calcite and dolomite are the carbon sequestration minerals after CO2 charging. It further proved the feasibility of using CO2 to drive out oil and allow geological storage. The CO2-water-rock interaction affected the evolution characteristics of different minerals.
The mineral evolution of the CO2 water-rock interaction affects the change in reservoir porosity. Currently, there is no clear understanding of the impact of CO2-water-rock interaction on reservoir quality. There is a hypothesis that the CO2-formation water-rock interaction the tightness of and reduces the risk of CO2 leakage. Yu (2012) studied the flow-rock interaction during water-flooding of the tight sandstone CO2 formation in the southern Songliao Basin, and the porosity, pore volume, and permeability of the reservoir all decreased after the experiment. They believed that the reduction in physical properties was due to pore blockage caused by clay mineral grains. The numerical simulation results showed that a carbonate crust would formed at the sandstone-mudstone boundary after long-term storage of CO2, which prevents the escape of CO2. This result is similar to that of Liu (2011) in the numerical simulation study of CO2 storage in the Mt. Simon sandstone formation in the midwestern United States, and they both found a large amount of secondary clay mineral precipitation.
However, in recent years, many scholars have concluded that the CO2-formation water-rock interaction could improve the physical properties of the reservoir, and the CO2 can be used to increase oil recovery. For example, Yuan (2020) selected the tight sandstone of the Yanchang Formation in the Ordos Basin to study the influence of dissolution on the physical properties of the reservoir during the CO2 flooding process. A combination of CO2 static storage experiment, CO2 displacement experiment, and numerical simulation was completed, and the results showed that dissolution had occurred and it had improved the physical properties of the reservoir and enhanced recovery. The pore volume change coefficient was large in the area close to the gas injection well, but it is small in the area closer to the production well. Park (2021) studied the influence of CO2 storage on caprock porosity in the Janggi Basin of South Korea through physical simulation experiments. He observed that the dissolution of primary minerals resulted in the increase of caprock porosity, which was verified by porosity measurement and CT scanning. The sample porosity from 14.9–18.7%, to 15.1–20.7% after the experiment, and the dissolution of primary calcite was the cause of the porosity changes. Foroutan (2021) studied the pore network changes of the Triassic sandstone reservoir in the Allegheny National Forest in northwestern Pennsylvania and the Pecos area in Texas after the injection of CO2-rich brine. The results showed that the sandstone’s permeability, porosity, and pore connectivity improved significantly during the injection of CO2 rich brine, and Young’s modulus of sandstone samples reduced significantly due to the dissolution of calcite and clay minerals. Therefore accurate characterization of the mineral evolution in the CO2-formation water-rock interaction, and research on its impact on the physical properties of the reservoirs, is still a vital problem; detailed research on the comparison of in-situ mineral evolution before and after the experiment and the comparison of micro-nano-scale pore structure is required [15].
Based on the above problems, the tight sandstones of the fourth member of the Quantou Formation in the Songliao Basin were selected to carry out a physical simulation experiment of CO2-formation water-tight sandstone interaction under the real formation temperature and pressure, using a high temperature and pressure physical simulation device. Physical property analysis, XRD mineral analysis, micro-CT scanning, high-resolution scanning electron microscopy, QEMSCAN mineral analysis and ion analysis were carried out to study the in-situ characterization of the same location, the same mineral, and the same pore at the micron level at different interaction times; the evolution process of CO2 water-rock interaction sensitive minerals, the changes of micro-pore structure and the main controlling factors affecting the physical properties of the reservoir were clarified. Relevant information could provide a scientific basis and technical support for CO2 geological storage research.

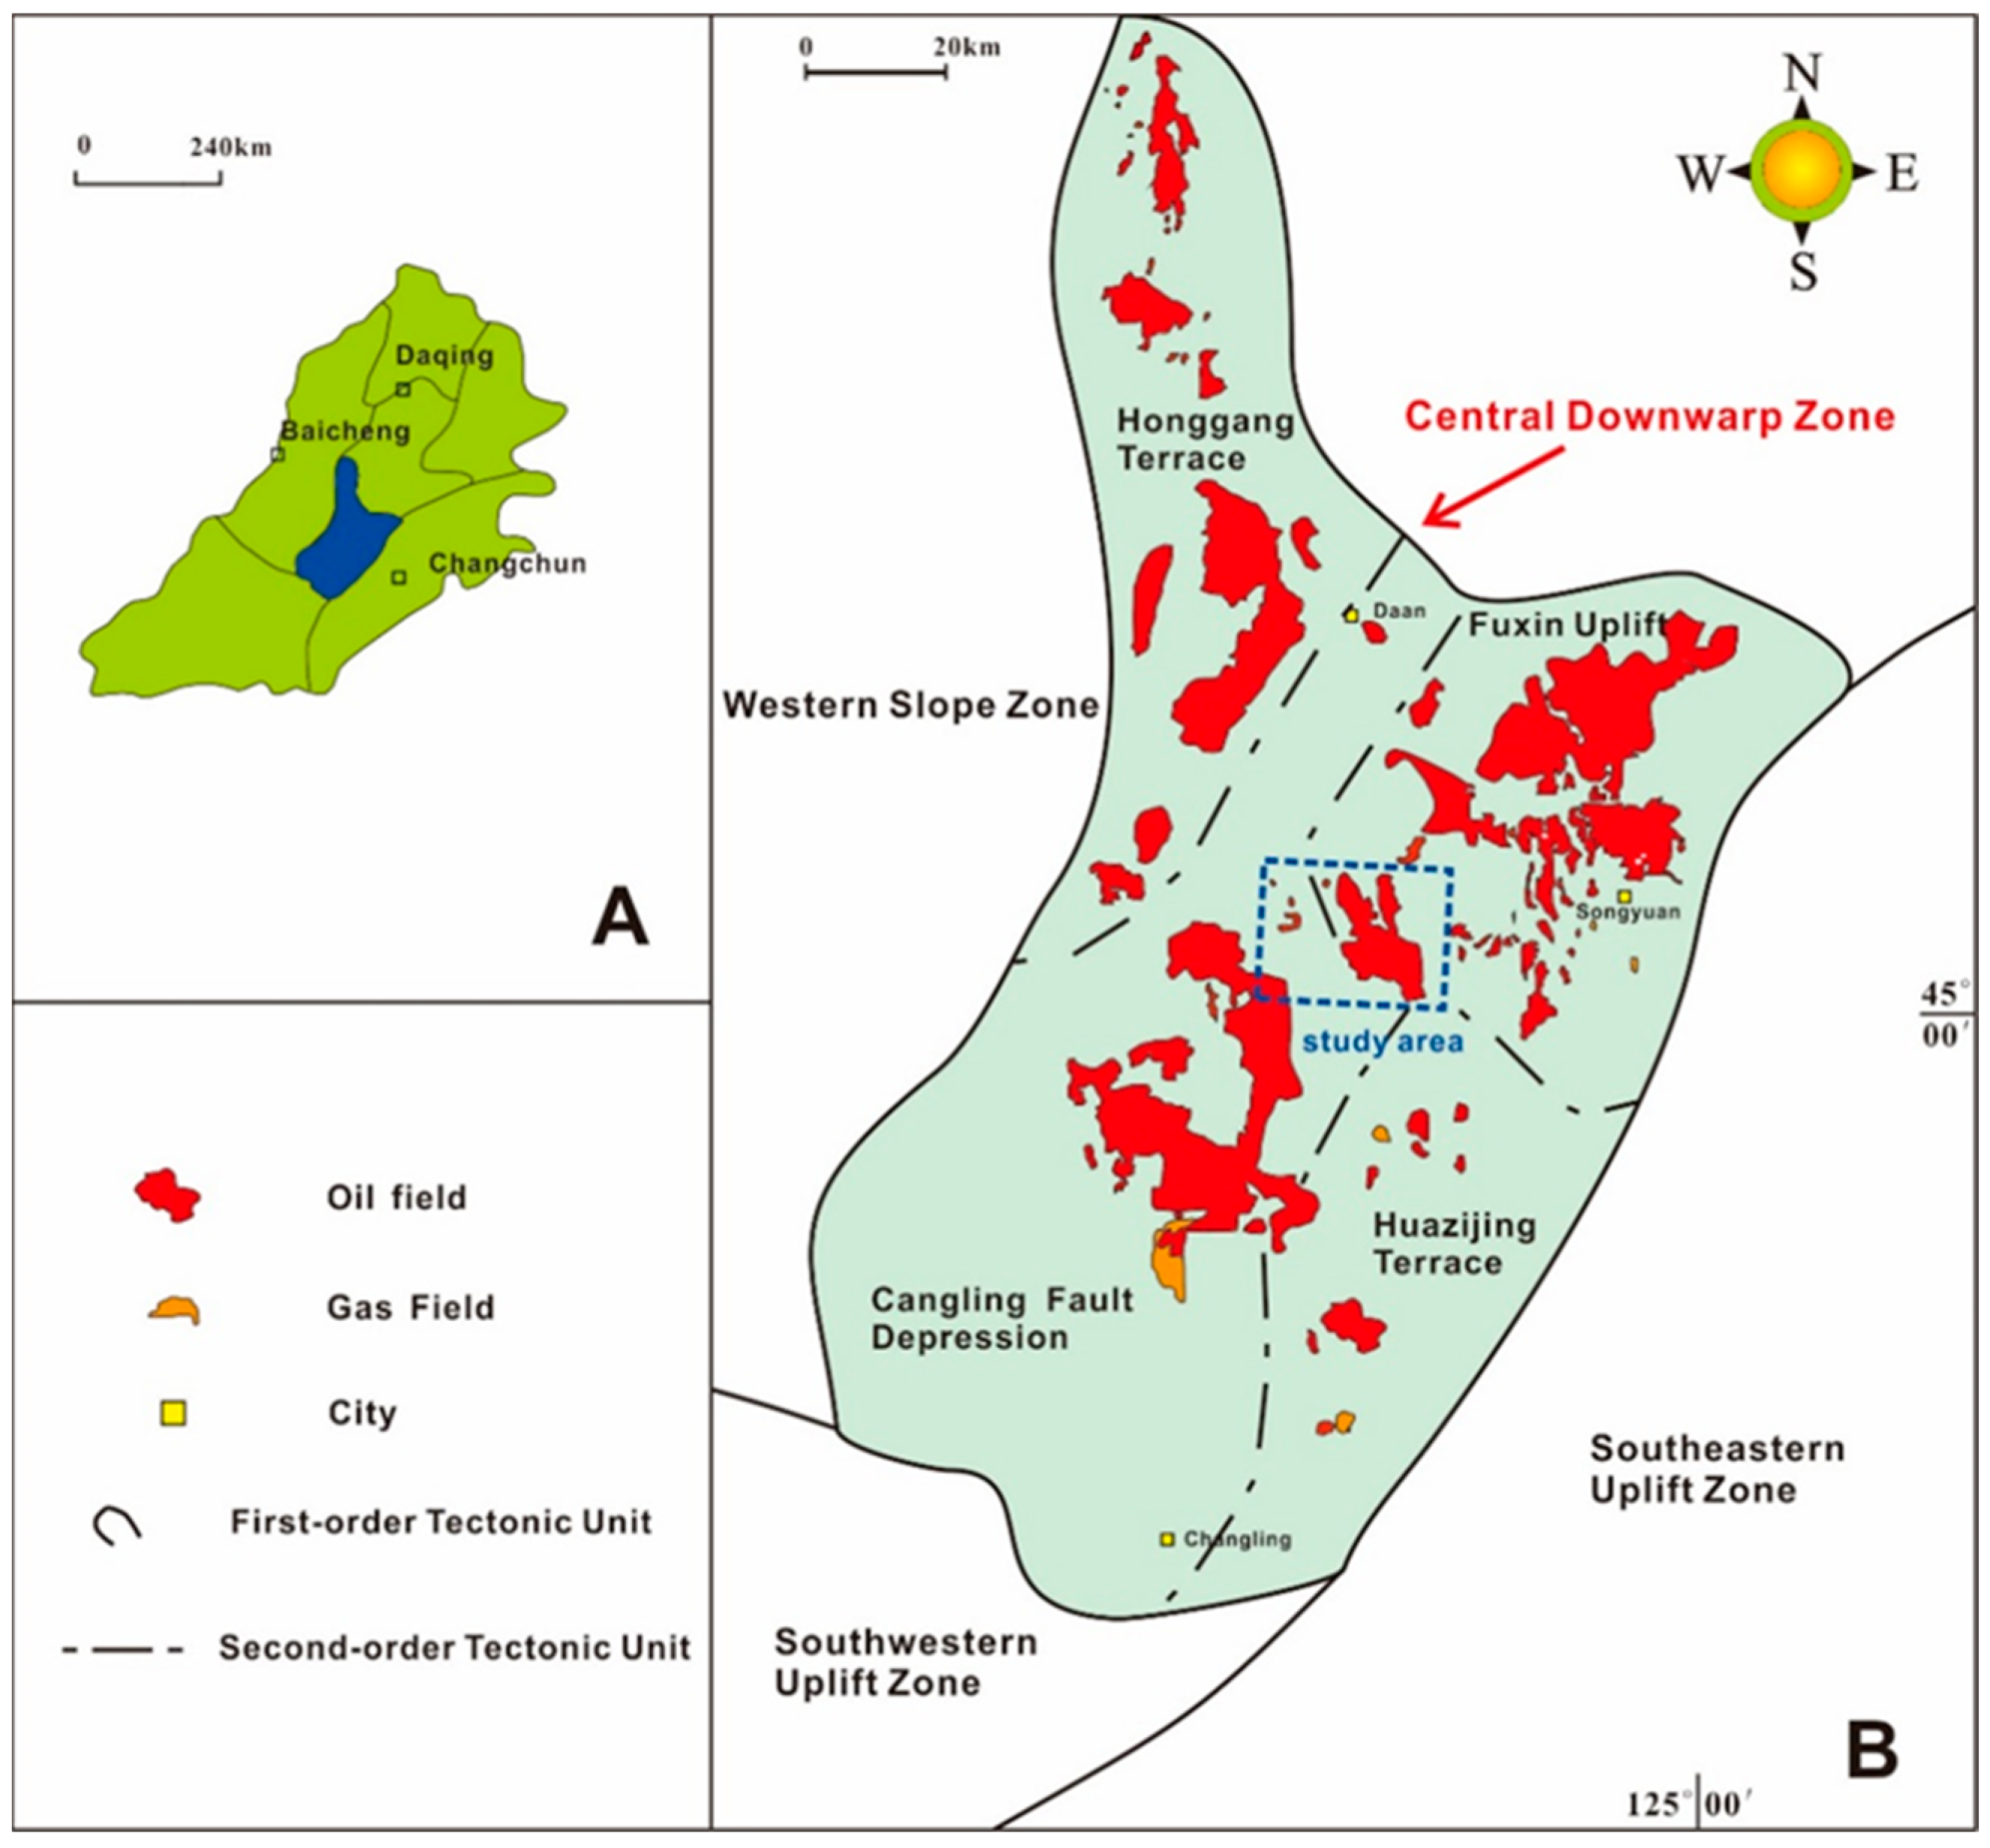
2. Geological Background and Research Methods

2.1. Sample Information

The Songliao Basin is one of the largest Mesozoic and Cenozoic rift basins in China, and one of the largest petroliferous basins in China [16]. The southern part of Songliao Basin is divided into the central sag belt, western slope belt, southeast uplift belt and southwest uplift belt (Figure 1). Our study area is located in the central sag over an area of about 1275 km2, which is a key area for tight oil development [17].
The experimental samples were collected from the fourth member of the Lower Cretaceous Quantou Formation, which has a lithology dominated by fine-grained sandstone. The overall physical properties are poor, with an average porosity of 7.3% and an average permeability of 0.13 mD. Samples with different physical properties were selected to carry out CO2-water-rock interaction in this paper. The samples were taken at depths of 2335.7 m, 2382 m, and 2385.7 m, with a porosity of 7.9%, 14.7%, and 9.7% and a permeability of 0.32 mD, 18 mD, and 0.37 mD. The dominant minerals are quartz, K-feldspar, and albite, with a quartz content of more than 50%, and a K-feldspar content of 16–40%; ankerite is the main carbonate mineral with a content of less than 8%; the content of clay minerals is relatively low with a value of 5% to 11% (Table 1).

2.2. Experimental Device and Design

The schematic diagram of the physical simulation experiment device is shown in Figure 2. The experimental device is mainly composed of a high-temperature, high-pressure and corrosion-resistant cylindrical interaction vessel, a high-temperature oven (with a maximum temperature of 250 °C), ISCO pump (with a maximum injection pressure of 120 MPa), stainless steel pipeline (with a diameter of 1 mm) and a liquid collector.
Before the experiment, the samples were prepared into a series of cylindrical samples with a 2.5 cm diameter, and a 5 mm diameter. The samples were then placed into the interaction vessel. The water was collocated based on the ion composition of formation water found in the fourth member of the Quantou Formation in the study area. CO2 was injected into the interaction container using a high-pressure CO2 gas cylinder (with a concentration of 99.99%) until the CO2 and formation water reached a saturated state.
The interaction system was set up during the experiment according to the actual formation temperature (100 °C) and pressure (24 Mpa). The system was stabilized for 12 h to ensure that the temperature and pressure of the interaction vessel reached equilibrium. It was then set to 24, 72, 192 and 432 h, and samples were taken out for physical property analysis, SEM observation, ionized water analysis, micro-CT scan, XRD mineral analysis, and to compare the minerals, reservoir physical properties and pore structure changes of the experimental samples at the different times.

2.3. Experimental Method

2.3.1. Analysis of Physical Properties

The porosity and permeability were measured using an AP-608 system of American Coretest Systems. The standard cylindrical aluminum block samples were tested before each measurement to ensure that the porosity error was within 0.1% and the permeability error was about 0.002 mD. The samples were plugs with a diameter of 2.54 cm at a temperature measured in the experiment of 24 °C; the loading pressure for the permeability measurement was 1000 Psi.

2.3.2. X-ray Diffraction Mineral Analysis

The mineral content analysis was carried out in the Key Laboratory of Oil and Gas Reservoir of China National Petroleum Corporation. The sample was pre-treated and then crushed to 200 meshes. Each analysis required a minimum of 10 g of sample. XRD quantitative analysis was used as a test method, and a Ragiku-2500 (TTR III) of Japan Rigaku Company (Tokyo, Japan) was used to conduct mineralogical analysis under 40 kV and 150 mA Cu Kα radiation. The parameters were set as the diffraction data from 2.6° to 45° with a rate of 2.0°/min and a step size of 0.02°.

2.3.3. High-Resolution Field Emission Scanning Electron Microscope (FE-SEM) and QEMSCAN Analysis

FE-SEM imaging and QEMSCAN analysis were carried out in the Key Laboratory of Oil and Gas Reservoir of China National Petroleum Corporation. The sample was pre-treated before analysis, and then cut into a 1 cm × 1 cm × 1 cm cube. After grinding, the sample’s surfaces were polished using a Leica Res102 argon ion polisher. The voltage during argon ion polishing was 5 kV and the polishing time was 2 h. A Helios Nano-Lab 650 focused ion beam scanning electron microscope (FIB-SEM) produced by FEI company was used for the high-resolution imaging analysis, with a pixel resolution of 10 nm, and the imaging voltage was set to 5 kV when observing the samples, with a beam current of 0.4 nA and a working distance of 4 mm. Before the observation, the samples were dried in an oven at 60 °C for 12 h. After the experiment, a Qunta450 field emission scanning electron microscope (SEM) produced by FEI was used to analyze the samples by QEMSCAN. The mineral changes of the sandstone samples during the CO2 water-rock interaction before and after the experiment were compared. The analysis parameters were set to the energy spectrum point spacing of 1 µm, with an imaging voltage of 20 kV, a beam current of 6.4 nA, and a working distance of 10 mm.

2.3.4. Ion Analysis

The interaction liquid was collected into a conical flask using stainless steel pipes and valves. The interaction liquid ion analysis was carried out at Zhongtie Geophysical Exploration Co. Ltd. in Langfang city, Hebei province, and the sodium, potassium, calcium, magnesium, iron, aluminum, sulfate and silicon ions were measured by inductively coupled plasma atomic absorption spectrophotometry and EDTA titration method.

2.3.5. Micron CT

Micro-CT is a high-resolution and high-contrast X-ray tomography microscope that can detect micro-scale pore networks in tight sandstones. After scanning, the pore space can be visualized and reconstructed in three dimensions. In order to ensure the imaging quality, the samples were drilled into a plug with a diameter of 5 mm and a length of 1 cm. The parameters were set to a single exposure time of 2 s with a pixel resolution of 1 μm and a total scanning time of 4 h. A total of 2500 images were collected to complete the sample scanning. Micron CT scanning was carried out in the Key Laboratory of Oil and Gas Reservoir of China National Petroleum Corporation. During the scanning process, the positions of the X-ray source and detector remained unchanged. The same scanning parameters were used to scan the same position for each sample. Avizo Fire software was used to reconstruct the three-dimensional model and calculate pore volume and structural changes after the images were acquired.

3. Results

3.1. Differential Evolution Characteristics of Minerals
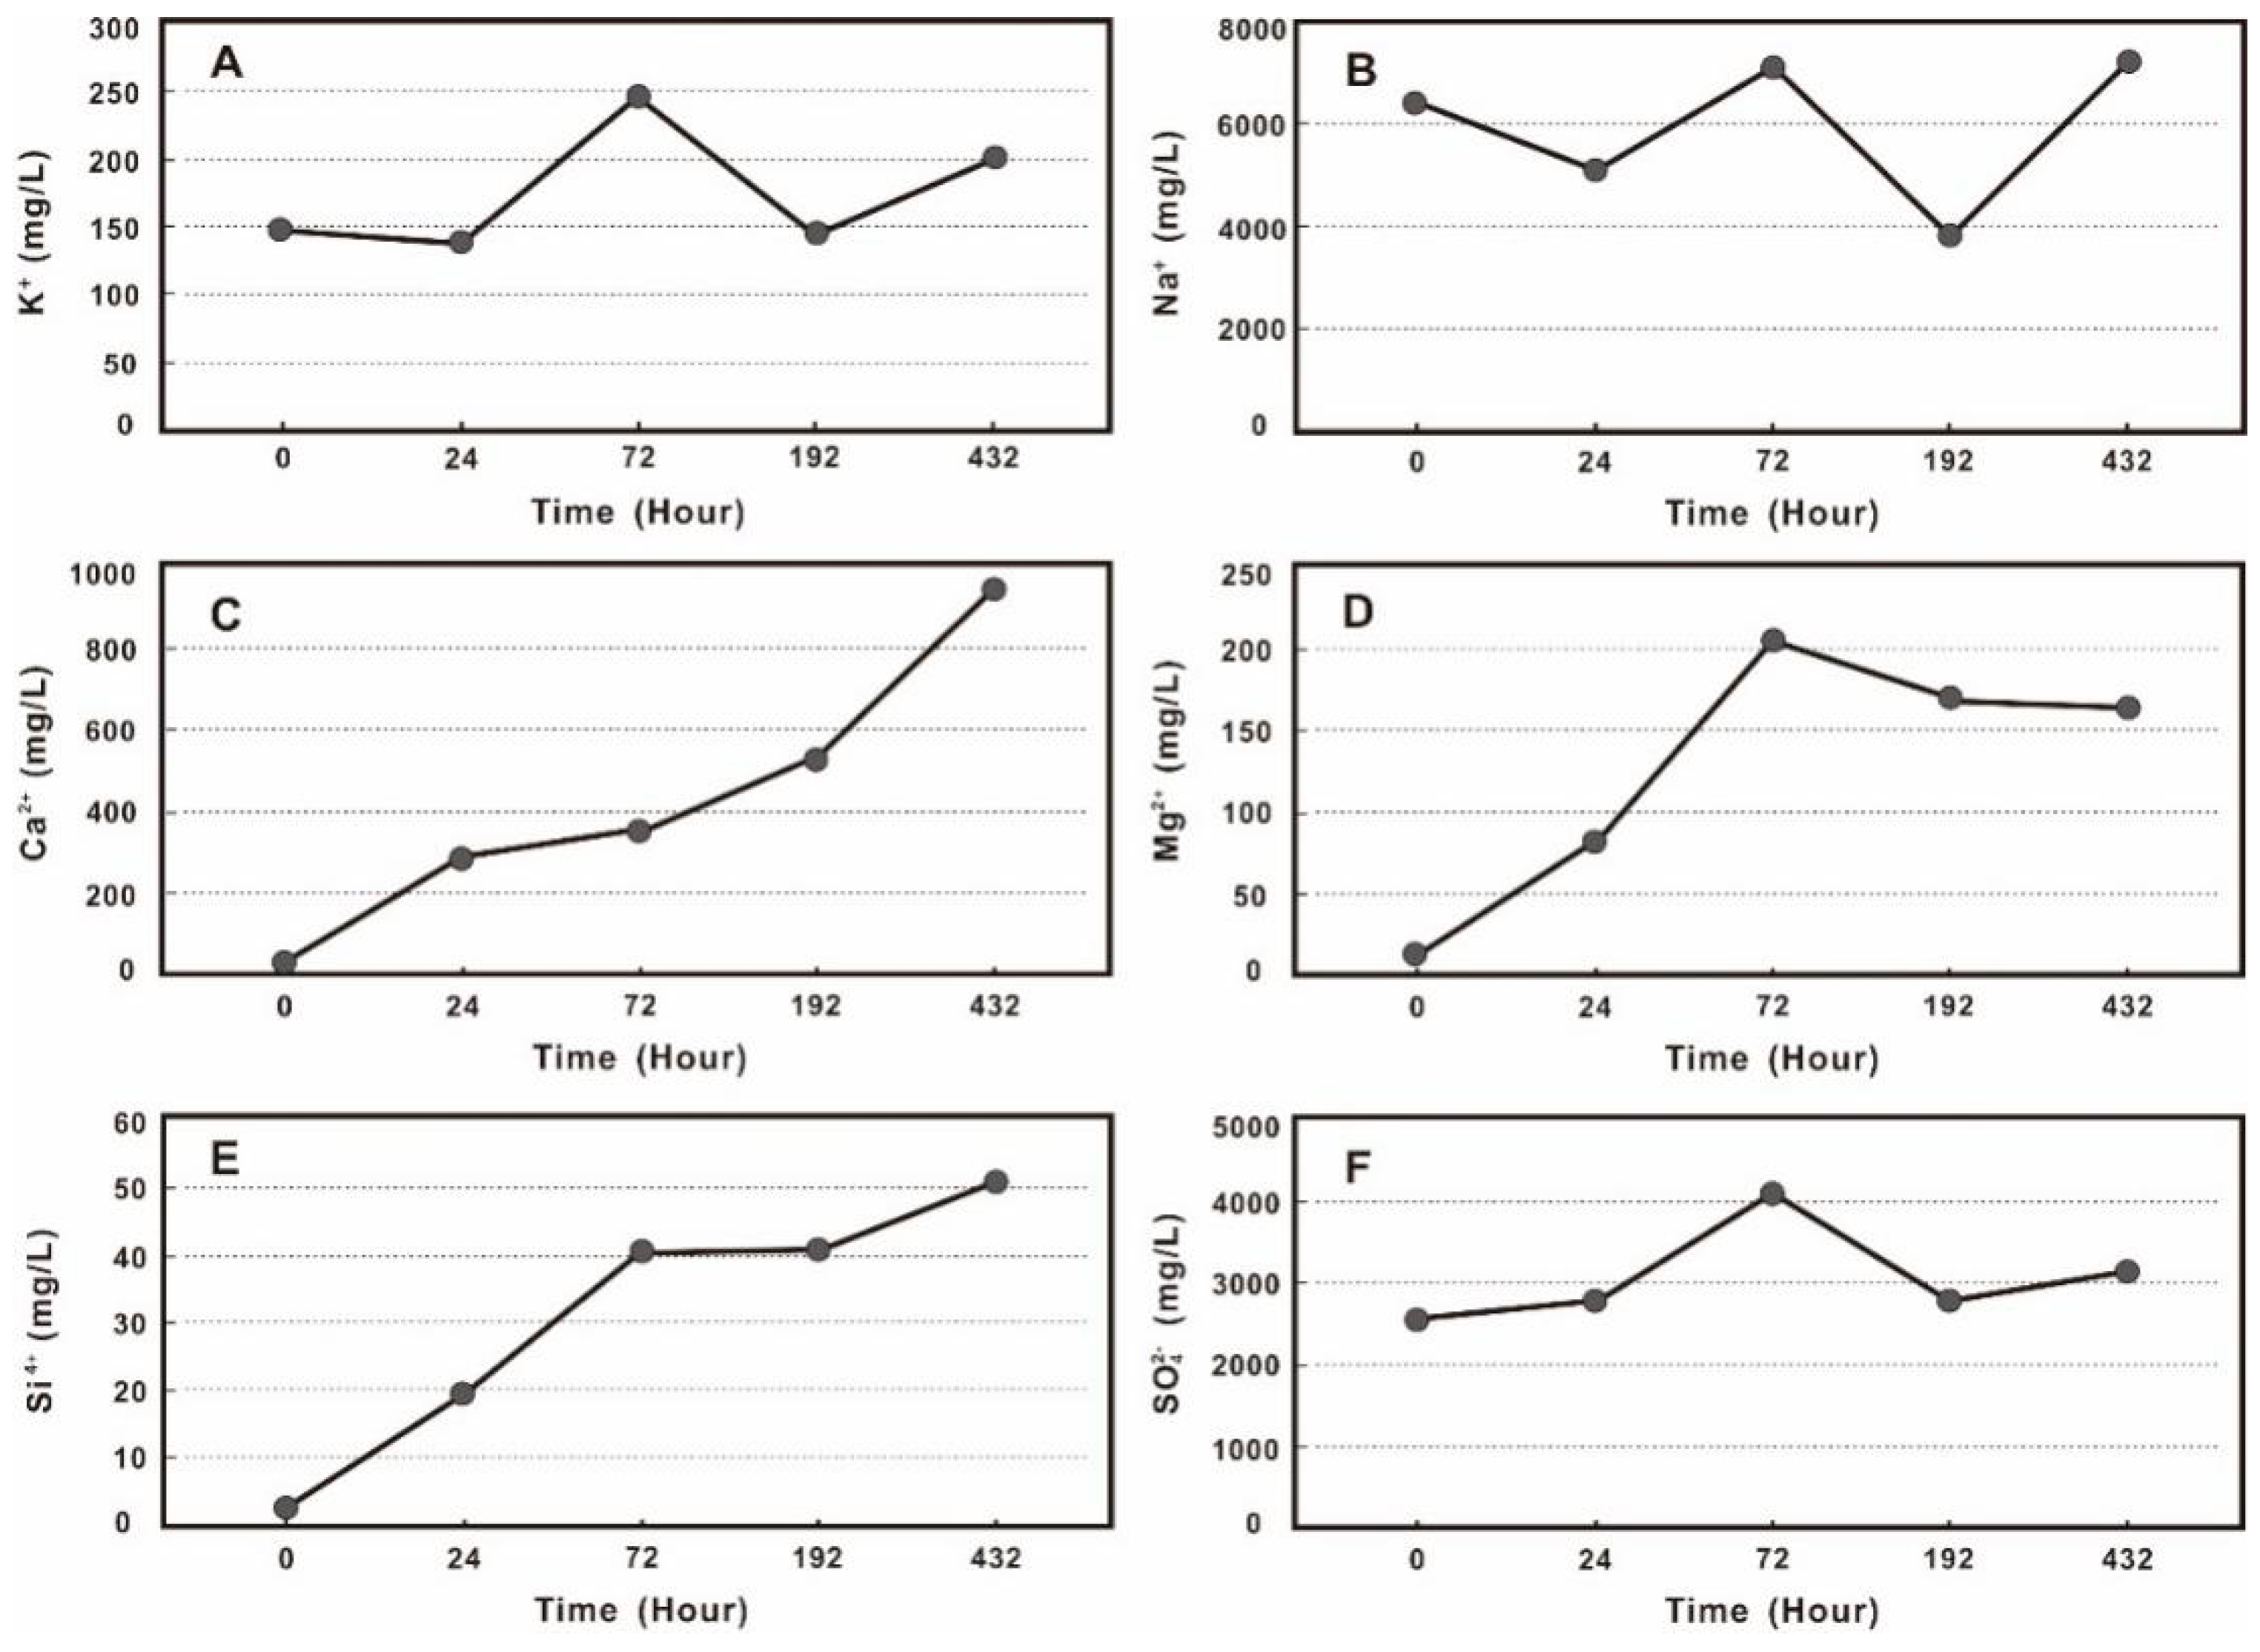
The XRD mineral analysis results (Figure 3) show that the relative contents of K-feldspar, quartz, and clay minerals increased overall as the interaction progresses, while the relative contents of albite and ankerite decreased. The content of ankerite in Q-147 is so low that it is difficult to detect. Only 1.1% of the ankerite was detected in the 72 h of the experiment; 6.3% of the ankerite was detected in the initial state of sample Q-148, and 6.9% at 24 h. There was no ankerite detected at 72 h, 192 h, and 432 h.
The mineral content changed during different CO2-water-rock interaction stages. Taking the A-130 as an example, the relative content of K-feldspar did not change greatly during the experiment, but there was a significant decrease in the relative content of albite from 27.4% to 19.7% after 72 h. After 192 h, it continued to decrease to 16.7%, and after 432 h, it increased to 19.8%. The relative content of quartz kept increasing until 192 h after the experiment and the content decreased from 64.5% to 58% after 432 h, but the overall quartz content increased. The relative content of ankerite and clay minerals evolved in a similar trend before 192 h. Both continued to decrease and then increased slightly. However, the relative content of ankerite decreased again after 432 h, and the relative content of clay minerals increased significantly.

3.2. Ion Evolution

Along with the interaction progresses, contents of K+, Na+, Ca2+, Mg2+, Si4+, and SO42− showed an overall upward trend (Figure 4). There was a similar trend for the Ca2+, Mg2+, and Si4+ with relatively low initial contents. The increase of Ca2+ content during the whole experiment was relatively obvious, with a continued increase in concentrations from the initial 4.5 mg/L to 943.5 mg/L after the experiment (Figure 4C); Mg2+ and Si4+ increased significantly in the early stage of the interaction, from the initial 13.6 mg/L and 0.3 mg/L to 272.5 mg/L and 54 mg/L after 72 h of interaction, and then gradually flattened. The content of Mg2+ decreased slightly in the later stage, with final Mg2+ and Si4+ concentrations of 163.5 mg/L and 51 mg/L (Figure 4D,E).
The K+, Na+, and SO42− followed a similar pattern with fluctuating changes on the whole. They decreased slightly or increased at 24 h after the interaction (Figure 4A,B,F). K+ decreased from the initial 146.7 mg/L to 136.7 mg/L, and Na+ from 6437 mg/L to 5115.4 mg/L (Figure 4A,B). SO42− increased from the initial 2570 mg/L to 2760 mg /L, and K+, Na+, SO42− reached their peaks after 72 h with values of 325.8 mg/L, 9507.8 mg/L, and 5440 mg/L. They then decreased to 143.7 mg/L, 3829.9 mg/L, 2785.7 mg/L after 192 h. At 432 h the increasing trends varied considerably. The final concentrations of K+, Na+, and SO42− were 199.4 mg/L, 7225.4 mg/L, and 3140 mg/L (Figure 4A,B,F).

3.3. SEM Results

(1) Non-clay minerals
Previous research has shown that the non-clay minerals of the fourth member of the Quantou Formation tight sandstone mainly include quartz, K-feldspar, albite, calcite and dolomite. The results of in-situ SEM showed that with the extension of the CO2 flow rock interaction time, the evolution characteristics of different minerals were different. Quartz, K-feldspar, and albite had no apparent dissolution (Figure 5 and Figure 6); it should be noted that although there is no significant change in the pore morphology related to quartz and feldspar, oil removement can be seen in the original sample. The pores between the feldspar and quartz grains are filled with oil (Figure 5A and Figure 6A). As the interaction time increases, the oil in the pores is gradually dissolved (Figure 5B and Figure 6B–E).
Unlike quartz and feldspar, the carbonate minerals in the tight sandstones changed significantly in the CO2 fluid-rock interaction. However, the evolution characteristics of dolomite and calcite were different. Ankerite experienced the most apparent dissolution (Figure 5 and Figure 6). SEM results showed that the ankerite cement eroded after the interaction (Figure 5A,B), while the surrounding felsic minerals did not change greatly (Figure 5C,D). The number and space of pores at the same location increased significantly from 192 h (Figure 5E) to 432 h (Figure 5F), with a small amount of NaCl precipitation. In addition, the dolomite dissolution gradually increased with time, and the dissolution properties of the dolomite were not obvious from the original state (Figure 6A) to 24 h (Figure 6B). The ankerite surface dissolved into pores after 72 h (Figure 6C). After 192 h, ankerite dissolution increased considerably (Figure 6D), demonstrating not only an increase in pore sizes, but also a significantly improved connectivity between pores (Figure 6E). A large area of ankerite had dissolved after 432 h (Figure 6F), forming large-scale pore spaces, and only a small amount of ankerite was observed in the QEMSCAN (Figure 6E).
Unlike the ankerite, the calcite underwent simultaneous dissolution and precipitation (Figure 7). After 24 h, a large amount of authigenic minerals were found in the sample (Figure 7A,B), determined by the EDS spectrum to be calcite (Figure 7F). The amount of authigenic calcite observed in the sample increased after 72 h, but the particle size became smaller. Some dissolution holes could be observed in the new calcite (Figure 7C). The calcite was almost wholly dissolved after 192 h, and only a small residue could be observed (Figure 7D). Some remaining uncorroded calcite crystals could still be observed after 432 h when observing samples of other positions, but there was a big difference in morphology from the calcite particles that appeared at 24 h (Figure 7E).
(2) Clay minerals
The clay minerals of the Quantou Formation are dominated by illite-smectite mixed layers. In-situ SEM observation showed that the illite-smectite mixed layer is mainly in the form of filler between feldspar and quartz particles, and the pores are mainly arranged along the direction of narrow slit-like pores. During the CO2 fluid-rock interaction process, the illite-smectite mixed layers were relatively stable, but mineral deposits can be observed in the intragranular pores of the illite-smectite mixed layer (Figure 8). From 24 h to 72 h, clay mineral filling appeared in the inner pores of part of the illite-smectite mixed layers, and the particle size of the filling particles became larger (Figure 8A–C); during the later period after 432 h as the interaction time increased, all the inner pores were filled with secondary minerals (Figure 8D). It should be noted that the particle size of the secondary minerals gradually decreases (Figure 8D,E).

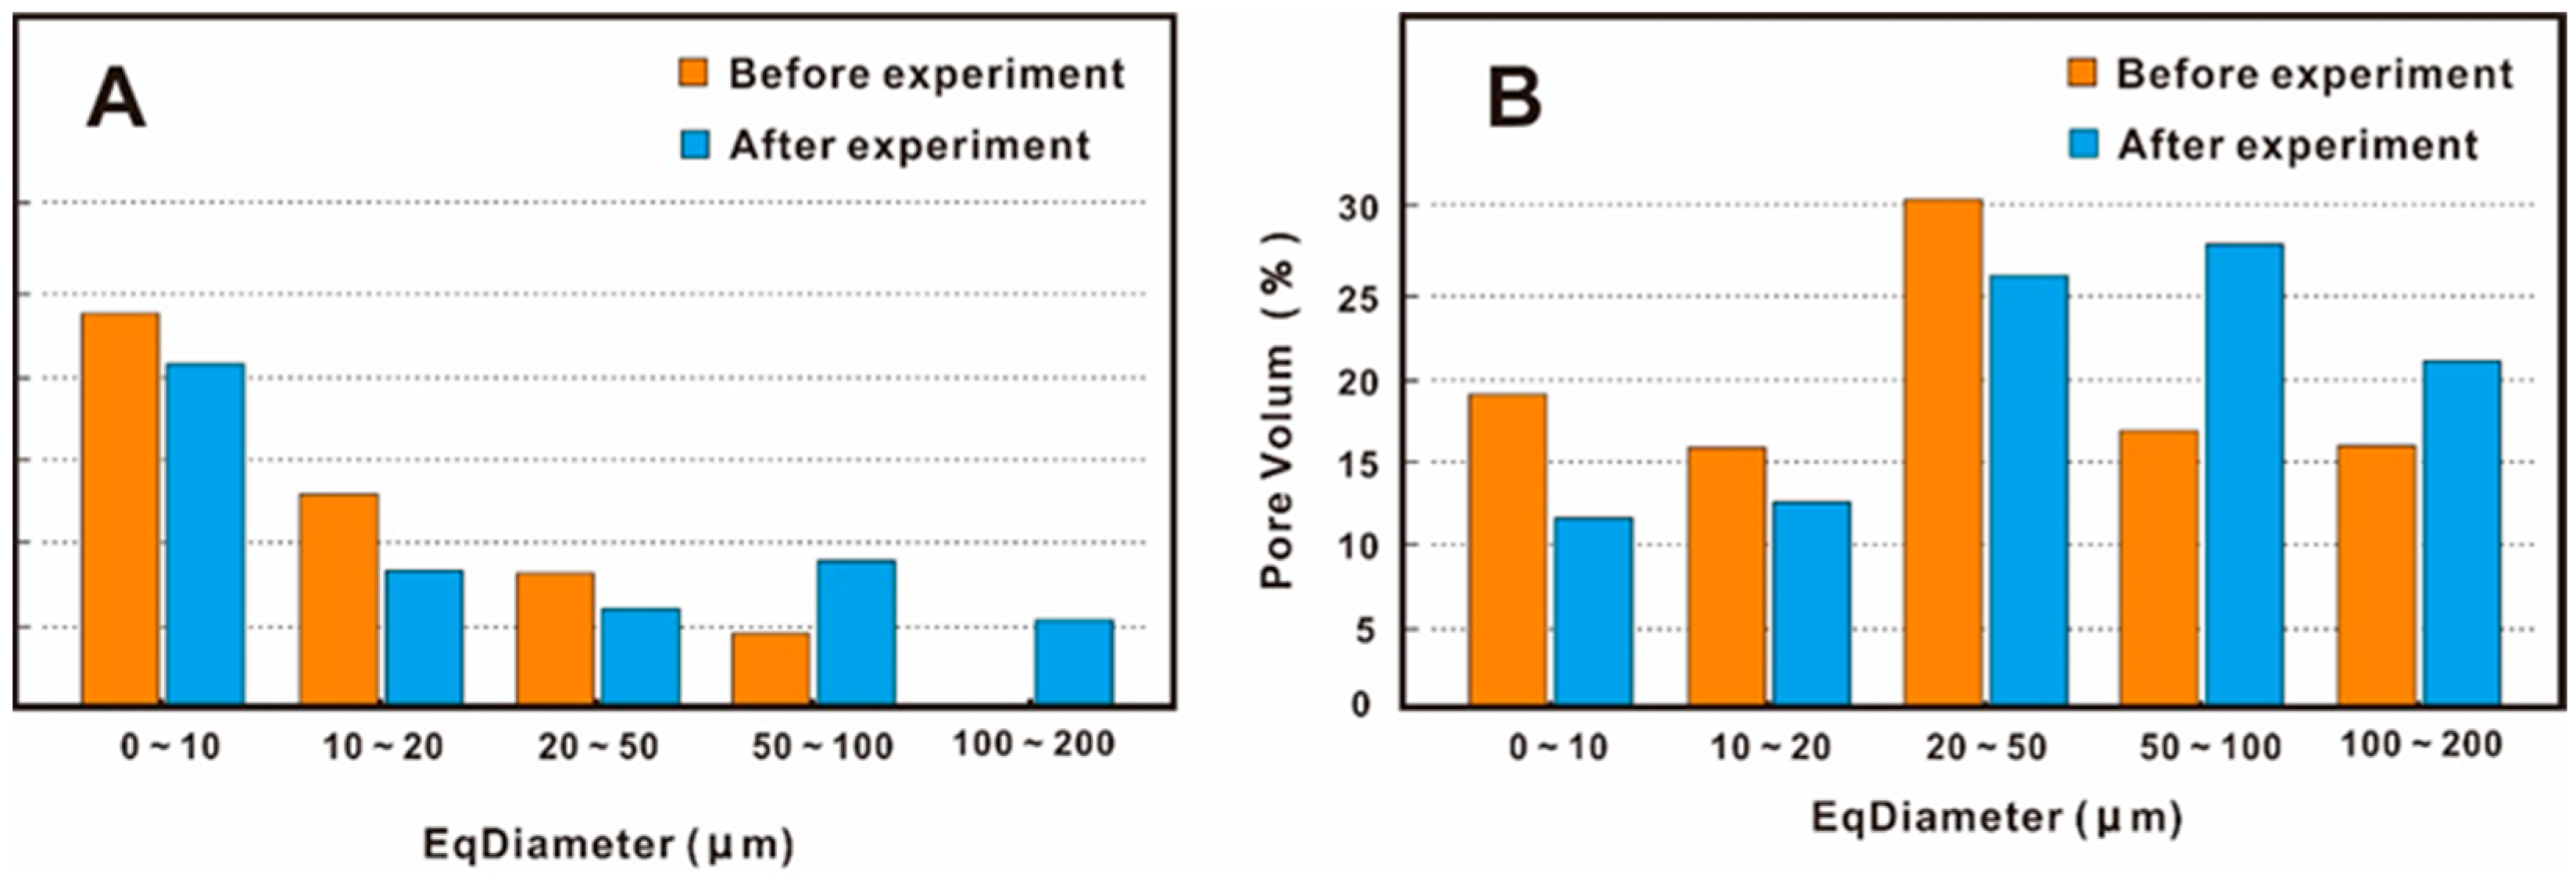
3.4. Three-Dimensional Characterization of the Pore Structures

The quantitative analysis of the three-dimensional CT model shows strong heterogeneity of the pore system in different parts before and after the experiment (Figure 9). There was an increasing trend in the proportion of relatively large pores (Figure 9A–D). In this study, a ball-and-stick model based on connected pores is used to describe the permeability of a sample. The ball-and-stick model indicated that the changes in the connectivity between the pores of different samples before and after the CO2 water-rock interaction also varied: the overall connectivity of the sample A-130 became better after the experiment (Figure 9A1,B1); the overall connectivity of the sample Q-148 became weaker after the experiment, but it was observed that some local pores had better connectivity (Figure 9C1,D1).
The ball-and-stick model also indicated that the small pore volume decreased and the large pore volume increased before and after the experiment (Figure 10). The pore volumes of sample A-130 at diameters of 0–10 μm, 10–20 μm, and 20–50 μm decreased by 2.63%, 9.71%, and 5.51% after the experiment, and the pore volumes at diameters of 50–100 μm and 100–200 μm increased by 7.12% and 10.72%. The pore volumes of sample Q-148 at diameters of 0–10 μm, 10–20 μm, and 20–50 μm decreased by 6.8%, 3.83%, and 4.7% after the experiment, and the pore volumes at diameters of 50–100 μm and 100–200 μm increased by 10.75% and 4.59%.

3.5. Changes in the Reservoir Physical Properties

The comparison of physical properties before and after the experiment showed that the porosity and permeability tended to increase after the water-rock interaction. The porosity of samples A-130, Q-147, and Q-148 increased by 21.31%, 4.07%, and 6.65%, and the permeability increased by 70.06%, 32.37%, and 2.97% (Figure 11, Table 1). Sample A-130 had the lowest initial porosity and permeability, and the highest increases in porosity and permeability after the experiment; sample Q-147 had the highest initial porosity and permeability, and the lowest increase in porosity and permeability after the experiment. The initial porosity and permeability of sample Q-148 lay between sample A-130 and Q-147, and the rate of change in physical properties after the experiment was also in the middle, indicating that there was a negative correlation between the change rates of initial physical properties and subsequent physical properties after interaction during the CO2 water-rock interaction process.
The impact of different CO2 water-rock interaction time on the physical properties of the reservoir was also different. Taking sample A-130 as an example, the relative change ratio of physical properties was obvious in the early stage and not so obvious in the later stage. The increase in porosity was 12.53%, and the permeability increase was 40.43% from the initial state to the 24th hour; the relative change in porosity was 4.71% from 24 h to 72 h, with a corresponding permeability change of 16.7%. The physical properties of the samples were relatively stable at 72 h. After 192 h and 432 h, the changes in porosity were −1.12% and 4.12%, and the changes in permeability were −5.08% and 9.93%. The changes in physical properties of the sample at different interaction times for the three different groups were almost the same (Figure 11).

4. Discussion

4.1. CO2 Water-Rock Interaction in Tight Sandstone

The differential evolution of minerals is the focus of CO2 water-rock interaction [18,19,20,21,22]. Feldspar, calcite, dolomite, and clay minerals are the major minerals involved in mineral evolution and micro-migration, especially in sandstone reservoirs. Previous studies have focused on these minerals [23,24,25,26]. The tight sandstones of the fourth member of Quantou Formation was selected to carry out CO2 water-rock interaction under a storage condition. The total experiment time exceeded 18 days. In terms of mineral evolution, two different phenomena were observed: (1) K-feldspar and albite minerals did not change significantly before and after the experiment. At more than 18 days, the cumulative time of the simulation experiment far surpassed the obvious dissolution time for the of feldspar minerals observed by predecessors. Therefore, it is inferred that the oil on the surface of feldspar pores may be the main reason for the weaker dissolution of feldspar minerals. This oil hindered direct contact between the acidic fluid formed by CO2 and the feldspar minerals, thus preventing the feldspar dissolution. From the SEM images after the experiment, it can be seen that the oil attached to the pore surface of the feldspar was finally removed and dissolved (Figure 5E), and this finally caused the differential dissolution of the feldspar minerals. (2) Differential evolution of calcite and ankerite: Calcite crystals precipitation were observed after 24 h of the experiment, and ankerite experienced the most obvious dissolution. The analysis of the ion concentration of the interaction solution showed that Ca2+ concentration was very low in the initial ionized water. The variation of the Ca2+ concentration corresponded to the variation of the ankerite (Figure 4). Therefore, it is inferred that the Ca2+ of the newly formed calcite are from the dissolution of carbonate minerals in the sample (1). With the experimental system maintained at high temperature and high pressure, and sufficient CO32− and H+ in the solution, the dissolution and formation of the new calcite proceeded simultaneously by Equations (2) and (3). After the experiment, some new crystals precipitates could still be observed. This process of ion migration and evolution provides a theoretical basis for mineralization and storage, illustrating that calcite can be used as a stable carbon-fixing mineral in the CO2 geological storage progress, the formula that transformation of mineral ions is as follows:
CaMg CO 3 2 + 2 H + = Ca 2 + + Mg 2 + + 2 HCO 3
Ca 2 + + CO 3 2 = CaCO 3
CaCO 3 + H + = Ca 2 + + HCO 3
High-resolution in-situ SEM results showed no significant change in the morphology and composition of clay minerals. It found only that the particle migration during the interaction had blocked the pores of the existing clay minerals. On the one hand, the clay mineral was single and dominated by illite-smectite mixed layers in the study area, and the content of chlorite and kaolinite was low. Previous studies have shown that chlorite is more sensitive to CO2-water-rock interaction and dissolves easily, kaolinite and montmorillonite precipitate easily [1,8]; The illite-smectite mixed layer was relatively stable during CO2-water-rock interaction. On the other hand, the occurrence of clay minerals in the study area is different from other regions. For example, the clay minerals in the tight sandstone of the Chang 7 member from the Ordos were dominated by fenstral forms, which were characterized by multi-phase growth [1]; The clay minerals in the tight sandstone of the fourth member of the Quantou Formation are mainly filled with intergranular fillings such as feldspar and quartz. There was no multi-phase growth, and the fenstral structure was relatively stable during the experiment. It is speculated that the relatively small changes in clay minerals may be caused by the single type and attitude of clay minerals and the lack of clay minerals sensitive to CO2.

4.2. Physical Property Changes

We focus on the comparative evaluation of tight sandstones with different physical properties. The results show that the original physical properties of the samples correlate negatively with the changing rate of physical properties after the experiment. The mineral composition of tight sandstone is one of the causes resulting in the change in the physical properties of the reservoirs after CO2-water-rock interaction. That is to say, the higher the propCO2-sensitive sensitive minerals, the more obvious changes in tight sandstone after the interaction. Using the experimental samples in this paper as an example, ankerite is relatively sensitive to the CO2-water-rock interaction. Ankerite is an authigenic cement and the higher the content, the worse initial the physical property of the reservoir. Sample A-130 had the worst initial physical properties and the highest ankerite content, accounting for 7.5% of the total mineral content. The changes in porosity and permeability of A-130 at different interaction times were the largest. While sample Q-147 had the best initial physical properties with the lowest dolomite content, the changes in porosity and permeability at different interaction times were the smallest. Therefore, when studying the physical property changes after CO2-water-rock interaction, it is very important to clarify the content of sensitive minerals in the CO2-water-rock interaction process in the study area.
The differential evolution of minerals has led to the variation of the microscopic pore structure of the reservoirs [27]. It can be seen from the SEM that the carbonate minerals represented by ankerite are dissolved into pores. At the same time, micro-particles migrated and precipitated after dissolution, which blocked the original pore system of clay minerals such as the illite-smectite mixed layer. This study selected two relatively tight samples to reconstruct the three-dimensional pore structure before and after the experiment using the micron CT and quantitatively analyzed the pore data. The results show that the proportion of pore volume with an equivalent diameter of 0–50 μm in the total pore volume increased after the experiment, while the proportion of pore volume with an equivalent diameter of 50–200 μm in the total pore volume decreased after the experiment. This illustrates that the dissolution accounted for by CO2-water-rock interaction in the study area has more influence on the pore structures than the precipitation of micro-particles, and mineral dissolution is the main reason for the increase of the pore volume and the connectivity between the pores of the sample after the experiment. It should be noted that we found that carbonate minerals showed the greatest change in the water-rock interaction. However, due to the relatively low content of these minerals, the physical properties of the samples did not change significantly before and after the experiment.
In addition, the connectivity between the pores correlates closely with the overall permeability [11,27]. In other words, the connectivity of the pores represents the permeability change. In the connectivity analysis of sample Q-148, it can be seen from the ball-and-stick model that the overall connectivity of the sample after the experiment was worse than that of the initial sample, while the connectivity of some connected pores in the local area became better. Combined with the physical property results, the permeability of sample Q-148 was 0.37 mD before the experiment and 0.381 mD after the experiment, and the permeability change rate was only 2.97%. This indicates that the worse overall pore connectivity and the improved local pore connectivity jointly led to the slight permeability changes.
Sample A-130 had an initial permeability of 0.324 mD and a final permeability of 0.551 mD after the experiment, giving a permeability increase of 70.06%. From the ball-and-stick model, it can be seen that the overall pore connectivity of sample A-130 increased significantly, and these results illustrate that there is a close correlation between pore connectivity and permeability.

5. Conclusions

In this paper, the tight sandstone of the fourth member of the Cretaceous Quantou Formation in the southern Songliao Basin was selected to carry out physical simulation experiments of CO2-formation water-rock interaction under sub-surface conditions. This study mainly discussed the mineral evolution of at different storage times and their influence on the pore structure. It clarified the changes in physical properties and the main controlling factors of tight sandstone reservoirs. The main conclusions are as follows:
(1) Different minerals had different evolution characteristics in the CO2-water-rock interaction. Quartz, potash feldspar, albite, etc. were relatively stable, but ankerite dissolved strongly to form new dissolution pores and formed Ca2+ ions. The precipitation and dissolution of calcite occurred simultaneously, forming a large number of calcite crystals in the early stage. The crystallization and dissolution of calcite proceeded simultaneously in the middle and late stages of the interaction, and a relatively stable calcite precipitation was formed in the later period. The clay minerals such as the illite-smectite mixed layer were relatively stable, and a large number of dissolved particles migrated and precipitated, blocking the pores of the clay minerals.
(2) The pore structure of the studied tight sandstone showed a trend of small pores decreasing and large pores increasing. The dissolution of carbonate minerals represented by ankerite, the precipitation of calcite crystals, and the migration of particles to block the inner pores of the illite-smectite mixed layer were the main factors causing the differential evolution of the pore structures. After the experiment, the proportion of the pore volume with an equivalent diameter of 0–50 μm decreased, while the proportion of the pore volume with an equivalent diameter of 50 μm–200 μm increased. The connectivity between pores was closely related to permeability.
(3) The differential evolution of minerals caused the differential evolution of the microscopic pore structure and connectivity, which triggered changes in the reservoir’s physical properties. As the interaction time increased, the porosity and permeability of the tight sandstone in the fourth member of the Quantou Formation increased (from 4.07–21.31% and from 2.97–70.06%). The higher the sample’s original physical properties, the smaller the increase in physical properties after the experiment. The main reason for this is that ankerite is an authigenic cement—the higher the content, the worse the physical properties of the reservoir—but ankerite is very sensitive in the CO2-water-rock interaction fluid system. With a higher ankerite content comes a higher proportion of dissolution pores, leading to a much higher change in the physical properties.

Author Contributions

Conceptualization, writing-original draft preparation, Data curation, Y.Z.; Methodology, Supervision, Project administration, S.W.; Writing—review & editing, Y.C.; Investigation, C.Y.; Methodology, Z.Y.; Visualization, G.H. and M.G.; Formal analysis, M.L.; Resources, X.Y. All authors have read and agreed to the published version of the manuscript.

Funding

This work was financially supported by the National Natural Science Foundation of China (Project No. 42072187) and CNPC Key Project of Science and Technology (No. 2021ZZ01-05).

Data Availability Statement

Not applicable.

Conflicts of Interest

The authors declare no conflict of interest.

References

  1. Wu, S.; Zou, C.; Ma, D.; Zhai, X.; Yu, H.; Yu, Z. Reservoir property changes during CO2–brine flow-through experiments in tight sandstone: Implications for CO2 enhanced oil recovery in the Triassic Chang 7 Member tight sandstone, Ordos Basin, China. J. Asian Earth Sci. 2019, 179, 200–210. [Google Scholar] [CrossRef]
  2. Moodiea, N.; Ampomahb, W.; Jia, W.; Heathc, J.; Phersona, B. Assignment and calibration of relative permeability by hydrostratigraphic units for multiphase flow analysis, case study: CO2-EOR operations at the Farnsworth Unit, Texas. Int. J. Greenh. Gas Control 2019, 81, 103–114. [Google Scholar] [CrossRef]
  3. Ma, B.; Cao, Y.; Zhang, Y.; Eriksson, K. Role of CO2-water-rock interactions and implications for CO2 sequestration in Eocene deeply buried sandstones in the Bonan Sag, eastern Bohai Bay Basin, China. Chem. Geol. 2019, 541, 119585. [Google Scholar] [CrossRef]
  4. Jiang, K.; Ashworth, P. The development of Carbon Capture Utilization and Storage (CCUS) research in China: A bibliometric perspective. Renew. Sustain. Energy Rev. 2021, 138, 110521. [Google Scholar] [CrossRef]
  5. Sun, Y.; Li, Q.; Yang, D.; Liu, X. Laboratory core flooding experimental systems for CO2 geosequestration: An updated review over the past decade. J. Rock Mech. Geotech. Eng. 2011, 8, 113–126. [Google Scholar] [CrossRef] [Green Version]
  6. Wang, Y.; Zan, N.; Cao, X.; Cao, Y.; Yuan, G.; Jonathan, G.; Lin, M. Geologic CO2 storage in arkosic sandstones with CaCl2-rich formation water. Chem. Geol. 2020, 558, 119867. [Google Scholar]
  7. Hamza, A.; Hussein, I.A.; Al-Marri, M.J.; Mahmoud, M.; Shawabkeh, R.; Aparicio, S. CO2 enhanced gas recovery and sequestration in depleted gas reservoirs: A review. J. Pet. Sci. Eng 2020, 196, 107685. [Google Scholar] [CrossRef]
  8. Yu, Z.; Liu, L.; Yang, S.; Li, S.; Yang, Y. An experimental study of CO2–brine–rock interaction at in situ pressure–temperature reservoir conditions. Chem. Geol. 2012, 326–327, 88–101. [Google Scholar] [CrossRef]
  9. Hua, G.; Wu, S.; Jing, Z.; Yu, X.; Xu, K.; Shi, W.; Guan, M. Rock physical and chemical alterations during the in-situ interaction between fracturing fluid and Silurian organic-rich shales in China. J. Nat. Gas Sci. Eng. 2021, 94, 104075. [Google Scholar] [CrossRef]
  10. Dávila, G.; Cama, J.; Luquot, L.; Soler, J.; Ayora, C. Experimental and modeling study of the interaction between a crushed marl caprock and CO2-rich solutions under different pressure and temperature conditions. Appl. Geochem. 2017, 448, 26–42. [Google Scholar] [CrossRef]
  11. Foroutan, M.; Ghazanfari, E.; Amirlatifi, A.; Perdrial, N. Variation of pore-network, mechanical and hydrological characteristics of sandstone specimens through CO2-enriched brine injection. Geomech. Energy Environ. 2021, 26, 100217. [Google Scholar] [CrossRef]
  12. Liu, N. Mineral Trapping Capacity Estimation of CO2 in Sandstones: Constraints from the Dawsonite-Bearing Sandstones in Honggang, Southern Part of Songliao Basin. Ph.D. Thesis, Jilin University, Changchun, China, 2011. [Google Scholar]
  13. Yu, Z.; Liu, L.; Liu, K.; Yang, S.; Yang, Y. Petrological characterization and reactive transport simulation of a high-water-cut oil reservoir in the Southern Songliao Basin, Eastern China for CO2 sequestration. Int. J. Greenh. Gas Control 2015, 37, 191–212. [Google Scholar] [CrossRef]
  14. Park, J. Porosity changes due to analcime in a basaltic tuff from the Janggi Basin, Korea: Experimental and geochemical modeling study of CO2–water–rock interactions. Environ. Earth Sci. 2021, 80, 81. [Google Scholar] [CrossRef]
  15. Yu, Z. An Experiment Study on Water-Rock Interaction during Water Flooding in Formations Saturated with CO2-Example from Southern Songliao Basin. Ph.D. Thesis, Jilin University, Changchun, China, 2013. [Google Scholar]
  16. Bai, B.; Zhu, R.; Wu, S.; Yang, W.; Gelb, J.; Gu, A.; Zhang, X.; Su, L. Multi-scale method of Nano(Micro)-CT study on microscopic pore structure of tight sandstone of Yanchang Formation, Ordos Basin. Pet. Explor. Dev. 2013, 40, 329–333. [Google Scholar] [CrossRef]
  17. Du, X.; Xie, X.; Lu, Y.; Ren, J.; Zhang, S.; Lang, P.; Cheng, T.; Su, M.; Zhang, C. Distribution of continental red paleosols and their forming mechanisms in the Late Cretaceous Yaojia Formation of the Songliao Basin, NE China. Cretac. Res. 2011, 32, 244–257. [Google Scholar] [CrossRef]
  18. Fischer, S.; Liebscher, A.; Wandrey, M. CO2–brine–rock interaction—First results of long-term exposure experiments at in situ P–T conditions of the Ketzin CO2 reservoir. Geochemistry 2010, 70, 155–164. [Google Scholar] [CrossRef] [Green Version]
  19. Hamza, A.; Hussein, I.; Marri, M.; Mahmoud, M.; Shawabkeh, R. Impact of clays on CO2 adsorption and enhanced gas recovery in sandstone reservoirs. Int. J. Greenh. Gas Control 2021, 106, 103286. [Google Scholar] [CrossRef]
  20. Wang, F.; Ping, S.; Yuan, Y.; Sun, Z.; Tian, H.; Yang, Z. Effects of the mechanical response of low-permeability sandstone reservoirs on CO2 geological storage based on laboratory experiments and numerical simulations. Sci. Total Environ. 2021, 796, 149066. [Google Scholar] [CrossRef]
  21. Ketzer, J.; Iglesias, R.; Einloft, S.; Dullius, J.; Ligabue, R.; Lima, V. Water–rock–CO2 interactions in saline aquifers aimed for carbon dioxide storage: Experimental and numerical modeling studies of the Rio Bonito Formation (Permian), southern Brazil. Appl. Geochem. 2009, 24, 760–767. [Google Scholar] [CrossRef]
  22. Liu, F.; Lu, P.; Zhu, C.; Xiao, Y. Coupled reactive flow and transport modeling of CO2 sequestration in the Mt. Simon sandstone formation, Midwest U.S.A. Int. J. Greenh. Gas Control 2011, 5, 294–307. [Google Scholar] [CrossRef]
  23. Wilke, F.; Vásquez, M.; Wiersberg, T.; Naumann, R.; Erzinger, J. On the interaction of pure and impure supercritical CO2 with rock forming minerals in saline aquifers: An experimental geochemical approach. Appl. Geochem. 2012, 27, 1615–1622. [Google Scholar] [CrossRef]
  24. Dávila, G.; Luquot, L.; Soler, J.; Cama, J. Interaction between a fractured marl caprock and CO2-rich sulfate solution under supercritical CO2 conditions. Int. J. Greenh. Gas Control 2016, 48, 105–119. [Google Scholar] [CrossRef] [Green Version]
  25. Legros, H.; Sanchez, P.; Elongo, V.; Laurent, O.; Falck, H.; Adlakha, E.; Michou, C. Fluid evolution of the Cantung tungsten skarn, Northwest Territories, Canada: Differentiation and fluid-rock interaction. Ore Geol. Rev. 2020, 127, 103866. [Google Scholar] [CrossRef]
  26. Perrin, J.; Krause, M.; Kuo, C.; Miljkovic, L.; Charoba, E.; Benson, S. Core-scale experimental study of relative permeability properties of CO2 and brine in reservoir rocks. Energy Procedia 2009, 1, 3515–3552. [Google Scholar] [CrossRef] [Green Version]
  27. Ajayi, T.; Gomes, G.; Bera, A. A review of CO2 storage in geological formations emphasizing modeling, monitoring and capacity estimation approaches. Pet. Sci. 2019, 16, 1028–1063. [Google Scholar] [CrossRef]
Figure 1. Location of the studied area in the Songliao Basin [8]. (A) Location of the southern part of the Songliao Basin (blue-filled area); (B) tectonic sub-division of the southern part of the Songliao Basin and the study area.
Energies 15 09268 g001
Figure 2. Experimental system setup.
Energies 15 09268 g002
Figure 3. Mineralogy variation during different stages of CO2-water-sandstone interaction experiment. (A) Sample A-130; (B) Sample Q-147; (C) Sample Q-148.
Energies 15 09268 g003
Figure 4. The changes of typical ions during the experiments (A—K+; B—Na+; C—Ca2+; D—Mg2+; E—Si4+; F—SO42−).
Energies 15 09268 g004
Figure 5. SEM images of typical mineral changes during the experiment. (An—ankerite, Ab—albite, KF—K-feldspar DP—Dissolution pores) (A) initial sample; (B) sample after 432 h of the experiment; (C) the dissolution position after 192 h of experiment; (D) QEMSCAN mineral analysis; (E) ankerite dissolution after 192 h; (F) ankerite dissolution at 432 h.
Energies 15 09268 g005
Figure 6. SEM images of ankerite dissolution during the experiment. (An—ankerite, Ab—albite, KF—K-feldspar, DP—Dissolution pores). (A) The initial sample; (B) The sample after 24 h, with no observable dissolution; (C) Holes formed due to dissolution after 72 h; (D) After 192 h, the dissolution pores became larger. (E) After 432 h, a large area of ankerite was dissolved; (F) QEMSCAN mineral analysis.
Energies 15 09268 g006
Figure 7. SEM images of calcite precipitation (Qz—quartz, Ca—calcite). (A) The initial sample; (B) Newly formed calcite on the sample’s surface after 24 h; (C) The newly formed calcite was dissolved after 72 h; (D) The sample at the end of the 432 h; (E) Calcite was found in other locations at the end of the 432 h; (F) The EDS analysis verified the calcite in (B).
Energies 15 09268 g007
Figure 8. SEM images of the illite-smectite mixed layer during the experiment (Qz—Quartz, I/S—illite-smectite mixed layer) (A) initial sample; (B) After 24 h; (C) After 72 h; (D) After 432 h; (E) large-scale clay mineral map after 432 h; (F) QEMSCAN mineral analysis.
Energies 15 09268 g008
Figure 9. Three-dimensional model of pore system for samples A-130 and Q-148: (A) pore space of sample A-130 before experiment; (B) pore space of sample A-130 after the experiment; (C) pore space of sample Q-148 before experiment; (D) represents the pore space of the Q-148 after the experiment. The red parts represent pores with an equivalent diameter of 0–20 μm, the blue parts represent pores with an equivalent diameter of 20–50 μm, the green parts represent pores with an equivalent diameter of 50–100 μm, and the yellow parts represent pores with an equivalent diameter of 100 μm~200 μm. (A1) Pore connectivity of sample A-130 before the experiment, (B1) Pore connectivity of sample A-130 after the experiment; (C1) Pore connectivity of sample Q-148 before experiment; (D1) Pore connectivity of sample Q-148 after the experiment. The red, yellow, green, and blue represent the strong to weak connectivity between pores.
Energies 15 09268 g009
Figure 10. The relationship between the equivalent diameter and the percentage change of pore volume (A) sample A-130; (B) sample Q-148.
Energies 15 09268 g010
Figure 11. The porosity and permeability changes of samples at different experiment times. (A) porosity; (B) permeability.
Energies 15 09268 g011
Table 1. Physical properties and mineralogy and ion data of three samples at different stages.
Sample IDStagesPorosityPermeabilityMineral Content (%)Ion Composition (mg/L)
%mDQuartzK-FeldsparAlbiteAnkeriteClayCa2+Mg2+Si4+
A-130Initial7.9110.32450.81.627.67.510.34.513.60.3
24 h8.9020.45552.93.227.46.19.2292.081.819.5
72 h9.3210.53156.51.919.74.57.4449.3272.554.0
192 h9.1270.50464.52.316.77.48.3521.5170.340.7
432 h9.5970.55158.02.619.86.711.3943.5163.551.0
Q-147Initial14.74118.00278.69.96.0/5.5
24 h15.17521.16182.85.35.2/6.7
72 h15.45421.55684.64.73.31.16.3
192 h15.59521.46478.413.04.8/3.8
432 h15.34123.82981.05.65.6/7.8
Ion composition(mg/L)
K+Na+So42−
Q-148Initial9.7010.3755.61.928.96.37.3146.76437.02570.0
24 h9.9830.32554.72.724.06.911.7136.75115.42760.0
72 h10.460.35851.52.325.1/12.3325.89507.85440.0
192 h10.3150.35153.71.824.6/12.1143.73829.92785.7
432 h10.3460.38151.13.624.9/12.9199.47225.43140.0
Publisher’s Note: MDPI stays neutral with regard to jurisdictional claims in published maps and institutional affiliations.

