Article

An Analytical Feasibility Study for Solar Panel Installation in Qatar Based on Generated to Consumed Electrical Energy Indicator

Department of Electronic and Electrical Engineering, College of Engineering, Design and Physical Sciences, Brunel University London, Uxbridge UB8 3PH, UK
*
Author to whom correspondence should be addressed.
Energies 2022, 15(24), 9270; https://doi.org/10.3390/en15249270
Submission received: 25 September 2022 / Revised: 4 November 2022 / Accepted: 2 December 2022 / Published: 7 December 2022
(This article belongs to the Section A: Sustainable Energy)

Abstract

:
The main objective of this study is to establish analytical feasibility for the deployment of solar panels in Qatar houses and other organisations; to calculate, by the use of analytical means, solar panel deployment scenarios with different panel sizes, efficiency, and sun per day, in order to estimate generated energy and compare that with actual consumption over a period of twelve months. In addition, the study aims to provide a comparative indicator on the ratio of generated energy to consumed energy and consumed electrical energy (GtoC), to establish the possibility of using the GtoC ratio as a new renewable energy rating index, for use in renewable energy investment and sales forecasting, in maintaining comparisons between different installation scenarios, and in upgrade planning and decision making. This study’s analytical solutions might be correlated with data from in situ solar panel installation scenarios in order to fully establish the performance under operational scenarios. The study will be beneficial to support roadmaps to foster solar panel deployment in Qatar, through demonstrating scenarios that can enable economic and environmental incentives. In addition, the study can be useful for other Gulf Cooperation Council (GCC) states with similar weather and economic conditions. Moreover, GtoC indicator can be used as a new source of data to establish a data-driven model for suitable clean energy projects.

1. Introduction

The peninsula of Qatar in Eastern Arabia is bordered by the Persian Gulf and Saudi Arabia. The region lies between the latitudes 24° N and 27° N and the longitudes 50° E and 52° E. Low, barren plains are covered with dunes and salt flats throughout the country [1]. Qatar has an arid climate, high summer temperatures (>40 °C), low summer humidity, low rainfall (annual average 71 mm) with a high evaporation rate (average yearly 2200 mm), and low soil fertility. During the brief winter, the weather I conversely has low temperatures and high humidity. A high temperature of 32.6 °C is moderate, and a low temperature of 21.4 °C [1]. Qatar’s challenging weather presents an amazing opportunity to place Qatar among the leading providers of clean energy.
As can be seen from Figure 1, Qatar is blessed with massive amounts of solar exposure throughout the year, ranging from a low of 10:37 h per day for December to the highest of 13:45 h in June. With the proper solar panel technology, Qatar can guarantee sustainable and clean energy from solar panels throughout the year [2]. Therefore, this study attempts to demonstrate the possibility of deploying solar panels on home and business roofs to support other efforts from solar panel frames, and to investigate possible ways to monitor and manage generated energy, which can be used to offset Qatar’s massive use of electricity for mechanical cooling by harnessing the very source of its hot and arid climate (i.e., using solar energy to cool the spaces people inhabit).

2. Solar Energy Projects in Qatar

Qatar has abundant solar resources, with an annual average of 2113 kWh/m2 (computed over four years of coincident data) [3]. While high ambient temperatures and dusty conditions affect PV panel performance and dependability [4], recent research suggests Qatar has a potential solar equivalent of 1.5 million barrels of crude oil per year [5]. By 2020, Qatar aims to create more than 1 GW of renewable energy. It has many ongoing projects, mainly focusing on solar power. For example, the Qatari government has also built a 1 GW solar PV plant in Doha and the Ras Lafin stadiums, which will feature solar technology cooling for the 2022 FIFA World Cup. This represents a longstanding interest in solar technologies, including passive cooling potential; small-scale research on solar ponds for residential cooling was carried out at Qatar University in 1992 [6]. The Arabian Gulf’s high average insolation (solar irradiation) rate of approximately 1800 kW/m2 makes solar energy the most promising renewable option for the entire Gulf region, including Qatar.
Qatar has started an enormous initiative to develop and install solar energy as a serious component of its energy mix, including several large-scale solar power projects in the works. For example, Qatar General Electricity and Water Corporation (Kahramaa) expects to complete a 200 MW solar power plant by 2020. Qatar’s total power-producing capacity was 8750 MW in 2013, which is 2700 MW more than the total demand [7]. Furthermore, Qatar’s food security programme has called for long-term water desalination utilising solar energy [7]. There have also been a handful of smaller solar panel installations on commercial building rooftops and parking lot blinds [7].
The IEA anticipates that photovoltaics (PV) will provide 11% of world energy consumption by 2050, resulting in a 2.3 Gt decrease in carbon dioxide emissions per year. Existing structures account for more than 40% of worldwide primary energy use. These earnings are also vulnerable to global economic fluctuations, international commerce, political, social, and environmental issues, and fiercely growing rivalry. Large-scale PV facilities for PV energy conversion are built in arid places with lots of sunlight [5] every year, 70% of which is bright, resulting in 6 kWh/m2 per day [8]. Peak energy consumption in the GCC occurs during the day in August and September, when air conditioning use is at its peak and GSR levels are at their maximum for the year [4].
Due to the high average insolation (solar irradiation) rate of around 1800 kWh/m2 in the GCC, solar energy is arguably the most promising renewable alternative for the whole area, including Qatar [1]. With estimated annual 2200 kWh/m2 of direct normal irradiance and 2140 kWh/m2 global horizontal irradiance, Qatar’s insolation rates suitable for estimating PV and CSP potential are higher than the GCC average.
The Siraj Solar Energy project was scheduled to produce roughly 700 MW of power in the fourth quarter of 2021, as one of Qatar’s major solar projects. According to Qatar’s energy minister, in January 2020, the government inked a deal with Total, the French energy powerhouse, and Marubeni, a Japanese company, to develop a solar power plant capable of producing 800 MW, or a tenth of the country’s peak energy consumption [9]. Al Kharsaah solar power plant, Qatar’s first large-scale solar power plant, will use cutting-edge solar energy technology such as twin panels to conserve space, automated sun-tracking systems, and robotic solar panel cleaning to boost production efficiency and lower operating costs. It is anticipated to be completed in 2022 [9].
Al-Kharsaah Solar PV Independent Power Producer (IPP) project, located 80 kilometres from Doha, Qatar’s capital, is the country’s first large-scale solar power plant (800 MWp), reducing Qatar’s environmental imprint substantially. The Qatari grid began to be equipped with sustainable, affordable, and clean power from 2021 with an initial capacity of 350 MWp, and it was anticipated to reach total capacity during 2022. The project will generate around 10% of Qatar’s electricity peak demand and reduce the country’s CO2 emissions by 26 million tons [10]. Over 1000 hectares in size, the solar plant will be built and equipped with 2 million bifacial solar modules with trackers, providing substantial power gains and taking advantage of the region’s exceptional solar exposure [10]. The solar facility features 2 million bifacial solar modules with trackers, allowing for considerable power increase and taking advantage of the region’s excellent sunshine exposure [10].
The Al-Kharsaah Solar PV IPP Project, with an output of 800 MWp, will span 10 square kilometres (approximately 1400 soccer fields) and include 2 million tracker-mounted modules [11], and is projected to be fully operational in the second half of 2022 [12]. This will allow significant power improvements by utilising the region’s abundant sunlight; using 3240 installed string inverters will increase yearly production even more by facilitating better tracking of the highest power point at the string level. A semi-automated solar module cleaning system will be installed at the factory every four days to remove dust and sand from each module. Al-Kharsaah will be constructed in two stages, each with a capacity of 400 MWp. In its first year of operation (P50 Year 1), it is expected to generate almost 2,000,000 MWh, enough energy to power roughly 55,000 Qatari homes [11]. The project will provide 10% of the country’s peak electricity demand at total capacity and cut CO2 emissions by 26 million metric tonnes throughout its lifetime, making it a turning point in the country’s energy history [11].
Despite the fact that Qatar is one of the richest countries in the world [13], which can easily afford investment in high-quality solar panel systems, and despite major public efforts towards sustainable development [14] to achieve the clean energy targets of QNV 2030 [15], there are still unaddressed technical limitations [16] and a lack of projects to foster the deployment of solar panels within private homes and businesses to enable the transition to clean energy, which could place Qatar among the leading clean energy producing countries. Therefore, this study aims to fill the gap in this research and provide some milestones to policy makers and other stakeholders to enable advanced solutions using efficient solar panels and the ratio of generated to consumed energy and consumed electrical energy (GtoC). This will bring benefits to home and business owners, in addition to establishing a vision for Qatar to become one of the leading exporters for clean energy and help the world with the evolving energy crisis. Moreover, the research may help other GCC states in their missions.
The research design for this study is based on the analytical research method, which enables understanding the relationship between the two or more variables. For this study, the solar panel efficiency and solar panel size for each specific month with given sun per day are the main variables [17]. This study was accomplished through four stages, as outlined in Figure 2.
The first task is to obtain the actual consumption data for a selected home for a period of twelve months (commensurate with the solar exposure shown in Figure 1), as reported in Table 1 and shown in Figure 3, to provide an indication of current (baseline) monthly and annual energy consumption. The estimated energy generated from solar panels is then calculated for different scenarios to reflect the impact of solar panel efficiency and the size of the panels on the generated energy for each month; the resultant data is then compared with the actual consumption for each month. The third stage is to compare the amount of generated energy with the consumed energy to provide a comparative factor that can be used as an indicator to reflect the performance of that specific house. The final stage is to present generated to consumed ratio possible uses.
Figure 3 shows the actual daily home consumption over the period of twelve months. It can be seen that consumption is much less for the period December to March, which reflects the relatively cold winter period. July (shown in red) is also very low, reflecting that the majority of the native population go on vacation abroad (and many expatriate workers take their annual vacations) to escape the intensity of the hottest period of the year. It is expected that July would otherwise have similar consumption to August, this finding agrees with other study included 10 homes [18].

3. Analytical Solution

Mathematical equations used in this analysis were derived primarily from YES Energy Solutions [19].
Estimated Daily Solar Panels Energy Generation Formula
G = ( p s 1000 p n p e s P D ) 1000
where G is the total generated electrical energy from solar panels (kWh), p s is the solar panel area (m2), p n is the number of solar panels, p e is solar efficiency, and s P D is sun hours per day.
Generated to Consumed Electrical Energy Ratio (GtoC) Formula
G t o C = ( G C ) × 100 %    
where G   is the total generated electrical energy from solar panels in KWh, and C   is the consumed electrical energy by the house in KWh.
Average G t o C for Number of Homes in City or District Formula
( G t o C   ) A   = ( i = 1 n ( G t o C   ) 1   + ( G t o C   ) 2 + + ( G t o C   ) n ) n  
where n is the total number of houses in the city or district.
National G t o C Formula
( G t o C   ) N   = ( i = 1 n ( G t o C   ) A 1   + ( G t o C   ) A 2 + + ( G t o C   ) A n ) n
where n is the total number of cities or districts in country.

4. Calculations of Scenarios

Solar panels do not provide 100% efficiency; they typically provide three levels of efficiency (20%, 40%, or 50%), depending on their technological capacity and ambient conditions. Therefore, these three levels of efficiency have been used against three numbers of panels (2, 4, and 6) with a standard panel area of 1.6 m2, to enable meaningful comparison between efficiency and number of panels in each house during each month of the year, based on the sun per day for each month, as shown in Table 2. The parameters Low, Medium, and High Panel Efficiency (LPE/MPE/HPE) and Low, Medium, and High Panel Number (LPN/MPN/HPN) were used for comparative purposes.

4.1. LPE vs. LPN (20% vs. 2 Panels)

Figure 4 shows that the energy generated is very low and it does not substitute the consumed energy in the majority of the months of the year. This cannot be considered a practical scenario.

4.2. LPE vs. MPN (20% vs. 4 Panels)

Figure 5 shows that the energy generated is still not enough to substitute the consumed energy in the majority of the months of the year. This cannot be considered a practical scenario.

4.3. LPE vs. HPN (20% vs. 6 Panels)

Figure 6 shows that the energy generated is enough to substitute the consumed energy in the majority of months throughout the year. This can be considered as a practical scenario, but there is still a necessity to obtain energy from other sources to maintain latent capacity and cover times of peak demand.

4.4. MPE vs. LPN (40% vs. 2 Panels)

Figure 7 shows that it is not possible to substitute the energy consumed by the house for the energy generated by the solar panels in the majority of months around the year, which indicates that this is not a practical scenario.

4.5. MPE vs. MPN (40% vs. 4 Panels)

Figure 8 shows that the expected amount of generated energy from solar panels is consistently higher than the actual home electrical consumption, which means that the home can likely depend on the generated energy from solar panels in each month of the year. Therefore, this scenario can be considered as an ideal one, which reflects huge investment with a good return in terms of energy.

4.6. MPE vs. HPN (40% vs. 6 Panels)

Figure 9 shows that the expected amount of generated in energy from solar panels is much higher than the actual home conception, which means that the home can cover the monthly consumption from the energy generated by solar panels, and supply the main grid with the extra generated energy. Therefore, this scenario can be considered ideal for both homeowners and energy companies, with sufficient latent capacity to allow for the companies to buy energy (at reduced rates) from consumers (usually via subsidised prices during periods when households rely more on conventional electricity from power plants).

4.7. HPE vs. LPN (50% vs. 2 Panels)

Figure 10 shows that high efficiency cannot compensate for LPN, which means that the home still requires extra sources of energy for some months around the year, as the generated energy does not cover most of the months. Therefore, this scenario cannot be considered practical, especially due to the absolute outstripping of supply during the hottest period (from June to September, excluding the July dip in demand, which as explained previously is attributable to the national vacation exodus during the hottest time of year).

4.8. HPE vs. MPN (50% vs. 4 Panels)

Figure 11 shows that the home can depend on the generated energy from solar panels around the year without the need for external sources of energy, and there might be a possibility of having extra energy to supply back to the main grid. Therefore, this can be considered as a very good scenario for homeowners.

4.9. HPE vs. HPN (50% vs. 6 Panels)

Figure 12 shows that this scenario is very good, since the home can depend on the generated energy from solar panels around the year, with the possibility of having extra energy to supply it back to the main grid. Therefore, this can be considered a very good scenario for homeowners and energy companies.
Generated to Consumed Electrical Energy Ratio (GtoC) is expressed in Equation (5).
G t o C = ( G C ) × 100 %
where G is the total generated electrical energy from solar panels in KWh, and C is the consumed electrical energy by the house in KWh.

5. GtoC Use Cases

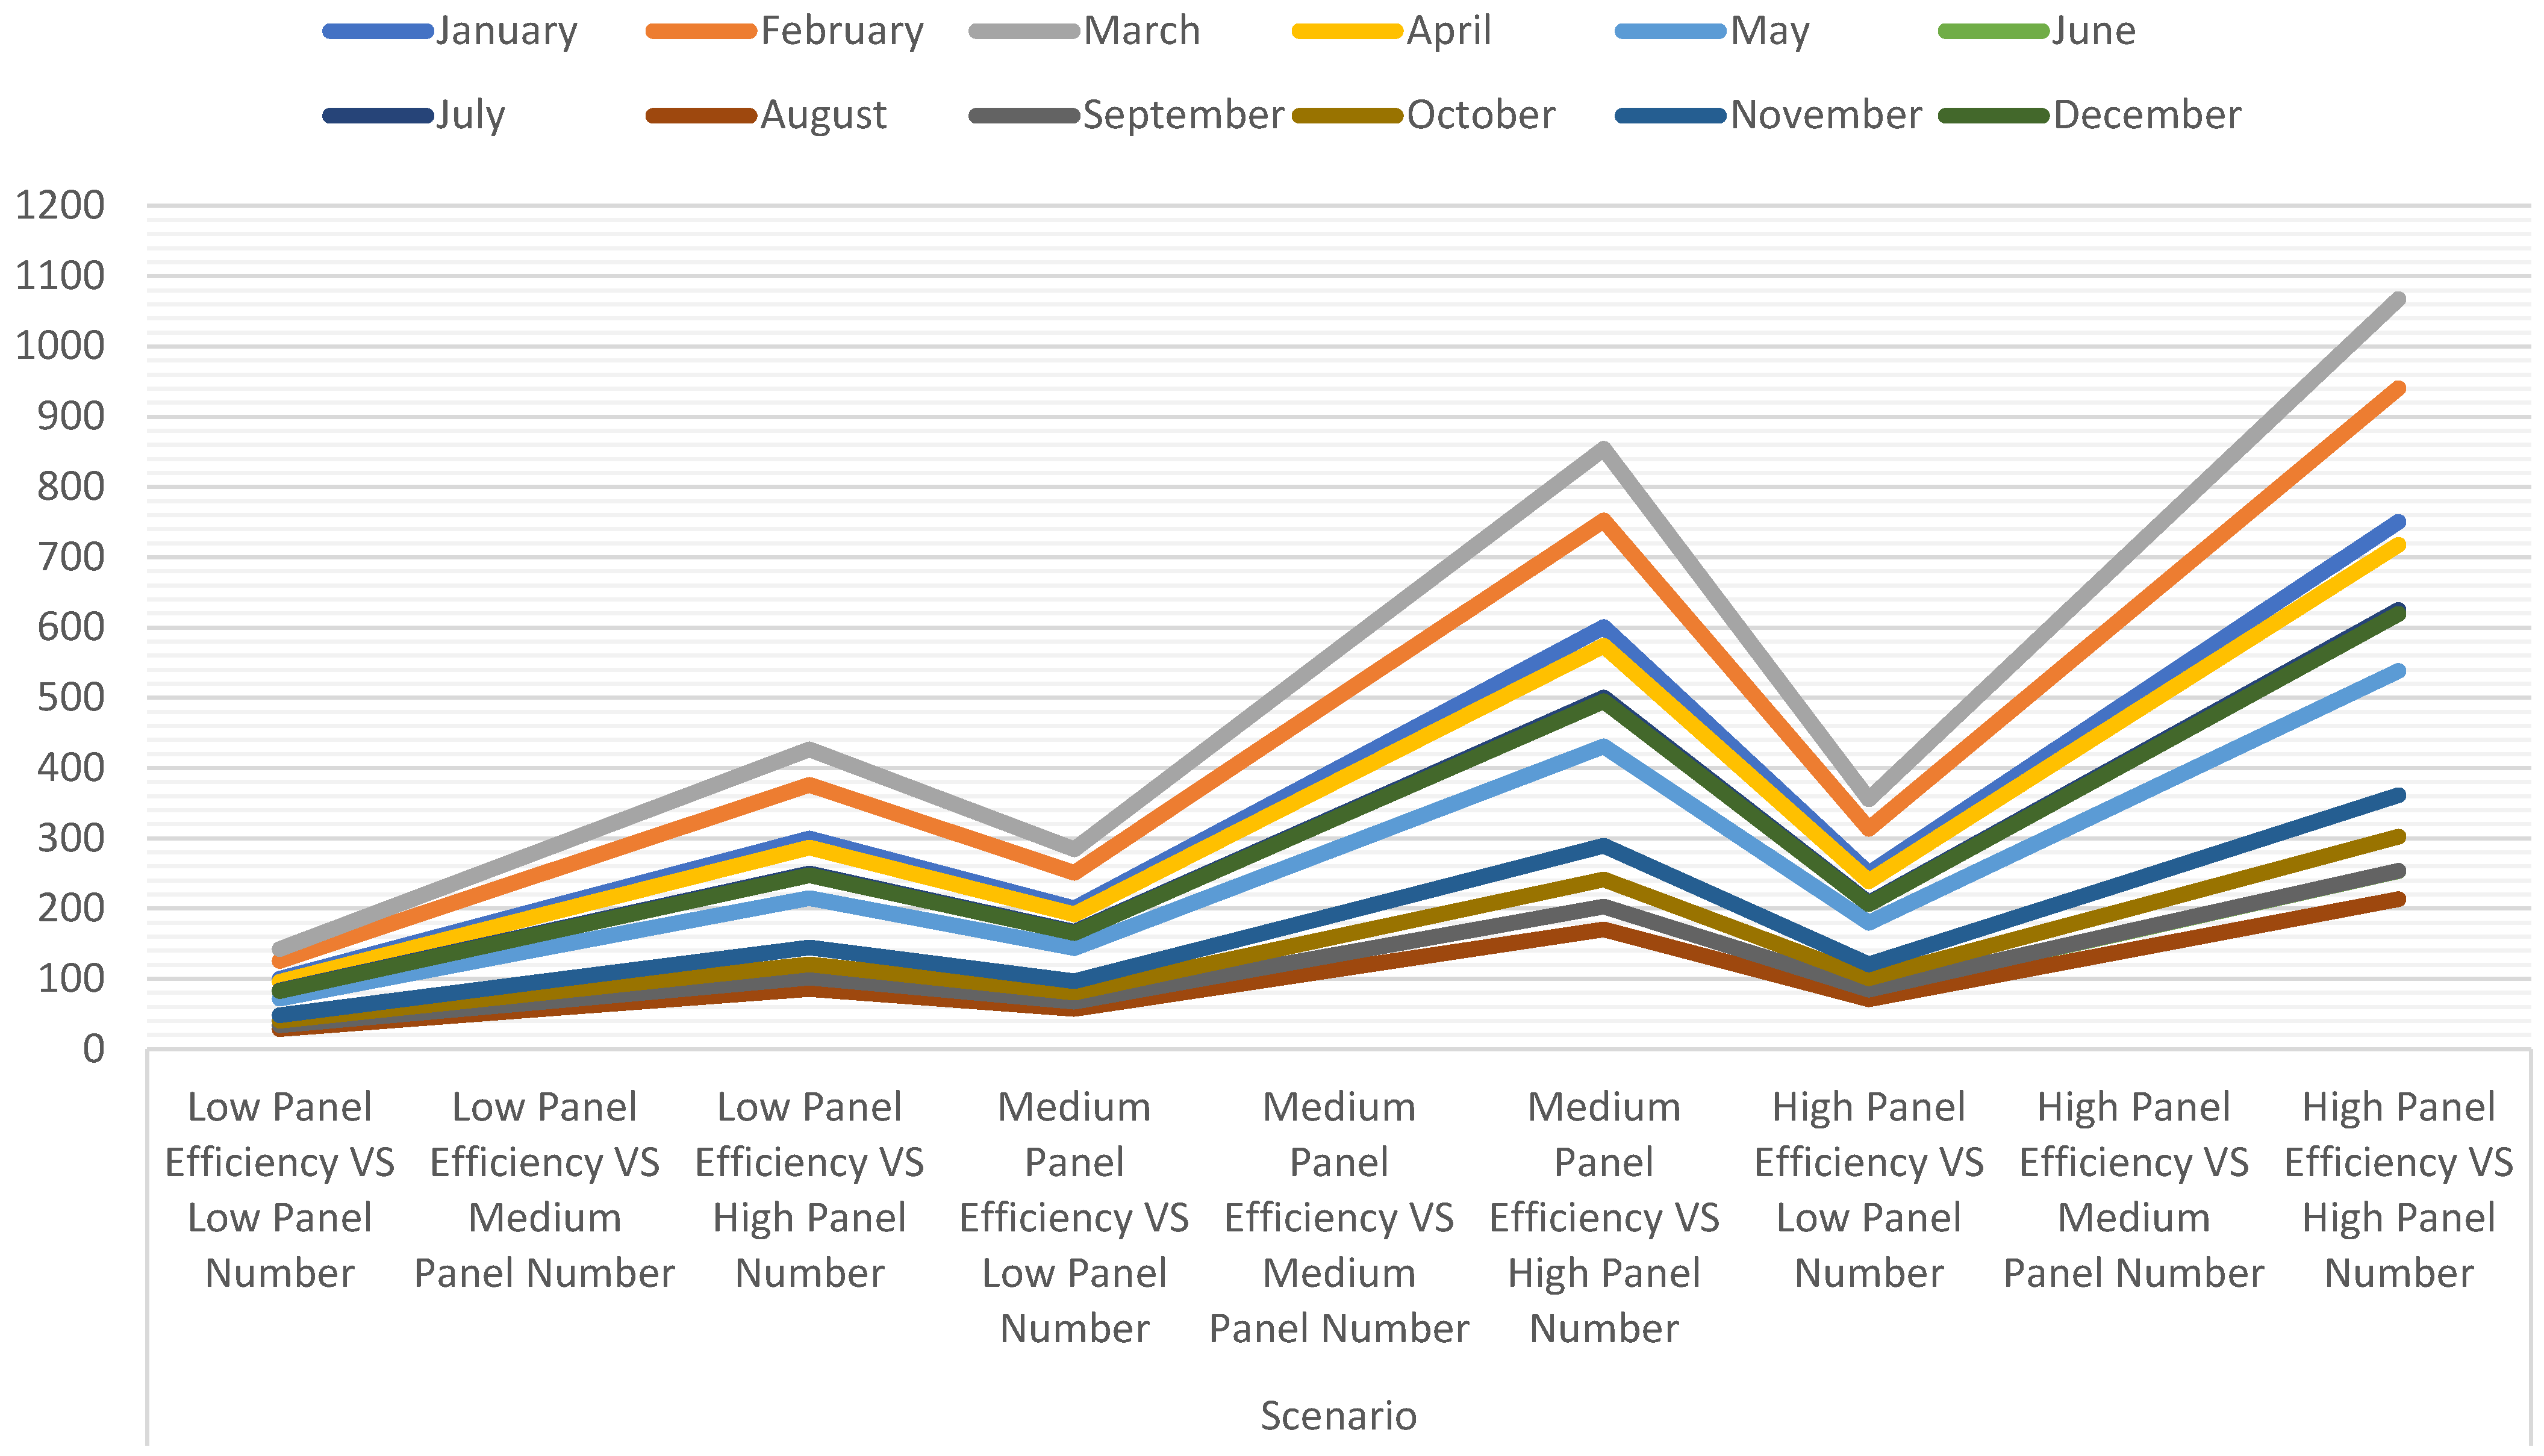
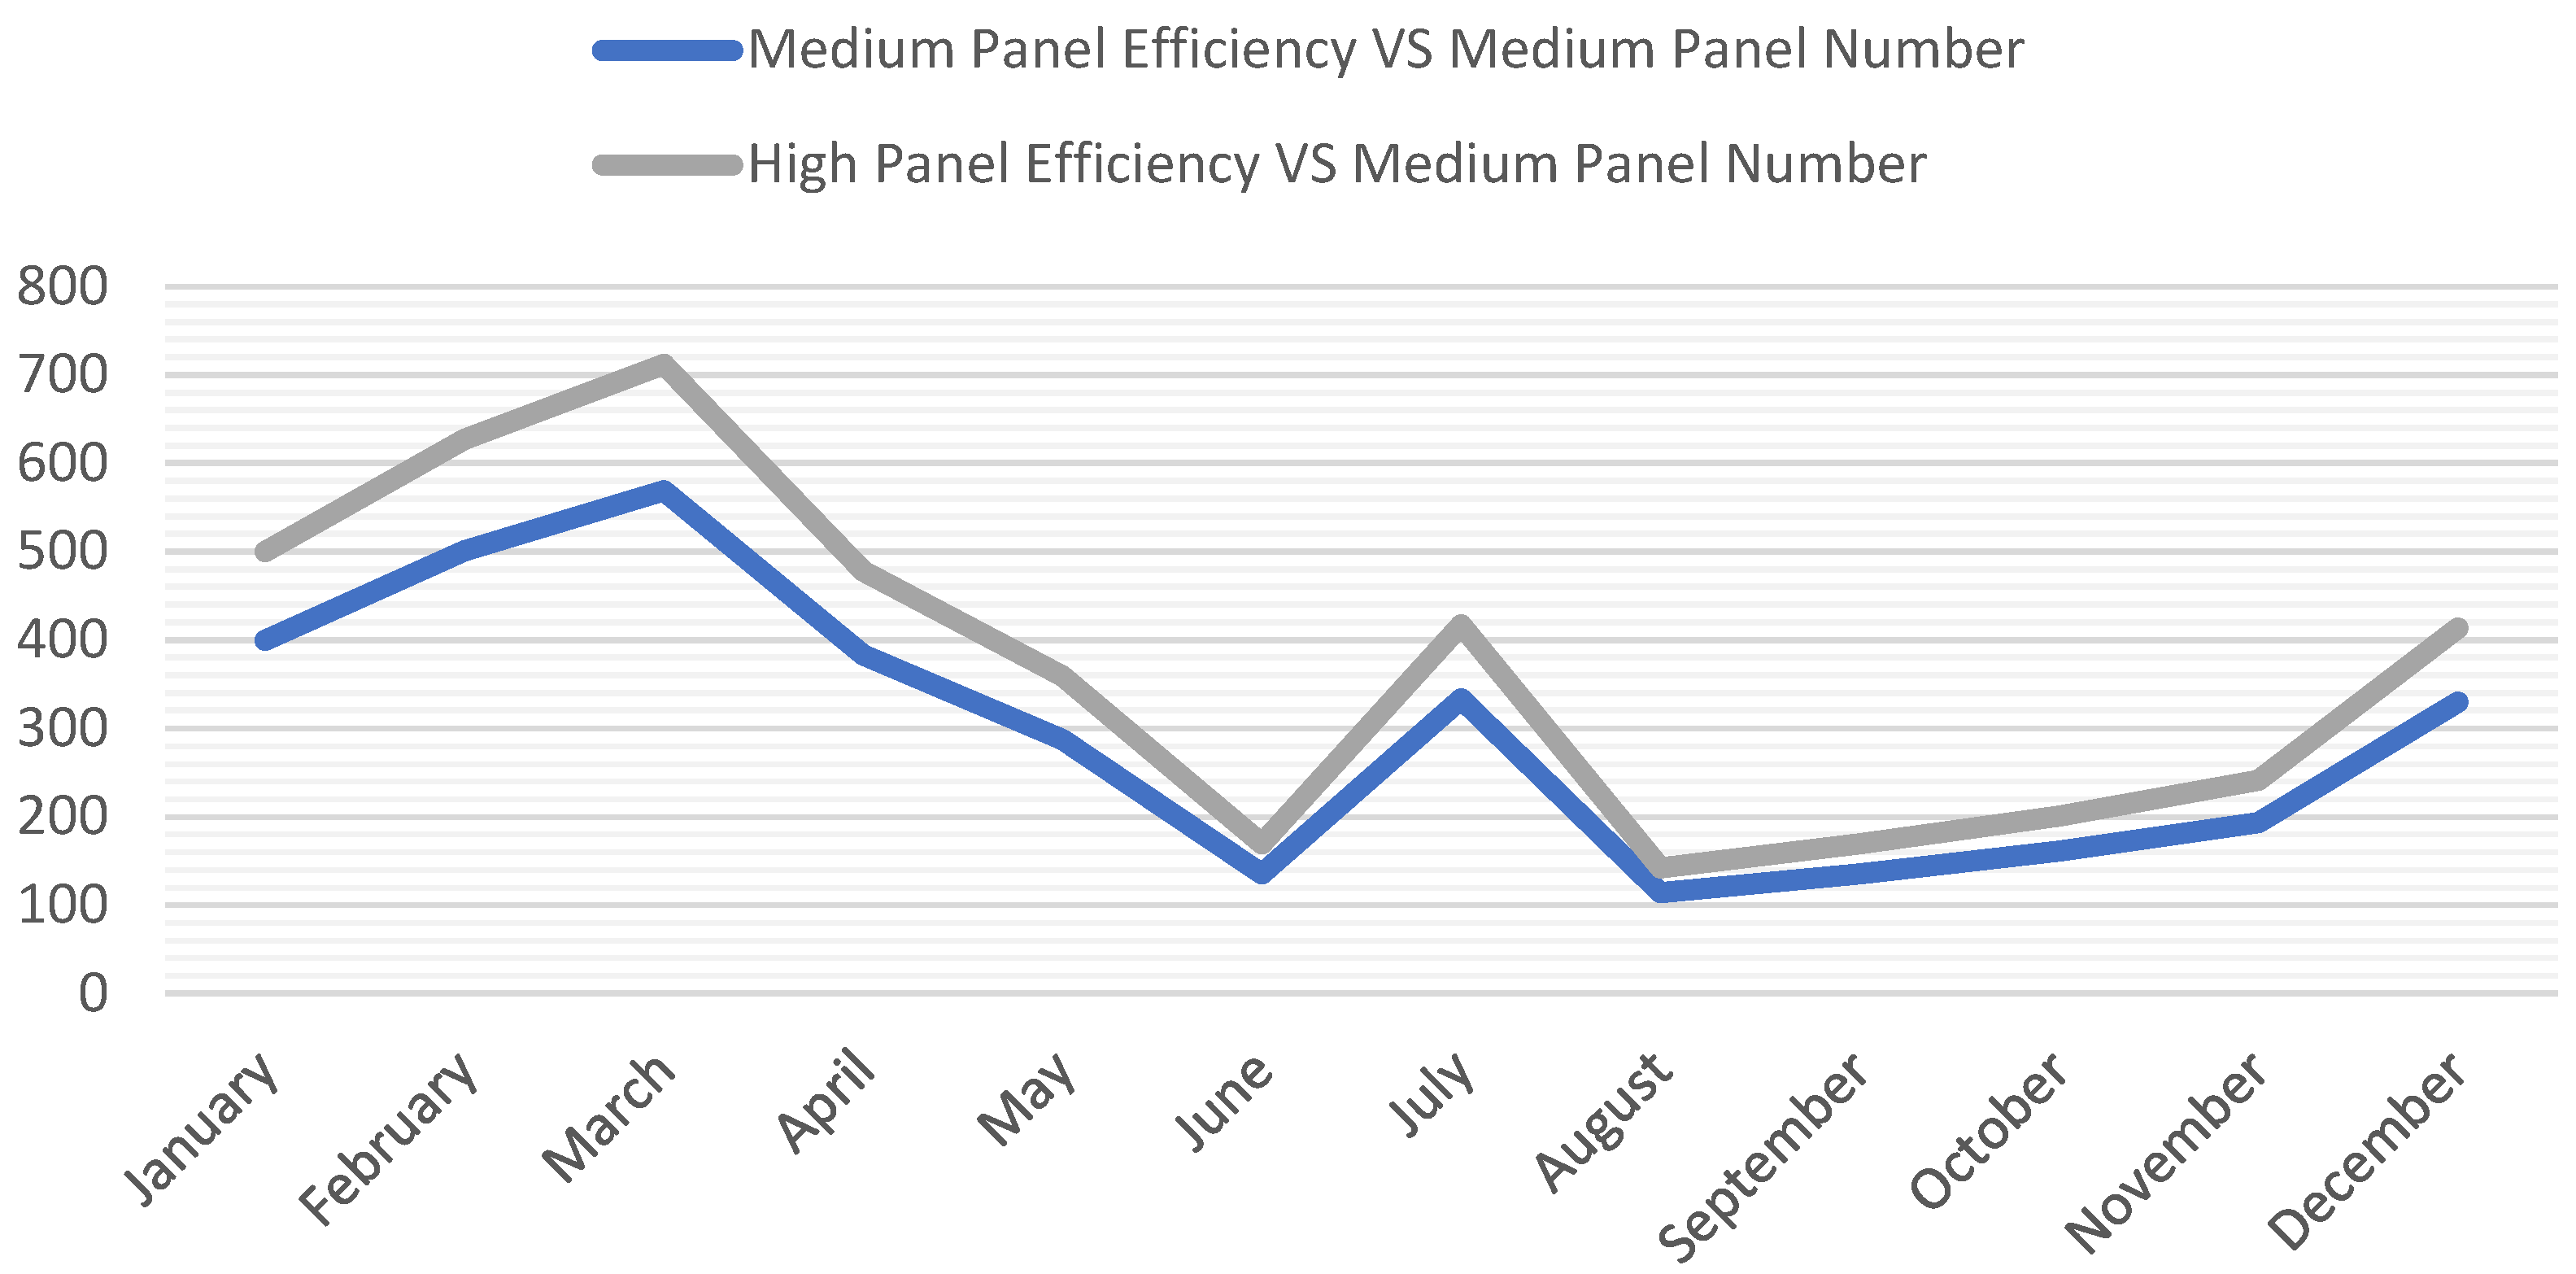
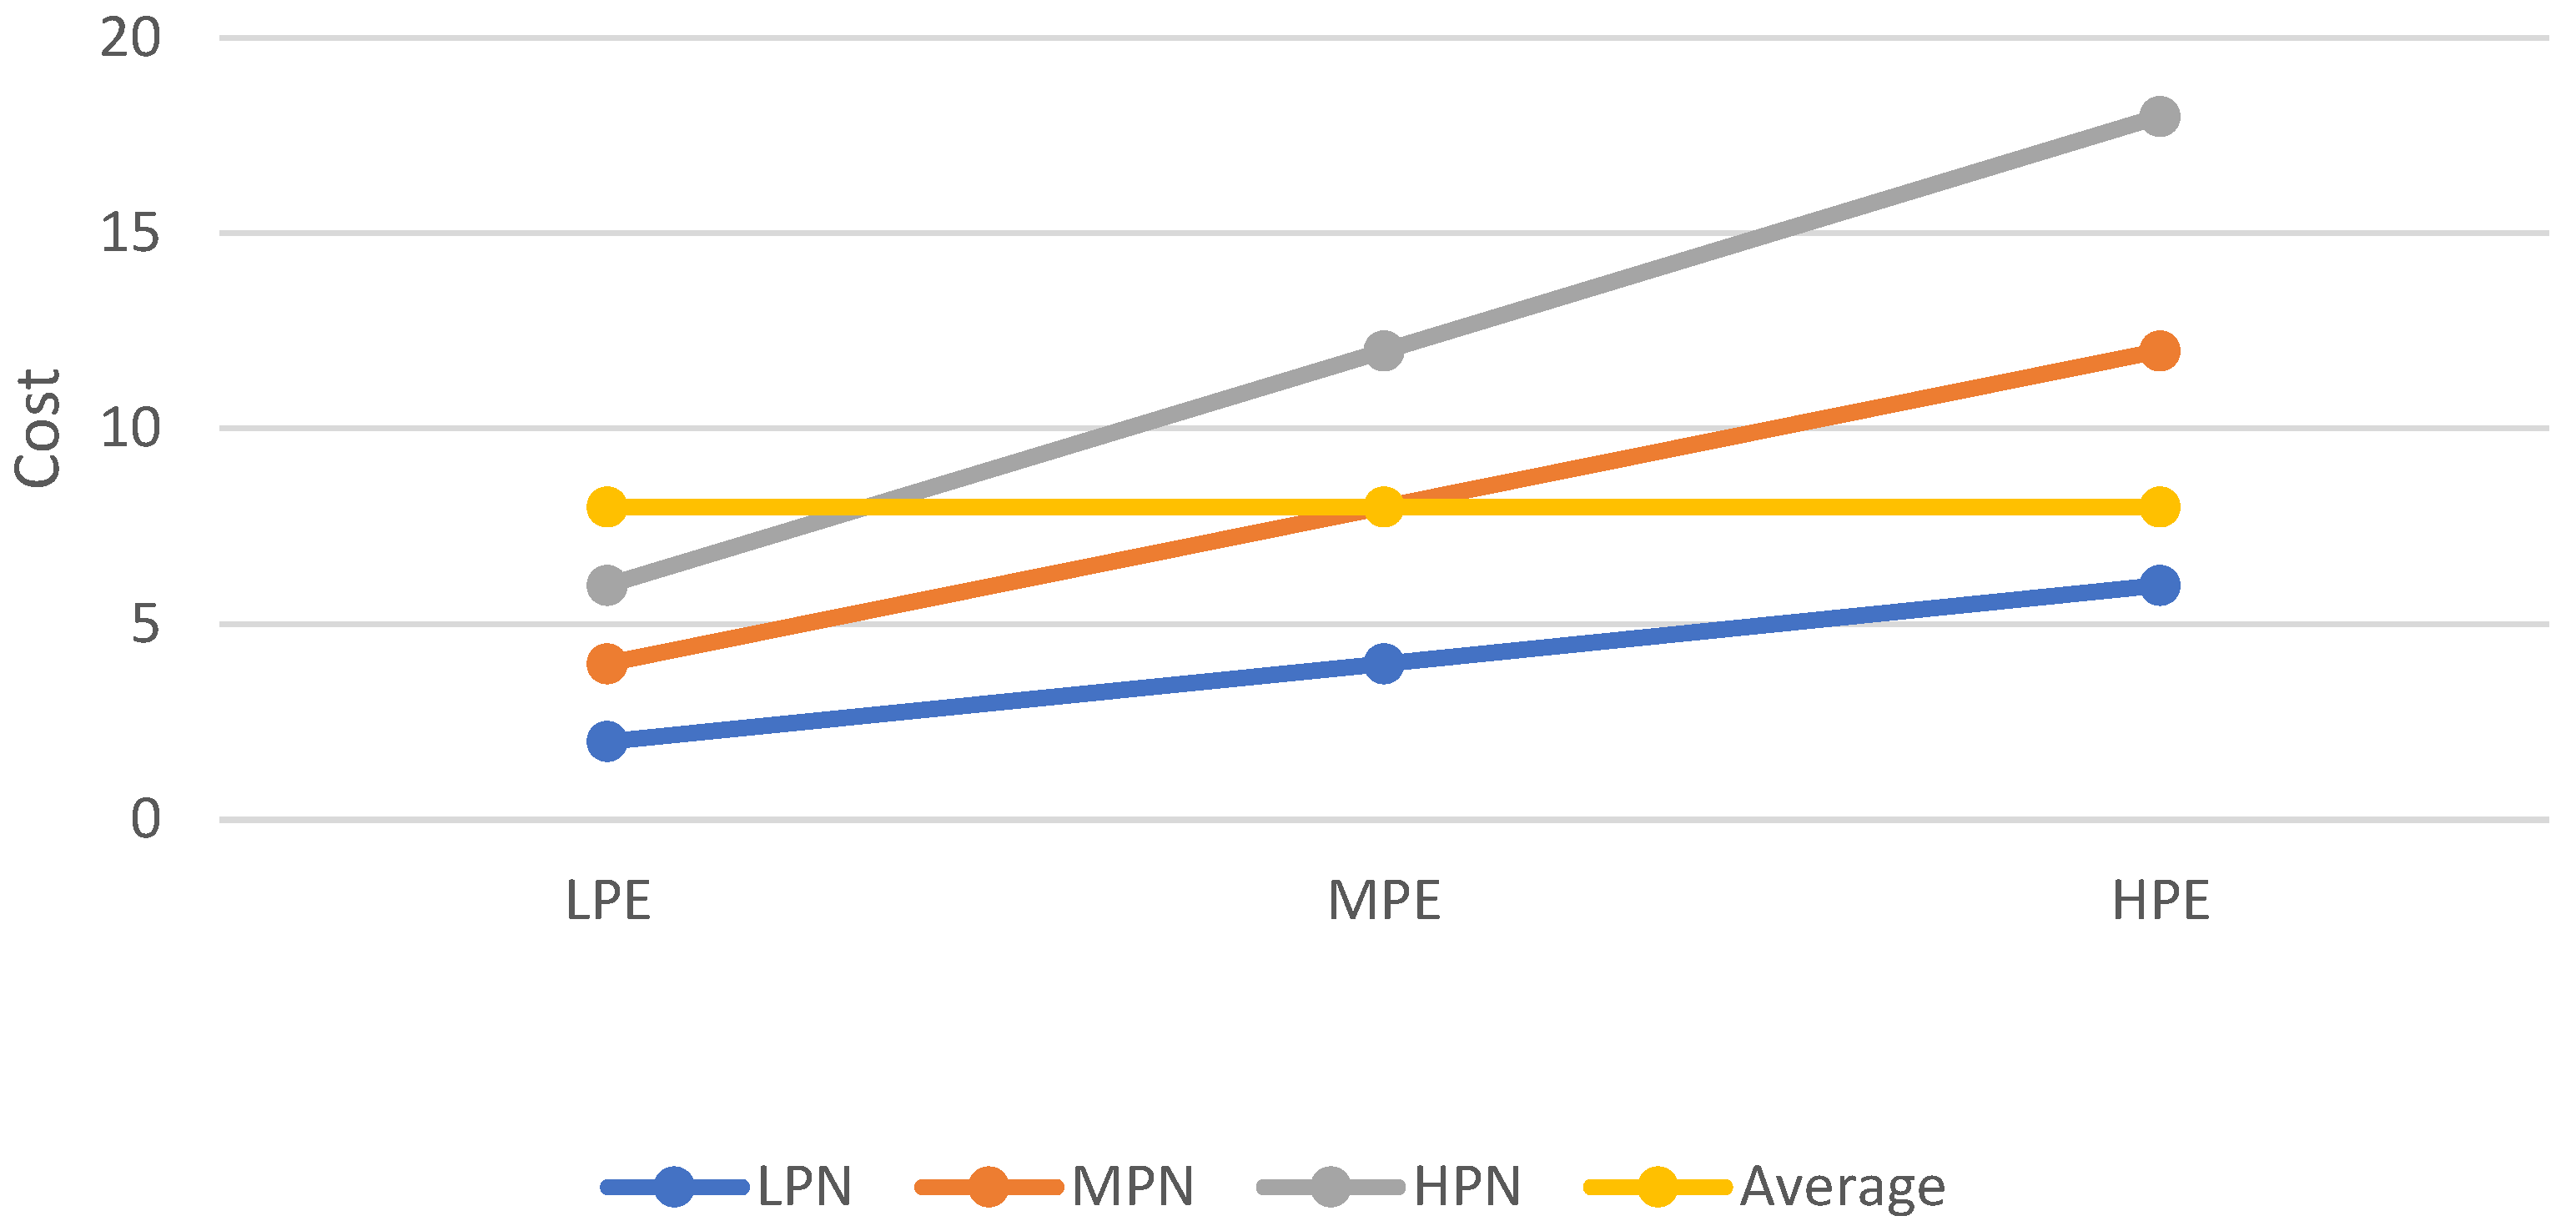
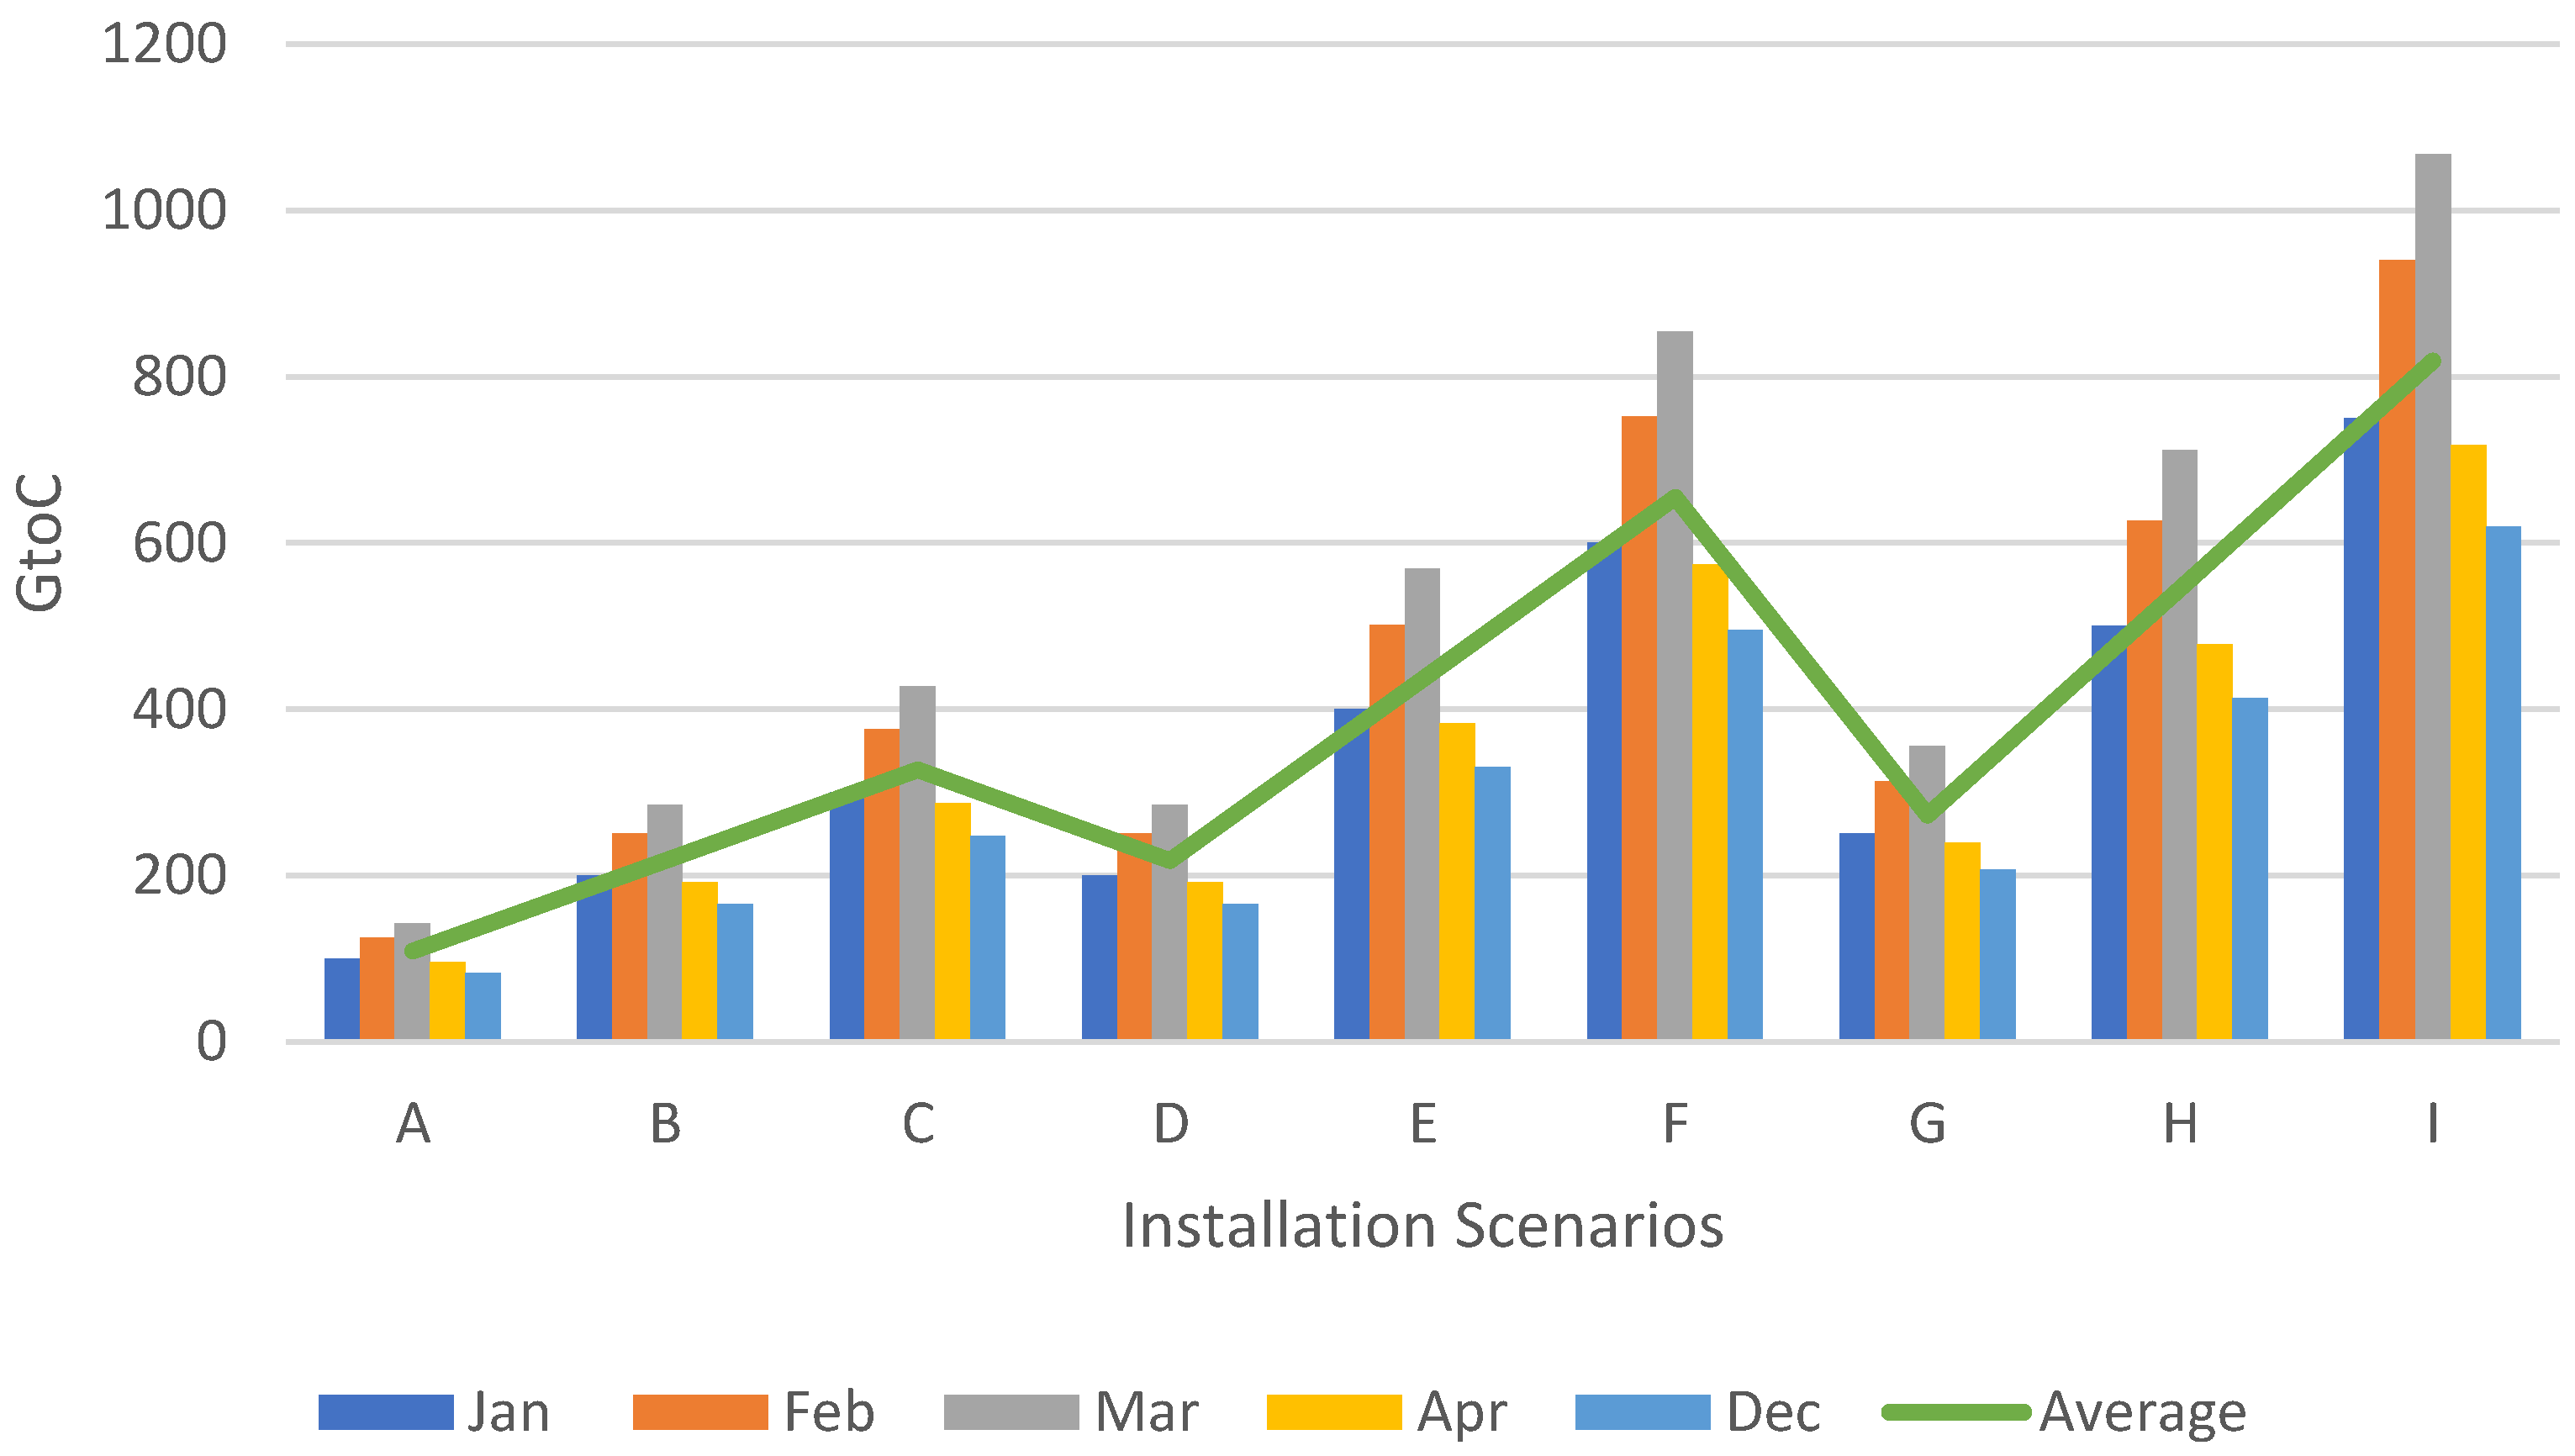
5.1. Comparing Different Installation Scenarios

When considering different installation scenarios for solar PV panels in buildings, the main considerations are the available roof space, roof type, panel size, panel performance, and the amount of solar radiation arriving at the site [20,21,22]. Therefore, mathematical equations can be used to provide an assessment of the estimated energy generated from a solar panel system at a particular property. On the other hand, comparing the generated energy with the consumed energy at a particular property gives a good indication of whether the property will be able to meet its own required energy demand at specific times, or whether it might require energy consumption from the main grid at certain times. Table 3 and Figure 13 illustrate the GtoC for each month around the year for the selected case study house. It clearly shows what settings are likely to provide better performance, highlighted in green, where the generated energy is much higher than consumed energy; amber, indicating that generated energy is equal or just higher that consumed energy; and red, indicating that generated energy is much less than consumed energy.

5.2. New RE Energy Rating Index

Energy Efficiency Index (EEI) is used as an indicator to monitor energy consumption performance [23], in the same manner as the energy-saving index. GtoC can be used as an index to provide an indication of the capacity of the property to generate energy from the solar panel system to satisfy the property’s consumption needs. As explained in Table 4, the Traffic Light Index of red, amber, and green signals can be a useful indicator for different stakeholders; for instance, potential homebuyers would be able to determine whether this property would be self-sufficient for expected energy consumption using the current solar system, which heavily affects property prices [24]. Moreover, GtoC can be also used to rank cities or countries in same manner as the World Energy Council’s Energy Trilemma Index [25], to evaluate general performance in attaining a sustainable combination between policies. The achieved grade reflects a state’s achievement, with “A” being the best grade. Such indices enable interactive monitoring of national energy policies’ sustainability.

5.3. GtoC as Investment Index

Renewable energy investment by property owners or by companies seeking to enter the market of renewable energy generation requires clear indicators to enable sound decision making, including data that are trustworthy and can be processed and communicated rapidly and concisely, particularly Energy Index, Weather Index, Energy Budget and Weather Adjusted Energy Index [26,27]. GtoC can be used to perform meaningful comparisons between two or more settings. For example, consider the case of the best two scenarios, shown in Figure 14, compared statistically using t-test [28]; the t-value is 1.05571 and p-value is 0.151278, hence, the result is not significant at p < 0.05. This clearly shows that there is no significant difference in the amount of the generated energy or the GtoC for two cases, but the cost of installation for the two systems is significantly different.
In addition, we can calculate the solar panel cost, as presented in Figure 15, with the assumption that the unit price per panel with medium efficiency is twice the price per panel with low efficiency, and a high-efficiency panel is three times the cost of the low-efficiency panel. This shows that the option of having medium panel number with medium panel efficiency has an average cost, which agrees with the calculation driven from GtoC; this enables a good compromise. Hence, having a smaller number of panels and selecting this option can help achieve benefits, such as lower installation costs, making the best use of available roof space, best energy generation, and safer and fewer material requirements [29]. Most importantly, it presents an effective way to clean and maintain panels in the harsh weather of Qatar [30]. Nevertheless, going for more efficient panels means increasing the upfront cost of the solar panel system [31]. Thus, making the right calculation, which offers average cost with a good level of system efficiency, is key for influencing factor [20], which can encourage owners and policymakers to take real steps. At present, the use of roof solar panels in Qatar is in its infancy; such an approach might be useful in achieving national milestones, before expanding and upgrading to high-efficiency panels, with the ultimate goal of becoming a clean energy exporter. Therefore, companies keen to sign contracts with householders or property owners will be able to assess return on investment based on the figure provided for GtoC and system upfront cost.
Moreover, another example for evaluating investment opportunities based on GtoC calculation, as presented in Table 3 and plotted in Figure 16, shows that for the period from December to April, when the temperature is clement in Qatar and demand for electricity for December to February is at its lowest [18], there is a good opportunity to export energy, mainly from installation scenarios E, F, H, and I, with highest GtoC average for winter time, as the demand for energy rises in Europe [32], which can support global efforts towards sustainable energy resources [33].

5.4. Maintenance, Upgrade Planning, and Decision-Making Index

The long-term efficiency and sustainability of solar PV systems themselves depends on periodic monitoring, maintenance, and potential upgrades, with regular evaluation of performance to sustain energy generation at required or optimum levels. Large solar panel plants use advanced systems including IoT and Intelligent Wireless Sensor Networks for monitoring, but such costly technologies are unfeasible for smaller and localized private applications [28]. For homes and businesses with a limited number of solar panels, there is a need for a practical and affordable approach, such as GtoC. Moreover, strategies and decision-making require enough data to enable making the right judgement [34]. For example, if the government desired to establish national renewable energy policies [35], it could incentivise teams and consumers to install solar panel systems, or establish initiatives to support solar energy generation, requiring some indicators to enable them to make sound decisions. GtoC can be very helpful to different stakeholders in establishing a good strategy and making informed decisions. On other hand, as dust, dirt, and ageing degrade PV systems and reduce their performance [36], GtoC can be used as a good indicator to enable comparison with the previous reading when the system was at its best performance, to support planning, cleaning, maintenance, or replacement of parts or whole systems. This is important, since Qatar can have high dust density from the months of May, June, and July in comparison to other months [37]. Figure 17 illustrates how not cleaning solar panels could degrade panel performance, which can be identified from changes on GtoC. This can be translated to order to perform clearing to restore the normal GtoC.

6. Conclusions

The study has been conducted to analyse and establish the feasibility for deploying solar panels in Qatari homes and business roofs. The comparison between estimated generated energy from different settings of solar panels of varying efficiency, total panel size, and sun exposure per day in each month clearly reveals the great potential for some settings that can enable properties to generate sufficient clean energy that can satisfy their own consumption, and even produce a surplus. Some settings with medium to high panel efficiency and good panel size can provide very good investment potential, generating extra energy that can be sold back to the grid or internationally, especially during the winter period when Qatar maintains relatively high solar exposure but electricity demand is lower due to less requirement for active cooling (which are coincidentally the times of peak energy demand in temperate and colder countries, which could be potential export markets for Qatar’s solar power generation).
This study also indicates that GtoC is a reliable indicator for simple comparison. In addition, it can be used on a wider scale to establish a data-driven model to support energy management, and decision making. Since this study has been based on analytical solutions, it would be useful to correlate these results with some other results obtained from real-life solar panel installation scenarios, in order to fully establish the performance under various operational scenarios.

Author Contributions

Conceptualization, A.B. and Z.H.; methodology, A.B. and Z.H.; investigation, A.B.; writing original draft preparation, A.B.; writing—review and editing, Z.H.; supervision, M.A. All authors have read and agreed to the published version of the manuscript.

Funding

This research received no external funding.

Data Availability Statement

The data can be shared up on request.

Conflicts of Interest

The authors declare no conflict of interest.

References

  1. Zainaa, S.; Sadaf, S.; Kunjuc, A.; Meraj, M.; Unal, D.; Touati, F. Statistical Assessment of Renewable Energy Generation in Optimizing Qatar Green Buildings. arXiv 2021, arXiv:2103.07881. Available online: https://www.researchgate.net/publication/350087529_Statistical_Assessment_of_Renewable_Energy_Generation_in_Optimizing_Qatar_Green_Buildings (accessed on 27 June 2022).
  2. World Data. Sunrise and Sunset in Qatar. Available online: https://www.worlddata.info/asia/qatar/sunset.php (accessed on 27 June 2022).
  3. Bachour, D.; Perez–Astudillo, D. Ground-measurement GHI map for Qatar. Energy Procedia 2014, 49, 2297–2302. [Google Scholar] [CrossRef] [Green Version]
  4. Meltzer, J.; Hultman, N.E.; Langley, C. Low-Carbon Energy Transitions in Qatar and the Gulf Cooperation Council Region; Global Economy and Development at Brookings: New York, NY, USA, 2014; Available online: https://www.brookings.edu/wp-content/uploads/2016/07/low-carbon-energy-transitions-qatar-meltzer-hultman-full.pdf (accessed on 27 June 2022).
  5. Alnaser, W.E.; Alnaser, N.W. The impact of the rise of using solar energy in GCC countries. In Renewable Energy and Sustainable Buildings (Innovative Renewable Energy); Sayigh, A., Ed.; Springer: Cham, Switzerland, 2020; pp. 167–183. [Google Scholar] [CrossRef] [Green Version]
  6. Kamal, W.A. A solar pond for air conditioning a small family house in Qatar. Eng. J. Qatar Univ. 1992, 5, 163–176. [Google Scholar]
  7. Guo, B.; Javed, W.; Figgis, B.W.; Mirza, T. Effect of dust and weather conditions on photovoltaic performance in Doha, Qatar. In Proceedings of the 2015 First Workshop on Smart Grid and Renewable Energy (SGRE), Doha, Qatar, 22–23 March 2015; pp. 1–6. [Google Scholar] [CrossRef]
  8. Aksakal, A.; Rehman, S. Global solar radiation in north-eastern Saudi Arabia. Renew. Energy 1999, 17, 461–472. [Google Scholar] [CrossRef]
  9. Anadolu Agency. Japan to Provide $330 M for Qatar Mega Solar Power Plant. Available online: https://www.aa.com.tr/en/middle-east/japan-to-provide-330m-for-qatar-mega-solar-power-plant/1940284 (accessed on 27 June 2022).
  10. Total Energies. Total to Develop Qatar’s First Large-Scale (800 MWp) Solar Plant. Available online: https://totalenergies.com/media/news/press-releases/total-develop-qatars-first-large-scale-800-mwp-solar-plant#:~:text=Qatar (accessed on 27 June 2022).
  11. Total Energies. Al Kharsaah, a Pioneering Solar Power Plant in Qatar. Available online: https://totalenergies.com/projects/renewables-electricity/al-kharsaah-pioneering-solar-power-plant-qatar (accessed on 27 June 2022).
  12. Elrahmani, A.; Hannun, J.; Eljack, F.; Kazi, M.K. Status of renewable energy in the GCC region and future opportunities. Curr. Opin. Chem. Eng. 2021, 31, 100664. [Google Scholar] [CrossRef]
  13. Bakhtiarian, M.F. Investment Guide in Qatar. In Proceedings of the 4th International Conference on Business, Management & Economics, Berlin, Germany, 15–17 December 2020. [Google Scholar]
  14. Tan, T.; Al–Khalaqi, A.; Al–Khulaifi, N. Qatar National Vision 2030. Sustain. Dev. Apprais. Gulf Reg. 2014, 19, 65–81. [Google Scholar]
  15. Scharfenort, N. Urban development and social change in Qatar: The Qatar National Vision 2030 and the 2022 FIFA World Cup. J. Arab. Stud. 2012, 2, 209–230. [Google Scholar] [CrossRef]
  16. Okonkwo, E.C.; Wole–Osho, I.; Bamisile, O.; Abid, M.; Al–Ansari, T. Grid integration of renewable energy in Qatar: Potentials and limitations. Energy 2021, 235, 121310. [Google Scholar] [CrossRef]
  17. Goundar, S. Research Methodology and Research Method; Victoria University of Wellington: Wellington, New Zealand, 2012. [Google Scholar]
  18. Alrawi, O.; Bayram, I.S.; Al-Ghamdi, S.G.; Koc, M. High-resolution household load profiling and evaluation of rooftop pv systems in selected houses in qatar. Energies 2019, 12, 3876. [Google Scholar] [CrossRef] [Green Version]
  19. YES Energy Solutions. How Much Energy do Solar Panels Produce for Your Home? Available online: https://www.yesenergysolutions.co.uk/advice/how-much-energy-solar-panels-produce-home (accessed on 27 June 2022).
  20. Fouad, M.M.; Shihata, L.A.; Morgan, E.I. An integrated review of factors influencing the performance of photovoltaic panels. Renew. Sustain. Energy Rev. 2017, 80, 1499–1511. [Google Scholar] [CrossRef]
  21. Vidyanandan, K.V. An overview of factors affecting the performance of solar PV systems. Energy Scan 2017, 27, 216. [Google Scholar]
  22. Osma–Pinto, G.; Ordóñez–Plata, G. Measuring factors influencing performance of rooftop PV panels in warm tropical climates. Sol. Energy 2019, 185, 112–123. [Google Scholar] [CrossRef]
  23. Bakar, N.N.A.; Hassan, M.Y.; Abdullah, H.; Rahman, H.A.; Abdullah, M.P.; Hussin, F.; Bandi, M. Energy efficiency index as an indicator for measuring building energy performance: A review. Renew. Sustain. Energy Rev. 2015, 44, 1–11. [Google Scholar] [CrossRef]
  24. Hoen, B.; Wiser, R.H.; Cappers, P.; Thayer, M.A. An Analysis of the Effects of Residential Photovoltaic Energy Systems on Home Sales Prices in California. Ernest Orlando Lawrence Berkeley National Laboratory 2011, LBNL-4476E. Available online: https://eta-publications.lbl.gov/sites/default/files/lbnl-4476e.pdf (accessed on 27 June 2022).
  25. Marti, L.; Puertas, R. Sustainable energy development analysis: Energy Trilemma. Sustain. Technol. Entrep. 2022, 1, 100007. [Google Scholar] [CrossRef]
  26. PV Magazine International. KPIs Solar Operators should be Tracking to Overcome the Data Deluge. Available online: https://www.pv-magazine.com/2021/09/27/kpis-solar-operators-should-be-tracking-to-overcome-the-data-deluge/ (accessed on 27 June 2022).
  27. Limentani, G.B.; Ringo, M.C.; Ye, F.; Berquist, M.L.; McSorley, E.O. Beyond the t-test: Statistical equivalence testing. Anal. Chem. 2005, 77, 221A–226A. [Google Scholar] [CrossRef] [Green Version]
  28. Siddikov, I.; Khujamatov, K.; Khasanov, D.; Reypnazarov, E. IoT and intelligent wireless sensor network for remote monitoring systems of solar power stations. In Proceedings of the 11th World Conference “Intelligent System for Industrial Automation” (WCIS-2020) (Advances in Intelligent Systems and Computing, 1323); Aliev; Aliev, R.A., Yusupbekov, N.R., Kacprzyk, J., Pedrycz, W., Sadikoglu, F.M., Eds.; Springer: Cham, Switzerland, 2020; pp. 186–195. [Google Scholar] [CrossRef]
  29. Pandey, A.K.; Tyagi, V.V.; Jeyraj, A.; Selvaraj, L.; Rahim, N.A.; Tyagi, S.K. Recent advances in solar photovoltaic systems for emerging trends and advanced applications. Renew. Sustain. Energy Rev. 2016, 53, 859–884. [Google Scholar] [CrossRef]
  30. Alrawi, O.; Bayram, I.S.; Koc, M.; Al-Ghamdi, S.G. Economic Viability of Rooftop Photovoltaic Systems and Energy Storage Systems in Qatar. Energies 2022, 15, 3040. [Google Scholar] [CrossRef]
  31. Bauner, C.; Crago, C.L. Adoption of residential solar power under uncertainty: Implications for renewable energy incentives. Energy Policy 2015, 86, 27–35. [Google Scholar] [CrossRef]
  32. Darwish, S.; Abdo, H.; AlShuwaiee, W.M. Opportunities, challenges and risks of transition into renewable energy: The case of the Arab Gulf Cooperation Council. Int. Energy J. 2018, 18, 391–400. [Google Scholar]
  33. Chakraborty, S.; Li, J.; Bhattacharya, P. The solution to the global energy crisis with new materials, and sustainability. J. Phase Change Mater. 2021, 1. [Google Scholar] [CrossRef]
  34. Provost, F.; Fawcett, T. Data science and its relationship to big data and data–driven decision making. Big Data 2013, 1, 51–59. [Google Scholar] [CrossRef] [PubMed]
  35. Hafeznia, H.; Aslani, A.; Anwar, S.; Yousefjamali, M. Analysis of the effectiveness of national renewable energy policies: A case of photovoltaic policies. Renew. Sustain. Energy Rev. 2017, 79, 669–680. [Google Scholar] [CrossRef]
  36. Javed, W.; Wubulikasimu, Y.; Figgis, B.; Guo, B. Characterization of dust accumulated on photovoltaic panels in Doha, Qatar. Sol. Energy 2017, 142, 123–135. [Google Scholar] [CrossRef]
  37. Bartlett, K.S. Dust Storm Forecasting for Al Udeid AB, Qatar: An Empirical Analysis. Master’s Thesis, United States Air Force, Washington, DC, USA, March 2004. [Google Scholar]
Figure 1. Average Sun Hours Per Month in Qatar.
Energies 15 09270 g001
Figure 2. Research Design.
Energies 15 09270 g002
Figure 3. Example of Qatari Home Daily Electrical Consumption in Each Month.
Energies 15 09270 g003
Figure 4. LPE vs. LPN (20% vs. 2 panels).
Energies 15 09270 g004
Figure 5. LPE vs. MPN (20% vs. 4 panels).
Energies 15 09270 g005
Figure 6. LPE vs. HPN (20% vs. 6 panels).
Energies 15 09270 g006
Figure 7. MPE vs. LPN (40% vs. 2 panels).
Energies 15 09270 g007
Figure 8. MPE vs. MPN (40% vs. 4 panels).
Energies 15 09270 g008
Figure 9. MPE vs. HPN (40% vs. 6 panels).
Energies 15 09270 g009
Figure 10. HPE vs. LPN (50% vs. 2 panels).
Energies 15 09270 g010
Figure 11. HPE vs. MPN (50% vs. 4 panels).
Energies 15 09270 g011
Figure 12. HPE vs. HPN (50% vs. 6 panels).
Energies 15 09270 g012
Figure 13. Generated to Consumed Electrical Energy Ration (GtoC)%.
Energies 15 09270 g013
Figure 14. GtoC Comparing Two Scenarios.
Energies 15 09270 g014
Figure 15. Comparing Solar Panels Cost.
Energies 15 09270 g015
Figure 16. GtoC to Identify Energy Export Opportunities.
Energies 15 09270 g016
Figure 17. Illustration of dust impact on GtoC.
Energies 15 09270 g017
Table 1. Home Specification.
ItemMeasurementRemarks
Total area900m2
Penthouse roof area56.72m2
Total roof area65.47m2
No. bedrooms10Excluding lounges
No. inhabitants15Including 3 children
No. air-conditioning unit19114 kW
Table 2. Calculation Scenarios.
ScenarioPanel Efficiency (%)No. PanelsPanel Area (m2)
LPE vs. LPN2023.2
LPE vs. MPN46.4
LPE vs. HPN69.6
MPE vs. LPN4023.2
MPE vs. MPN46.4
MPE vs. HPN69.6
HPE vs. LPN5023.2
HPE vs. MPN46.4
HPE vs. HPN69.6
Key: LPE/MPE/HPE—Low/Medium/High Panel Efficiency. LPN/MPN/HPN—Low/Medium/High Panel Number.
Table 3. GtoC to Compare Different Installation Scenarios.
Scenario
ABCDEFGHI
January100.0271200.0543300.0814200.0543400.1085600.1628250.0678500.1356750.2035
February125.3993250.7986376.1979250.7986501.5972752.3958313.4982626.9965940.4947
March142.3046284.6091426.9137284.6091569.2183853.8274355.7614711.52291067.284
April95.67646191.3529287.0294191.3529382.7058574.0587239.1911478.3823717.5734
May71.74668143.4934215.24143.4934286.9867430.4801179.3667358.7334538.1001
June33.7668167.53362101.300467.53362135.0672202.600984.41702168.834253.2511
July83.31175166.6235249.9353166.6235333.247499.8705208.2794416.5588624.8381
August28.4434456.8868885.3303156.88688113.7738170.660671.10859142.2172213.3258
September33.8269367.65387101.480867.65387135.3077202.961684.56733169.1347253.702
October40.295580.591120.886580.591161.182241.773100.7388201.4775302.2163
November48.1690596.33811144.507296.33811192.6762289.0143120.4226240.8453361.2679
December82.55708165.1142247.6712165.1142330.2283495.3425206.3927412.7854619.1781
A. LPE vs. LPN. B. LPE vs. MPN. C. LPE vs. HPN. D. MPE vs. LPN. E. MPE vs. MPN. F. MPE vs. HPN. G. HPE vs. LPN. H. HPE vs. MPN. I. HPE vs. HPN. Color caption: Green: generated energy is much higher than consumed; Amber, generated energy is equal to consumed; Red: generated energy is much less than consumed.
Table 4. Traffic Light Index.
Traffic LightRepresentationMathematical Illustration
RedGenerated energy < consumed energy G t o C < 100 %
AmberGenerated energy ≥ consumed energy 150 %   G t o C 100 %
GreenGenerated energy > consumed energy G t o C > 150 %
Publisher’s Note: MDPI stays neutral with regard to jurisdictional claims in published maps and institutional affiliations.

