Article

Study on the Performance of Variable Density Multilayer Insulation in Liquid Hydrogen Temperature Region

1
School of Electrical Engineering, Xinjiang University, Urumqi 830049, China
2
State Grid Economic and Technological Research Institute Co., Ltd., Beijing 102209, China
*
Author to whom correspondence should be addressed.
Energies 2022, 15(24), 9267; https://doi.org/10.3390/en15249267
Submission received: 7 November 2022 / Revised: 25 November 2022 / Accepted: 27 November 2022 / Published: 7 December 2022
(This article belongs to the Section A5: Hydrogen Energy)

Abstract

:
The storage of hydrogen is important for the development of hydrogen energy, especially for the storage of liquid hydrogen, which has been receiving more and more attention recently. In order to study the thermal insulation performance of variable-density multilayer insulation (VDMLI) structures under different working conditions at liquid hydrogen temperatures without incorporating a composite structure, we established a heat transfer model based on a layer-by-layer calculation method. Then, we carried out numerical calculations to analyze the influence of the total number of layers, the thermal boundary temperature, and vacuums on the performance of MLI at liquid hydrogen temperatures. To investigate the optimization of variable-density configurations on the thermal insulation performance of VDMLI and to obtain accurate variable-density configurations, we proposed a variable-density configuration method based on the control variable method and the insertion by region method. The results indicate that the optimal variable-density configuration is the insertion of 4 layers of radiation shields in the low-density region, 15 layers in the medium-density region and 38 layers in the high-density region. Compared with a uniform-density structure, the heat flux is reduced by 8.6%.

1. Introduction

Hydrogen energy, an important clean and renewable energy, has been attracting more and more attention recently. Hydrogen energy is of great importance to ensure energy security, promote the transformation of the energy system, and promote sustainable economic development [1,2,3]. Hydrogen has a wide range of uses, including energy storage, electricity generation, heat generation, and uses as a fuel. Its application scenarios have gradually expanded to electricity, transportation, construction, etc. [4,5,6,7,8]. However, the production and efficient storage of hydrogen are important issues for the practical application of hydrogen energy [9,10,11]. Hydrogen storage technology includes high-pressure gaseous hydrogen storage, cryogenic liquid hydrogen storage, metal hydride hydrogen storage, etc. Compared with conventional gaseous hydrogen storage methods, liquid hydrogen storage has a high hydrogen storage density and a high energy density, which make it advantageous in storage and transportation [10]. However, the physical and chemical properties of hydrogen also create some technical challenges for the storage of liquid hydrogen [12]. The temperature of liquid hydrogen is much lower than room temperature, and liquid hydrogen has a low boiling point and low latent heat. Heat leakage causes continuous evaporation of liquid hydrogen, resulting in over-pressure and a loss of liquid hydrogen. In addition, liquefied hydrogen is flammable and explosive, which are properties that may cause combustion or explosions [13]. To prevent the loss of liquid hydrogen and the overpressure of storage tanks and to extend non-destructive storage times, heat leakage from the environment to liquid hydrogen storage tanks must be minimized. Due to the low temperature of liquid hydrogen, hydrogen storage tanks have high requirements for thermal insulation. Therefore, improving the thermal insulation performance of liquid hydrogen storage tanks is an important direction of current research.
MLI is an efficient thermal insulation technology that consists of low-emissivity radiation shields and a low thermal conductivity spacer [14]. Numerous researchers have conducted extensive research on MLI. Johnson et al. [15,16] optimized the layer density of multilayer insulation systems for different thermal boundary temperatures and vacuums and investigated the insulation performance of low-density multilayer insulation structures at liquid nitrogen temperatures. The insulation performance was related to layer density, the number of layers, and the thermal boundary temperature. Wang et al. [17] studied performance improvements for vacuum multilayer insulation structures by adding getter material to the spacer material, and they conducted experimental tests that showed that the optimum C and Cu mass content for the highest efficiency and lowest cost are 68.086% and 21.276%, respectively.
With the use of liquid hydrogen as a cryogenic propellant in the aerospace field, researchers began their studies on composite multilayer insulation structures. Martin and Hastings et al. [18,19,20] used a multipurpose hydrogen test bed to evaluate a foam/multilayer insulation system. The heat leakage was reduced by about 50% compared with standard MLI. Huang et al. [21] proposed a layer-by-layer model using foam and multilayer insulation (FMLI) to study its thermal insulation performance at different vacuum levels at liquid nitrogen temperatures, showing that almost no difference in heat flux exists between FMLI and VDMLI at 10−3 Pa. While at 105 Pa, the heat flux through FMLI and VDMLI is 45.2 W·m−2 and 147.8 W·m−2, respectively. Liu et al. [22] studied the performance of FMLI in a cryogenic storage system under different working conditions. The FMLI system had better performance and reduced heat leakage by 35% compared with the single foam insulation structure. Zheng et al. [23,24,25] introduced a self-evaporative vapor cooling shield (VCS) and analyzed four different insulation structures. The thermal insulation performance was significantly improved after adding the VCS. In addition, we conducted a theoretical analysis and experimental tests on a composite insulation system consisting of SOFI and MLI/VDMLI with liquid nitrogen as the working substance. The experimental results indicated that the thermal resistance of SOFI only accounts for 0.12% in high vacuum conditions, and it is 45.37% of the total thermal resistance in atmospheric pressure conditions. Xu et al. [26] introduced a new type of thermal insulation system by combining vacuum-insensitive hollow glass microspheres (HGMs) with VCS, and they analyzed the effect of the VCS’s installation position on thermal insulation performance. The heat leakage of this thermal insulation system was reduced by 45% and 81% in high vacuum (10−3 Pa) and low vacuum (1 Pa) conditions, respectively, compared with MLI. Wang et al. [27,28] proposed an HGM–VDMLI system and optimized its configuration. The heat flux of HGM–VDMLI was reduced by 11.97% compared with VDMLI. They also used different inner materials to predict the performance of the insulation structure in high vacuum conditions and at liquid hydrogen temperatures. Jiang et al. [29] used an MLI and VCS composite system to predict the transient temperature distribution and heat flux change in an insulation structure. The introduction of VCS for liquid hydrogen storage could reduce heat flux by about 60%.
Early research on multilayer insulation structures was carried out for the entire insulation layer while ignoring the different heat transfer relationships (radiation heat transfer, solid heat conduction, and gas conduction) between the layers. Although the total heat flux of each layer in a multilayer insulation structure is equal, the heat flux of the heat transfer changes with the layer position. In addition, the vacuum, the thermal insulation material used, the total number of layers, and the boundary temperature all affect the performance of the liquid hydrogen storage tank, so it needs to be studied in different working conditions. In this paper, we establish a heat transfer model based on the layer-by-layer calculation method to investigate the insulation performance of multilayer insulation structures under different working conditions at liquid hydrogen temperatures. We calculated the heat flux (not only the total heat flux) for different heat transfers in a multilayer insulation structure; therefore, we were able to obtain the relationship of each heat flux change with changes in layer position. The purpose of this was to optimize the insulation performance according to different heat transfer mechanisms. For the variable-density configuration method, previous studies have been conducted by utilizing the sub-region method, by determining the layer density of each region, and by comparing the heat flux of the insulation structure with different variable-density configurations. This method can obtain relatively better variable-density configurations among several configurations, but it cannot obtain the most accurate variable-density configuration of specific layers in each region. In order to obtain accurate variable-density configurations, we propose a method based on the control variable method and the insertion by region method. This method can directly and precisely obtain the optimal layer density configuration with the aim of providing the best insulation performance without using a composite structure. The cited literature on the insulation of liquid hydrogen storage tanks mainly discusses the aerospace field, and the discussed insulation structures are also more complex, such as foam/multi-layer composite insulation (FMLI) structures and self-evaporative vapor cooling shield composite insulation structures. As hydrogen energy continues to receive increased attention, the large-scale development of hydrogen energy is occurring in the civil field. If composite insulation structures are used in the civil field, the structure of the insulation layer becomes complicated, and the production cost increases, which may not be suitable for large-scale applications. Therefore, the aim of this paper is to improve the structure performance of liquid hydrogen storage tanks without using composite structures. This study contributes to the storage of liquid hydrogen in the civil field and provides a basis for improving the thermal insulation performance of variable-density multilayer insulation structures.

2. Model and Calculation Procedure

In order to study the thermal insulation performance of multilayer insulation structures under different working conditions and to study changes in the heat flux in different layer positions, we took two adjacent radiation layers as the research object and calculated the radiation heat transfer, gas heat conduction, and solid heat conduction between those two adjacent radiation layers. The layer-by-layer calculation method proposed by McIntosh [30] also takes two radiation layers as the research object, which is suitable for the research in this paper. Therefore, to establish a model for calculation, we based this paper on the layer-by-layer calculation method. To calculate the heat flux between the two adjacent radiation shields, this model assumes that the heat transfer in a multilayer insulation structure is one-dimensional, and it is based on three heat transfer mechanisms (radiation heat transfer, gas heat conduction, and solid heat conduction).

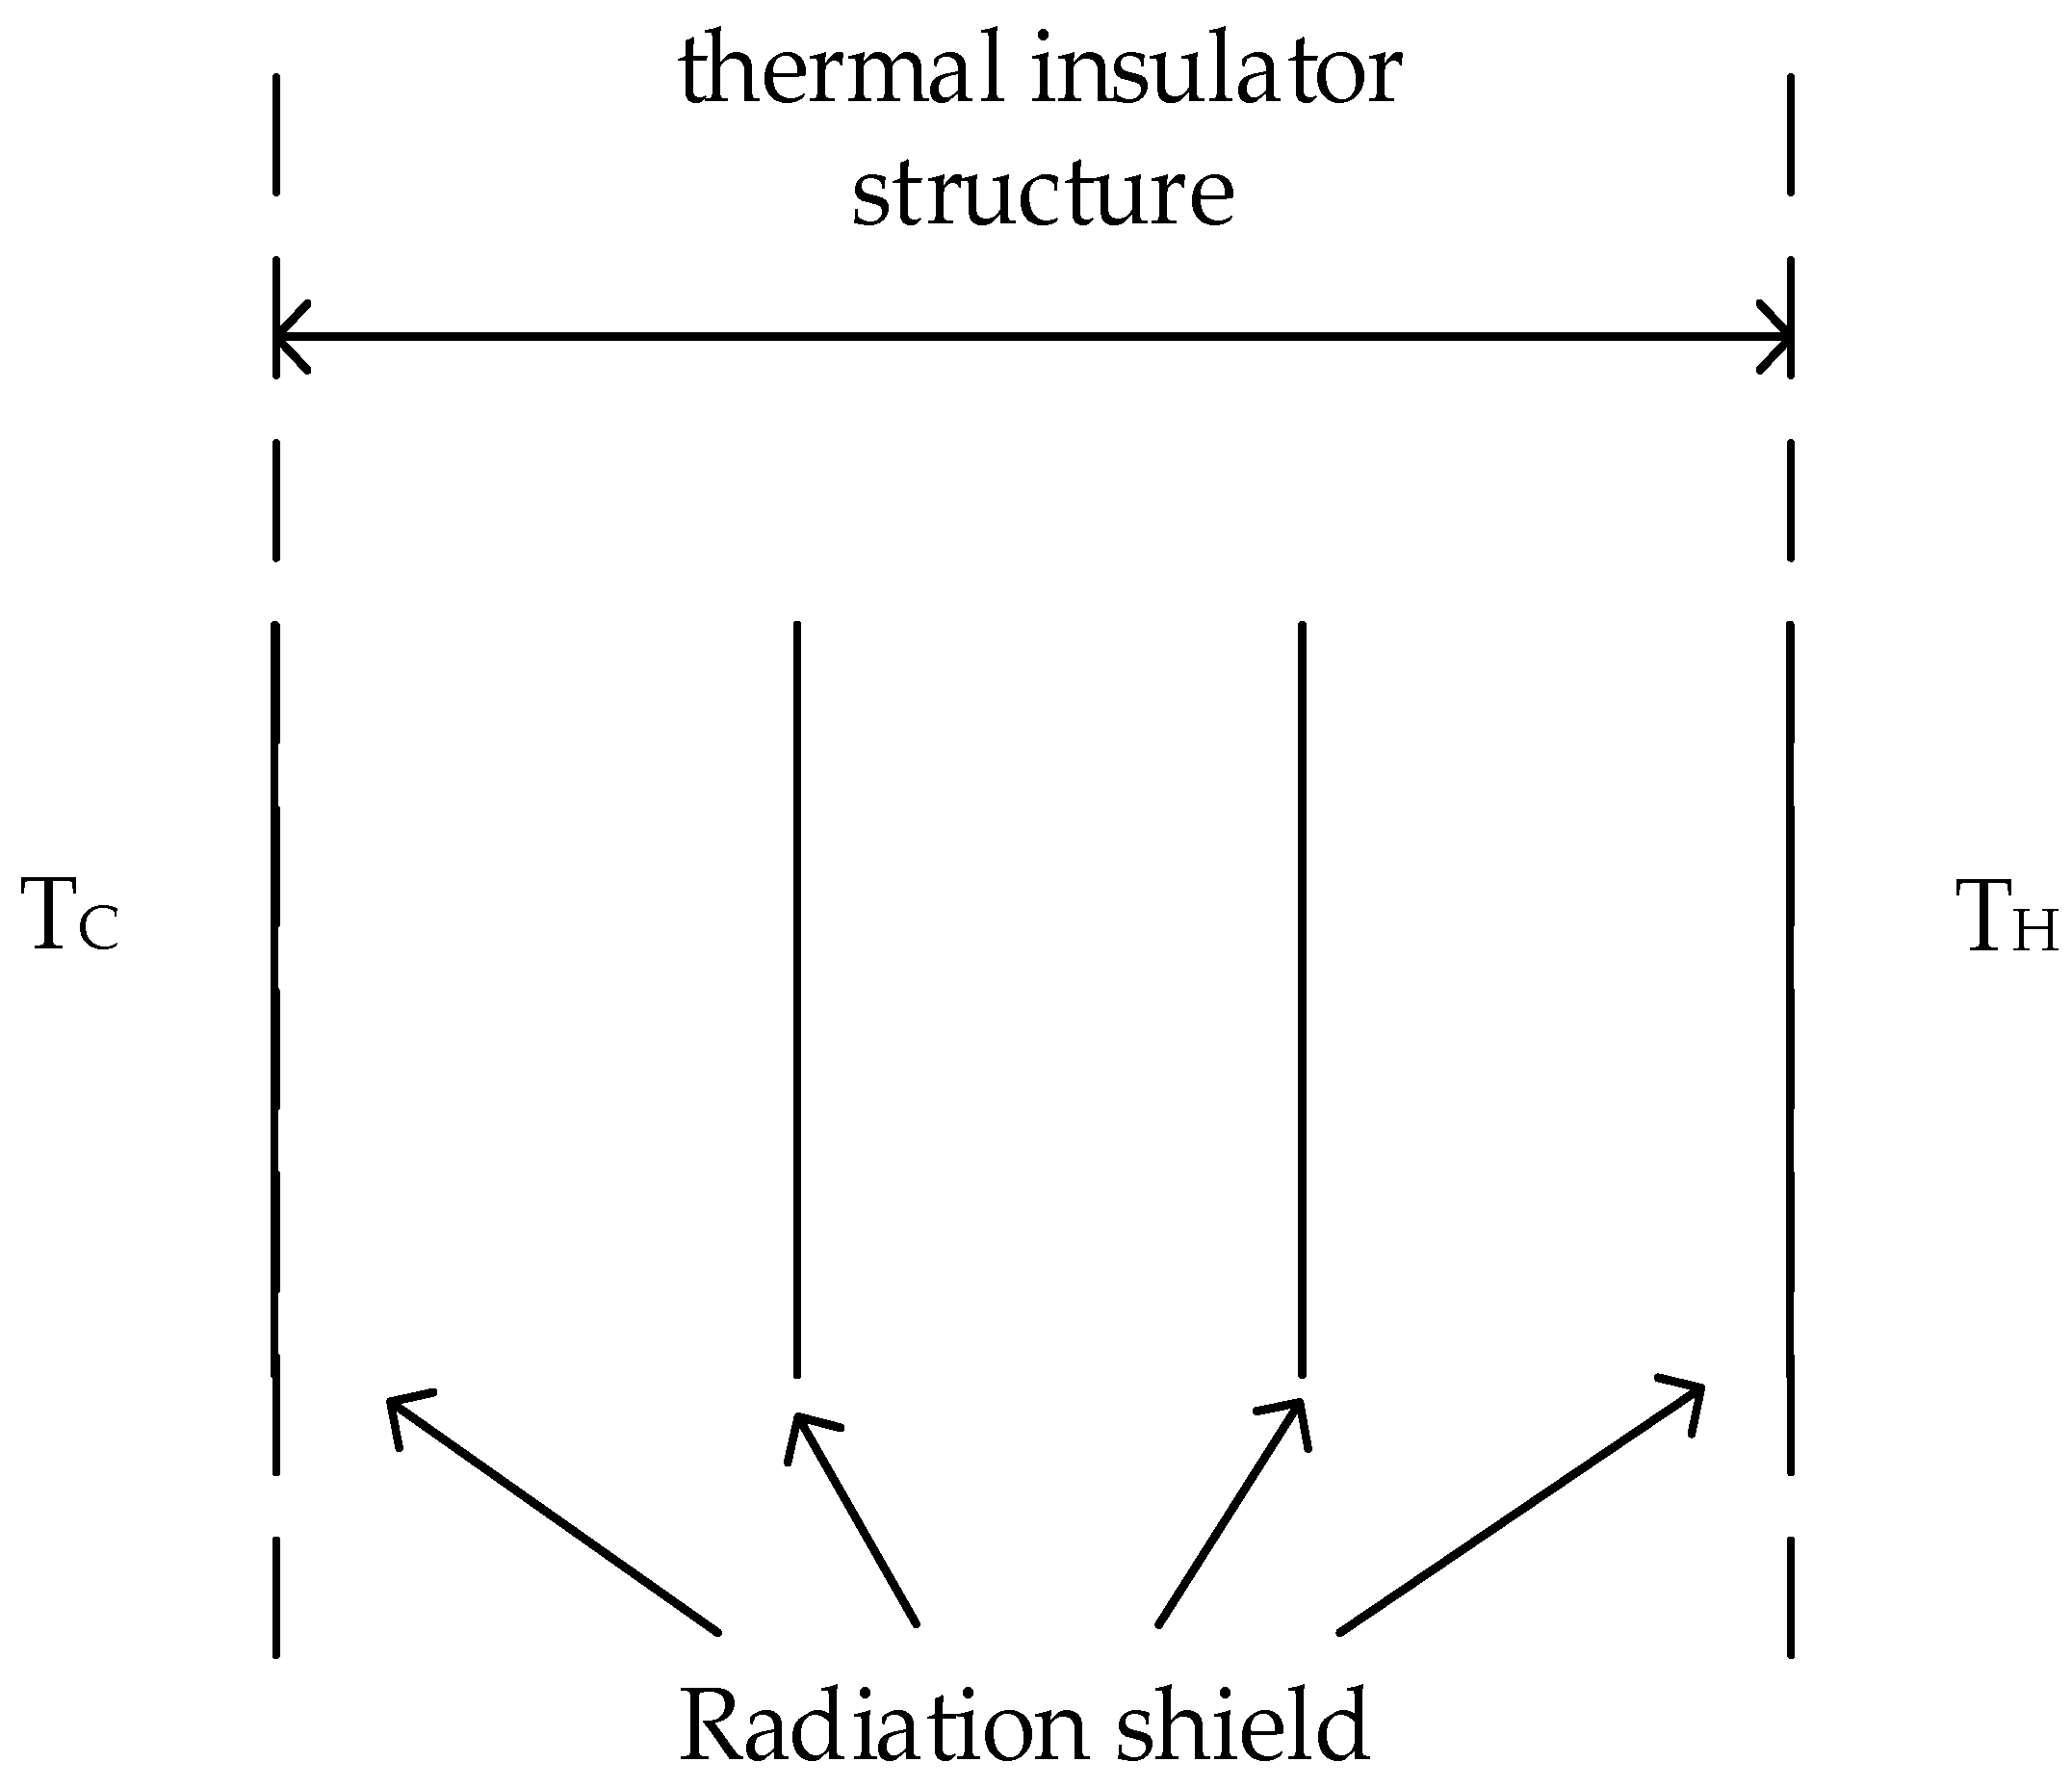
2.1. Heat Transfer Model

The radiation heat transfer between adjacent radiation layers is written as:
q i _ r a d = K i _ r a d ( T i + 1 T i )
K i _ r a d = [ σ ( T i + 1 + T i ) ( T i + 1 2 + T i 2 ) ] / ( 1 ε i + 1 + 1 ε i 1 )
where K i _ r a d is the radiation heat transfer coefficient; the Stefan–Boltzmann coefficient is σ = 5.67 × 10 8   W m 2 K 4 ; T i + 1 and T i are the temperatures of the two adjacent radiation shields; and ε i + 1 and ε i are the emissivity of the two adjacent radiation shields, both taking 0.04 for aluminized shield.
The solid heat conduction between adjacent radiation layers is written as:
q i _ s = K i _ s ( T i + 1 T i )
K i _ s = C 1 f k / D X
k = 0.017 + 7 × 10 6 ( 800 T ) + 0.0228 ln ( T )
where K i _ s is the solid heat conduction coefficient; C 1 is an empirical constant (for a Dacron net, C 1 is 0.008); f is the relative density of the spacer to the solid material (0.02); D X is the thickness of the spacer material between two adjacent radiation shields; and k is the thermal conductivity of the spacer material (W/(m·K)).
The gas conduction between adjacent radiation layers is written as:
q i _ g = K i _ g ( T i + 1 T i )
K i _ g = C 2 P α
C 2 = [ γ + 1 γ 1 ] [ R 8 π M T ] 1 / 2
where K i _ g is the gas conduction coefficient; P is the residual gas pressure; α is the accommodation coefficient (0.9 for air); γ is the specific heat ratio ( γ = C P / C V , where C P is the isobaric heat capacity, and C V is the isochoric heat capacity); R is the general gas constant (8.314 J/(mol·K)); M is the molecular weight of gas (g/mol); and T is the temperature of the vacuum chamber wall (K). For air and the vacuum chamber at room temperature, C 2 = 1.1666 .
The total heat flux through the multilayer insulation structure is written as:
q i _ t o t = q i _ r a d + q i _ s + q i _ g

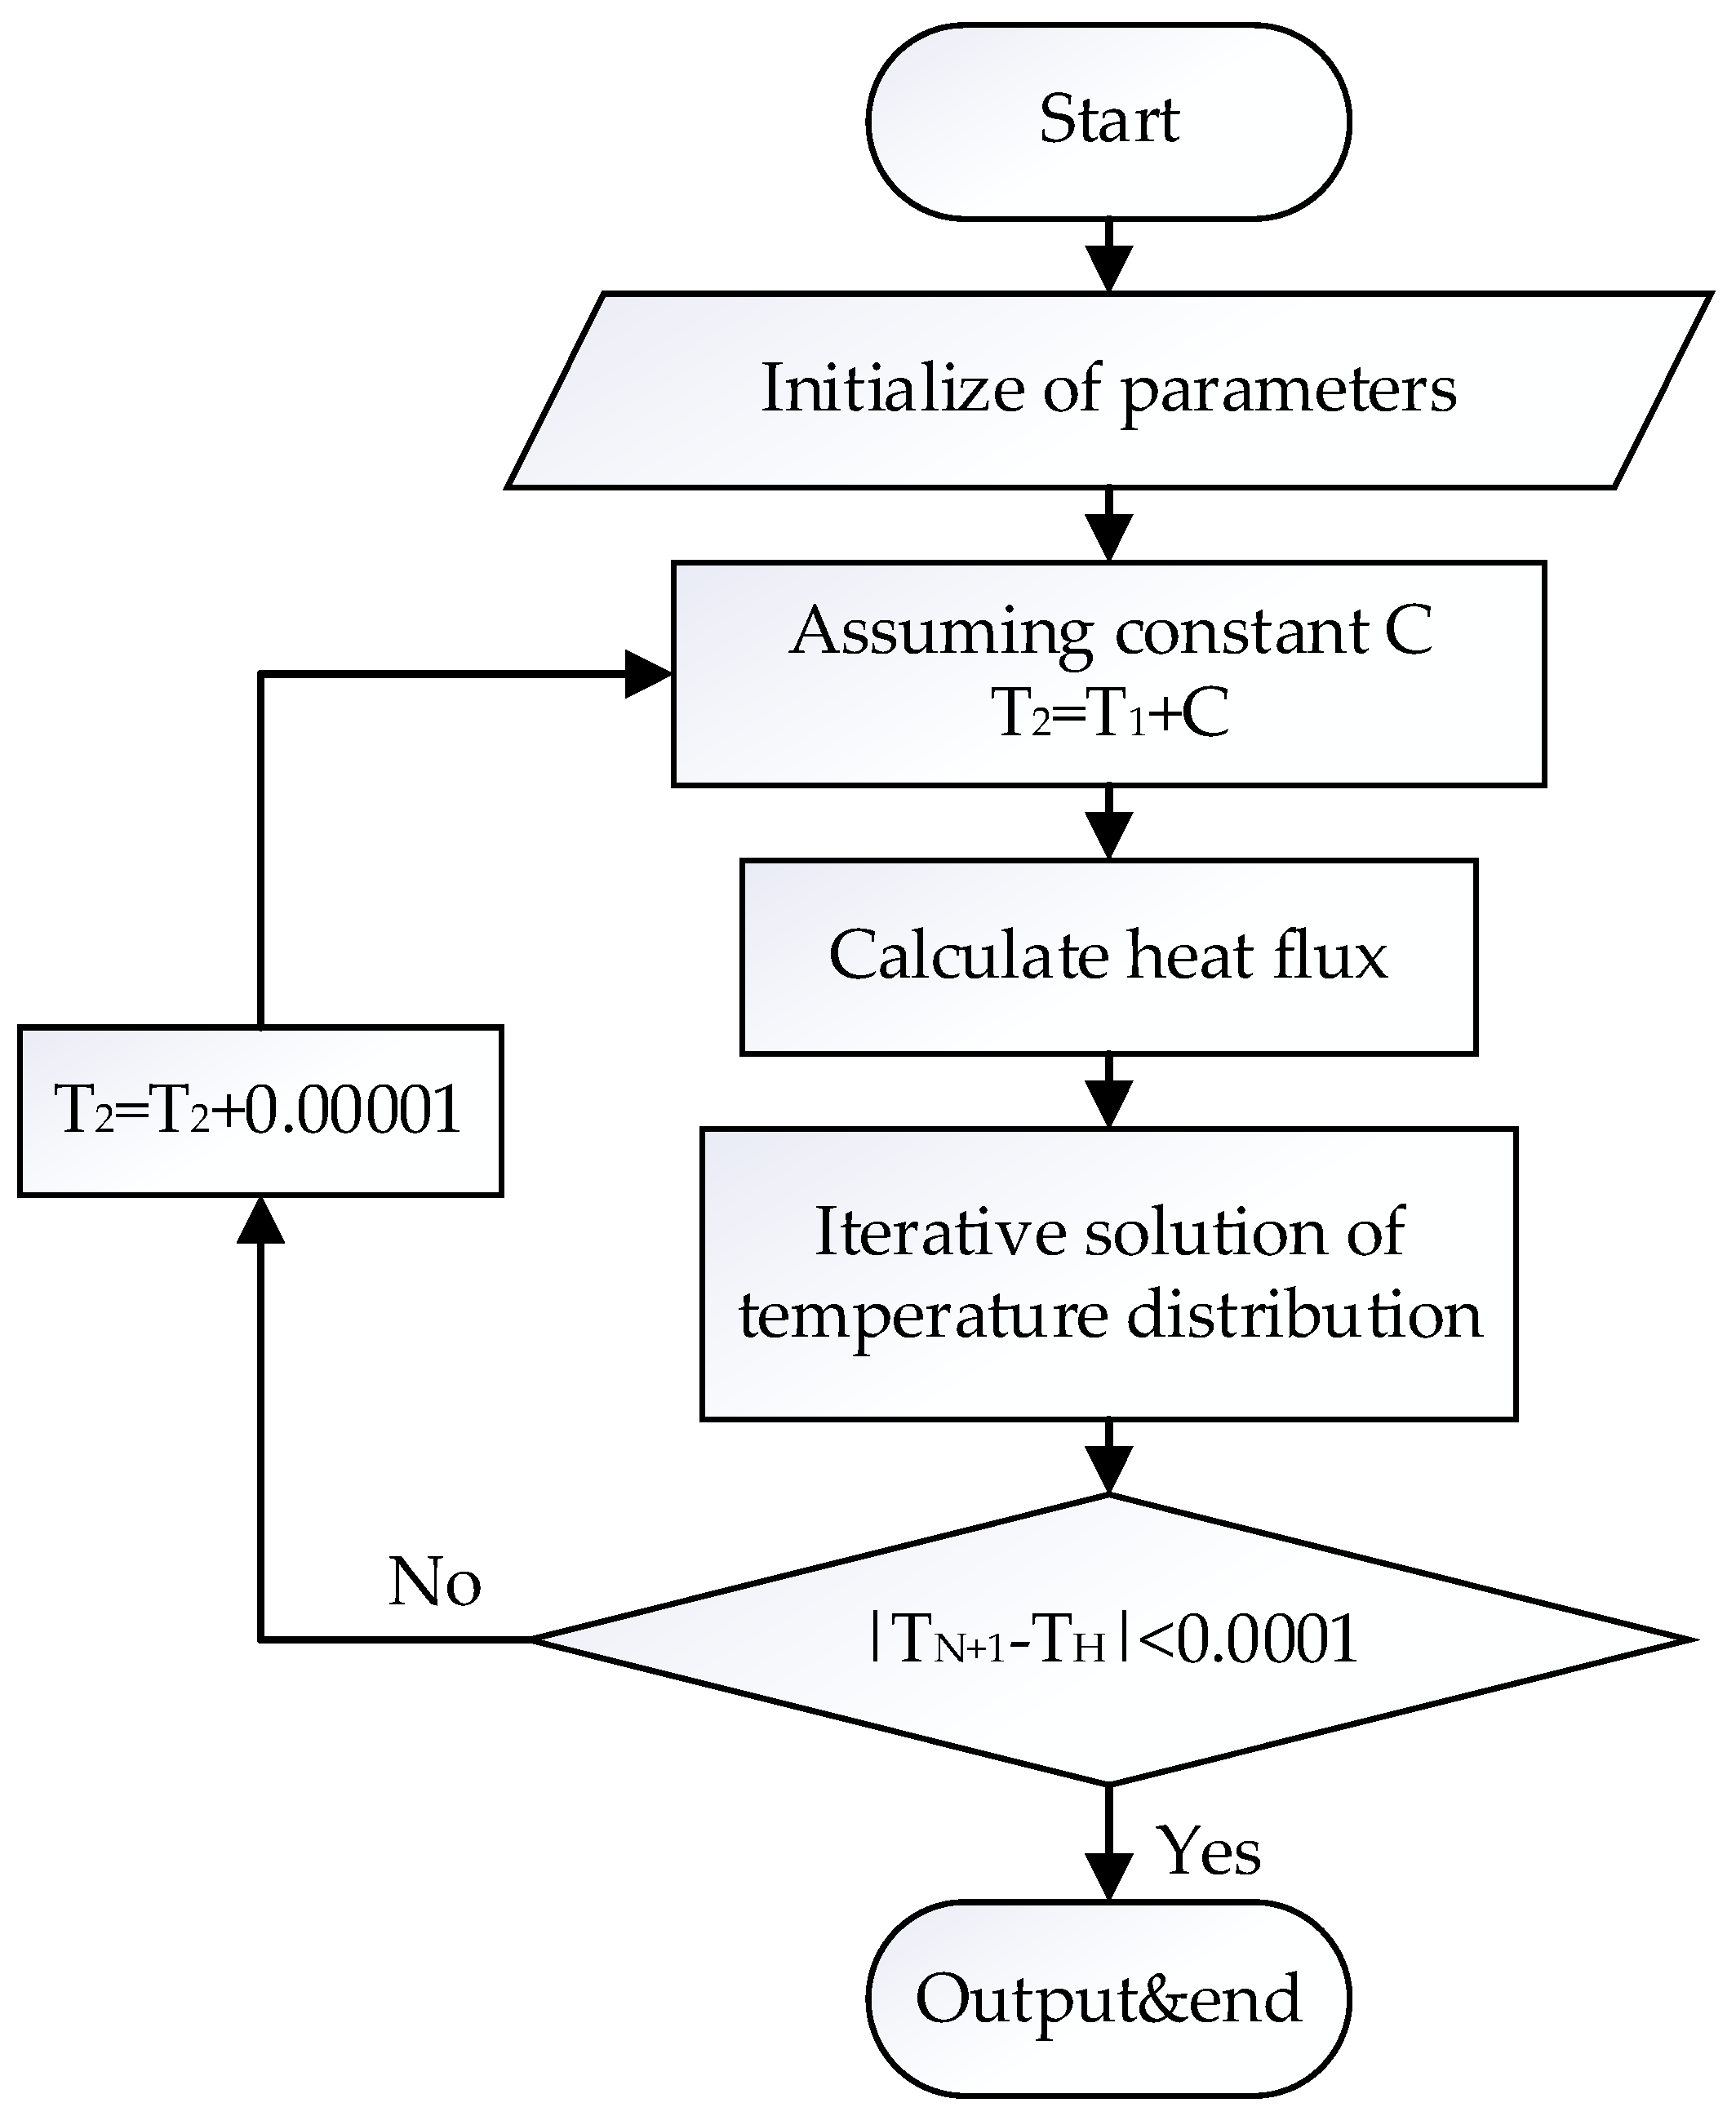
2.2. Calculation Procedure

In order to calculate the temperature distribution and heat flux of the multilayer insulation structure, we used Matlab for iterative calculations. Initially, we assumed that T 2 = T 1 + C , where T 1 and T 2 are the temperatures of the first and second radiation shields from the cold boundary, respectively, and where C is a constant. The heat flux of the first layer is obtained according to T 1 , T 2 , and C . Because the heat flux of each layer is equal, i.e., q 1 = q 2 = q 3 = = q N , N is the total number of layers. The heat flux and the temperature of each layer are calculated using iterative calculation according to Equations (1), (3), (6), and (9). The calculated value of the last layer is compared with the thermal boundary temperature, and if the difference is less than a certain value, the final heat flux and temperature distribution are obtained. The layer-by-layer calculation model flow is shown in Figure 1.

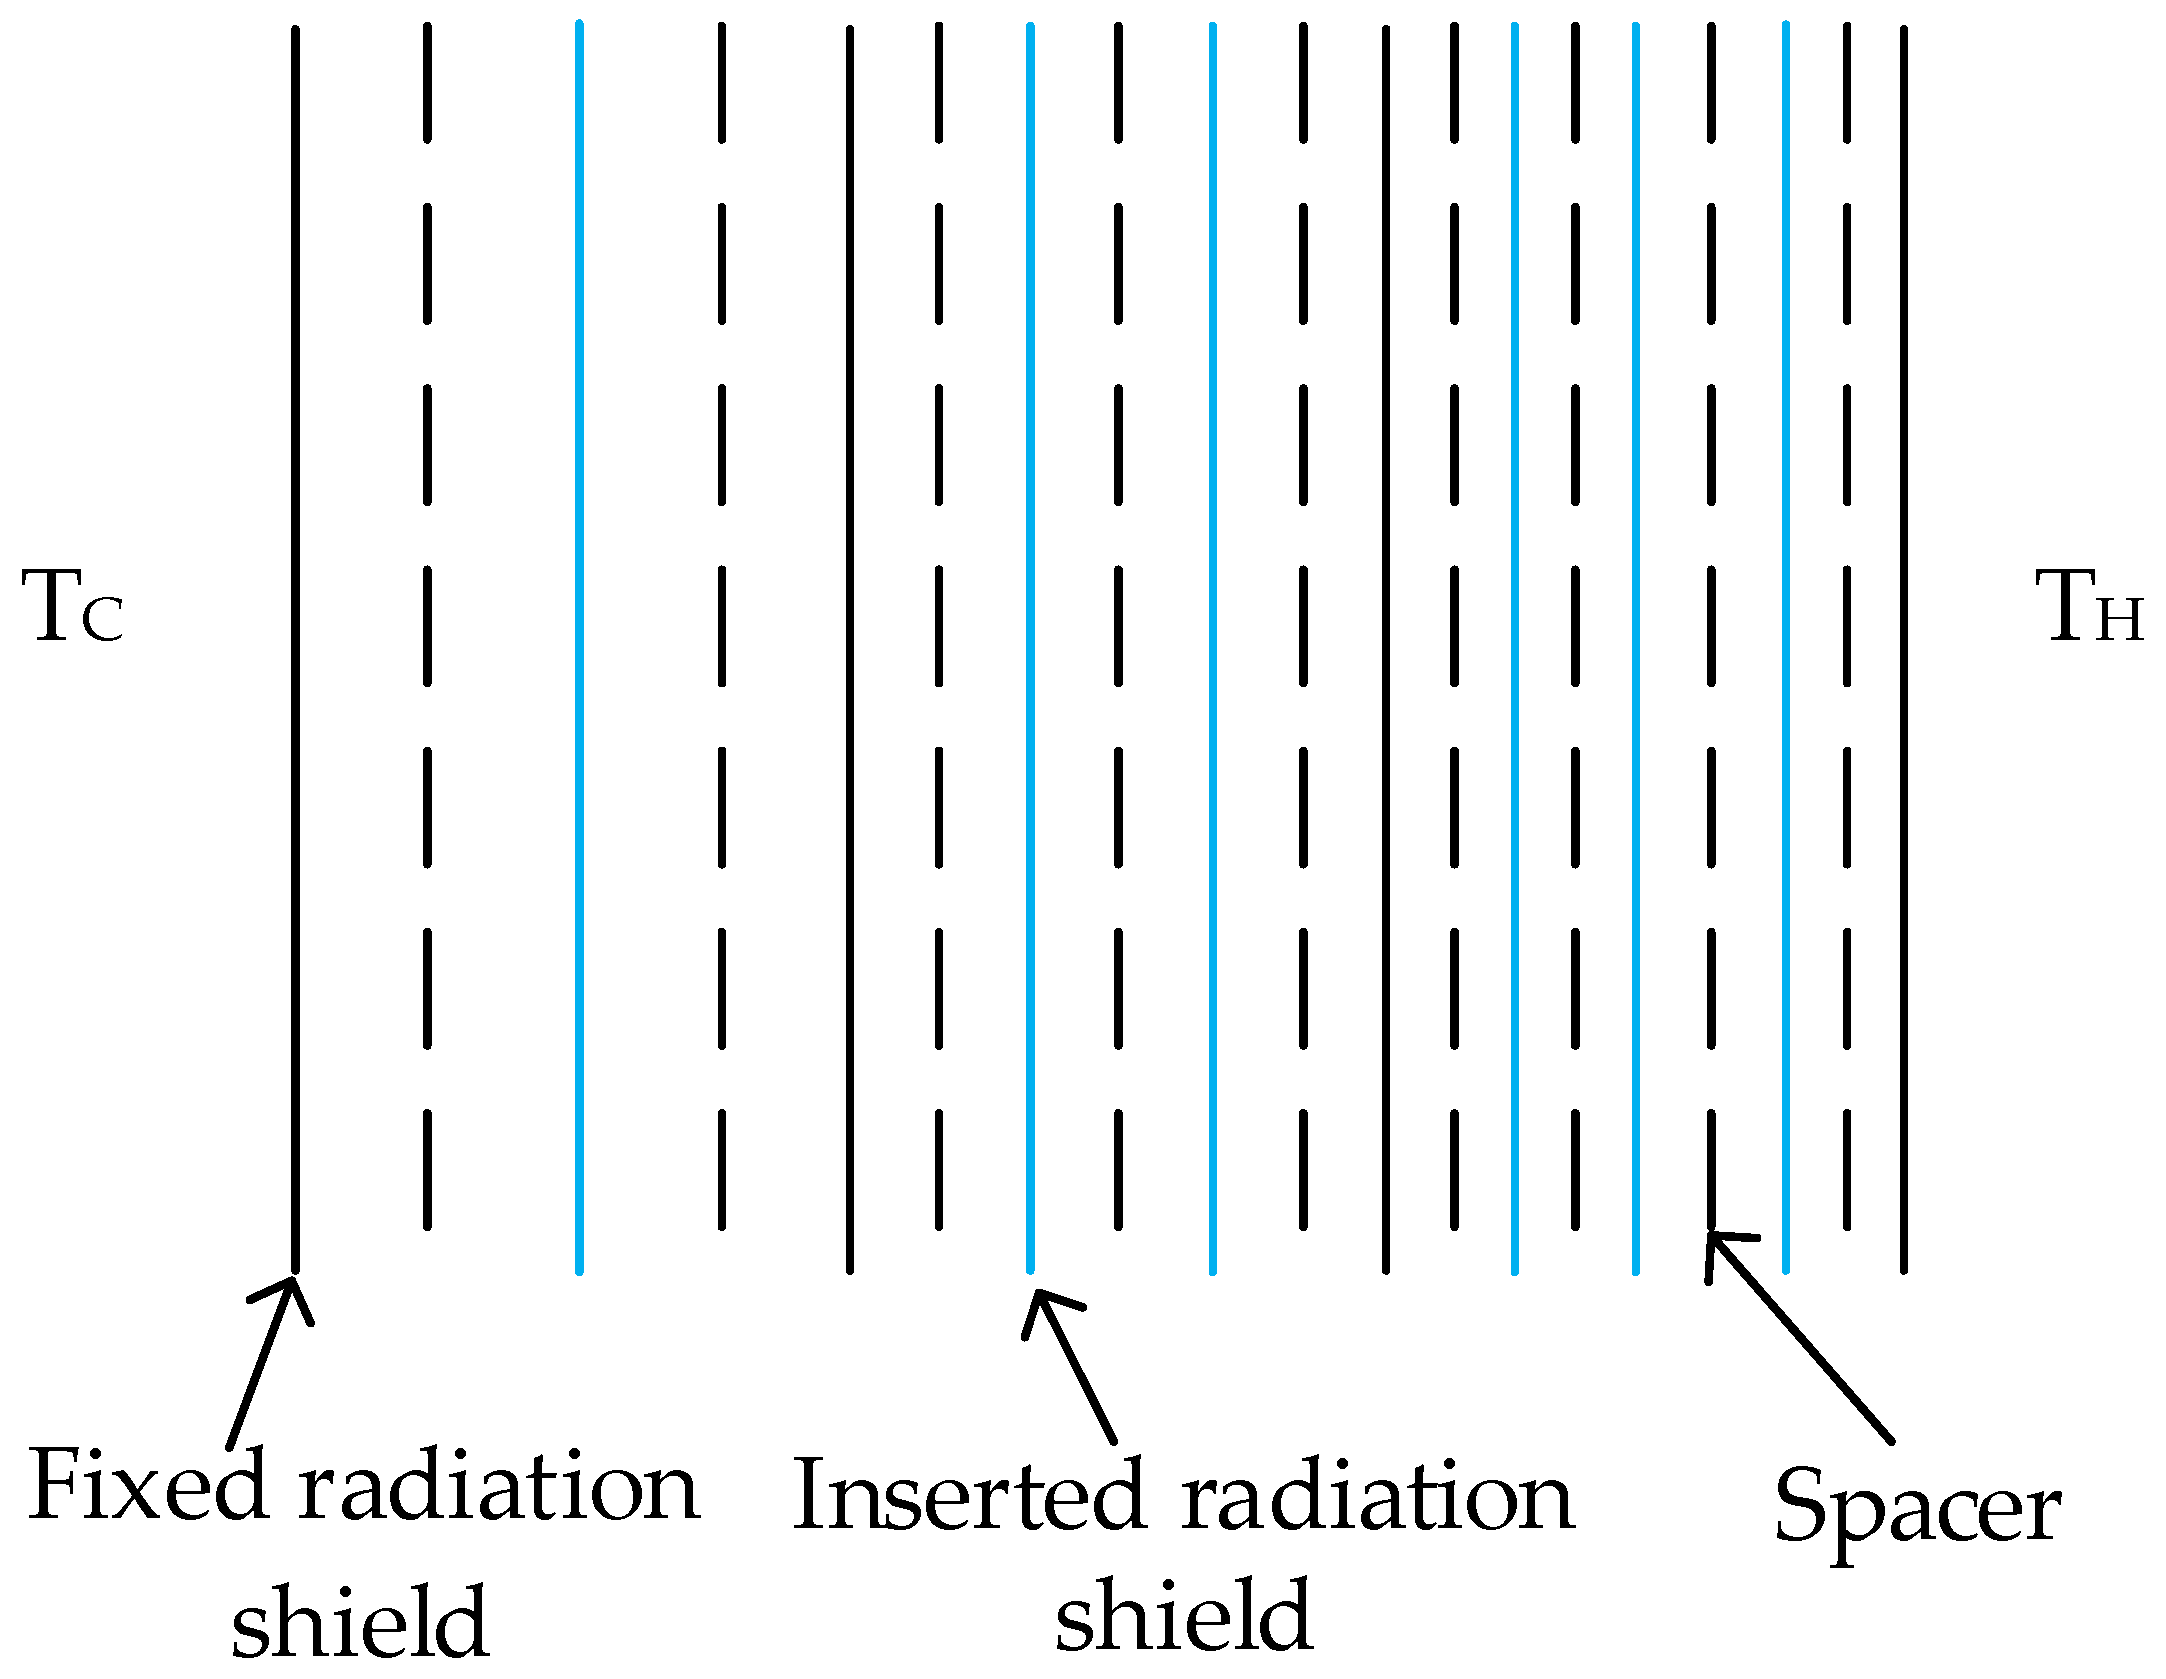
2.3. Variable-Density Configuration Method

In order to obtain an accurate configuration of the variable-density multilayer insulation structure and to improve the performance of the multilayer insulation structure, we proposed a variable-density configuration method based on the control variable method and the insertion by region method. First, the total thickness and the total number of radiation shields are set. Then, the four radiation shields are evenly arranged according to the given thickness and are divided into three regions, as shown in Figure 2.
The three segmented regions are low-, medium-, and high-density regions. Finally, all the remaining radiation shields are inserted in the low-, medium-, and high-density regions according to their numbers from low to high, as shown in Figure 3.
In the variable-density configuration process, the uniform-layer density is used as the density configuration of the medium-density region, and then all the remaining radiation shields are inserted in the low-density region and the high-density region. The set number of layers inserted in the low-density region is always less than the number of layers inserted in the medium-density region, and the number of layers inserted in the medium-density region is always less than the number of layers inserted in the high-density region. Under this premise, the number of layers inserted in the low-density region and the high-density region changes, and the result of the configuration that minimizes the heat flux can be calculated. Therefore, the optimal number of layers in the low-density area can be determined. Similarly, the number of layers inserted in the low-density region is set, the remaining radiation shields are inserted in the medium-density and high-density regions, and the configuration that minimizes the heat flux (the optimal variable-density configuration) can then be calculated.

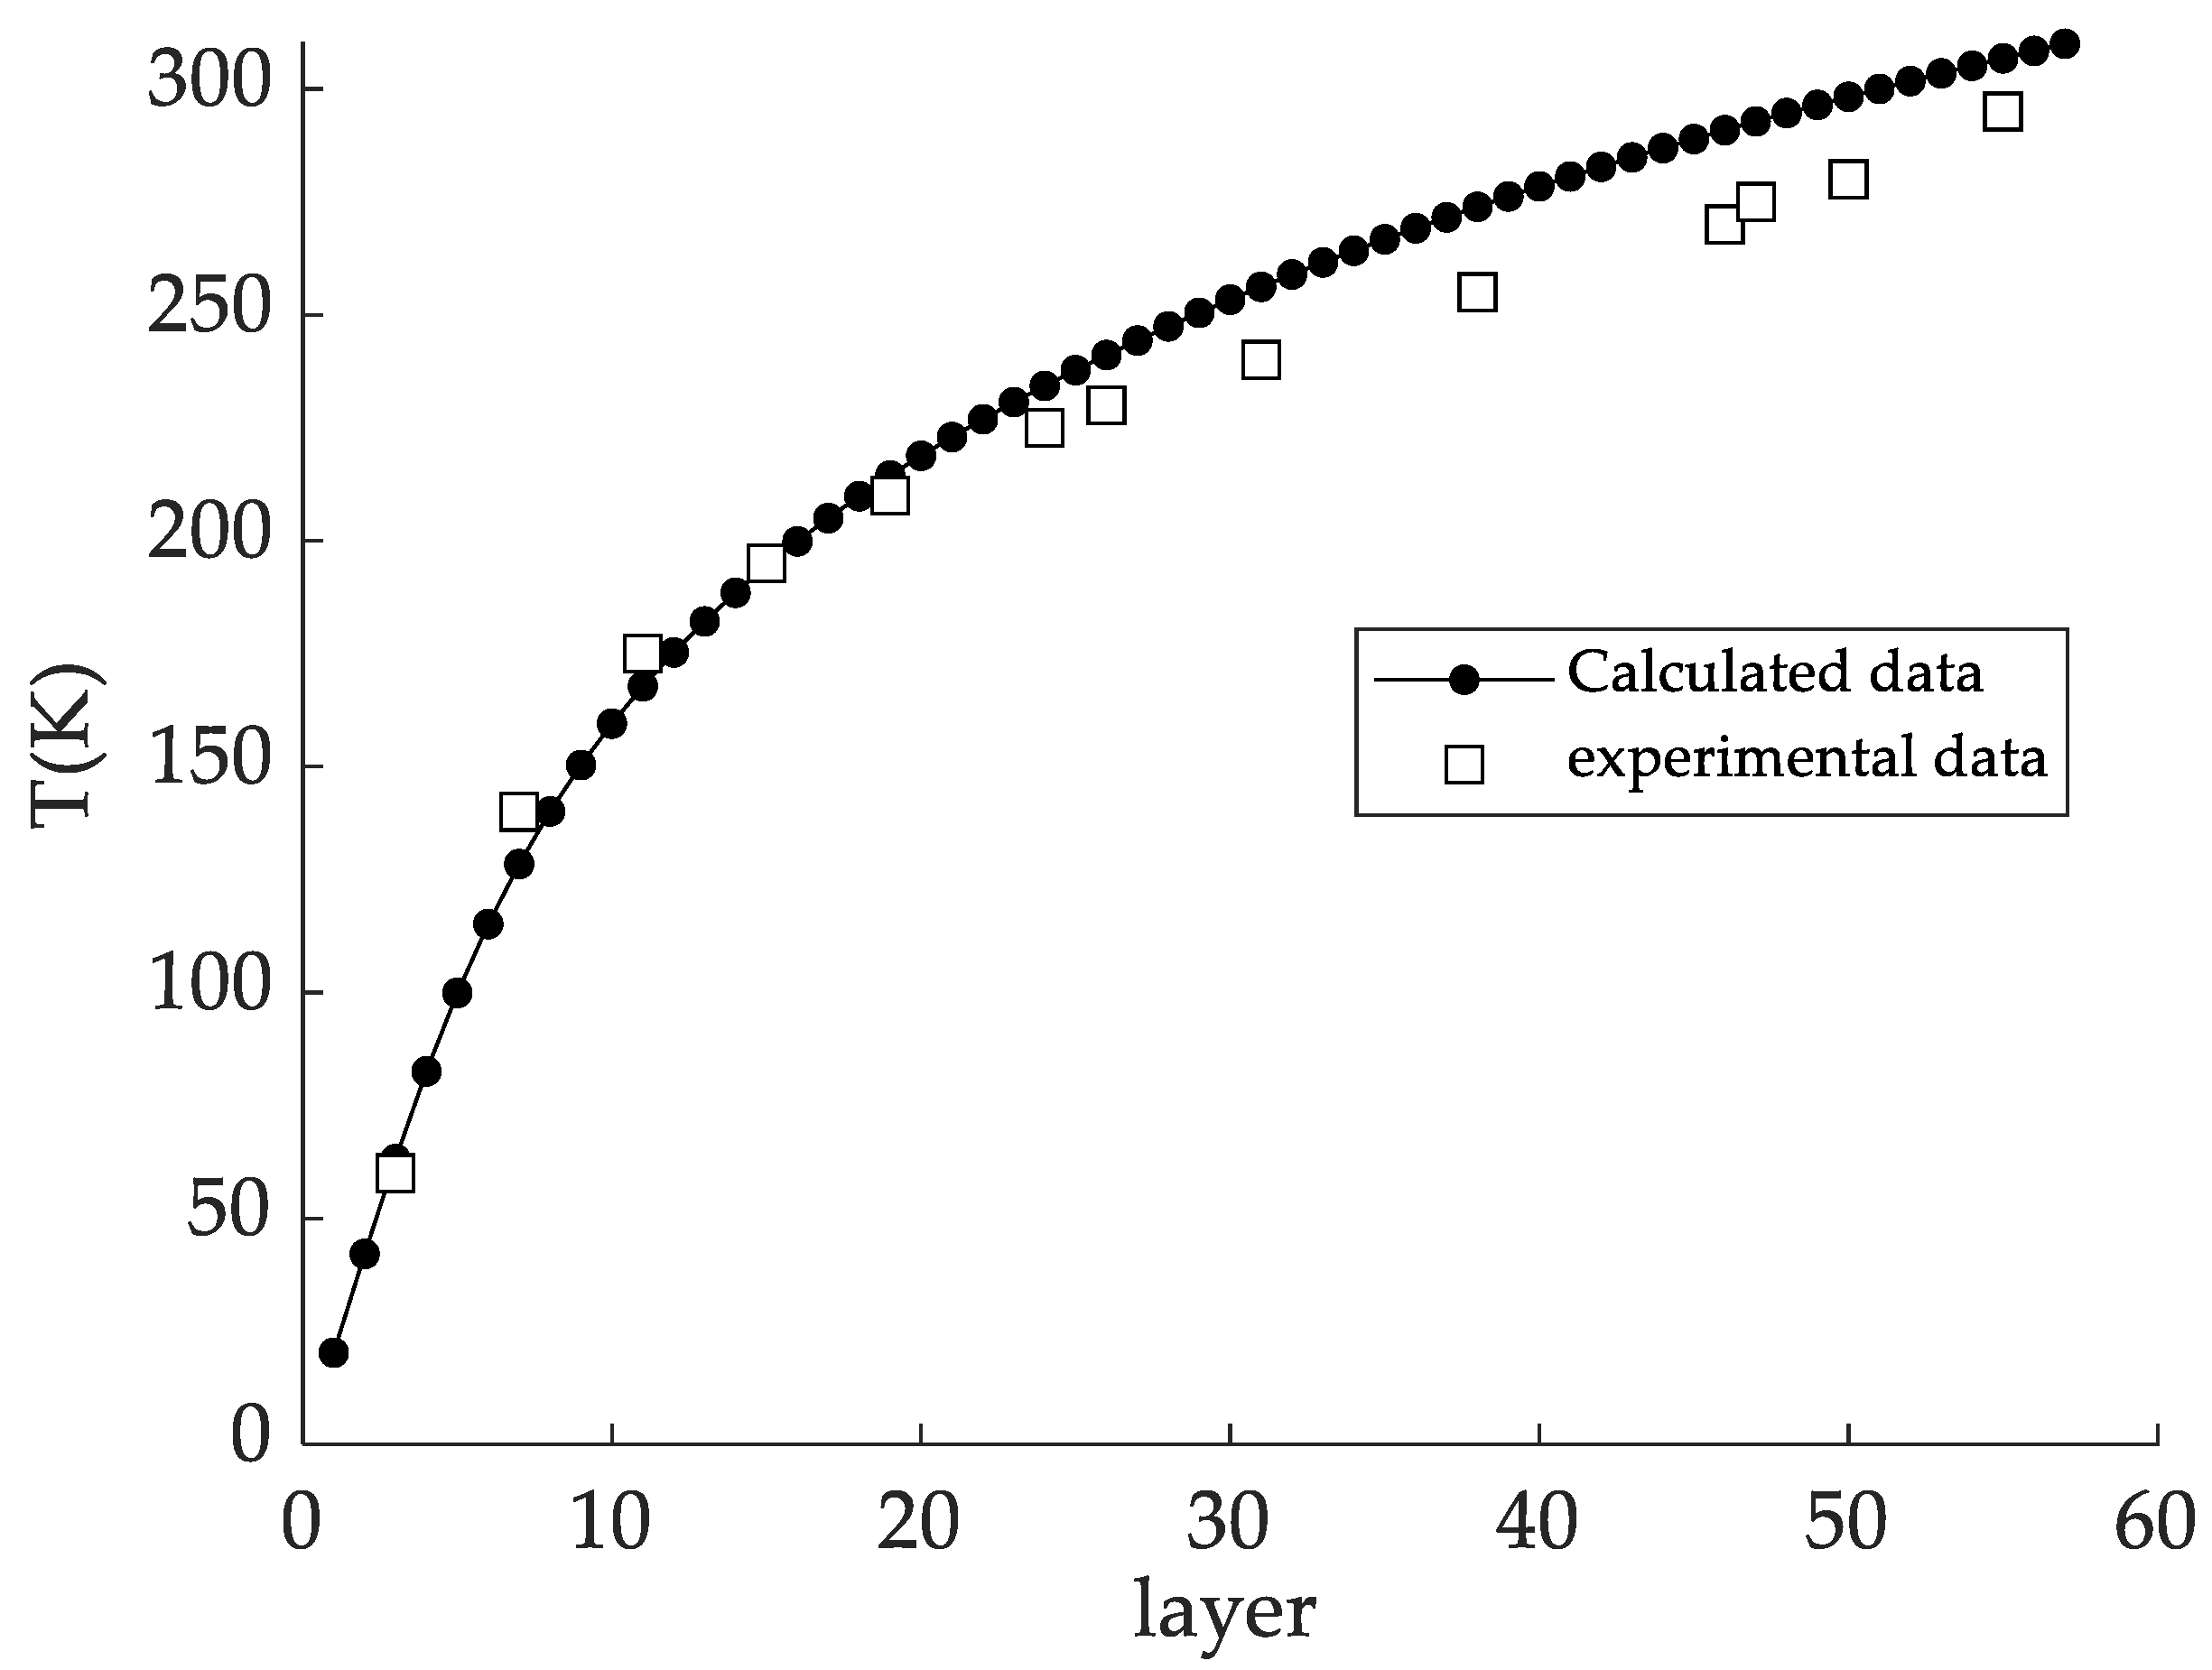
3. Validation of the Configuration Method

To verify the accuracy of the variable-density configuration method, we compared the calculation results of the proposed variable-density configuration method with the experimental results [31] of variable-density multilayer insulation based on liquid hydrogen temperatures. In the experiment, the variable-density configuration method is sub-regional and determines the layer density of each region. In order to obtain three density regions and to conduct the experiments, we determined that the number of layers and the densities of each region were 24 layers and 27 mm-thick for the first region, 22 layers and 25.4 mm-thick for the second region and 10 layers and 4.76 mm thick for the third region. The proposed method of insertion by region uses 4 layers of radiation shields to divide the thickness of a 57.16 mm insulation layer into three regions equally, and the three regions are set to have 23 layers, 21 layers and 8 layers inserted, with a total of 56 layers of radiation shields for calculation. Figure 4 shows a comparison of the temperature distributions between the calculated values and the experimental test values. Using this figure, one can see that the calculated values of the insertion by region configuration method fit well with the experimental values, and the temperature distribution shows some discrepancies only after 30 layers. The calculated heat flux is 0.2152 W/m2, which has an error of 1.5% with the experimental heat flux of 0.212 W/m2. Therefore, the variable-density configuration method based on the control variable method and the insertion by region method is accurate and can be used for subsequent research.

4. Results and Discussion

In order to study the influence of each factor on the insulation performance of a multilayer insulation structure at liquid hydrogen temperatures, we took the cold boundary of 20 K as an example. We assumed that the multilayer insulation structure had a uniform-layer density of 20 layers per cm. We calculated the magnitude of the heat flux and the variation in the heat flux with layer position separately for different numbers of layers, thermal boundary temperatures, vacuums, and variable densities.

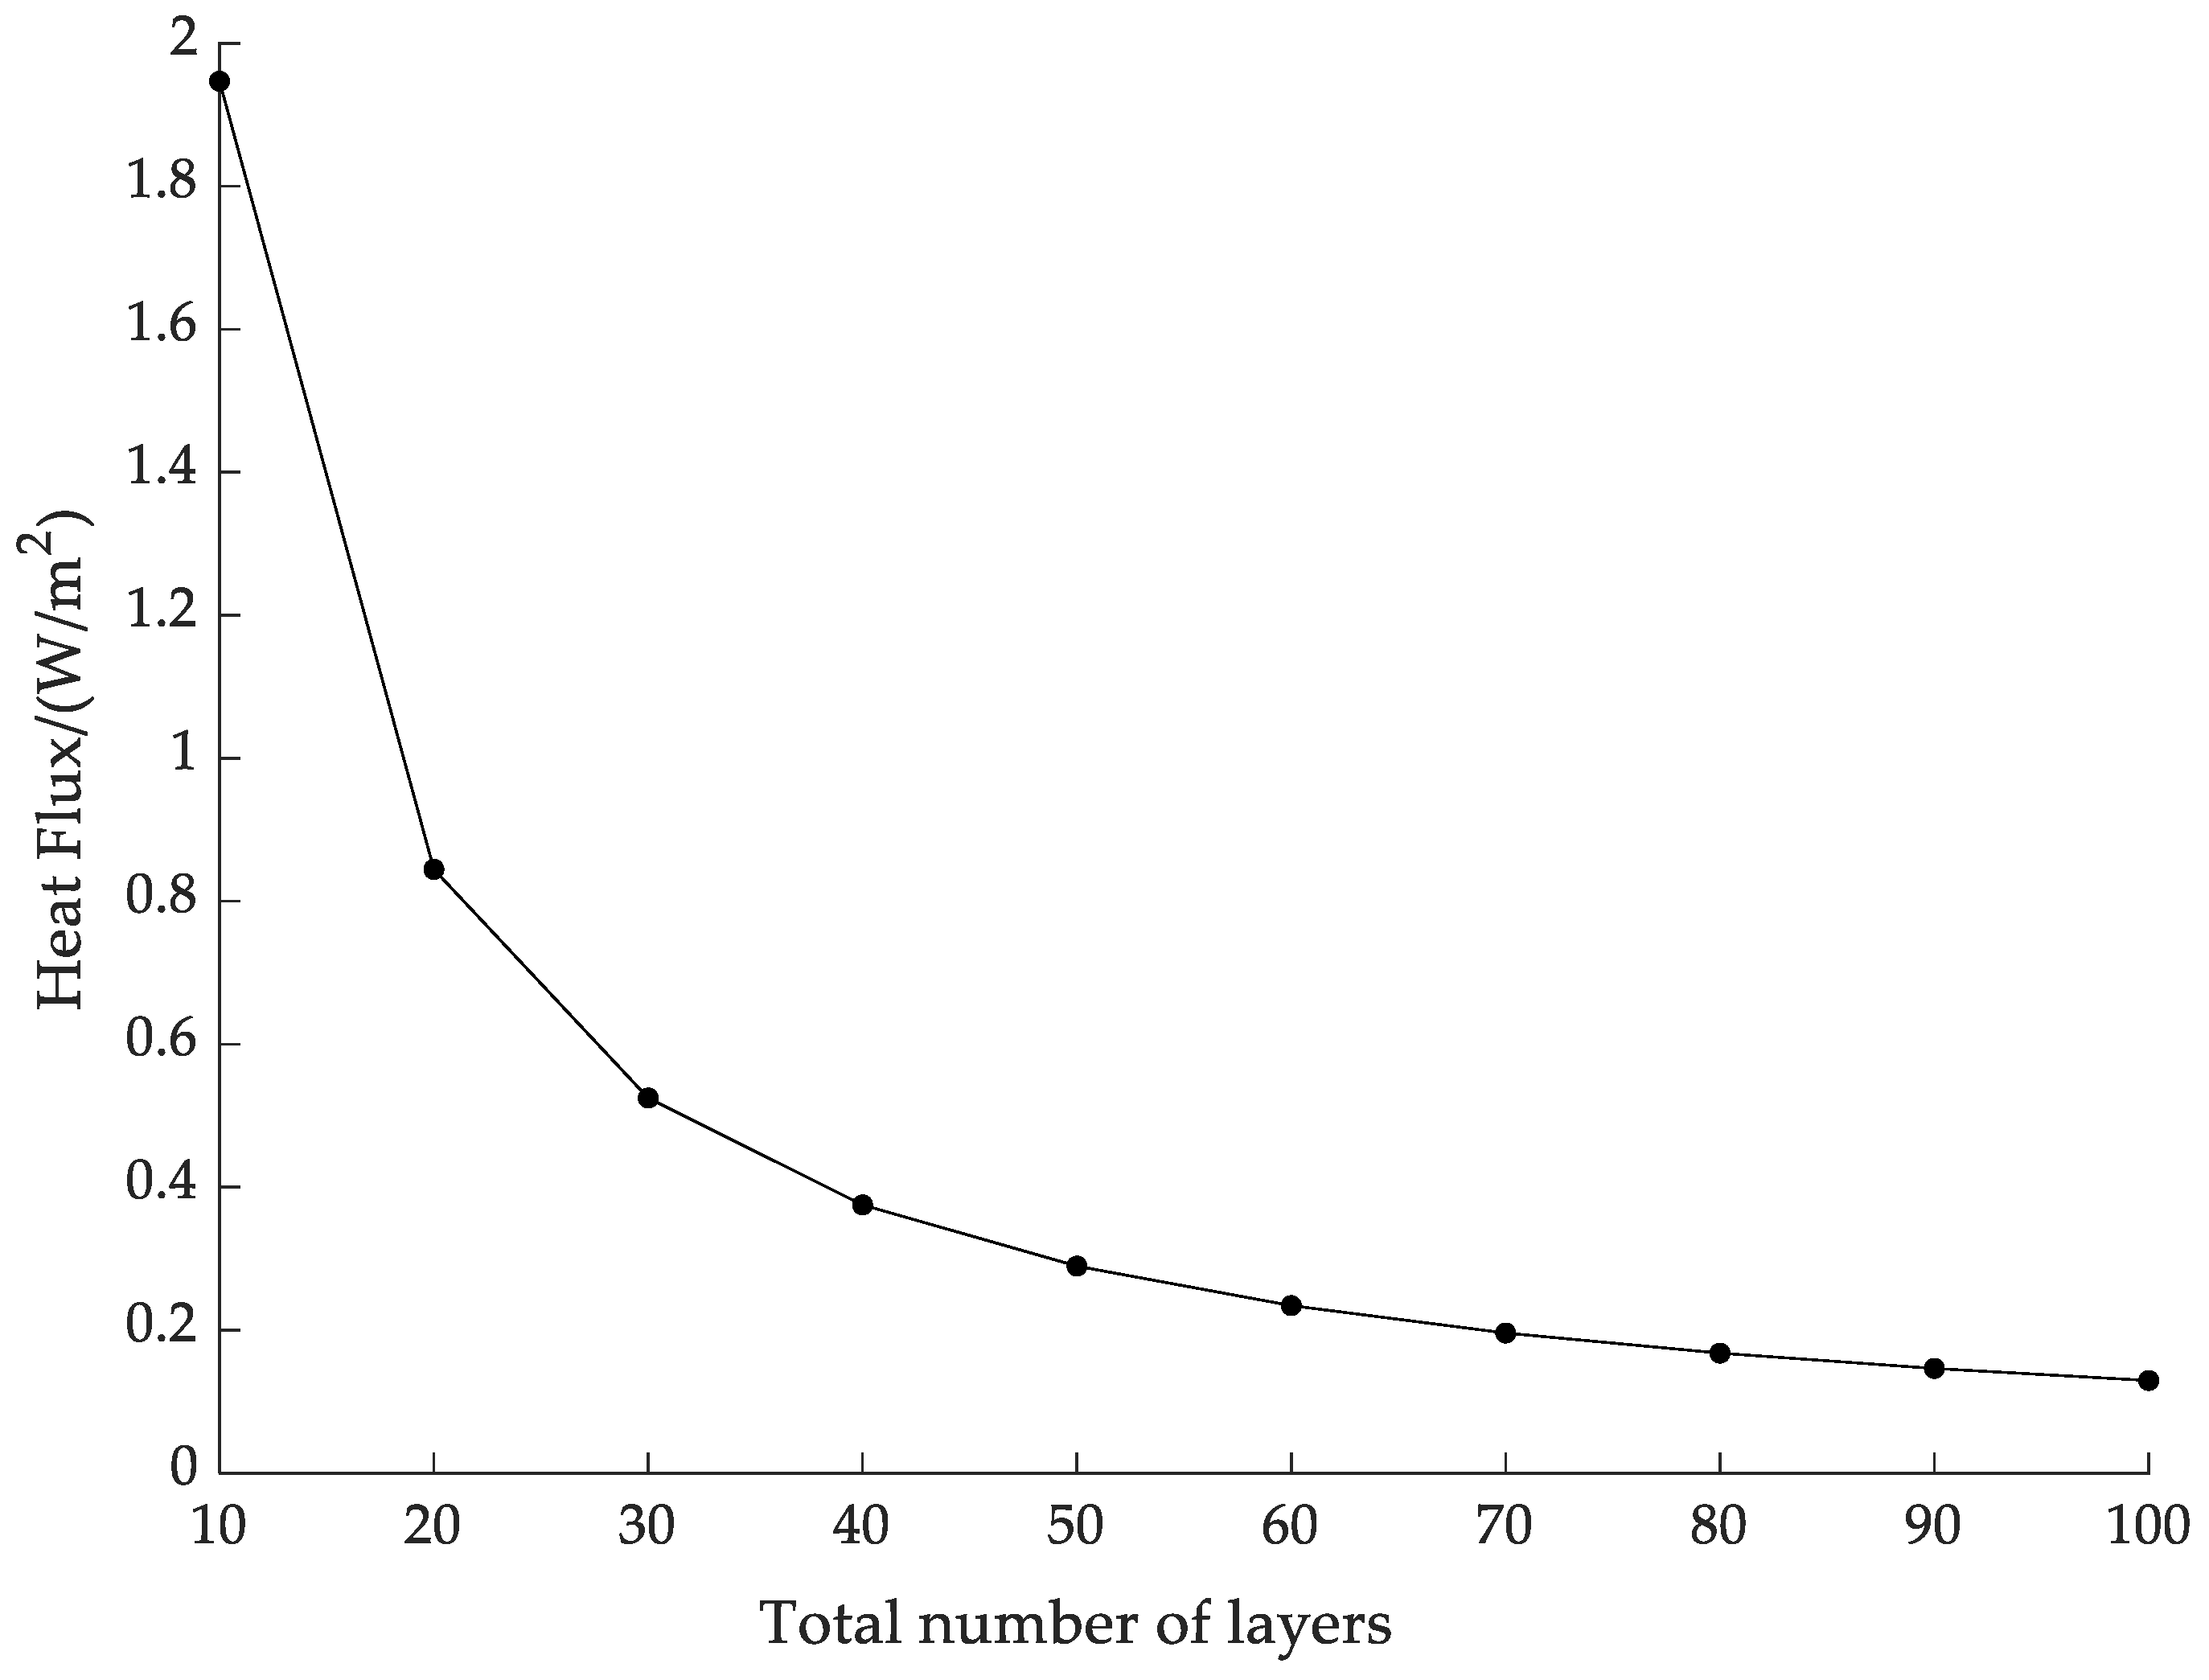
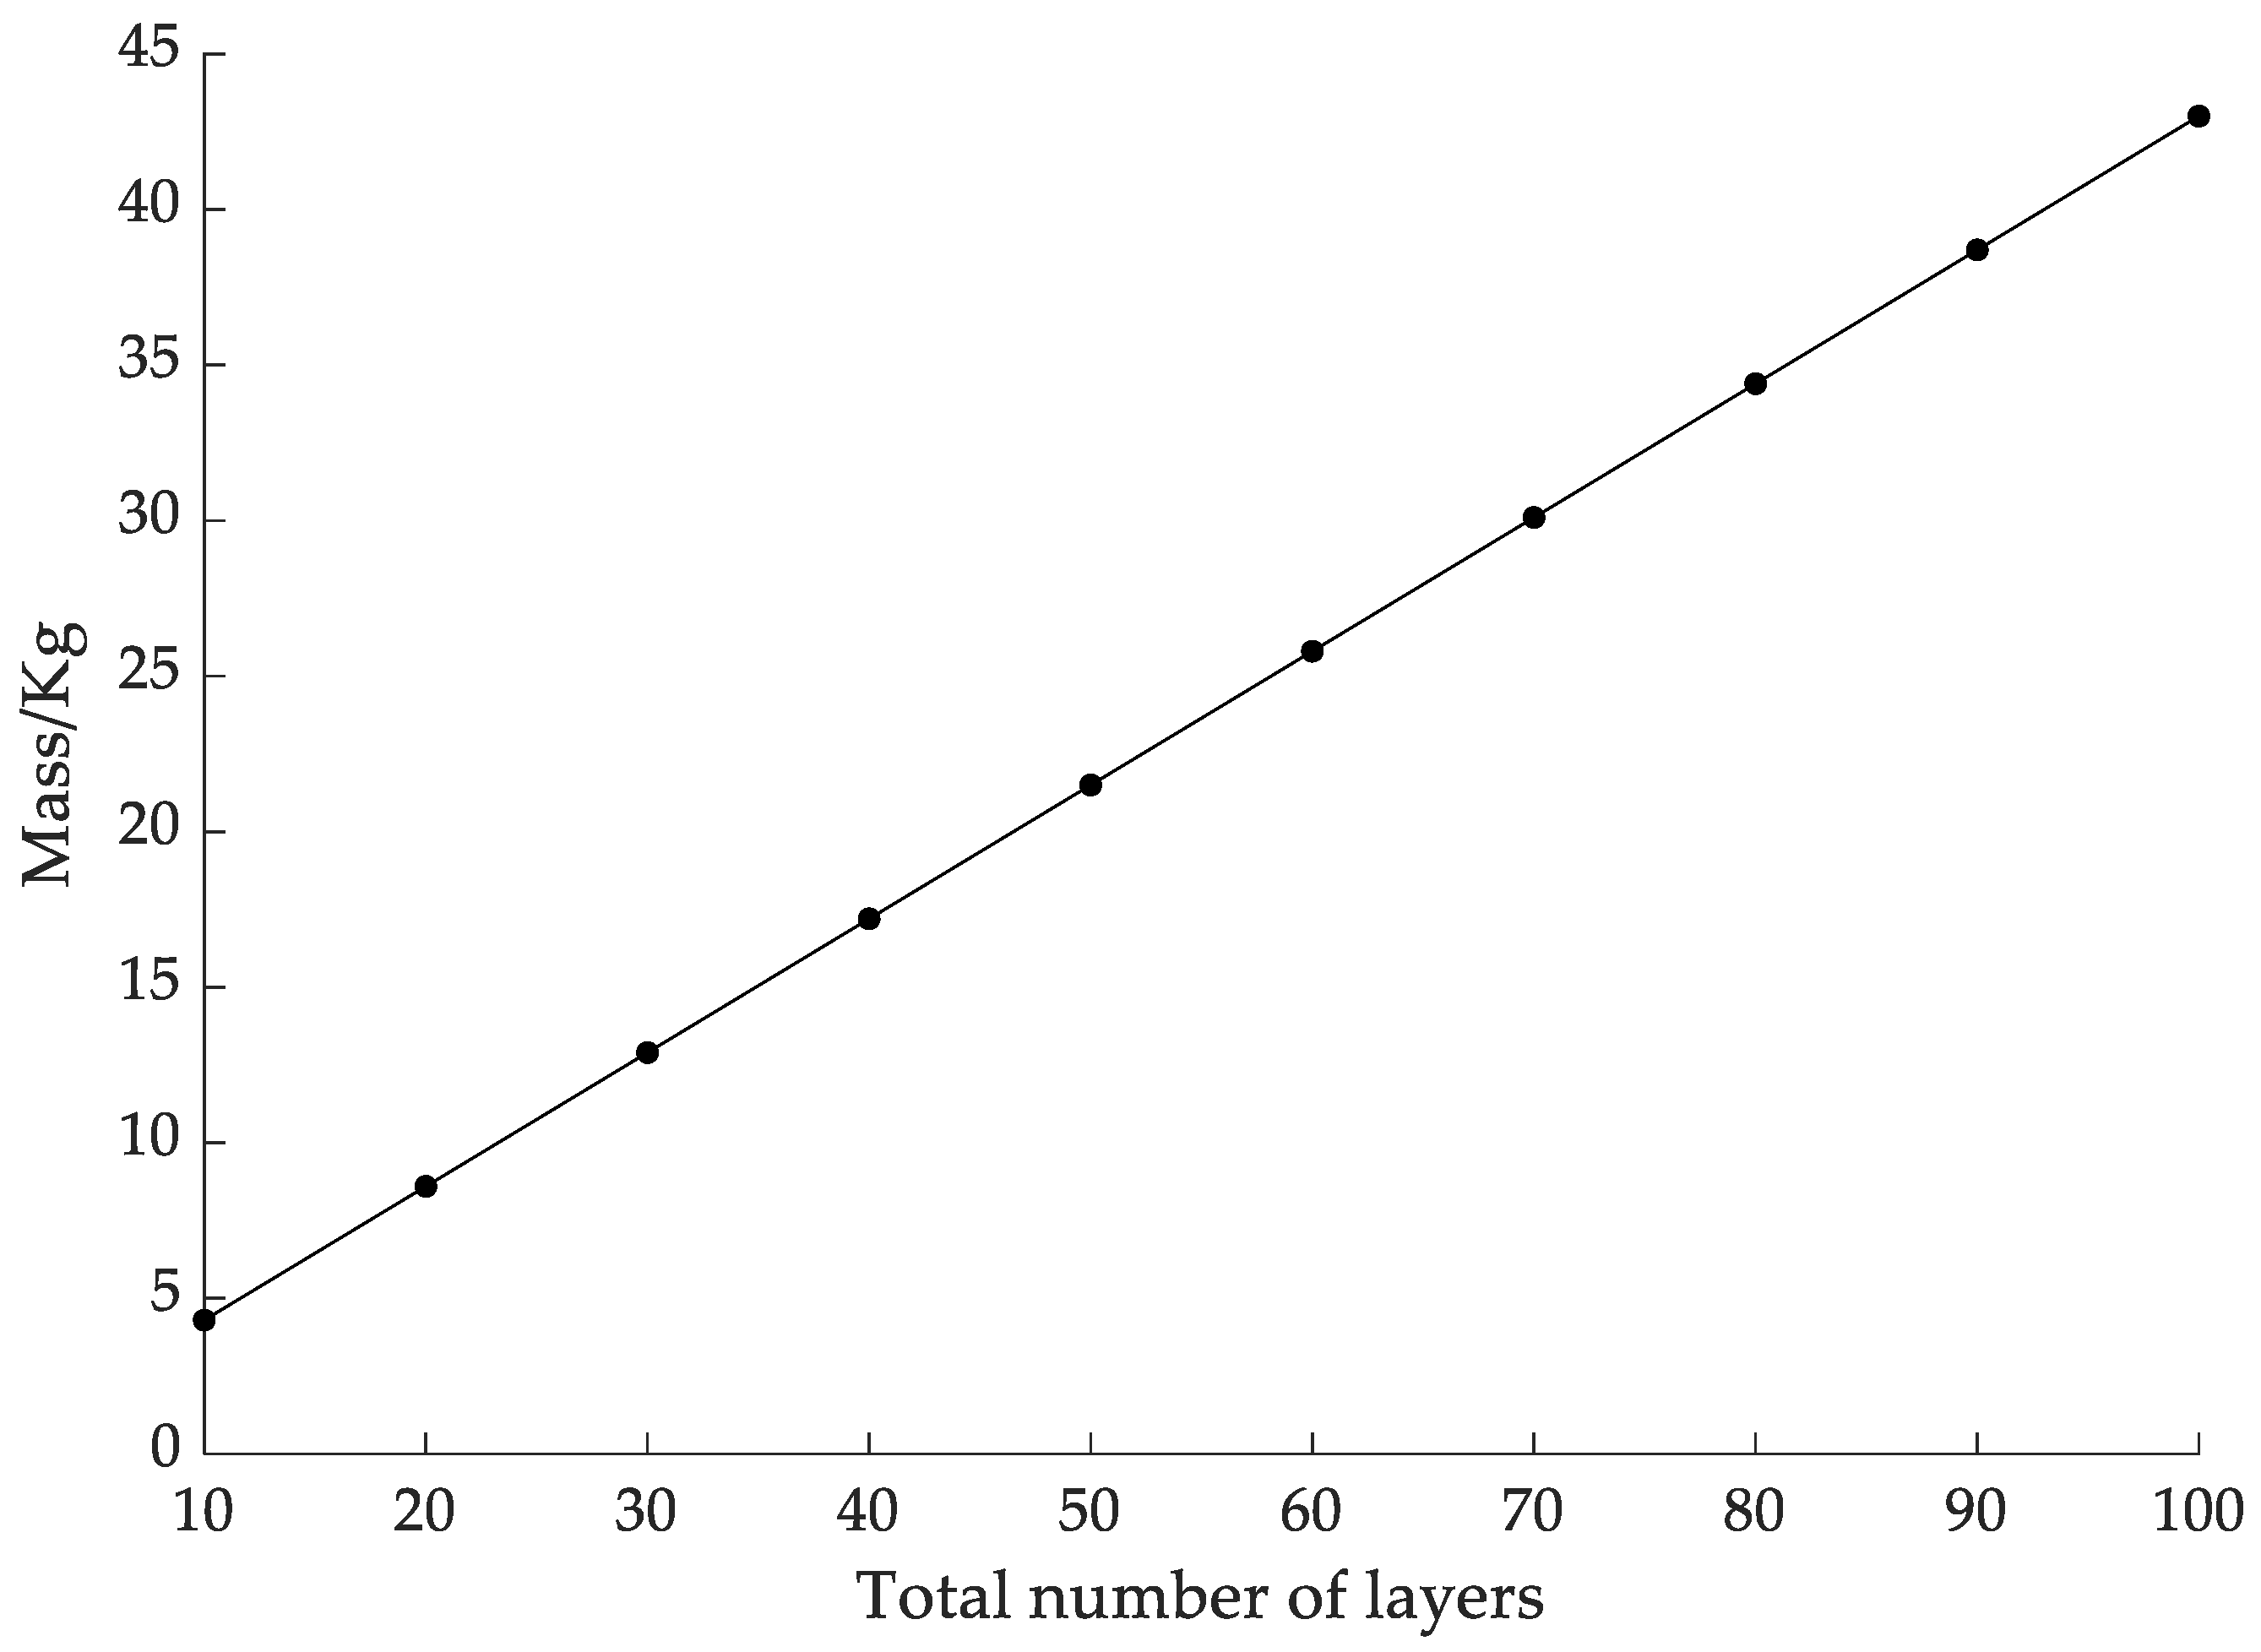
4.1. Effect of the Total Number of Layers on Heat Flux Density

To study the influence of the total number of layers on the thermal insulation performance, we increased the total number of layers from 10 to 100 layers with 10 as the step length, and then we calculated the change in the heat flux. Figure 5 shows the variation in the heat flux when the total number of layers increases from 10 to 100 layers. Using this figure, one can see that the heat flux decreases gradually with increases in the total number of layers, especially upon being increased from 10 to 30 layers. The heat flux decreases obviously from 1.947 W/m2 to 0.5246 W/m2, but when the total number of layers increases to 50 layers, the heat flux tends to decline more gently. When the total number of layers is 60, the heat flux is only 0.0542 W/m2 less than that of 50 layers. In addition to this, the total mass of the multilayer insulation structure changes as the number of layers increases. Figure 6 shows the variation in the total mass of the insulation structure when the total number of layers increases from 10 to 100 layers. Using this figure, one can see that, the more insulation layers there are, the greater the total mass of the insulation. Therefore, the number of radiation shields is not necessarily better as it increases, so it needs to be selected according to the specific situation.
Because the heat flux has no obvious change after the total number of layers increases to 50, we calculated the effect of a vacuum and the thermal boundary temperature on the performance of multilayer insulation structures using a multilayer insulation structure with a total of 50 layers as an example.

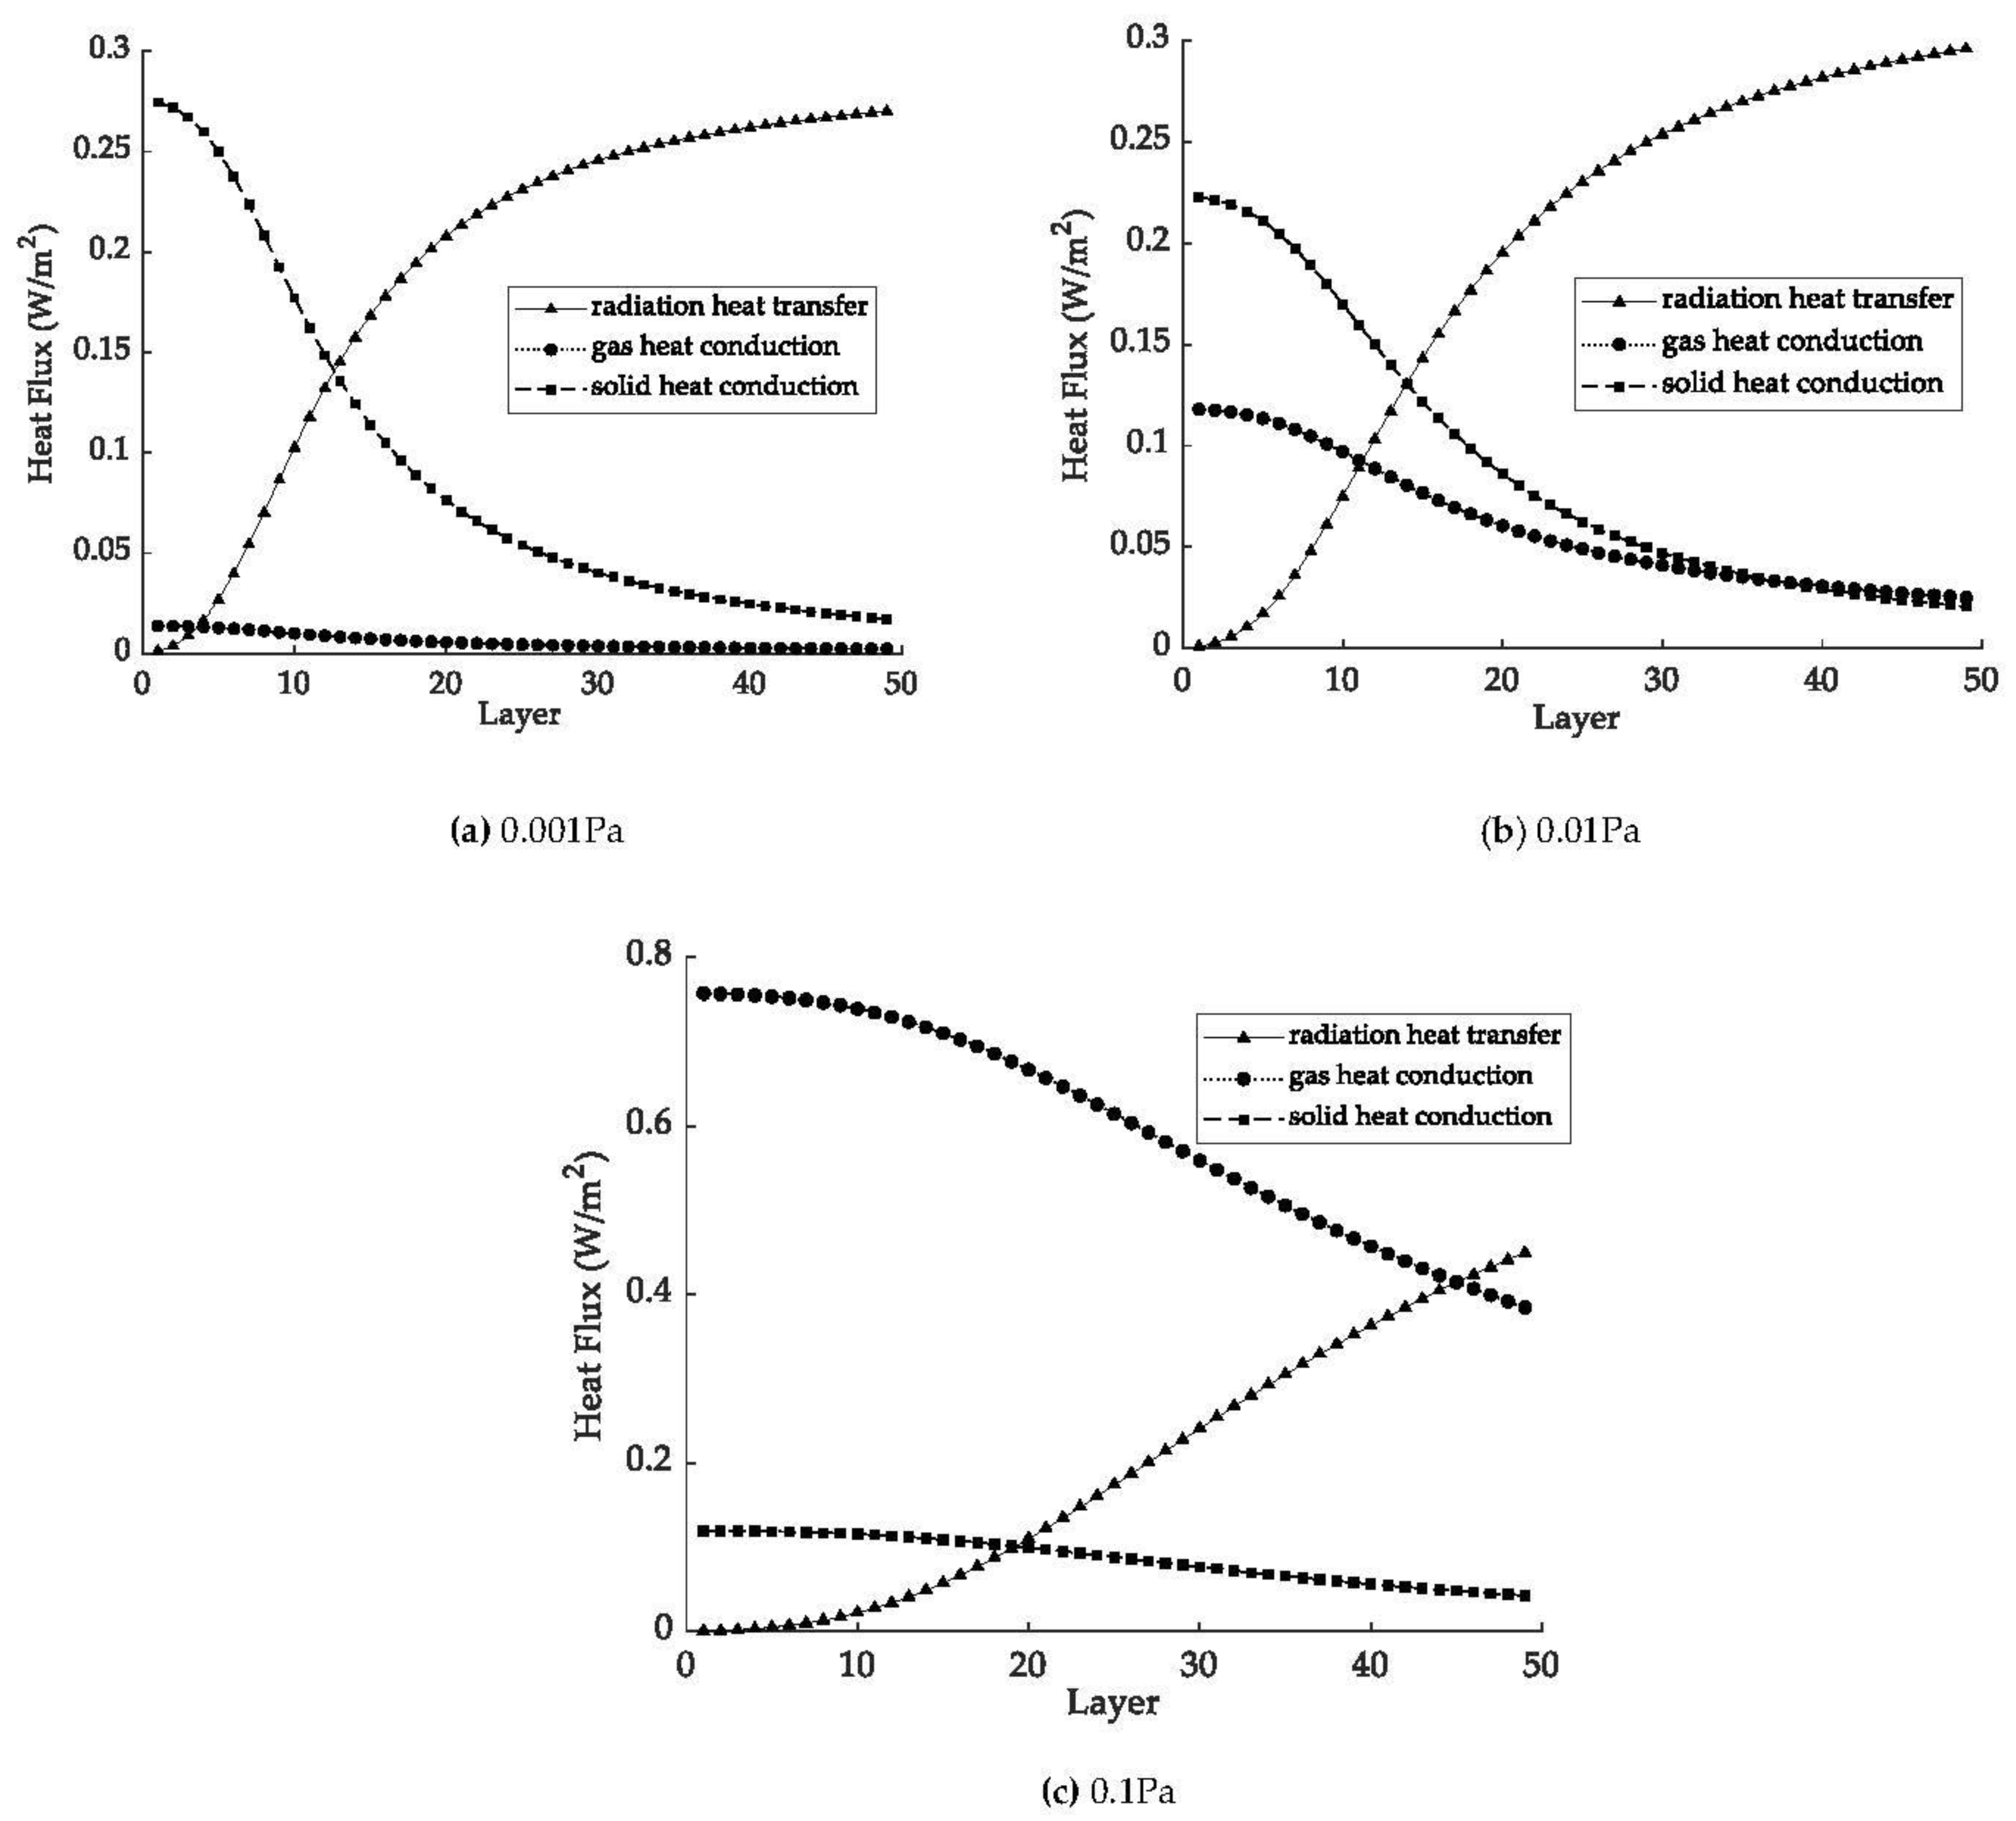
4.2. Effect of a Vacuum on Heat Flux

To study the effect of a vacuum on the insulation performance, we increased the residual gas pressure in the multilayer insulation structure from 10−4 Pa to 1 Pa, and then we calculated the change in the heat flux. Figure 7 shows the change in the heat flux when the residual gas pressure increases from 10−4 Pa to 1 Pa. Using this figure, one can see that, as the pressure increases, the heat flux increases. During the period from 10−4 Pa to 0.01 Pa, the heat flux has no obvious change, rising from 0.2844 W/m2 to 0.3416 W/m2. However, when the pressure exceeds 0.01 Pa, the heat flux changes significantly, and the heat flux at 0.1 Pa is 0.8772 W/m2, which is about 2.5 times that at 10−2 Pa. Thus, the vacuum environment can be considered to have been lost. When the pressure is 1 Pa, the heat flux rises directly up to 6.276 W/m2. Therefore, the pressure should be controlled below 0.01 Pa and preferably not more than 10−3 Pa, in which case the residual gas heat conduction can be ignored.
Figure 8 shows the change in the heat flux for the heat transfer in different layer positions when the pressure is 10−3 Pa, 0.01 Pa and 0.1 Pa. Using this figure, one can see that, when the vacuum environment is lost (0.1 Pa), changes in the heat flux with layer position are relatively flat compared with those of the vacuum environment (10−3 Pa). Gas heat conduction has become the main heat transfer method, and residual gas heat conduction cannot be ignored. At the region near the cold boundary, the heat flux for the share of radiation heat transfer is always low during changes in pressure, and solid heat conduction primarily occurs. However, when the pressure is 0.1 Pa, gas heat conduction primarily occurs. At the region near the thermal boundary, radiation heat transfer always plays a primary role during changes in pressure. When the pressure changes from 10−3 Pa to 0.1 Pa, gas heat conduction and radiation heat transfer increase, and solid heat conduction decreases. This indicates that changes in the vacuum mainly affect residual gas heat conduction, but it does not have any effect on other heat transfer methods because the influence of residual gas heat conduction indirectly affects the other two heat transfer methods.
After evacuating the multilayer insulation structure, the vacuum of the multilayer structure is not constant because the insulation material releases gas into the vacuum interlayer, which leads to the failure of the vacuum after a long time. Therefore, adsorption materials can be used for adsorption to maintain a good vacuum environment.

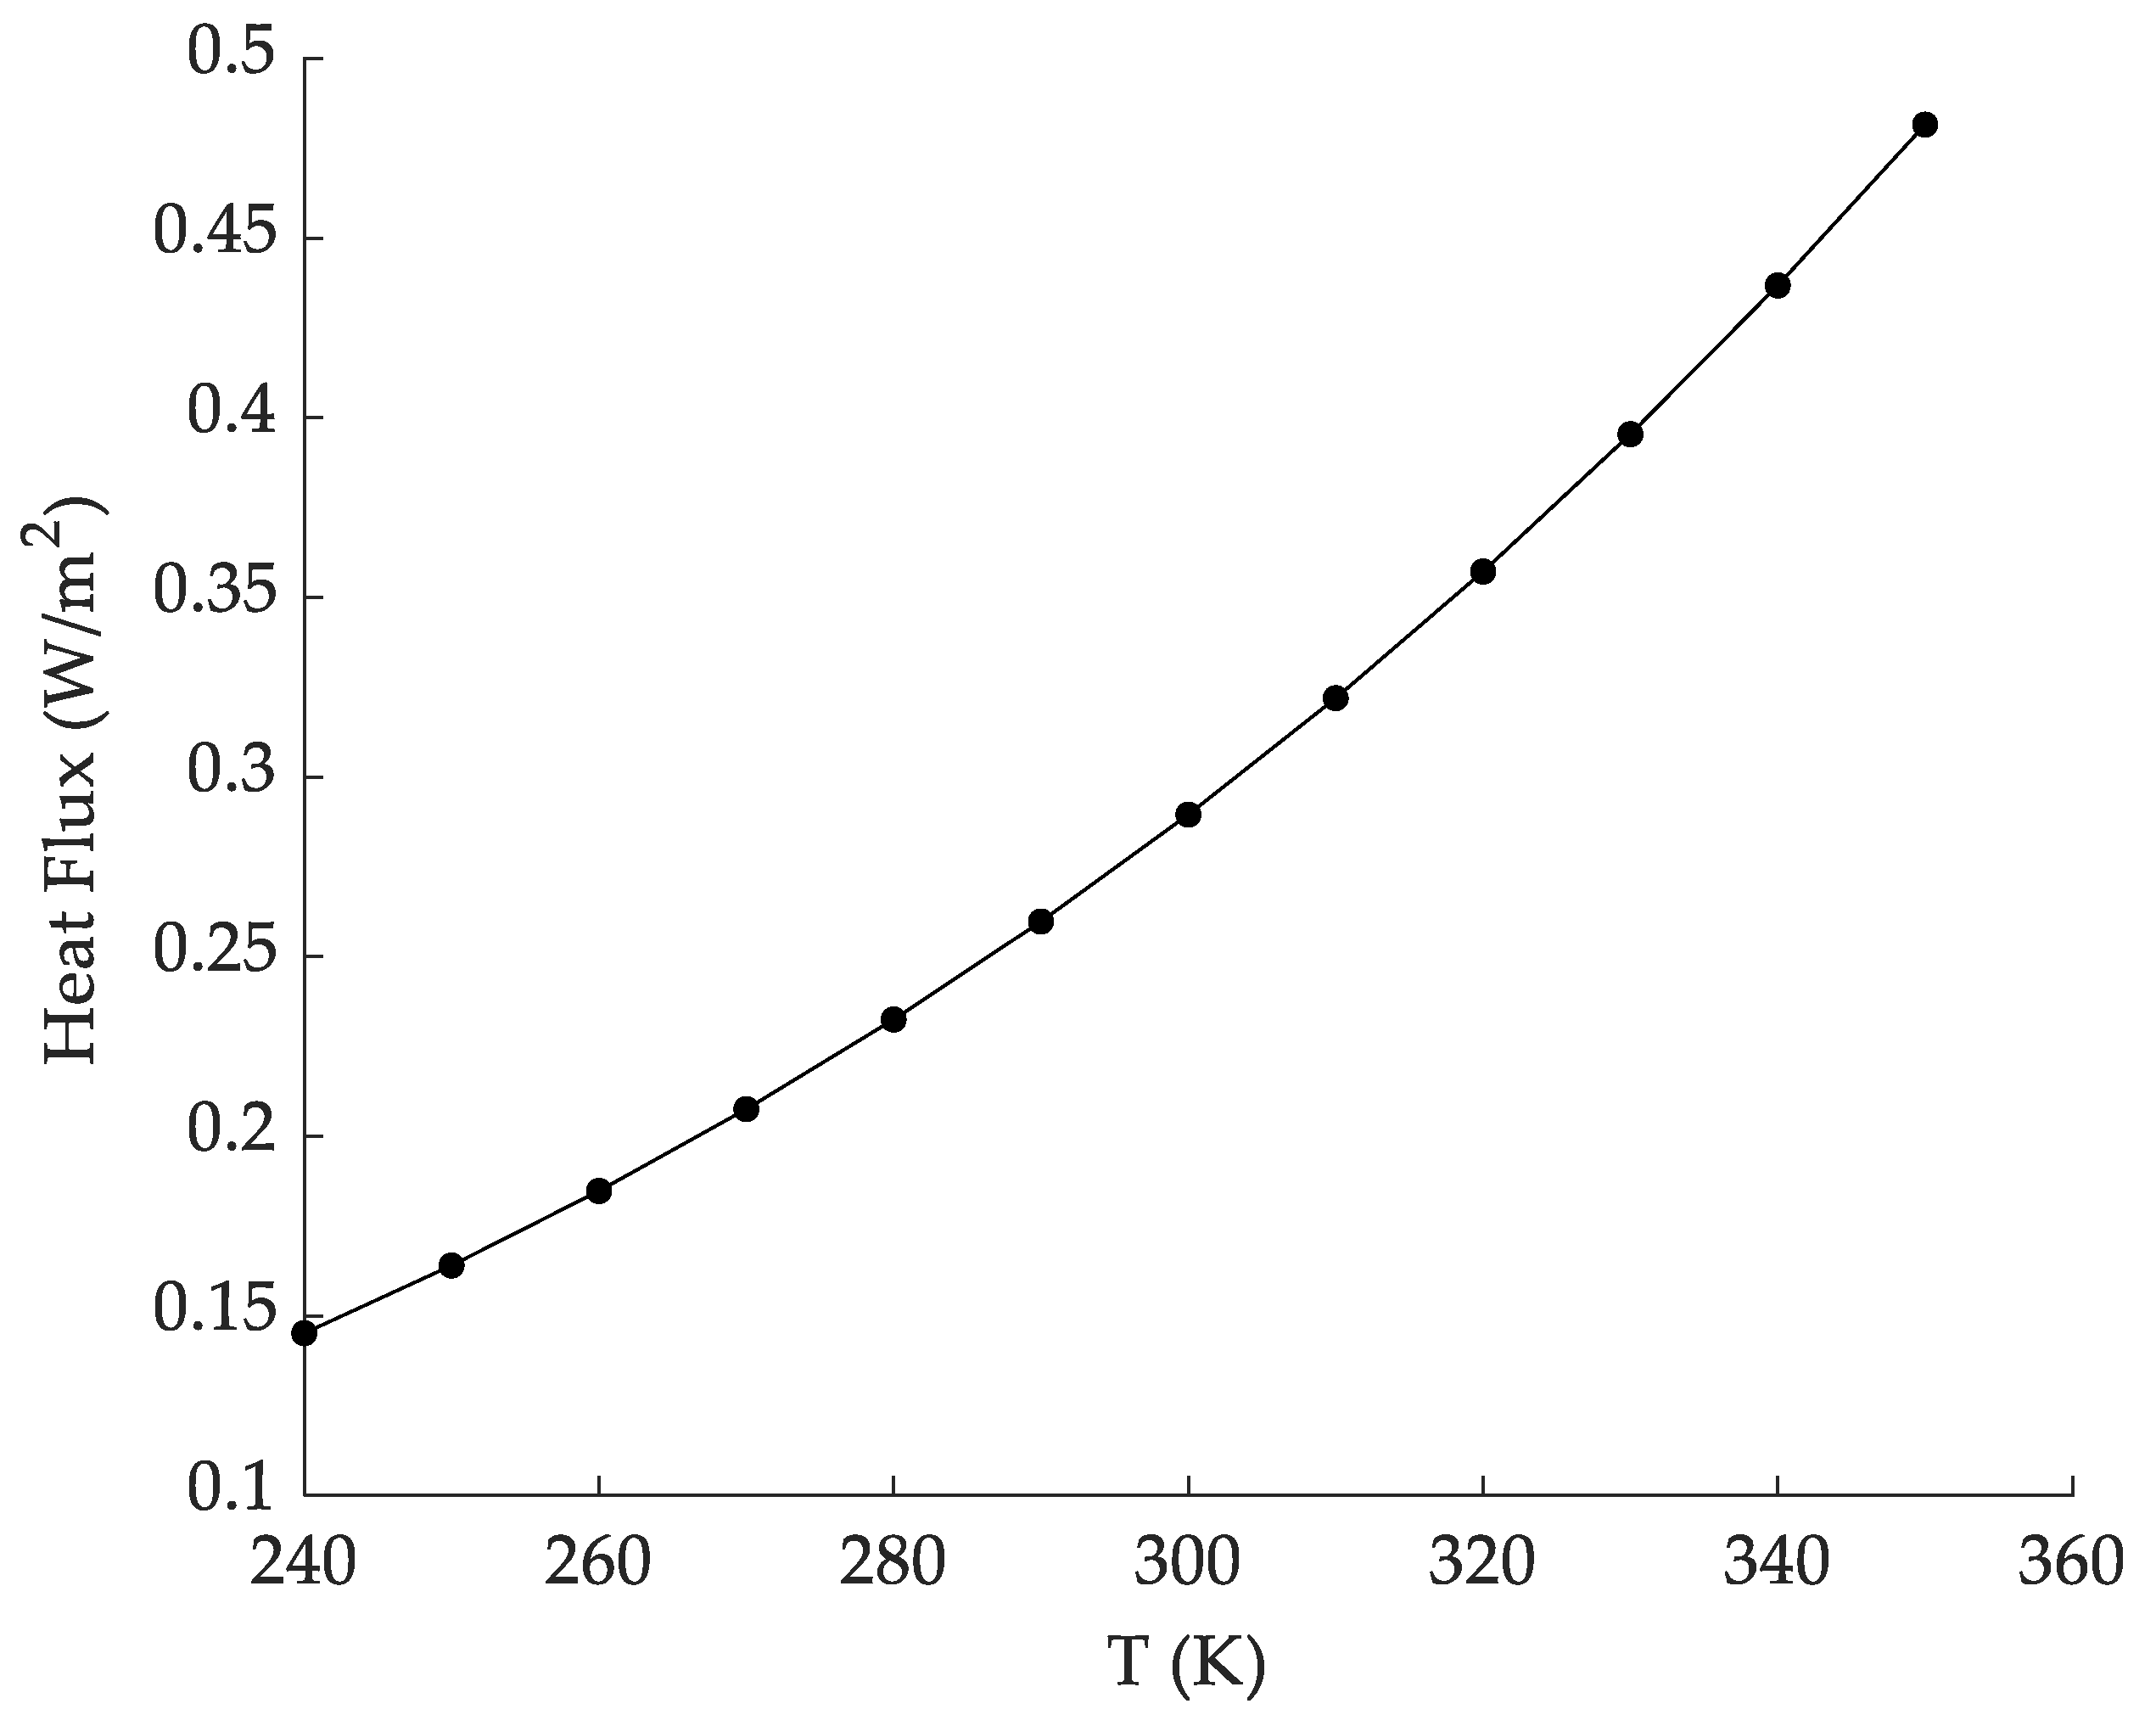
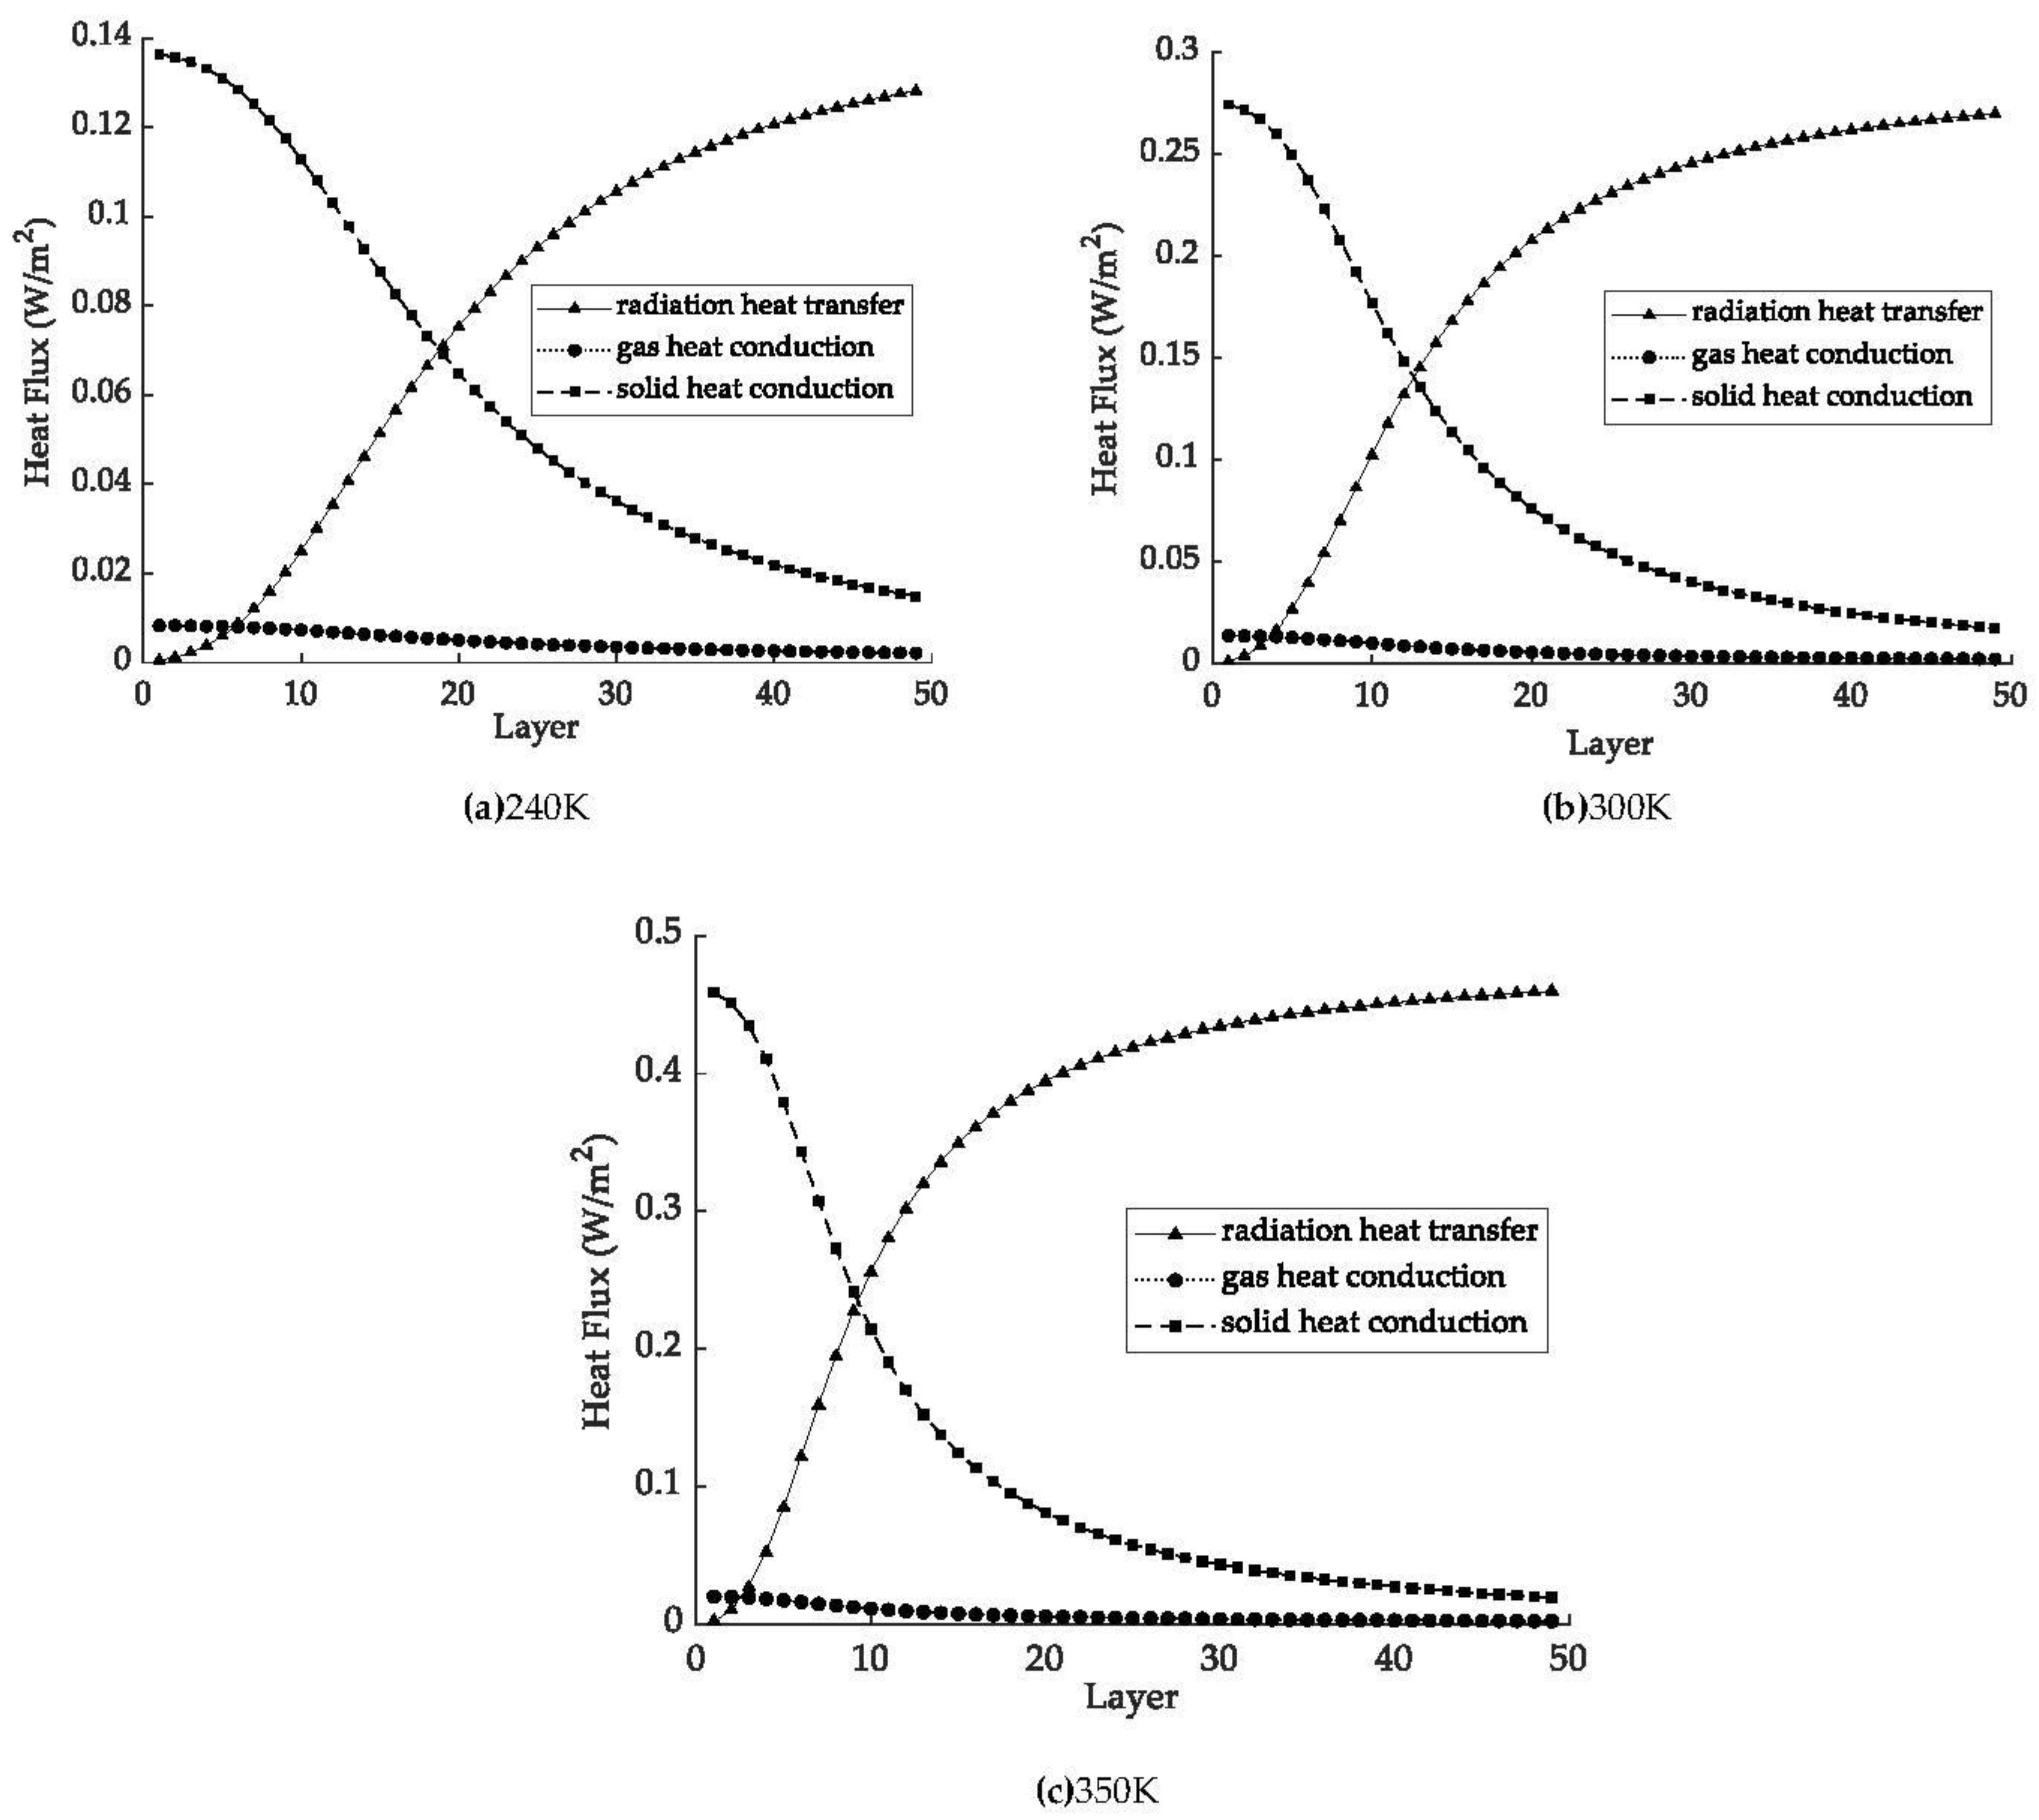
4.3. Effect of the Thermal Boundary Temperature on Heat Flux

To study the influence of the thermal boundary temperature on insulation performance, we increased the temperature from 240 K to 350 K with 10 K as the step length, and we then calculated changes in the heat flux. Figure 9 shows the variation in the heat flux when the thermal boundary temperature increases from 240 K to 350 K. Using this figure, one can see that the heat flux increases with increases in the thermal boundary temperature from 0.1452 W/m2 at 240 K to 0.4816 W/m2 at 350 K. This indicates that the heat flux is greatly affected by the thermal boundary temperature, and it has an upward trend instead of a linear increase. This is because radiation heat transfer is the main heat transfer path in vacuum multilayer insulation structures, and radiation heat transfer is mainly affected by temperature.
Figure 10 shows the change in the heat flux for the heat transfer in different layer positions when the thermal boundary temperature is 240 K, 300 K, and 350 K. Using this figure, one can see that, regardless of whether the thermal boundary temperature is 240 K, 300 K, or 350 K, in the region near the cold boundary, the radiation heat transfer heat flux increases rapidly first and then rises gently, the solid heat conduction heat flux decreases rapidly first and then decreases gently, and the residual gas heat conduction heat flux has almost no change. This indicates that, near the cold boundary, solid heat conduction is the main heat transfer method. In addition, near the thermal boundary, radiation heat transfer is the main heat transfer method. With increases in the thermal boundary temperature, the layer positions of the main regions where the radiation heat flux and the solid heat flux change also change. As the temperature of the thermal boundary increases, the layer position of the rising and falling area comes closer to the cold boundary, and the variation in the heat flux also flattens out closer to the cold boundary. In other words, as the thermal boundary temperature increases, the proportion of the radiation heat flux in the total heat flux becomes higher, and the radiation heat transfer is mainly affected by the boundary temperature. From the above analysis, one can see that, near the cold boundary, solid heat conduction primarily occurs, and near the thermal boundary, radiation heat mainly occurs. Therefore, when the variable-density configuration is adopted, the number of radiation shields near the cold boundary area should be reduced, and the number of radiation shields near the thermal boundary area should be increased.

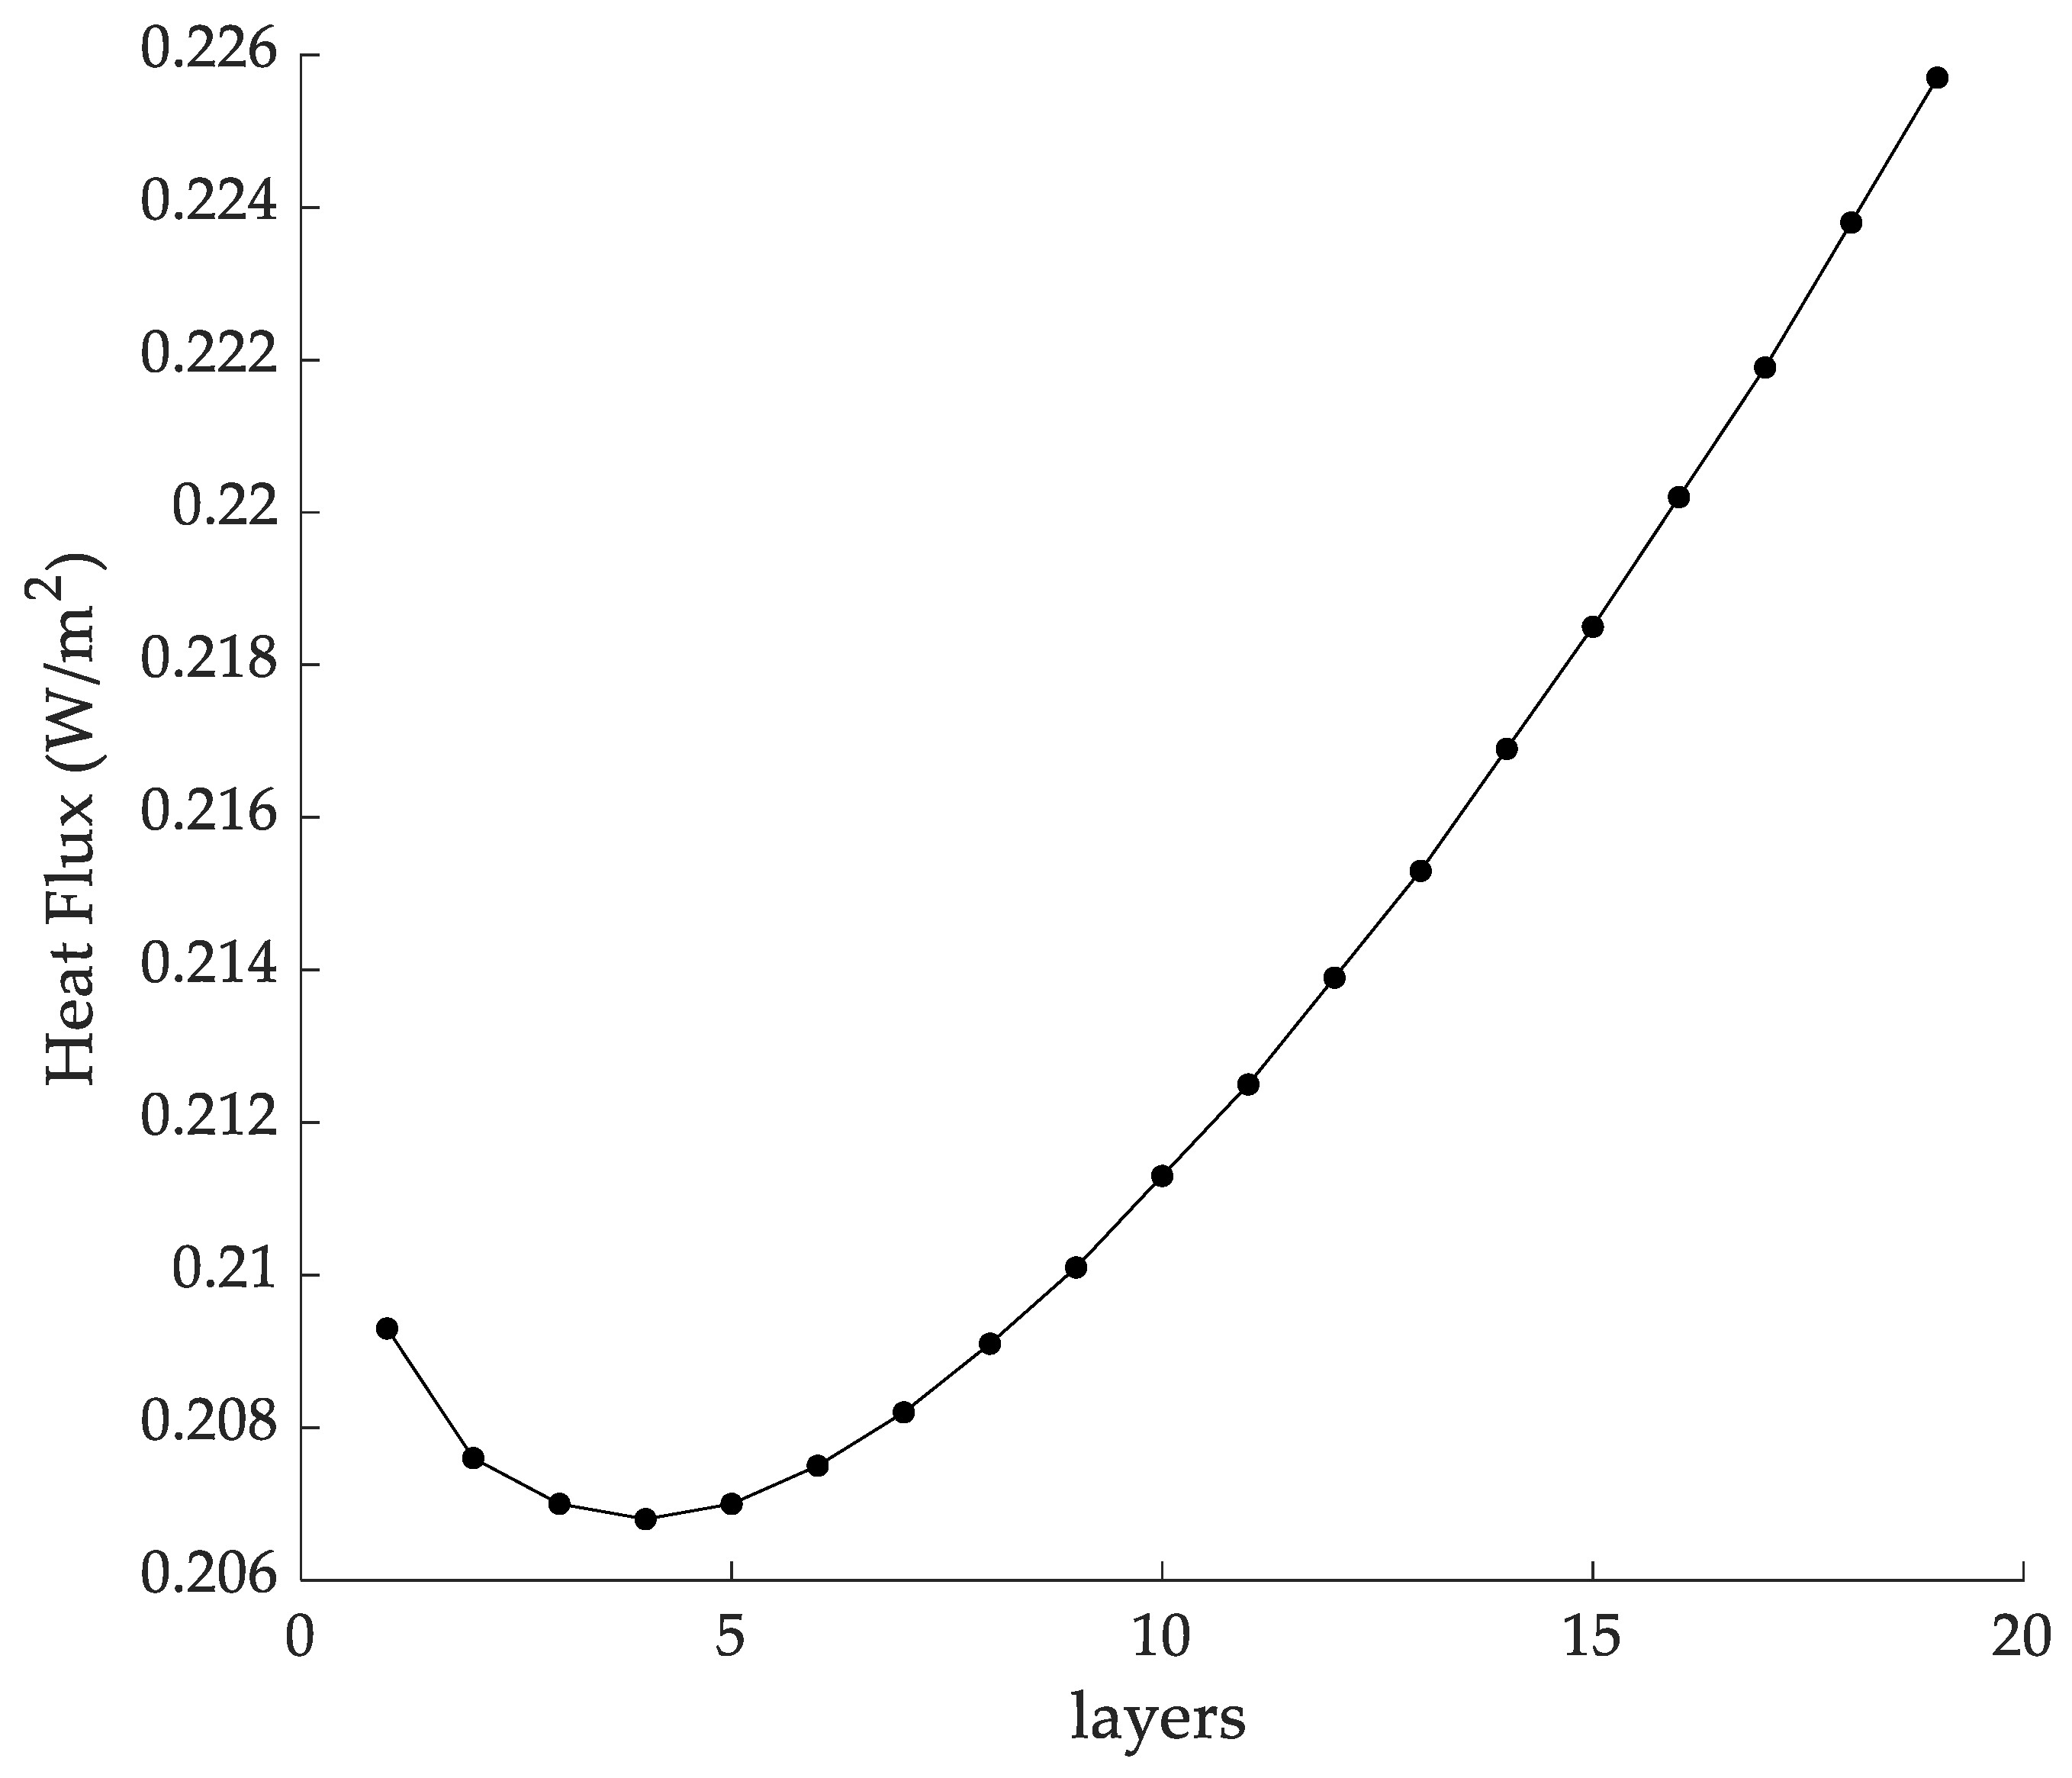
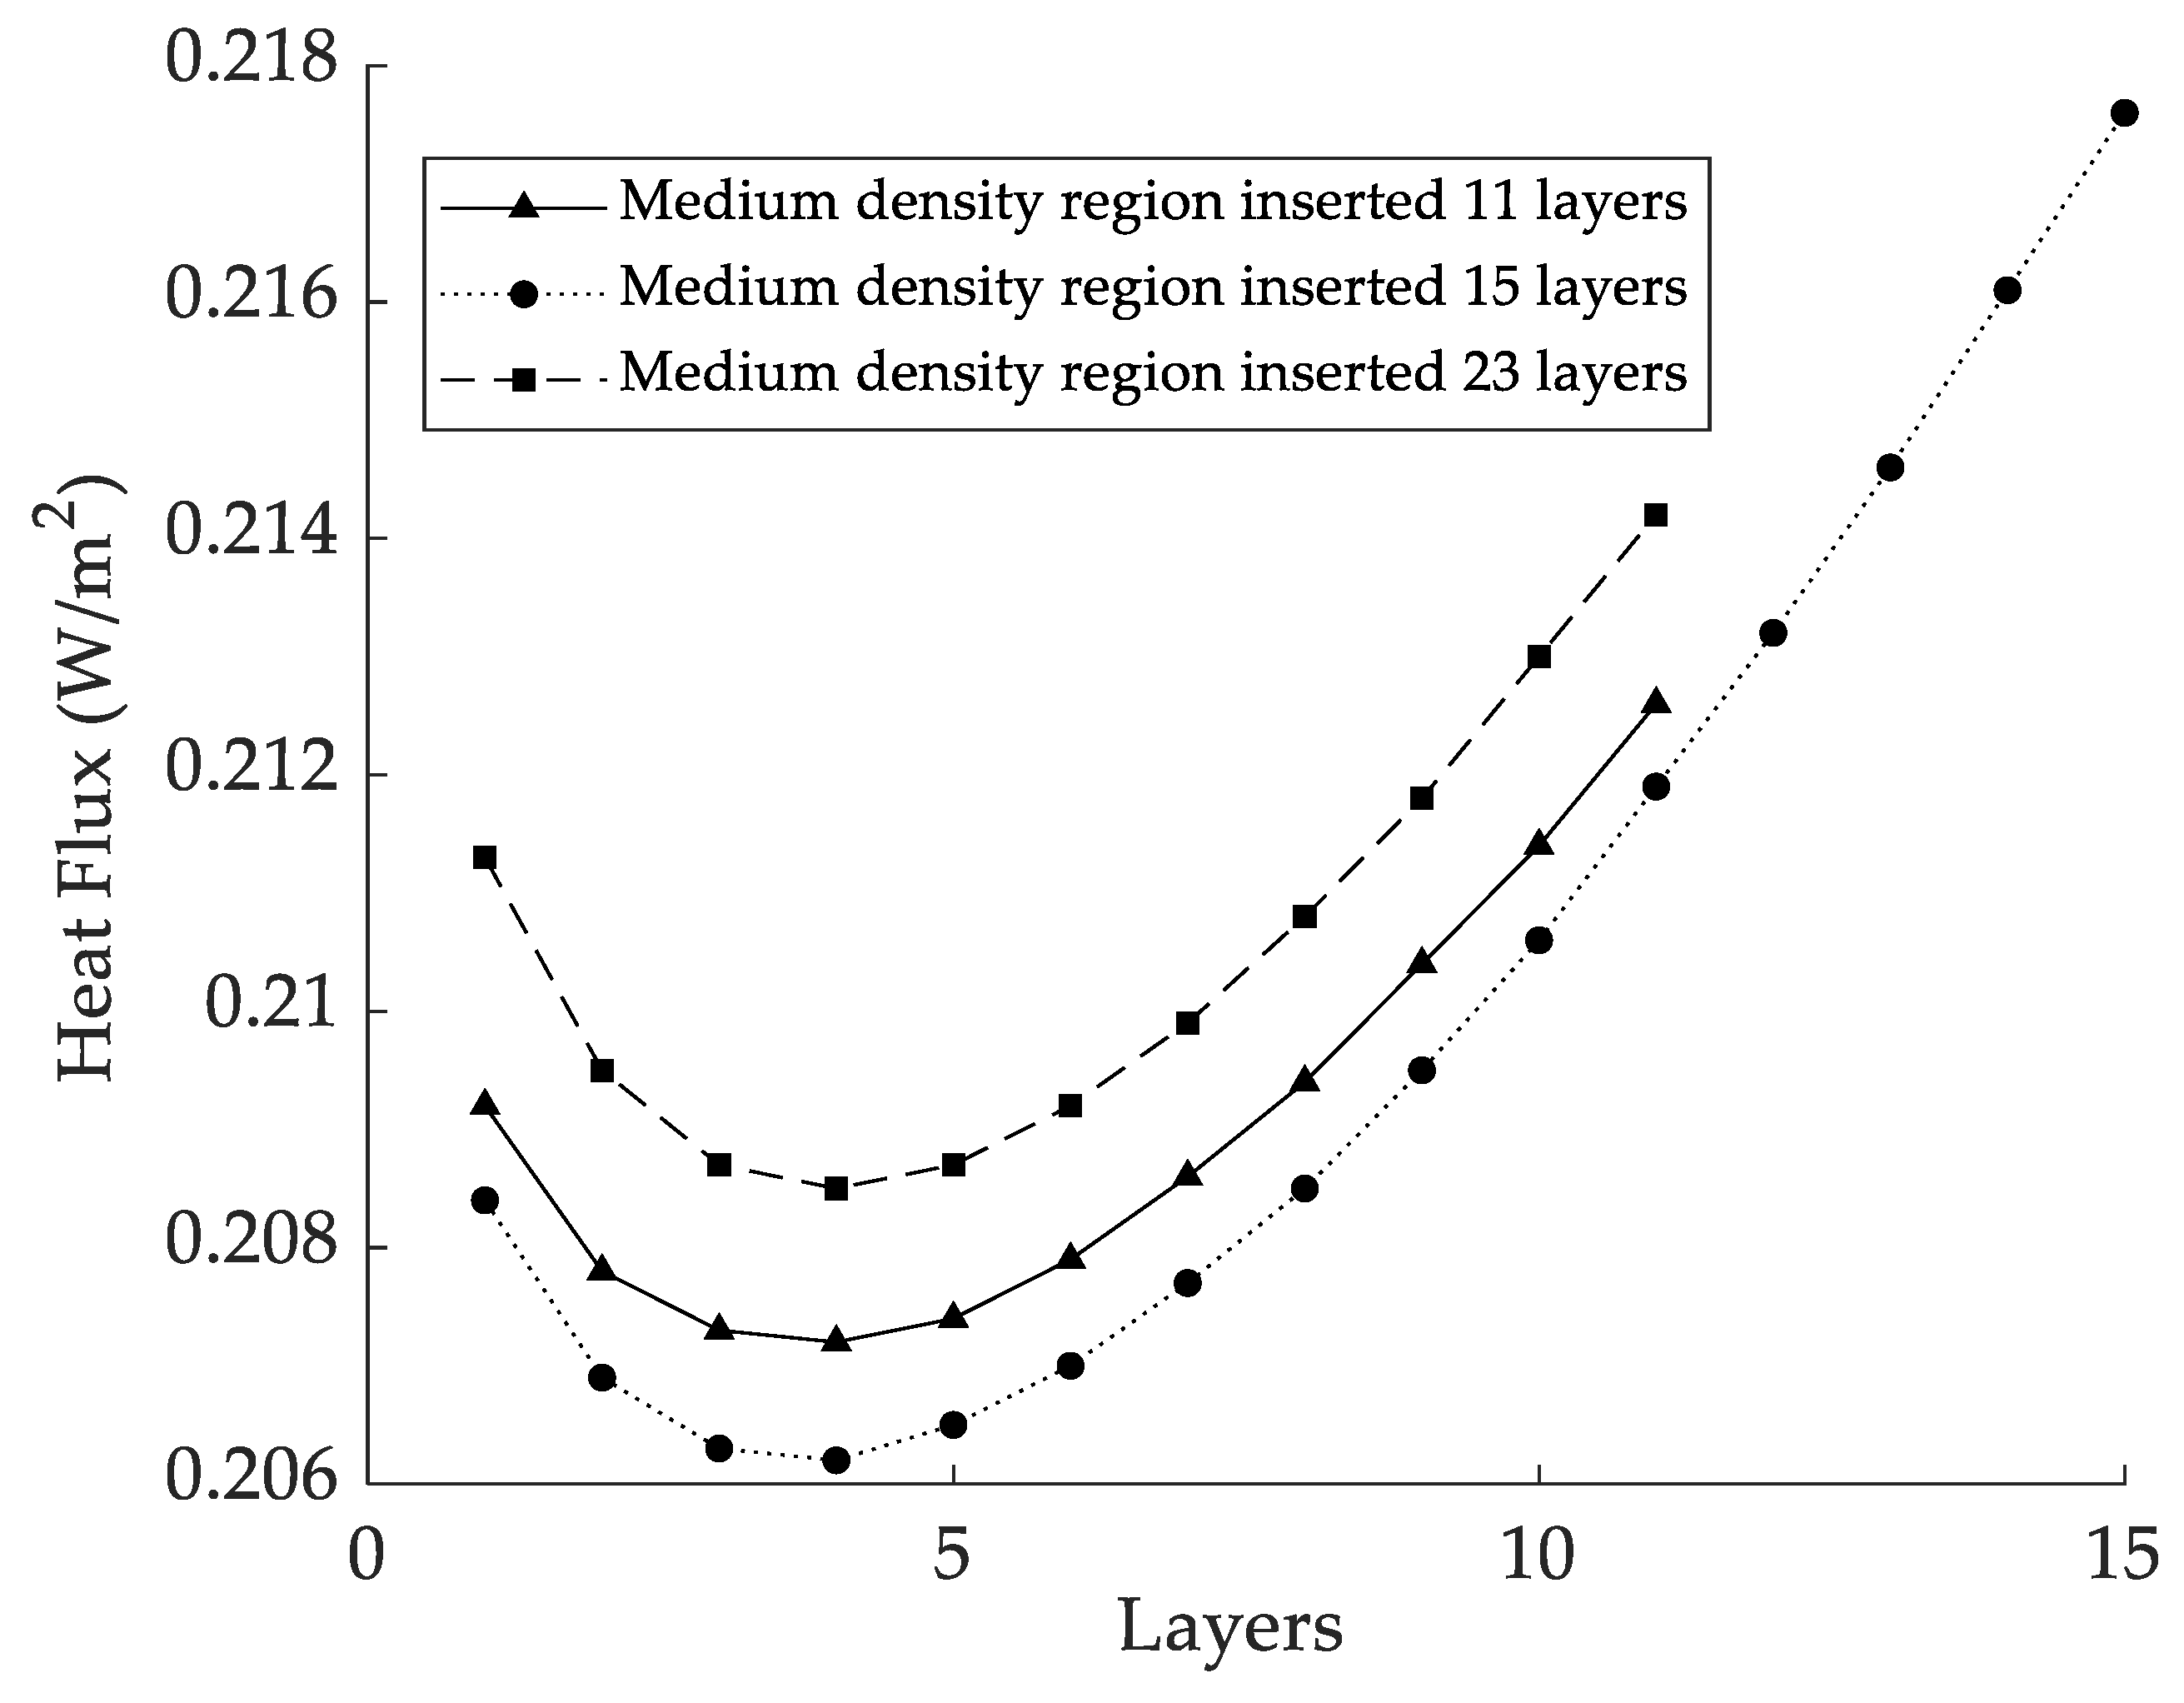
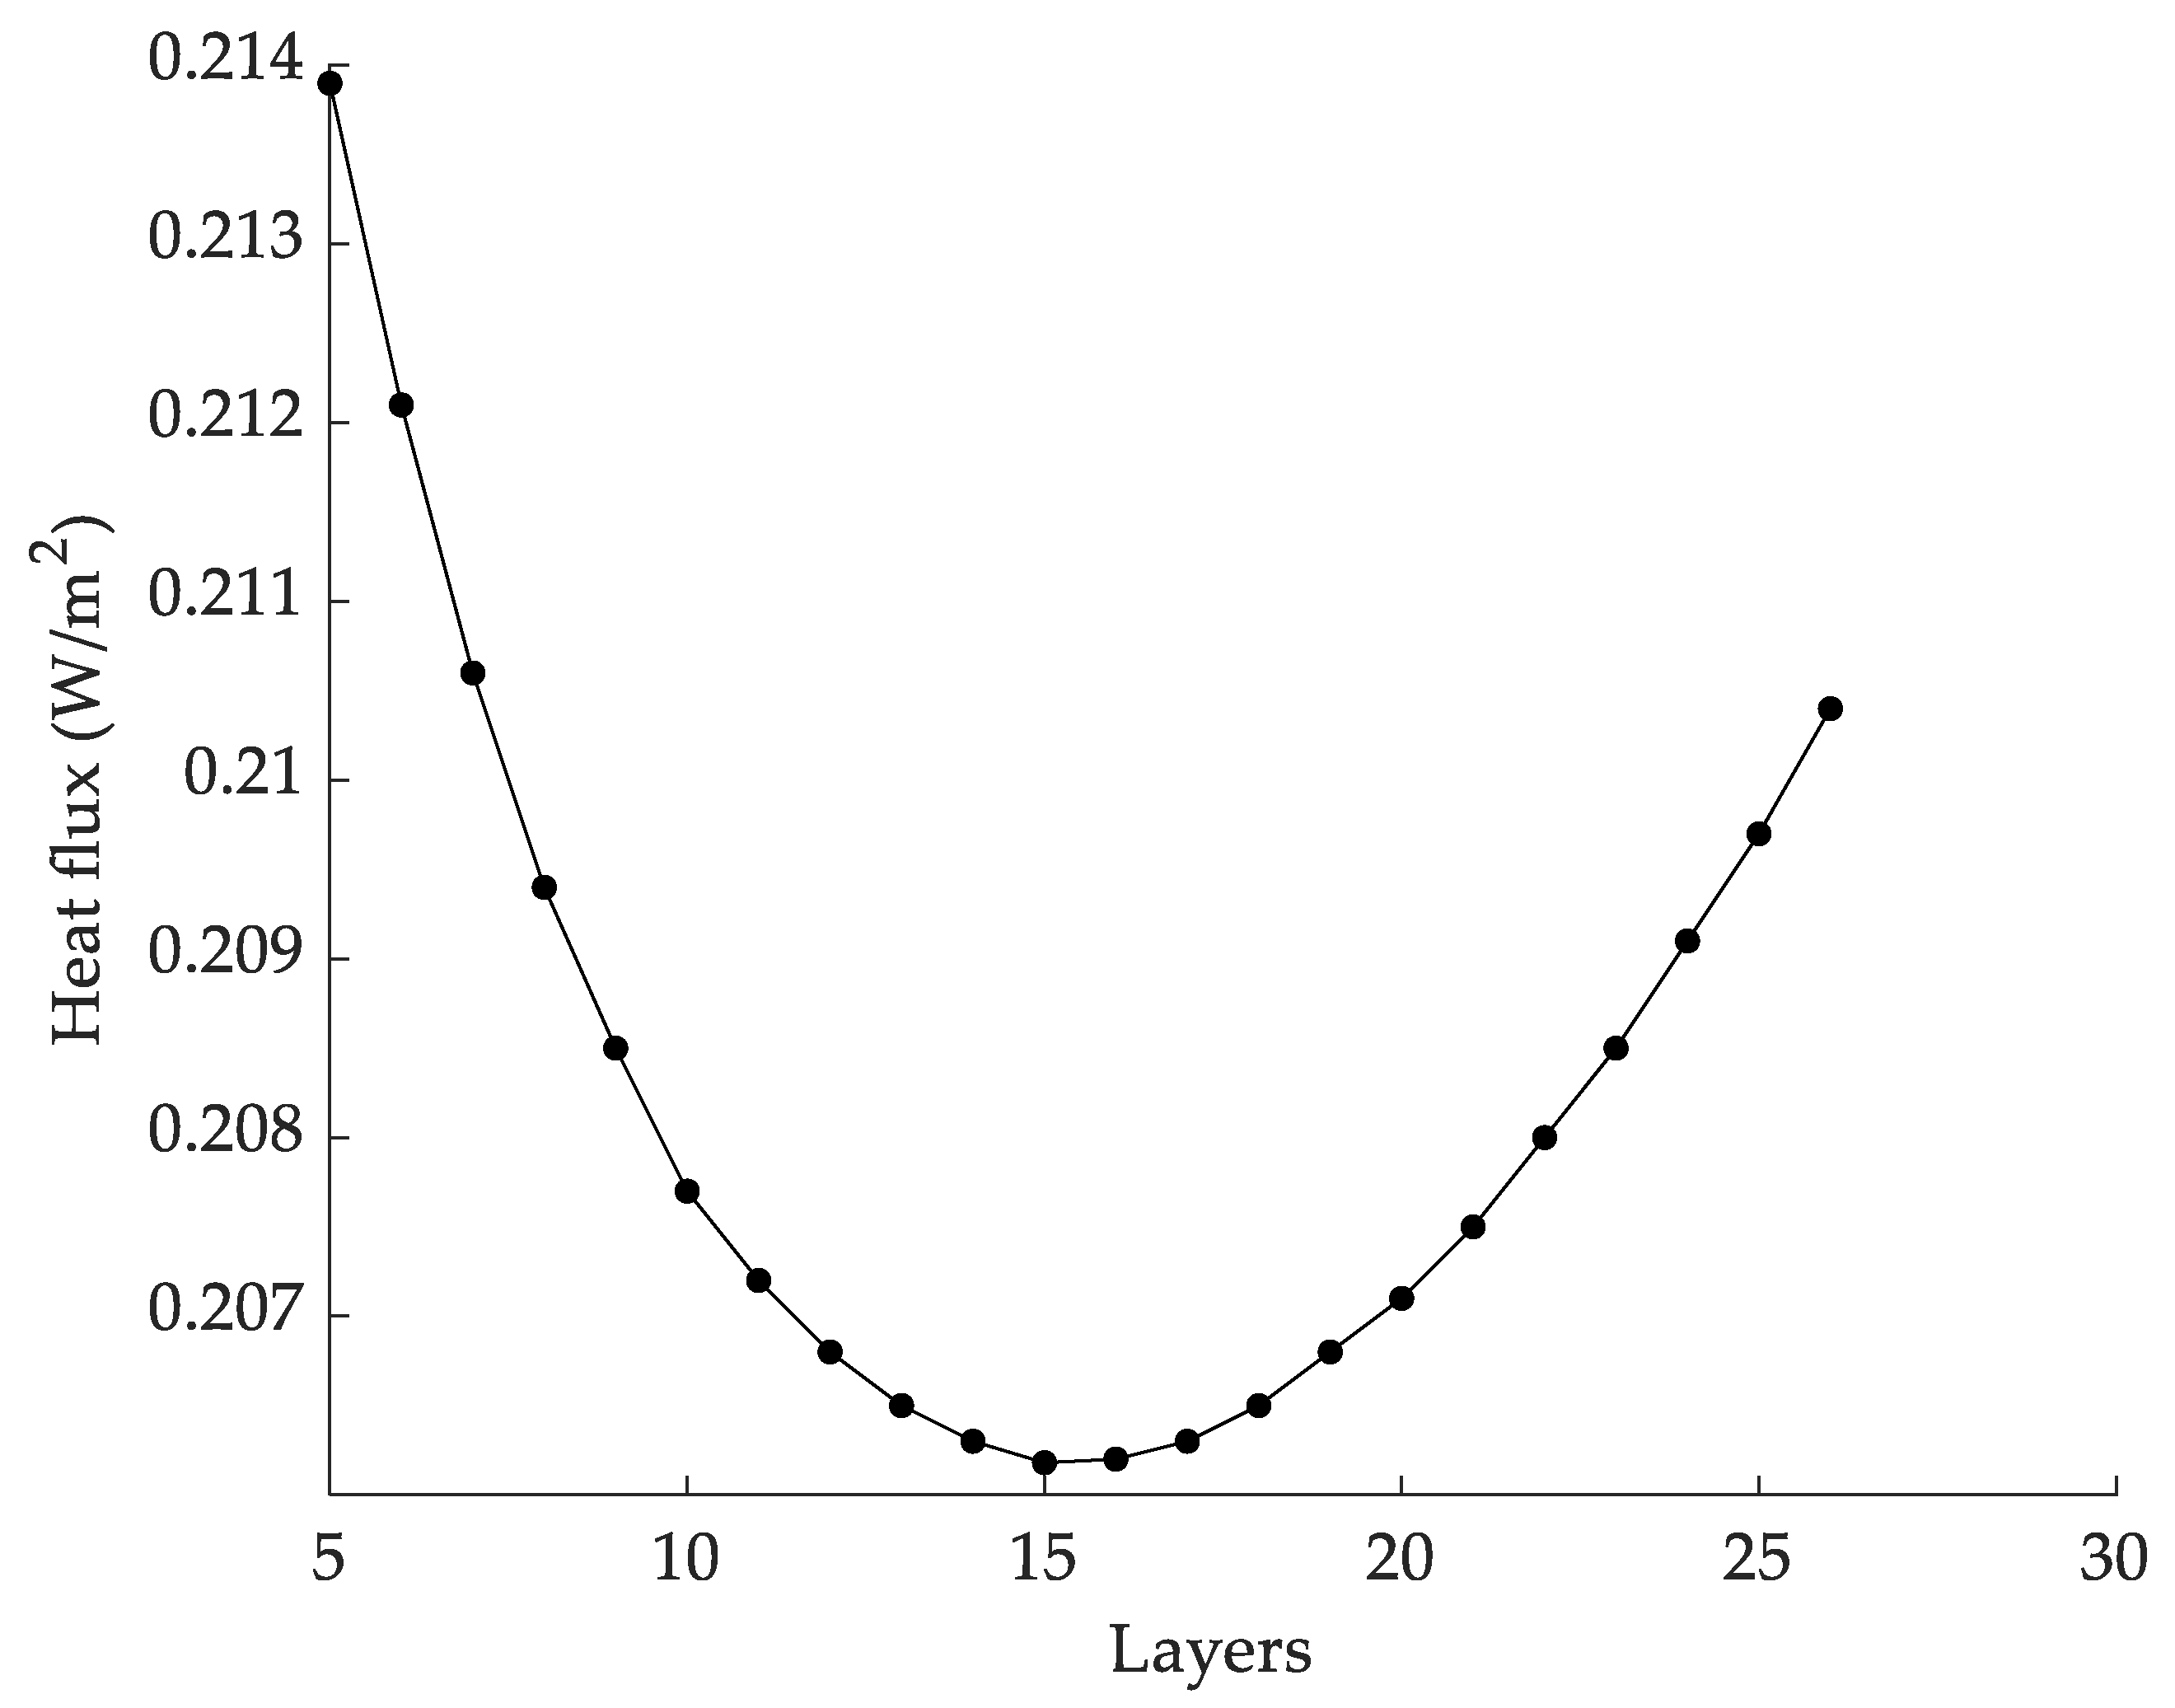
4.4. Optimization of Variable-Density Configuration

We set the cold and hot boundaries to 20 K and 300 K, respectively, and took a multilayer insulation structure with a thickness of 3 cm and 61 layers of radiation shields as an example. We adopted a variable-density configuration based on the control variable method and region insertion method. Figure 11 shows the variation in the heat flux upon setting the layer density of the medium-density region to 20 layers per cm and upon changing the number of shields inserted in the low-density region and high-density region. Using this figure, one can see that decreasing the number of shields in the low-density region does not lower the heat flux. Heat flux decreases first and then increases with increases in the number of shields inserted in the low-density region. When four layers of radiation shields are inserted in the low-density region, the heat flux reaches a minimum value of 0.2068 W/m2. Until the number of layers inserted in the low-density region increases to the uniform-layer density, the heat flux of the variable-density multilayer structure is always lower than that of the uniform-density configuration, which shows the effectiveness of the variable-density configuration.
Figure 12 shows the variation in the heat flux when inserting 11, 15, and 23 layers of radiation shields in the medium-density region and when changing the number of layers inserted in the low-density region. From the figure, one can see that, in all three situations, the same results occur as those yielded by inserting 19 layers of shields in the medium-density region. When four layers of radiation shields are inserted in the low-density region, the heat flux reaches the lowest values, which are 0.2072 W/m2, 0.2062 W/m2, and 0.2085 W/m2. Although the number of inserted layers in the medium-density region is different, the change in the heat flux occurs similarly. As the number of inserted layers increases in the low-density region, the heat flux decreases first and then increases. Therefore, we can conclude that, when the total number of shields and the boundary temperature are determined, the number of layers to be inserted in the low-density region can be uniquely determined to minimize the heat flux, and changing the number of layers that are inserted in the medium-density region is not necessary to further determine the optimal number of layers to be inserted in the low-density region.
After determining the optimal number of layers inserted in the low-density region, the number of layers inserted in the low-density region can be fixed. Then, the number of layers inserted in the medium-density region and the high-density region changes, and the optimal variable-density configuration can be calculated. Figure 13 shows the change in the heat flux when changing the number of layers inserted in the medium-density region and the high-density region. Using this figure, one can see that, with the increase in the number of radiation shields inserted in the medium-density region, the heat flux decreases first and then increases. When 15 layers are inserted in the medium-density region, the heat flux reaches a minimum value of 0.2062 W/m2. Thus far, the determination of the optimal variable-density configuration is completed. When the cold and thermal boundary temperatures are 20 K and 300 K, respectively, and when the total number of layers is 61, the optimal variable-density configuration is 4 layers inserted in the low-density region, 15 layers inserted in the medium-density region, and 38 layers inserted in the high-density region. With this configuration, the heat flux reaches the lowest value of 0.2062 W/m2, and the number of layers that are inserted in each density region is an accurate value. At liquid hydrogen temperatures, the heat flux of the optimal variable-density structure is reduced by 8.6% compared with a uniform-layer density structure. With a variable-density configuration, fewer radiation shields should be configured near the cold boundary region, and more radiation shields should be configured near the thermal boundary region.

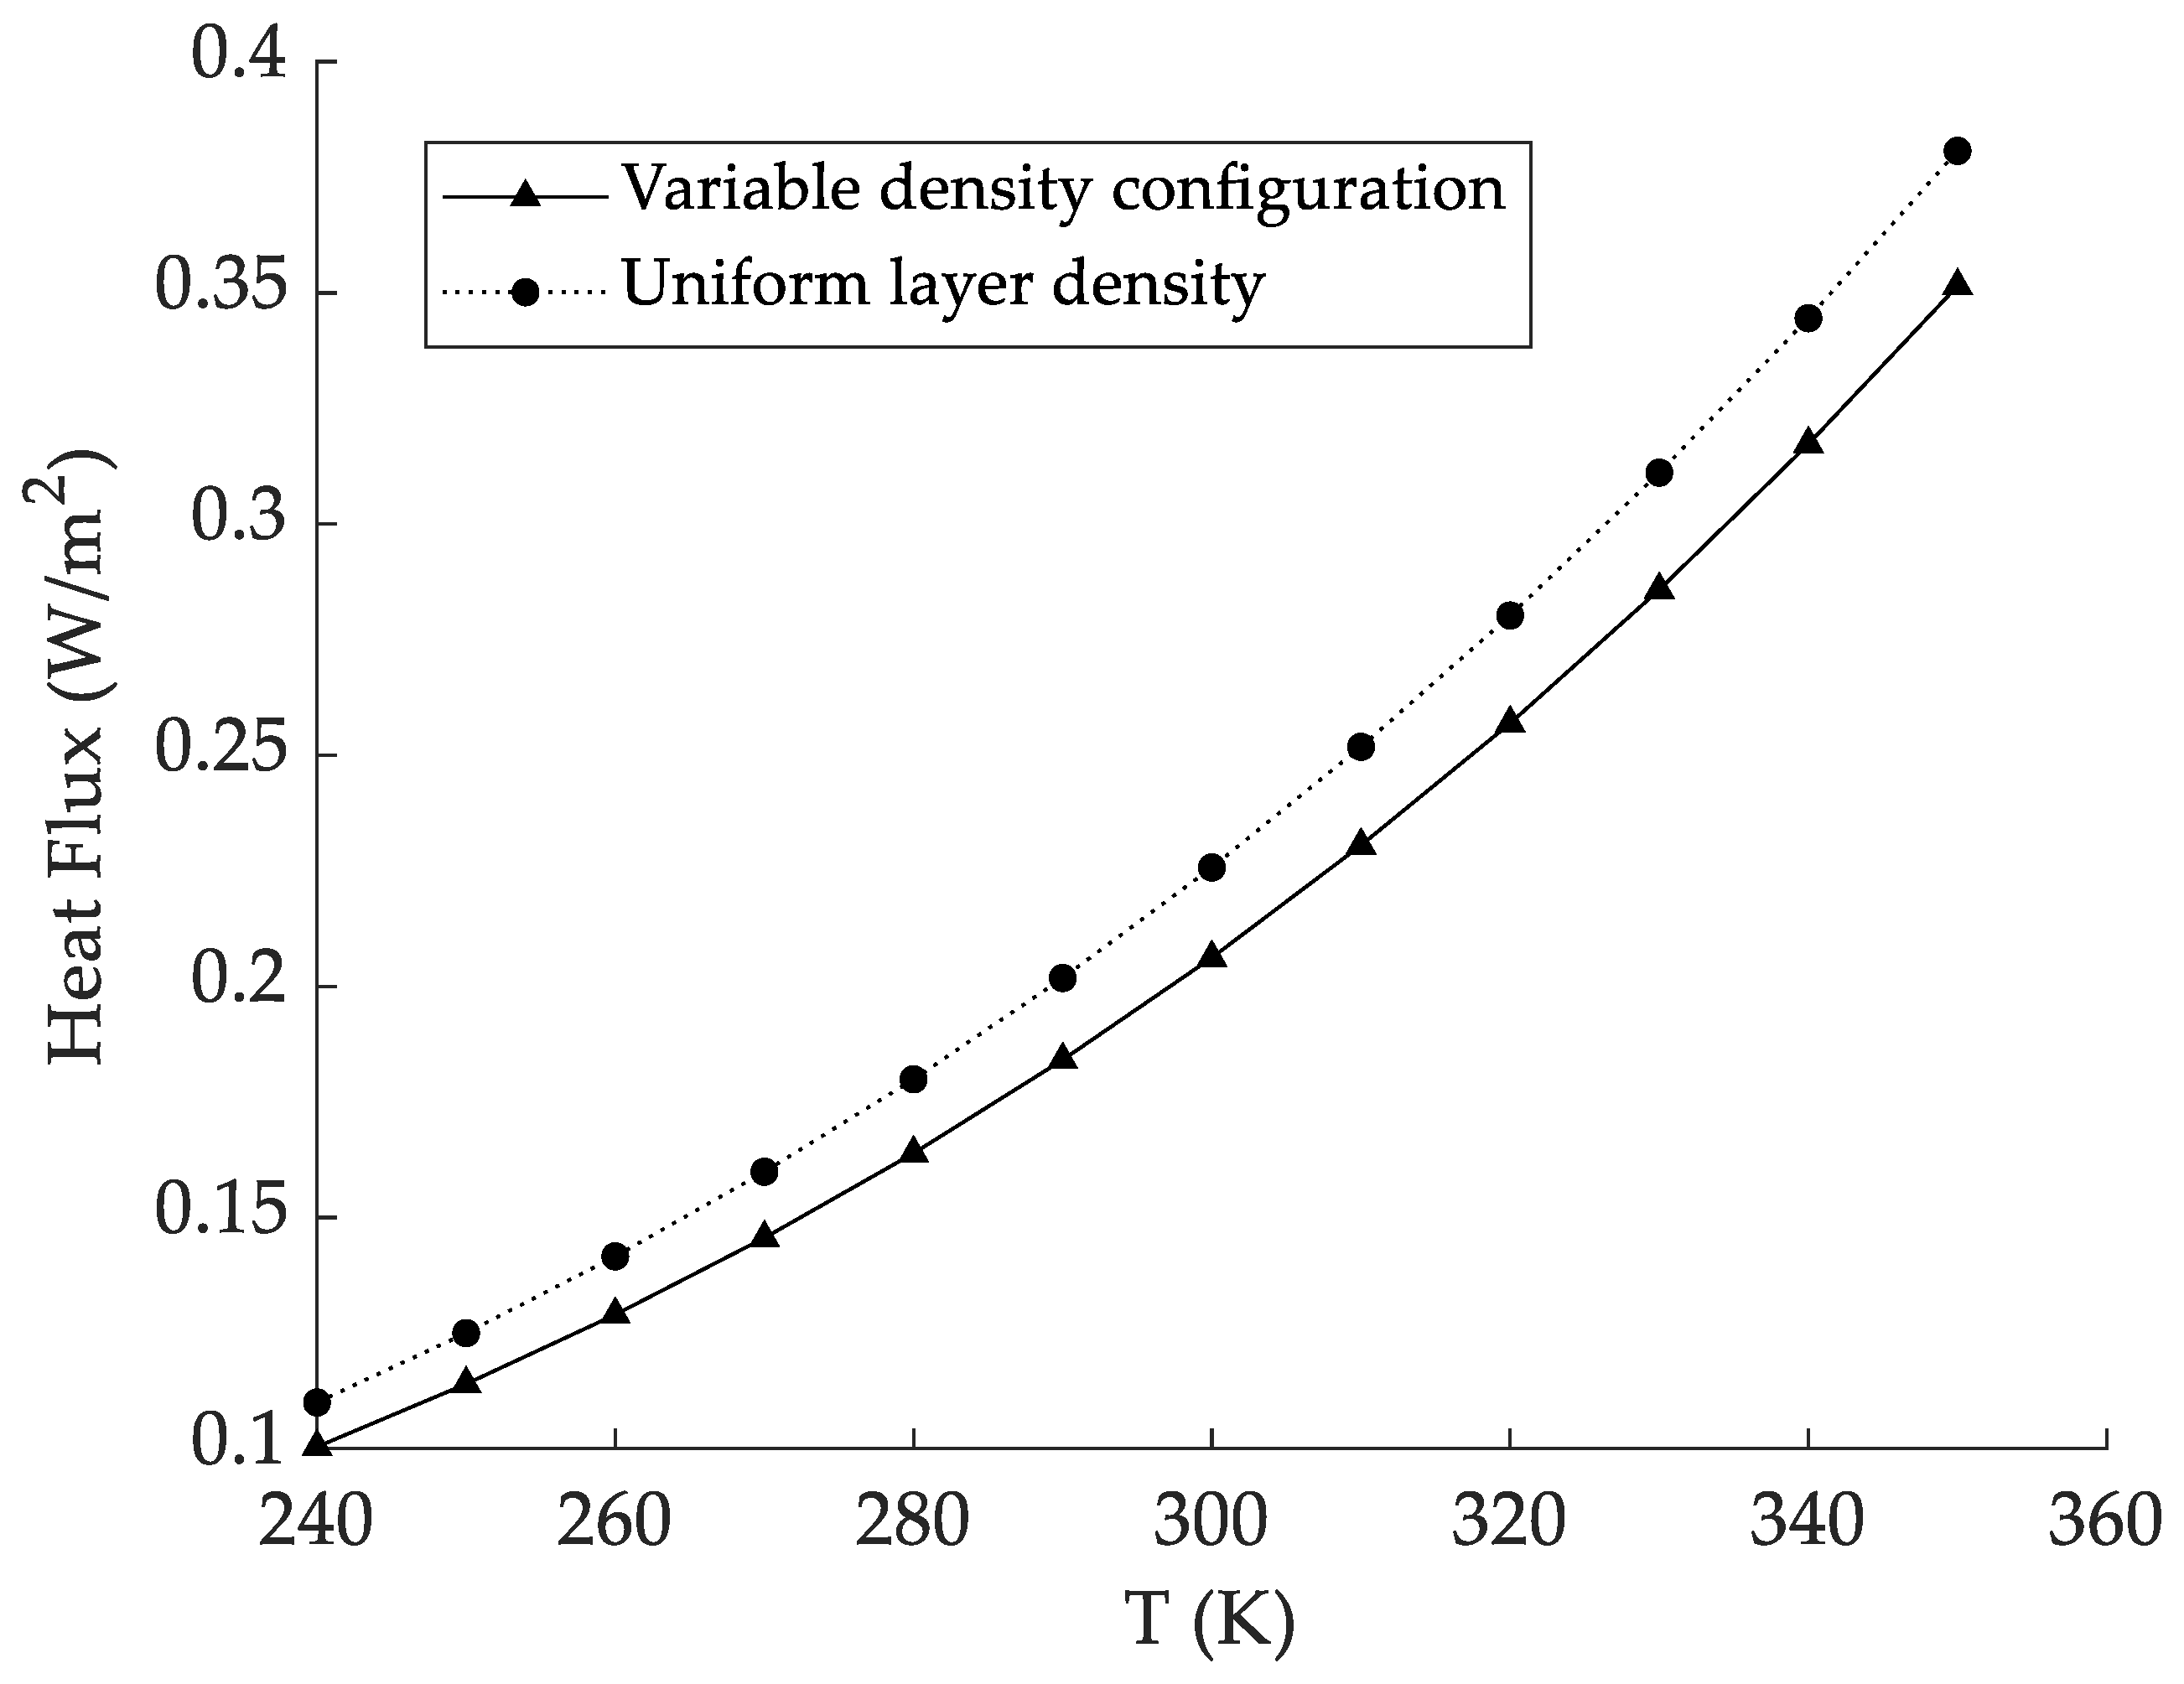
4.5. Comparison with Uniform-Layer Density at Different Thermal Boundary Temperatures

The above optimal variable-density configuration uses a fixed boundary temperature, but when the thermal boundary temperature changes, this variable-density configuration is not the optimal configuration for this new boundary temperature. Figure 14 shows the variation in the heat flux with increases in the thermal boundary temperature when a variable-density insulator structure is used, which is the same as that for a uniform-density structure. The heat flux increases with increases in the thermal boundary temperature and is greatly affected by the boundary temperature, but compared with a uniform-density structure, the heat flux of the variable-density structure is always lower than that of the uniform-density structure in the thermal boundary temperature range of 240 K to 350 K. This indicates that, although this configuration is not an optimal variable-density configuration at different boundary temperatures, it is still better than that of a uniform-density structure, which shows that a variable-density insulation structure can exhibit excellent insulation performance at different thermal boundary temperatures.

5. Conclusions

The purpose of this paper is to optimize the thermal insulation performance of multilayer insulation structures at liquid hydrogen temperatures without incorporating a composite structure. In this paper, we established a layer-by-layer calculation model, and we studied the performance of a multilayer insulation structure in different working conditions by calculating the heat flux of each heat transfer; therefore, we could obtain the relationship of each change in heat flux with each change in layer position. Furthermore, we proposed a method based on the control variable method and the insertion by region method. Using this method can directly and precisely obtain the optimal layer density configuration. We obtained the following results:
  • As the total number of layers increases, the heat flux gradually decreases, but more layers do not mean that it is better. When the number of layers reaches 50, the heat flux tends to decrease gently, but the total mass and thickness of the insulation layer linearly increase. Therefore, the total number of layers needs to be selected according to the specific situation.
  • When the pressure is lower than 0.01 Pa, the heat flux has no obvious change, and the residual gas conduction is negligible. When the pressure increases to more than 0.01 Pa, the heat flux changes significantly, and the residual gas thermal conductivity cannot be ignored. When this occurs, the multilayer insulation structure loses the vacuum environment, so the pressure should be kept below 0.01 Pa.
  • With increases in the thermal boundary temperature, the heat flux increases and is strongly influenced by the temperature. Radiation heat transfer is the main heat transfer path in vacuum multilayer insulation. As the thermal boundary temperature increases, the proportion of radiation heat transfer heat flux in the total heat flux also increases. The proposed variable-density configuration method based on the control variable method and the insertion by region method can optimize the variable-density configuration and obtain an accurate configuration for layer density. At liquid hydrogen temperatures with a fixed thermal boundary of 300 K and 61 layers of radiation shields, the optimal variable-density configuration is 4 layers inserted in the low-density region, 15 layers inserted in the medium-density region and 38 layers inserted in the high-density region. The heat flux is 0.2062 W/m2, which is 8.6% lower than that of the uniform-layer density. In the range of 240 K to 350 K, the thermal insulation performance is better than that of a uniform-layer density.

Author Contributions

Conceptualization, K.L. and J.C.; data curation, K.L.; formal analysis, K.L.; funding acquisition, J.C.; investigation, K.L., Y.H. and X.T.; methodology, K.L.; project administration, J.C.; resources, K.L. and J.C.; software, K.L. and X.T.; supervision, J.C.; validation, K.L. and X.T.; visualization, K.L. and Y.H.; writing—original draft preparation, K.L. and Y.H.; writing—review and editing, K.L. and Y.H. All authors have read and agreed to the published version of the manuscript.

Funding

This research was supported by the Special Fund Project for Central Leading Local Science and Technology Development of China (grant number ZYYD2022B11).

Conflicts of Interest

The authors declare no conflict of interest.

References

  1. Majumdar, A.; Deutch, J.M.; Prasher, R.S.; Griffin, T.P. A Framework for a Hydrogen Economy. Joule 2021, 5, 1905–1908. [Google Scholar] [CrossRef]
  2. Khan, I.; Hou, F.; Zakari, A.; Tawiah, V.K. The dynamic links among energy transitions, energy consumption, and sustainable economic growth: A novel framework for IEA countries. Energy 2021, 222, 119935. [Google Scholar] [CrossRef]
  3. Kovač, A.; Paranos, M.; Marciuš, D. Hydrogen in energy transition: A review. Int. J. Hydrogen Energy 2021, 46, 10016–10035. [Google Scholar] [CrossRef]
  4. Lin, R.H.; Zhao, Y.Y.; Wu, B.D. Toward a hydrogen society: Hydrogen and smart grid integration. Int. J. Hydrogen Energy 2020, 45, 20164–20175. [Google Scholar] [CrossRef]
  5. Elberry, A.M.; Thakur, J.; Santasalo-Aarnio, A.; Larmi, M. Large-scale compressed hydrogen storage as part of renewable electricity storage systems. Int. J. Hydrogen Energy 2021, 46, 15671–15690. [Google Scholar] [CrossRef]
  6. Staffell, I.; Scamman, D.; Velazquez Abad, A.; Balcombe, P.; Dodds, P.E.; Ekins, P.; Shah, N.; Ward, K.R. The role of hydrogen and fuel cells in the global energy system. Energy Environ. Sci. 2019, 12, 463–491. [Google Scholar] [CrossRef] [Green Version]
  7. Boretti, A. Hydrogen internal combustion engines to 2030. Int. J. Hydrogen Energy 2020, 45, 23692–23703. [Google Scholar] [CrossRef]
  8. Stepien, Z. A Comprehensive Overview of Hydrogen-Fueled Internal Combustion Engines: Achievements and Future Challenges. Energies 2021, 14, 6504. [Google Scholar] [CrossRef]
  9. Yukesh Kannah, R.; Merrylin, J.; Poornima Devi, T.; Kavitha, S.; Sivashanmugam, P.; Kumar, G.; Rajesh Banu, J. Food waste valorization: Biofuels and value added product recovery. Bioresour. Technol. Rep. 2020, 11, 100524. [Google Scholar] [CrossRef]
  10. Olabi, A.G.; Saleh Bahri, A.; Abdelghafar, A.A.; Baroutaji, A.; Sayed, E.T.; Alami, A.H.; Rezk, H.; Abdelkareem, M.A. Large-vscale hydrogen production and storage technologies: Current status and future directions. Int. J. Hydrogen Energy 2021, 46, 23498–23528. [Google Scholar] [CrossRef]
  11. Calise, F. Recent Advances in Green Hydrogen Technology. Energies 2022, 15, 5828. [Google Scholar] [CrossRef]
  12. Moradi, R.; Groth, K.M. Hydrogen storage and delivery: Review of the state of the art technologies and risk and reliability analysis. Int. J. Hydrogen Energy 2019, 44, 12254–12269. [Google Scholar] [CrossRef]
  13. Aziz, M. Liquid Hydrogen: A Review on Liquefaction, Storage, Transportation, and Safety. Energies 2021, 14, 5917. [Google Scholar] [CrossRef]
  14. Johnson, W.L. Optimization of layer densities for multilayered insulation systems. AIP Conf. Proc. 2010, 1218, 804–811. [Google Scholar]
  15. Johnson, W.; Fesmire, J.E. Thermal performance of low layer density multilayer insulation using liquid nitrogen. Adv. Cryog. Eng. 2012, 1434, 39–46. [Google Scholar]
  16. Johnson, W. Thermal analysis of low layer density multilayer insulation test results. Adv. Cryog. Eng. 2012, 1434, 1519–1526. [Google Scholar]
  17. Wang, J.; Zhan, Y.; Wang, W.; Wang, R. Optimization and performance of highly efficient hydrogen getter applied in high vacuum multilayer insulation cryogenic tank. Vacuum 2018, 149, 87–92. [Google Scholar] [CrossRef]
  18. Martin, J.J.; Hastings, L. Large-Scale Liquid Hydrogen Testing of Variable Density Multilayer Insulation with a Foam Substrate; NASA: Washington, DC, USA, 2001. [Google Scholar]
  19. Hastings, L.J.; Hedayat, A.; Brown, T.M. Analytical Modeling and Test Correlation of Variable Density Multilayer Insulation for Cryogenic Storage; NASA: Washington, DC, USA, 2004. [Google Scholar]
  20. Hedayat, A.; Hastings, L.J.; Brown, T. Analytical modeling of variable density multilayer insulation for cryogenic storage. AIP Conf. Proc. 2002, 613, 1557–1564. [Google Scholar]
  21. Huang, Y.; Wang, B.; Zhou, S.; Wu, J.; Lei, G.; Li, P.; Sun, P. Modeling and experimental study on combination of foam and variable density multilayer insulation for cryogen storage. Energy 2017, 123, 487–498. [Google Scholar] [CrossRef]
  22. Liu, Z.; Li, Y.; Zhou, G. Insulation performance of foam during the terrestrial and ascent period. Appl. Therm. Eng 2018, 145, 364–374. [Google Scholar] [CrossRef]
  23. Zheng, J.; Chen, L.; Wang, J.; Xi, X.; Zhu, H.; Zhou, Y.; Wang, J. Thermodynamic analysis and comparison of four insulation schemes for liquid hydrogen storage tank. Energy Convers. Manag. 2019, 186, 526–534. [Google Scholar] [CrossRef]
  24. Zheng, J.; Chen, L.; Cui, C.; Guo, J.; Zhu, W.; Zhou, Y.; Wang, J. Experimental study on composite insulation system of spray on foam insulation and variable density multilayer insulation. Appl. Therm. Eng. 2018, 130, 161–168. [Google Scholar] [CrossRef]
  25. Zheng, J.; Chen, L.; Wang, J.; Zhou, Y.; Wang, J. Thermodynamic modeling and optimization of self-evaporation vapor cooled shield for liquid hydrogen storage tank. Energy Convers. Manag. 2019, 184, 74–82. [Google Scholar] [CrossRef]
  26. Xu, X.; Xu, H.; Yang, B.; Chen, L.; Wang, J. A Novel Composite Insulation System of Hollow Glass Microspheres and Multilayer Insulation with Self-Evaporating Vapor Cooled Shield for Liquid Hydrogen Storage. Energy Technol. 2020, 8, 2000591. [Google Scholar] [CrossRef]
  27. Wang, P.; Ji, L.; Yuan, J.; An, Z.; Yan, K.; Zhang, J. Modeling and optimization of composite thermal insulation system with HGMs and VDMLI for liquid hydrogen on orbit storage. Int. J. Hydrogen Energy 2020, 45, 7088–7097. [Google Scholar] [CrossRef]
  28. Wang, P.; Ji, L.; Yuan, J.; An, Z.; Yan, K.; Zhang, J. The influence of inner material with different average thermal conductivity on the performance of whole insulation system for liquid hydrogen on orbit storage. Int. J. Hydrogen Energy 2021, 46, 10913–10923. [Google Scholar] [CrossRef]
  29. Jiang, W.; Sun, P.; Li, P.; Zuo, Z.; Huang, Y. Transient thermal behavior of multi-layer insulation coupled with vapor cooled shield used for liquid hydrogen storage tank. Energy 2021, 231, 120859. [Google Scholar] [CrossRef]
  30. McIntosh, G.E. Layer by Layer MLI Calculation Using a Separated Mode Equation. Adv. Cryog. Eng. 1994, 39, 1683–1690. [Google Scholar]
  31. Stochl, R.J.; Dempsey, P.J.; Leonard, K.R.; McIntosh, G.E. Variable Density MLI Test Results; Springer: Boston, MA, USA, 1996. [Google Scholar]
Figure 1. Flow chart of the layer-by-layer calculation model.
Energies 15 09267 g001
Figure 2. Schematic of the sub-region structure.
Energies 15 09267 g002
Figure 3. Schematic of the variable density configuration.
Energies 15 09267 g003
Figure 4. Comparison between calculated and experimental data.
Energies 15 09267 g004
Figure 5. Variation in heat flux with the total number of layers.
Energies 15 09267 g005
Figure 6. Variation in mass with the total number of layers.
Energies 15 09267 g006
Figure 7. Variation in heat flux with the pressure.
Energies 15 09267 g007
Figure 8. Variation in heat flux with the layer position.
Energies 15 09267 g008
Figure 9. Variation in heat flux with thermal boundary temperature.
Energies 15 09267 g009
Figure 10. The variation in heat flux with layer position.
Energies 15 09267 g010
Figure 11. Variation in heat flux with the number of insertion layers in the low-density region.
Energies 15 09267 g011
Figure 12. The heat flux varies with the number of inserted layers in the low-density region.
Energies 15 09267 g012
Figure 13. Variation in heat flux with the number of insertion layers in the medium-density region.
Energies 15 09267 g013
Figure 14. Comparison of the heat flux between variable density configurations and the uniform layer density.
Energies 15 09267 g014
Publisher’s Note: MDPI stays neutral with regard to jurisdictional claims in published maps and institutional affiliations.

