Article

Operation and Multi-Objective Design Optimization of a Plate Heat Exchanger with Zigzag Flow Channel Geometry

1
Department of Aeronautics and Astronautics, National Cheng Kung University, Tainan 701, Taiwan
2
Research Center for Smart Sustainable Circular Economy, Tunghai University, Taichung 407, Taiwan
3
Department of Mechanical Engineering, National Chin-Yi University of Technology, Taichung 411, Taiwan
4
Department of Mechanical and Materials Engineering, Tatung University, Taipei 104, Taiwan
5
Biorefineries for Biofuels & Bioproducts Laboratory, Center for Transdisciplinary Research, Department of Pharmacology, Saveetha Dental College, Saveetha Institute of Medical and Technical Sciences, Saveetha University, Chennai 600077, India
6
Lee Kong Chian Faculty of Engineering and Science, Tunku Abdul Rahman University, Kajang 43000, Malaysia
*
Authors to whom correspondence should be addressed.
Energies 2022, 15(21), 8205; https://doi.org/10.3390/en15218205
Submission received: 9 October 2022 / Revised: 24 October 2022 / Accepted: 27 October 2022 / Published: 3 November 2022
(This article belongs to the Collection Artificial Intelligence and Smart Energy)

Abstract

:
The performance of a plate heat exchanger (PHE) using water as the working fluid with zigzag flow channels was optimized in the present study. The optimal operating conditions of the PHE are explored experimentally by the Taguchi method, with effectiveness as the objective function. The results are further verified by the analysis of variance (ANOVA). In addition, the zigzag flow channel geometry is optimized by the non-dominated sorting genetic algorithm-II (NSGA-II), in which the effectiveness and pressure drop of the PHE are considered the two objective functions in the multi-objective optimization process. The experimental results show that the ratio of flow rates is the most important factor affecting the effectiveness of the PHE. The optimal operating conditions are the temperatures of 95 °C and 10 °C at the inlets of hot and cold water flows, respectively, with a cold/hot flow rate ratio of 0.25. The resultant effectiveness is 0.945. Three geometric parameters of the zigzag flow channel are considered, including the entrance length, the bending angle, and the fillet radius. The sensitivity analysis of the parameters reveals that a conflict exists between the two objective functions, and multi-objective optimization is necessary for the zigzag flow channel geometry. The numerical simulations successfully obtain the Pareto optimal front for the two objective functions, which benefits the determination of the geometric design for the zigzag flow channel.

1. Introduction

During the operation of industrial activities, a large amount of waste heat is liberated into the environment, which not only wastes energy but also causes thermal pollution [1]. The demand for energy in various industries is increasing rapidly. However, the improvement in energy conversion efficiency is limited. Therefore, waste heat recovery as an energy-saving method has recently attracted much attention. According to temperature ranges, waste heat is classified as high-temperature (above 650 °C), medium-temperature (250–650 °C), and low-temperature (below 250 °C) [2]. Among them, low-temperature waste heat accounts for the highest proportion of 60% of the total exhaust energy [3]. Many heat recovery technologies are available for capturing waste heat, such as air preheaters, heat exchangers, and thermoelectric generation [4,5,6]. Heat emissions can be transferred and recovered through these units, allowing thermal energy to be reused in industrial processes.
With the development of energy-saving technology, the applications of heat exchangers in the industry are becoming more popular. There are many types of heat exchangers, and according to different temperatures, pressures, media, and working conditions, heat exchangers have various applications. The advantages and disadvantages of the heat exchanger need to be considered in practical applications. For example, the double-pipe heat exchanger (DPHE) has a simple structure and can withstand high pressure. However, it occupies a large area and is easy to leak [7]. Shell and tube heat exchangers (STHE) are widely used in chemical equipment, but cleaning pipes is difficult [8]. Plate heat exchangers (PHE) have high heat exchange efficiency and are easy to clean, but the pressure drop is generally relatively high in operation [9].
Many researchers have attempted to ameliorate heat exchanger performance through the Taguchi method. The Taguchi method is an effective and low-cost method for quality engineering that has been widely used in various fields [10,11], including heat exchangers. It can take into account factors that may affect product variation and uses fewer experiments to find optimal conditions. Jamshidi et al. [12] combined the shell and helical tube heat exchangers to study the effects of fluid flow and geometric parameters on the heat transfer rate with the Taguchi method. The experimental results showed that the heat transfer rate could be improved by using a larger coil diameter and a higher mass flow rate. Kotcioglu et al. [13] established a model for a three-dimensional crossflow heat exchanger. They used the Taguchi method and analysis of variance (ANOVA) to analyze the flow rate, Reynolds number, and temperature effects on the Nusselt number and friction factor. They found the Reynolds number was the most critical parameter and determined the best combination of operating components.
In addition to the Taguchi method, many other theoretical approaches can also be used to optimize the heat exchanger performance. Rao et al. [14] minimized entropy generation in a crossflow plate-fin heat exchanger using a particle swarm optimization method. Selbas et al. [15] used a genetic algorithm to change the shell and tube heat exchanger’s geometric design and minimize the heat exchanger’s cost. However, more than one objective function often needs to be considered in practical engineering problems, and it is necessary to solve a problem with multiple objective functions. The objective functions may interact, and many multi-objective optimization methods have been developed, such as the global optimal algorithm, the response surface method, and the genetic algorithm method. The Non-dominated Sorting Genetic Algorithm-II (NSGA-II) is one of them, which has been employed in the optimization of heat exchanger performance [14]. It is a genetic algorithm with elite strategy and fast dominance sorting and is especially suitable for solving multi-objective problems. The goal of using NSGA-II is to generate the Pareto optimal front, which consists of optimal solutions that do not dominate each other. The Pareto-optimal front provides visualization of two objective functions. Researchers can evaluate trade-offs between objectives and the most suitable result. Table 1 lists a brief review of the relevant studies concerning multi-objective optimization using NSGA-II.
In past studies regarding heat exchanger optimization, most of them involve the designs of shell-and-tube heat exchangers, plate-fin heat exchangers, and fin-and-tube heat exchangers [22]. However, less effort has been devoted to optimizing PHE with zigzag flow channels and using water as the unique working fluid. Therefore, this study aims to maximize the performance of a PHE in which the working fluid is water with zigzag flow channels designed by the Taguchi method and NSGA-II. The Taguchi method is used to create experimental cases. Three operating factors are considered in the experiments: the inlet temperature of hot water, the inlet temperature of cold water, and the ratio of cold/hot water flow rates. Accordingly, the optimal conditions for the parameters can be determined. Furthermore, multi-objective optimization is carried out for the geometric design of the zigzag flow channel using the NSGA-II algorithm and computational fluid dynamics (CFD) simulation. The pressure drop and effectiveness of the PHE are considered objective functions, and three geometric variables are taken into account: the bending angle, the entrance length, and the fillet radius. The influence of each geometric parameter on the objective functions is explored, and then the Pareto optimal front is determined.

2. Methodology

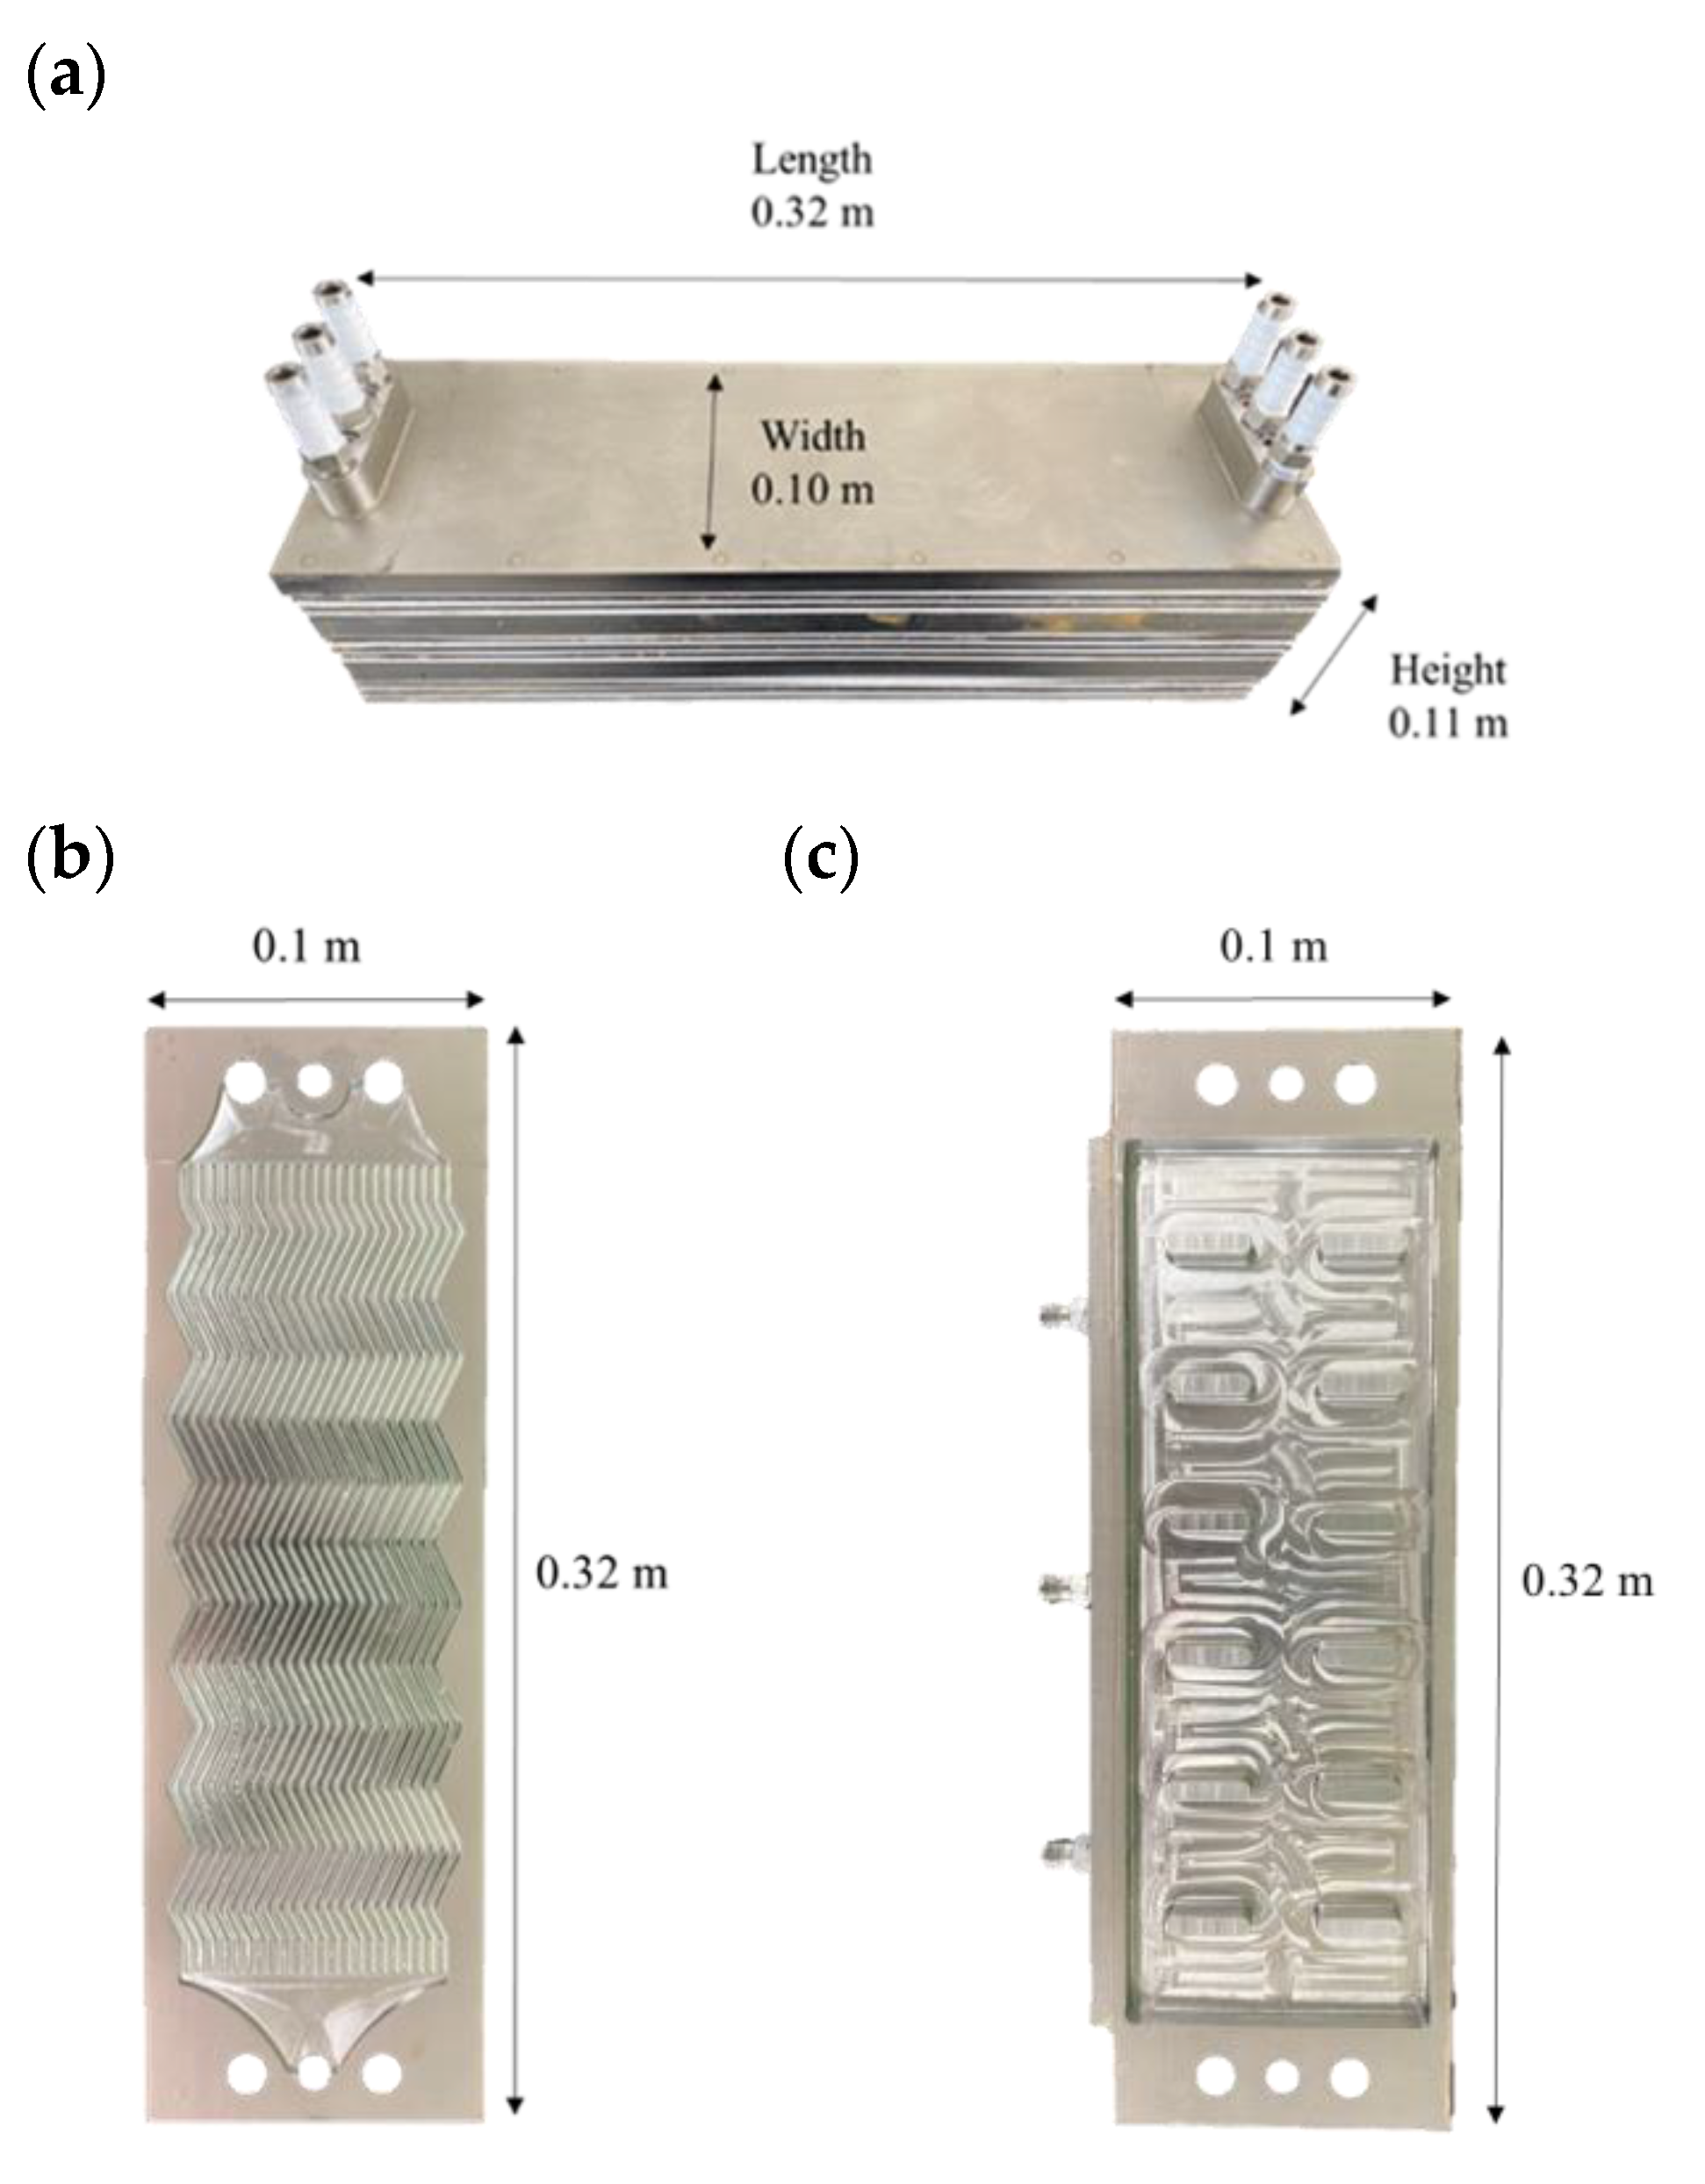
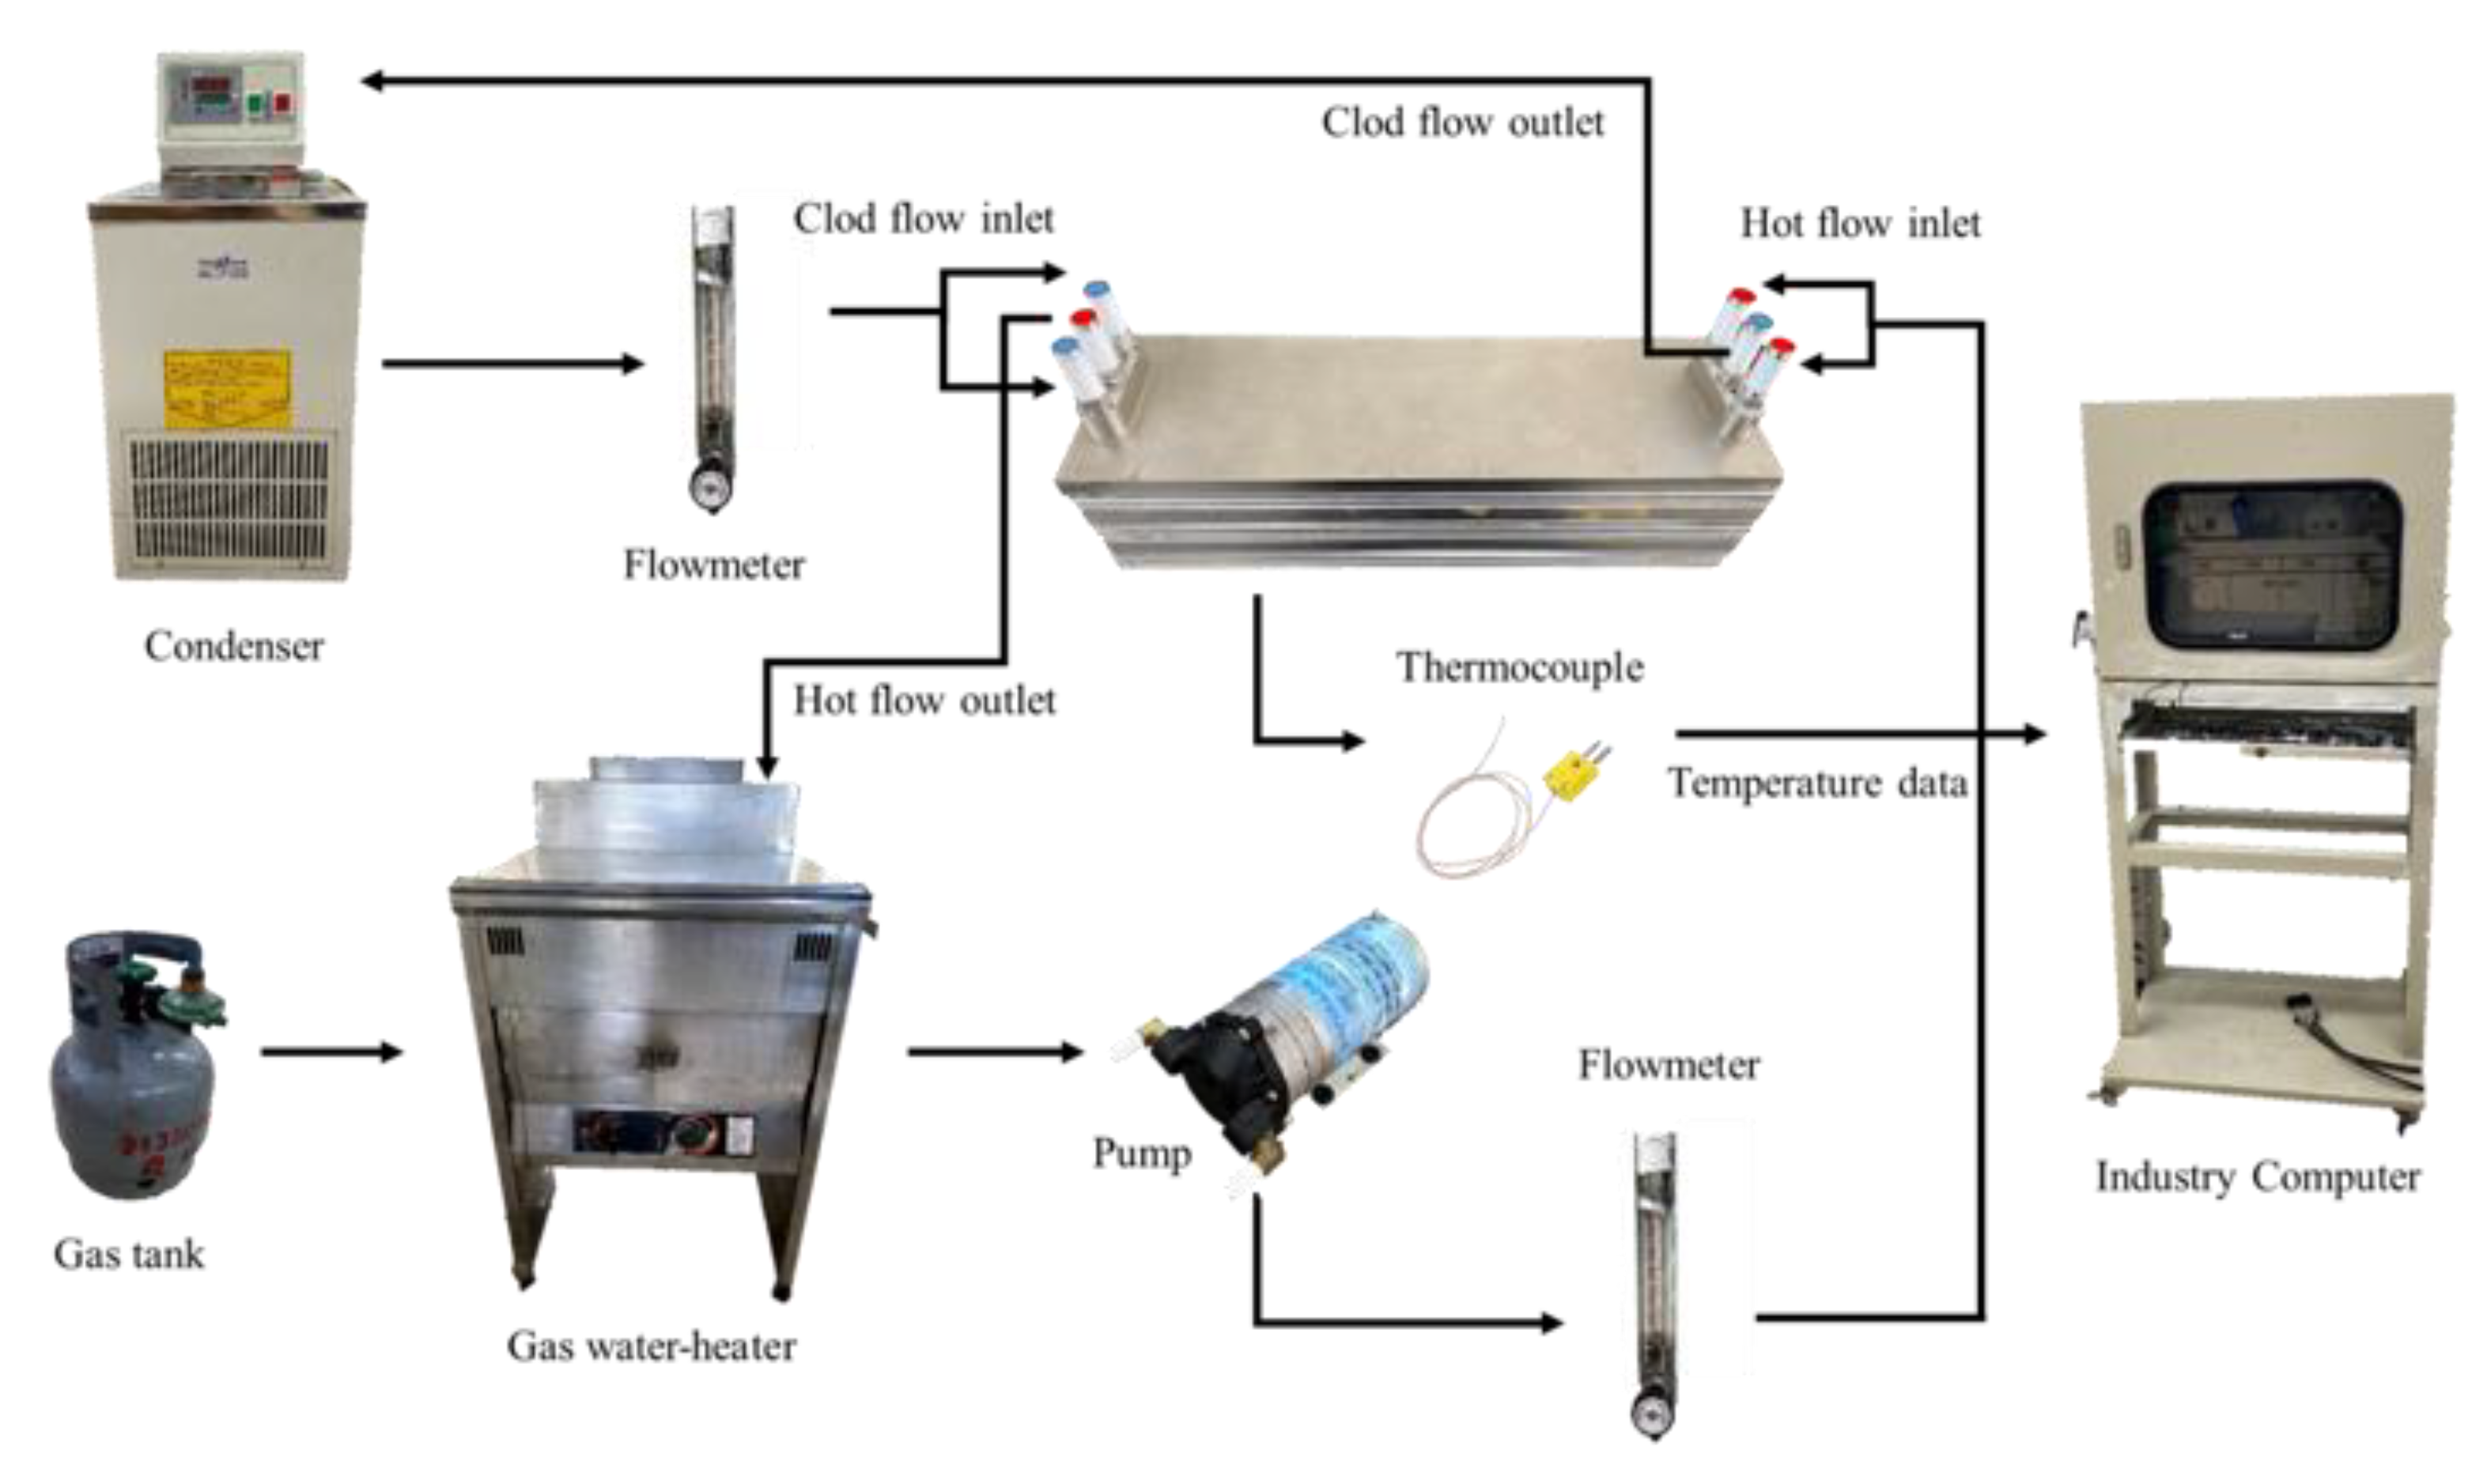
2.1. Model and Experimental Setup

The photo of the plate heat exchanger is shown in Figure 1a. The heat exchanger stack has twelve flat plates, including nine flow channel plates made of SUS316 steel (Figure 1b), two layers of phase change material (PCM) (Figure 1c), and one cover plate. Bolts clamp them, and the plate dimensions are 0.32 m in length and 0.1 m in width. The thicknesses of the flow channel plate and PCM layers were 0.0025 and 0.0115 m, respectively. The cold and hot flow channel plates have the same zigzag channel geometry, which can increase heat transfer efficiency [23]. According to the study [24], a heat exchanger with a counter-flow design can maximize heat recovery. Hence, the present heat exchanger adopts a counter-flow design as the flow directions of cold and hot flows are shown in Figure 2a. Both cold and hot flows have two inlets and one outlet. A 3-inch metal fitting is attached to each inlet and outlet and connected to silicone hoses. The structure of the plate heat exchanger is illustrated in Figure 2b, which consists of three sets of heat exchange layers with two PCM layers inserted between them. While this study focuses more on the vertical heat transfer between hot and cold water channels, PCM will not be included in the experience and simulation.
The experimental setup is shown in Figure 3. Water was used as the working fluid in the PHE to test the heat exchange performance. The hot water was driven by a pump (HITON, HF-8006) and heated by a 40 L gas heating system (Ta-Han, BDF-23C). The cold water was circulated and controlled by a thermostatic water bath (Yih Der, BL710-D) to maintain a constant temperature at the inlet of the heat exchanger. The flow meters (Dwyer, GSN-15-N) were connected to control the flow rates of cold and hot water flows in a range of 0.25–2.5 L/min (LPM), along with the allowed error of ±3%. Six K-type thermocouples (Chuan Yu, K type) were installed in the pipes to measure the inlet and outlet temperatures of the water flows. The resolution of the K-type thermocouples is ±0.75 °C. The whole heat exchanger was covered by insulation cotton to reduce heat loss. The data measured by the thermocouples were recorded on an industrial computer equipped with a thermocouple module.

2.2. Optimization of Operation Conditions by the Taguchi Method and Analysis of Variance (ANOVA)

The PHE performance was tested, and the Taguchi method was used to analyze the optimal operating conditions for the understanding of the effects of system parameters on the PHE. The Taguchi method is effective in quality engineering, characterized by reducing the effects of various causes to improve quality. An orthogonal array can be selected according to the design of the system parameters and the level values. The experiments to be performed can be filtered, and one can obtain reliable estimations with fewer runs of experimental groups.
Three control factors are considered in the Taguchi method: the inlet temperature of hot water, the inlet temperature of cold water, and the flow rate ratio of cold/hot water flows, which are indicated by Factor A, Factor B, and Factor C, respectively. Each factor consists of three levels, as shown in Table 2. The experiments are performed in one atmosphere where the water boiling temperature is 100 °C. Therefore, three inlet hot water temperatures of 75, 85, and 95 °C are selected. Meanwhile, cold water at room temperature is adopted. As a result, three standard temperatures of 10, 20, and 30 °C are considered. It is inferred that the cold/hot water flow rate ratio may be a crucial parameter affecting heat exchange. Under the condition of a hot water flow rate of 2 LPM, the ratios of cold/hot water flow rates are 0.25, 0.5, and 1. Accordingly, the L9 (33) orthogonal array with 9 cases can be constructed, as shown in Table 3.
The signal-to-noise ratio (S/N ratio) is used to compare the interference and influence of different factors on the objective function, and the sensitivity of the parameters can be calculated. In the Taguchi method, the S/N ratios are categorized as the nominal-the-better (NB), the larger-the-better (LB), and the smaller-the-better (SB). The signal is usually predictable in quality, while the noise is generally unpredictable. The objective function is the effectiveness ( ε ) of the PHE, and the target of the experiments is to find the optimal combination of the factors to obtain the highest effectiveness of the PHE. Therefore, the LB criterion is selected as the judgment basis, which could be expressed by:
S N = 10 log 10 ( 1 y 2 )
where y is a dimensionless value representing the effectiveness of the heat exchanger, which is defined as:
y = ε = Q a c t u a l Q m a x = C c ( T c o T c i ) C m i n ( T h i T c i ) = ( m ˙ c p ) c ( T c o T c i ) ( m ˙ c p ) m i n ( T h i T c i )
In the above equation, Q a c t u a l is the actual heat transfer rate, Q m a x is the maximum heat transfer rate, m ˙   is the mass flow rate of cold water, C c is the specific heat capacity of cold water, C m i n is the smaller specific heat capacity between cold and hot water, T c 0 , T c i , and T h i are the temperatures at the outlet of cold water, the inlet of cold water, and the inlet of hot water, respectively. The effectiveness mainly depends on the temperature difference ( T c 0 T c i ) . The maximum effectiveness is equal to 1, which represents the ideal condition that the temperature T c 0 is equal to the temperature T h i without any heat loss.
ANOVA is a statistical method. ANOVA estimates the amount of change caused by each factor relative to the total change. This was achieved by using the ANOVA F-test to obtain F-values. The measurement of the ANOVA F-test is defined by:
F = s u m   o f   s q u a r e   o f   t r e a t m e n t f s u m   o f   s q u a r e   o f   e r r o r f e = s i f S f   [ ( N 1 ) f ]
where f is the degree of freedom, N is the number of tests, and S f is the sum of the square of error, which can be represented by the minimum of each factor [4,25].

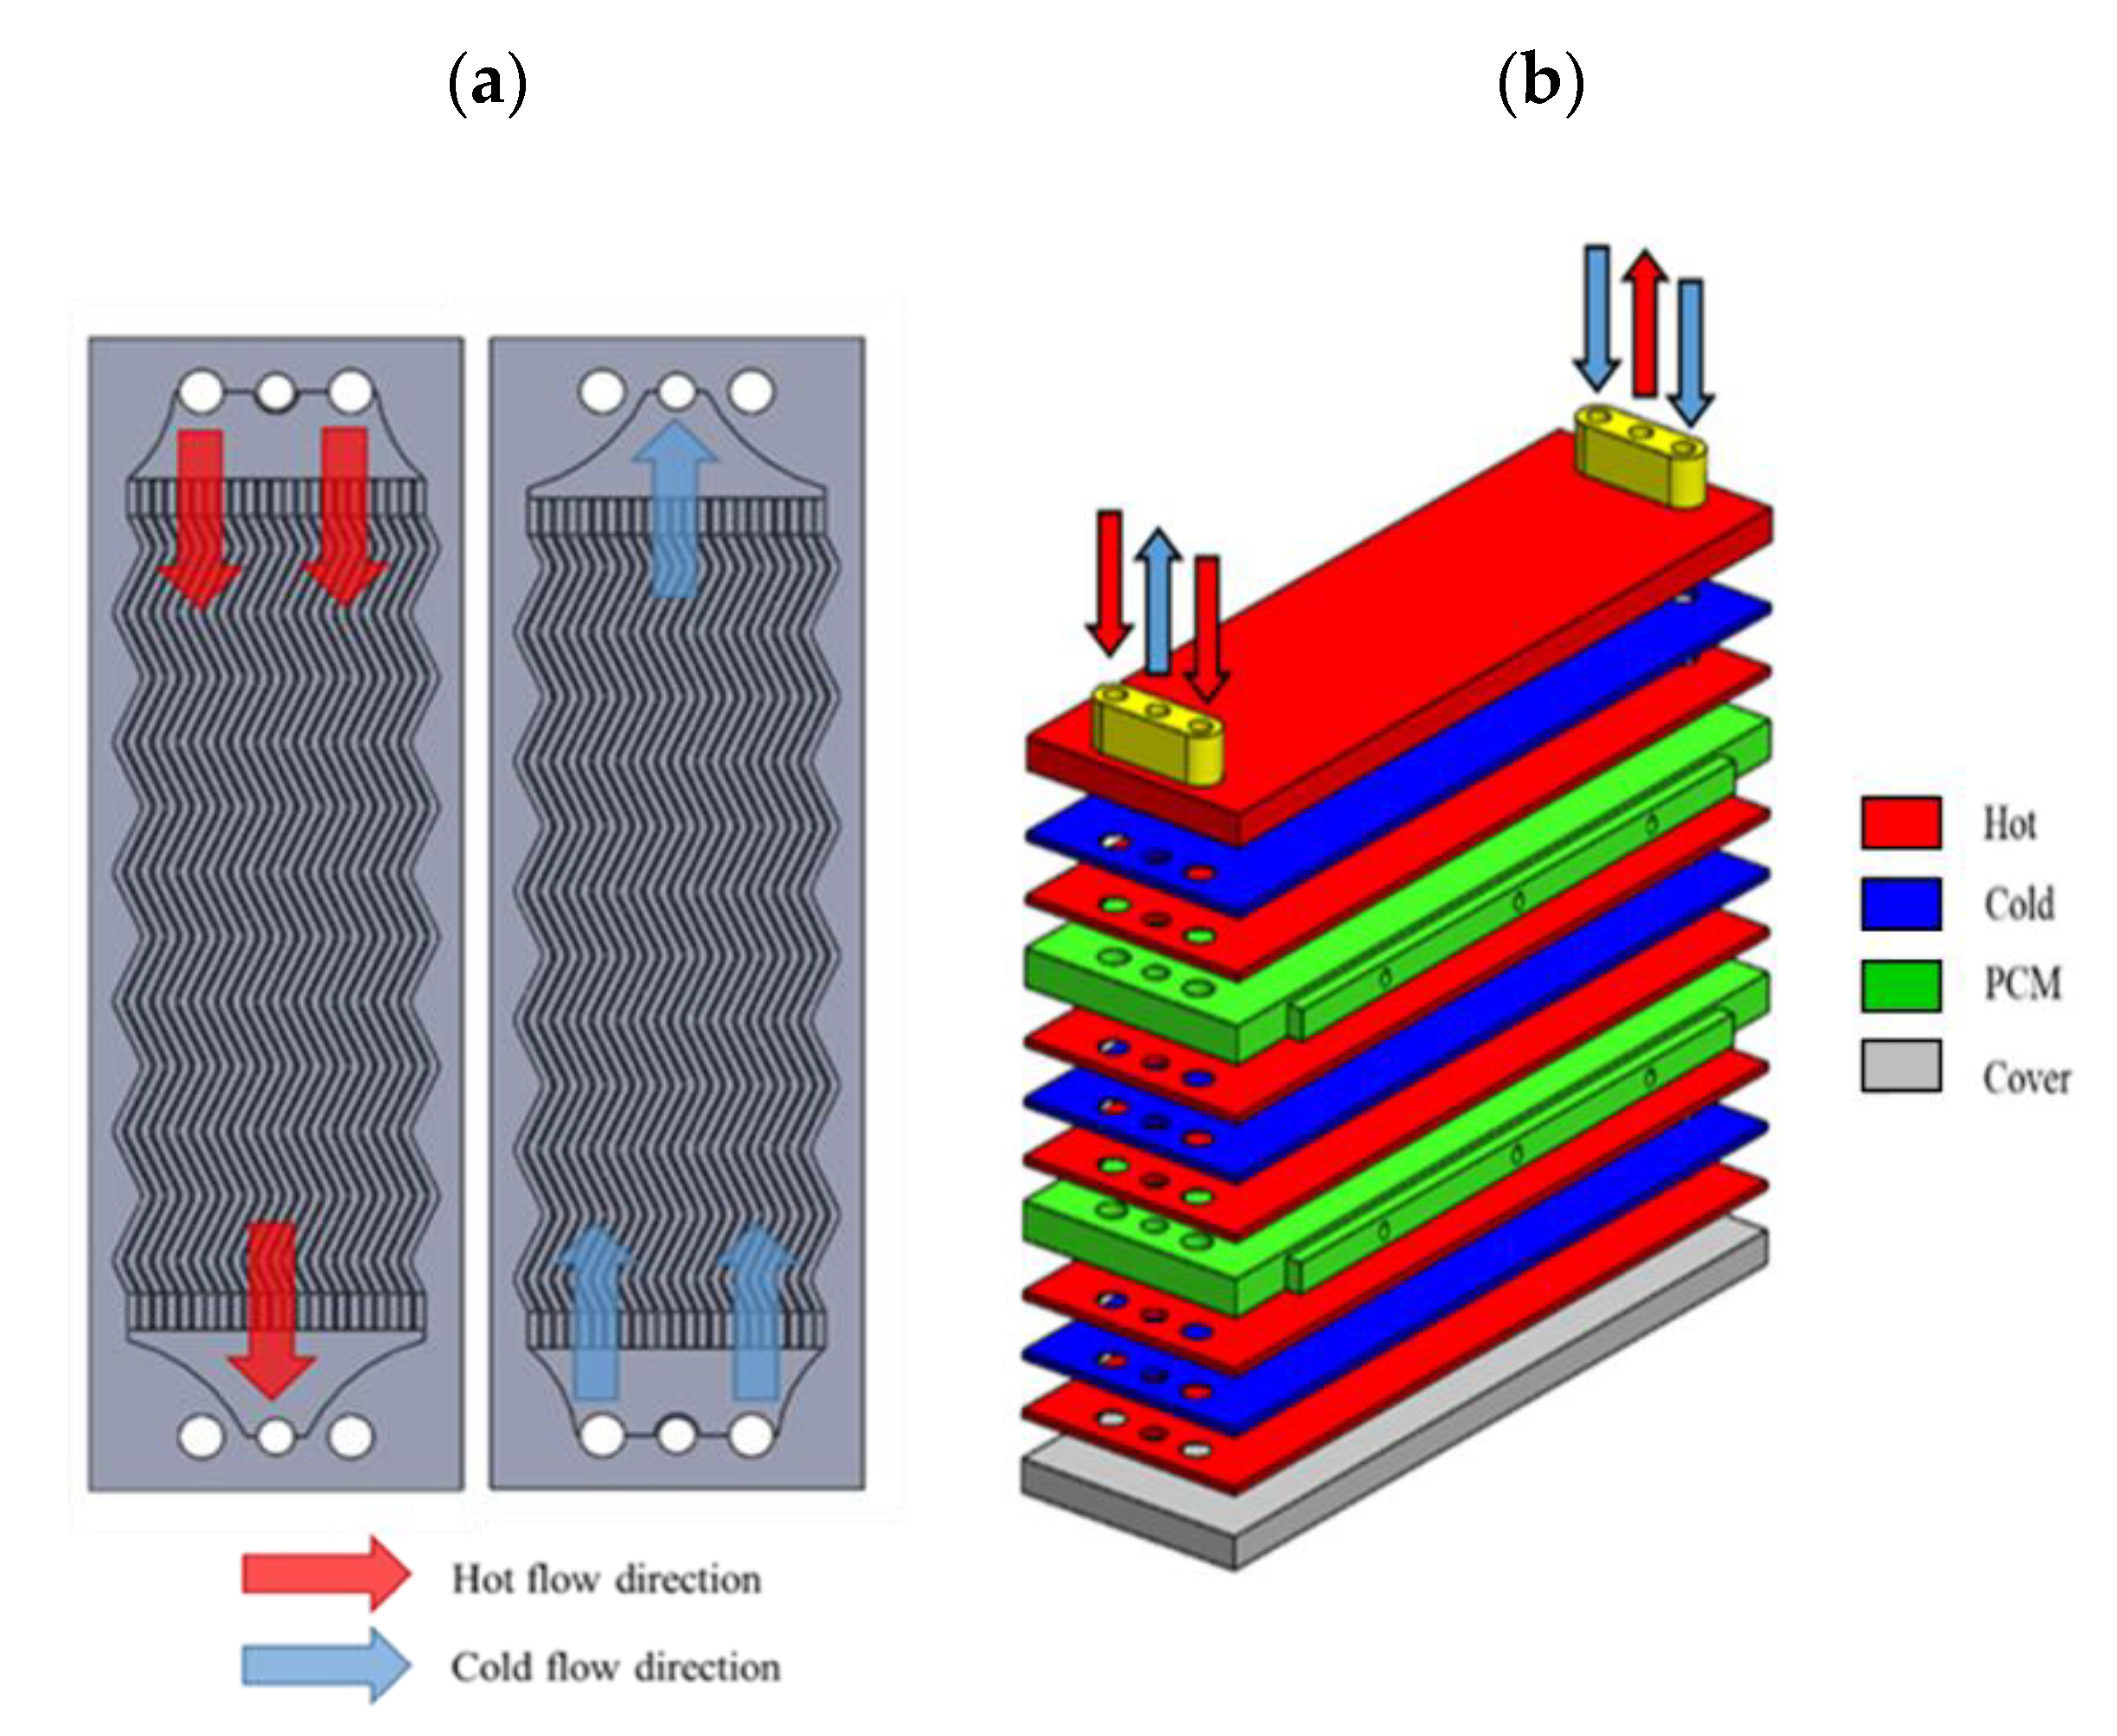
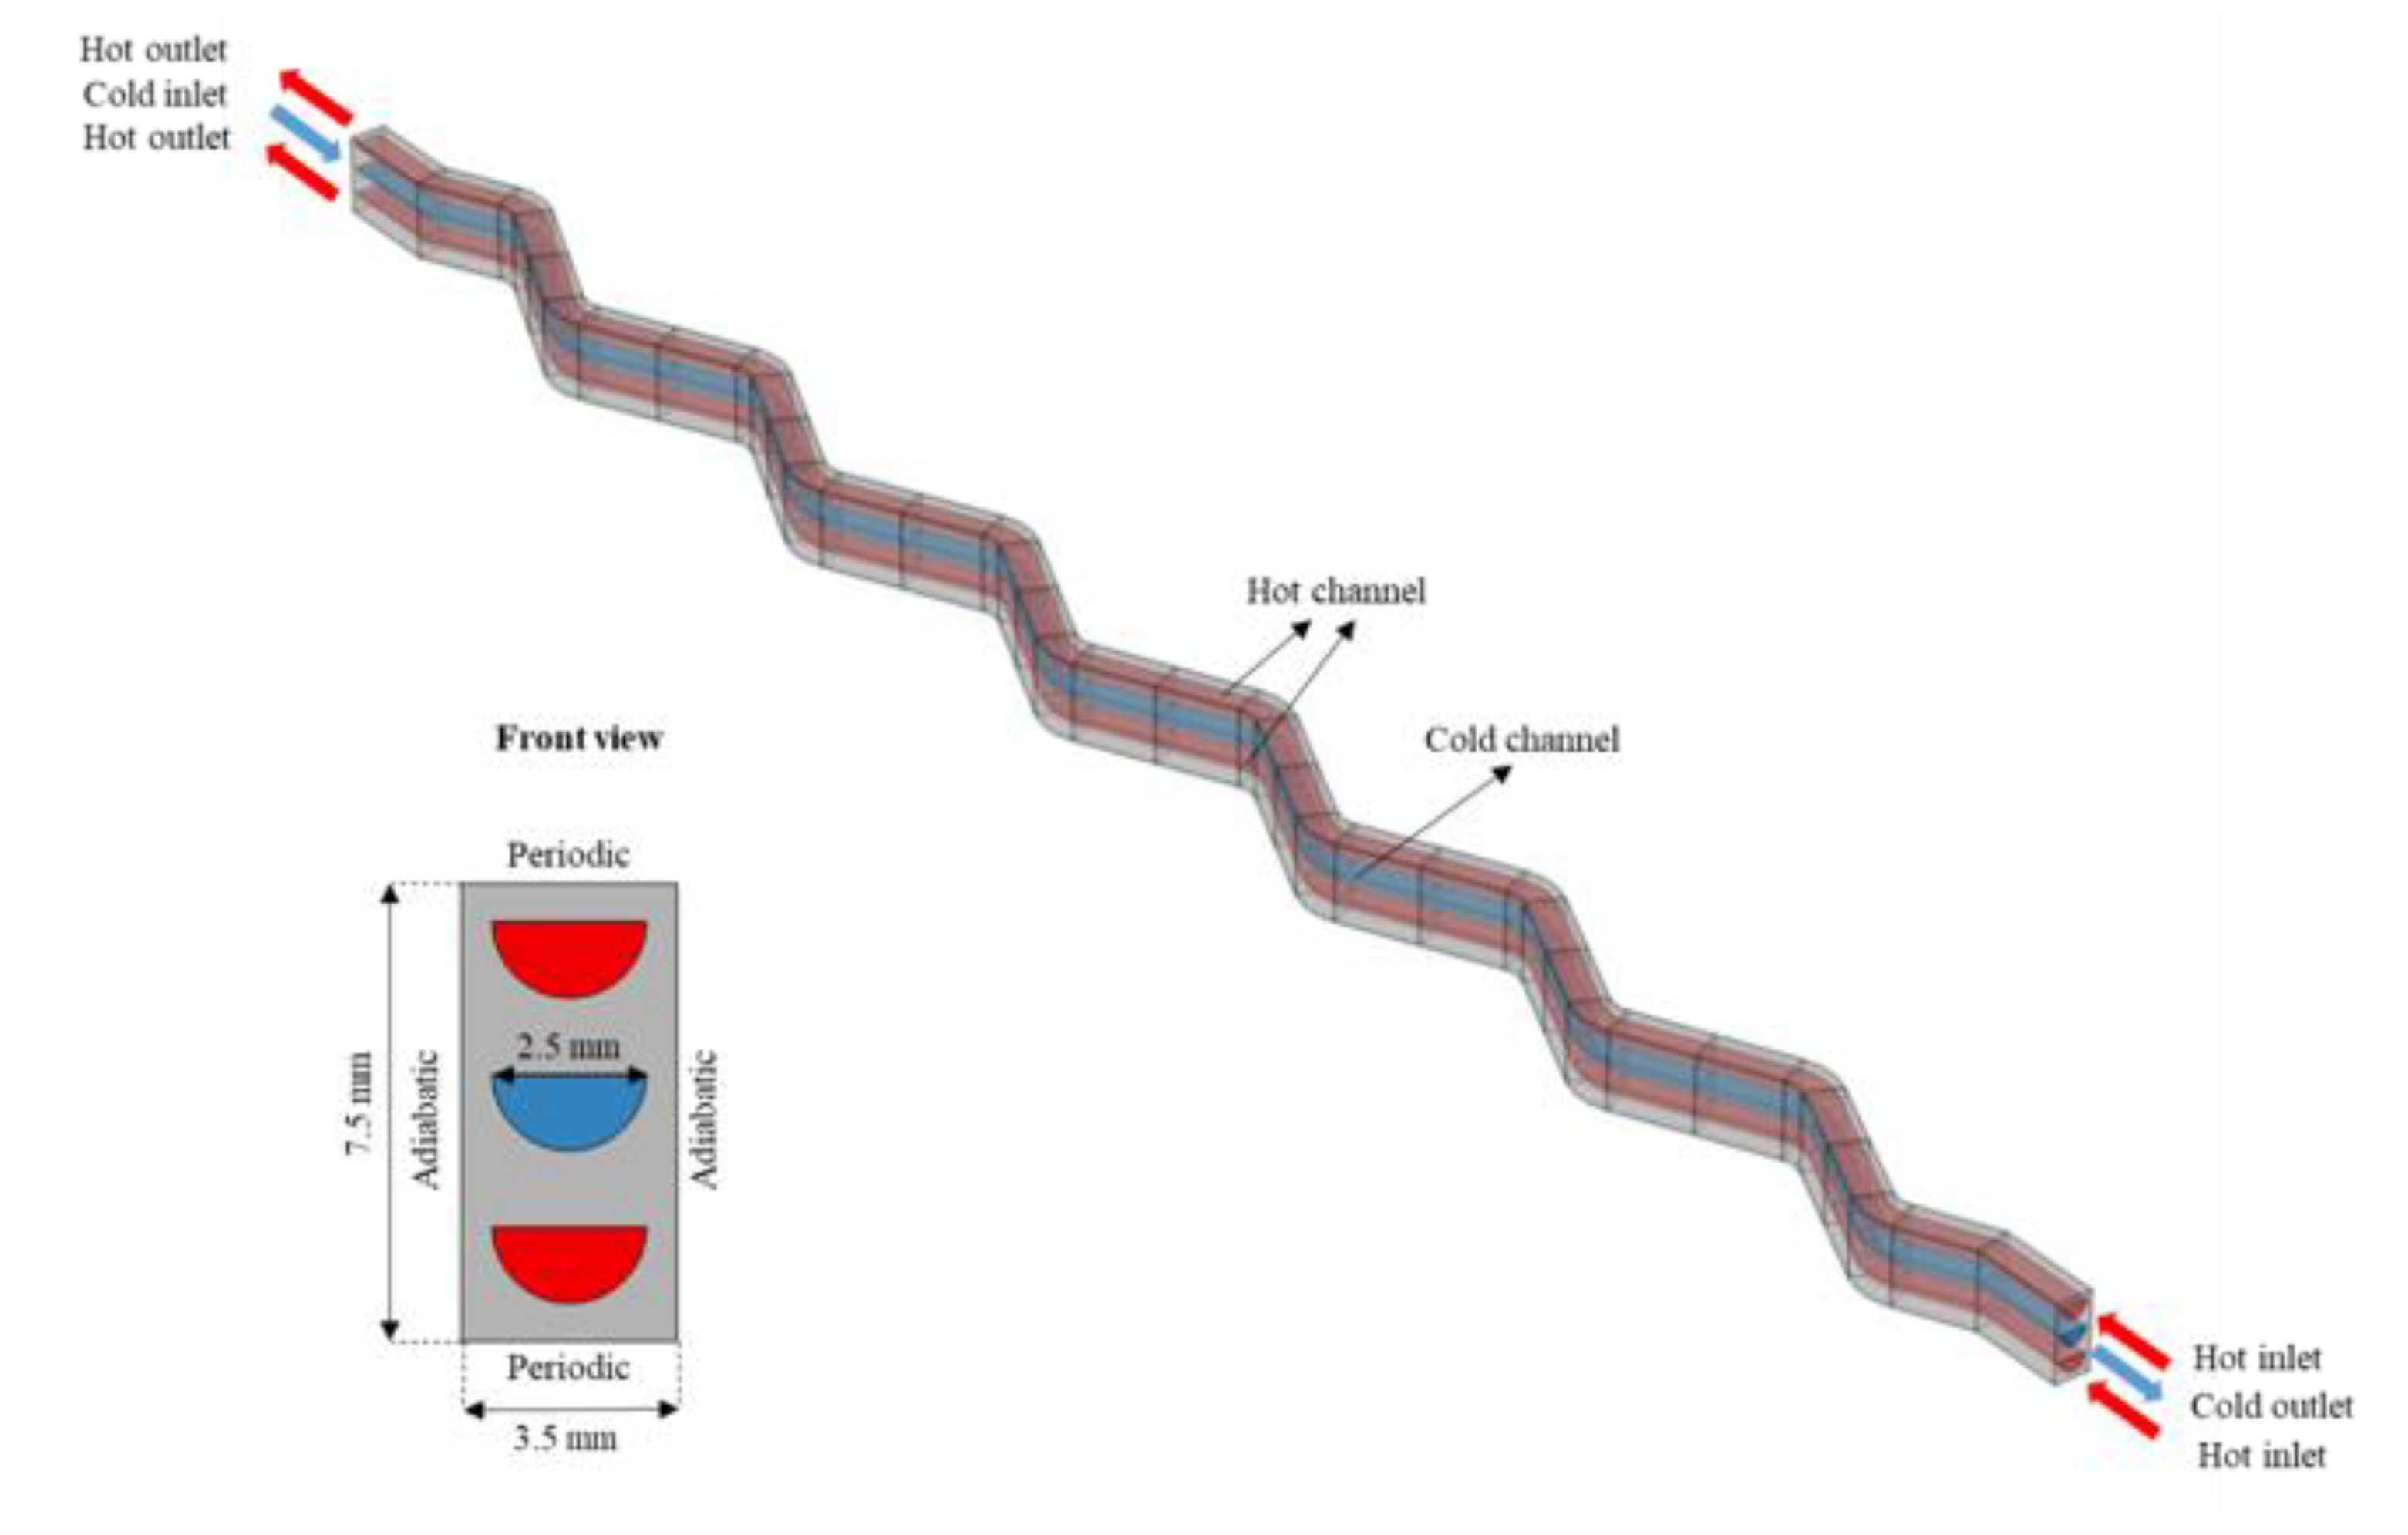
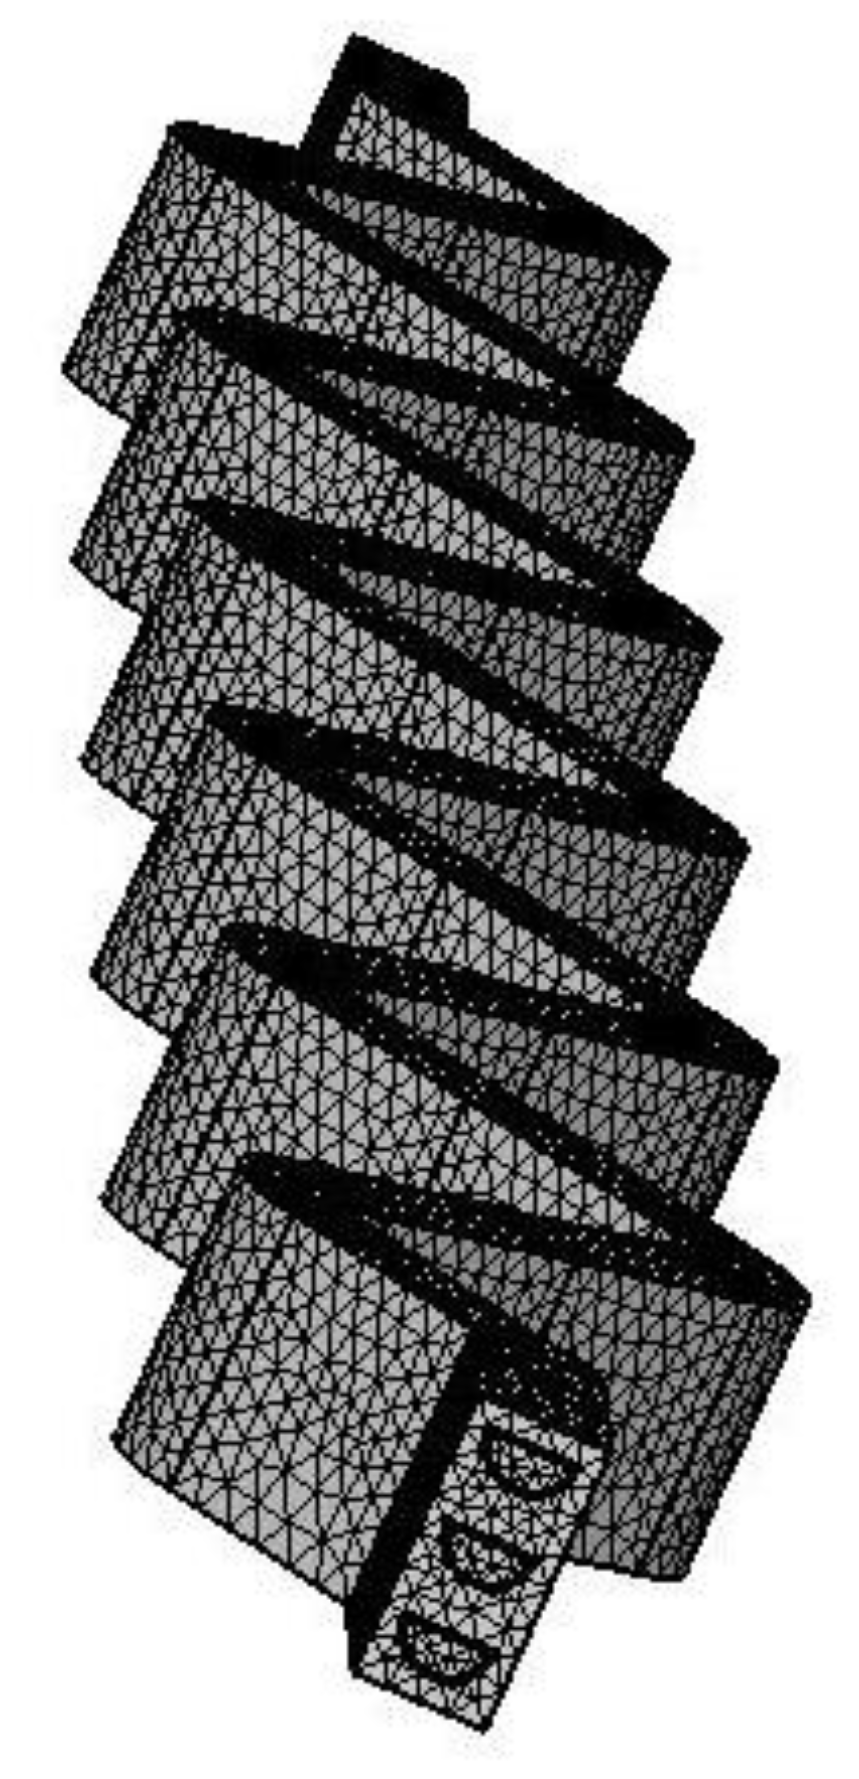
2.3. Schematic of the PHE Model

SolidWorks established the 3D PHE model for numerical simulation. The structure of the PHE is of the double-banking type, based on the stack of a cold flow channel sandwiched by two hot flow channels. It repeats periodically, as shown in Figure 2b. The entire PHE can be approximated by such a simplified model with periodic boundaries on the top and bottom surfaces, and since the simulation focuses on the vertical heat transfer, the lateral surface boundaries are set to be adiabatic [26,27,28], as shown in Figure 4, to save computation time. The channel geometry is the same as the practical PHE geometry and simplified into three zigzag channels with semicircular cross-sections. The diameter of the semicircular channel is 2.5 mm, and the length and width of the cross-sectional area are 7.5 and 3.5 mm, respectively.

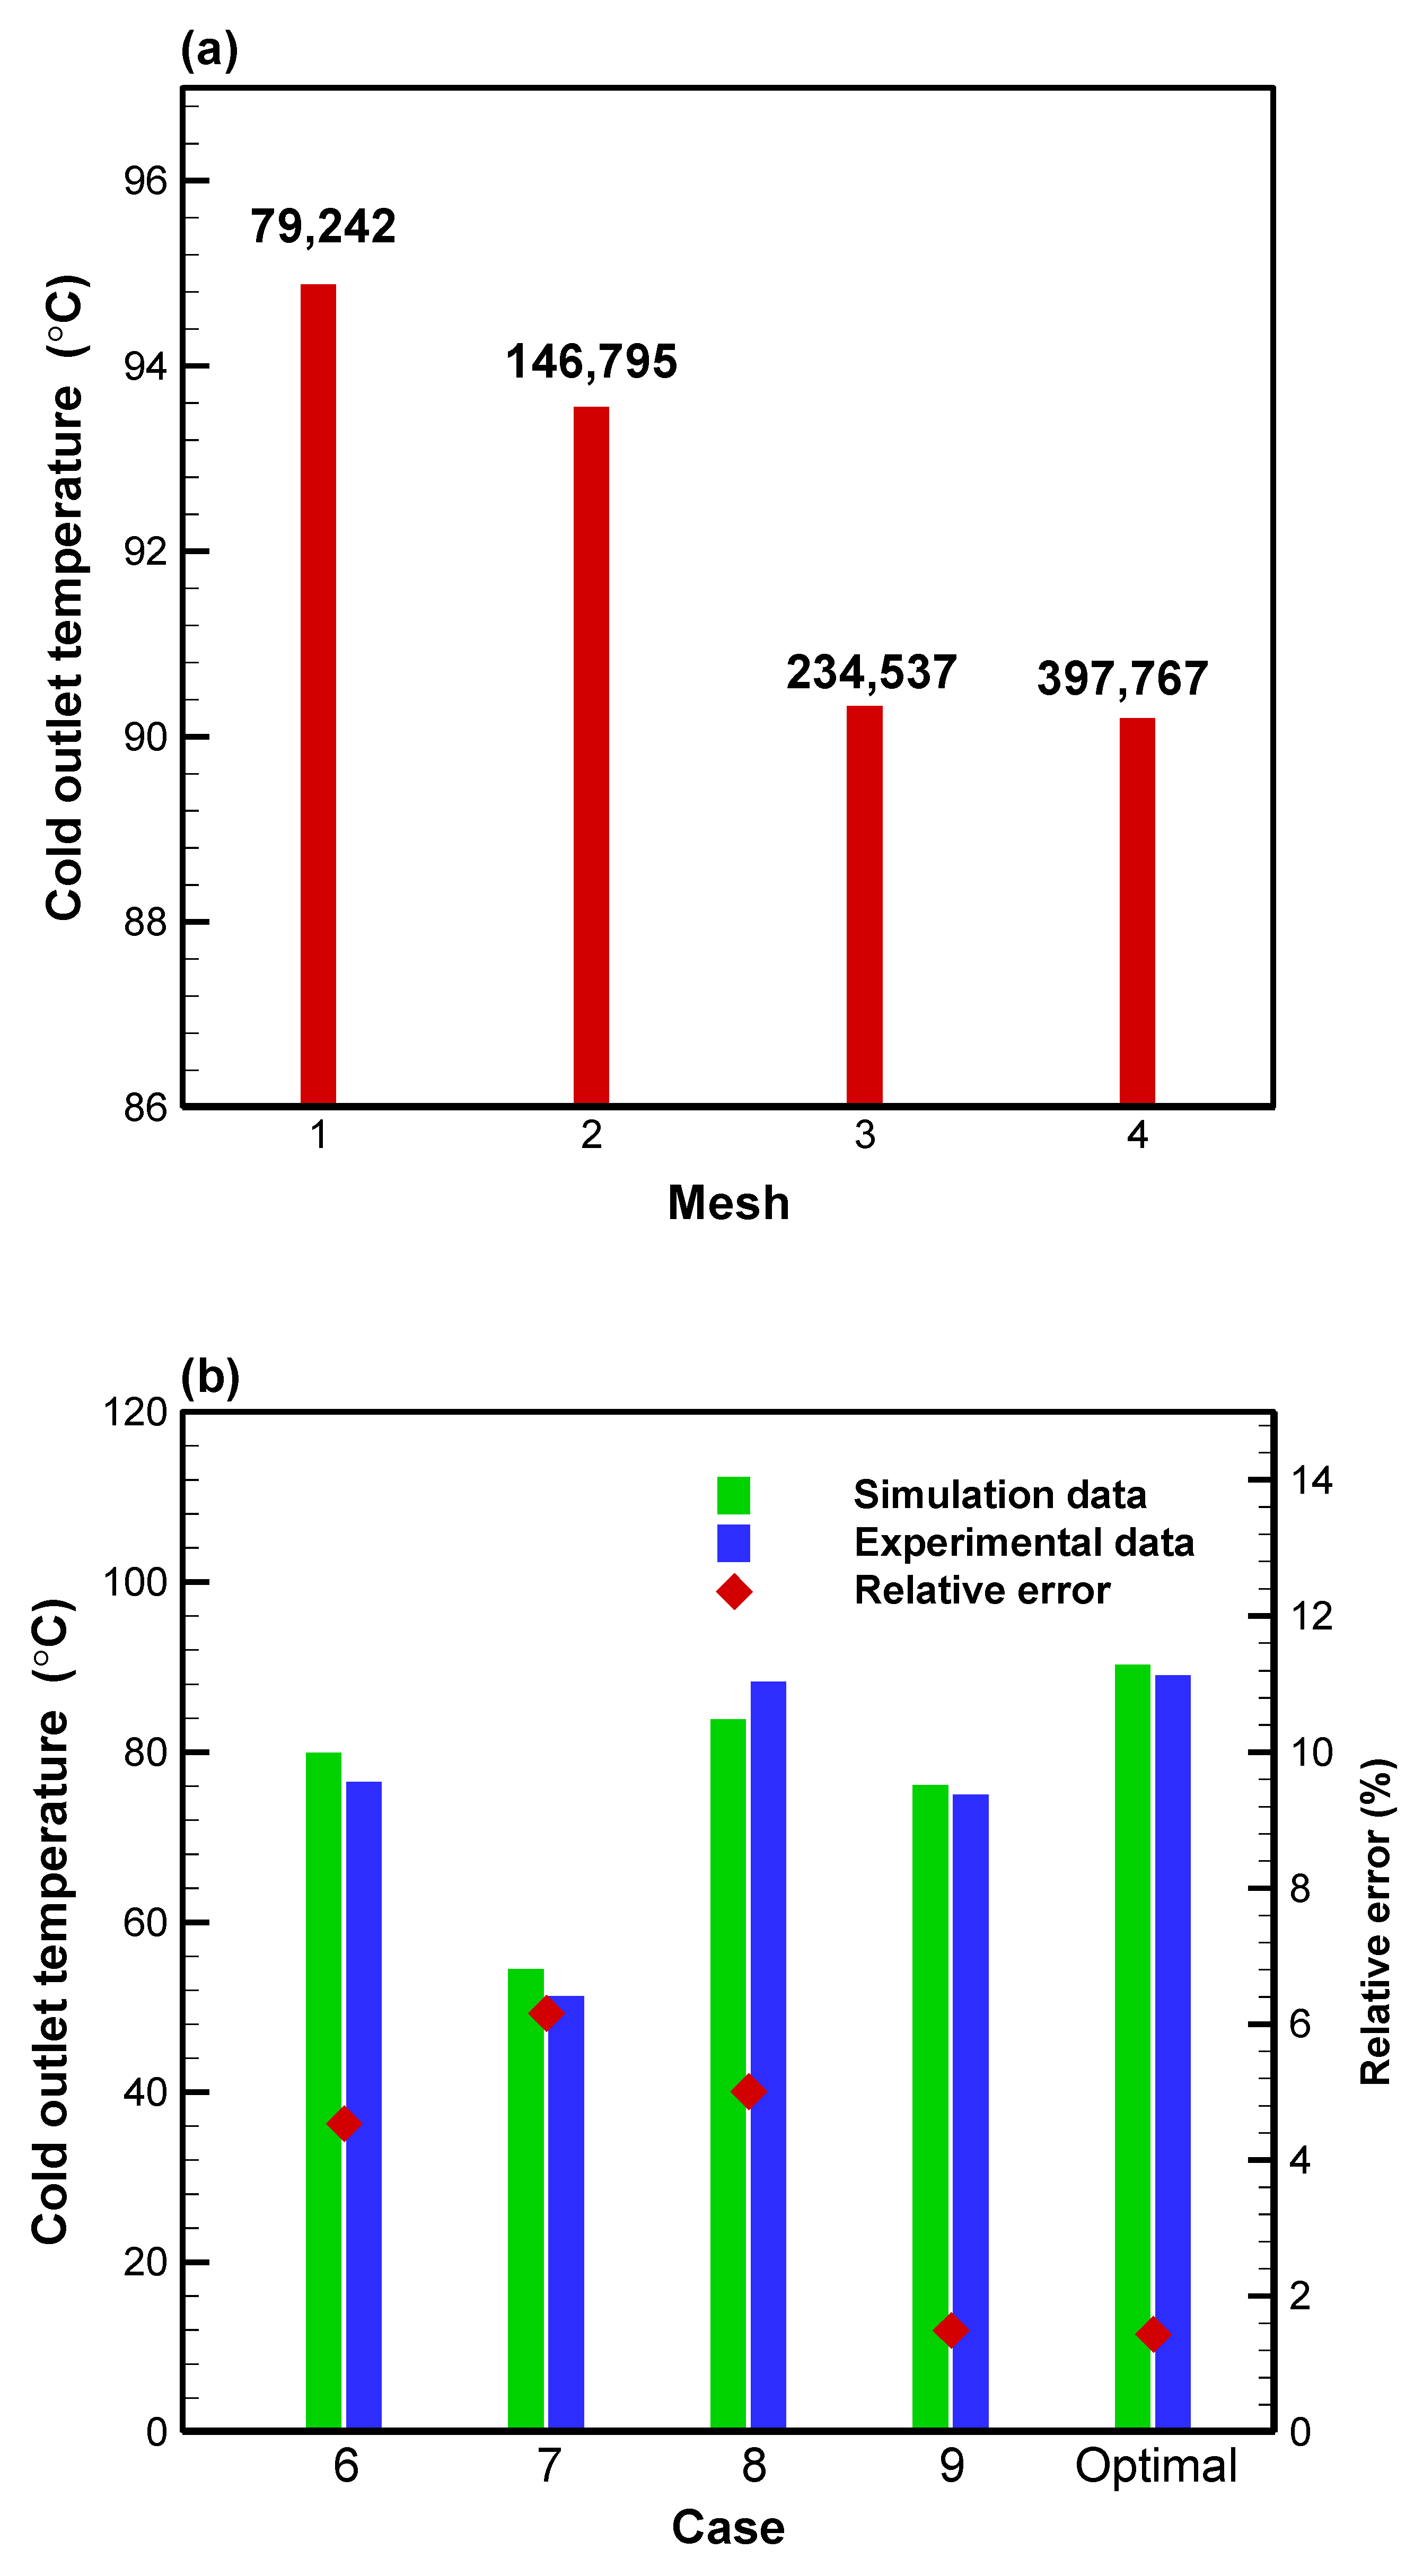
2.4. Theoretical Model and Numerical Simulation

The commercial software COMSOL Multiphysics is used for numerical simulation. The PHE is assumed to operate in a steady state without any heat source. It is well insulated from the surroundings, and the heat loss is ignored. Since the Reynolds number is less than 4000, the model of incompressible laminar flow is employed in the flow channels. The problem involves fluid motion with heat transfer between solid and fluid flows [29,30]. The continuity equation is:
· V = 0
where V is the flow velocity. The momentum equations are:
ρ ( V · ) V = p + · K
where ρ is the water density, p is the pressure, and K is the effect of viscous force. The energy equation for water flow is:
ρ c p ( u T x + v T y + w T z ) = κ ( 2 T x 2 + 2 T y 2 + 2 T z 2 )
where κ is the thermal conductivity, cp is the specific heat of water, and T is the temperature. The heat diffusion equation in the solid regions is:
2 T x 2 + 2 T y 2 + 2 T z 2 = 0
Figure 5 shows the typical grid system and the constructed grid systems were tested before performing numerical simulations. Four grid systems with different grid numbers were established and used to perform simulations under the optimal operating conditions predicted by the Taguchi method. The inlet temperature and velocity of the hot and cold water are set to 95 °C and 0.098 m/s as well as 10 °C and 0.049 m/s, respectively. The outlets are considered to be at atmospheric pressure. The wall boundary layer does not slip and ignores the effect of gravity. The temperature at the outlet of the cold flow is used for comparison. As shown in Figure 6a, the numerical result approaches a constant gradually with an increasing mesh number. Because the relative error between the results of Mesh 3 and Mesh 4 is less than 1%, the grid system of Mesh 3 was employed to reduce time consumption and obtain sufficient accuracy.
The grid system of Mesh 3 is further verified by comparing the numerical predictions with experimental data. Five typical cases, including Cases 6, 7, 8, and 9, and the optimal case in Table 3, are considered for comparisons and illustrated in Figure 6b. For the optimal case, the measured temperature at the outlet of cold flow is 89.0, while the numerical simulation is 90.3, with a relative error of 1.4% only. The relative errors between the experimental and numerical results are always less than 7% for the other cases. This confirms that the grid system of Mesh 3 is sufficient to provide reliable simulation results and that numerical validations are achieved.

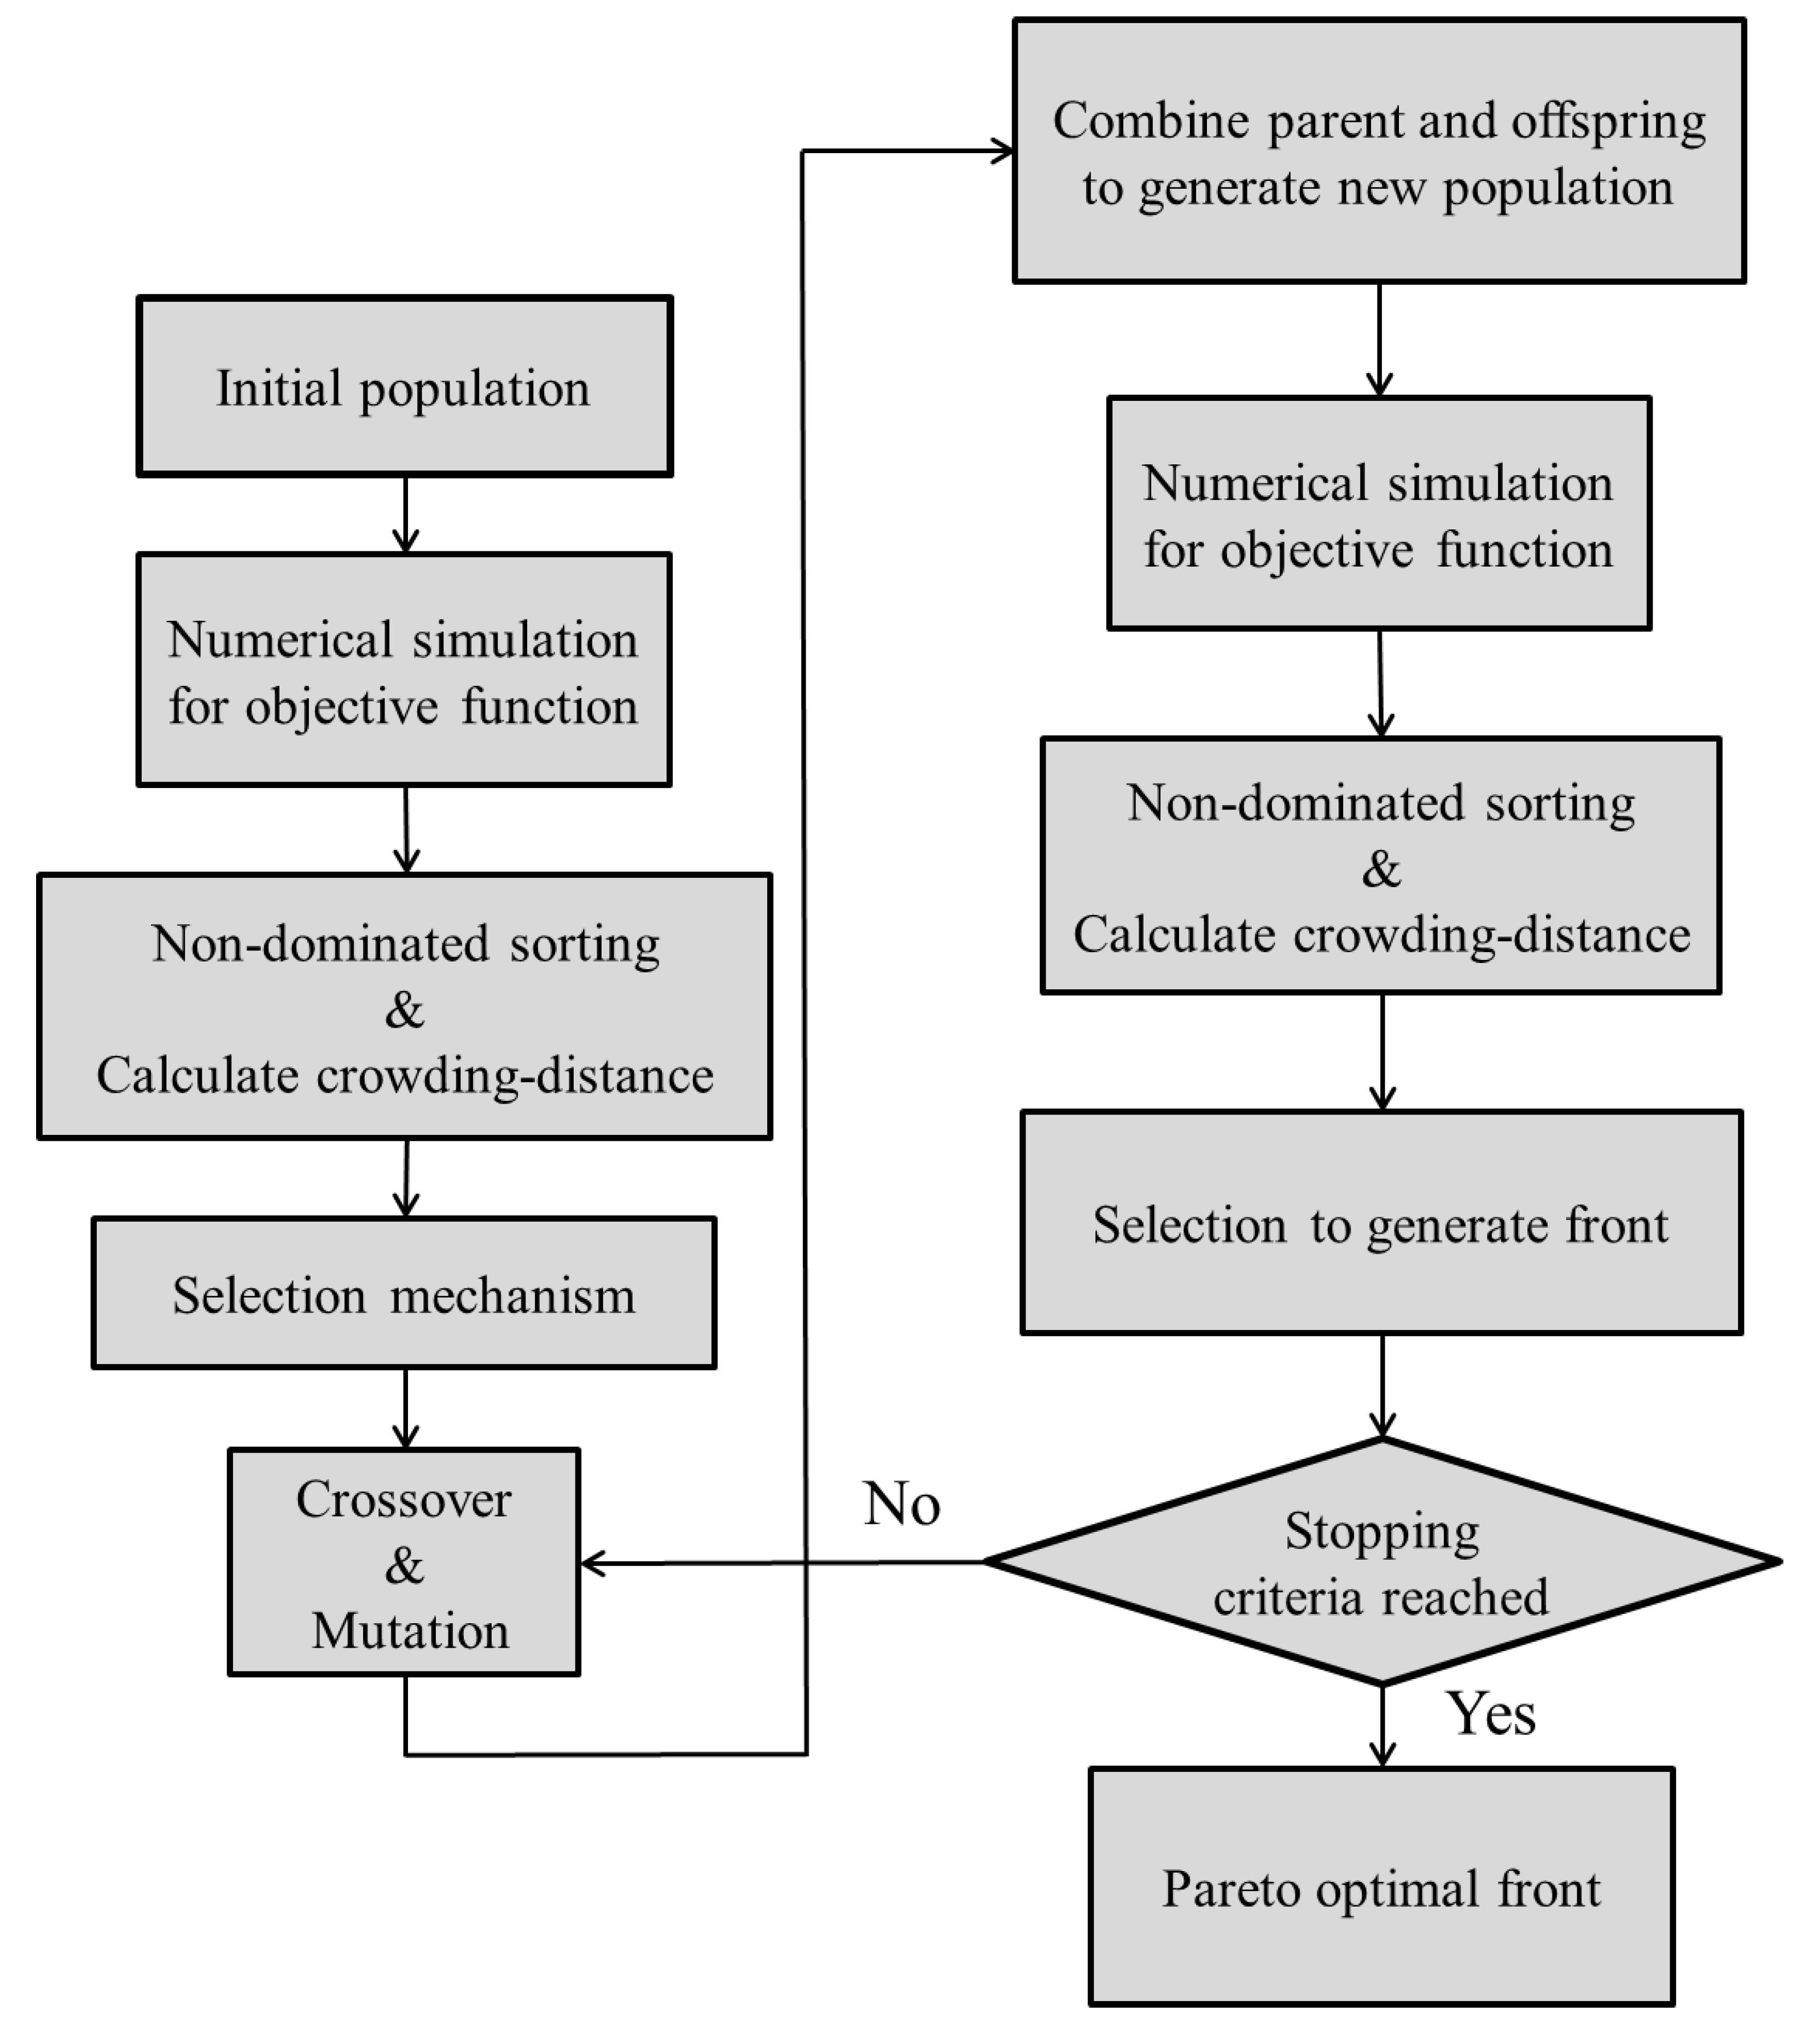
2.5. Genetic Algorithm for Multi-Objective Optimization

The genetic algorithm NSGA-II is employed in this study to optimize multi-objective functions. The mathematical definition of multi-objective optimization is as follows [31]:
Maximize/minimize:
f i ( x ) i i = 1 , ,   N
Subject to constraints:
g j ( x ) = 1 , ,   M j = 1 , ,   M
h k ( x ) 1 , ,   M k = 1 , ,   M
where fi is the objective function, gj is the equality constraint, hk is the inequality constraint, and x is the design variable (geometrical parameter or working condition). The subscripts i, j, and k represent the number of the state variable.
Two objective functions are considered: the PHE’s effectiveness and pressure drop. The effectiveness is defined as Equation (2), and the pressure drop is expressed by:
P = P i n P o u t
The two objective functions conflict with each other; that is, an increase in effectiveness would induce a more significant pressure drop across the PHE. Hence, it is necessary to explore the Pareto optimal front [32] by weighing the two objective functions, and then the corresponding optimal PHE geometry can be determined. Based on the elite strategy and non-dominated sorting theory, the NSGA-II method can efficiently converge to a solution. The flow chart of this method is shown in Figure 7. COMSOL Multiphysics performed numerical simulations to generate the results of objective functions for the initial population. Combining the elite strategy with non-dominated sorting allows for the retention of high-quality solutions as well as the identification of the front of all solutions. The selection mechanism of the population consists of high-rank solutions. When two solutions have the same rank, the solution with the larger crowding distance is selected. After crossover and mutation, a new population is generated by combining the parents, and the selection mechanism is also identified. Finally, the iteration is completed to generate the Pareto optimal front.
In the optimization of geometric design, the feasible design variables are the entrance length, the bending angle, and the fillet radius, as illustrated in Figure 8. The entrance length is between 10 and 20 mm, the bending angle is between 100 and 150°, and the fillet radius is between 1.8 and 5 mm. Each variable was modified based on the practical flow channel geometry and references [33,34]. Here, the variables were updated and calculated by the NSGA-II algorithm, which was implemented in the MATLAB environment. The updated variables were inserted into COMSOL Multiphysics, and SolidWorks created the geometry.

3. Results and Discussion

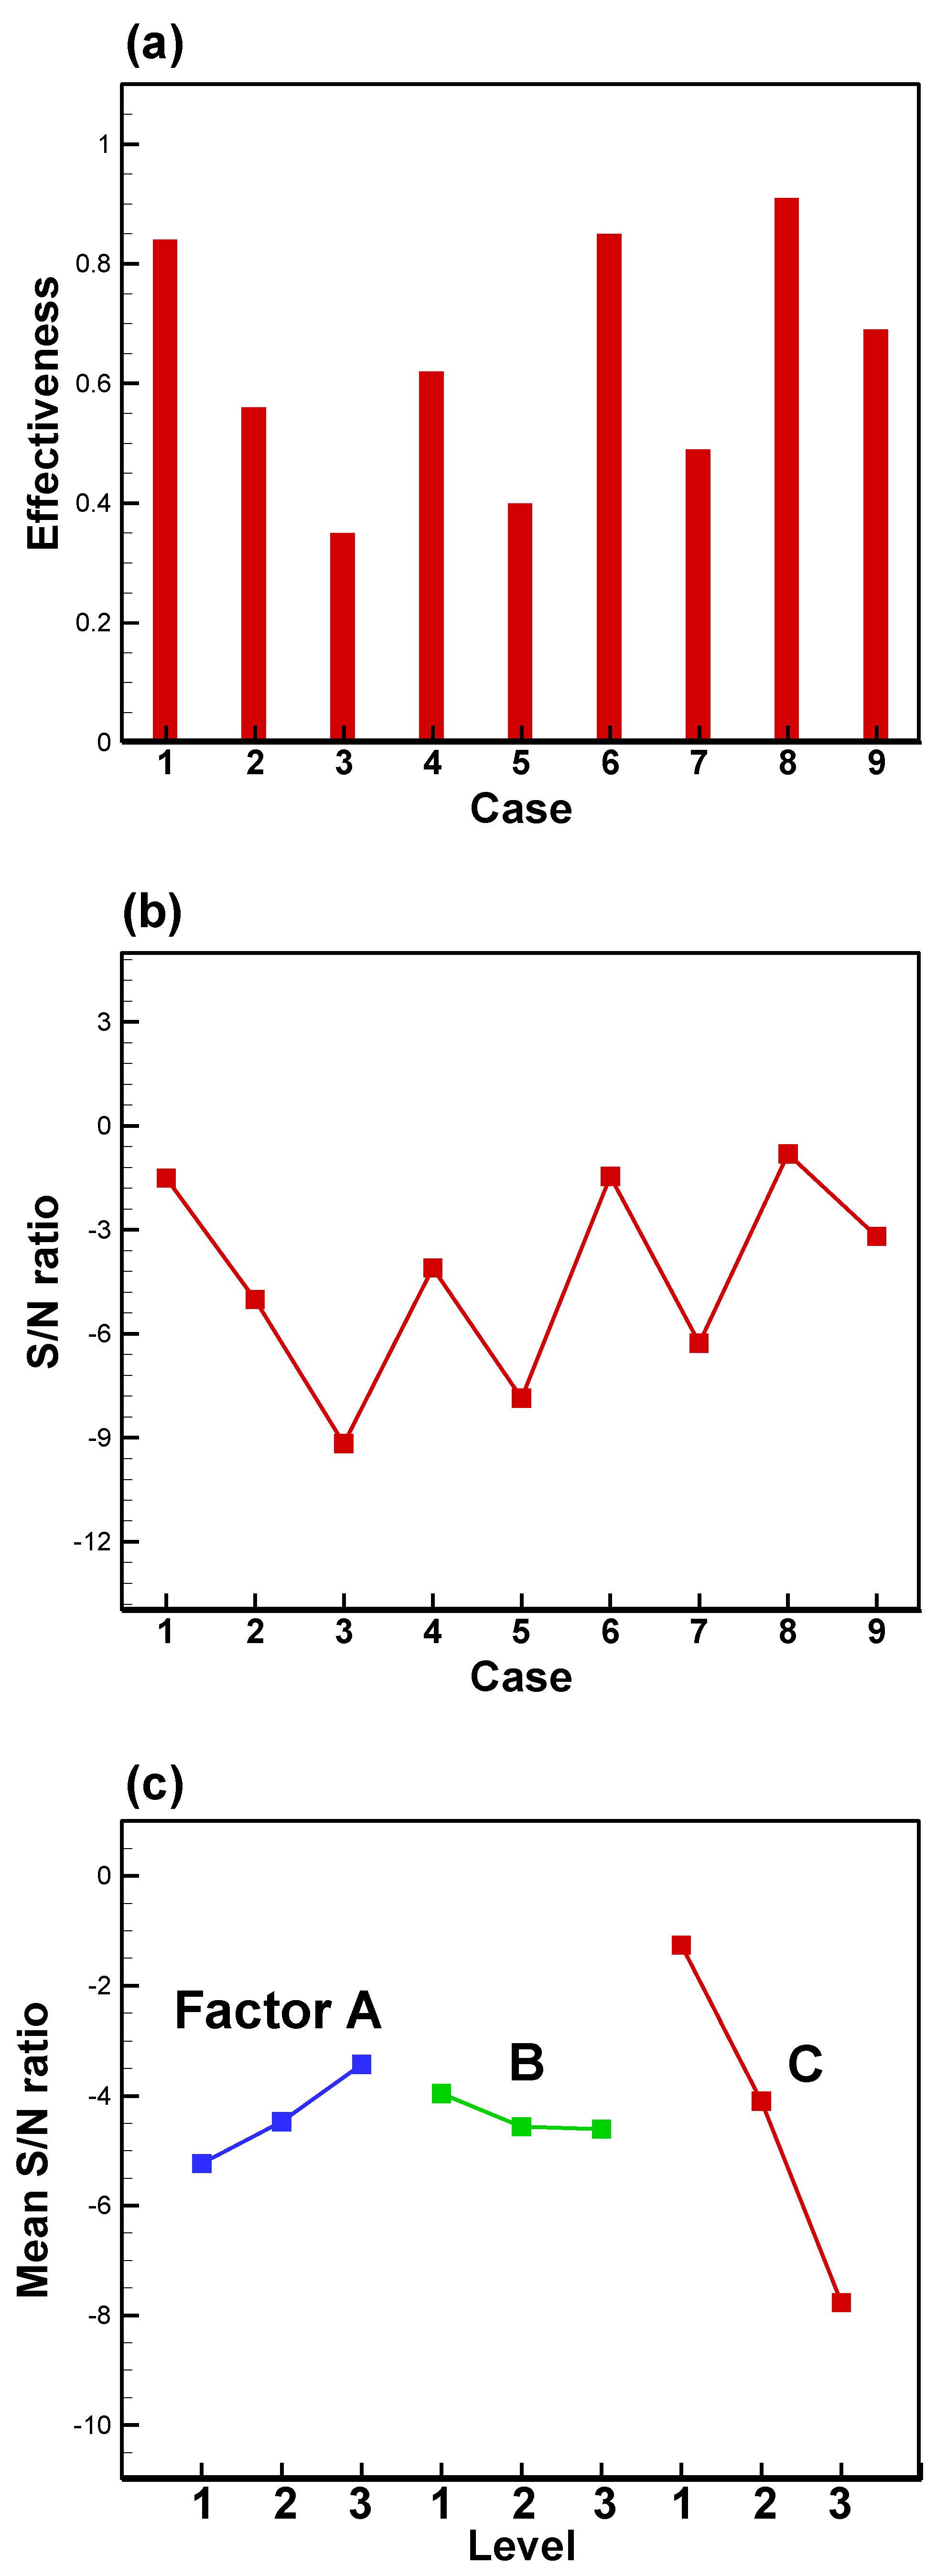
3.1. Operating Factor Analysis by the Taguchi Method
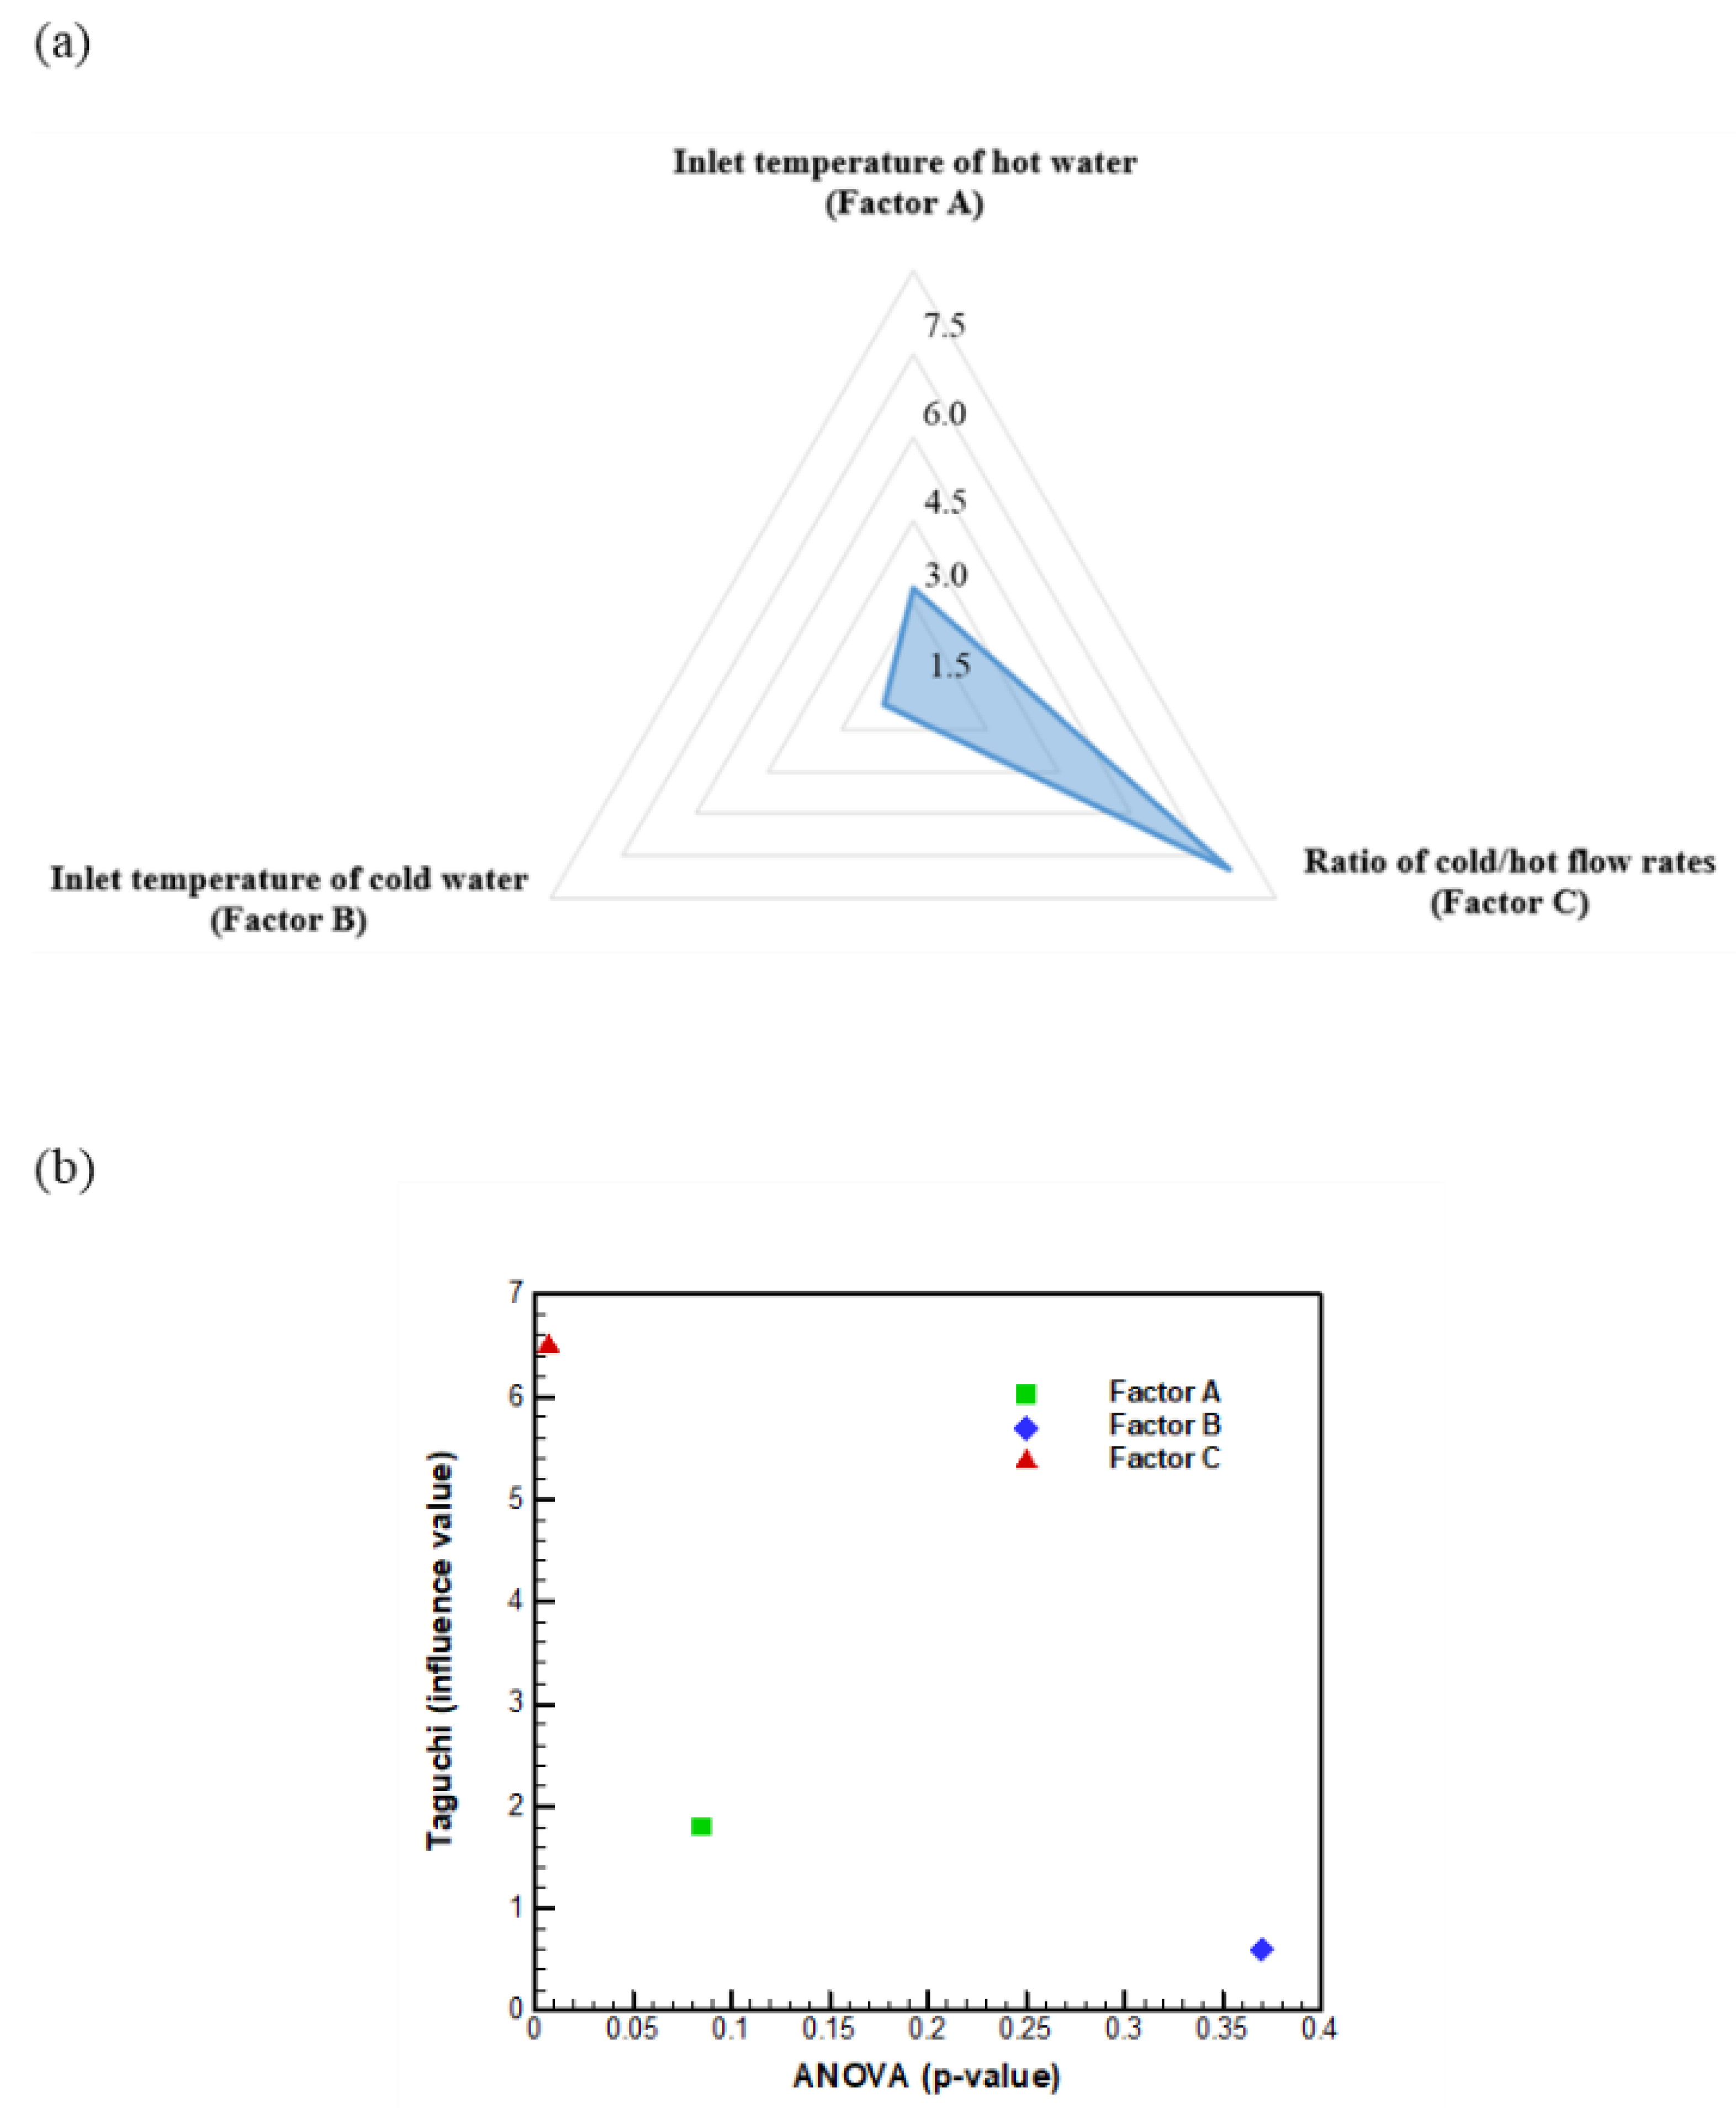
Experiments were carried out according to the nine cases listed in Table 3, and the results for the effectiveness are shown in Figure 9a. In the experimental study, each experiment was performed at least twice. The uncertainty analysis suggested that the relative error was within 4%. This confirmed the high repeatability of experiments. It is found that Case 8 gives the highest effectiveness of 0.91, whereas Case 2 presents the lowest value of 0.56. The S/N ratio of each case was calculated by Equation (1) to explore the influence of each factor on the quality variation [35], and the results are illustrated in Figure 9b. A comparison between Figure 9a,b suggests that a higher effectiveness value renders a greater quantity of the S/N ratio. The S/N ratios of Case 8 and Case 2 are −0.812 and −5.008, respectively. The mean S/N ratio is the average of the three S/N ratios for a factor at the same level [36], and the variations of the mean S/N ratio for the three factors with the levels are shown in Figure 9c. The influence of the factor on the objective function can be estimated by the difference between the maximum and minimum S/N ratios. The radar chart for the influences of the three factors (i.e., the effect values) is displayed in Figure 10a. The order of the effect magnitudes is Factor C (6.5) > Factor A (1.8) > Factor B (0.6). This result reveals that the flow rate ratio is the most crucial factor affecting the effectiveness of the PHE, and the inlet temperature of hot water is more influential than the inlet temperature of cold water.
According to the results demonstrated in Figure 9c, the optimal operating conditions for maximum effectiveness can be determined. The combination of the optimal operating conditions occurs at 95 °C of the inlet temperature of hot water (level 3), 10 °C of the inlet temperature of cold water (level 1), and 0.25 of the flow rate ratio (level 1). This operating state is not included in the 9 cases of the orthogonal array (Table 3). Hence, an experiment was performed further for this case, and the measured effectiveness was 0.945. This value is the highest value in comparison with the nine cases. The experimental study by Attalla et al. [37] for PHE also observed similar results. A reduction in the flow rate ratio or an increase in the inlet temperature of hot flow would be beneficial to improve the effectiveness of the heat exchanger. The present results show that the Taguchi method is an efficient technique for optimizing the operating parameters to enhance the effectiveness of a PHE.

3.2. ANOVA Analysis

The analysis of variance (ANOVA) is a statistical formula and is usually used to compare the variation between the mean values of different cases. Here we employed this method to identify the importance of the three factors in affecting the objective function. The analysis results are listed in Table 4. The table contains the F-value and p-value data, indicating a factor’s influence and significance [4,38]. A higher F-value means that the factor is more influential. Under the confidence interval of 95%, a p-value below 0.05 represents the influence of the factor is significant [39]. Among the three factors, Factor C′s F-value is 138.74, and its p-value is 0.007. This F-value is substantially larger than those of the other two factors, while the p-value is by far smaller than those of the other two factors. This implies that the flow rate ratio is a significant factor in determining the PHE’s effectiveness. Figley et al. [40] also observed similar results and reported that the flow rate ratio played an important role in affecting the effectiveness of a printed circuit heat exchanger.
The F-values of the three factors follow the order of Factor C (138.74) > Factor A (10.73) > Factor B (1.7). This feature is in line with that of the Taguchi approach. It has been reported that there is a linear correlation between the effect value in the Taguchi method and the F-value in ANOVA [41]. Meanwhile, the rank for the significance of the three factors according to the p-value is Factor C (0.007) > Factor A (0.085) > Factor B (0.37). The trend in the relationship between the F-value and the p-value, as shown in Figure 10b, conforms with the result of a past study [42]. In summary, the results of ANOVA are consistent with those predicted by the Taguchi method. Specifically, the factor possessing the lowest p-value also presents the highest influence value in the Taguchi method.

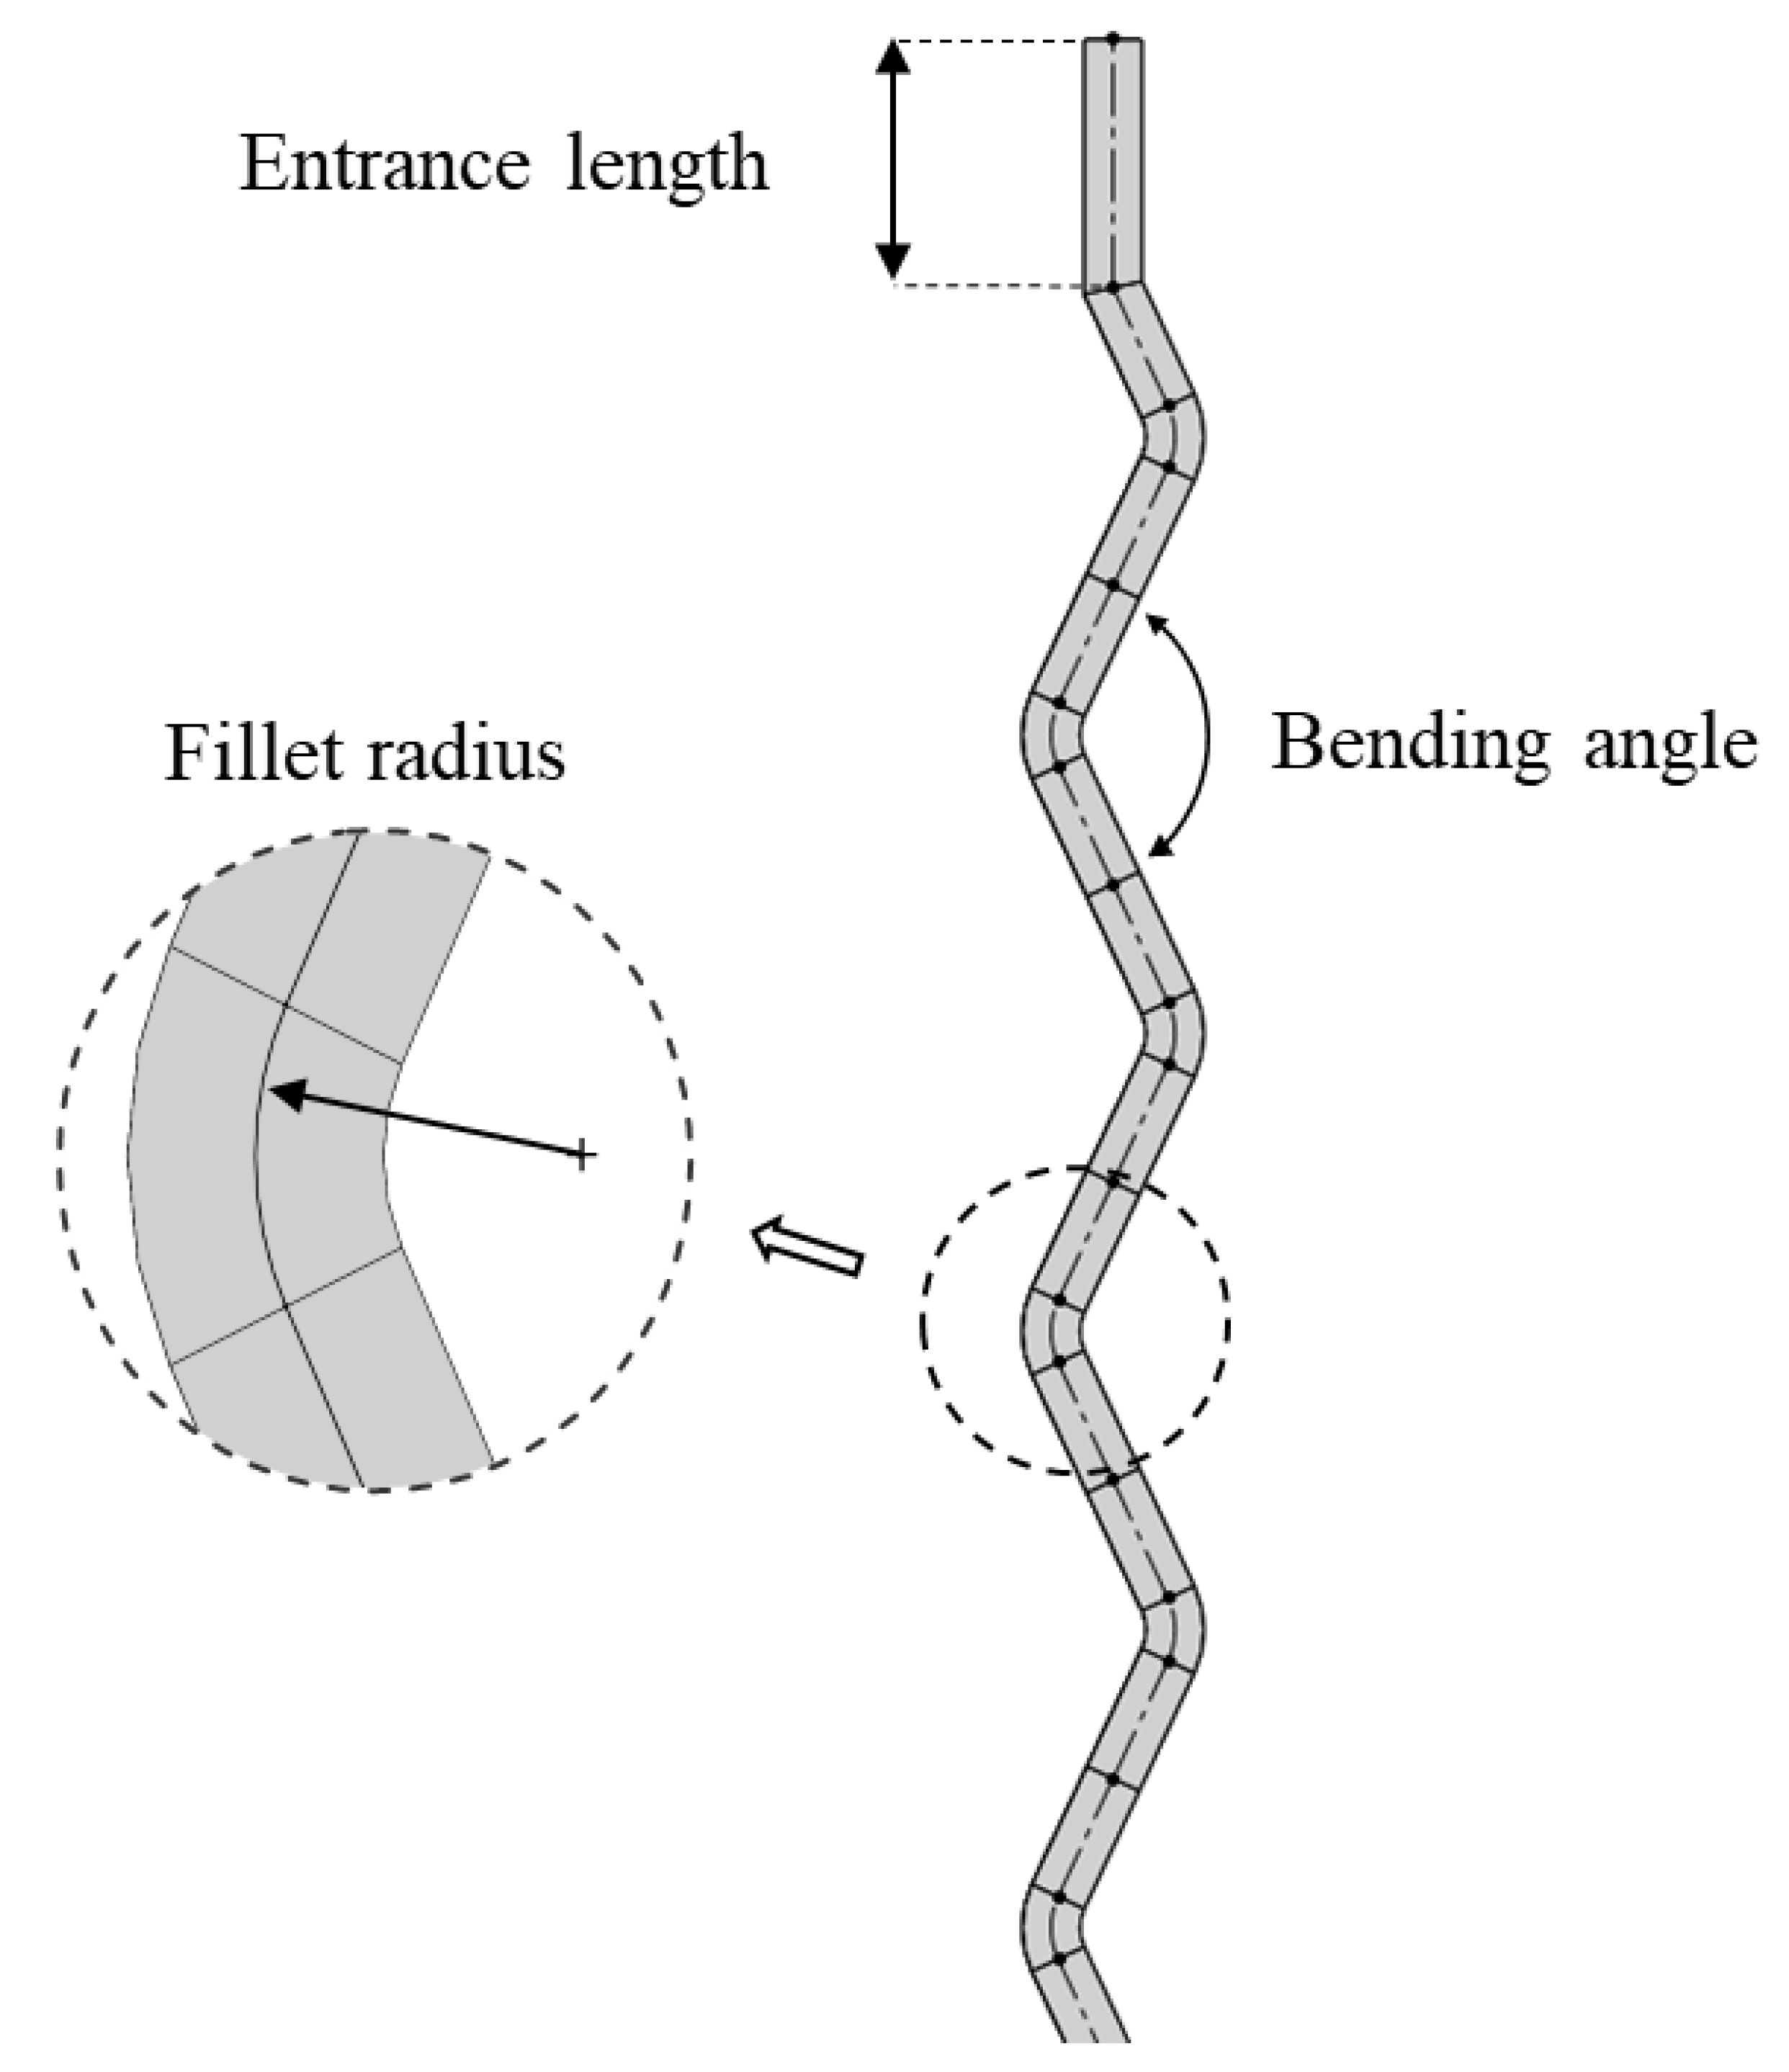
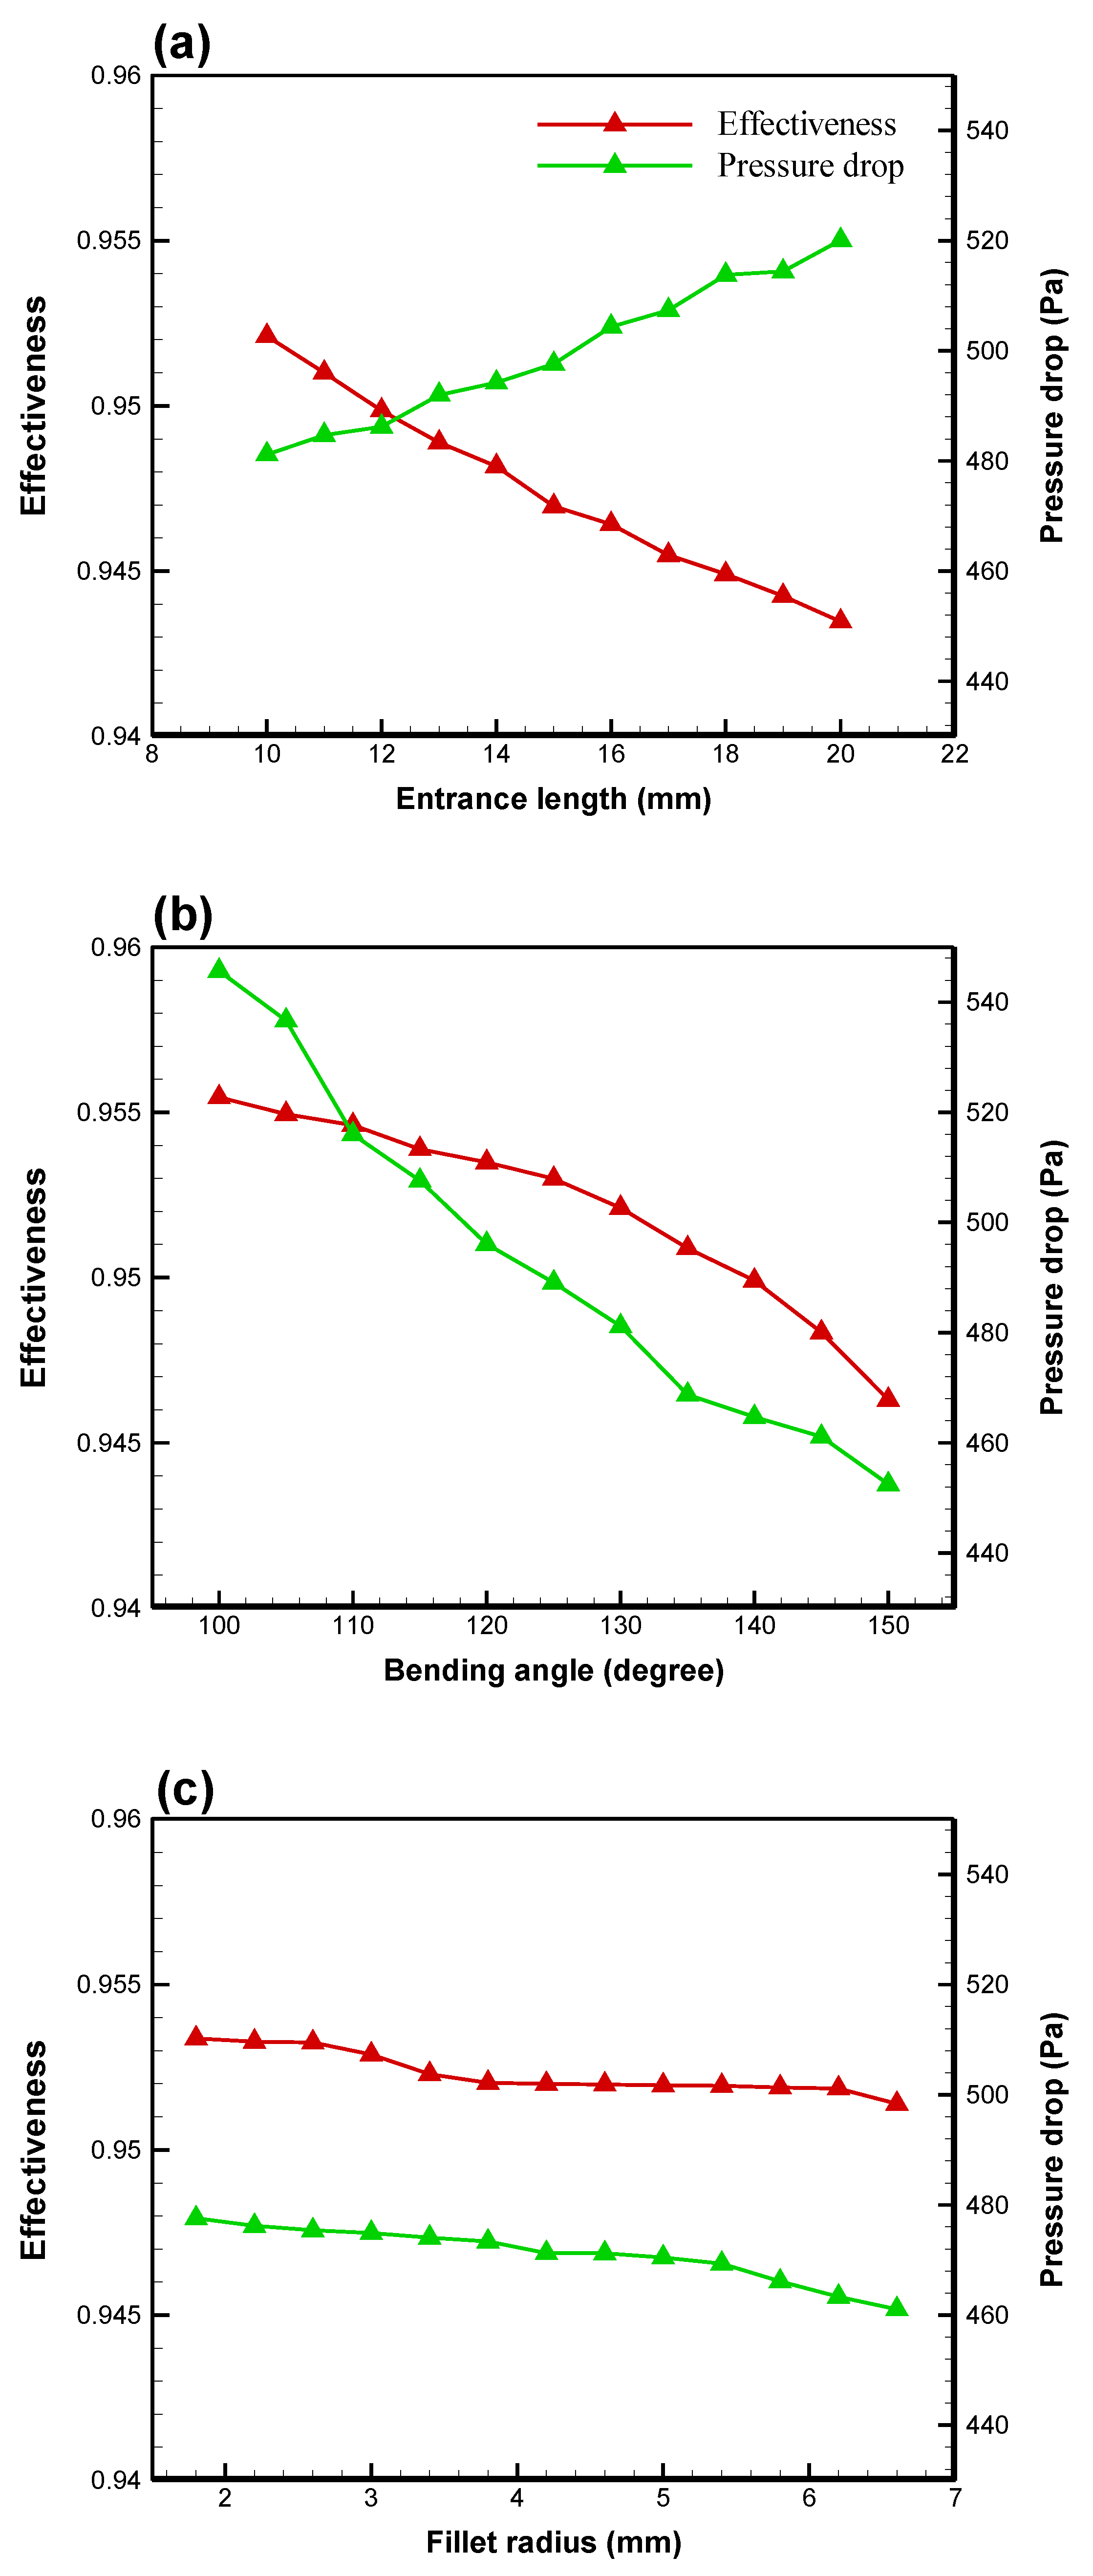
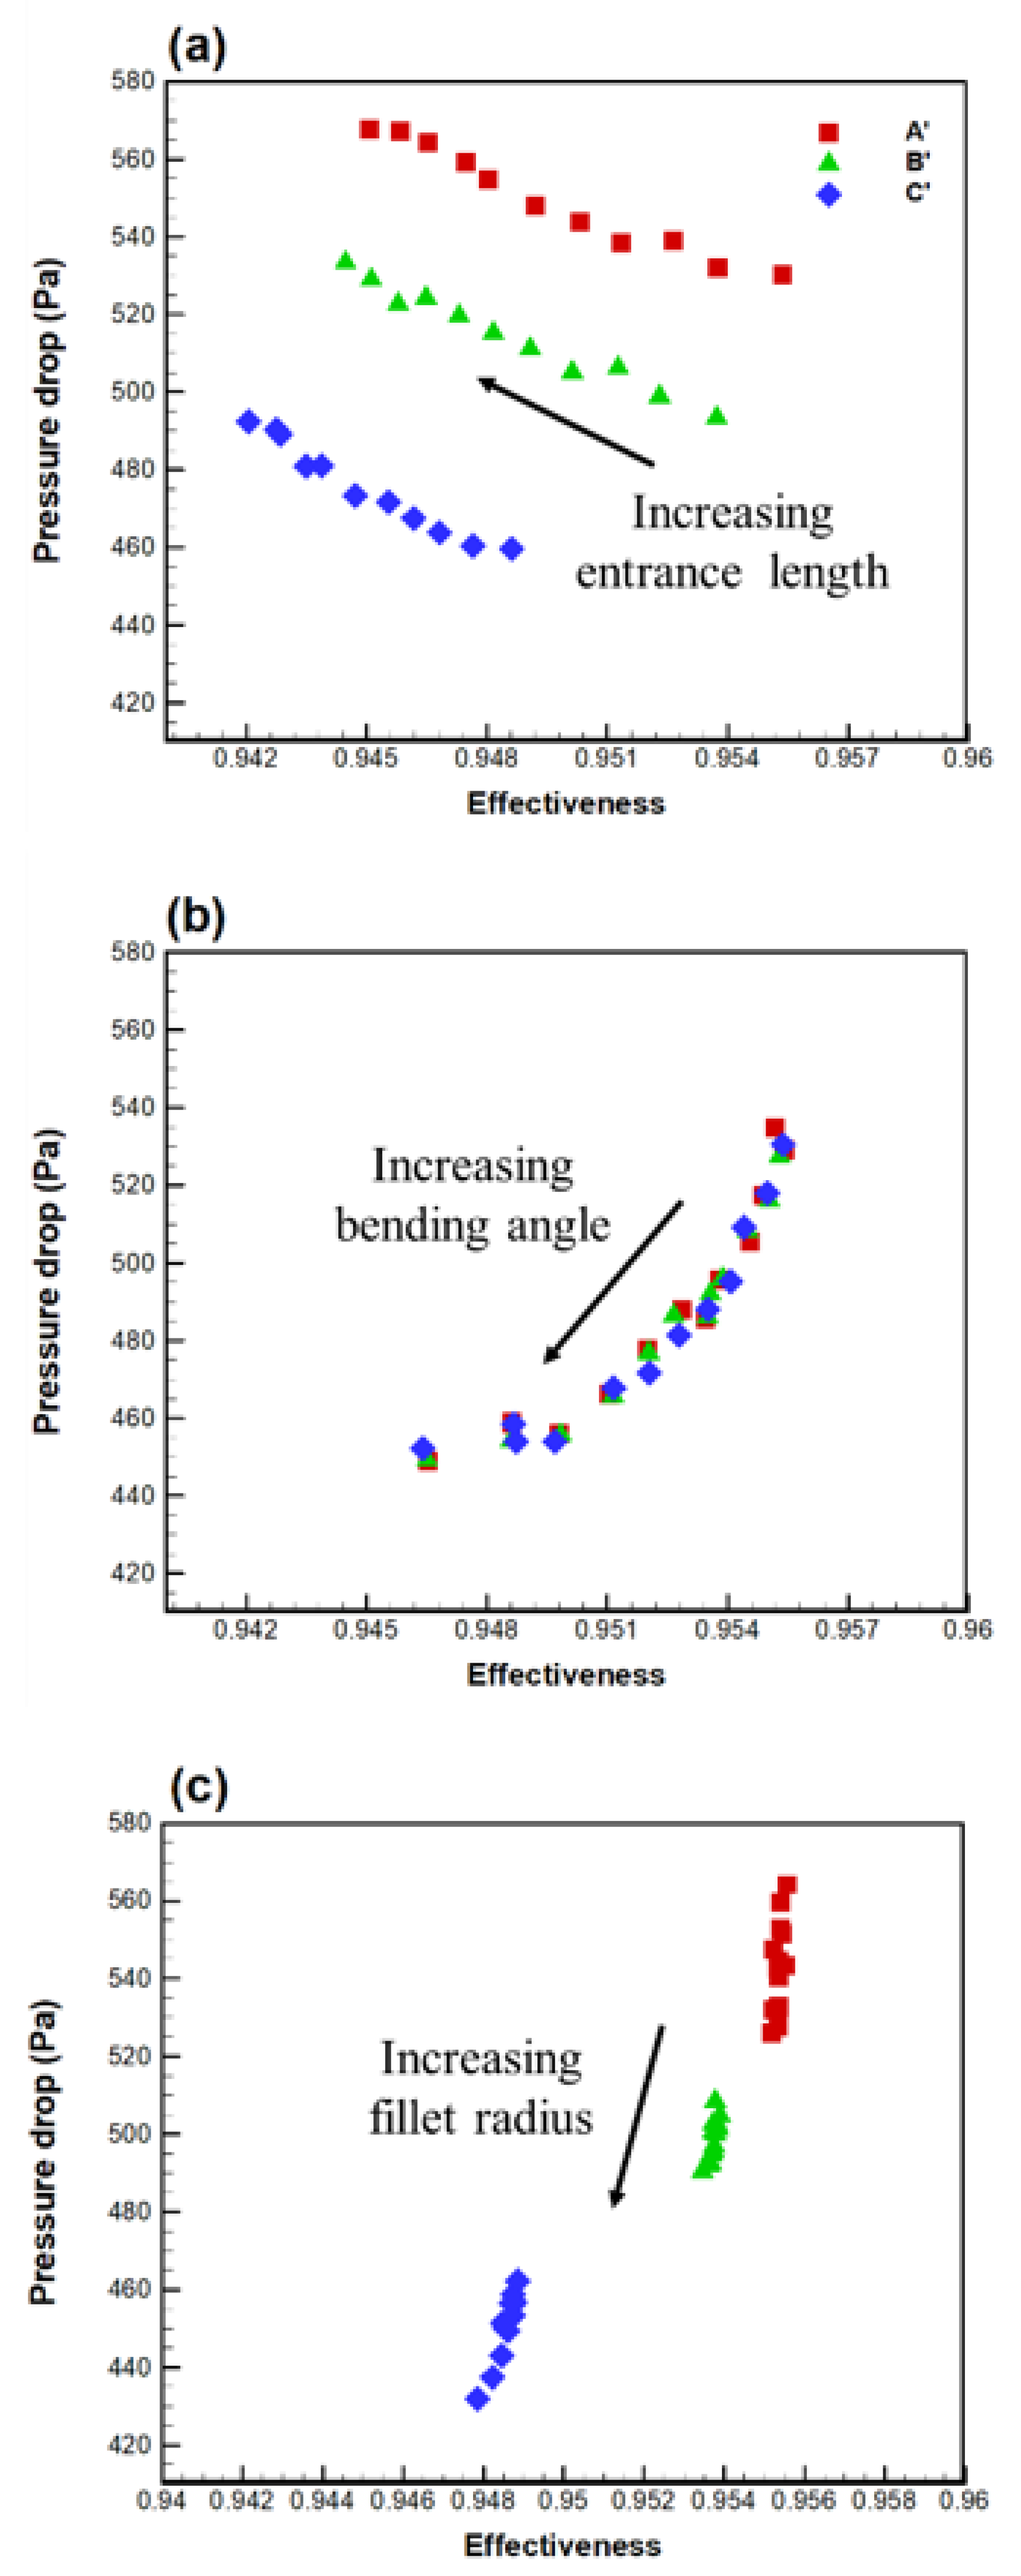
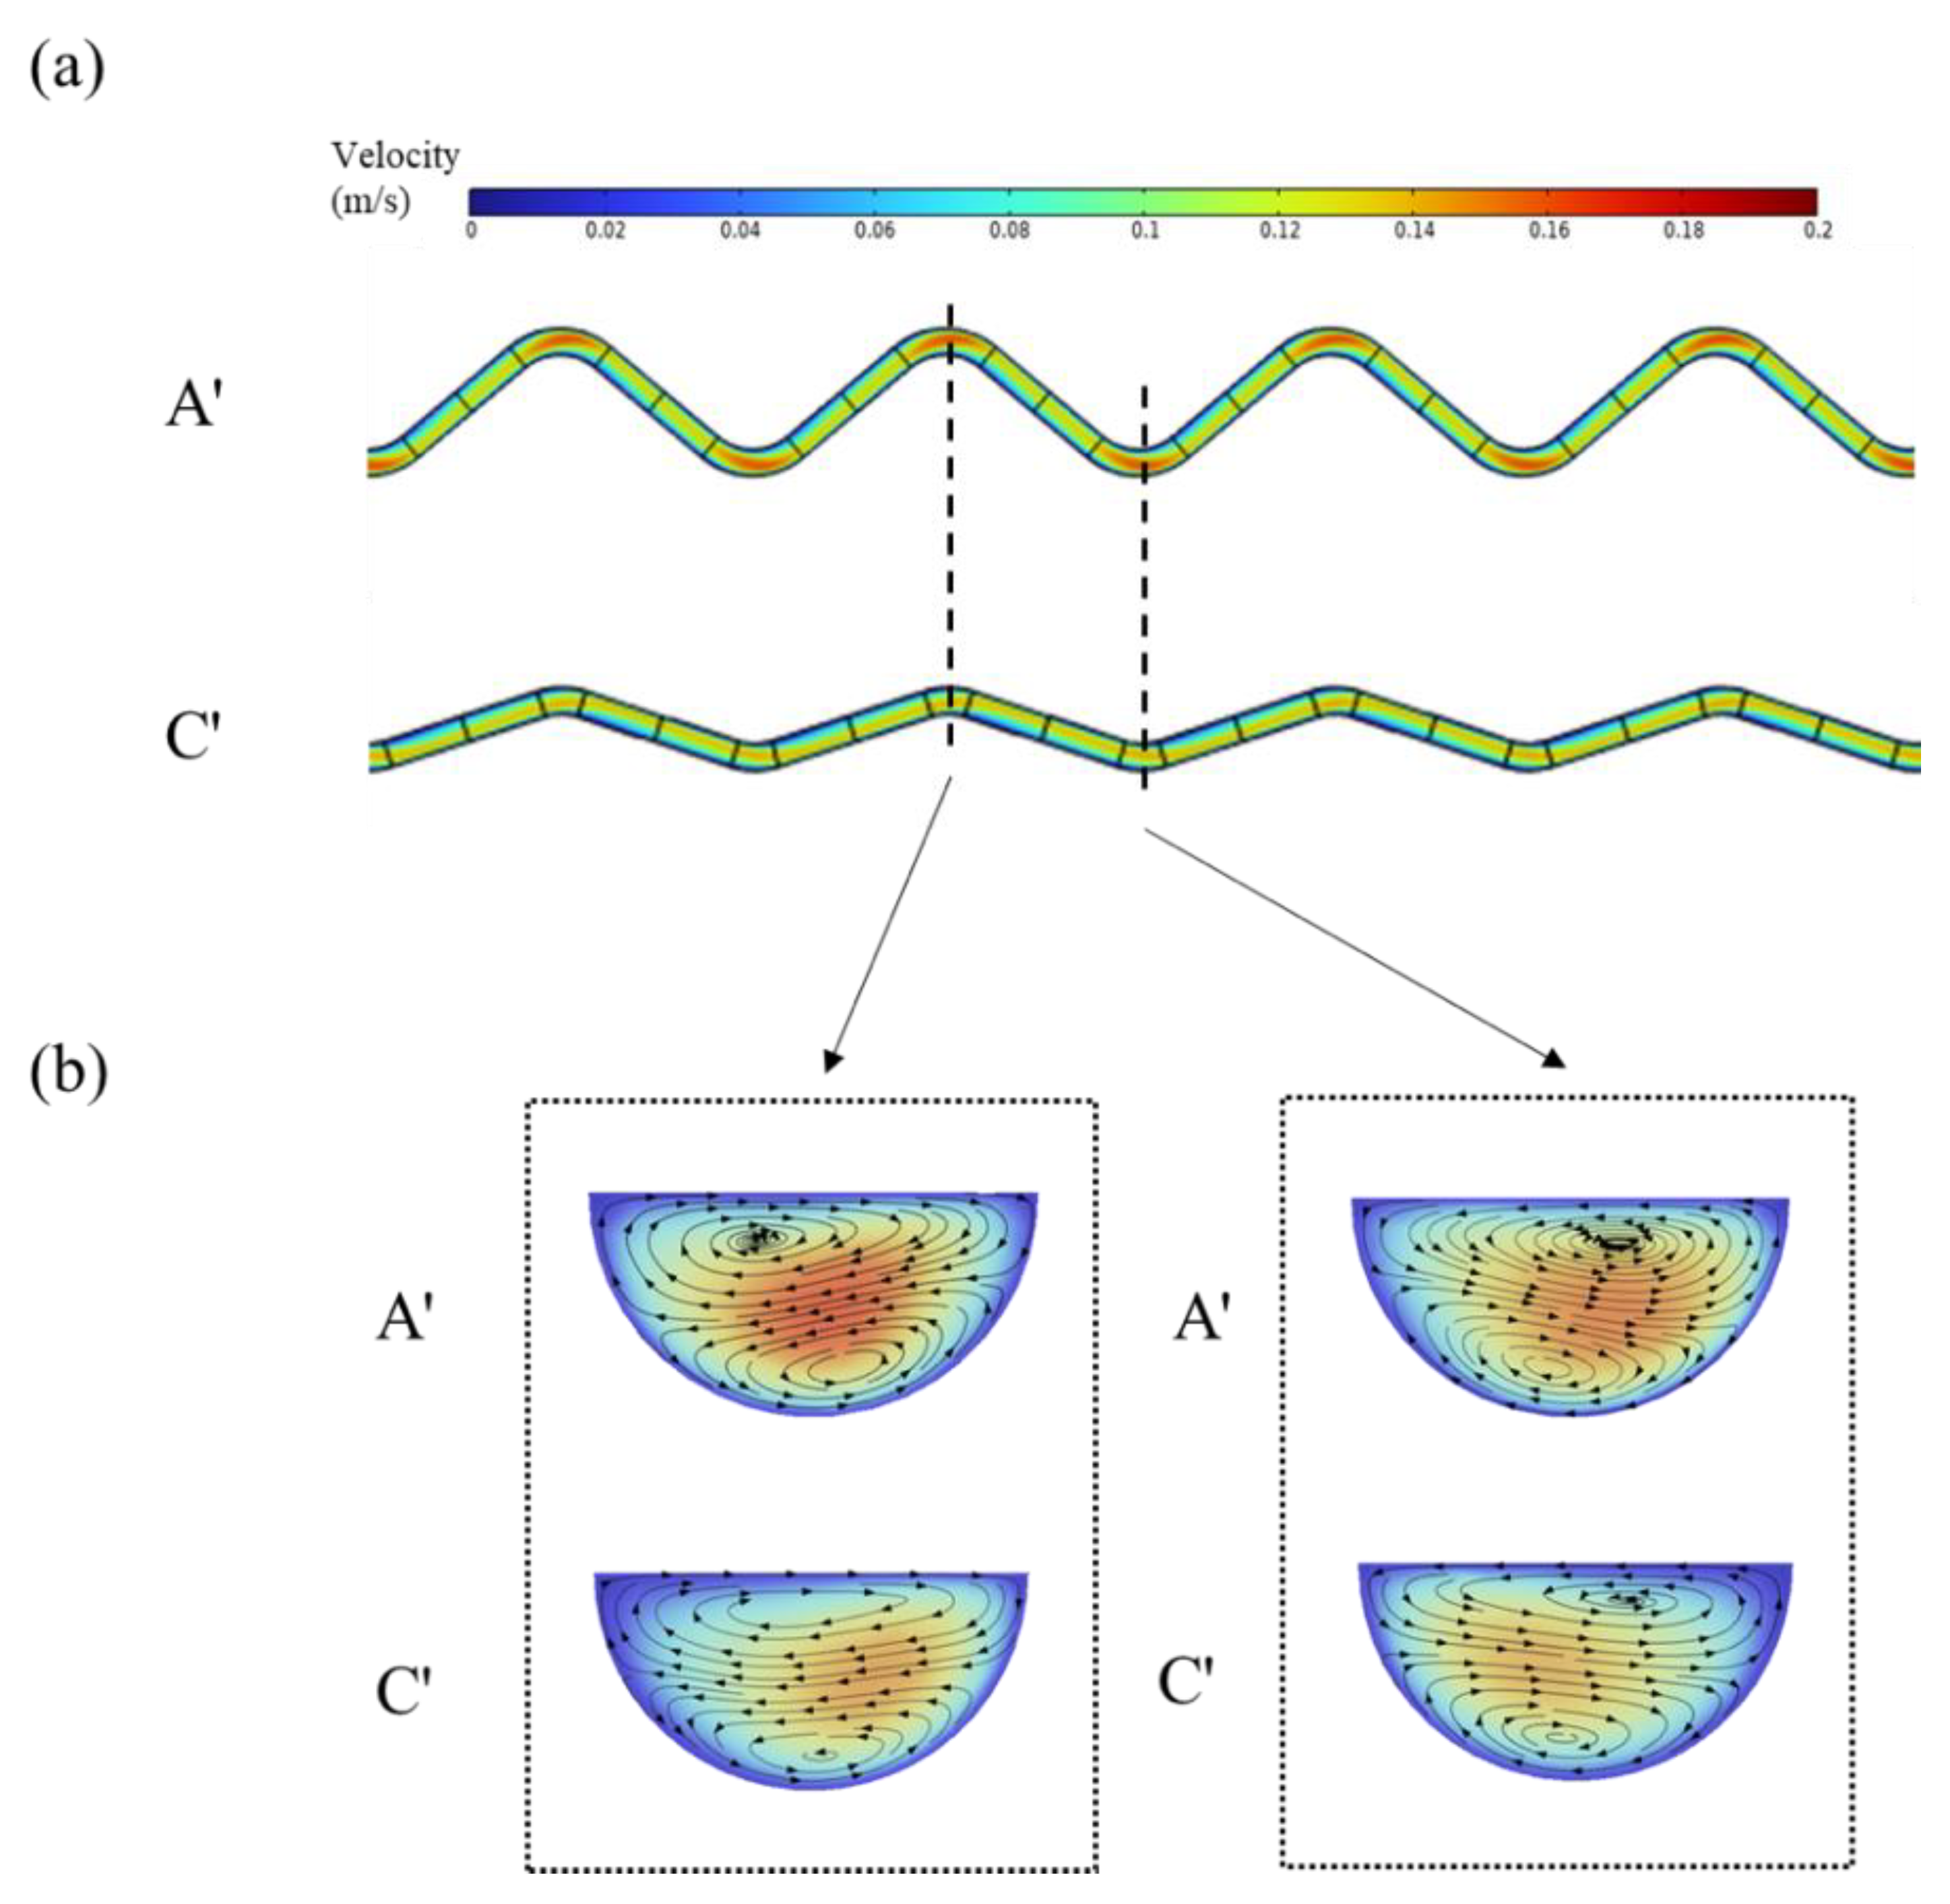
3.3. Effect of Geometric Parameters of the Zigzag Flow Channel

Before performing the multi-objective optimization of the zigzag flow channel, the effects of the three geometric parameters: the entrance length, the bending angle, and the fillet radius, as shown in Figure 8, on the objective functions: the effectiveness and pressure drop of the PHE, are explored in this section. The optimal operating conditions of the PHE, obtained experimentally by the Taguchi method, were used in the numerical simulation. In other words, with a flow rate ratio of 0.25, the inlet temperatures for the hot and cold water flows were 95 °C and 10 °C, respectively. The entrance length, bending angle, and fillet radius are respectively 15 mm, 130°, and 4.5 mm in the practical zigzag flow channels, as shown in Figure 1b. Here, in the simulations, the effect of each parameter was evaluated with the other two parameters fixed as constants.
Figure 11 shows the effects of the three geometric parameters on the effectiveness and pressure drop of the PHE. The effect of entrance length is considered in the range of 10 to 20 mm, as illustrated in Figure 11a. It is found that an increase in the entrance length reduces the effectiveness and raises the pressure drop simultaneously. This result reveals that the entrance length should be as short as possible to enhance the effectiveness of the PHE. The influence of the bending angle evaluated is in the range of 100–150°, and the results are demonstrated in Figure 11b. The two objective functions decrease as the bending angle is increased. When the bending angle increases, the influence of boundary layer separation diminishes at the corner and thus reduces the flow resistance. As a result, the pressure drop decreases while the effectiveness is also lowered simultaneously. This result is consistent with the findings of Tu et al. [43] and shows the design of zigzag flow channels could improve the effectiveness while the bending angle needs to be optimized to balance the two objective functions.
The results for the effect of fillet radius are shown in Figure 11c, in which the fillet radius varies from 1.8 to 6.5 mm. It is seen that both the two objective functions decrease gradually as the fillet radius increases, but the effect of the fillet radius is less significant than the bending angle. Wang et al. [44] also mentioned that the main flow velocity distribution in the channel would be more uniform as the fillet radius increases; hence, the flow resistance within the channel would decrease. Therefore, a larger fillet radius would cause a smaller pressure drop, while heat transfer effectiveness would be reduced. The present results suggest that the three geometric parameters cause a mutual interference between pressure drop and effectiveness. Accordingly, a multi-objective optimization is necessary to evaluate the optimal geometric design of the zigzag flow channel, which will be conducted in the next section.

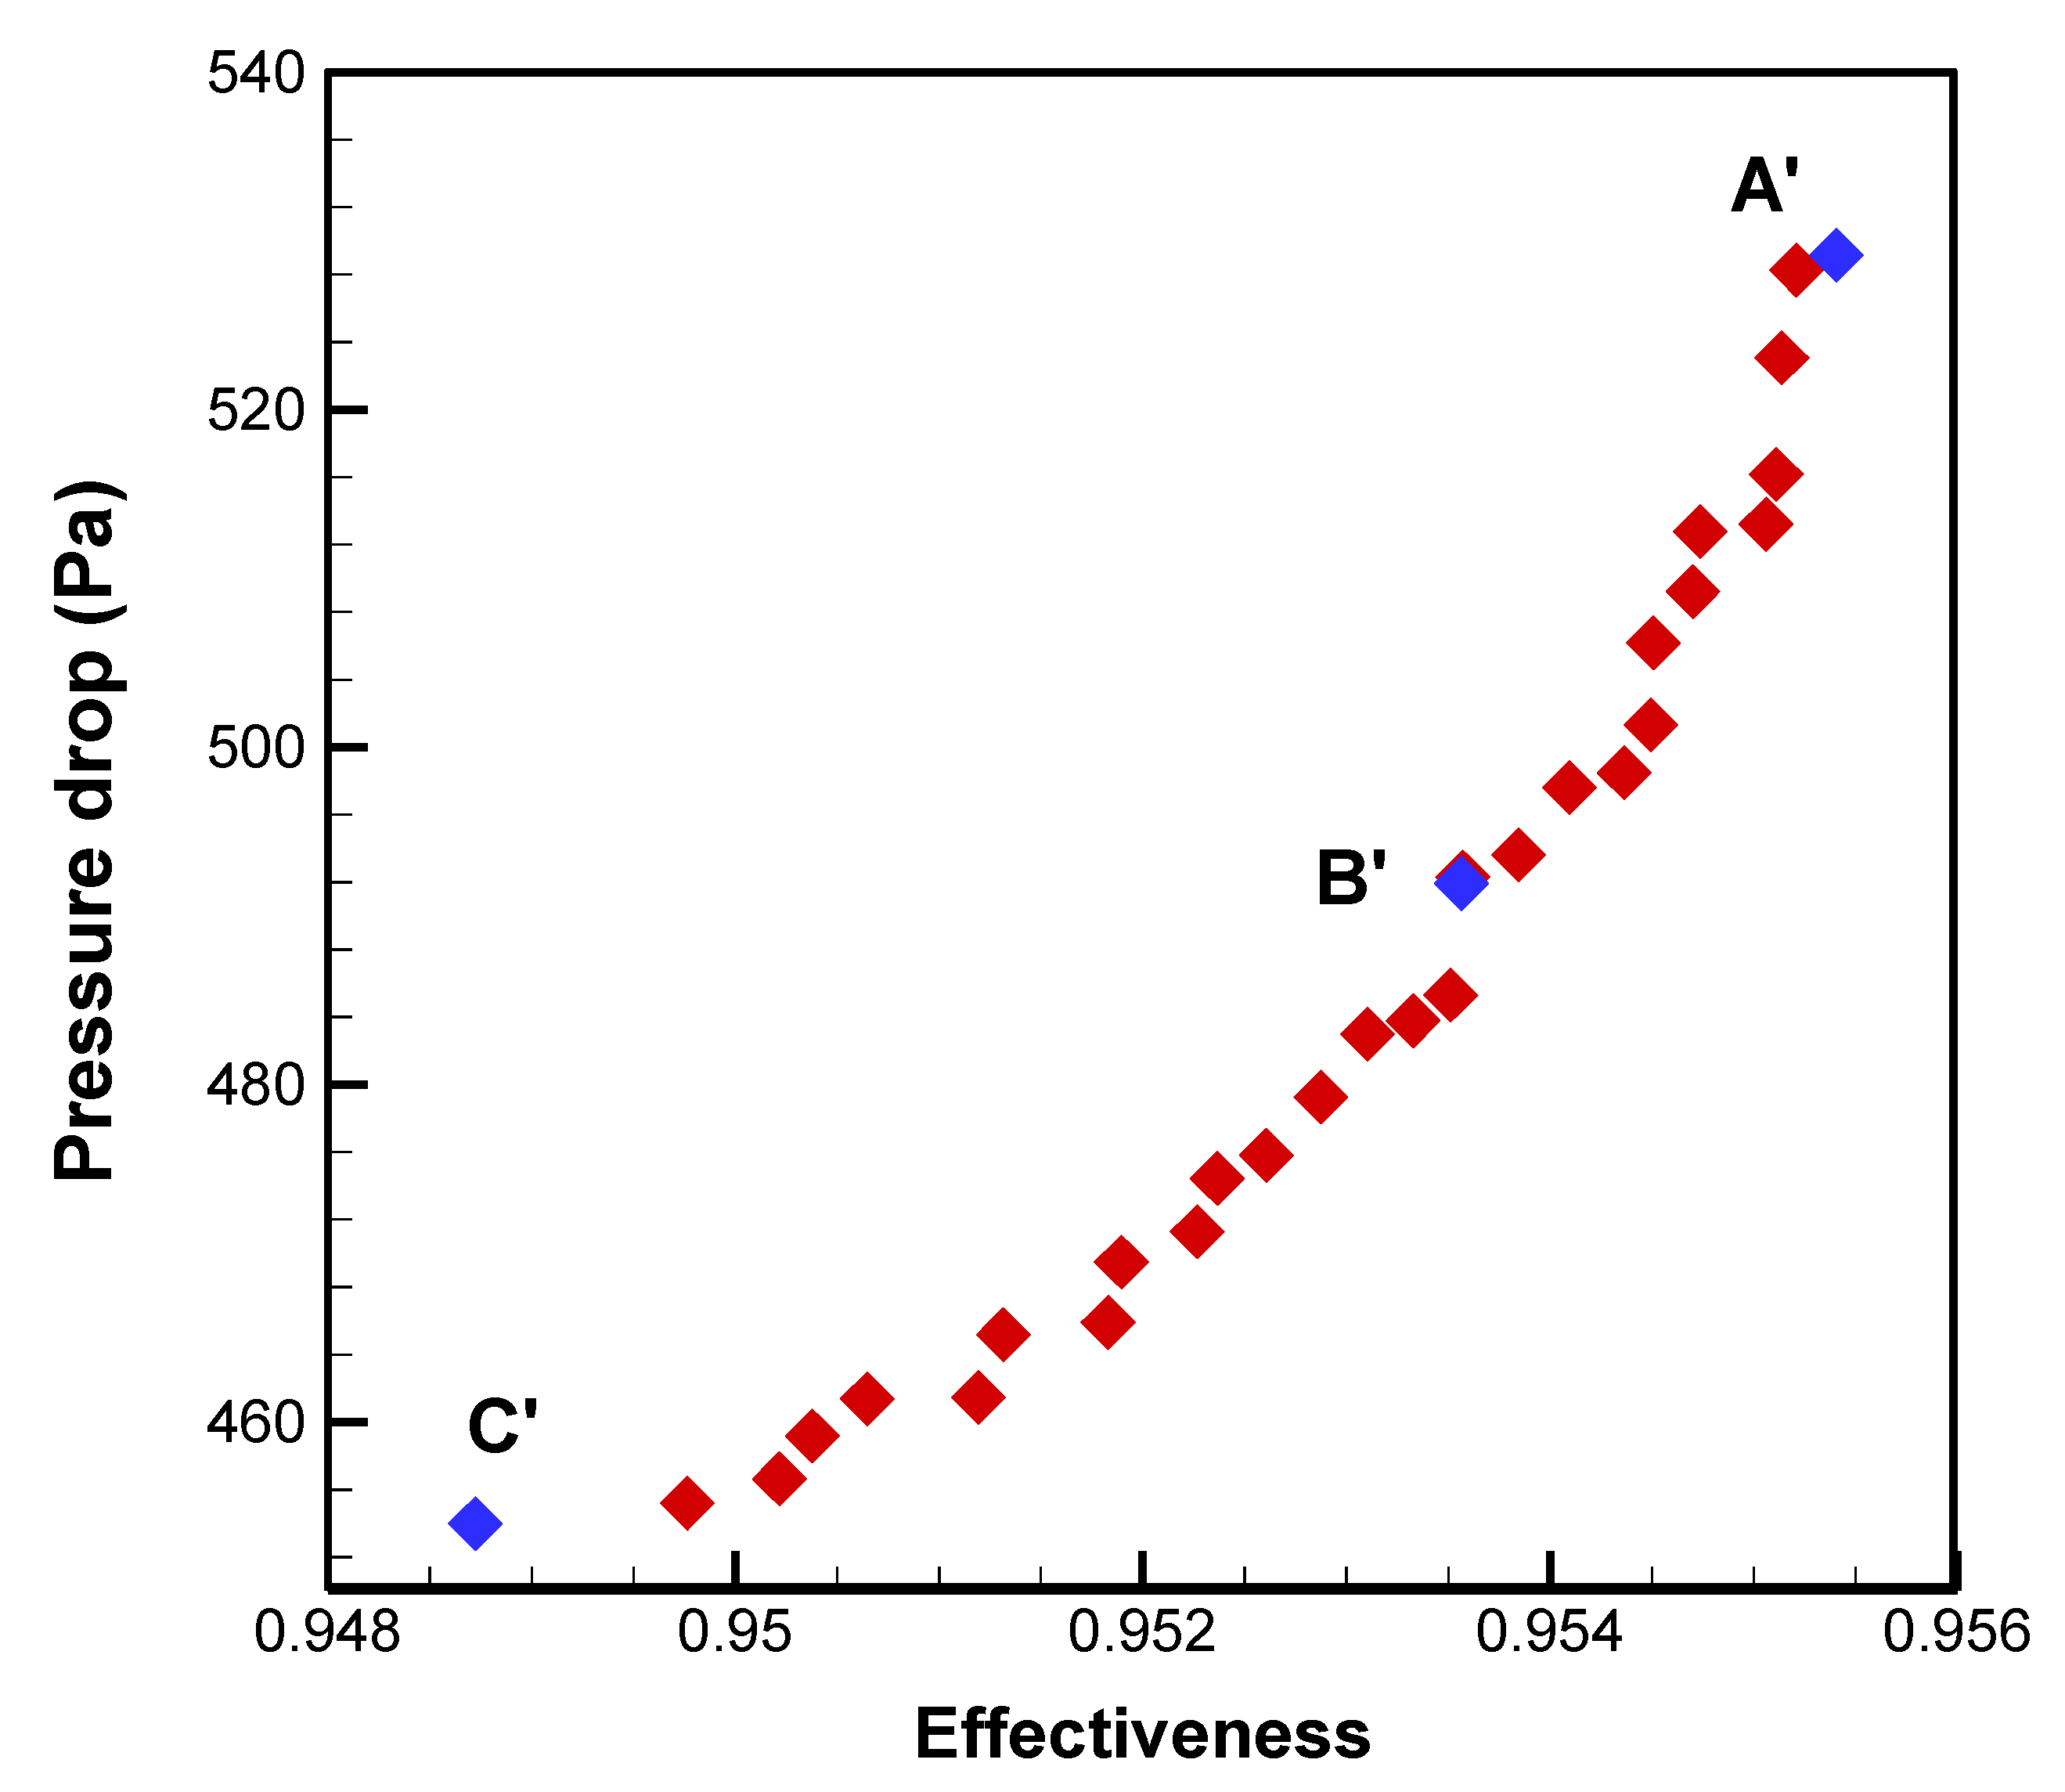
3.4. Optimization of Flow Channel Geometry by NSGA-II

The desired goal of optimization is to maximize the effectiveness value and minimize the pressure drop. Accordingly, a multi-objective optimization was performed by the NSGA-II method to determine the Pareto optimal front for the PHE. In the optimizing processes, a total of 30 cases were used as the initial population of NSGA-II. Thirty iterations of evolutionary computations were implemented and set as the final stop criterion, and then 30 design points were generated as the Pareto front points. The crossover percentage, mutation percentage, and mutation rate used in the genetic algorithm for optimization were set as 0.7, 0.4, and 0.2, respectively [45]. The Pareto optimal front in the two-dimensional objective distribution for the effectiveness and pressure drop is displayed in Figure 12. It is obvious that a conflict exists between the two objective functions. That is, an increase in the effectiveness value leads to a rise in the pressure drop. Table 5 lists the geometric design parameters and the corresponding values of the objective functions for the three typical points A′, B′, and C′ on the Pareto optimal front, as denoted in Figure 12. Point A′ takes the effectiveness value as the objective function and gives the maximum effectiveness of 0.953. Point C′ considers the pressure drop as the objective function and presents the minimum pressure drop of 453.98 Pa. The following equation can correlate the effectiveness and pressure drop of the Pareto optimal front:
P = 11363   ln ε + 1034 ,       R 2 = 0.91
where ε is the effectiveness value. The coefficient of determination (R2) value for this equation is 0.91. In fact, any point on the Pareto optimal front is the optimal design point. The choice of the design point is based on the consideration of the relative importance of the two objective functions. Then the corresponding optimal geometric design of the zigzag flow channel can be determined.
Figure 13a–c shows the variations of the objective functions at the three optimal design points A′, B′, and C′, respectively, with each of the geometric parameters: the entrance length, the bending angle, and the fillet radius, respectively. One can see that the variations of the objective functions exhibit the same trend at each of the specific optimal points. As shown by the analysis in the previous section, a smaller entrance length is preferable to enhance the effectiveness value but reduce the pressure drop. On the other hand, the bending angle and fillet radius cause a conflict between the two objective functions. That is, an improvement in the effectiveness value would also raise the pressure drop. Figure 13b demonstrates that the bending angle variation significantly influences the pressure drop and effectiveness. This result reveals that the bending angle has the greatest sensitivity among the three geometric parameters. The flow fields inside the zigzag flow channels were further analyzed. The optimal design points A′ and C′ were selected for comparison to explore the influence of geometric structure on the flow. From the data in Table 5, the bending angles of points A′ and C′ are 100.1° and 144.0°, respectively.
The simulation results of flow velocity and streamline pattern are shown in Figure 14. Figure 14a displays the profiles of axial velocity magnitude along the two hot water channels. It is seen that the flow speed profile at the bends would be more non-uniform, and the flow speed would rise within the central region. When the flow passes through the bends in the zigzag flow channel, the mixing of the fluids adjacent to the wall and in the central region is enhanced due to the boundary layer separation [43]. This phenomenon is more significant as the bending angle decreases. Figure 14b illustrates the cross-sectional streamline patterns at the turning points of the two flow channels. Two Dean vortices can be observed at the cross-section of the turning point, and the intensity is more vigorous for design point A′. The induced centrifugal force in the channel is responsible for the formation of Dean vortices [46,47]. The smaller the bending angle, the more pronounced the Dean vortices. The occurrence of vortices in the flow can enhance collisions between fluid parcels but cause more pressure loss [28]. As a result, design point A′ presents a higher effectiveness value but a more significant pressure loss. Once the bending angle increases at the design point C′, the intensity of vortices decreases, which lowers the mixing effect and heat transfer efficiency [48], but the pressure loss is lessened.

4. Conclusions

The optimization of operating conditions and geometric design of the zigzag flow channel for a PHE has been investigated in this study. The operating conditions were optimized experimentally based on the Taguchi method and verified further by the ANOVA method. Three factors, including the inlet temperature of hot water, the inlet temperature of cold water, and the flow rate ratio of cold/hot water flow, are considered in the experiments. The results show that the flow rate ratio is the most significant factor influencing the PHE effectiveness, while the inlet temperature of cold water only plays a minor role. The highest effectiveness value is 0.945. The result of ANOVA confirms the prediction of the Taguchi method that the flow rate ratio is the most crucial factor affecting the effectiveness. The optimal geometric design of the zigzag flow channel was further explored by numerical simulation. Three design parameters are considered: entrance length, bending angle, and fillet radius. The objective functions are the effectiveness and pressure drop of the PHE, and a multi-objective optimization analysis is implemented to generate the Pareto optimal front by the NSGA-II method to determine the optimal geometric design. Sensitivity analysis reveals that the bending angle is the most important geometric parameter to affect the two objective functions. The flow field simulations found that Dean vortices occur at the bends of the flow channel, and the intensity of vortices is more pronounced as the bending angle decreases. Therefore, the PHE effectiveness and pressure loss rise as the bending angle decreases.

Author Contributions

Conceptualization, supervision, resources, project administration, funding acquisition, writing—review and editing W.-H.C.; methodology, data curation, formal analysis, investigation, writing—original draft preparation, Y.-W.L.; formal analysis, investigation, writing—review and editing, M.-H.C.; investigation, writing—review and editing, C.-C.C.; investigation, writing—review and editing, V.A.; investigation, writing—review and editing, L.H.S. All authors have read and agreed to the published version of the manuscript.

Funding

This research is funded by the Headquarters of University Advancement at the National Cheng Kung University (NCKU), which was sponsored by the Ministry of Education, Taiwan. This research is also partly supported by the Higher Education Sprout Project, Ministry of Education to the Headquarters of University Advancement at NCKU.

Institutional Review Board Statement

This article does not contain any studies with human participants or animals performed by the author.

Data Availability Statement

All data generated or analyzed during this study are included in this published article. Further, the raw data generated during and/or analyzed during the current study are available from the corresponding author on reasonable request.

Acknowledgments

The authors acknowledge the financial support of the Headquarters of University Advancement at the National Cheng Kung University (NCKU), which was sponsored by the Ministry of Education, Taiwan. This research is also partly supported by the Higher Education Sprout Project, Ministry of Education to the Headquarters of University Advancement at NCKU.

Conflicts of Interest

The authors declare no conflict of interest.

References

  1. Su, Z.; Zhang, M.; Xu, P.; Zhao, Z.; Wang, Z.; Huang, H.; Quyang, T. Opportunities and strategies for multigrade waste heat utilization in various industries: A recent review. Energy Convers. Manag. 2021, 229, 113769. [Google Scholar] [CrossRef]
  2. Papapetrou, M.; Kosmadakis, G.; Cipollina, A.; La Commare, U.; Micale, G. Industrial waste heat: Estimation of the technically available resource in the EU per industrial sector, temperature level and country. Appl. Therm. Eng. 2018, 138, 207–216. [Google Scholar] [CrossRef]
  3. Forman, C.; Muritala, I.K.; Pardemann, R.; Meyer, B. Estimating the global waste heat potential. Renew. Sustain. Energy Rev. 2016, 57, 1568–1579. [Google Scholar] [CrossRef]
  4. Chen, W.-H.; Uribe, M.C.; Kwon, E.E.; Lin, K.-Y.A.; Park, Y.-K.; Ding, L.; Saw, L.H. A comprehensive review of thermoelectric generation optimization by statistical approach: Taguchi method, analysis of variance (ANOVA), and response surface methodology (RSM). Renew. Sustain. Energy Rev. 2022, 169, 112917. [Google Scholar] [CrossRef]
  5. Jouhara, H.; Khordehgah, N.; Almahmoud, S.; Delpech, B.; Chauhan, A.; Tassou, S.A. Waste heat recovery technologies and applications. Therm. Sci. Eng. Prog. 2018, 6, 268–289. [Google Scholar] [CrossRef]
  6. Xie, J.Y.; Chueh, C.-C.; Chen, W.-H.; Chen, K.J. Heat transfer performance comparison of printed circuit heat exchangers with straight, zigzag and serpentine flow channels for waste heat recovery. Int. J. Energy Res. 2022, 46, 1722–1735. [Google Scholar] [CrossRef]
  7. Omidi, M.; Farhadi, M.; Jafari, M. A comprehensive review on double pipe heat exchangers. Appl. Therm. Eng. 2017, 110, 1075–1090. [Google Scholar] [CrossRef]
  8. Wang, Q.; Chen, G.; Chen, Q.; Zeng, M. Review of Improvements on Shell-and-Tube Heat Exchangers With Helical Baffles. Heat Transf. Eng. 2010, 31, 836–853. [Google Scholar] [CrossRef]
  9. Abu-Khader, M.M. Plate heat exchangers: Recent advances. Renew. Sustain. Energy Rev. 2012, 16, 1883–1891. [Google Scholar] [CrossRef]
  10. Fei, N.C.; Mehat, N.M.; Kamaruddin, S. Practical Applications of Taguchi Method for Optimization of Processing Parameters for Plastic Injection Moulding: A Retrospective Review. ISRN Ind. Eng. 2013, 2013, 462174. [Google Scholar] [CrossRef]
  11. Singh, O.P.; Kumar, G.; Kumar, M. Role of Taguchi and Grey Relational Method in Optimization of Machining Parameters of Different Materials: A Review. Acta Electron. Malays. (AEM) 2019, 3, 19–22. [Google Scholar] [CrossRef]
  12. Jamshidi, N.; Farhadi, M.; Ganji, D.D.; Sedighi, K. Experimental analysis of heat transfer enhancement in shell and helical tube heat exchangers. Appl. Therm. Eng. 2013, 51, 644–652. [Google Scholar] [CrossRef]
  13. Kotcioglu, I.; Khalaji, M.N.; Cansiz, A. Heat transfer analysis of a rectangular channel having tubular router in different winglet configurations with Taguchi method. Appl. Therm. Eng. 2018, 132, 637–650. [Google Scholar] [CrossRef]
  14. Rao, R.V.; Patel, V.K. Thermodynamic optimization of cross flow plate-fin heat exchanger using a particle swarm optimization algorithm. Int. J. Therm. Sci. 2010, 49, 1712–1721. [Google Scholar] [CrossRef]
  15. Selbaş, R.; Kızılkan, Ö.; Reppich, M. A new design approach for shell-and-tube heat exchangers using genetic algorithms from economic point of view. Chem. Eng. Process. Process Intensif. 2006, 45, 268–275. [Google Scholar] [CrossRef]
  16. Liu, C.; Bu, W.; Xu, D. Multi-objective shape optimization of a plate-fin heat exchanger using CFD and multi-objective genetic algorithm. Int. J. Heat Mass Transf. 2017, 111, 65–82. [Google Scholar] [CrossRef]
  17. Wang, J.; Wang, M.; Li, M.; Xia, J.; Dai, Y. Multi-objective optimization design of condenser in an organic Rankine cycle for low grade waste heat recovery using evolutionary algorithm. Int. Commun. Heat Mass Transf. 2013, 45, 47–54. [Google Scholar] [CrossRef]
  18. Raja, B.D.; Jhala, R.L.; Patel, V. Many-objective optimization of shell and tube heat exchanger. Therm. Sci. Eng. Prog. 2017, 2, 87–101. [Google Scholar] [CrossRef]
  19. Sanaye, S.; Hajabdollahi, H. Thermal-economic multi-objective optimization of plate fin heat exchanger using genetic algorithm. Appl. Energy 2010, 87, 1893–1902. [Google Scholar] [CrossRef]
  20. Raja, B.D.; Patel, V.; Jhala, R.L. Thermal design and optimization of fin-and-tube heat exchanger using heat transfer search algorithm. Therm. Sci. Eng. Prog. 2017, 4, 45–57. [Google Scholar] [CrossRef]
  21. Yang, Y.; Li, H.; Yao, M.; Zhang, Y.; Zhang, C.; Zhang, L.; Wu, S. Optimizing the size of a printed circuit heat exchanger by multi-objective genetic algorithm. Appl. Therm. Eng. 2020, 167, 114811. [Google Scholar] [CrossRef]
  22. Imran, M.; Pambudi, N.A.; Farooq, M. Thermal and hydraulic optimization of plate heat exchanger using multi objective genetic algorithm. Case Stud. Therm. Eng. 2017, 10, 570–578. [Google Scholar] [CrossRef]
  23. Zhao, Z.; Zhou, Y.; Ma, X.; Chen, X.; Li, S.; Yang, S. Effect of Different Zigzag Channel Shapes of PCHEs on Heat Transfer Performance of Supercritical LNG. Energies. 2019, 12, 2085. [Google Scholar] [CrossRef] [Green Version]
  24. Zohuri, B. RETRACTED CHAPTER: Heat Exchanger Types and Classifications. In Retracted Book: Compact Heat Exchangers: Selection, Application, Design and Evaluation; Zohuri, B., Ed.; Springer International Publishing: Cham, Denmark, 2017; pp. 19–56. [Google Scholar]
  25. Chen, W.-H.; Wang, J.-S.; Chang, M.-H.; Mutuku, J.K.; Hoang, A.T. Efficiency improvement of a vertical-axis wind turbine using a deflector optimized by Taguchi approach with modified additive method. Energy Convers. Manag. 2021, 245, 114609. [Google Scholar] [CrossRef]
  26. Kim, D.E.; Kim, M.H.; Cha, J.E.; Kim, S.O. Numerical investigation on thermal–hydraulic performance of new printed circuit heat exchanger model. Nucl. Eng. Des. 2008, 238, 3269–3276. [Google Scholar] [CrossRef]
  27. Kim, I.H.; Zhang, X.; Christensen, R.; Sun, X. Design study and cost assessment of straight, zigzag, S-shape, and OSF PCHEs for a FLiNaK–SCO2 Secondary Heat Exchanger in FHRs. Ann. Nucl. Energy 2016, 94, 129–137. [Google Scholar] [CrossRef] [Green Version]
  28. Xu, T.; Zhao, H.; Wang, M.; Qi, J. Numerical Study of Thermal-Hydraulic Performance of a New Spiral Z-Type PCHE for Supercritical CO2 Brayton Cycle. Energies 2021, 14, 4417. [Google Scholar] [CrossRef]
  29. Aneesh, A.M.; Sharma, A.; Srivastava, A.; Chaudhury, P. Effects of wavy channel configurations on thermal-hydraulic characteristics of Printed Circuit Heat Exchanger (PCHE). Int. J. Heat Mass Transf. 2018, 118, 304–315. [Google Scholar] [CrossRef]
  30. Shin, M.-S.; Park, N.; Park, M.-J.; Cheon, J.-Y.; Kang, J.K.; Jun, K.-W.; Ha, K.-S. Modeling a channel-type reactor with a plate heat exchanger for cobalt-based Fischer–Tropsch synthesis. Fuel Process. Technol. 2014, 118, 235–243. [Google Scholar] [CrossRef]
  31. Lee, D.S.; Morillo, C.; Bugeda, G.; Oller, S.; Onate, E. Multilayered composite structure design optimisation using distributed/parallel multi-objective evolutionary algorithms. Compos. Struct. 2012, 94, 1087–1096. [Google Scholar] [CrossRef]
  32. Wang, Z.; Rangaiah, G.P. Application and Analysis of Methods for Selecting an Optimal Solution from the Pareto-Optimal Front obtained by Multiobjective Optimization. Ind. Eng. Chem. Res. 2017, 56, 560–574. [Google Scholar] [CrossRef]
  33. Yoon, S.-J.; O’Brien, J.; Chen, M.; Sabharwall, P.; Sun, X. Development and validation of Nusselt number and friction factor correlations for laminar flow in semi-circular zigzag channel of printed circuit heat exchanger. Appl. Therm. Eng. 2017, 123, 1327–1344. [Google Scholar] [CrossRef]
  34. Zhang, H.; Guo, J.; Huai, X.; Cheng, K.; Cui, X. Studies on the thermal-hydraulic performance of zigzag channel with supercritical pressure CO2. J. Supercrit. Fluids 2019, 148, 104–115. [Google Scholar] [CrossRef]
  35. Chen, W.-H.; Chen, C.-Y.; Huang, C.-Y.; Hwang, C.-J. Power output analysis and optimization of two straight-bladed vertical-axis wind turbines. Appl. Energy 2017, 185, 223–232. [Google Scholar] [CrossRef]
  36. Chen, C.-C.; Tseng, H.-H.; Lin, Y.-L.; Chen, W.-H. Hydrogen production and carbon dioxide enrichment from ethanol steam reforming followed by water gas shift reaction. J. Clean. Prod. 2017, 162, 1430–1441. [Google Scholar] [CrossRef]
  37. Attalla, M.; Maghrabie, H.M. Investigation of effectiveness and pumping power of plate heat exchanger with rough surface. Chem. Eng. Sci. 2020, 211, 115277. [Google Scholar] [CrossRef]
  38. Arpia, A.A.; Chen, W.-H.; Ubando, A.T.; Tabatabaei, M.; Lam, S.S.; Culaba, A.B.; De Luna, M.D.G. Catalytic microwave-assisted torrefaction of sugarcane bagasse with calcium oxide optimized via Taguchi approach: Product characterization and energy analysis. Fuel 2021, 305, 121543. [Google Scholar] [CrossRef]
  39. San, F.G.B.; Isik-Gulsac, I.; Okur, O. Analysis of the polymer composite bipolar plate properties on the performance of PEMFC (polymer electrolyte membrane fuel cells) by RSM (response surface methodology). Energy 2013, 55, 1067–1075. [Google Scholar]
  40. Figley, J.; Sun, X.; Mylavarapu, S.K.; Hajek, B. Numerical study on thermal hydraulic performance of a Printed Circuit Heat Exchanger. Prog. Nucl. Energy 2013, 68, 89–96. [Google Scholar] [CrossRef]
  41. Chen, W.-H.; Lin, Y.-Y.; Liu, H.-C.; Baroutian, S. Optimization of food waste hydrothermal liquefaction by a two-step process in association with a double analysis. Energy 2020, 199, 117438. [Google Scholar] [CrossRef]
  42. Chen, W.-H.; Chiu, G.-L.; Ong, H.C.; Lam, S.S.; Lim, S.; Ok, Y.S.; Kwom, E.E. Optimization and analysis of syngas production from methane and CO2 via Taguchi approach, response surface methodology (RSM) and analysis of variance (ANOVA). Fuel 2021, 296, 120642. [Google Scholar] [CrossRef]
  43. Tu, Y.; Zeng, Y. Numerical Study on Flow and Heat Transfer Characteristics of Supercritical CO2 in Zigzag Microchannels. Energies 2022, 15, 2099. [Google Scholar] [CrossRef]
  44. Wang, B.; Shen, J.; Cheng, J.; Wang, Y. Numerical Improvement Using Flow and Heat Transfer Calculations of the Zigzag Geometry for Carbon Dioxide PCHEs. Energies 2022, 15, 2831. [Google Scholar] [CrossRef]
  45. Hajabdollahi, H.; Ahmadi, P.; Dincer, I. Exergetic Optimization of Shell-and-Tube Heat Exchangers Using NSGA-II. Heat Transfer Engineering. Heat Transf. Eng. 2012, 33, 618–628. [Google Scholar] [CrossRef]
  46. Chen, W.-H.; Mutuku, J.K.; Yang, Z.-W.; Hwang, C.-J.; Lee, W.J.; Ashokkumar, V. An investigation for airflow and deposition of PM2.5 contaminated with SAR-CoV-2 virus in healthy and diseased human airway. Environ. Res. 2021, 197, 111096. [Google Scholar] [CrossRef]
  47. Mutuku, J.K.; Hou, W.-C.; Chen, W.-H. An Overview of Experiments and Numerical Simulations on Airflow and Aerosols Deposition in Human Airways and the Role of Bioaerosol Motion in COVID-19 Transmission. Aerosol Air Qual. Res. 2020, 20, 1172–1196. [Google Scholar] [CrossRef]
  48. Zheng, Z.; Fletcher, D.F.; Haynes, B.S. Transient laminar heat transfer simulations in periodic zigzag channels. Int. J. Heat Mass Transf. 2014, 71, 758–768. [Google Scholar] [CrossRef]
Figure 1. The photos and dimensions of (a) the PHE, (b) the flow channel plate, and (c) the PCM plate.
Energies 15 08205 g001
Figure 2. (a) The directions of cold/hot water flows in the flow channel plates, and (b) the structure of the PHE.
Energies 15 08205 g002
Figure 3. Schematic diagram of the experimental setup.
Energies 15 08205 g003
Figure 4. The simplified model of PHE with zigzag flow channels. The boundary conditions are adiabatic on the lateral surfaces and periodic on the top and bottom surfaces.
Energies 15 08205 g004
Figure 5. The schematic diagram of the grid model.
Energies 15 08205 g005
Figure 6. (a) Results of grid tests, and (b) comparisons of numerical and experimental results.
Energies 15 08205 g006
Figure 7. The flow chart of the NSGA-II method.
Energies 15 08205 g007
Figure 8. Schematic diagram of the three design parameters for a zigzag flow channel.
Energies 15 08205 g008
Figure 9. (a) Effectiveness and (b) S/N ratio for the nine cases in the orthogonal array, and (c) mean S/N ratio variations for factors A, B, and C with three levels.
Energies 15 08205 g009
Figure 10. (a) Radar chart for Taguchi factor influences; and (b) correlation of Taguchi experimental design influence value and ANOVA p-values.
Energies 15 08205 g010
Figure 11. Effects of (a) the entrance length, (b) the bending angle, and (c) the fillet radius on the effectiveness and pressure drop of the PHE.
Energies 15 08205 g011
Figure 12. The distribution of solutions of Pareto optimal points using NSGA-II.
Energies 15 08205 g012
Figure 13. The variations of the pressure drop with the effectiveness at the three typical design points A′, B′, and C′ as marked in the Pareto optimal front (Figure 11) by adjusting (a) entrance length, (b) bending angle, and (c) fillet radius.
Energies 15 08205 g013
Figure 14. Simulation results at optimal design points A′ and C′ in Figure 12; (a) the axial velocity magnitude along the hot water channels, and (b) the profiles of axial velocity magnitude and streamline pattern at the turning locations of the flow channels.
Energies 15 08205 g014
Table 1. Major studies for the flow channel optimization of PEMFC and the employed methodology.
Heat ExchangerWorking FluidObjective FunctionRef.
Plate-fin heat
exchanger
AirMaximize: Colburn factor
Minimize: friction factor
[16]
Plate heat
exchanger
R134a and waterMaximize: heat transfer surface area
Minimize: pressure drop
[17]
Shell and tube heat exchangerOil and waterMaximize: effectiveness
Minimize: pressure drop, cost, and entropy generation
[18]
Plate-fin heat exchangerAirMaximize: effectiveness
Minimize: total annual cost
[19]
Fin-and-tube heat exchangerAir and waterMinimize: total weight
Minimize: total annual cost
[20]
Printed circuit heat exchangerCO2Maximize: temperature rise
Minimize: pressure drop
[21]
Table 2. Control factors and level settings for the Taguchi method.
FactorControl ParameterLevel
123
AInlet temperature of hot water (°C)758595
BInlet temperature of cold water (°C)102030
CFlow rate ratio of cold/hot water flows *0.250.51
*: Flow rate of hot water is fixed at 2 L·min−1 (LPM).
Table 3. L9 (33) orthogonal array.
CaseFactor
ABC
1111
2122
3133
4212
5223
6231
7313
8321
9332
Table 4. Analysis of variance for the three factors A, B, and C.
FactorDFAdj SSAdj MSF-Valuep-Value
A24.93712.468610.730.085
B20.78320.39161.700.370
C263.830831.9154138.740.007
Residual Error20.46010.2300
Total8
Table 5. Optimal parameters for the design points A′, B′, and C′ in the Pareto optimal front.
Design PointGeometric ParametersObjective Function
Entrance Length
(mm)
Bending
Angle
(degree)
Fillet Radius
(mm)
EffectivenessPressure Drop
(Pa)
A′10100.16.180.955529
B′10117.26.170.953492
C′10144.06.090.948454
Publisher’s Note: MDPI stays neutral with regard to jurisdictional claims in published maps and institutional affiliations.

