


Most Searched Topics in the Scientific Literature on Failures in Photovoltaic Installations


Abstract
1. Introduction
2. Operation and Failures of Photovoltaic Installations
- operational:
- -
- frame stratification [17],
- -
- increase in resistance and short circuit in cells [18],
- -
- shading of panels [19],
- -
- junction box failure [20],
- -
- PV panels aging [21],
- -
- a fire in the installation caused by a short circuit [22],
- -
- degradation of cables insulation [23],
- -
- improper operational conditions [24],
- -
- no lightning protection or overvoltage [25],
- environmental:
- regulatory:
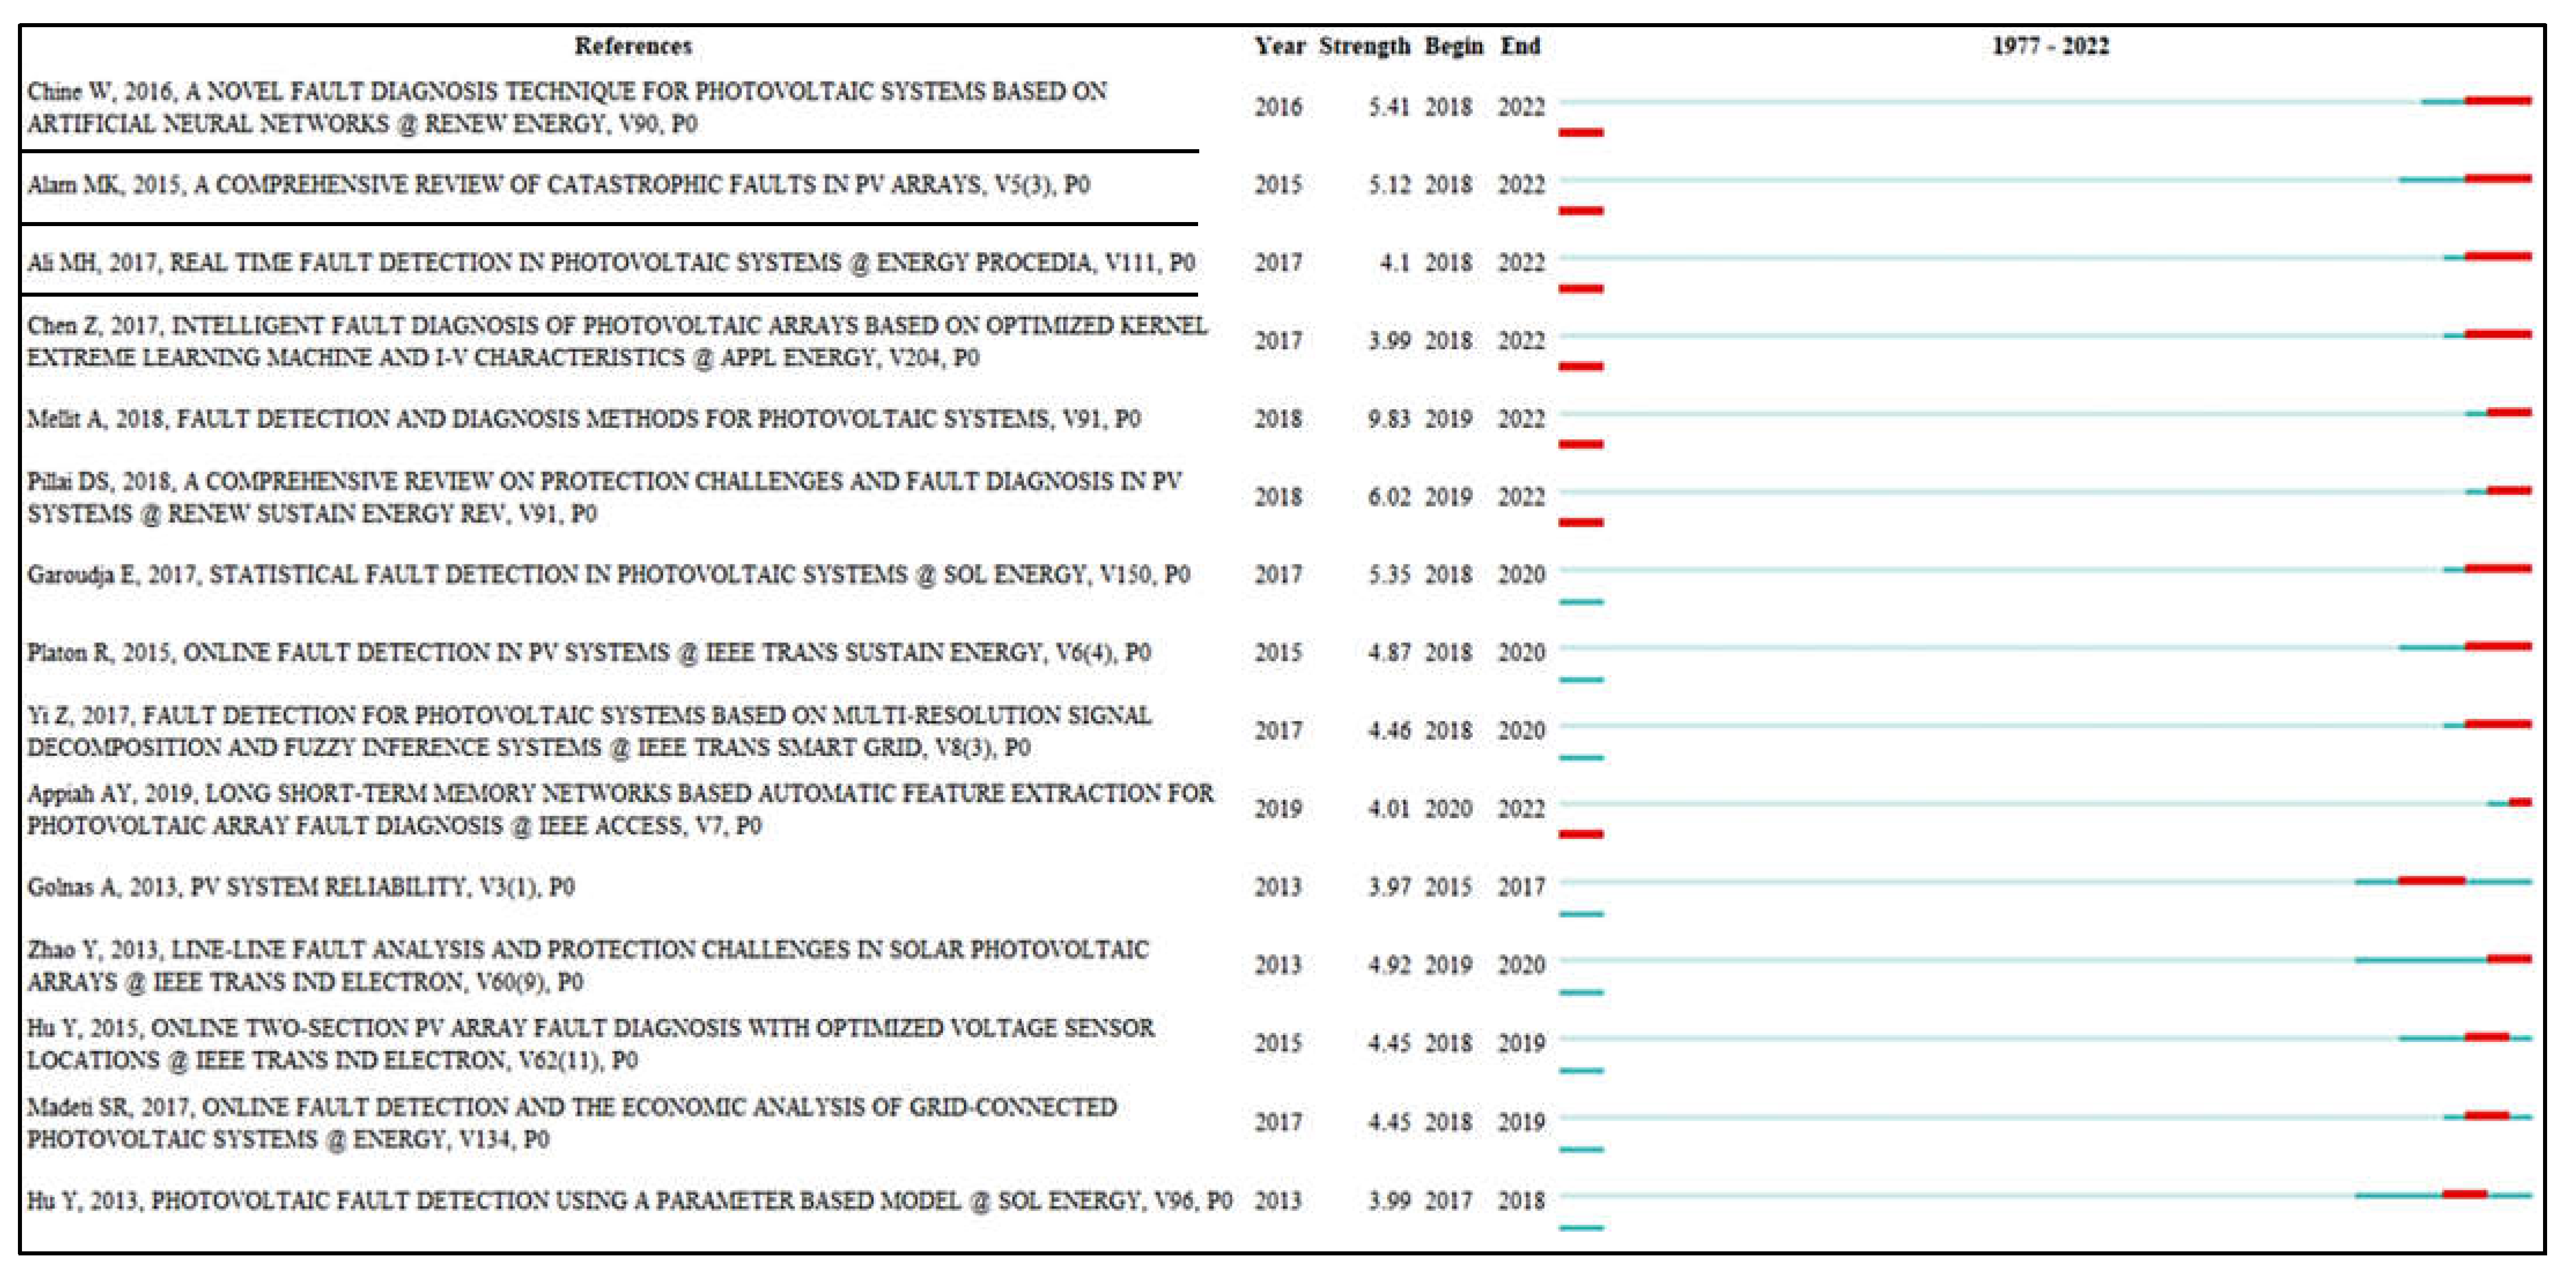
3. Scientometric Analysis of the Literature
4. Multi-Criteria Decision Analysis with Implementation of Analytic Hierarchy Process of Photovoltaic Panels Failure Risk Assessment
5. Conclusions
Author Contributions
Funding
Data Availability Statement
Conflicts of Interest
References
- Musial, W.; Ziolo, M.; Luty, L.; Musial, K. Energy Policy of European Union Member States in the Context of Renewable Energy Sources Development. Energies 2021, 14, 2864. [Google Scholar] [CrossRef]
- Rabczak, S.; Nowak, K. Possibilities of Adapting a Free-Cooling System in an Existing Commercial Building. Energies 2022, 15, 3350. [Google Scholar] [CrossRef]
- Karamov, D.N.; Ilyushin, P.V.; Suslov, K.V. Electrification of Rural Remote Areas Using Renewable Energy Sources: Literature Review. Energies 2022, 15, 5881. [Google Scholar] [CrossRef]
- Kut, P.; Pietrucha-Urbanik, K.; Tchórzewska-Cieślak, B. Reliability-Oriented Design of a Solar-PV Deployments. Energies 2021, 14, 6535. [Google Scholar] [CrossRef]
- Cergibozan, R. Renewable energy sources as a solution for energy security risk: Empirical evidence from OECD countries. Renew. Energy 2022, 183, 617–626. [Google Scholar] [CrossRef]
- Serino, M.N. Energy security through diversification of non-hydro renewable energy sources in developing countries. Energy Environ. 2022, 33, 546–561. [Google Scholar] [CrossRef]
- Rios-Ocampo, J.P.; Arango-Aramburo, S.; Larsen, E.R. Renewable energy penetration and energy security in electricity markets. Int. J. Energy Res. 2021, 45, 17767–17783. [Google Scholar] [CrossRef]
- Trifonov, I.; Trukhan, D.; Koshlich, Y.; Prasolov, V.; Slusarczyk, B. Influence of the Share of Renewable Energy Sources on the Level of Energy Security in EECCA Countries. Energies 2021, 14, 903. [Google Scholar] [CrossRef]
- Czekala, W.; Tarkowski, F.; Pochwatka, P. Social Aspects of Energy Production from Renewable Sources. Eco-development Problems 2021, 16, 61–66. [Google Scholar] [CrossRef]
- Eurostat. Available online: https://ec.europa.eu/eurostat (accessed on 19 August 2022).
- Paska, J.; Piotr, M. Modeling of photovoltaic power plants reliability. Energy Market 2014, 111, 81–86. [Google Scholar]
- Lim, J.R.; Shin, W.G.; Lee, C.G.; Lee, Y.G.; Ju, Y.C.; Ko, S.W.; Kim, J.D.; Kang, G.H.; Hwang, H. A Study of the Electrical Output and Reliability Characteristics of the Crystalline Photovoltaic Module According to the Front Materials. Energies 2021, 14, 163. [Google Scholar] [CrossRef]
- Maihulla, A.S.; Yusuf, I.; Salihu Isa, M. Reliability modeling and performance evaluation of solar photovoltaic system using Gumbel-Hougaard family copula. Int. J. Qual. Reliab. Manag. 2021, 39, 2041–2057. [Google Scholar] [CrossRef]
- He, J.; Sangwongwanich, A.; Yang, Y.; Iannuzzo, F. Lifetime Evaluation of Three-Level Inverters for 1500-V Photovoltaic Systems. IEEE J. Emerg. Sel. Top. Power Electron. 2021, 9, 4285–4298. [Google Scholar] [CrossRef]
- Dhimish, M.; Ahmad, A.; Tyrrell, A.M. Inequalities in photovoltaics modules reliability: From packaging to PV installation site. Renew. Energy 2022, 192, 805–814. [Google Scholar] [CrossRef]
- Johnston, S.; Sulas-Kern, D.B.; Jordan, D. Photovoltaic Module Imaging for Hail Damage Assessment with Multi-year Follow Up. In Proceedings of the 2021 IEEE 48th Photovoltaic Specialists Conference (PVSC), Fort Lauderdale, FL, USA, 25 April 2021; IEEE: New York, NY, USA, 2021; pp. 763–766. [Google Scholar]
- Dubey, R.; Kottantharayil, A.; Shiradkar, N.; Vasi, J. Effect of Mechanical Loading Cycle Parameters on Crack Generation and Power Loss in PV Modules. In Proceedings of the 2021 IEEE 48th Photovoltaic Specialists Conference (PVSC), Fort Lauderdale, FL, USA, 25 April 2021; IEEE: New York, NY, USA, 2021; pp. 799–802. [Google Scholar]
- Yuan, S.; Yang, B.-F.; Zhang, J.-Y. Experimental study on short-circuit current characteristics of a photovoltaic system with low voltage ride through capability under a symmetrical fault. Energy Rep. 2022, 8, 4502–4511. [Google Scholar] [CrossRef]
- Renaudineau, H.; Paradell-Sola, P.; Trilla, L.; Filba-Martinez, A.; Luis Dominguez-Garcia, J. Fault-Tolerant PV Multistring Inverter. In Proceedings of the 2021 13th Annual IEEE Green Technologies Conference Greentech 2021, Denver, CO, USA, 7–9 April 2021; IEEE: New York, NY, USA, 2021; pp. 75–80. [Google Scholar]
- Esemen, M.; Gurler, S. Reliability based modeling of the performance of solar plants with multistate PV modules. Hacet. J. Math. Stat. 2022, 51, 606–617. [Google Scholar] [CrossRef]
- Alves dos Santos, S.A.; Torres, J.P.N.; Fernandes, C.A.F.; Marques Lameirinhas, R.A. The impact of aging of solar cells on the performance of photovoltaic panels. Energy Convers. Manag. X 2021, 10, 100082. [Google Scholar] [CrossRef]
- Yang, H.-Y.; Zhou, X.-D.; Yang, L.-Z.; Zhang, T.-L. Experimental Studies on the Flammability and Fire Hazards of Photovoltaic Modules. Materials 2015, 8, 4210–4225. [Google Scholar] [CrossRef]
- Choudhary, M.; Shafiq, M.; Kiitam, I.; Hussain, A.; Palu, I.; Taklaja, P. A Review of Aging Models for Electrical Insulation in Power Cables. Energies 2022, 15, 3408. [Google Scholar] [CrossRef]
- Rahman, M.M.; Hasanuzzaman, M.; Rahim, N.A. Effects of operational conditions on the energy efficiency of photovoltaic modules operating in Malaysia. J. Clean. Prod. 2017, 143, 912–924. [Google Scholar] [CrossRef]
- Damianaki, K.; Christodoulou, C.A.; Kokalis, C.-C.A.; Kyritsis, A.; Ellinas, E.D.; Vita, V.; Gonos, I.F. Lightning Protection of Photovoltaic Systems: Computation of the Developed Potentials. Appl. Sci. 2021, 11, 337. [Google Scholar] [CrossRef]
- Gobbo, S.; Ghiraldini, A.; Dramis, A.; Dal Ferro, N.; Morari, F. Estimation of Hail Damage Using Crop Models and Remote Sensing. Remote Sens. 2021, 13, 2655. [Google Scholar] [CrossRef]
- Glavaš, H.; Žnidarec, M.; Šljivac, D.; Veić, N. Application of Infrared Thermography in an Adequate Reusability Analysis of Photovoltaic Modules Affected by Hail. Appl. Sci. 2022, 12, 745. [Google Scholar] [CrossRef]
- Chrobak, P.; Skovajsa, J.; Zálešák, M. Effect of cloudiness on the production of electricity by photovoltaic panels. MATEC Web Conf. 2016, 76, 02010. [Google Scholar] [CrossRef]
- Al-Taani, H.; Arabasi, S. Solar Irradiance Measurements Using Smart Devices: A Cost-Effective Technique for Estimation of Solar Irradiance for Sustainable Energy Systems. Sustainability 2018, 10, 508. [Google Scholar] [CrossRef]
- Uematsu, Y.; Yambe, T.; Watanabe, T.; Ikeda, H. The Benefit of Horizontal Photovoltaic Panels in Reducing Wind Loads on a Membrane Roofing System on a Flat Roof. Wind 2021, 1, 44–62. [Google Scholar] [CrossRef]
- Kuttybay, N.; Saymbetov, A.; Mekhilef, S.; Nurgaliyev, M.; Tukymbekov, D.; Dosymbetova, G.; Meiirkhanov, A.; Svanbayev, Y. Optimized Single-Axis Schedule Solar Tracker in Different Weather Conditions. Energies 2020, 13, 5226. [Google Scholar] [CrossRef]
- Lebreton, C.; Kbidi, F.; Graillet, A.; Jegado, T.; Alicalapa, F.; Benne, M.; Damour, C. PV System Failures Diagnosis Based on Multiscale Dispersion Entropy. Entropy 2022, 24, 1311. [Google Scholar] [CrossRef]
- Tavakoli, A.; Saha, S.; Arif, M.T.; Haque, M.E.; Mendis, N.; Oo, A.M.T. Impacts of Grid Integration of Solar PV and Electric Vehicle on Grid Stability, Power Quality and Energy Economics: A Review. IET Energy Syst. Integr. 2020, 2, 243–260. [Google Scholar] [CrossRef]
- Hess, D.J. Science Studies an Advanced Introduction; Nyu Press: New York, NY, USA, 1997. [Google Scholar]
- Che, S.; Kamphuis, P.; Zhang, S.; Zhao, X.; Kim, J.H. A Visualization Analysis of Crisis and Risk Communication Research Using CiteSpace. Int. J. Environ. Res. Public Health 2022, 19, 2923. [Google Scholar] [CrossRef]
- Hu, H.; Xue, W.; Jiang, P.; Li, Y. Bibliometric analysis for ocean renewable energy: An comprehensive review for hotspots, frontiers, and emerging trends. Renew. Sust. Energ. Rev. 2022, 167, 112739. [Google Scholar] [CrossRef]
- Yang, Z.; Huang, D.; Zhao, Y.; Wang, W. A Bibliometric Review of Energy Related International Investment Based on an Evolutionary Perspective. Energies 2022, 15, 3435. [Google Scholar] [CrossRef]
- Guo, Y.; Geng, X.; Chen, D.; Chen, Y. Sustainable Building Design Development Knowledge Map: A Visual Analysis Using CiteSpace. Buildings 2022, 12, 969. [Google Scholar] [CrossRef]
- Wang, D.; Huangfu, Y.; Dong, Z.; Dong, Y. Research Hotspots and Evolution Trends of Carbon Neutrality-Visual Analysis of Bibliometrics Based on CiteSpace. Sustainability 2022, 14, 1078. [Google Scholar] [CrossRef]
- Liu, C.; Yuan, Y.; Zhou, A.; Guo, L.; Zhang, H.; Liu, X. Development Trends and Research Frontiers of Preferential Flow in Soil Based on CiteSpace. Water 2022, 14, 3036. [Google Scholar] [CrossRef]
- Liu, Z.; Yin, Y.; Liu, W.; Dunford, M. Visualizing the intellectual structure and evolution of innovation systems research: A bibliometric analysis. Scientometrics 2015, 103, 135–158. [Google Scholar] [CrossRef]
- CiteSpce. Available online: https://citespace.podia.com/ (accessed on 19 August 2022).
- Chine, W.; Mellit, A.; Lughi, V.; Malek, A.; Sulligoi, G.; Massi Pavan, A. A novel fault diagnosis technique for photovoltaic systems based on artificial neural networks. Renew. Energy 2016, 90, 501–512. [Google Scholar] [CrossRef]
- Alam, M.K.; Khan, F.; Johnson, J.; Flicker, J. A Comprehensive Review of Catastrophic Faults in PV Arrays: Types, Detection, and Mitigation Techniques. IEEE J. Photovolt. 2015, 5, 982–997. [Google Scholar] [CrossRef]
- Ali, M.H.; Rabhi, A.; Hajjaji, A.E.; Tina, G.M. Real Time Fault Detection in Photovoltaic Systems. Energy Procedia 2017, 111, 914–923. [Google Scholar] [CrossRef]
- Saaty, T.L. A scaling method for priorities in hierarchical structures. J. Math. Psychol. 1977, 15, 234–281. [Google Scholar] [CrossRef]
- Saaty, R.W. The analytic hierarchy process—What it is and how it is used. Math. Model. 1987, 9, 161–176. [Google Scholar] [CrossRef]
- Pietrucha-Urbanik, K.; Tchórzewska-Cieślak, B. Approaches to Failure Risk Analysis of the Water Distribution Network with Regard to the Safety of Consumers. Water 2018, 10, 1679. [Google Scholar] [CrossRef]


| Country | Number of Publications | Centrality |
|---|---|---|
| USA | 331 | 0.15 |
| China | 291 | 0.11 |
| India | 92 | 0.02 |
| Italy | 70 | 0.04 |
| Germany | 64 | 0.20 |
| Japan | 64 | 0.08 |
| United Kingdom | 63 | 0.18 |
| South Korea | 61 | 0.04 |
| Spain | 55 | 0.12 |
| France | 48 | 0.23 |
| Taiwan | 41 | 0.02 |
| Denmark | 31 | 0.08 |
| Australia | 30 | 0.03 |
| Canada | 27 | 0.06 |
| Switzerland | 23 | 0.02 |
| Netherlands | 22 | 0.02 |
| Algeria | 22 | 0.00 |
| Belgium | 18 | 0.01 |
| Singapore | 18 | 0.00 |
| Austria | 18 | 0.01 |
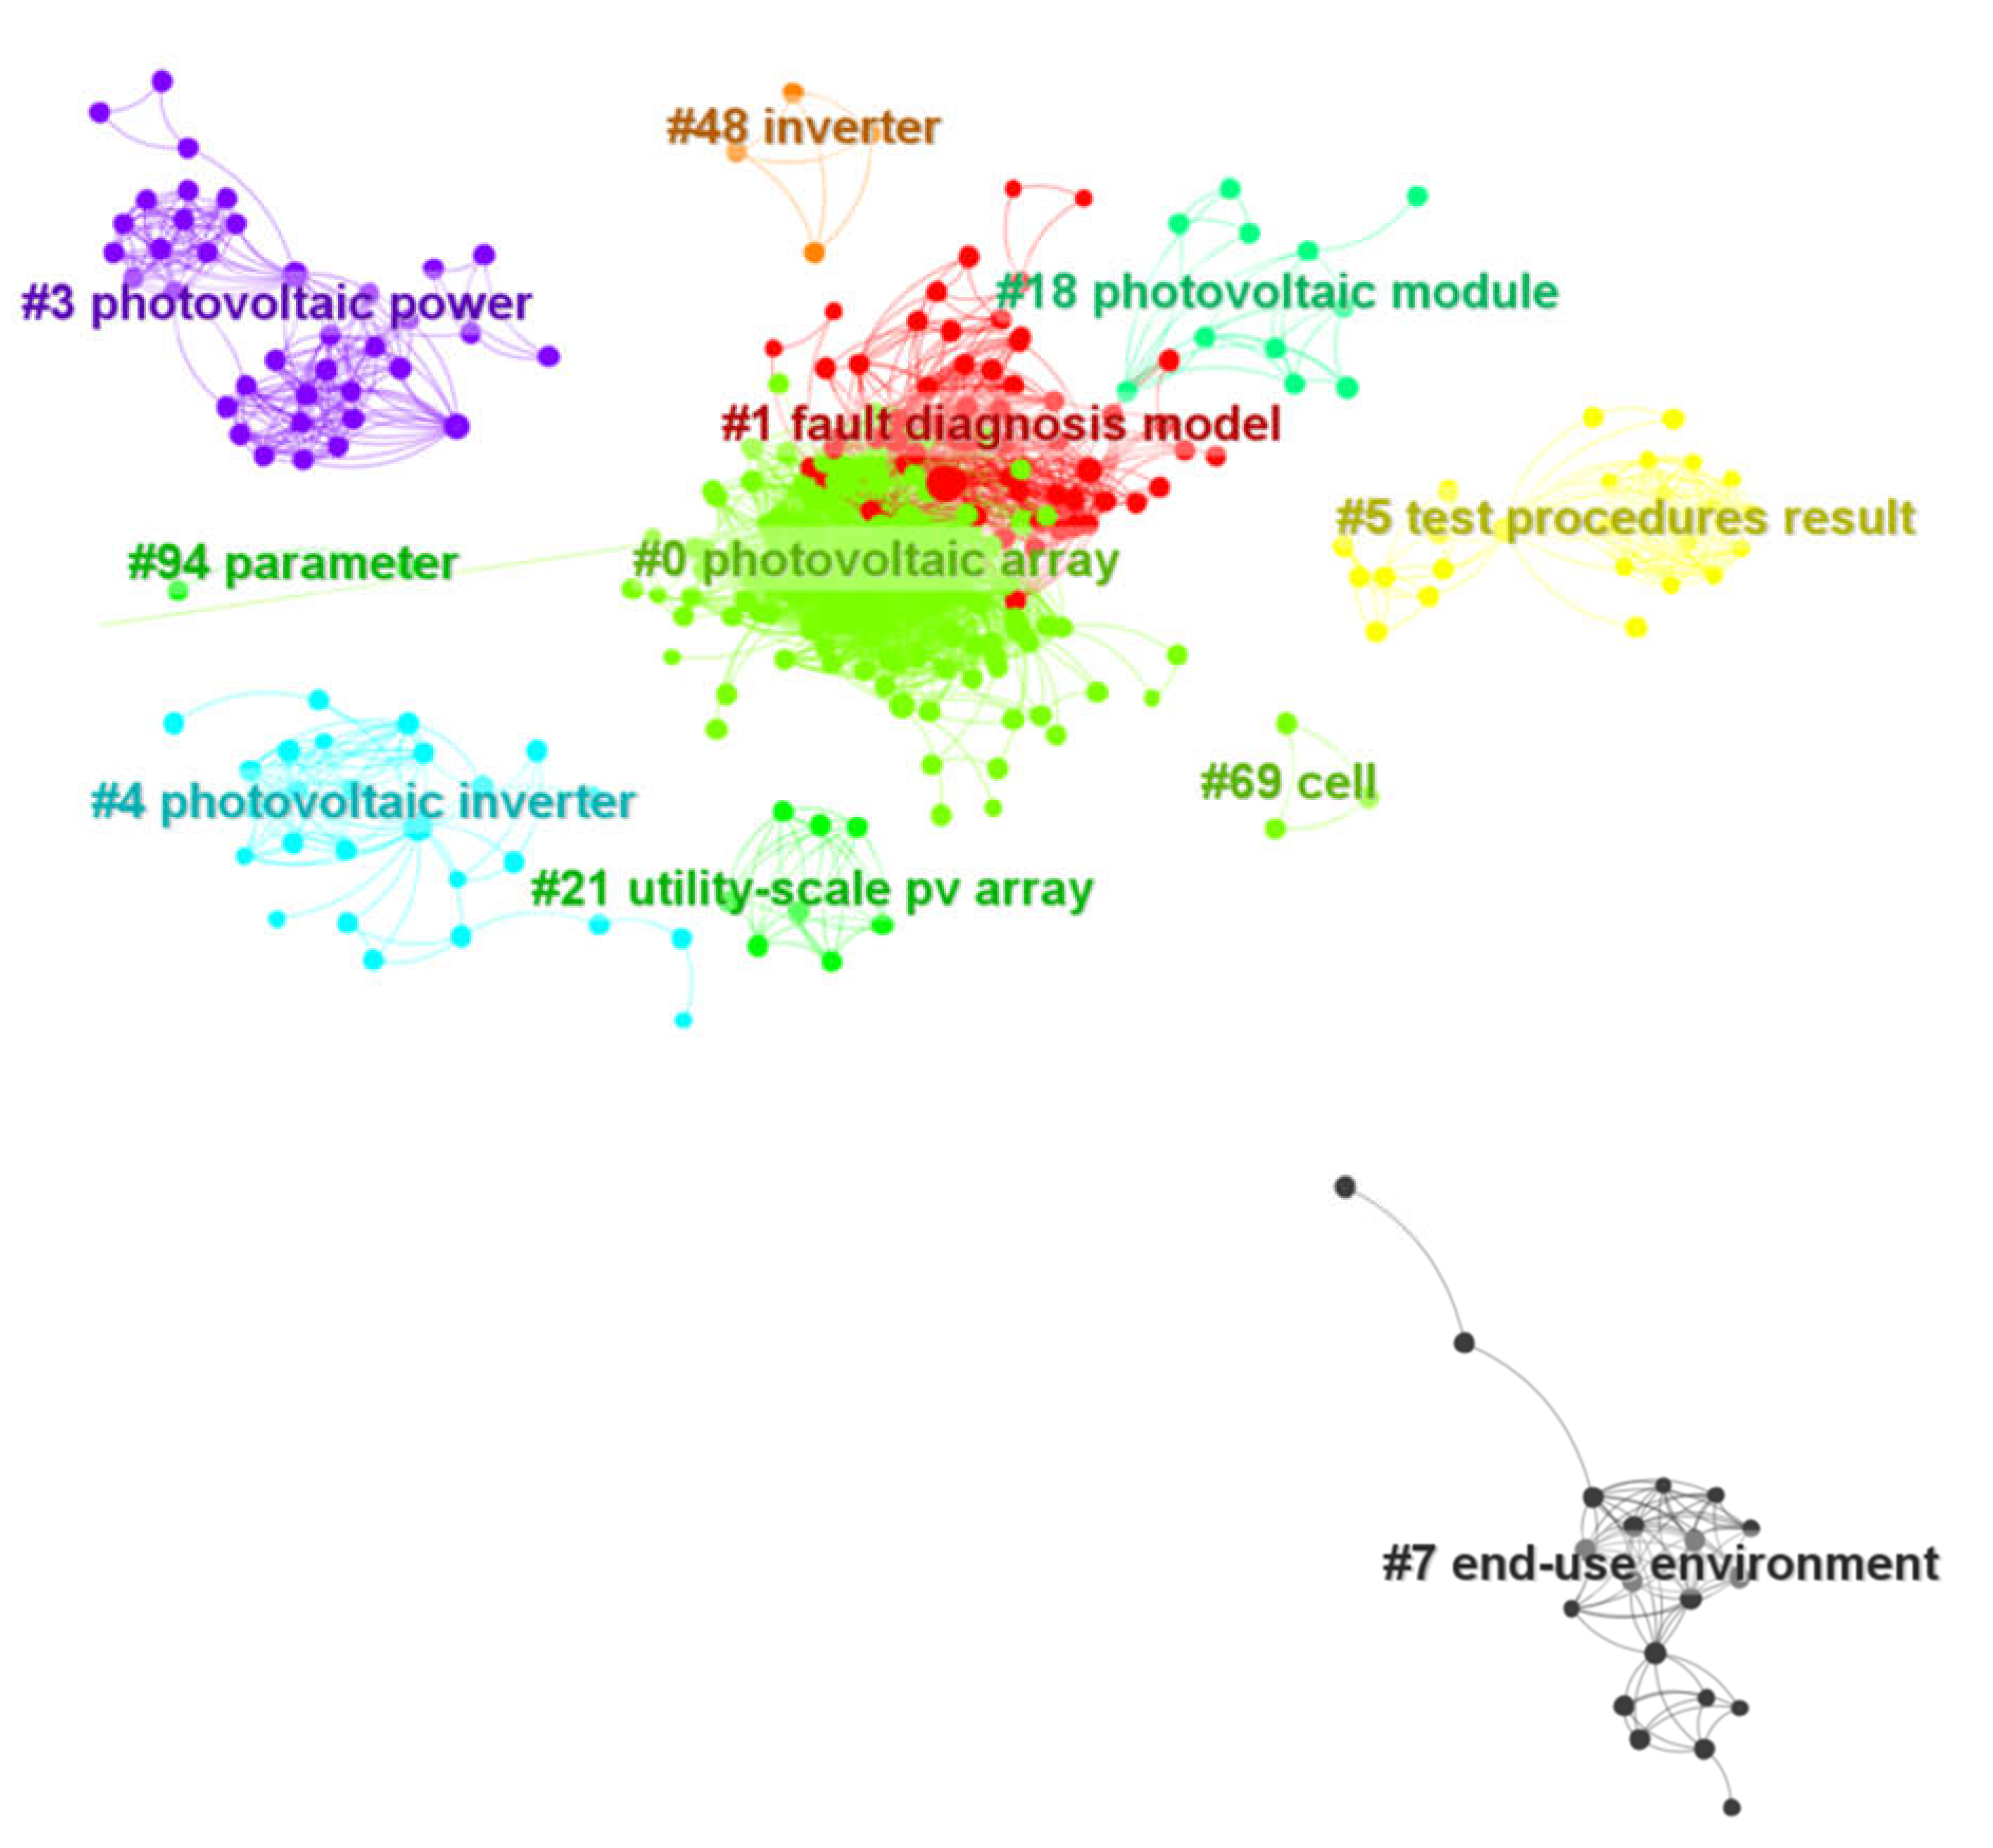
| Cluster ID | Main Interest |
|---|---|
| #0 | Photovoltaic array fault diagnostic, neural network, input fault features, short circuit, non-uniform irradiance |
| #1 | Photovoltaic panels, fault diagnosis models, multiple prediction |
| #3 | Post-fault operation, photovoltaic microconverter, continuous changing operating, continuous changing environmental conditions |
| #4 | PV inverters, small systems, PV system simulation |
| #5 | Bifacial modules, voltage characteristics, various faults |
| #7 | Humidity induced degradation, high temperature, aging techniques |
| #18 | Photovoltaic modules, harsh environment, degradation effects, gradual degradation |
| #21 | Utility scale PV array, current-based protection |
| #48 | Inverters, effectiveness, open-circuit fault in grid connected inverters, |
| #69 | Cell, disconnection, interconnections failure, |
| #94 | Faults diagnosing, monitoring of photovoltaic systems |
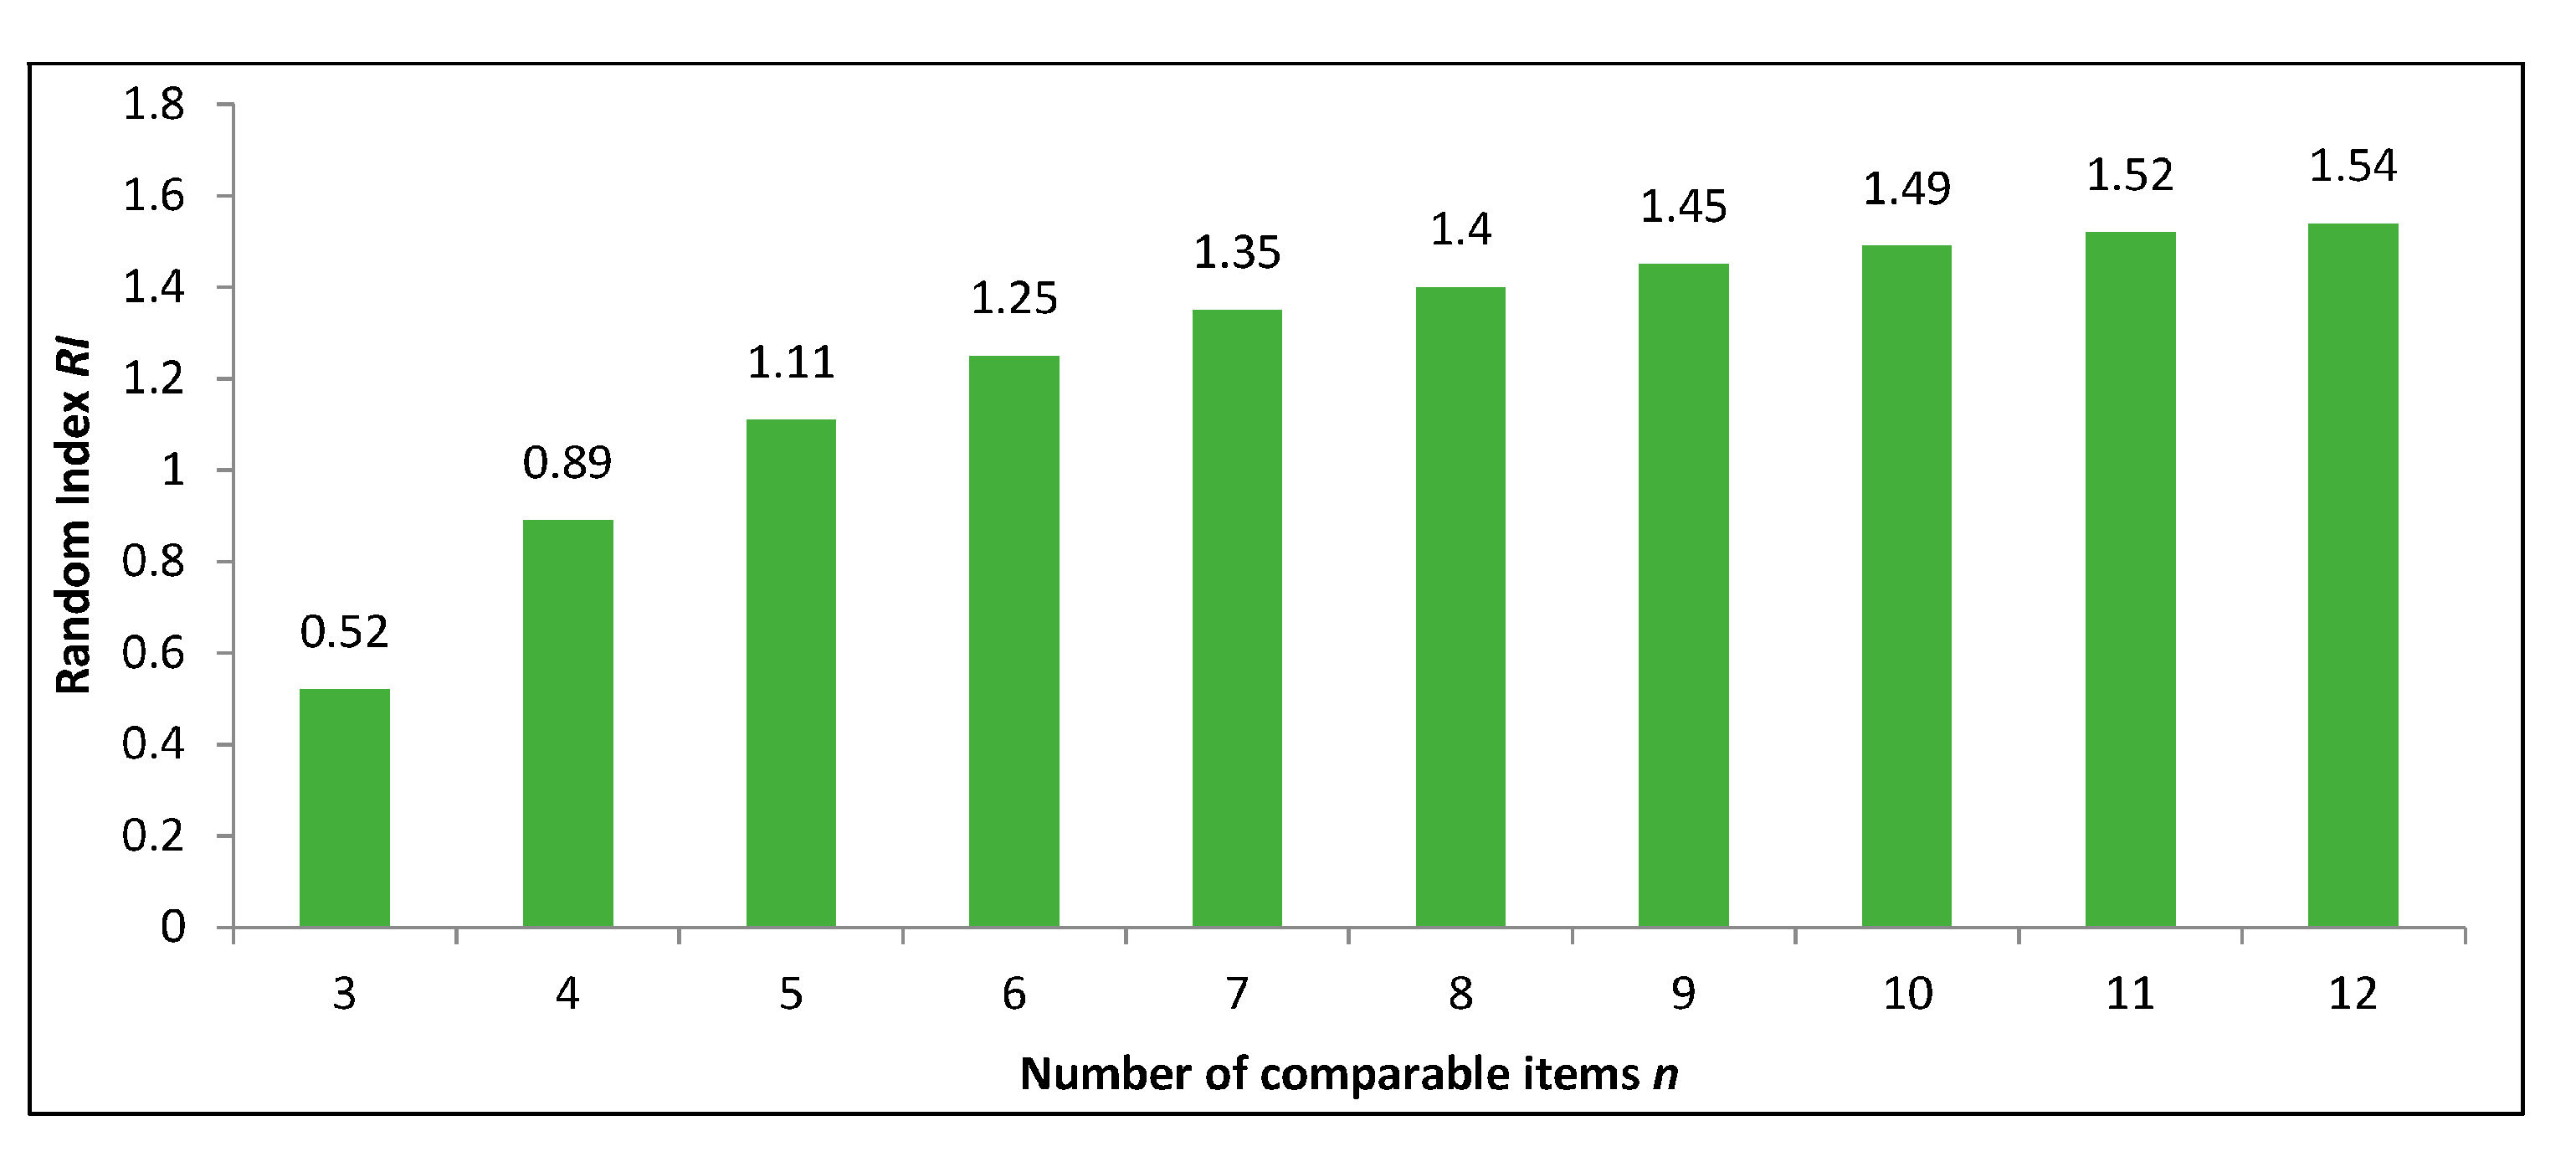
| Interpretation | Value of aij | Definition | |
|---|---|---|---|
| 1 | 1 | i and j are equally important | equal importance |
| 2 | 1/2 | equal to moderate importance values | for comprise between the above values |
| 3 | 1/3 | i is slightly more important than j | moderate importance |
| 4 | 1/4 | moderate to strong importance values | for comprise between the above values |
| 5 | 1/5 | i is more important than j | strong importance |
| 6 | 1/6 | strong to very strong importance values | for comprise between the above values |
| 7 | 1/7 | i is far more important than j | very strong or demonstrated importance |
| 8 | 1/8 | very strong to the extreme importance values | for comprise between the above values |
| 9 | 1/9 | i is absolutely more important than j | extreme importance |
| No. | Categories and Subcategories of Criteria | Point Weighting of Subcategories | |||
|---|---|---|---|---|---|
| 1 | 1(a) | Design | Outdated building plans and blueprints, not taking into account renovations carried out, new chimneys, roofing replaced, | 2 | |
| 1(b) | Failure to take into account the load-bearing capacity of the roof in the design of the photovoltaic installation, | 3 | |||
| 1(c) | Oversizing the inverter power, | 2 | |||
| 1(d) | Failure to consider shading from trees, chimneys or neighboring buildings, | 3 | |||
| 2 | 2(a) | Performance | Installation company is certified and has the reference list, procedures related to the acceptance of investments, PV installation made with the latest technology, | 1 | |
| 2(b) | Installation company has a reference list of completed investments, material verification and acceptance procedures are performed, | 2 | |||
| 2(c) | The company uses structures with safety certificates and approvals for assembly, | 1 | |||
| 2(d) | Use of high-quality photovoltaic panels and components, | 1 | |||
| 3 | 3(a) | Operation | Frame damage | Fracture due to weight, e.g., of snow, | 2 |
| 3(b) | Depressurization, | 3 | |||
| 3(c) | Stratification, | 3 | |||
| 3(d) | Back cover failure | Yellowing, | 1 | ||
| 3(e) | Cracking, | 2 | |||
| 3(f) | Damage to electrical circuits, | 2 | |||
| 3(g) | Cell failures | Cracks in silicon, | 1 | ||
| 3(h) | Breaking the connections connecting the cells, | 1 | |||
| 3(i) | Increase in resistance and short circuit, | 1 | |||
| 3(j) | Shading of panels | Heating of shaded cells, | 2 | ||
| 3(k) | Installation performance drop, | 2 | |||
| 3(m) | Glazing of panels | Breakage of glass due to hail, | 2 | ||
| 3(n) | Water and oxygen entering the cell through the rupture, | 2 | |||
| 3(o) | Contamination of modules resulting in a decrease in power, | 3 | |||
| 3(p) | Junction box | Heating up, | 1 | ||
| 3(q) | Increase in contact resistance, | 1 | |||
| 3(s) | Wiring problems, | 1 | |||
| 3(t) | To 10 years, | 1 | |||
| 3(u) | PV panels age | From 10 to 20 years, | 2 | ||
| 3(v) | Above 20 years, | 3 | |||
| 4 | 4(a) | Social | Nuisance resulting from building installation and green area | PV panel on ground, | 1 |
| 4(b) | PV panels on building, | 2 | |||
| 5 | 5(a) | Financial | Size of possible losses when failure occurs | Financial loss of up to 102 EUR, | 1 |
| 5(b) | Financial loss from 102 to 103 EUR, | 2 | |||
| 5(c) | Financial loss above 103 EUR, | 3 | |||
| 5(d) | Difficulty of repair damage | Breakdown repair time up to 1 day, | 1 | ||
| 5(e) | Breakdown repair time from 1 to 7 days, | 2 | |||
| 5(f) | Breakdown repair time above 7 days, | 3 | |||
| 6 | 6(a) | Environment | Annual average irradiance | To 800 kWh/m2, | 3 |
| 6(b) | From 800 to 1000 kWh/m2, | 2 | |||
| 6(c) | Above 1000 kWh/m2. | 1 | |||
| Category | 1 | 2 | 3 | 4 | 5 | 6 | Weight |
|---|---|---|---|---|---|---|---|
| 1 | 1 | 2 | 2 | 2 | 4 | 5 | 0.320 |
| 2 | 0.5 | 1 | 2 | 2 | 4 | 5 | 0.252 |
| 3 | 0.5 | 0.5 | 1 | 2 | 3 | 5 | 0.190 |
| 4 | 0.5 | 0.5 | 0.5 | 1 | 2 | 2 | 0.120 |
| 5 | 0.25 | 0.25 | 0.333 | 0.5 | 1 | 2 | 0.070 |
| 6 | 0.2 | 0.2 | 0.20 | 0.5 | 0.5 | 1 | 0.048 |
| Total | 2.950 | 4.450 | 6.033 | 8 | 14.5 | 20 | 1.000 |
| No. | Categories and Subcategories of Criteria | Weight | ||||
|---|---|---|---|---|---|---|
| Point Weight of Subcategories | Categories | |||||
| 1 | 1(a) | Design | Outdated building plans and blueprints, not taking into account renovations carried out, new chimneys, roofing replaced | 2 | 0.320 | |
| 1(b) | Failure to take into account the load-bearing capacity of the roof in the design of the photovoltaic installation | 3 | 0.320 | |||
| 1(c) | Oversizing the inverter power | 2 | 0.320 | |||
| 1(d) | Failure to consider shading from trees, chimneys, or neighbouring buildings | 3 | 0.320 | |||
| 2 | 2(a) | Performance | Installation company is certified and has the reference list, procedures related to the acceptance of investments, PV installation made with the latest technology, | 1 | 0.252 | |
| 2(b) | Installation company has a reference list of completed investments, material verification and acceptance procedures are performed, | 2 | 0.252 | |||
| 2(c) | The company uses structures with safety certificates and approvals for assembly | 1 | 0.252 | |||
| 2d) | Use of high-quality photovoltaic panels and components | 1 | 0.252 | |||
| 3 | 3(a) | Operation | Frame damage | Fracture due to weight, e.g., of snow | 2 | 0.190 |
| 3(b) | Depressurization | 3 | 0.190 | |||
| 3(c) | Stratification | 3 | 0.190 | |||
| 3(d) | Back cover failure | Yellowing | 1 | 0.190 | ||
| 3(e) | Cracking | 2 | 0.190 | |||
| 3(f) | Damage to electrical circuits | 2 | 0.190 | |||
| 3(g) | Cell failures | Cracks in silicon | 1 | 0.190 | ||
| 3(h) | Breaking the connections connecting the cells | 1 | 0.190 | |||
| 3(i) | Increase in resistance and short circuit | 1 | 0.190 | |||
| 3(j) | Shading of panels | Heating of shaded cells | 2 | 0.190 | ||
| 3(k) | Installation performance drop | 2 | 0.190 | |||
| 3(m) | Glazing of panels | Breakage of glass due to hail | 2 | 0.190 | ||
| 3(n) | Water and oxygen entering the cell through the rupture | 2 | 0.190 | |||
| 3(o) | Contamination of modules resulting in a decrease in power | 3 | 0.190 | |||
| 3(p) | Junction box | Heating up | 1 | 0.190 | ||
| 3(q) | Increase in contact resistance | 1 | 0.190 | |||
| 3(s) | Wiring problems | 1 | 0.190 | |||
| 3(t) | To 10 years | 1 | 0.190 | |||
| 3(u) | PV panels age | From 10 To 20 years | 2 | 0.190 | ||
| 3(v) | Above 20 years | 3 | 0.190 | |||
| 4 | 4(a) | Social | Nuisance resulting from building installation and green area | PV panel on ground | 1 | 0.120 |
| 4(b) | PV panels on building | 2 | 0.120 | |||
| 5 | 5(a) | Financial | Size of possible losses when a failure occurs | Financial loss of up to 102 EUR, | 1 | 0.070 |
| 5(b) | Financial loss from 102 to 103 EUR, | 2 | 0.070 | |||
| 5(c) | Financial loss above 103 EUR, | 3 | 0.070 | |||
| 5(d) | Difficulty of repair damage | Breakdown repair time up to 1 day | 1 | 0.070 | ||
| 5(e) | Breakdown repair time from 1 to 7 days | 2 | 0.070 | |||
| 5(f) | Breakdown repair time above 7 days | 3 | 0.070 | |||
| 6 | 6(a) | Environment | Annual average irradiance | To 800 kWh/m2 | 3 | 0.048 |
| 6(b) | 800–1000 kWh/m2 | 2 | 0.048 | |||
| 6(c) | Above 1000 kWh/m2 | 1 | 0.048 | |||
Publisher’s Note: MDPI stays neutral with regard to jurisdictional claims in published maps and institutional affiliations. |
© 2022 by the authors. Licensee MDPI, Basel, Switzerland. This article is an open access article distributed under the terms and conditions of the Creative Commons Attribution (CC BY) license (https://creativecommons.org/licenses/by/4.0/).
Share and Cite
Kut, P.; Pietrucha-Urbanik, K. Most Searched Topics in the Scientific Literature on Failures in Photovoltaic Installations. Energies 2022, 15, 8108. https://doi.org/10.3390/en15218108
Kut P, Pietrucha-Urbanik K. Most Searched Topics in the Scientific Literature on Failures in Photovoltaic Installations. Energies. 2022; 15(21):8108. https://doi.org/10.3390/en15218108
Chicago/Turabian StyleKut, Paweł, and Katarzyna Pietrucha-Urbanik. 2022. "Most Searched Topics in the Scientific Literature on Failures in Photovoltaic Installations" Energies 15, no. 21: 8108. https://doi.org/10.3390/en15218108
APA StyleKut, P., & Pietrucha-Urbanik, K. (2022). Most Searched Topics in the Scientific Literature on Failures in Photovoltaic Installations. Energies, 15(21), 8108. https://doi.org/10.3390/en15218108