Abstract
Emissions from the road transport sector are a major contributor to the climate change. Commonly used heavy vehicles powered by diesel engines emit toxic and harmful compounds that adversely affect the environment. For this reason, increasingly newer Euro emission standards are being introduced. Therefore, the emission performance of heavy-duty vehicles used in the transportation processes of diverse loads was investigated. The first research object was a set of vehicles equipped with a crane used for loading and unloading timber. The measurements were carried out in a specially designed research test reflecting the way the vehicle is used. It consisted of the drive to the loading site, the transport of timber to the destination and the processes of loading and unloading timber. The test route included driving on both unpaved forest roads and asphalt roads. The second research object was a set of vehicles used in long-distance road transport. The research route characterizing the traffic of vehicles from the cited group was selected here. There were three stages of the route–urban, extra-urban and highway. The whole trip was carried out with a load of 24,800 kg. The testing equipment consisted of SEMTECH DS and AVL Micro Soot Sensor devices belonging to the PEMS (Portable Emission Measurement System) group. Based on the obtained results, the influence of the operating conditions on the exhaust emissions and fuel consumption was determined.
1. Introduction
In recent years, the world has seen a crisis in the transportation sector. The coronavirus pandemic, widespread closures and all sorts of restrictions have reduced the number of people in transit. According to the latest data [1], freight transport in Europe also declined in 2019–2020. The nearly 1% decrease in road freight transport was directly attributable to a decline in international and domestic freight. The first half of 2020 saw a decline in freight work in the European Union member states. The second quarter of this year brought more than 7% fewer ton-miles compared to the previous months. The crisis was a direct consequence of increased restrictions and blockades on international traffic aimed at stopping the spread of the virus. Despite the difficulties, road transport still plays a significant role in the freight sector. This is particularly evident in Poland [1]. According to the Eurostat data, trucks registered in Poland recorded the highest number of ton-miles. In addition, as mentioned in a publication by Bielaczyc P. et al. [2], the population will grow in the coming years, which will contribute to an increased demand for the distribution of all kinds of goods.
The widespread use of road transport is determined by a number of advantages that characterize this mode of transportation. Undoubtedly, the greatest functionality is the ability to deliver cargo directly from point A to point B–from sender to recipient. The use of road vehicles also carries negative consequences. They manifest themselves, among other things, in the emission of pollutants into the atmosphere resulting from the combustion of fossil fuels. It is worth mentioning that, according to the European Environment Agency, the transport sector accounts for one-third of energy consumption in the European Union [3].
Diesel engines are used to power HDVs. Among other things, these engines are characterized by high efficiency. However, they struggle with the problem of emitting harmful compounds into the atmosphere [4]. The compounds emitted by motor vehicles include toxic carbon monoxide, nitrogen oxides, hydrocarbons, carcinogenic particulates and the greenhouse gas–carbon dioxide [5]. As pointed out in [6], an increasing number of motor vehicles is being used to transport goods and the transportation of freight by road alone accounts for the largest share of emissions among all modes of transportation. In turn, the paper [6] concluded that using longer and larger vehicles to transport freight would save both money and reduce greenhouse gas emissions. Eickman et al. undertook a comparison of the CO2 emissions of a freight train and a truck [7]. Increased knowledge of the impact of exhaust gas on the natural ecosystem and human health results in the introduction of measures to reduce the negative impact of the exhaust gas. One of the European Union’s goals is to transition to low- and zero-emission vehicles in order to achieve climate neutrality. A single EU state aims to achieve CO2 neutrality by 2050. In addition, legislative bodies around the world are increasing emission limits for individual exhaust components [3]. These measures are forcing automotive companies to use increasingly efficient and advanced exhaust aftertreatment systems. At the same time, an appropriate selection of both engine and non-engine emission-limiting solutions regarding individual exhaust components is essential [4,8,9].
The volume of exhaust emissions varies widely and depends on multiple factors. It is influenced, among other things, by the speed of driving, the situation on the road, the condition of the infrastructure, the driver’s skills or the weather conditions. However, it is very difficult to obtain comprehensive data on the emissions of individual exhaust components in laboratory tests. Therefore, increasing attention is drawn to measuring emissions under actual operating conditions using the PEMS equipment (Portable Emission Measurement System).
Much of the contemporary research and analysis devoted to determining the actual emissions of various exhaust components is based on RDE studies [10,11,12,13]. Much of the research is directly to emissions from different types of trucks under actual operating conditions [14,15,16]. In addition, there was an opportunity to develop a model of instantaneous CO2 emission of a vehicle equipped with a hybrid system based on the use of machine learning techniques [17]. The publication [18] evaluated emissions under actual operating conditions of a biogas-powered bus. Differences in real-world emissions between diesel and LNG powered HDVs were the subject of discussion in Lv, Ge et al. [19]. In [20], an attempt was made to determine emissions during cold start from gasoline and LPG vehicles for selected ambient temperatures. Li and Lu [21] focused on evaluating nitrogen oxide emissions from a heavy-duty vehicle under actual operating conditions. In [22], the authors focus onto the actual NOx emissions. In contrast, [23] focused on determining the exhaust emissions in the process of extracting and transporting timber. Grigoratos et al. [4], on the other hand, studied HDVs (four trucks of different types and a bus) fitted with Euro VI engines. The study confirmed that the exhaust after-treatment system used in the vehicles was effective, as the amount of the emitted compounds was significantly lower than the limits set by the emission standard. However, the authors of the publication noted that, for some compounds, the increased emissions occur at low speeds [4,24,25]. This confirms the fact that even when complex exhaust aftertreatment systems are used, factors such as speed and driving dynamics have a significant influence on the emissions. The problem of nitrogen oxide emissions from trucks is also the subject of an analysis presented in the paper by Mendoza-Villafuerte et al. [26]. The data provided by the PEMS equipment allows a comprehensive evaluation of the emissions of individual exhaust components from both motor vehicles and other machinery fitted with internal combustion engines [27,28,29,30]. Reference [31] presents a detailed analysis of particulate matter emissions from a truck and a city bus, taking into account the weight and the size distribution as well as the PM count (PN). The study showed that the installed particulate filters effectively trap larger particles. In the case of freight transport, the level of emitted exhaust components is also fundamentally influenced by the weight of the transported cargo, as demonstrated in [32,33,34]. It is also worth noting that nowadays almost any type of cargo is transported by road–from general cargo to liquids, containers, natural resources or hazardous materials. A wide range of transported cargo also forces the use of special solutions to facilitate its safe transportation. Reference [35] presents an analysis of the emissions from HDVs carrying big bags and steel. The same authors in [26] presented the process of harvesting and transporting timber using specially adapted trucks. It is noteworthy that the above-mentioned machines transport completely different loads and, in part, are operated under different conditions. Therefore, this paper compares the emissions of heavy-duty vehicles of different applications.
The authors proposed a new method of assessment in forest transport. There are few publications in this field. The authors took into account the different road surfaces and the individual phases of the logging process. They compared the results with a conventional heavy-duty truck. The influence of the transported load on the indicated parameters was also investigated. For this purpose, the indicators of the measure of the transport work related to the fuel consumption and individual exhaust gas components were determined. The variety of the research objects and the nature of their operation made it possible to show a wide range of applications for HDVs in road transport of goods
2. Materials and Methods
2.1. Research Objects
Two road units were used for the tests (Figure 1), the technical data of which are summarized in Table 1. The first unit (A) consisted of a tractor-trailer with a stanchion tail specially adapted to carry timber. The vehicle was equipped with a crane for loading and unloading of timber. In this case, the vehicle was powered by a 6-cylinder diesel engine with a maximum power output of 353 kW. During the test, the vehicle was carrying logs of a total weight of 25,000 kg.

Figure 1.
Research objects (a) Research object A (b) Research object B.

Table 1.
Research object specification.
The second vehicle was a tractor unit with a curtainsider. During the tests the vehicle transported steel of a total mass of 24,800 kg. The tractor was fitted with an 8-cylinder diesel engine of the capacity of 15.6 dm3 and the power output of 412 kW. The engine is Euro V compliant fitted with an SCR system to reduce the NOx emissions. For both vehicles was used diesel b7 fuel.
2.2. Measurement Equipment
The testing of the vehicles was carried out using advanced PEMS equipment. For the analysis of the exhaust gas from vehicle B, the Semtech DS (Sensors) instrumentation was used (Figure 2). The device enables the measurement of exhaust gas components (CO, CO2, HC, NOx, and O2) during actual operation of the machine. The measurement system is equipped with a number of analyzers such as FID (Flame Ionization Detector), NDUV (Non-Dispersive Ultraviolet) and NDIR (Non-Dispersive Infrared). They are responsible for measuring hydrocarbons, nitrogen oxides, carbon monoxide and carbon dioxide, respectively. The oxygen content is determined by means of an electrochemical sensor (Table 2.). In contrast, the Axion R/S+ was used to test vehicle A (Figure 2). This equipment is more compact and allows the measurement of both gaseous components and particulates in the exhaust gas. CO, CO2, and THC are measured using an NDIR analyzer. The NOx concentration is determined using an electrochemical analyzer, while particulate matter is measured using a laser scattering method (Table 3.) [10]. In addition, both studies used a Texa apparatus which, together with a GPS system, enabled the recording of the engine operating parameters including, but not limited to, the engine speed and load.
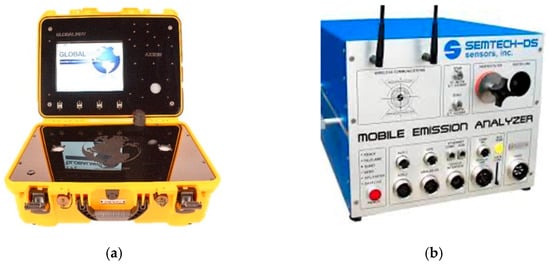
Figure 2.
Measurement equipment (a) Axion R/S+ (b) Semtech DS.

Table 2.
Semtech DS technical specifications.

Table 3.
Axion RS+ technical specifications.
2.3. Research Cycle
Due to the different nature of the operation of the two test objects, the routes were constructed to reflect their actual operating conditions. For vehicle A, the authors proposed a route that represented a standard timber haul from a forest to a sawmill. The study started at a local company and led along paved roads (both urban and non-urban) to the forest, then, on unpaved roads to the timber storage area where the loading of the timber took place. The next stage was to return the loaded vehicle to the sawmill where the timber was unloaded. The total distance of the route was 52 km, of which 8.5 km were forest roads and 43.5 km were public paved roads (Figure 3). In the case of vehicle B, the test began in an industrial part of a medium-sized city. The route led through urban (A–B) and non-urban (C–D) roads to a freeway junction, from where it returned to the starting point (Figure 3). Lasting over 30 min, the test cycle reflects a typical freight transport system. It was one repetitions performed in the measurements for both cycle.
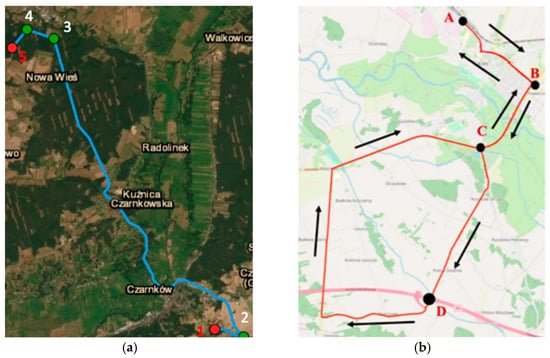
Figure 3.
(a) test route of the tractor–wood loader; (b) test route of the tractor–trailer.
3. Results
3.1. Research Results Obtained from Vehicle A
Based on the obtained data, the characteristics of the proportion of running time as a function of speed and acceleration were also prepared. During the run on the paved roads, the vehicle moved at speeds in the range of 0–28 m/s and for both runs very similar characteristics were obtained. During the drive to the forest, the dominant share was observed for speeds in the range (16 m/s; 24 m/s> and accelerations in the range <−0.6 m/s2; 0.6 m/s2>. The highest value for a single interval of approximately 13% was observed for the speed (20 m/s; 24 m/s> and the acceleration (0 m/s2; 0.6 m/s2>. In the case of the transport of timber, however, a greater share of the specific operating time was observed for lower values of speed, i.e., from the range (8 m/s–16 m/s> and acceleration from <−0.6 m/s2; 0.6 m/s2>. A much smaller proportion of the operating time was also recorded for speeds in the range (20 m/s; 24 m/s>. In addition, it is noteworthy that the highest value for each interval was observed for the lower speed falling within the range of (16 m/s; 20 m/s> and acceleration of <0–0.6 m/s2>. It amounted to approximately 12%. The above-mentioned relationships are mainly due to the higher vehicle load as a result of transporting wood. During the trip to the forest, both with and without the load, the vehicle moved mainly with speeds in the range (0 m/s; 4 m/s> and accelerations in the ranges <–0.6 m/s2; 0 m/s2), 0 m/s2 and (0; 0.6 m/s2>, as shown in Figure 4 and Figure 5. It is noteworthy that driving without a load on forest roads was characterized by a slightly higher proportion of the above-mentioned ranges, by 8% and 17%, respectively, for the first two previously mentioned ranges. In the case of driving to the wood yard on unpaved roads, a significant share of vehicle stops was observed. They resulted from the course and characteristics of the measuring part of road in forest. Summarising the analysis of the vehicle’s driving profile in the test during timber transport, the vehicle travelled at an average speed of 57 km/h on paved roads. On forest roads, however, the vehicle travelled an average of 8 km/h. For example, in [23] the transport from the forest to the sawmill took place at an average speed of 10 km/h on unpaved roads and 42 km/h on paved roads. In [36] the vehicles used for timber transport travelled at an average speed of just under 14 km/h on forest roads.
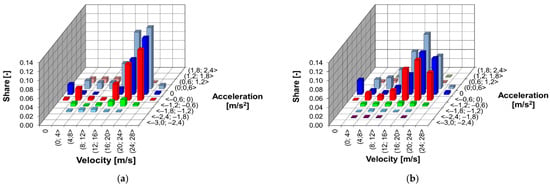
Figure 4.
Characteristics of the share of work time as a function of speed and acceleration during (a) forest road transport and (b) road to the sawmill.
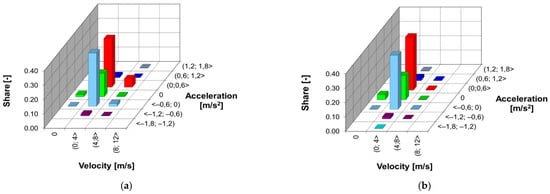
Figure 5.
Characteristics of the share of operating time as a function of speed and acceleration during the forest road transit (a) unloaded (b) loaded.
In order to show a comprehensive analysis of the work done by the engine of the vehicle used to transport wood, the time density characteristics of the engine work as a function of speed and torque were prepared. The graphs were determined based on the data obtained from the diagnostic system of the object under study. In this case, the analysis was also carried out with reference to individual stages of the timber extraction process. During the journey to the forest by the paved roads, the unit performed work equal to 47.5 kWh. The study showed that the engine operated in the torque from 0 Nm to 2800 Nm and crankshaft speeds from 400 rpm to 2200 rpm. Significant shares were observed for the engine speed in the range (1200 rpm; 1600 rpm> and torque in the range (0 Nm; 2400 Nm>. On the other hand, the largest share of the operating time was approximately 17% for the engine load ranging from (1200 Nm; 1600 Nm> and engine speed of (1400 rpm; 1600 rpm>. When transporting timber on the paved roads, the engine operated in the same torque ranges compared to the forest access roads. The speed range was (400 rpm; 4400 rpm>. Also, the highest proportion of work (approximately 12%) was recorded for the speed in the ranges (1400 rpm; 1600 rpm> and torque in the range (1200 Nm; 1600 Nm>.
The main operating area is similar to the area recorded during the first stage of the test. Due to the carriage of approximately 20 tons of wood and the higher load of the engine, the significant work area is also the speed range (1400 rpm; 1600 rpm> in the torque range (2400 Nm; 2800 Nm>. It is worth noting that the share of work of the engine in this area is, on average, 75–90% higher than the values obtained for the passage without a load (Figure 6). During the second part of the test that included a forest road run, the engine operated in the same speed range as on the paved road run and a much lower load (0 Nm; 1600 Nm>. The most frequently used area of engine operation (both when driving with and without load) was the low torque (0 Nm; 800 Nm> and speed (600 rpm; 800 rpm>. The highest proportion of the engine operating time during the forest road drive without a load was for the torque ranging from 0 Nm to 400 Nm at (1200 rpm; 1400 rpm>. This amounted to 21%. In the case of transporting wood on the unpaved road, the maximum (approximately 15%) occurred for the engine speed of (800 rpm; 1200 rpm> and torque ranging from 400 Nm to 800 Nm. When analyzing the obtained density characteristics, it is clear that the main operating area during the carriage of timber was the speed range of (800 rpm; 2200 rpm> at (400 Nm; 800 Nm>. For the unloaded run, this area fell in the same speed range, but the torque range was not dominated by one interval and ranged from 0 Nm to 800 Nm. The work performed by the engine when transporting wood was 17.4 kWh. Driving on the unpaved roads without a load resulted in 16.5 kWh of work performed by the engine (Figure 7).
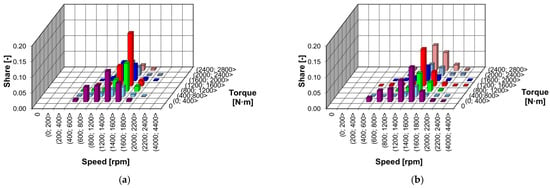
Figure 6.
Characteristics of the share of operating time as a function of engine speed and load during (a) a forest road run and (b) trip to the sawmill.
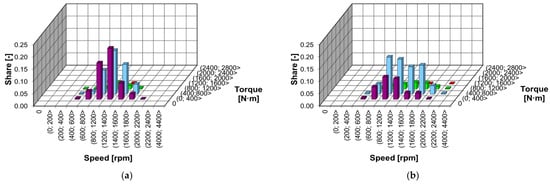
Figure 7.
Characteristics of the share of operating time as a function of engine speed and load when driving on forest roads (a) unladen and (b) carrying a load.
In order to provide a comprehensive analysis of the exhaust emissions in the process of timber transport, the loading processes were also examined. Due to the fact that the test vehicle was equipped with a crane, it was not necessary to engage additional equipment for loading of timber. During the loading tasks, the engine of the research object operated within the speed ranges of (400 rpm; 1400 rpm> and loads of <0 Nm; 1200 Nm>. During both the loading and unloading of the raw material, the dominant operating area was the point described by the speed and torque ranges: (800 rpm; 1200 rpm> and (400 Nm; 800 Nm>. It is worth mentioning that the share of this work area was approximately 95% greater during loading. This is directly due to the fact that this process took longer than the unloading (Figure 8).

Figure 8.
Characteristics of the share of operating time as a function of engine speed and load during (a) loading and (b) unloading.
The relation of the obtained values of carbon monoxide emission to the operating parameters of the studied object shows a very diverse and uneven trend of the exhaust emissions (Figure 9). In the case of the test run to the forest, two areas with increased emissions can be distinguished. The first one occurred for the speed ranges of (800 rpm; 1200 rpm> and loads of (400 Nm; 2000 Nm>. The second one occurred for the highest values of load (2000 Nm–2800 Nm) and speed (1400 rpm–2200 rpm). When analyzing the characteristics for the carriage of wood, it is possible to observe three dominant areas where significant emission of the investigated exhaust components occurred. These were observed for the ranges: (600 rpm; 800 rpm> and (400 Nm; 800 Nm>, (800 rpm; 1200 rpm> and (800 Nm; 1200 Nm> and (600 rpm; 800 rpm> and (1200 Nm; 1600 Nm>. The emission intensities for the above areas were 64 mg/s, 36 mg/s and 83 mg/s, respectively. In the outstanding engine operating areas, the emission intensities were relatively similar.

Figure 9.
CO emission during (a) the drive in the forest and (b) the drive to the sawmill on a paved road as a function of engine speed and load.
During the test run to the forest, it can be observed that the distribution of nitrogen oxides emission intensity is uneven. For this component, two significant areas of operation were observed where increased emissions occurred. The mentioned areas were registered for medium and high torque and speed ranges: (400 rpm; 1400 rpm>, (400 Nm; 200 Nm>, and (1200 rpm; 2200 rpm>, (400 Nm;200 Nm>. The second area had the highest emission values. It should be noted that in the case of the carbon monoxide emission intensity, also similar work areas with increased emission of the studied component were observed. The maximum intensity of the NOx emission was approximately 49 mg/s. It occurred for the maximum speed and torque in the range of (1600 Nm; 2000 Nm>. This is a direct result of the fact that during the route to the forest the right operating conditions for the SCR system, which is directly responsible for reducing these compounds, did not occur. A high exhaust gas temperature is required for its proper operation. In the case of trips to the forest without a load, the SCR catalytic system did not reach the required light-off temperature, this means that the conditions under which the described system reached 50% were not achieved. During the drive to the sawmill, the intensity of the NOx emission was negligible and quite evenly distributed throughout the recorded engine load range. Compared to the drive without the load, these values are extremely marginal. When analyzing the obtained characteristics, it is possible to observe only a slight increase in the emission level for the highest torque values. The highest intensity during the return run, recorded for the speeds in the range of (1200 rpm; 1400 rpm> and torque of (2000 Nm; 2400 Nm>, was more than 18 times lower compared to the drive to the forest (Figure 10).
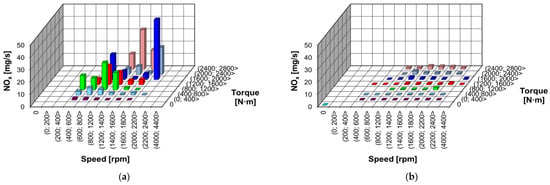
Figure 10.
NOx emission during (a) the drive in the forest and (b) the drive to the sawmill on a paved road as a function of the engine speed and load.
The emission of unburned hydrocarbons during the drive to the forest was observed for a speed range of (400 rpm; 2200 rpm> and the entire load range of the engine, i.e., from 0 Nm to 2800 Nm. When analyzing the characteristics of the vehicle transporting timber, it can be observed that the THC emission occurred for the same torque and speed range up to 4400 rpm. Over the entire range of characteristics, for both runs, the amount of emission increased with the increasing speed and torque (Figure 11). In both cases, the maximum emission occurred for the maximum load and speed in the range of (2200 rpm; 2400 rpm> (while carrying timber) and (1600 rpm; 1800 rpm> (while driving with no load). These values reached 0.38 mg/s and 0.65 mg/s, respectively.

Figure 11.
THC emission for (a) the drive in the forest and (b) the drive to the sawmill as a function of engine speed and load.
The characteristics of the density of the CO2 intensity as a function of torque and speed are uniformly distributed, both for the transport of timber and with no load. In both cases, the emission of the component increased with the increasing values of the analyzed operating parameters of the engine. The highest values of emission intensity were observed for the maximum engine load and speed (Figure 12). During the drive to the forest, the highest value of CO2 emission reached the level of approximately 51 g/s and fell in the range of speeds (1600 rpm; 1800 rpm> and torque (2400 Nm; 2800 Nm>. On the other hand, for the last stage of the study, i.e., the drive to the sawmill with the load, this value was recorded for the operating area described by the speeds (2200 rpm; 2400 rpm> and load (2400 Nm; 2800 Nm>. This value was approximately 5 g/s higher than for the run with the empty trailer.
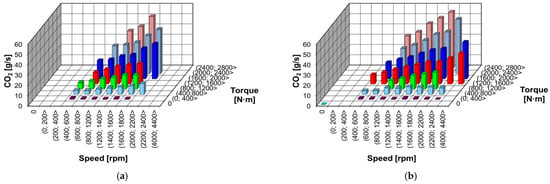
Figure 12.
CO2 emission for (a) the drive in the forest and (b) the drive to the sawmill as a function of engine speed and load.
Carbon monoxide emissions occurred over the entire torque and speed range, at which the vehicle operated while driving on unpaved roads. The highest intensity of the CO emission was observed for the entire speed range and for the highest values of the engine load in the range (800 Nm; 1600 Nm>. It should be noted that the vehicle driving on unpaved roads operated mainly at lower loads in the range (0 Nm; 800 Nm>. The empty run as well as the run with the load were characterized by the highest emissions for the maximum torque values (1200 Nm; 1600 Nm>. In the case of the drive to the forest, the maximum share of the emission intensity of 8.2 mg/s increased when the speed fell in the interval (800 rpm; 1200 rpm). When accessing the paved road, the highest share of emission intensity (6.1 mg/s) occurred for the engine speed of (2200 rpm; 2400 rpm> (Figure 13).
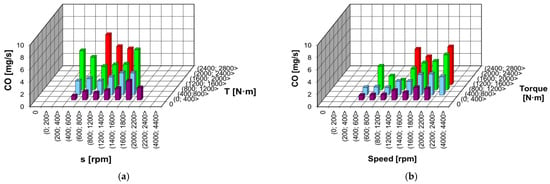
Figure 13.
CO emission for (a) unladen and (b) laden truck drive on the unpaved road as a function of engine speed and load.
Small emissions of nitrogen oxides, when driving unladen on the forest roads, occurred in every area of the engine operation. However, the share of the emission rate of the exhaust component is very negligible in these areas, averaging 0.0012 mg/s. These data confirm very good performance of the catalytic reduction system. On the other hand, the characteristics of NOx emission intensity for driving on unpaved roads is much more diversified and unevenly distributed. In this case, the highest values were observed for the medium and heavy engine loads (400 Nm; 1600 Nm> and the whole range of the recorded engine speeds (i.e., from 400 rpm to 2400 rpm). The highest value of the nitrogen oxide emission intensity fell in the area defined by the intervals (2200 rpm; 2400 rpm> and (800 Nm; 1200 Nm> (Figure 14).
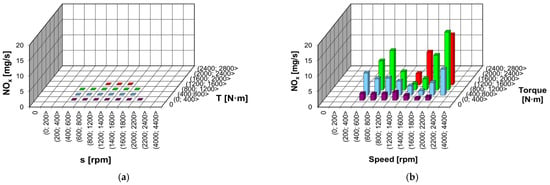
Figure 14.
NOx emission for (a) unladen and (b) laden truck drive on the unpaved road as a function of engine speed and load.
The characteristics of the hydrocarbon emission intensity as a function of torque and speed, for both runs, showed an increase in the emission intensity with the engine load. In the case of the arrival at the depot, areas with increased hydrocarbon emissions were observed for the torque of (800 Nm; 1600 Nm> and the entire range of engine speeds. The highest proportion of the THC emission occurred for the area defined by the speed in the range (1200 rpm; 2400 rpm> and torque ranging from 1200 Nm to 1600 Nm. It is noteworthy that the distribution of the THC emission for the loaded run is similar to that of carbon monoxide. These characteristics show an increase in the emission intensity as both speed and torque increase. The highest emission intensity for this stage of the test occurred for the largest range of speeds and torques (800 Nm; 1200 Nm> (Figure 15).
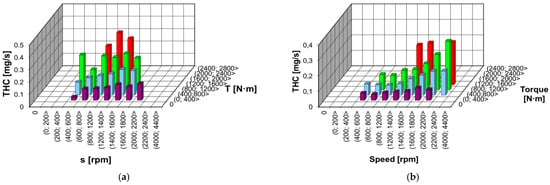
Figure 15.
THC emission intensity for (a) unladen and (b) laden truck driving on the unpaved road as a function of engine speed and load.
The close dependence of the emission of carbon dioxide on the engine operating parameters is confirmed by the intensity characteristics as a function of torque and speed shown in Figure 16. For the observed areas of engine operation, in this part of the research test, the CO2 emissions increase with speed and load. When accessing the forestry depot, the highest emission intensity (23 g/s) was observed for the engine operating area defined by the speed in the range of (1400 rpm; 1600 rpm> and torque ranging from 1200 Nm to 1600 Nm. When carrying timber, the highest emission intensity occurred for the same engine load and speed in the range (2200 rpm; 2400 rpm>. It was 8% higher than the highest value recorded for the drive without load.
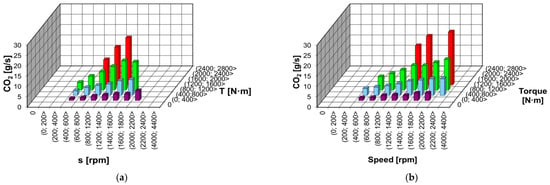
Figure 16.
CO2 emission for (a) unladen and (b) laden truck driving on the unpaved road as a function of engine speed and load.
The emission of carbon monoxide during the handling stage occurred for the entire area of the engine operation. It is characterized by an uneven distribution of the emission intensities. For the loading work, it can be observed that the intensity values were close to each other in each operating range. However, for the unloading work, significant intensity values occurred for the load in the range (400 Nm; 1200 Nm> and engine speed of (600 rpm; 1400 rpm>. High intensities were also observed for the point described by the intervals (800 rpm; 1400 rpm> and (0 Nm; 400 Nm>. During unloading, higher carbon monoxide emission values were observed at each operating point. The maximum intensity value during timber unloading was 10% higher than the maximum recorded for the loading work (Figure 17).
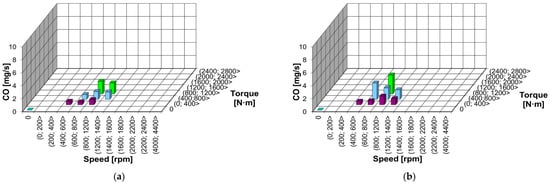
Figure 17.
CO emission during timber (a) loading and (b) unloading as a function of engine speed and load.
The highest intensity of the NOx emissions during the loading work occurred for the operating point where the speed was between 1200 rpm and 1400 rpm and the load fell in the (800 Nm; 1200 Nm> range. This was the area of the engine operation responsible for significant NOx emissions in this part of the study. When analyzing the characteristics related to the unloading of timber, it can be seen that there are increased emissions in other areas of operation. It can also be seen that for loads in the range of <0 Nm; 800 Nm> there was an increase in the emission intensity with the increasing speed. In this part of the research test, the highest intensity was observed for the point (1200 rpm; 1400 rpm> and (400 Nm; 800 Nm> (Figure 18).
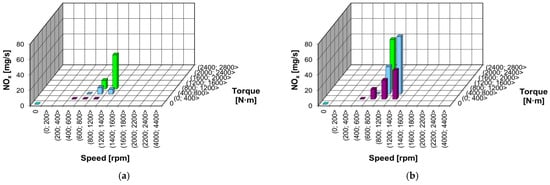
Figure 18.
NOx emission during (a) loading and (b) unloading as a function of engine speed and load.
The intensity characteristics of the hydrocarbon emissions during loading, spread out in a relatively uniform manner. The emissions occurred for every engine operating point that was observed at this stage of the study. It can also be seen that the emission intensity values increase with the increasing engine load. The highest intensity occurred for two engine operating points and was approximately 0.12 mg/s. In the mentioned areas, the torque was (800 Nm; 1200 Nm> and the engine speed was in the ranges: (800 rpm; 1200 rpm>, (1200 rpm; 1400 rpm>. For the discharge characteristics, the highest emission intensity occurred for the same engine load and speed of (800 rpm; 1200 rpm>. It was approximately 17% higher compared to the maximum obtained during the loading work (Figure 19).
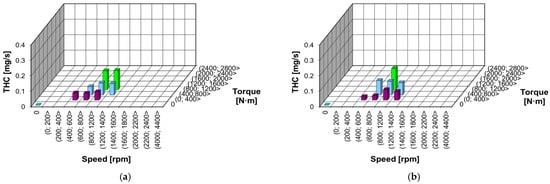
Figure 19.
THC emission intensity during (a) loading and (b) unloading as a function of engine speed and load.
The emission intensity characteristics as a function of load and speed are also very similar. As the torque increases, the carbon dioxide intensity values increase, which is a consequence of higher fuel consumption. In both cases, the highest intensity was observed for the maximum load recorded in the test in the range (800 Nm; 1200 Nm>. For the loading work, the area with the highest emission occurred for (1200 rpm; 1400 rpm>. For unloading, this point occurred when the engine operated at a speed of (800 rpm; 1200 rpm> (Figure 20).
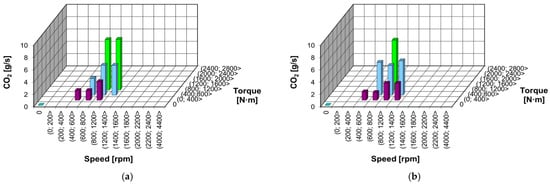
Figure 20.
CO2 emission during (a) loading and (b) unloading as a function of engine speed and load.
3.2. Research Results Obtained from Vehicle B
High emission of carbon dioxide also occurs at high values of acceleration. As it increases, the intensity of emission of carbon dioxide increases. This is directly related to the amount of fuel delivered to the combustion chamber. In order to increase the vehicle speed, it is necessary to deliver more diesel fuel to the cylinder, which results in increased emission. The average second-by-second emission of CO2 was 13.39 g/s. During the test, for every kilometer driven, approximately 1014 g of this exhaust component were released into the atmosphere. During the test, the values of the basic parameters of the truck engine operation were also recorded, which made it possible to present the emissions of individual exhaust components as a function of the engine speed and torque. Thanks to this, it is possible to formulate conclusions and emission correlations with the nature of the engine operation. The emission of each of the analysed gaseous compounds takes place for the entire range of engine loads and speeds from the interval (400 rpm; 2200 rpm>. In the case of CO2, particular intensity of its emission to the atmosphere can be observed for a high engine load of 1200 Nm to 2800 Nm and a speed in the range of (800 rpm; 1800 rpm>. The highest value of carbon dioxide emission intensity was approximately 39 g/s at speed (1200 rpm; 1400 rpm> and torque (2400 Nm; 2800 Nm>. In the case of engine loads from 0 Nm to 1200 Nm, the CO2 emission is not particularly intense. The highest CO2 emission in the range (1200 rpm; 1400 rpm> and torque (800 Nm; 1200 Nm>) is approximately 35% of the maximum emission that occurred in the entire test (Figure 21).
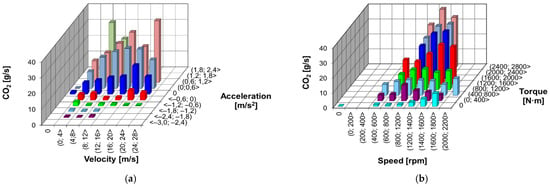
Figure 21.
Correlation of the CO2 emission intensity against (a) vehicle acceleration, speed and (b) engine speed, torque.
When analyzing the characteristics of the CO emission depending on the engine operating parameters, it can be observed that a significant role in the intensity of this emission is played by the engine speeds in the range of (600 rpm; 1600 rpm>. The highest carbon monoxide emission intensities occur for the maximum engine load and are 127.3 mg/s (at speed of (800 rpm; 1200 rpm>) and 194.1 mg (for speed of (1200 rpm; 1400 rpm>), respectively. The values of the CO emissions for lower engine loads (below 2000 Nm) are several times lower than in the case of emissions occurring for the maximum torque. For example, the emission of this component for the loads (2400 Nm; 2800 Nm> in the engine speed range (800 rpm; 1200 rpm> is over 3 times higher than for the loads in the range (2000 Nm; 2400 Nm>. For the engine speeds (1200 rpm; 1400 rpm>, the ratio is the same. Only for the engine speeds in the range (1400 rpm; 1600 rpm) the difference between the intensities is much lower–the emission at the maximum load is only 1.5–times greater than the emission for the engine loads ((2000 Nm; 2400 Nm>). When analyzing the NOx emission characteristics, it can be seen that for high engine loads, the intensity grows with the increasing engine speed. For smaller torque ranges and low speeds, the intensity is characterized by fluctuations and no clear increasing trend. The maximum emission of this component takes place for the engine speeds in the range from 1200 rpm and engine loads exceeding 1600 Nm. For the test run of the heavy-duty vehicle carrying a load of two tons, the highest NOx emission intensity of more than 389 mg/s occurred at the engine speeds in the range (1600 rpm; 1800 rpm> and torque in the range (1200 Nm; 1600 Nm>. Analyzing the characteristics of the hydrocarbon emission intensity, it can be observed that a significant THC emission during the test run occurred when the engine speed was in the range (800 rpm; 1600 rpm> and the engine load was (1600 Nm; 2800 Nm>. The highest hydrocarbon emission intensity was over 78 mg/s and occurred for the speeds of (1400 rpm; 1600 rpm> and the highest range of engine loads. In comparison, the lowest recorded THC intensity (13.3 mg/s) occurred when the engine was not under load and the engine speed was in the range of (400 rpm; 600 rpm> (Figure 22). When comparing the obtained relationships with research results presented in other publications, certain similarities can be observed. Very similar CO2 emission characteristics are presented in [37], confirming the close relationship of carbon dioxide emissions to engine load and speed, as well as to vehicle acceleration. The same publication also presents irregular carbon monoxide and nitrogen oxide emission characteristics, with emissions increasing with engine speed and load.
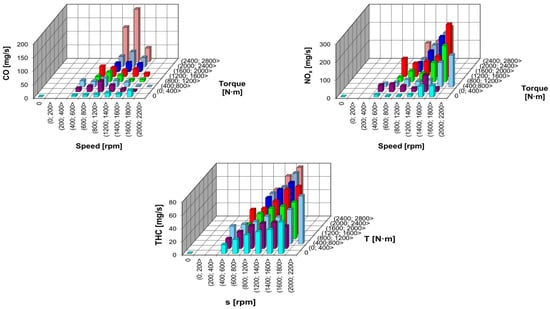
Figure 22.
Relation of the CO, NOx, THC emission intensity to the speed and torque of the truck under research.
Moreover, the analysis of the second-by-second fuel consumption was carried out for individual trips. The use of the Carbon Balance method made it possible to determine the exact values of the said parameter. Comparing the trips of vehicle A with and without cargo, it can be observed that the values obtained are higher for the laden truck. This is due to the fact that the vehicle was loaded with more than 25,000 kg. When vehicle A and vehicle B are compared the values also differ. This was influenced by the type of ground, on which the vehicle drove, because it had a significant impact on the fuel consumption. The same conclusion was reached by the authors of the publication [23], who directly concluded that the type of road on which a vehicle transporting wood moves influences emissions and fuel consumption. Technical aspects also had a significant impact. For example, test vehicle A was equipped with 3 driven axles, while test vehicle B had only one driven axle. Among other things, such a solution reduces the fuel consumption, besides, in vehicle B it is not necessary to use more axles or a different transmission with different ratios. An analysis of the timber transport cycle based on studies using PEMS apparatus showed that the average fuel consumption per 100 km was less than 50 dm3. The publication [36] presents a study of, among other things, fuel consumption, which was based on data obtained from the fleet management equipment with which the study sites were equipped. The authors of the publication estimated that, in the case of their study, the heavy vehicle consumed 0.77 dm3/km in the timber transport cycle. Transporting 24 800 kg of steel lumber exclusively on paved roads resulted in a fuel consumption of approximately 39 dm3/100 km. The amount of fuel consumption is mainly influenced by the speed of the vehicle, as shown in [37]. In the studies presented, a heavy-duty vehicle complying with the EEV standard achieved a fuel consumption of just under 30 dm3/km. As the authors point out, this level is due to the low speed and the high proportion of stops in road congestion. On the other hand, in the publication [38], the authors, based on their analysis, confirmed that the overall reduction of fuel consumption in the transportation process is significantly affected by the use of long and heavy vehicles. In the tests described in this paper, the passage of the test object was smooth and characterized by a low number of stops and stops. Comparing the fuel consumption of both vehicles, the previously mentioned relationships can be observed (Figure 23). The fuel consumption of vehicle A is 1.25 times higher compared to vehicle B, which is evident from the previous statements made in the conclusions.
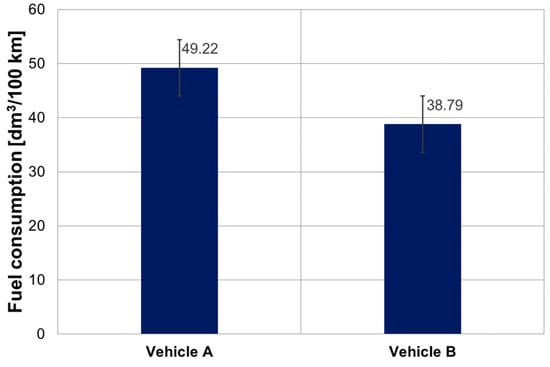
Figure 23.
Fuel consumption of Vehicle A and Vehicle B with load.
The obtained results made it possible to analyze the road exhaust emissions from vehicle A carrying load to the sawmill and from vehicle B (Figure 24). Additionally, the specific emissions for both research objects are also presented (Figure 25). As it may be observed, the differences in the emissions of individual exhaust components are significant and result from the fact that the first vehicle was EURO VI and the second one was EURO V compliant. Vehicle A, despite operating under much more difficult and varied conditions, owes such low emissions to its advanced exhaust aftertreatment system. In addition, tests of heavy-duty vehicles using PEMS equipment under state-of-the-art road conditions are quite common [39]. In the publication [37] the on-road emissions of an HDV driven over an 11-kilometre test route comprising urban and extra-urban traffic were approximately 1 g/km for CO, 6.4 for NOx, respectively. The differences between the emissions reported in the quoted article and those of vehicle B in this publication are due to a number of factors. First of all, the vehicles covered different distances under significantly different road conditions. More importantly, however, vehicle B met the newer emission standard, which contributed to the reduction in emissions. The publication [4] presents an emissions study of, among others, 5 HDVs meeting the Euro VI standard. In the study, in which the route complied with RDE requirements and included urban, extra-urban and motorway phases, the on-road emissions of the vehicles tested were: CO 0.75–1.02 g/kWh, NOx 0.09–0.78 g/kWh, THC 0.07–0.011 g/kWh. It can therefore be seen that these results are similar to the emissions obtained for vehicle A described in the paper, which met the same emission standard

Figure 24.
Road emission of vehicle A and vehicle B.

Figure 25.
Specific emission of vehicle A and vehicle B.
To complete the analysis, the authors also decided to relate the obtained exhaust emission results to the haulage work performed by the test objects. The transport work in the test trials was 1300 tkm for vehicle A and 669.9 tkm for vehicle B. Both vehicles carried a load of similar weight. However, the different route lengths meant that the work performed by the vehicle carrying timber was almost twice as much. The results obtained are shown in Figure 26. For vehicle A, transporting the load resulted in the CO emissions of 0.016 g/tkm, NOx–0.008 g/tkm and THC–0.001 g/tkm. The values obtained for vehicle B were higher by a factor of 5, 20 and 130, respectively. Such large differences are a direct result of the fact that the vehicle B performed less work. In addition, vehicle B had an older engine and a less advanced aftertreatment system, therefore, the emissions of individual exhaust components were significantly higher.

Figure 26.
Emission referred to the transport operation of the tested objects.
4. Conclusions
The conducted research allowed determining the emissions from heavy-duty vehicles of different applications. Each of the research objects was characterized by a different type of work performed. The first one was equipped with a crane for loading and unloading timber and the second one was used for long-distance road transport. The authors deliberately juxtaposed two vehicles of the same category, whose operating model differs significantly from each other, but which are homologated according to the same principles. Vehicle A is used on both paved and unpaved forest roads, where conditions can be extremely unfavourable. Vehicle B, on the other hand, represents a group of trucks used exclusively for road transport. Although the vehicles comply with different Euro standards and have different exhaust after-treatment systems, the characteristics presented in this study confirm the close dependence of the emissions of the analysed harmful compounds on the parameters of the power unit and the driving parameters. It is worth mentioning here that, as in the case of vehicle A, the method of operation is not fully taken into account in the harmful compound emission measurement procedure. This is particularly important, for example, due to the fact that increasingly stringent EURO emissions standards are being introduced, which, as mentioned at the beginning, are driving manufacturers to use newer generations of existing after-treatment systems or alternative propulsion systems, such as those using fuels like CNG or LNG. Nevertheless, the compression-ignition engine is still the most important source of propulsion for heavy goods vehicles due to the existing infrastructure, lower costs and refuelling times.
Author Contributions
Conceptualization, A.Z., P.F., P.L., A.J. and M.B.; methodology, A.Z., P.F., P.L., A.J., W.K. and M.B.; software, A.Z., P.F., P.L. and W.K.; formal analysis, A.Z., P.F., A.J. and W.K.; writing, M.B., P.L., A.J. and A.Z.; writing—review and editing, A.Z. and A.J.; visualization, M.B.; supervision, A.Z., P.F., P.L. and W.K.; project administration, A.Z.; funding acquisition, P.F. All authors have read and agreed to the published version of the manuscript.
Funding
The study was founded by Poznan University of Technology, grant number 0415/SBAD/0326.
Institutional Review Board Statement
Not applicable.
Informed Consent Statement
Not applicable.
Data Availability Statement
Not applicable.
Conflicts of Interest
The authors declare no conflict of interest.
References
- Eurostat. Available online: ec.europa.eu/ (accessed on 11 April 2022).
- Bielaczyc, P.; Woodburn, J.; Joshi, A. World-wide trends in powertrain system development in light of emissions legislation, fuels, lubricants, and test methods. Combust. Engines 2021, 184, 57–71. [Google Scholar] [CrossRef]
- Available online: https://www.eea.europa.eu/data-and-maps/indicators/transport-final-energy-consumption-by-mode/assessment-10 (accessed on 5 August 2022).
- Grigoratos, T.; Fontaras, G.; Giechaskiel, B.; Zacharof, N. Real world emissions performance of heavy-duty Euro VI diesel vehicles. Atmos. Environ. 2019, 201, 348–359. [Google Scholar] [CrossRef]
- Pielecha, J. (Ed.) Badania Emisji Zanieczyszczeń Silników Spalinowych; Wydawnictwo Politechniki Poznańskiej: Poznań, Poland, 2017. [Google Scholar]
- Vierth, I.; Lindgren, S.; Lindgren, H. Vehicle Weight, Modal Split, and Emissions—An Ex-Post Analysis for Sweden. Sustainability 2018, 10, 1731. [Google Scholar] [CrossRef]
- Eickman, C.; Ratecki, A. Measuring CO2 emissions. TTS Tech. Transp. Szyn. 2003, 13, 44–48. [Google Scholar]
- Gis, W.; Gis, M.; Pielecha, J.; Skobiej, K. Alternative Exhaust Emission Factors from Vehicles in on-Road Driving Tests. Energies 2021, 14, 3487. [Google Scholar] [CrossRef]
- Cunanan, C.; Tran, M.-K.; Lee, Y.; Kwok, S.; Leung, V.; Fowler, M. A Review of Heavy-Duty Vehicle Powertrain Technologies: Diesel Engine Vehicles, Battery Electric Vehicles, and Hydrogen Fuel Cell Electric Vehicles. Clean Technol. 2021, 3, 474–489. [Google Scholar] [CrossRef]
- Rymaniak, Ł.; Kamińska, M.; Szymlet, N.; Grzeszczyk, R. Analysis of Harmful Exhaust Gas Concentrations in Cloud behind a Vehicle with a Spark Ignition Engine. Energies 2021, 14, 1769. [Google Scholar] [CrossRef]
- Jaworski, A.; Lejda, K.; Mądziel, M.; Ustrzycki, A. Assessment of the emission of harmful car exhaust components in real traffic conditions. IOP Conf. Ser. Mater. Sci. Eng. 2018, 421, 042031. [Google Scholar] [CrossRef]
- Rahman, S.M.A.; Fattah, I.M.R.; Ong, H.C.; Ashik, F.R.; Hassan, M.M.; Murshed, M.T.; Imran, M.A.; Rahman, M.H.; Rahman, M.A.; Hasan, M.A.M.; et al. State-of-the-Art of Establishing Test Procedures for Real Driving Gaseous Emissions from Light- and Heavy-Duty Vehicles. Energies 2021, 14, 4195. [Google Scholar] [CrossRef]
- Mei, H.; Wang, L.; Wang, M.; Zhu, R.; Wang, Y.; Li, Y.; Zhang, R.; Wang, B.; Bao, X. Characterization of Exhaust CO, HC and NOx Emissions from Light-Duty Vehicles under Real Driving Conditions. Atmosphere 2021, 12, 1125. [Google Scholar] [CrossRef]
- Giechaskiel, B.; Gioria, R.; Carriero, M.; Lähde, T.; Forloni, F.; Perujo, A.; Martini, G.; Bissi, L.M.; Terenghi, R. Emission Factors of a Euro VI Heavy-duty Diesel Refuse Collection Vehicle. Sustainability 2019, 11, 1067. [Google Scholar] [CrossRef]
- Quiros, D.C.; Thiruvengadam, A.; Pradhan, S.; Besch, M.; Thiruvengadam, P.; Demirgok, B.; Carder, D.; Oshinuga, A.; Huai, T.; Hu, S. Real-World Emissions from Modern Heavy-Duty Diesel, Natural Gas, and Hybrid Diesel Trucks Operating Along Major California Freight Corridors. Emiss. Control. Sci. Technol. 2016, 2, 156–172. [Google Scholar] [CrossRef]
- Gu, H.; Liu, S.; Wei, Y.; Liu, X.; Zhu, X.; Li, Z. Effects of Polyoxymethylene Dimethyl Ethers Addition in Diesel on Real Driving Emission and Fuel Consumption Characteristics of a CHINA VI Heavy-Duty Vehicle. Energies 2022, 15, 2379. [Google Scholar] [CrossRef]
- Mądziel, M.; Jaworski, A.; Kuszewski, H.; Woś, P.; Campisi, T.; Lew, K. The Development of CO2 Instantaneous Emission Model of Full Hybrid Vehicle with the Use of Machine Learning Techniques. Energies 2022, 15, 142. [Google Scholar] [CrossRef]
- Spoof-Tuomi, K.; Arvidsson, H.; Nilsson, O.; Niemi, S. Real-Driving Emissions of an Aging Biogas-Fueled City Bus. Clean Technol. 2022, 4, 954–971. [Google Scholar] [CrossRef]
- Lv, L.; Ge, Y.; Ji, Z.; Tan, J.; Wang, X.; Hao, L.; Wang, Z.; Zhang, M.; Wang, C.; Liu, H. Regulated emission characteristics of in-use LNG and diesel semi-trailer towing vehicles under real driving conditions using PEMS. J. Environ. Sci. 2020, 88, 155–164. [Google Scholar] [CrossRef]
- Jaworski, A.; Mądziel, M.; Kuszewski, H.; Lejda, K.; Balawender, K.; Jaremcio, M.; Jakubowski, M.; Wojewoda, P.; Lew, K.; Ustrzycki, A. Analysis of Cold Start Emission from Light Duty Vehicles Fueled with Gasoline and LPG for Selected Ambient Temperature; SAE Technical Paper 2020-01-2207; SAE International: Warrendale, PA, USA, 2020. [Google Scholar] [CrossRef]
- Li, P.; Lü, L. Evaluating the Real-World NOx Emission from a China VI Heavy-Duty Diesel Vehicle. Appl. Sci. 2021, 11, 1335. [Google Scholar] [CrossRef]
- Ko, S.; Park, J.; Kim, H.; Kang, G.; Lee, J.; Kim, J.; Lee, J. NOx Emissions from Euro 5 and Euro 6 Heavy-Duty Diesel Vehicles under Real Driving Conditions. Energies 2020, 13, 218. [Google Scholar] [CrossRef]
- Lijewski, P.; Merkisz, J.; Fuć, P.; Ziółkowski, A.; Rymaniak, L.; Kusiak, W. Fuel consumption and exhaust emissions in the process of mechanized timber extraction and transport. Eur. J. For. Res. 2017, 136, 153–160. [Google Scholar] [CrossRef]
- Bodisco, T.; Zare, A. Practicalities and Driving Dynamics of a Real Driving Emissions (RDE) Euro 6 Regulation Homologation Test. Energies 2019, 12, 2306. [Google Scholar] [CrossRef]
- Šarkan, B.; Jaśkiewicz, M.; Kubiak, P.; Tarnapowicz, D.; Loman, M. Exhaust Emissions Measurement of a Vehicle with Retrofitted LPG System. Energies 2022, 15, 1184. [Google Scholar] [CrossRef]
- Mendoza-Villafuerte, P.; Suarez-Bertoa, R.; Giechaskiel, B.; Riccobono, F.; Bulgheroni, C.; Astorga, C.; Perujo, A. NOx, NH3, N2O and PN real driving emissions from a Euro VI heavy-duty vehicle. Impact of regulatory on-road test conditions on emissions. Sci. Total Environ. 2017, 609, 546–555. [Google Scholar] [CrossRef]
- Lejda, K.; Jaworski, A.; Mądziel, M.; Balawender, K.; Ustrzycki, A.; Savostin-Kosiak, D. Assessment of Petrol and Natural Gas Vehicle Carbon Oxides Emissions in the Laboratory and On-Road Tests. Energies 2021, 14, 1631. [Google Scholar] [CrossRef]
- Warguła, Ł.; Kukla, M.; Lijewski, P.; Dobrzyński, M.; Markiewicz, F. Impact of Compressed Natural Gas (CNG) Fuel Systems in Small Engine Wood Chippers on Exhaust Emissions and Fuel Consumption. Energies 2020, 13, 6709. [Google Scholar] [CrossRef]
- Chen, J.; Li, Y.; Meng, Z.; Feng, X.; Wang, J.; Zhou, H.; Li, J.; Shi, J.; Chen, Q.; Shi, H.; et al. Study on Emission Characteristics and Emission Reduction Effect for Construction Machinery under Actual Operating Conditions Using a Portable Emission Measurement System (Pems). Int. J. Environ. Res. Public Health 2022, 19, 9546. [Google Scholar] [CrossRef]
- Ziółkowski, A.; Fuć, P.; Jagielski, A.; Bednarek, M. Analysis of emissions and fuel consumption from forklifts by location of operation. Combust. Engines 2021, 189, 30–35. [Google Scholar] [CrossRef]
- Rymaniak, Ł.; Ziolkowski, A.; Gallas, D. Particle number and particulate mass emissions of heavy duty vehicles in real operating conditions. MATEC Web Conf. 2017, 118, 00025. [Google Scholar] [CrossRef]
- Fuć, P.; Merkisz, J.; Ziłkowski, A. Impact of masses load for CO2, NOx emission and fuel consumption heavy duty vehicles a total mass exceeding about 12, 000 kg. Adv. Sci. Technol. Res. J. 2012, 15, 41–53. [Google Scholar]
- Pang, K.; Zhang, K.; Ma, S. Tailpipe emission characterizations of diesel-fueled forklifts under real-world operations using a portable emission measurement system. J. Environ. Sci. 2021, 100, 34–42. [Google Scholar] [CrossRef]
- Fuć, P.; Lijewski, P.; Kurczewski, P.; Ziołkowski, A.; Dobrzyński, M. The analysis of fuel consumption and exhaust emissions from forklifts fueled by diesel fuel and liquefied petroleum gas (LPG) obtained under real driving conditions. In Proceedings of the International Mechanical Engineering Congress & Exposition IMECE 2017, Tampa, FL, USA, 3–9 November 2017. [Google Scholar]
- Merkisz, J.; Fuć, P.; Lijewski, P.; Ziółkowski, A.; Rymaniak, Ł. The research of exhaust emissions and fuel consumption from HHD engines under actual traffic conditions. Combust. Engines 2014, 158, 56–63. [Google Scholar] [CrossRef]
- Holzleitner, F.; Kanzian, C.; Stampfer, K. Analyzing time and fuel consumption in road transport of round wood with an onboard fleet manager. Eur. J. For. Res. 2011, 130, 293–301. [Google Scholar] [CrossRef]
- Merkisz, J.; Kozak, M.; Molik, P.; Nijak, D.; Andrzejewski, M.; Nowak, M.; Rymaniak, Ł.; Ziółkowski, A. The analysis of the emission level from a heavy-duty truck in city traffic. Combust. Engines 2012, 150, 80–88. [Google Scholar] [CrossRef]
- Liimatainen, H.; Greening, P.; Dadhich, P.; Keyes, A. Possible Impact of Long and Heavy Vehicles in the United Kingdom—A Commodity Level Approach. Sustainability 2018, 10, 2754. [Google Scholar] [CrossRef]
- Merkisz, J.; Pielecha, I. Alternatywne Napędy Pojazdów; Wydawnictwo Politechniki Poznańskiej: Poznań, Poland, 2006. [Google Scholar]
Publisher’s Note: MDPI stays neutral with regard to jurisdictional claims in published maps and institutional affiliations. |
© 2022 by the authors. Licensee MDPI, Basel, Switzerland. This article is an open access article distributed under the terms and conditions of the Creative Commons Attribution (CC BY) license (https://creativecommons.org/licenses/by/4.0/).