1. Context and Introduction
1.1. Context
The decarbonisation of energy is the main priority in Europe. At least 40% cuts in greenhouse gas emissions and a 32% share for renewable energy are to be achieved by 2030. However, 65% of Europe’s current energy demand is still met by natural gas, coal, and other fossil fuels.
Beyond the challenges related to hydrogen production in large quantities, it is essential to ensure the safety of hydrogen underground storage, which will be used to guarantee the continuity of services, i.e., as a buffer energy storage in support of intermittent renewable energy sources. Geological hydrogen storage, based on the example of natural gas (by providing seasonal capacity), can be a crucial solution to foster the decarbonisation of energy by making renewable hydrogen available at any time for mobility, industry, and household heating uses.
Several studies have benchmarked underground storage types based on their characteristics. Salt cavern storage has been recognised as the best suited technology to meet challenges to the new European energy system. Salt caverns created by solution mining offer the advantage of being virtually impermeable to gases and are currently the only structures used massively to store hydrogen underground.
In recent decades, underground hydrogen storage salt caverns have emerged and are already in operation in the UK and the USA, as listed below.
In Teesside in the UK, three salt caverns, each with geometrical volumes of 70,000 m3, have been in operation for about 50 years. Each salt cavern can store 1 million Nm3 of almost pure hydrogen (95% H2 and 3–4% CO2). These salt caverns are located at an average depth of 370 m.
In Clemens Dome, Lake Jackson in Texas, Conoco Philips has stored 30.2 Mm3 of hydrogen from synthesis gas (95% hydrogen), in an 850 m deep salt cavern, since 1986. The salt cavern has a geometric volume of 580,000 m3 and is operated between 70–135 bar with a minimum calorific value of 92 MWh.
In Moss Bluff, Liberty County, Texas, Praxair has stored 70.8 Mm3 of industrial hydrogen, in a salt cavern, since 2007. The cavern has a geometric volume of 566,000 m3 and is often operated between 76 and 134 bar with a minimum calorific value of 80 GWh.
In Spindletop Dome, in Beaumont, Texas, Air Liquide commissioned, in 2017, the world’s largest underground hydrogen storage facility. The salt cavern has a geometric volume of 906,000 m3 and is operated between 68 and 202 bar. The salt cavern is located at a depth of 1500 m, with a diameter of about 70 m.
These storage facilities have demonstrated the feasibility of storing hydrogen in salt caverns (see
Table 1).
1.2. Introduction
Several studies are underway around the world on underground hydrogen gas storage. For example, the European HyPSTER project (2021–2023) aims to demonstrate the feasibility of operating underground hydrogen storage in salt caverns on an industrial scale. In this context, a pilot site is planned in France at Bresse-Vallons (Ain) in the currently brine-filled EZ53 cavern leached out in 1982 and considered to be one of the most studied salt caverns in France.
In this paper, we focus on the blowout modelling of a hydrogen storage cavern. A blowout accident is one of the most significant accidents feared in such an industrial site [
2]. However, a small number of blowouts from gas storage caverns (generally speaking) have been reported in the literature, for example, in Moss Bluff, Texas and Fort Saskatchewan, Alberta, Canada (see [
3,
4,
5]). In fact, during the Moss Bluff accident [
6], gas flow lasted several days before the cavern emptied. The accident was analysed by [
7] using the LOCAS software [
8]. Gas outflow rate and duration were computed [
9]. Cavern gas experiences a fast temperature drop, and tensile thermal stresses appear at the cavern walls; fractures can be generated [
10]. In Europe, where implementing a subsurface safety valve (SSSV) is mandatory in all gas storage caverns, the probability of such an incident is divided by several orders of magnitude.
A critical aspect of blowout modelling is the ability to accurately predict the mass flow rate of gas through a wellhead by simulating a turbulent Fanno-type flow or choked flow, an option that does not appear to be available in most of the software used in the industry to predict a blowout. Bérest et al. [
11] provided a simplified method for the computation of blowout duration and change of gas temperature and pressure in a cavern and the well. The thermodynamic model of a cavern has correctly explained the evolution of cavern-gas temperature during a (controlled) gas withdrawal; the duration of the Moss Bluff blowout has been precisely back-calculated; and the computed air velocities have been shown to be compatible with the ballistic flight of bricks observed during the Kanopolis blowout, as proven by [
12]. This method was implemented in the LOCAS software to allow fully coupled (thermo-hydro-mechanical) numerical computations of the underground part of a blowout scenario in gaseous salt caverns (e.g., hydrogen, compressed air, and natural gas). The first part of this paper presents the result of blowout numerical computations on a salt cavern selected for a hydrogen storage pilot.
As a significant accidental scenario, the consequences of a blowout from a hydrogen storage cavern are assessed in the second part of this paper. Standard models for gas dispersion are used with reasonably safe hypotheses on the source terms (dimension of the breach, initial pressure, and available gas volume) and the jet orientation (vertical). For the numerical description of a blowout scenario, a set of 2D simulations is developed to predict the main characteristics of the combustible cloud formed during the dispersion process. Then, the atmospheric hydrogen dispersion is considered for assessing thermal and overpressure effects with complementary computational tools.
2. Description of the EZ53 Salt Cavern
2.1. History of the Cavern
The underground level of the Etrez site has two saliferous groups: one called “upper salt” (located at a depth between 700 m and 1100 m) and the other called “lower salt” (located at a depth between 1150 m and 1800 m). Cavern EZ53 was solution-mined from the “upper salt”.
The EZ53 well was drilled from 25 May 1981 to 18 June 1981. The cavern was leached from 19 March to 23 April 1982. Its leaching has not been completed, mainly for strategic choices and economic reasons (to promote the development of deeper layers). Cavern EZ53, therefore, has always been filled with brine and has been used for scientific in situ measurements and tests:
As a result, there is very good knowledge about the coupled thermo-hydromechanics behaviour of the EZ53 cavern.
2.2. Well and Cavern Geometry
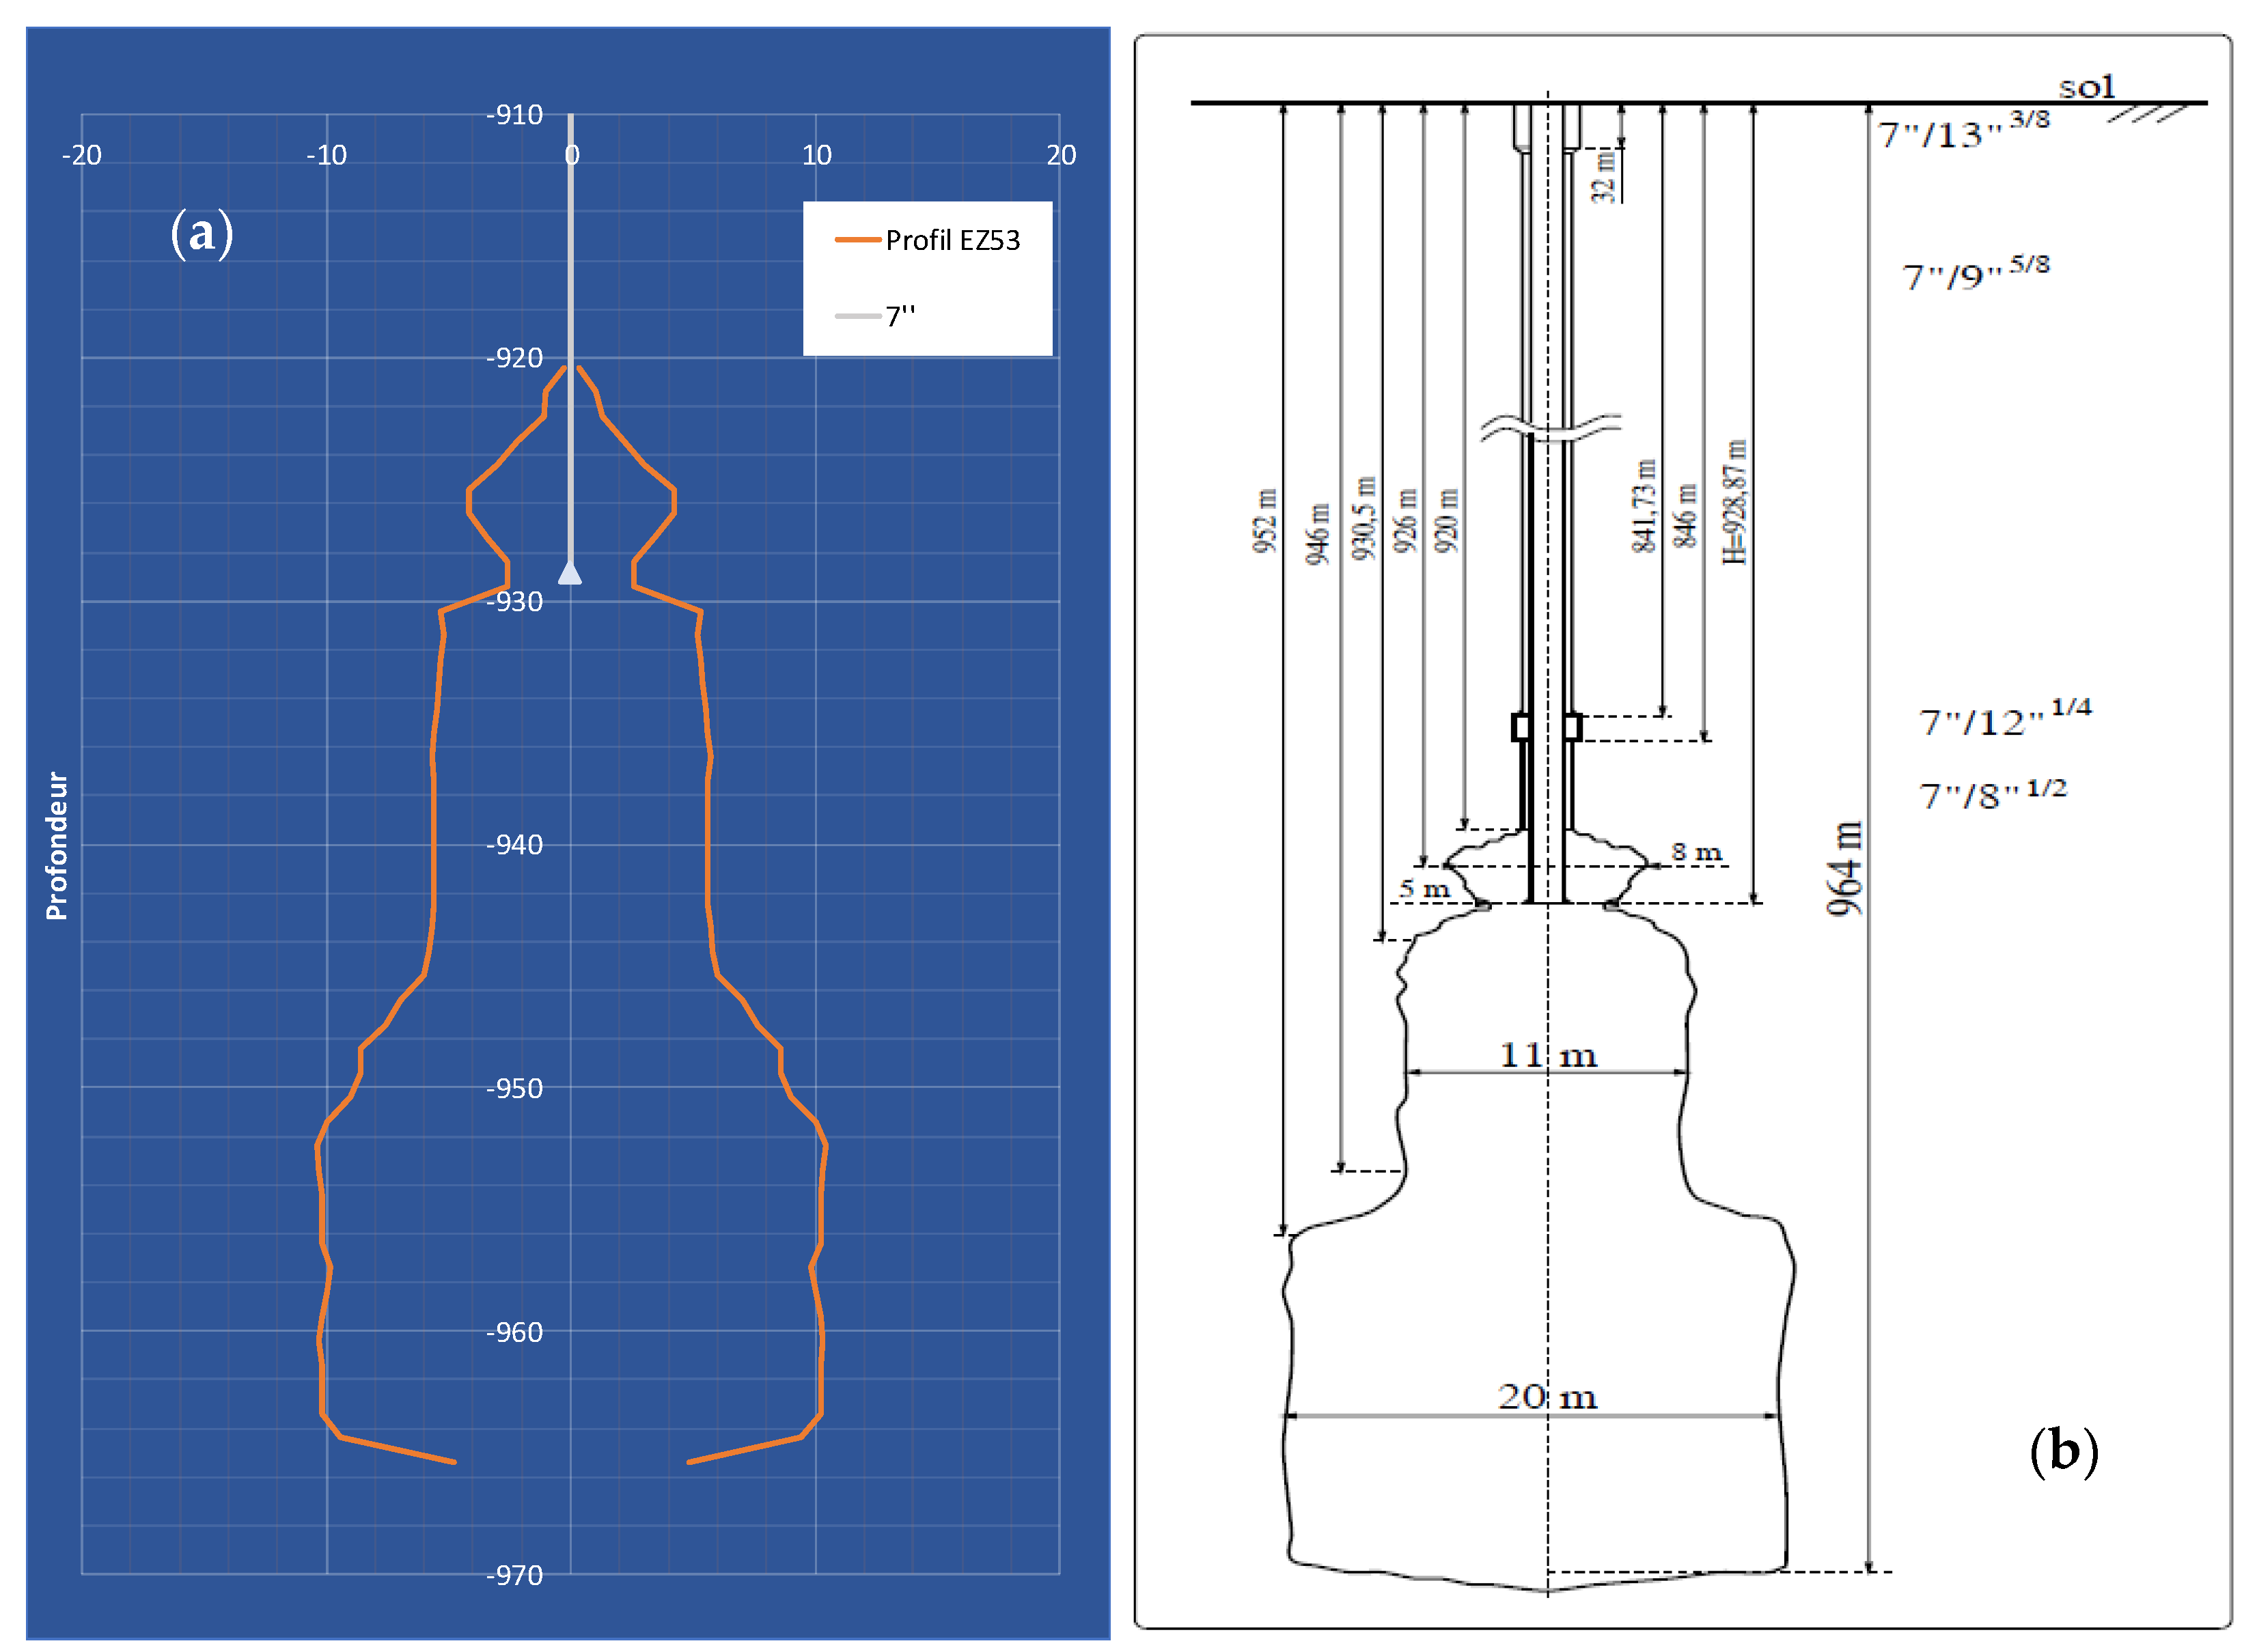
The EZ53 well has the following main components (see
Figure 1b):
A surface casing with a diameter of 133/8″ (0.34 m) anchored at 448.6 m and widened to 185/8″ (0.47 m) at a depth of 40.3 m. This casing is cemented to the surface.
A production casing (PC) with a diameter of 95/8″ (0.24 m) anchored at 841.73 m and widening to 133/8″ (0.34 m) at a depth of 31.80 m. This casing is also cemented to the surface.
An open section drilled at a diameter of 121/4″ (0.31 m) between the shoe of the production casing at a depth of 846 m, and then extended with an 81/2″ (0.22) diameter to 1042 m.
Then, we can determine:
The roof of the cavern at a depth of 920 m;
A narrowing (gully) at a depth of about 930 m;
The bottom of the cavern at 964 m.
Due to premature termination of leaching, the EZ53 salt cavern has a small volume of ~8000 m
3 at the end of leaching, for a free volume of 7390 m
3 measured during the last sonar survey performed in 1985 (
Figure 1a). The shape of the cavern is axisymmetric but irregular (
Figure 1a). There is a tightening (gully) at a 930 m depth (more precisely, between 928.4 m and 929.4 m), resulting from an insoluble layer. The cavern widens at its base to reach a maximum diameter of 20 m. The depth usually used in mechanical calculations to calculate the pressure at the cavern middle is 950 m.
The upper part of the cavern, located above the gully, represents a volume of approximately 200 m3 (more precisely, between 207 m3 and 228 m3, depending on whether the top or the bottom of the gully is taken as a reference). This upper part of the cavern will be filled with hydrogen during the tests.
The height of the chimney of salt cavern EZ53 is 78.67 m. The salt thickness between the top of the upper salt and the top of the EZ53 salt cavern is 236.4 m.
The case modelled in this paper represents the worst-case scenario of a blowout with the EZ53 salt cavern totally filled with hydrogen. This case does not correspond to the experimental configuration foreseen in the HyPSTER project, where the EZ53 salt cavern will not be totally filled with hydrogen. Thus, the consequences (and the release duration) do not correspond to the experimental condition of the HyPSTER project.
Table 2 provides the properties of the EZ53 salt cavern, to be used for blowout numerical computations.
3. Underground Blowout Prediction Model
Bérest’s model integrates the thermodynamics of gas in a well-cavern system to predict the values of the main parameters during a blowout from an underground gas storage cavern. Only major assumptions and simplifications of the model are provided in this section. More details can be found in [
9,
11].
3.1. Hydrogen Thermodynamics Properties
The hydrogen properties used in this paper are presented in
Table 3 (pressure and temperature are 10
5 Pa and 298.15 K, respectively). Normal conditions m
3(n) or Nm
3 are defined as follows: 0 °C = 32 °F and 1 atm = 1.01325 bar (
Table 4).
3.2. Thermodynamic Behaviour of Cavern Gas
Gas behaviour in the cavern and the gas behaviour in the wellbore are coupled through the boundary conditions at entry from the cavern to the well. The thermodynamic behaviour of hydrogen exhibits some specific features of interest (in particular, an isenthalpic depressurisation can lead to hydrogen warming); therefore, instead of the standard state equation of an ideal gas, a van der Waals state equation was selected to describe gas behaviour during the blowout, and . (P, T, and v are gas pressure, temperature and specific volume, respectively; h = e + Pv is the gas enthalpy). However, the ideal gas state equation could be used for methane or compressed air.
During gas withdrawal, the energy balance equation in the cavern can be written as , where is the mass of gas in the cavern, is the internal energy of the gas, and is the heat flux transferred from the rock mass to the cavern gas through the cavern wall. In addition, cavern volume is constant, . From thermodynamics, Blowout from a gas cavern is a rapid process, completed within a week or less. During such a short period, temperature changes are not given enough time to penetrate deep into the rock mass; from the perspective of thermal conduction, cavern walls can be considered to be the sum of small flat surfaces whose area equals the actual area of the cavern, .
When a varying temperature,
is applied on the surface, the heat flux per surface unit can be expressed as
, where
and
are the thermal conductivity and diffusivity of salt, respectively. When these simplifications are accepted, the heat balance equation during gas withdrawal can be written as:
This equation allows computing in the cavern when mass evolution is known.
3.3. Thermodynamic Behaviour of Gas in the Wellbore
The gas rate in the borehole, , typically is hundreds of meters per second (more when hydrogen is considered). This means that only a few seconds are needed for gas to travel from the cavern top to ground level. Such a short period is insufficient for cavern pressure to experience significant changes, and a steady state can be assumed at each instant. (Obviously, when more extended periods are considered, cavern pressure slowly decreases.) Duct diameter, , is supposed to be constant throughout the well; hence, the cross-sectional area of the well is also constant. The gas mass flow rate is Enthalpy is such that (Bernoulli). The momentum equation can be written as . Head losses per unit length are described by . During the blowout, the gas flow is turbulent. The effects of friction are confined to a thin boundary layer at the steel casing wall. The average gas velocity is uniform through any cross-sectional area (except, of course, in the boundary layer). For simplicity, head losses are written , where is the friction coefficient and f is the friction factor. The Colebrook equation is used, , where ε is the well roughness (typically, ).
Gas pressure and temperature (hence, gas specific volume) at the lower end of the string are known from the computation of cavern-gas thermodynamic behaviour. In principle, the gas pressure at the wellhead should be atmospheric. However, when the gas flow rate is very high, such an assumption leads to a solution such that gas flow is supersonic in the upper part of the well, which is incompatible with the second principle of thermodynamics (
). (No shock can exist inside the wellbore.) In such a case, it is assumed that the flow rate is sonic at the wellhead (“choked flow”),
. No constraint is applied to the wellhead gas pressure, which generally is larger than atmospheric pressure. Conversely, when the gas flow rate is relatively low, the gas flow is said to be normal, and the gas pressure is atmospheric at ground level. These assumptions (constituting the Fanno flow model) are standard [
20] and commonly accepted [
21].
Note that heat transfer from the rock mass to the wellbore or from the brine sump to the cavern gas body is neglected. In the computations, gravity forces (
g) are ignored. This model was tested against the Moss Bluff historical case with good results [
7], where blowout duration has been predicted correctly.
The thermodynamic model of gas flow in the well has the following limitations:
The simplified Colebrook equation roughly estimates the head losses. Indeed, the friction coefficient F is a function of the flow velocity, mainly when it is low.
The van der Waals equation of state can be, in some cases, insufficient for an accurate description of the behaviour of hydrogen, and the mass heat Cv is a function of the temperature.
At the end of the blowout, the gas flows are low, and the simplifications considered do not apply anymore. A detailed study of the effects observed at the end of an eruption could be complex but not without interest.
4. Results of the Computation of the Subterraneous Evolution of the Blowout
This section details the evolution of the thermodynamic parameters that characterise gas flow from the EZ53 salt cavern to the surface (ground level).
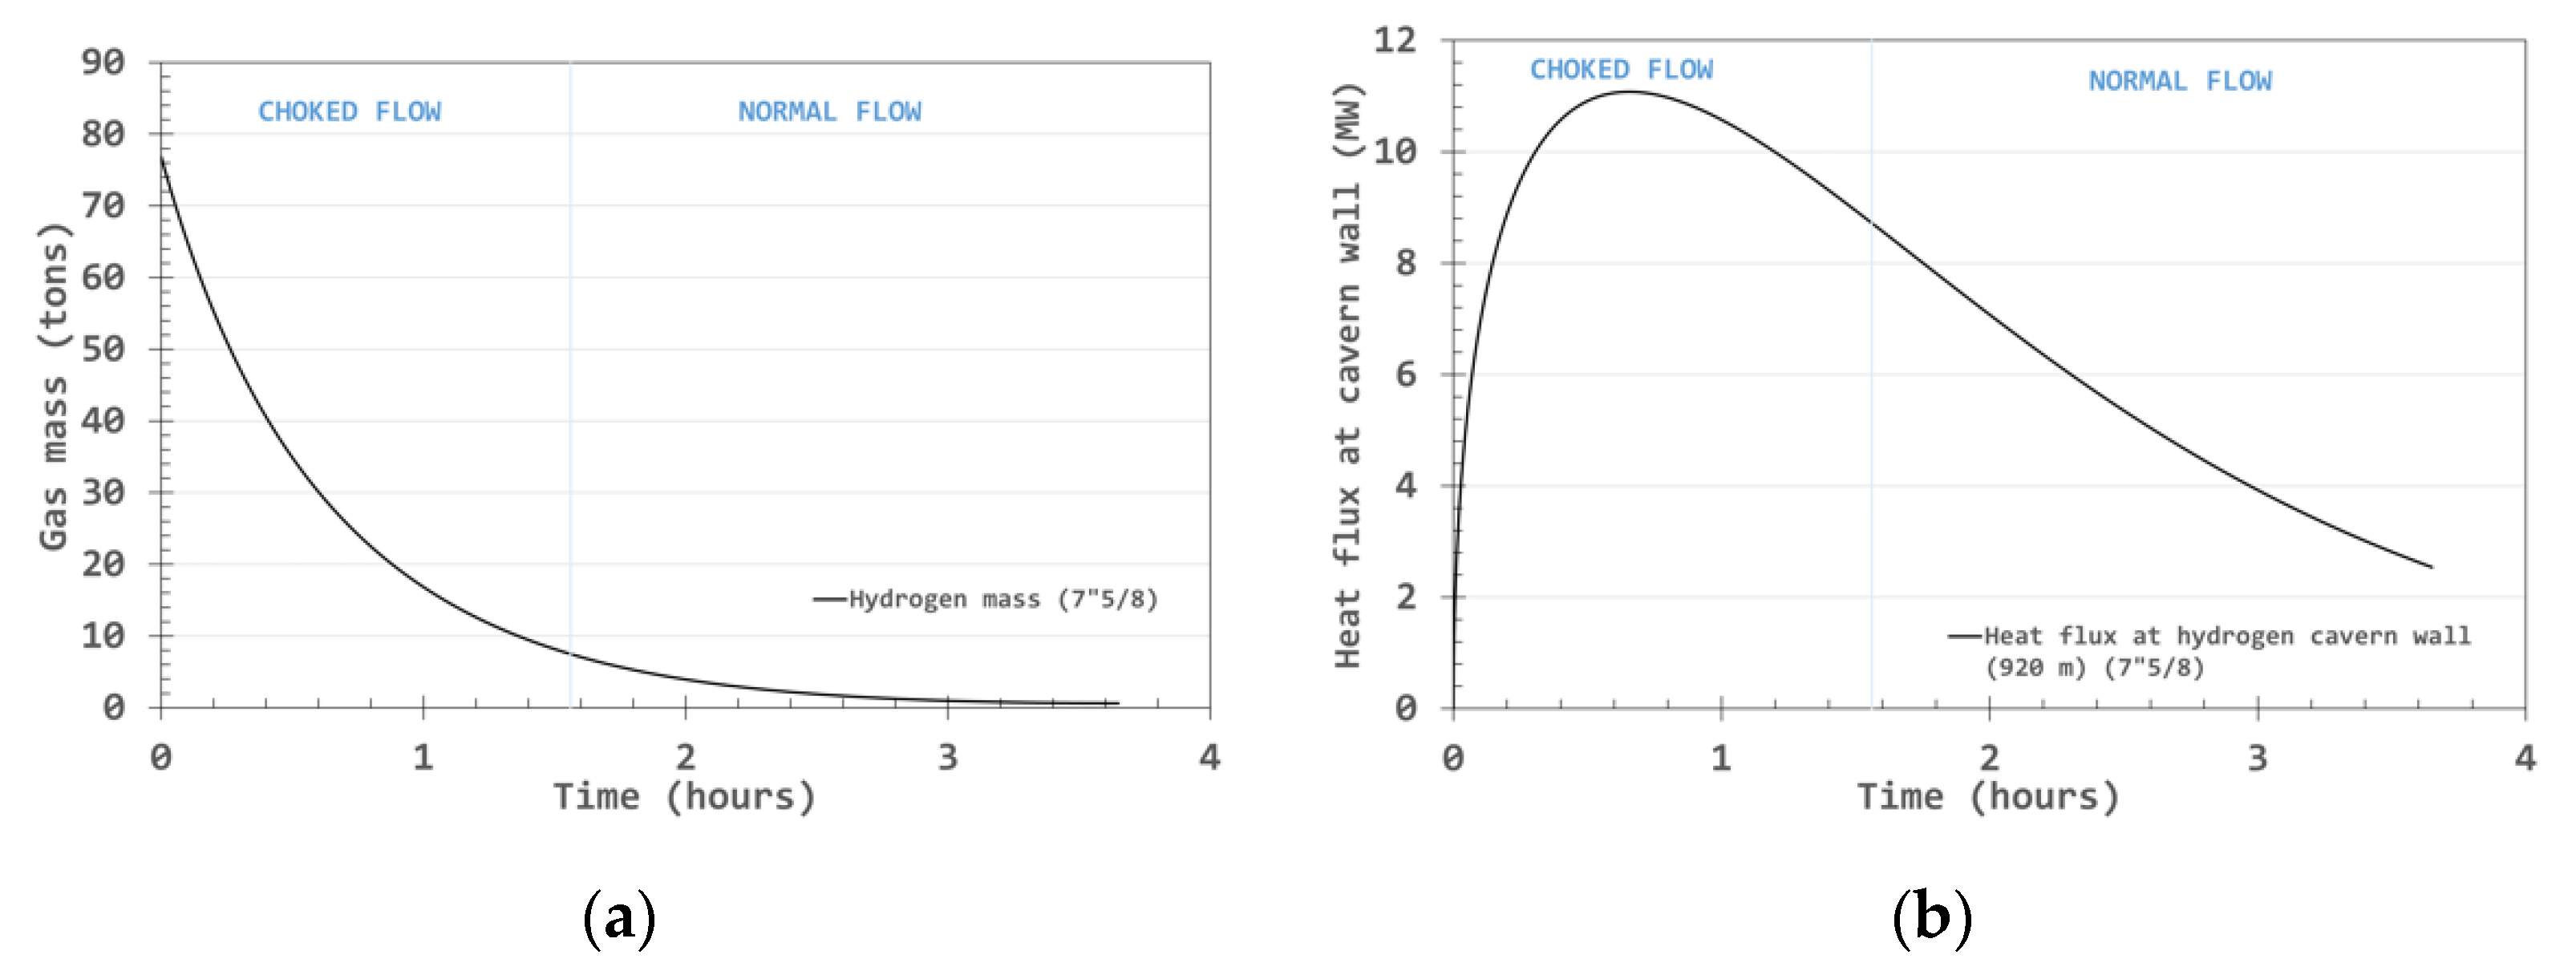
Figure 2 shows the evolution of the hydrogen mass as a function of time during the blowout. The hydrogen mass in the cavern decreases smoothly. The heat flux provided by the rock mass is exceptionally high after 45 min (11 MW, see
Figure 2b).
The blowout lasts approximately 3.65 h in the EZ53 salt cavern. Hydrogen flow is choked (gas velocity is sonic at the wellhead) during the first 1.56 h and normal during the second half of the blowout.
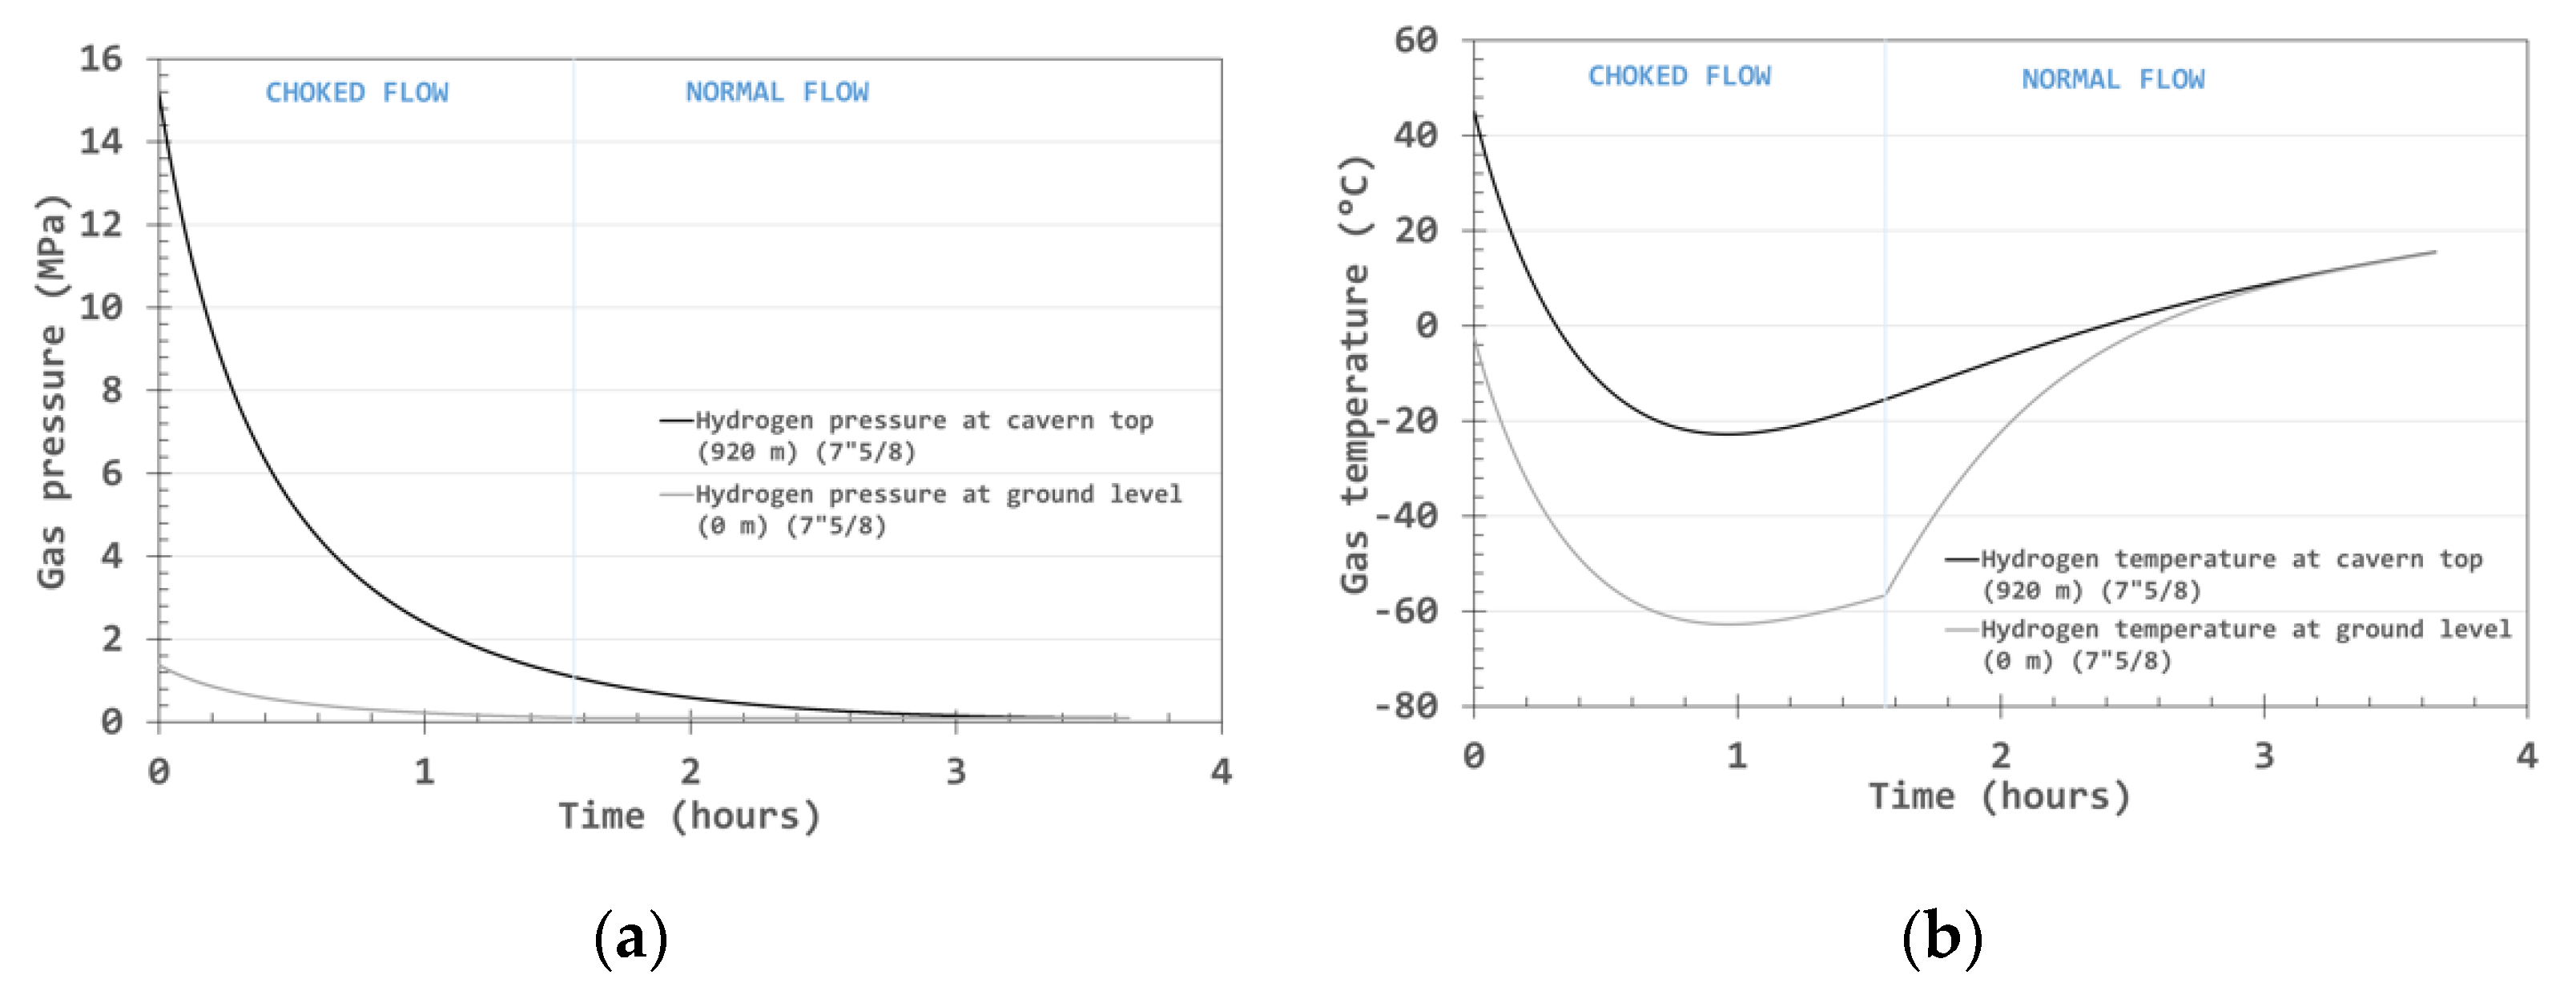
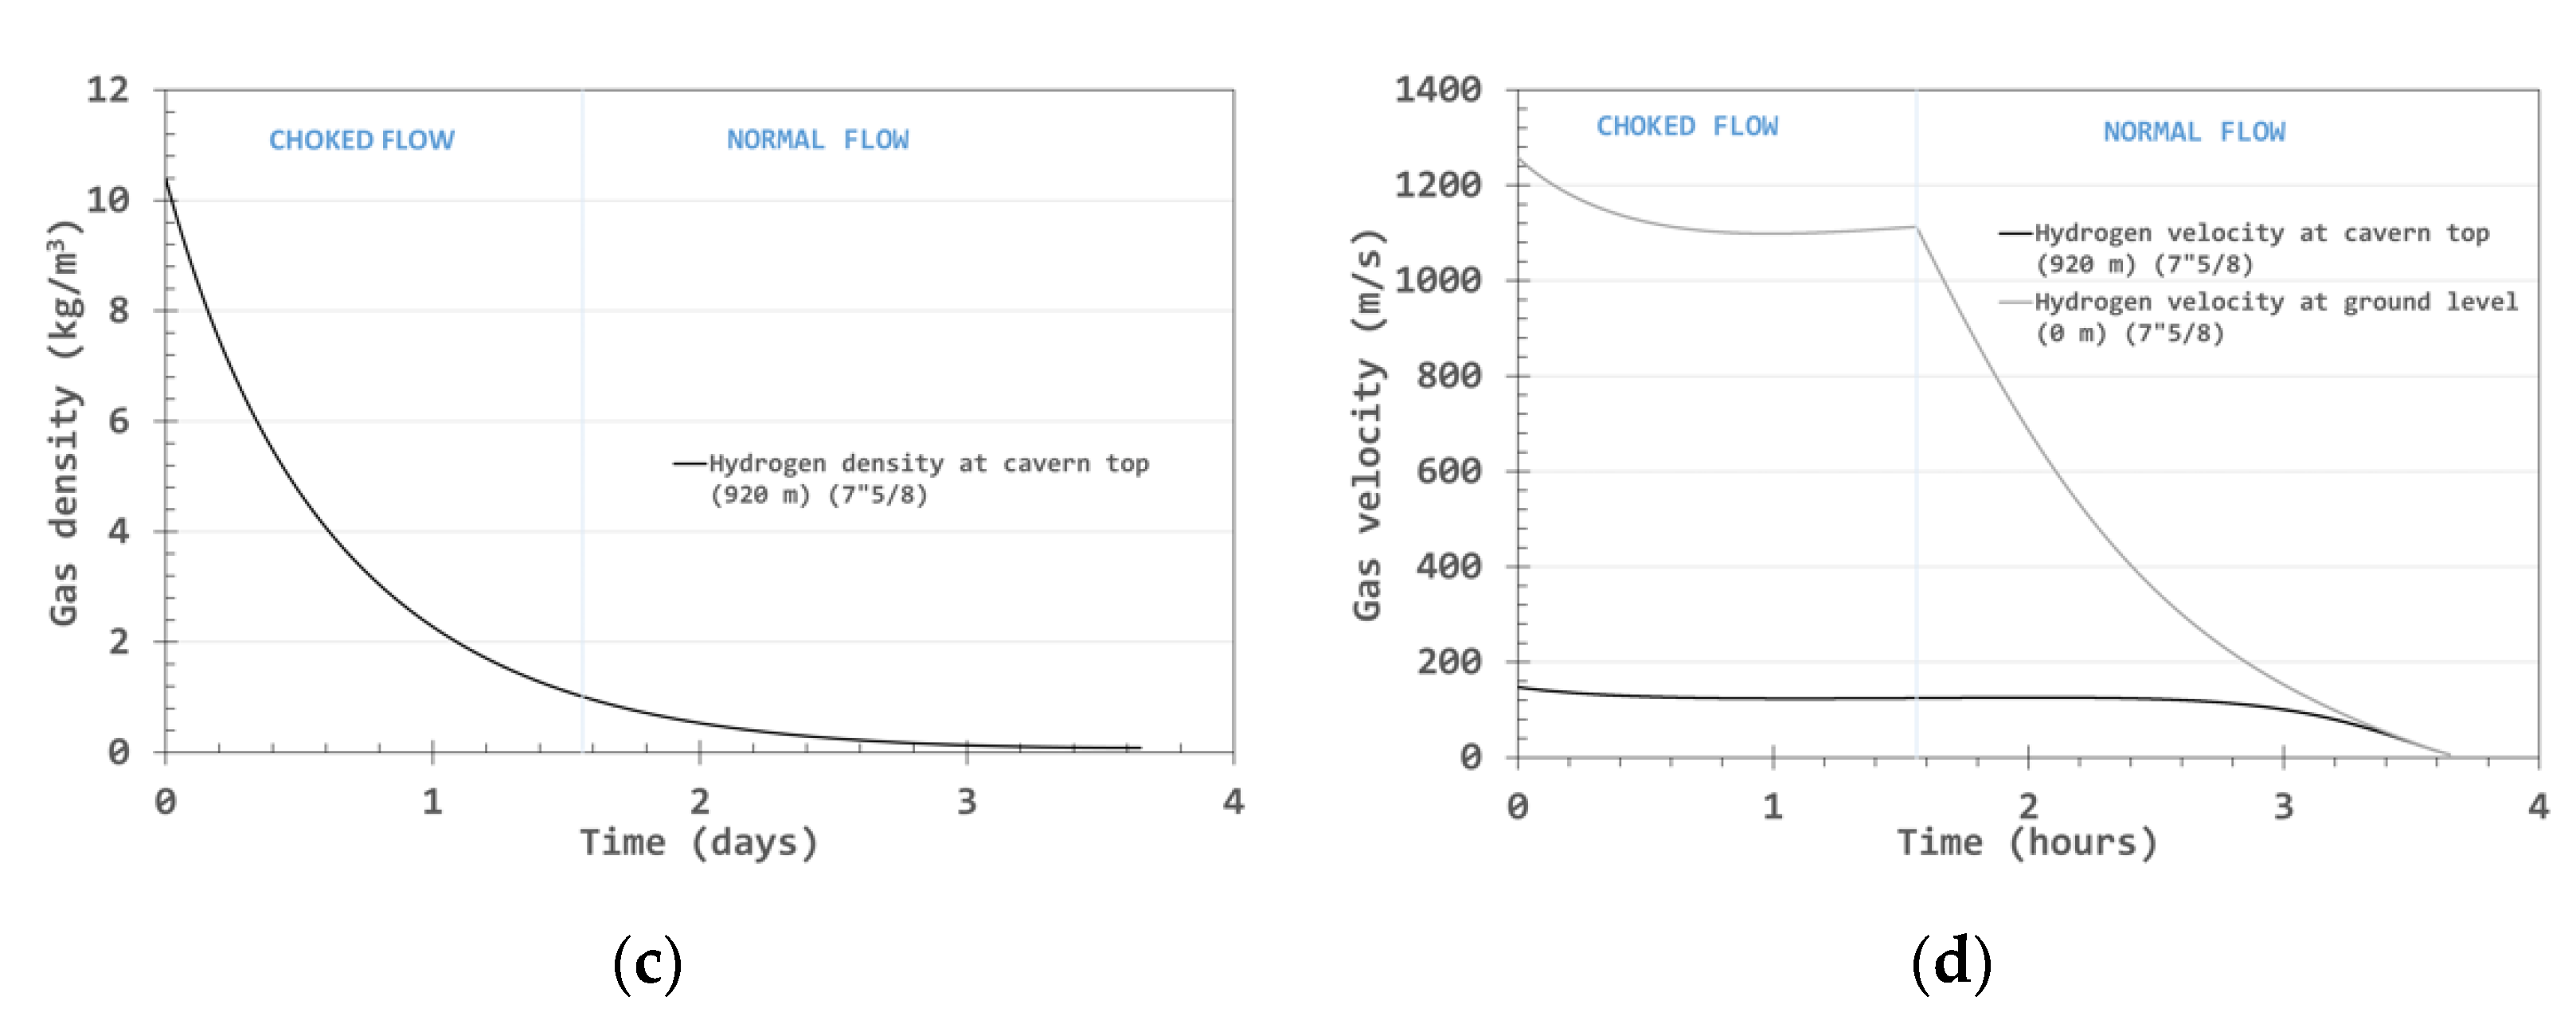
Figure 3 successively displays: (a) hydrogen pressure in the cavern and ground level, (b) hydrogen temperature in the cavern and outlet temperature, (c) hydrogen density at cavern top and ground level, and (d) hydrogen velocity at cavern top and ground level.
Hydrogen pressure in the cavern is 15.2 MPa when the blowout starts and drops to 0.1 MPa after 3.65 h (
Figure 3a). Gas depressurisation in the well is intense, and wellhead pressure is slight even during the choked part of the blowout. Later, during the normal flow, the cavern gas pressure becomes much smaller, resulting in slower velocities and normal flow.
The most critical parameter is hydrogen temperature (
Figure 3b). In the EZ53 salt cavern, it plummets from 45 °C to −22.8 °C, a temperature reached after nearly 1 h. Heat flux at this time is very large (see that hydrogen warms again to reach 15 °C in the cavern at the end of the blowout). Except at the end of the blowout, the gas temperature at ground level is much colder than the cavern temperature.
Hydrogen velocity is high (
Figure 3d); it equals the speed of sound at ground level, where the flow is choked. Sound celerity in hydrogen (more than 1200 m/s) is much faster than in air or natural gas. Gas velocities drastically decrease when the flow regime changes from choked flow to normal flow.
The “end” of the blowout is a problematic notion to establish. The thermal equilibrium between cavern gas and rock mass ideally should be reached. After choked flow ends, the cavern gas slowly warms, resulting in a low gas-outflow rate of approximately 6 m/s; the pressure difference between the cavern and ground level is no longer the driving force for the gas flow.
Figure 4 shows the distribution of hydrogen pressure (a) and hydrogen temperature (b) as a function of depth at the beginning of the blowout (
t = 0). The distribution of the temperature through the well from the cavern top to ground level (
Figure 4b) highlights the significance of the Joule–Thompson effect (see
Section 3.1)). Indeed, when the velocities at the base of the well are low, enthalpy remains almost constant, and hydrogen temperature increases when gas rises in the well—an effect that is not captured when the gas state equation is ideal.
A summary of the rsults of the blowout analysis on the EZ53 salt cavern is provided in
Table 5. These results from the EZ53 salt cavern are exploited in the second part of this paper to model the aerial part of the blowout.
5. Modelling the Aerial Part of the Blowout
The loss of containment generated at the surface level by a blowout in the EZ53 salt cavern results in atmospheric dispersion of hydrogen. The assessment of potential consequences of this hazardous event is evaluated through a computational study of the associated blowout scenario. This analysis aims to predict the concentration profiles generated by the atmospheric gas dispersion and also the thermal and overpressure effects caused by an ignition of the resulting combustible cloud.
For the numerical description of a blowout scenario, a set of integral-based simulations is developed to predict the main characteristics of the combustible cloud induced by the dispersion process. Then, the atmospheric hydrogen dispersion is considered for estimating thermal and overpressure effects with complementary computational tools.
5.1. Atmospheric Hydrogen Dispersion
The atmospheric dispersion of hydrogen was predicted by considering a vertical jet according to the underground blowout prediction model (the temperature, velocity, and mass flow rate profiles).
5.1.1. Unified Dispersion Model (UDM)
The Unified Dispersion Model (UDM) was developed by [
22] to characterise a cloud dispersion produced by a ground-level or elevated two-phase unpressurised or pressurised release. This model’s current version (UDM 3) includes possible plume lift-off, where a grounded cloud becomes buoyant and rises into the air. Increasing clouds may be constrained to the mixing layer. This allows assessment of the local concentrations of a dispersed gas or vapour after a continuous, instantaneous, constant finite duration or general time-varying release.
The updated Unified Dispersion Model (UDM 3) is currently implemented in the DNV software application PHAST 8.21. This atmospheric dispersion code has a lower level of complexity than CFD tools, but it can provide more accurate results than approaches based only on Gaussian models. For this reason, it is widely considered for risk assessments.
The numerical scheme of the UDM 3 is based on a parametrical solution of the fluid mechanic equations. For this purpose, four modules are available to describe the following scenarios of pollutant dispersion:
High-pressure releases in which the dispersion is controlled mainly by the kinetic energy of the mixture;
Dispersions dominated by both the kinetic energy of the release and gravity effects;
Dispersions of high-density substances;
Highly diluted dispersions in which a Gaussian model can be applied due to the neutral buoyancy of the mixture at ambient conditions.
Additionally, the UDM 3 calculates the phase distribution and cloud temperature using either a non-equilibrium thermodynamics model or a non-reactive equilibrium model. These aspects consider droplet rainout, pool spreading, and re-evaporation [
23].
The UDM 3 describes the general behaviour of a pollutant dispersion at a low computational cost. For this purpose, some environmental assumptions are considered to represent the scenario. For instance, the terrain is flat and has a uniform roughness (no obstacles). Moreover, the simulation code assumes that the atmospheric conditions are invariable throughout the discharge. Due to these assumptions, the computational model of this study is not adapted for the description of turbulence or vortical structures formed within the cloud. In the same manner, this numerical approach is not suitable for studies of the influence of significant obstacles located in the vicinity of the cavern’s outlet. For this type of analysis, other methods based on tridimensional models are recommended [
24]. However, implementing these tools has considerably increased the demand for computational resources.
Furthermore, a set of ordinary differential equations is integrated into the model for the description of the following dispersion phenomena:
Conservation of mass (air entrainment and water added from substrate);
Conservation of momentum;
Relation between cloud speed and cloud position;
Heat transfer relation;
Water vapor transfer relation;
Crosswind spreading.
5.1.2. Atmospheric Conditions
Following the French ministerial circular/directive of 10 May 2010 [
25], this modelling of vertical and high hydrogen releases is carried out for Pasquill’s atmospheric conditions A3, B3, B5, C5, C10, D5, D10, E3, and F3. As a reminder, the Pasquill classification considers two parameters for the atmosphere definition. The letter specifies the atmospheric stability (from A (very unstable) to F (very stable)), and the number determines the wind speed (m/s) at a reference height of 10 m. The values of temperature, humidity, and solar radiation, fixed for each condition, are specified, as presented in
Table 6.
5.2. Hazardous Events Generated by the Hydrogen Combustion
The flammability range of hydrogen (a volumetric gas-to-air ratio between 4% and 75%) is wide. In addition, the minimum ignition energy of this mixture is low (0.02 mJ for a stoichiometric mixture as compared with 0.29 mJ for methane). These properties imply a higher probability of inflammation of a dispersed cloud of this gas than other combustible gases. In addition, these events can result in significant affectation levels due to considerable thermal effects or high overpressures on the general public and nearby structures. The hazardous phenomena that might occur due to hydrogen containment loss are associated mainly with the ignition of the dispersing flammable cloud:
Flash fire (with thermal effects);
Unconfined vapour cloud explosion (with overpressure effects);
Jet fire (with thermal effects).
5.2.1. Flash Fire
This phenomenon is generated by igniting a combustible gas/air mixture at locations distant from the source. The event is developed as the flame front burns through the premixed vapour cloud and expands its volume. The cloud expansion can push vapours ahead, enlarging the visible flame and a burn back to the source, becoming a jet fire. The effects produced by this event are relatively short-term thermal hazards. Nonetheless, negligible overpressures (blast waves) can be evidenced as well.
The results of the hydrogen dispersion model determine the distance of effects of a flash fire according to the criteria established by the French circular of 10 May 2010 [
25]:
Significant lethal effects = distance to the lower flammability limit (LFL);
Lethal effects = distance to the LFL;
Irreversible effects = 1.1 × distance to the LFL.
5.2.2. Unconfined Vapour Cloud Explosion (UVCE)
This phenomenon is generated when the ignition of a flammable gas/air mixture leads to significant overpressure levels. The scenarios described in this paper evaluate the effects caused by potential deflagrations generated by the cloud’s ignition. Conversely, detonations are considered because the concentration profiles in an atmospheric dispersion are characterised by fluctuations that prevent the propagation of a possibly initiated explosion [
26].
The consequences of a UVCE are more or less important depending on whether there is total or partial confinement of the gas/air mixture and variations of the turbulence intensity in the environment.
The evaluation of the effects of the explosion of an UVCE formed by hydrogen release is carried out according to the multi-energy method. This method considers a sequential procedure to evaluate the overpressure levels of a UVCE. Firstly, the results obtained with the dispersion model establish the maximal extent of the flammable cloud in the environment. Then, the concentration profiles of the combustible cloud are used to determine the volumes of the fuel-air mixture in the area considered to be a blasting source. Subsequently, the volume of the equivalent fuel-air charge allows the calculation of the combustion energy released by the UVCE [
27]. Finally, a set of empirical equations associate the amount of released energy with the overpressure levels reached by the blast. However, the volume of the fuel-air mixture in the blast zone is calculated by considering the concentration profiles for evaluating the effect of flash fire.
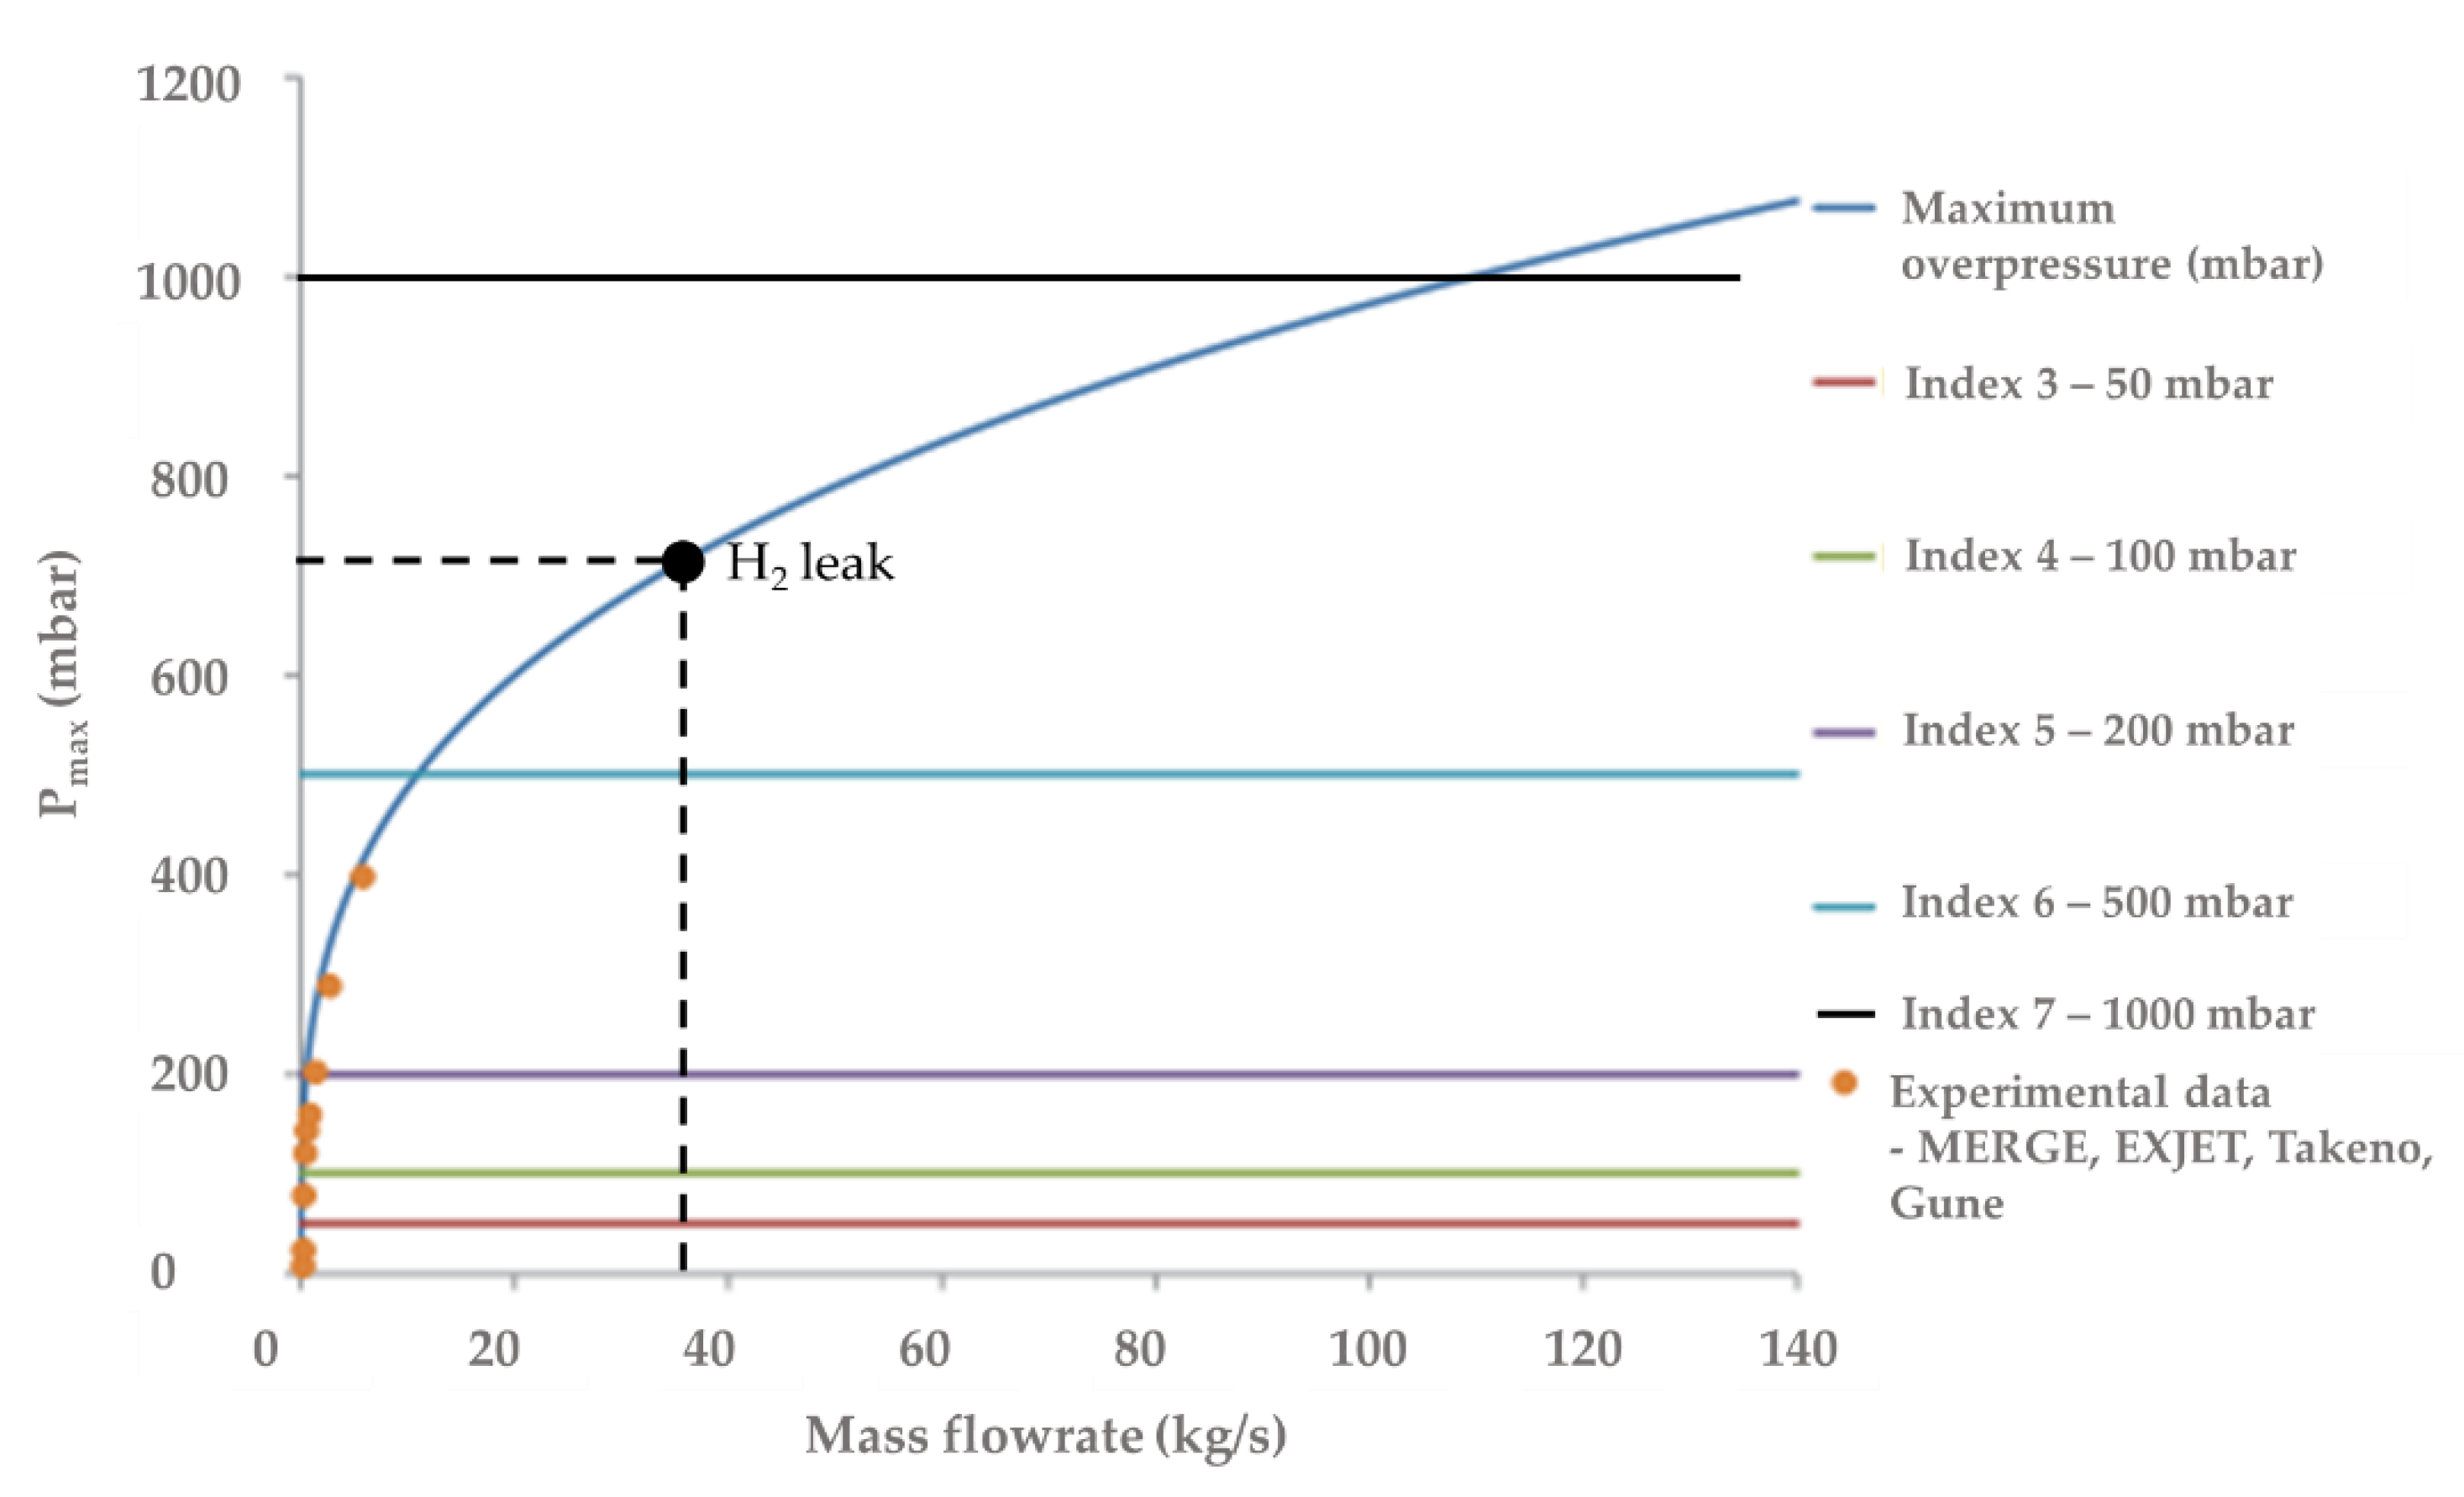
Estimating the overpressure levels depends on the assignment of the initial strength of the blast. This definition is considered by using the multi-energy method to determine the maximum overpressure. For this purpose, a severity index is selected for the cloud explosion by considering aspects such as the local confinement and the reactivity of the combustible gas. A number denotes this severity index within the 1–10 range, where one applies to an explosion of little strength and 10 applies to a detonation [
28]. The determination of this parameter can be performed according to different approaches based on experimental evidence [
27]. For this study, Ineris established the severity index of a hydrogen explosion by considering the tests carried out for the technical report Ω-UVCE (Ineris, 2016). The elaboration of this document considered a set of experiments carried out by Ineris in an open environment without obstacles to evaluate the maximum overpressure levels reached by jets of different combustible gases. The results obtained in that study allowed the determination of a correlation between the maximum blast pressure and the gas flow rate.
The distances of effects are determined with the multi-energy method module of the computational tool EPHEDRA, developed by Ineris. For this purpose, the following threshold values are considered:
Significant lethal and domino effects = maximum distance with an overpressure equal to or greater than 200 mbar;
Lethal effects = maximum distance with an overpressure between 140 and 200 mbar;
Irreversible effects = maximum distance with an overpressure between 50 mbar and 140 mbar.
5.2.3. Jet Fire
A jet flame occurs following the ignition of a flammable fluid issuing from a pipe or orifice. In this hazardous event, the fluid burns near the release plane. Through radiation and convection, it dissipates heat, which could be dangerous to life and property apart from the visible boundaries of the flame.
The DNV software application PHAST 8.21 has implemented various models to evaluate the effects of jet fires generated by gas/vapour releases. In this study, the physical description of vertical and inclined flames is carried out according to the Chamberlain model, representing them as solid bodies.
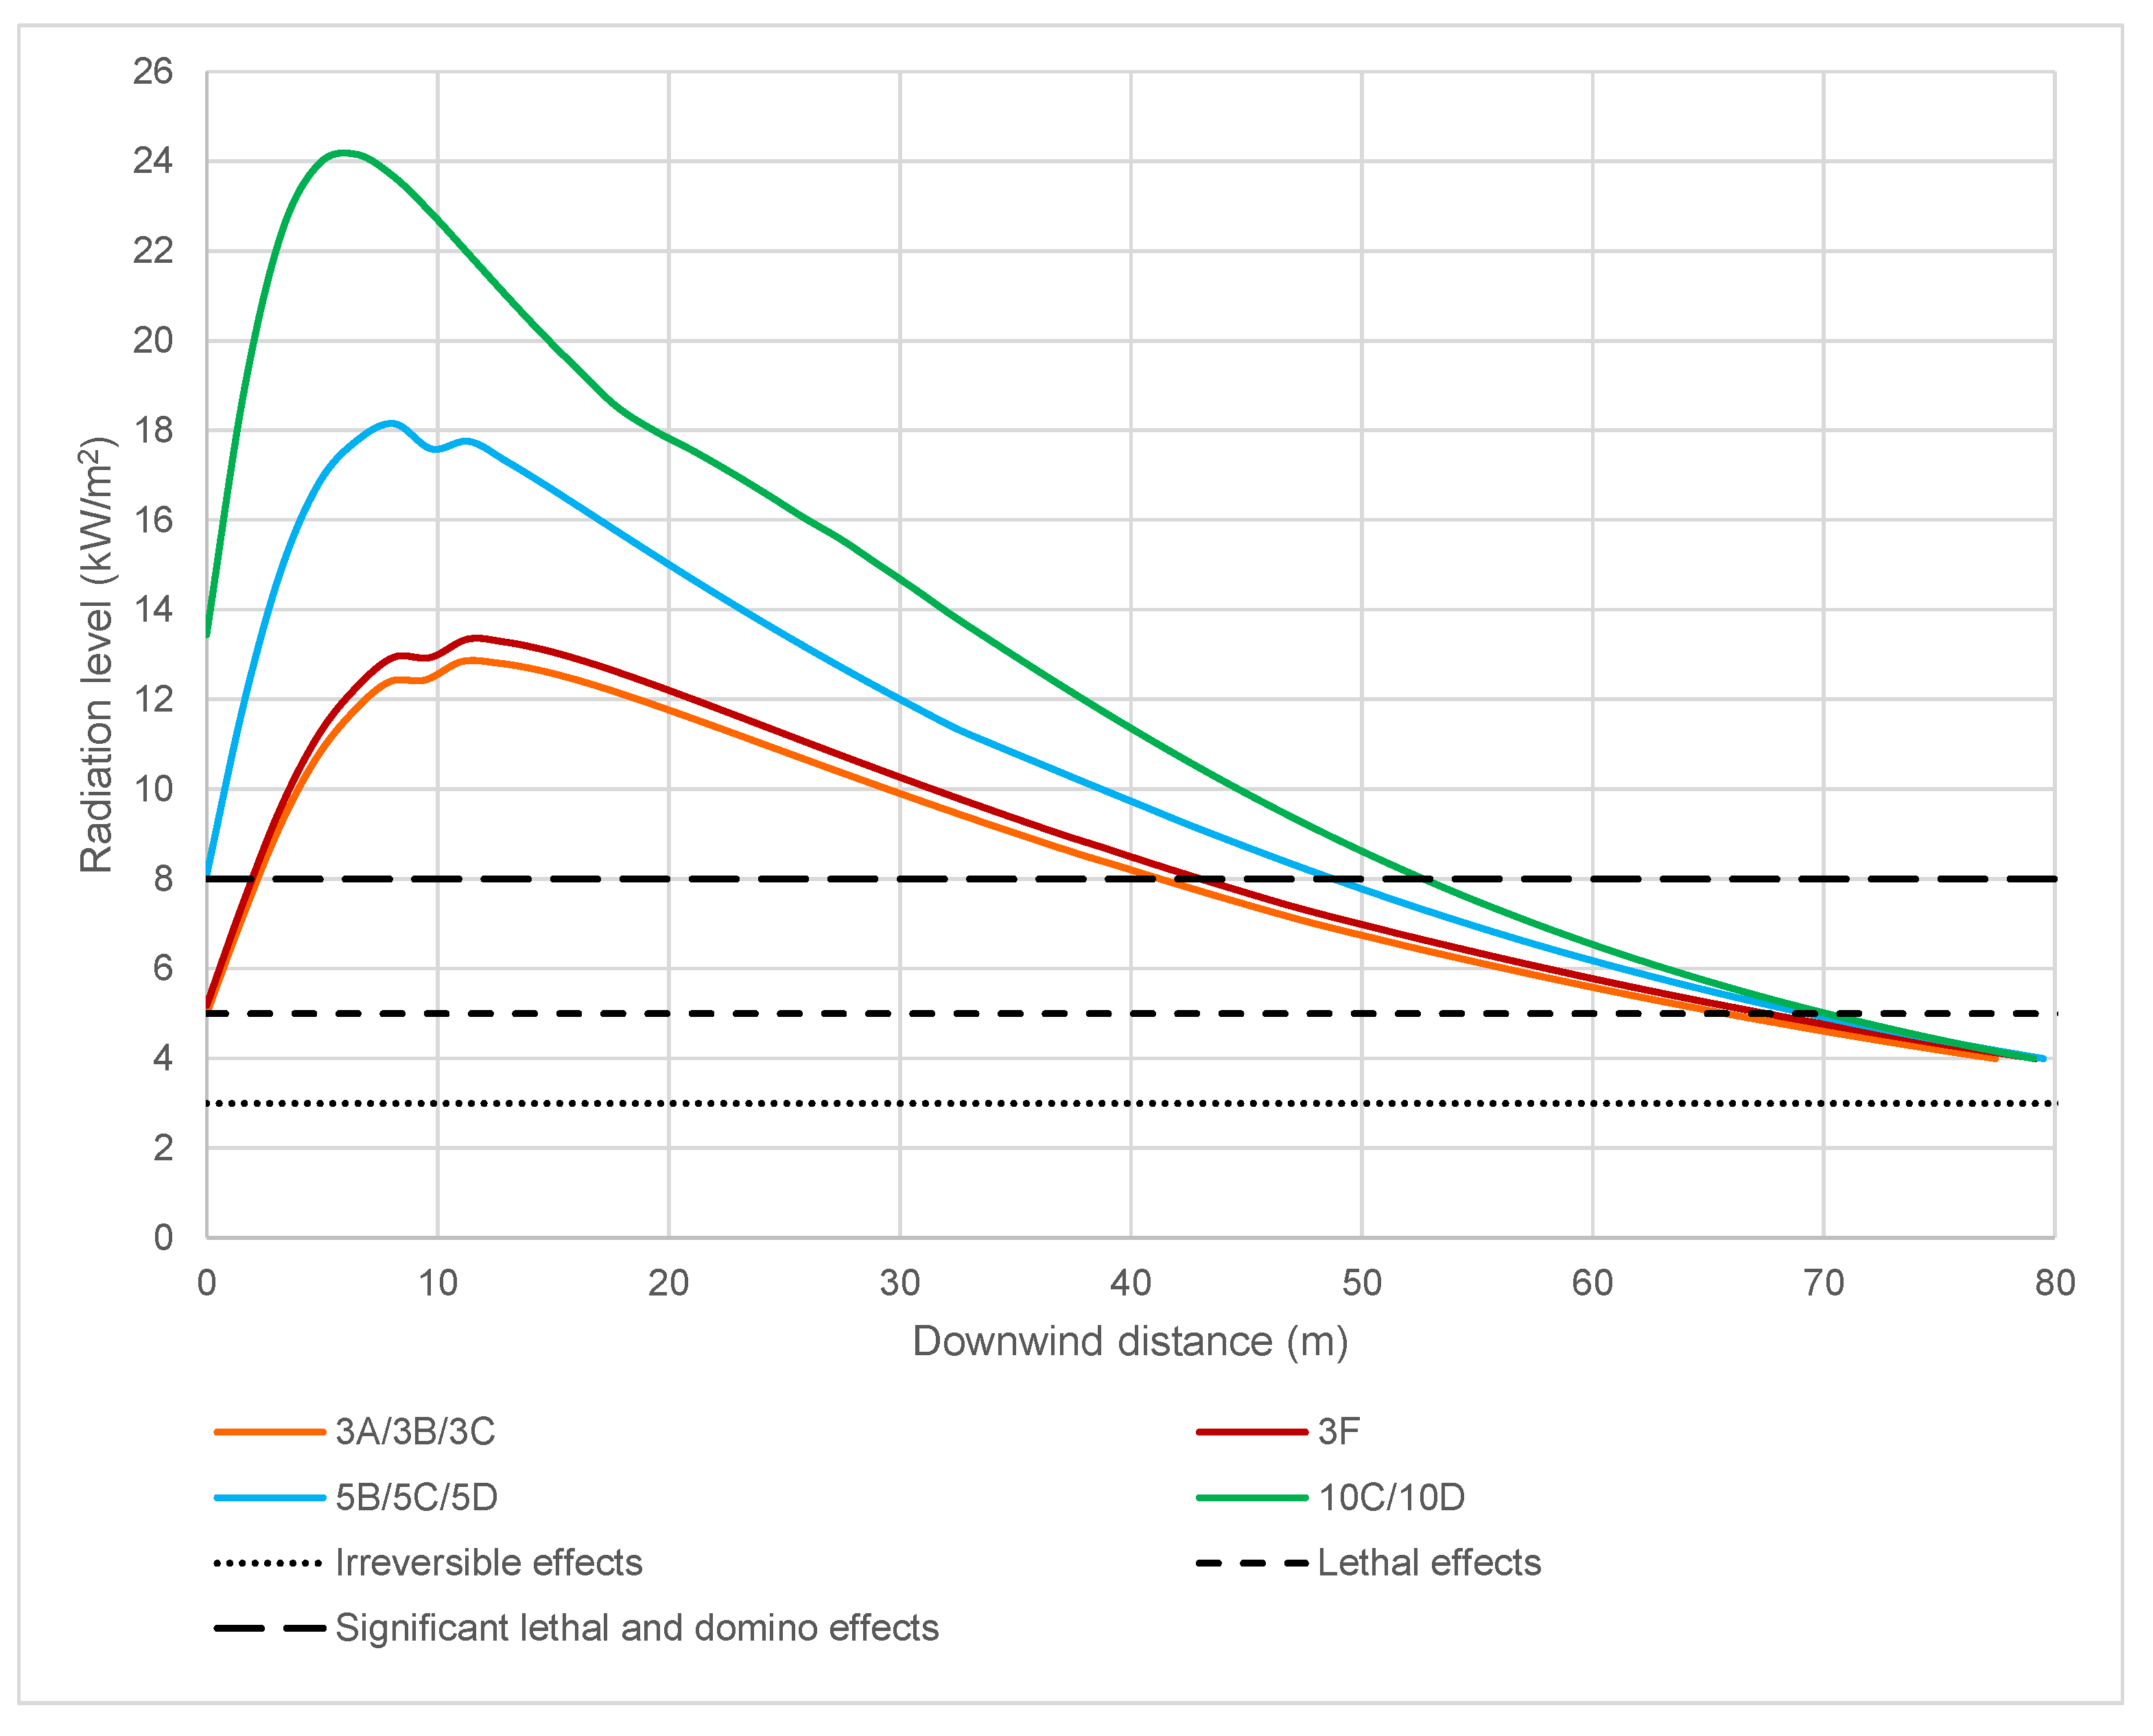
The distances of effects are determined with the software application PHAST 8.21, according to the following criteria:
Significant lethal and domino effects = maximum distance with thermal radiation equal to or greater than 8 kW/m2;
Lethal effects = maximum distance with thermal radiation between 5 kW/m2 and lower 8 kW/m2;
Irreversible effects = maximum distance with thermal radiation between 3 kW/m2 and 5 kW/m2.
For the aerial part, the model limitations can be expressed as follows: The computational model and assumptions are not adapted to describe turbulence or vortical structures formed within the cloud. In the same manner, this numerical approach is not suitable for studies of the influence of significant obstacles located in the vicinities of the cavern’s outlet. For this type of analysis, other methods based on tridimensional models are recommended [
22]; however, the implementation of these tools has a considerably higher demand for computational resources.
6. Computation Result of the Aerial Part of the Blowout
6.1. Atmospheric Hydrogen Dispersion
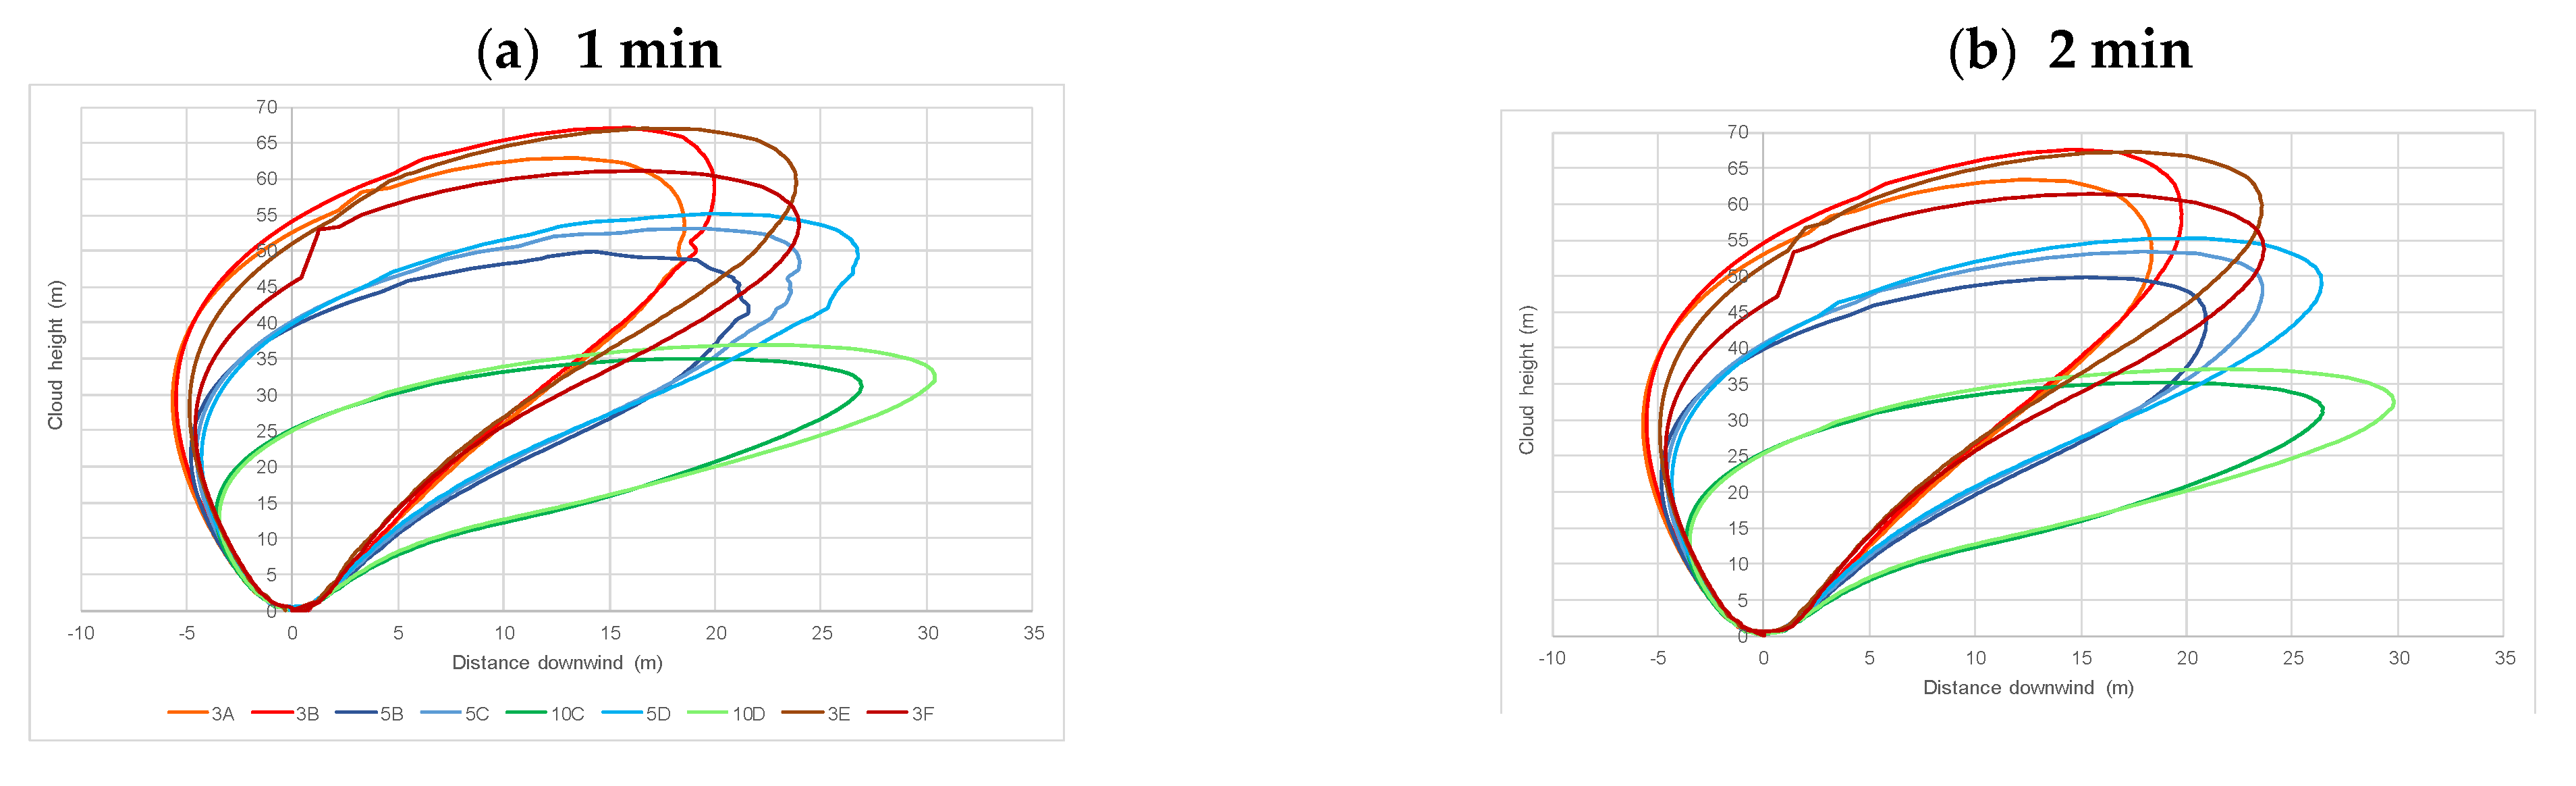
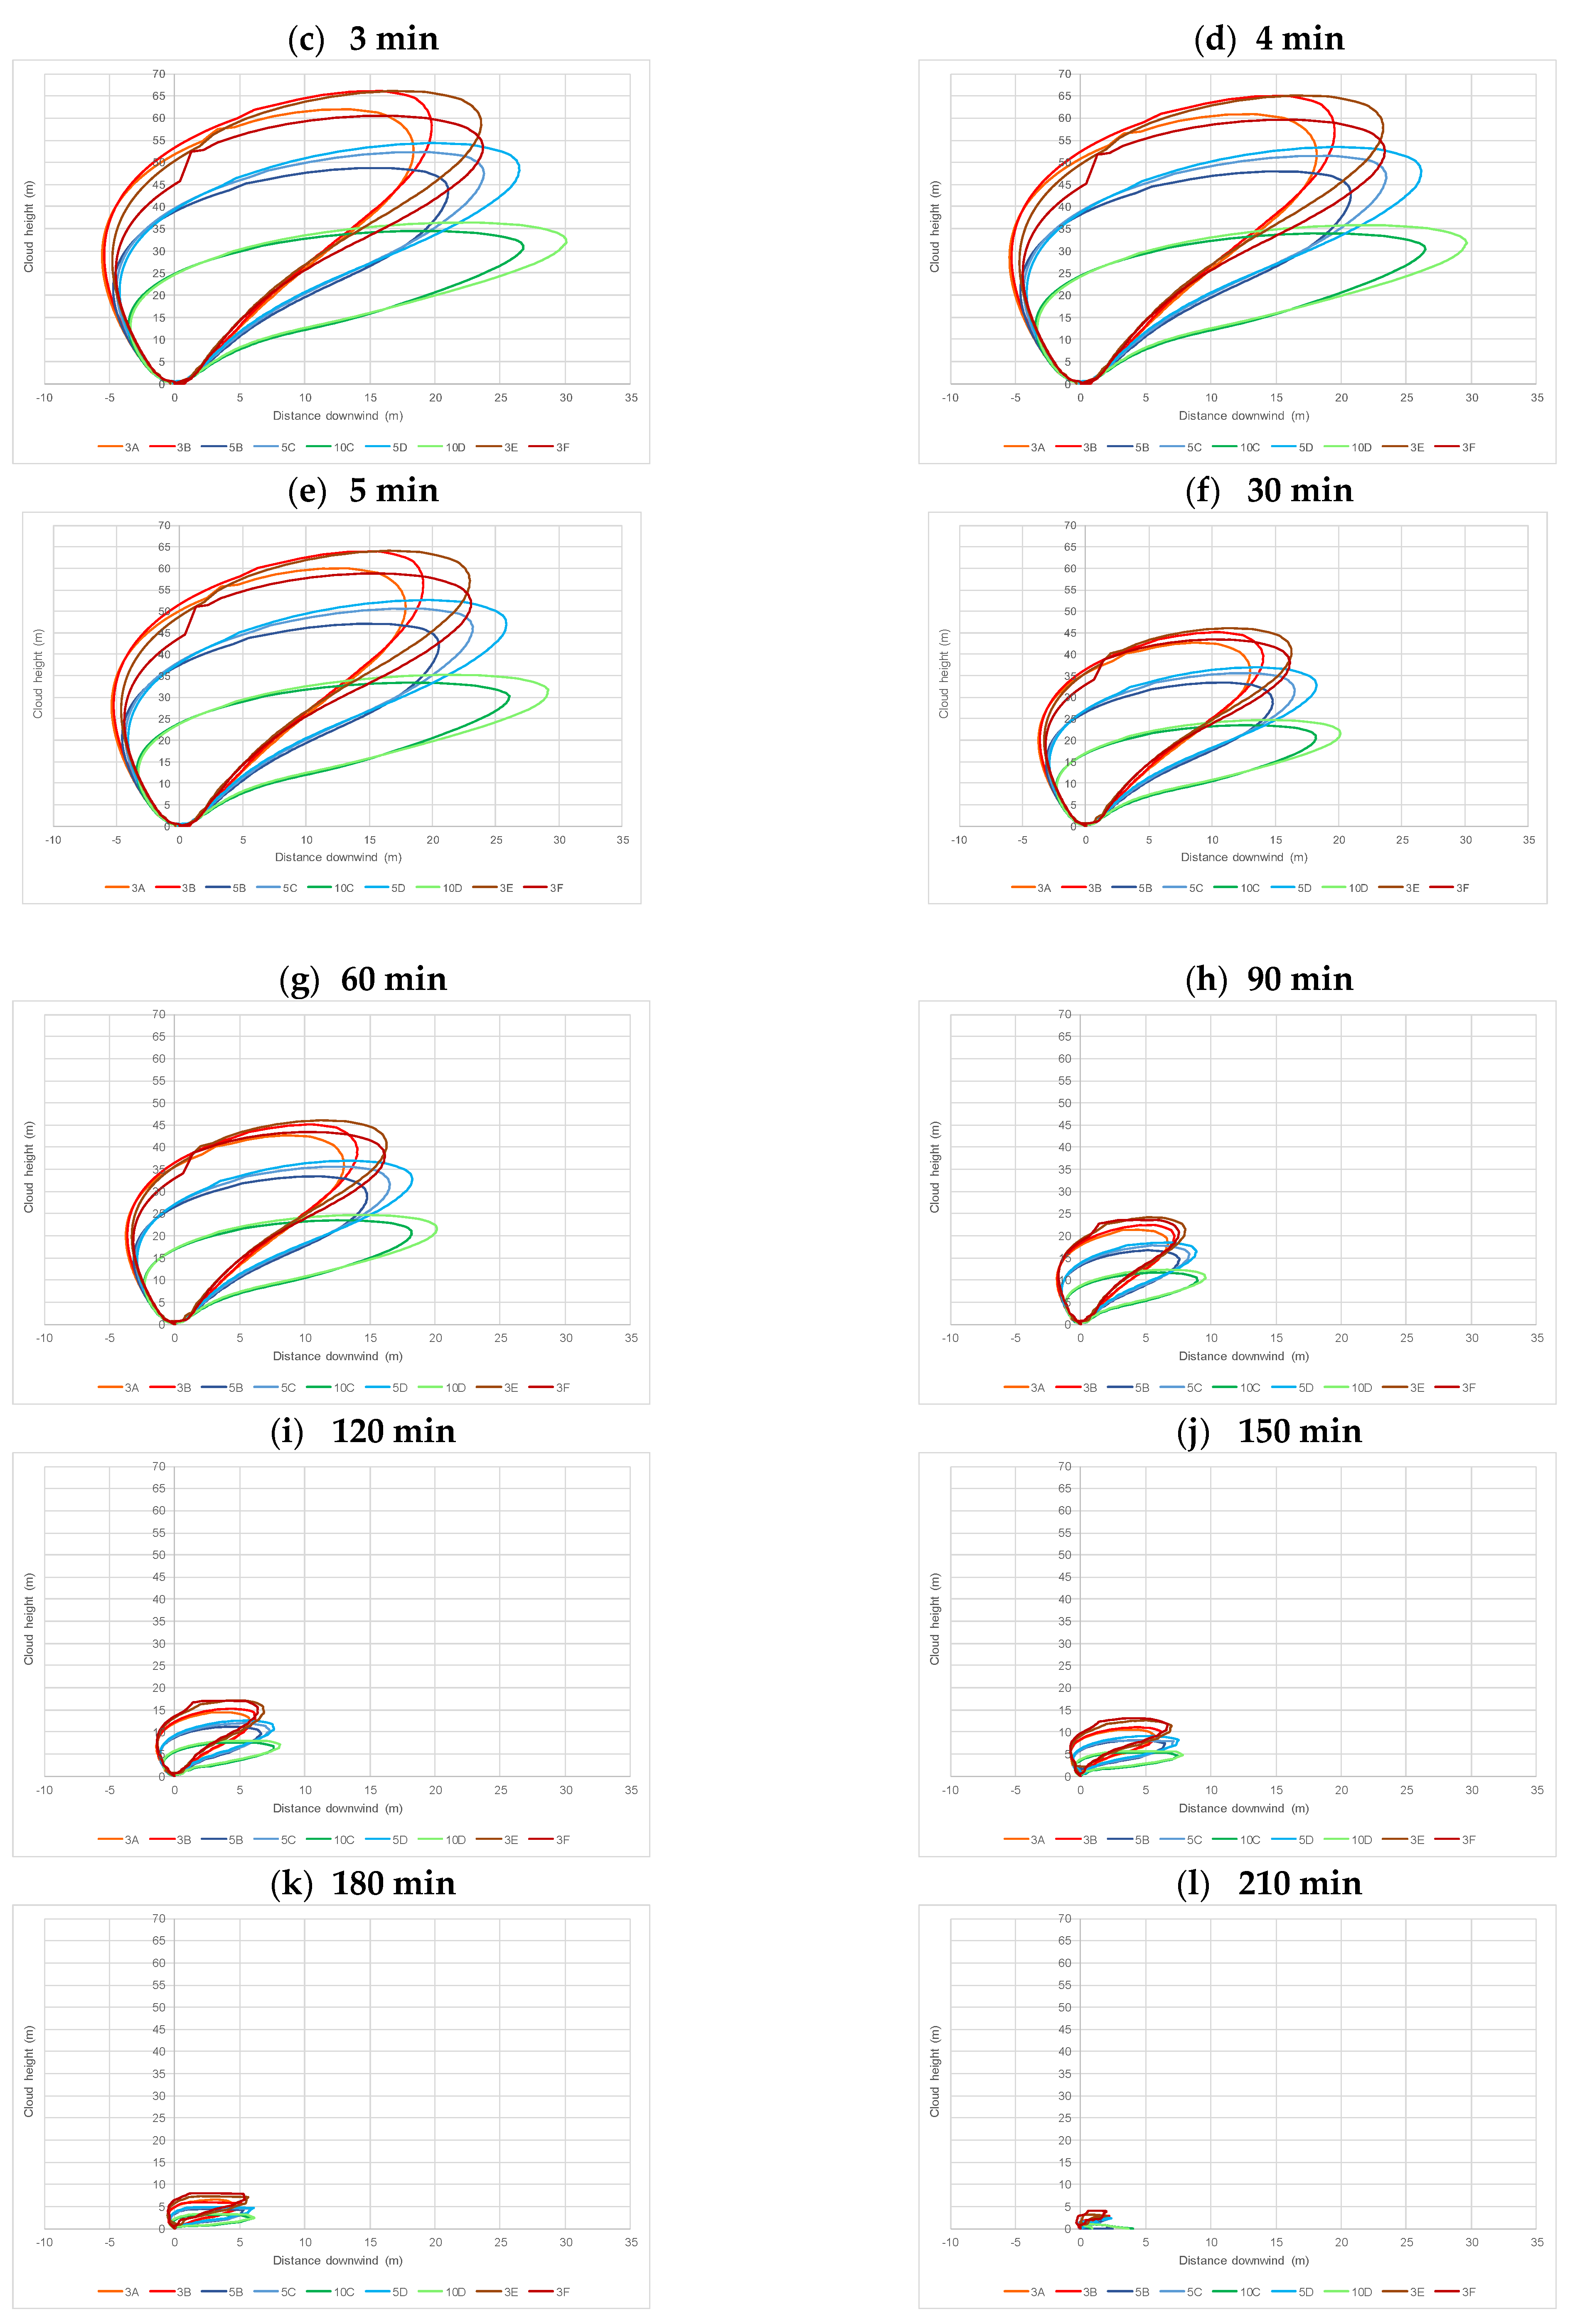
Figure 5 presents the evolution of the dispersion cloud during the hydrogen blowout (total duration = 3.65 h, see
Table 7). In this figure, the contours allow the determination of the zones with concentrations equal to or greater than the hydrogen’s lower flammability limit (40,000 ppm). According to the predictions, the maximum expansion of the combustible cloud is achieved during the first 120 min of release. Subsequently, plume size decreases due to the pressure drop within the cavern. The characteristics of the gas leak at the cavern’s outlet are presented below:
The consequences related to the ignition of the flammable cloud were evaluated 60 s after the onset of the release.
Figure 5 shows the dispersion of the hydrogen cloud depending on atmospheric conditions. Interestingly, the longest expansion in the downwind direction (30 m) is reached at 32 m, when the state is 10D.
6.2. Evaluation of Hazardous Events Following Ignition of the Flammable Hydrogen Cloud
6.2.1. Flash Fire
The distances for a flash fire event in this scenario are presented in
Table 8 for the nine atmospheric conditions considered in this study.
6.2.2. Unconfined Vapor Cloud Explosion (UVCE)
By the approach discussed in
Section 5.1.2, the volumes are estimated according to the results obtained for the gas dispersion at 1 min (
Figure 5a). The assessment of the maximal mass of H
2 likely to be induced during the explosion is presented in
Table 9 below.
Figure 6 shows the evolution of the explosion overpressure in an open field as a function of the hydrogen release flow rate. This plot is used to choose the explosion severity because the environment around the cavern’s head is an open field with a low confinement level. At the time considered for this calculation, the hydrogen flow rate is 36.4 kg/s. Hence, the estimation of the distance of effects is based on a severity index equal to 7 [
26].
6.2.3. Jet Fire
Figure 7 presents a jet fire’s radiation levels and the downwind distance at the height of 1.5 m to evaluate the effects on the general public.
The effects at 1.5 m surpass the thresholds defined for the impact on the general public. According to the simulation results, the most extended distances of effects are obtained for the weather conditions 10C and 10D. The distances of effects are listed in
Table 11.
7. Discussion
A small number of blowouts from gas storage caverns has been described in the literature. The most striking difference between a blowout in a well tapped in an oil or gas reservoir and a blowout in a gas cavern well is that the blowout in a gas cavern well is completed within a couple of days (see [
9,
10,
11,
12,
13,
14,
15,
16,
17,
18,
19,
20]), as the gas inventory in a cavern is much smaller than in a reservoir. Another difference is that modelling the thermodynamic behaviour of gas in the cavern is much simpler than in a porous reservoir, allowing complete computation of the blowout. It is also important to mention that due to the very low number of events (more precisely, there are no known cases of a blowout in hydrogen salt caverns), and the safety measures set up on the well, a blowout remains a significant but not a frequent accident in gas storage caverns. In France, a safety valve is often set at a 30 m depth below ground level; it is automatically triggered following a pressure drop at the wellhead.
Pique et al. [
30] presented the preliminary risk analysis (PRA) for a hydrogen cycling test on the EZ53 salt cavern. This study identified the central feared event and significant dangerous phenomena and classified them according to concerned storage operation phases. The PRA also highlights the importance of paying attention to the losses of containment and the overpressure and thermal effects of hydrogen inflammation.
The computational prediction of the hydrogen dispersion shows that the combustible cloud reaches its maximum extent after 1 min of gas release (
Figure 5). This period is characterised by the maximum pressure difference between the cavern’s outlet and the surrounding environment. The jet conditions mainly influence this plume expansion at the release point. Nevertheless,
Figure 5 also shows the influence of the atmospheric conditions on the plume stratification. For instance,
Figure 5a shows that, the plumes formed at Pasquill’s conditions defined by higher wind velocities (10C and 10D), reach a longer downwind distance (32 m at x = 30 m). In contrast, plumes formed with low wind velocities tend to stabilise at higher locations (66 m at x = 15 m). Moreover,
Figure 5 also shows that this behaviour is determined by the strength of the vertical jet and the influence of the hydrogen jet on the velocity field. This statement evaluates the potential consequences of cloud inflammation after 1 min of dispersion.
The characteristics of the combustible cloud at different atmospheric conditions lead to significant variations in the distances of effects of the hazardous events. However, this influence varies according to the phenomenon developed during the combustion of the dispersed cloud. A flash fire event, mainly associated with thermal and low-pressure effects, indicates longer distances with the plumes formed at high velocities (10C and 10D) due to the greater extent of the plume. Conversely, the most extended distances of effects of a cloud explosion are determined when the cloud is slightly affected by the wind speed, and the maximum downwind distance is short. This fact is observed because the intensity of the explosion is determined by the mass of hydrogen located in the ignition zone. Hence, greater overpressure levels can be reached if a more significant amount of H2 is in a smaller volume within the environment.
The computational results show that the distances determined for the overpressure effects are longer than those of the thermal effects.
Figure 6 shows that the hydrogen leak generates a vertical jet with a high severity index (7), which can lead to a significant risk near the cavern’s outlet. This result confirms the necessity of considering low confinement levels in the vicinities of the cavern to avoid a severity increase of the event due to a greater explosion intensity or the presence of structures or populations that can be affected.
8. Conclusions
A simplified solution was used to compute the evolution of gas pressures, temperatures, and velocities during a blowout in a gas storage cavern. It was shown that, in general, the flow is choked when the gas pressure in the cavern is high and is normal when the cavern pressure is low. This model provides a reasonable basis for computation of the thermomechanical behaviour of cavern walls during a blowout, a concern of particular significance for two reasons: it is essential, before a blowout, to establish a credible scenario (gas rate, duration, etc.) and, after a blowout, to assess if the cavern can be operated again. The validity of the mathematical solution at the end of the blowout is arguable, as water vapour condensation, for instance, may play a significant role.
The loss of containment generated at the surface level by the blowout of the EZ53 salt cavern results in atmospheric dispersion of hydrogen. When hydrogen is expelled from the cavern, an unconfined cloud, i.e., a mixture of air and hydrogen, forms above the wellhead. The cloud is defined by the volume in which the lower flammability limit (40,000 ppm) is reached. The shape and evolution of the cloud are governed by buoyancy (it rises because of low hydrogen density), atmospheric conditions (stability and wind speed, 10 m/s at a 10 m reference height in the following computations), and hydrogen flow rate from the wellhead (which decreases with time, as described above). The assessment of potential consequences of this hazardous event is evaluated through a computational study of the associated blowout scenario. This analysis aimed to predict the concentration profiles generated by the atmospheric gas dispersion and also the thermal and overpressure effects caused by an ignition of the resulting flammable cloud.
The flammability range of hydrogen (a volumetric ratio of gas to air between 4% and 75%) is significant. In addition, the ignition energy of this mixture is low (0.02 mJ as compared with 0.29 mJ for methane). As compared with natural gas, early ignition of a hydrogen-air cloud forming at the wellhead is highly likely (for instance, due to electric arcs generated by differences in the wellhead’s and the ground’s electric potential). The worst-case scenario is a vapour cloud which does not ignite immediately (for instance, because gas outflow rates are very high) as an explosion with possibly dramatic consequences can be expected. The distance from the cloud for which irreversible effects occur (for an ignition at 120 min) depends on atmospheric conditions and the type of event.
Author Contributions
Conceptualization, B.B. and P.B.; methodology, H.D., B.B. and P.B. software, C.M.R. and B.B.; validation, B.B. and P.B.; formal analysis, H.D. and C.M.R.; data curation, H.D.; writing—original draft preparation, H.D. and C.M.R.; writing—review and editing, H.D., G.H. and P.B.; supervision, P.B.; project administration, G.H.; funding acquisition, G.H. All authors have read and agreed to the published version of the manuscript.
Funding
The HyPSTER project has received funding from the Clean Hydrogen Partnership under grant no 101006751. The Clean Hydrogen Partnership receives support from the European Union’s Horizon 2020 Research and Innovation program, Hydrogen Europe and Hydrogen Europe Research.
Acknowledgments
This study was funded partially by the European Union in the framework of the HyPSTER project, which included research conducted by Storengy (France), Armines-Ecole Polytechnique (France), INOVYN (United Kingdom), ESK (Germany), Element Energy (UK), Ineris (France), Axelera (France), Brouard Consulting (France), and Equinor (Norway). Thanks to K. Sikora.
Conflicts of Interest
The authors declare no conflict of interest.
References
- Maarten, P.L. Hydrogen Storage in Salt Cavern Chemical Modelling and Analysis of Large-Scale Hydrogen Storage in Underground Salt Caverns. Master’s Thesis, Delf University of Technology, Delft, The Netherlands, 17 July 2020. [Google Scholar]
- van der Valk, K.; van Unen, M.; Brunner, L.G.; Groenenberg, R.M. Inventory of Risks Associated with Underground Storage of Compressed Air (CAES) and Hydrogen (UHS), and Qualitative Comparison of Risks of UHS vs. Underground Storage of Natural Gas (UGS); Report TNO R12005; TNO: Utrecht, The Netherlands, 2020; Available online: http://resolver.tudelft.nl/uuid:4a8bfbac-9b18-4499-945c-807c6ca7872e (accessed on 3 March 2022).
- Bérest, P.; Brouard, B. Safety of salt caverns used for underground storage. Oil Gas Sci. Technol. J. Rev. IFP 2003, 58, 361–384. [Google Scholar] [CrossRef]
- Alberta Energy and Utilities Board. BP Canada Energy Company Ethane Cavern Well Fires Fort Saskatchewan, Alberta, August/September 2001—EUB Post-Incident Report; Alberta Energy and Utilities Board: Calgary, AB, Canada, 2002. [Google Scholar]
- Réveillère, A.; Bérest, P.; Evans, D.; Stöwer, M.; Chabannes, C.; Koopmans, T.; Boly, R. Past Salt Caverns Incidents Database, Part 1: Leakage, Overfilling and Blow-Out; SMRI Research Report, RR201-72; Solution Mining Research Institute: Clifton Park, NY, USA, 2017. [Google Scholar]
- Rittenhour, T.P.; Heath, S.A. Moss Bluff Cavern 1 Blowout. In Proceedings of the SMRI Fall Technical Conference, Bremen, Germany, 30 September–3 October 2012; Solution Mining Research Institute: Clarks Summit, PA, USA, 2012; pp. 119–130. [Google Scholar]
- Brouard, B.; Nieland, J.; DeVries, K. Analysis of Moss Bluff Cavern #1 Blowout Data; SMRI Research Report 2013-01; Solution Mining Research Institute: Clarks Summit, PA, USA, 2013; 197p. [Google Scholar]
- Brouard, B.; Zakharov, V.; Frangi, A. Full Geomechanical Modeling and Data Management of a Gas-Storage Facility Using LOCAS 3D. In Proceedings of the SMRI Fall Virtual Technical Conference, Virtual, 21–24 September 2020. [Google Scholar]
- Djizanne, H.; Bérest, P.; Brouard, B.; Frangi, A. Blowout in Gas Storage Caverns. Oil Gas Sci. Technol. Rev. IFP Energ. Nouv. 2014, 69, 1251–1267. [Google Scholar] [CrossRef]
- Sicsic, P.; Bérest, P. Thermal Cracking following a blowout in a gas storage cavern. Int. J. Rock Mech. Min. Sci. 2014, 71, 320–329. [Google Scholar] [CrossRef]
- Bérest, P.; Djizanne, H.; Brouard, B.; Frangi, A. A Simplified Solution for Gas Flow During a Blow-out in an H2 or Air Storage Cavern. In Proceedings of the SMRI Spring Technical Conference, Lafayette, LA, USA, 21–24 April 2013. [Google Scholar]
- van Sambeek, L. Natural compressed air storage: A catastrophe at a Kansas salt mine. In Proceedings of the 9th International Symposium on Salt, Beijing, China, 4–7 September 2009; Volume 1, pp. 621–632. [Google Scholar]
- Hugout, B. Mechanical behaviour of salt cavities in situ tests model for calculating the cavity volume evolution. In Mechanical Behavior of Salt II; Langer, H.E., Ed.; Trans Tech Pub: Clausthal-Zellerfeld, Germany, 1988; pp. 291–310. ISBN 0-87849-071-X. [Google Scholar]
- Brouard, B. Sur le Comportement des Cavités Salines étude Théorique et Expérimentation In Situ. Ph.D. Thesis, École Polytechnique, Palaiseau, France, 1998. [Google Scholar]
- Bérest, P.; Bergues, J.; Brouard, B.; Durup, J.G.; Guerber, B. A salt cavern abandonment test. Int. J. Rock Mech. Min. Sci. 2001, 38, 357–368. [Google Scholar] [CrossRef]
- Hévin, G.; Pellizzaro, C.; Bérest, P.; Brouard, B. 12-Year Pressure Monitoring in an Idle Salt Cavern—The 1997–1998 Etrez Abandonment Test Revisited. In Proceedings of the SMRI Spring Technical Conference, Grand Junction, CO, USA, 26–27 April 2010. [Google Scholar]
- Djizanne, H.; Brouard, B.; Bérest, P.; Hévin, G. Modélisation de l’éruption d’une cavité saline de stockage souterrain d’hydrogène. In Proceedings of the 11èmes Journées Nationales de Géotechnique et de Géologie de l’Ingénieur, Lyon, France, 28–30 June 2022. [Google Scholar]
- Air Liquide. Gas Encyclopedia. 2012. Available online: http://encyclopedia.airliquide.com (accessed on 3 March 2022).
- Djizanne, H.; Brouard, B.; Bérest, P.; Hévin, G.; Murillo Rueda, C. Blowout from a hydrogen storage cavern. In Proceedings of the SMRI Spring Technical Conference, Rapid City, SD, USA, 4–5 May 2022. [Google Scholar]
- Landau, L.; Lifschitz, E. Mécanique des Fluides; Éditions MIR: Moscow, Russia, 1971. (In French) [Google Scholar]
- von Vogel, P.; Marx, C. Berechnung von Blowoutraten in Erdgassonden. Erdoel-Erdgas 1985, 10, 311–316. (In German) [Google Scholar]
- Woodward, J.L.; Cook, J.; Papadourakis, A. Modeling and Validation of a Dispersing Aerosol Jet. J. Hazard. Mater. 1995, 44, 185–207. [Google Scholar] [CrossRef]
- Witlox, H.W.M.; Holt, A. A unified model for jet, heavy and passive dispersion, including droplet rainout and re-evaporation. In CCPS 1999 UDM Paper; 1999; 24p, Available online: https://www.researchgate.net/publication/265566709 (accessed on 3 March 2022).
- Flores, F.; Garreaud, R.; Muñoz, R.C. OpenFOAM applied to the CFD simulation of turbulent buoyant atmospheric flows and pollutant dispersion inside large open pit mines under intense insolation. Comput. Fluids 2014, 90, 72–87. [Google Scholar] [CrossRef]
- Ministère de l’Écologie, du Développement durable, des Transports et du Logement. Circulaire du 10 mai 2010 Récapitulant les Règles Méthodologiques Applicables aux Etudes de Dangers, à L’appréciation de la Démarche de Réduction du Risque à la Source et aux Plans de Prévention des Risques Technologiques (PPRT) dans les Installations Classées en Application de la loi du 30 Juillet 2003; Ministère de l’Écologie, du Développement durable, des Transports et du Logement: Paris, France, 2010. [Google Scholar]
- van den Berg, A.C. The Multi-Energy Method. A Framework for Vapor Cloud Explosion Blast Prediction. J. Hazard. Mater. 1985, 12, 1–10. [Google Scholar] [CrossRef]
- Crowl, D.A.; Louvar, J.F. Chemical Process Safety: Fundamentals with Applications; Prentice Hall: Kent, OH, USA, 2011. [Google Scholar]
- Mannan, S. (Ed.) Explosion. In Lees’ Loss Prevention in the Process Industries, 3rd ed.; Butterworth-Heinemann: Portsmouth, NH, USA, 2005; 311p. [Google Scholar]
- Ineris, Omega UVCE—Les Explosions Non Confinées de Gaz et de Vapeurs. 2016. DRA-16-133610-06190A. Available online: https://www.ineris.fr/fr/omega-uvce-explosions-non-confinees-gaz-vapeurs (accessed on 3 March 2022). (In French).
- Pique, S.; Thoraval, A.; Lahaie, F.; Sarriquet, A. Preliminary Risk Assessment for Tests Planned in Pilot Salt Cavern Hydrogen Storage in the Frame of the French Project Stopil-H2. In Proceedings of the International Conference on Hydrogen Safety (ICHS), Online, 21–24 September 2021; p. 12. [Google Scholar]
| Publisher’s Note: MDPI stays neutral with regard to jurisdictional claims in published maps and institutional affiliations. |
© 2022 by the authors. Licensee MDPI, Basel, Switzerland. This article is an open access article distributed under the terms and conditions of the Creative Commons Attribution (CC BY) license (https://creativecommons.org/licenses/by/4.0/).


 ,
, 


