Article

Data-Driven Proxy Models for Improving Advanced Well Completion Design under Uncertainty

by
Ali Moradi
,
Javad Tavakolifaradonbe
and
Britt M. E. Moldestad
*
Department of Process, Energy and Environmental Technology, University of South-Eastern Norway, 3918 Porsgrunn, Norway
*
Author to whom correspondence should be addressed.
Energies 2022, 15(20), 7484; https://doi.org/10.3390/en15207484
Submission received: 7 September 2022 / Revised: 24 September 2022 / Accepted: 8 October 2022 / Published: 11 October 2022

Abstract

:
In order to improve the design of advanced wells, the performance of such wells needs to be carefully assessed by taking the reservoir uncertainties into account. This research aimed to develop data-driven proxy models for the simulation and assessment of oil recovery through advanced wells under uncertainty. An artificial neural network (ANN) was employed to create accurate and computationally efficient proxy models as an alternative to physics-based integrated well–reservoir models created by the Eclipse® reservoir simulator. The simulation speed and accuracy of the data-driven proxy models compared to physic-driven models were then evaluated. The evaluation showed that while the developed proxy models are 350 times faster, they can predict the production of oil and unwanted fluids through advanced wells with a mean error of less than 1% and 4%, respectively. As a result, the data-driven proxy models can be considered an efficient tool for uncertainty analysis where several simulations need to be performed to cover all possible scenarios. In this study, the developed proxy models were applied for uncertainty quantification of oil recovery from advanced wells completed with different types of downhole flow control devices (FCDs). According to the obtained results, compared to other types of well completion design, advanced wells completed with autonomous inflow control valve (AICV) technology have the best performance in limiting the production of unwanted fluids and are able to reduce the associated risk by 91%.

1. Introduction

Despite the rapid progress in the area of renewable energies, the world is still dependent on oil and gas for the foreseeable future. Therefore, in order to meet future energy demands, improving oil recovery with a low-carbon footprint must be in the spotlight. Oil recovery can be enhanced by maximizing the well–reservoir contact through the drilling of long horizontal wells. One of the main challenges of using such wells is the early breakthrough of unwanted fluids (water and/or gas) due to the heel-toe effect and heterogeneity along the well. To tackle this problem, advanced wells are widely applied today. Advanced (smart or intelligent) wells are horizontal wells completed with downhole flow control devices (FCDs), annular flow isolation (AFI), sand control screens (SCSs), and monitoring and control systems [1]. Figure 1 depicts a schematic of advanced well completion (AWC).
FCDs are the key components of AWC. FCDs are divided into four main categories: inflow control devices (ICDs), autonomous inflow control devices (AICDs), autonomous inflow control valves (AICVs), and interval control valves (ICVs). ICDs are installed as a passive (fixed) flow restrictor on the production tubing and are able to passively reduce the production of unwanted fluids by delaying water or gas breakthrough. However, ICDs cannot limit the production of unwanted fluid after the breakthrough. To address this issue, AICDs and AICVs have been developed as robust alternatives. AICDs and AICVs are able to choke low-viscosity fluids (relative to oil) after the breakthrough in an autonomous manner. As a result, in addition to delaying water or gas breakthrough, these technologies are able to reactively limit the production of undesired fluids after breakthrough. AICDs and AICVs cannot be controlled after the well deployment. As a result, when the inflow needs to be flexibly controlled, ICVs are used. These valves can be regulated using an electric, hydraulic, or wireless system from the surface. As a result, by applying ICVs, the production of unwanted fluids can be proactively controlled. However, due to the high cost and technical difficulties of installation, the application of ICVs is limited and they are not studied in this paper [3].
A successful and optimized design for advanced wells can significantly improve oil recovery. However, to achieve this, several parameters must be considered and precisely evaluated. This is a significantly time-consuming process using physics-driven models when the reservoir model is complex and there is uncertainty in the model design parameters. This is due to the fact that for describing the multiphase fluid flow from the reservoir pore to the production tubing through physics-driven models, a complex set of partial differential equations (PDEs) needs to be solved for each time step. Moreover, for such complex numerical simulations, the need for big data storage poses additional problems. To deal with these challenges, data-driven proxy models can be considered one of the most practical solutions. In other words, instead of a computationally expensive physics-based numerical model, a fast and reasonably accurate proxy model can be utilized for the prediction of advanced well performance and accordingly improve the advanced well completion design. This study is an effort to assess the functionality of data-driven proxy models for improving the design of advanced wells under uncertainty in the reservoir rock and fluid properties. This aim is followed by establishing a workflow for developing fast and accurate proxy models for advanced wells completed with the main types of FCDs.
Khuri et al. [4] introduced response surface methodologies (RSMs), reduced-order models (ROMs), and reduced physics models (RPMs) as the first techniques to generate the proxy models. Among these techniques, RSM is the most commonly used approach. By accounting for a set of statistical and mathematical techniques, RSM develops a logical relation between the outputs of interest and associated input parameters. Nonetheless, these days, data-driven models as a newly proxy-generating approach are being developed. Indeed, based on data mining and artificial intelligence, scientists are developing proxies to simulate a system [5].
Providing an appropriate data set, data-driven proxies are memorized and learned throughout a training process. Then, the prepared proxy is utilized to predict the performance-related tasks [6]. Data-driven proxy models have adequate potential, especially in the oil and gas industry with a wide scope of application [6,7]. In a study, the artificial neural network (ANN) was applied as a proxy model to assess the uncertainty in production prediction [8]. Another study investigated the different architectures of the neural networks in reducing the time of reservoir simulation [9]. The artificial neural network, separately or in combination with the genetic algorithm, was utilized to obtain the nonlinearities of problems [8,10]. Apart from the optimization of the algorithm, there are several studies related to the application of ANN in petroleum engineering. Shaik et al. predicted the lifetime of a pipeline by applying ANN [11]. Otchere et al. forecasted the features of a petroleum reservoir using supervised machine learning paradigms [12]. Moreover, the application of neural networks in production prediction was also proposed by Yuan et al. [13]. In all the previous studies, it is mentioned that the quality and accuracy of a proxy model highly depend on the training step. Apart from this, Mohaghegh et al. [14,15,16] investigated the applicability of the neural network, generic algorithm, and fuzzy logic in the oil and gas industry and showed that the neural network approach has a better ability to model complex reservoirs.
The aforementioned studies show that the data-driven proxy models developed by the ANN approach can offer a potent tool for resolving performance forecasting problems in the oil and gas industry. ANN is generally classified into two types, namely, the feedforward neural network and feedback neural network. The feedback neural network has a much more complicated network structure than that of the feedforward neural network and as a result, it is more sophisticated for solving a wide range of forecasting problems [6]. However, due to the complexity of proxy models developed by the feedback neural network and the difficulty associated with using such models, in this study, the data-driven proxy models were developed by taking advantage of the feedforward neural network. The required data sets for training the proxy models were generated by the industry-standard physics-based reservoir simulator EclipseTM. The Latin hypercube sampling approach (LHS), which is a pseudo-random sampling method, was applied for the design of experiment (DOE). Moreover, by enlisting a new algorithm, the developed proxy models were able to predict cumulative oil and water production through advanced wells by passing the time. The developed data-driven proxy models were utilized to efficiently and accurately investigate the performance of advanced wells with different completion designs. Therefore, the developed methodology enables petroleum engineers to improve the design of advanced wells under uncertain geological parameters.

2. Data and Methods

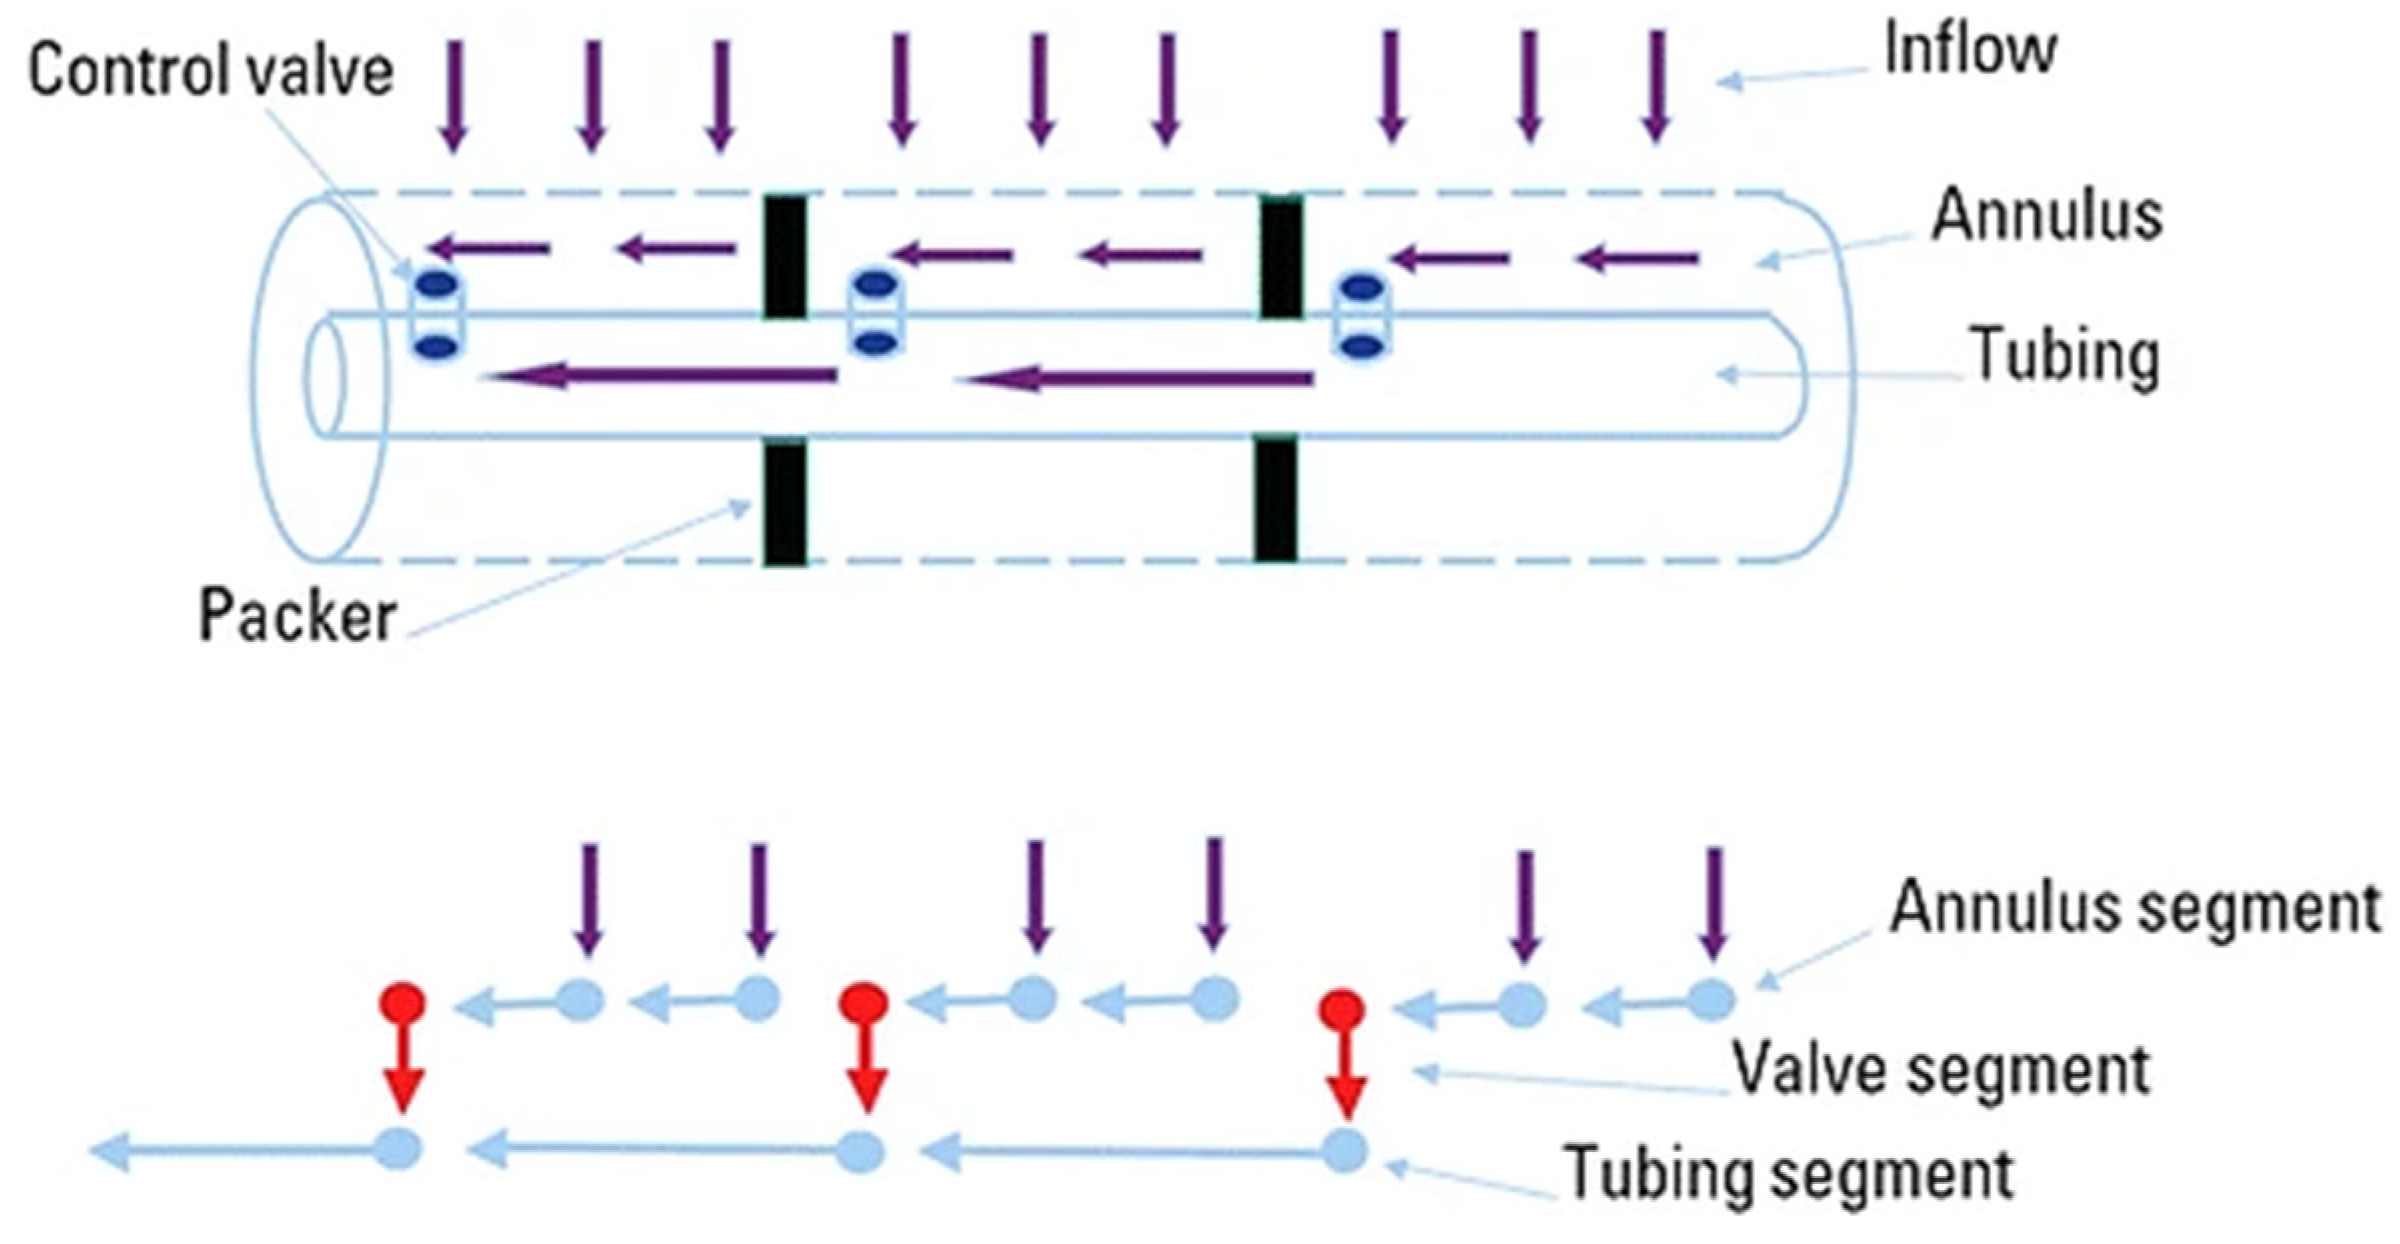
2.1. Development of the Physics-Based Integrated Well–Reservoir Model

In this paper, this study was conducted through the modeling and simulation of oil recovery from an advanced horizontal well in a synthetic heterogeneous reservoir with uncertain rock and fluid properties. It is assumed that a strong aquifer attached to the bottom face of the reservoir maintains the reservoir pressure. The reservoir has a length of 1000 m, a width of 70 m, and a thickness of 30 m. The length of the horizontal well is considered to be the same as the length of the reservoir and it is located 5.5 m below the top of the reservoir. Oil is produced with a constant pressure drawdown of 8 bar as long as the liquid production rate is below 1000 m3/day. To maintain the liquid production rate below its threshold, the pressure drawdown is lowered when the rate of liquid production rises over 1000 m3/day. A schematic of the horizontal well and reservoir is shown in Figure 2.
The reservoir pressure and temperature are 130 bar and 68 °C, respectively. The reservoir contains live oil with a viscosity of 2.7 cP and a density of 900 kg/m3. Table 1 provides information on the reservoir’s characteristics and their range of uncertainty. The ratio of vertical permeability to horizontal permeability is defined as permeability anisotropy.
The reservoir is considered to be a heterogenous sandstone reservoir, and it is assumed that porosity has a Gaussian distribution in the range of 0.15 and 0.27 with a mean value of 0.21 throughout the reservoir. Since permeability is related to porosity, the Carman–Kozeny relation [17], which relates permeability to porosity, is used to calculate the variation of permeability based on the distribution of porosity in the reservoir. Figure 3 illustrates the variation of porosity and permeability throughout the reservoir. As can be seen in the figure, permeability has variations in the range of 100–800 mD in the reservoir.
Using Standing’s black oil correlations [18], the reservoir oil properties as a function of pressure at the reservoir temperature were calculated and are presented in Figure 4 and used to develop the model in the Eclipse simulator.
In order to model advanced wells completed with FCDs and AFIs, the Multisegment Well Model (MSW) available in the Eclipse simulator was used. As depicted in Figure 5, in this model, one branch is considered to model the production tubing, and each isolated zone of the annulus is also modeled by a separate branch. Each branch consists of a series of one-dimensional segments, including a node and a flow path. The annulus segments can be connected to none or any number of reservoir grids to accept the inflow from the reservoir. Moreover, a specific segment can be added between the annulus and tubing segments to model each FCD. With this configuration, at first, the reservoir fluids enter the annulus via the annulus segments and then pass into the production tubing through FCDs [19].
In the MSW model, an AICD or AICV segment is introduced to the Eclipse simulator in the form of a specific mathematical model describing the rate of fluid flow passing through each AICD/AICV as a function of the pressure drop across it. This model can be derived by performing nonlinear regression on the available experimental data presenting the performance of such devices. However, an ICD segment is specified for the Eclipse simulator by its nozzle cross-sectional area (or diameter). Figure 6 shows the performance curves of ICDs, AICDs, and AICVs for oil, water, and gas obtained by laboratory tests under the reservoir conditions assumed in this paper.
By assuming only two phases of oil and water in the reservoir and using the given performance curves in Figure 6 for ICDs, the nozzle’s cross-section diameter of ICDs was calculated, which is 2 mm assuming a discharge coefficient of 0.61. Moreover, by performing nonlinear curve-fitting on the performance curves of AICDs and AICVs, Equations (1) and (2) were derived for the modeling of AICDs and AICVs, respectively. In these equations, Δ P is the pressure drop across the valve in bar, and Q ˙ is the rate of fluid flow passing through the valve in m3/h. ρ m i x and μ m i x are the fluid mixture density and viscosity, respectively, and they were calculated using Equation (3) based on the water cut α . The derived mathematical models for AICDs and AICVs vs. the experimental data are shown in Figure 7:
Δ P A I C D = 0.0737 ( ρ m i x 2 1000 ) ( 1 μ m i x ) 0.2689 Q ˙ A I C D 2.1805
Δ P A I C V = 0.5740 ( ρ m i x 2 1000 ) ( 1 μ m i x ) 2.3625 Q ˙ A I C V 2.0051
ρ m i x = α o i l ρ o i l + α w a t e r ρ w a t e r μ m i x = α o i l μ o i l + α w a t e r μ w a t e r
By integrating the developed models for the reservoir and advanced wells with different FCDs, the oil recovery from such wells can be simulated. The obtained results from the simulation for different cases and scenarios covering the uncertainty range were used to generate the required data sets for training and validation of the proxy models. Figure 8 illustrates the simulation results for the cumulative oil and water production from advanced wells with different FCD completions compared to the conventional well (open-hole) for the base case over 10 years.

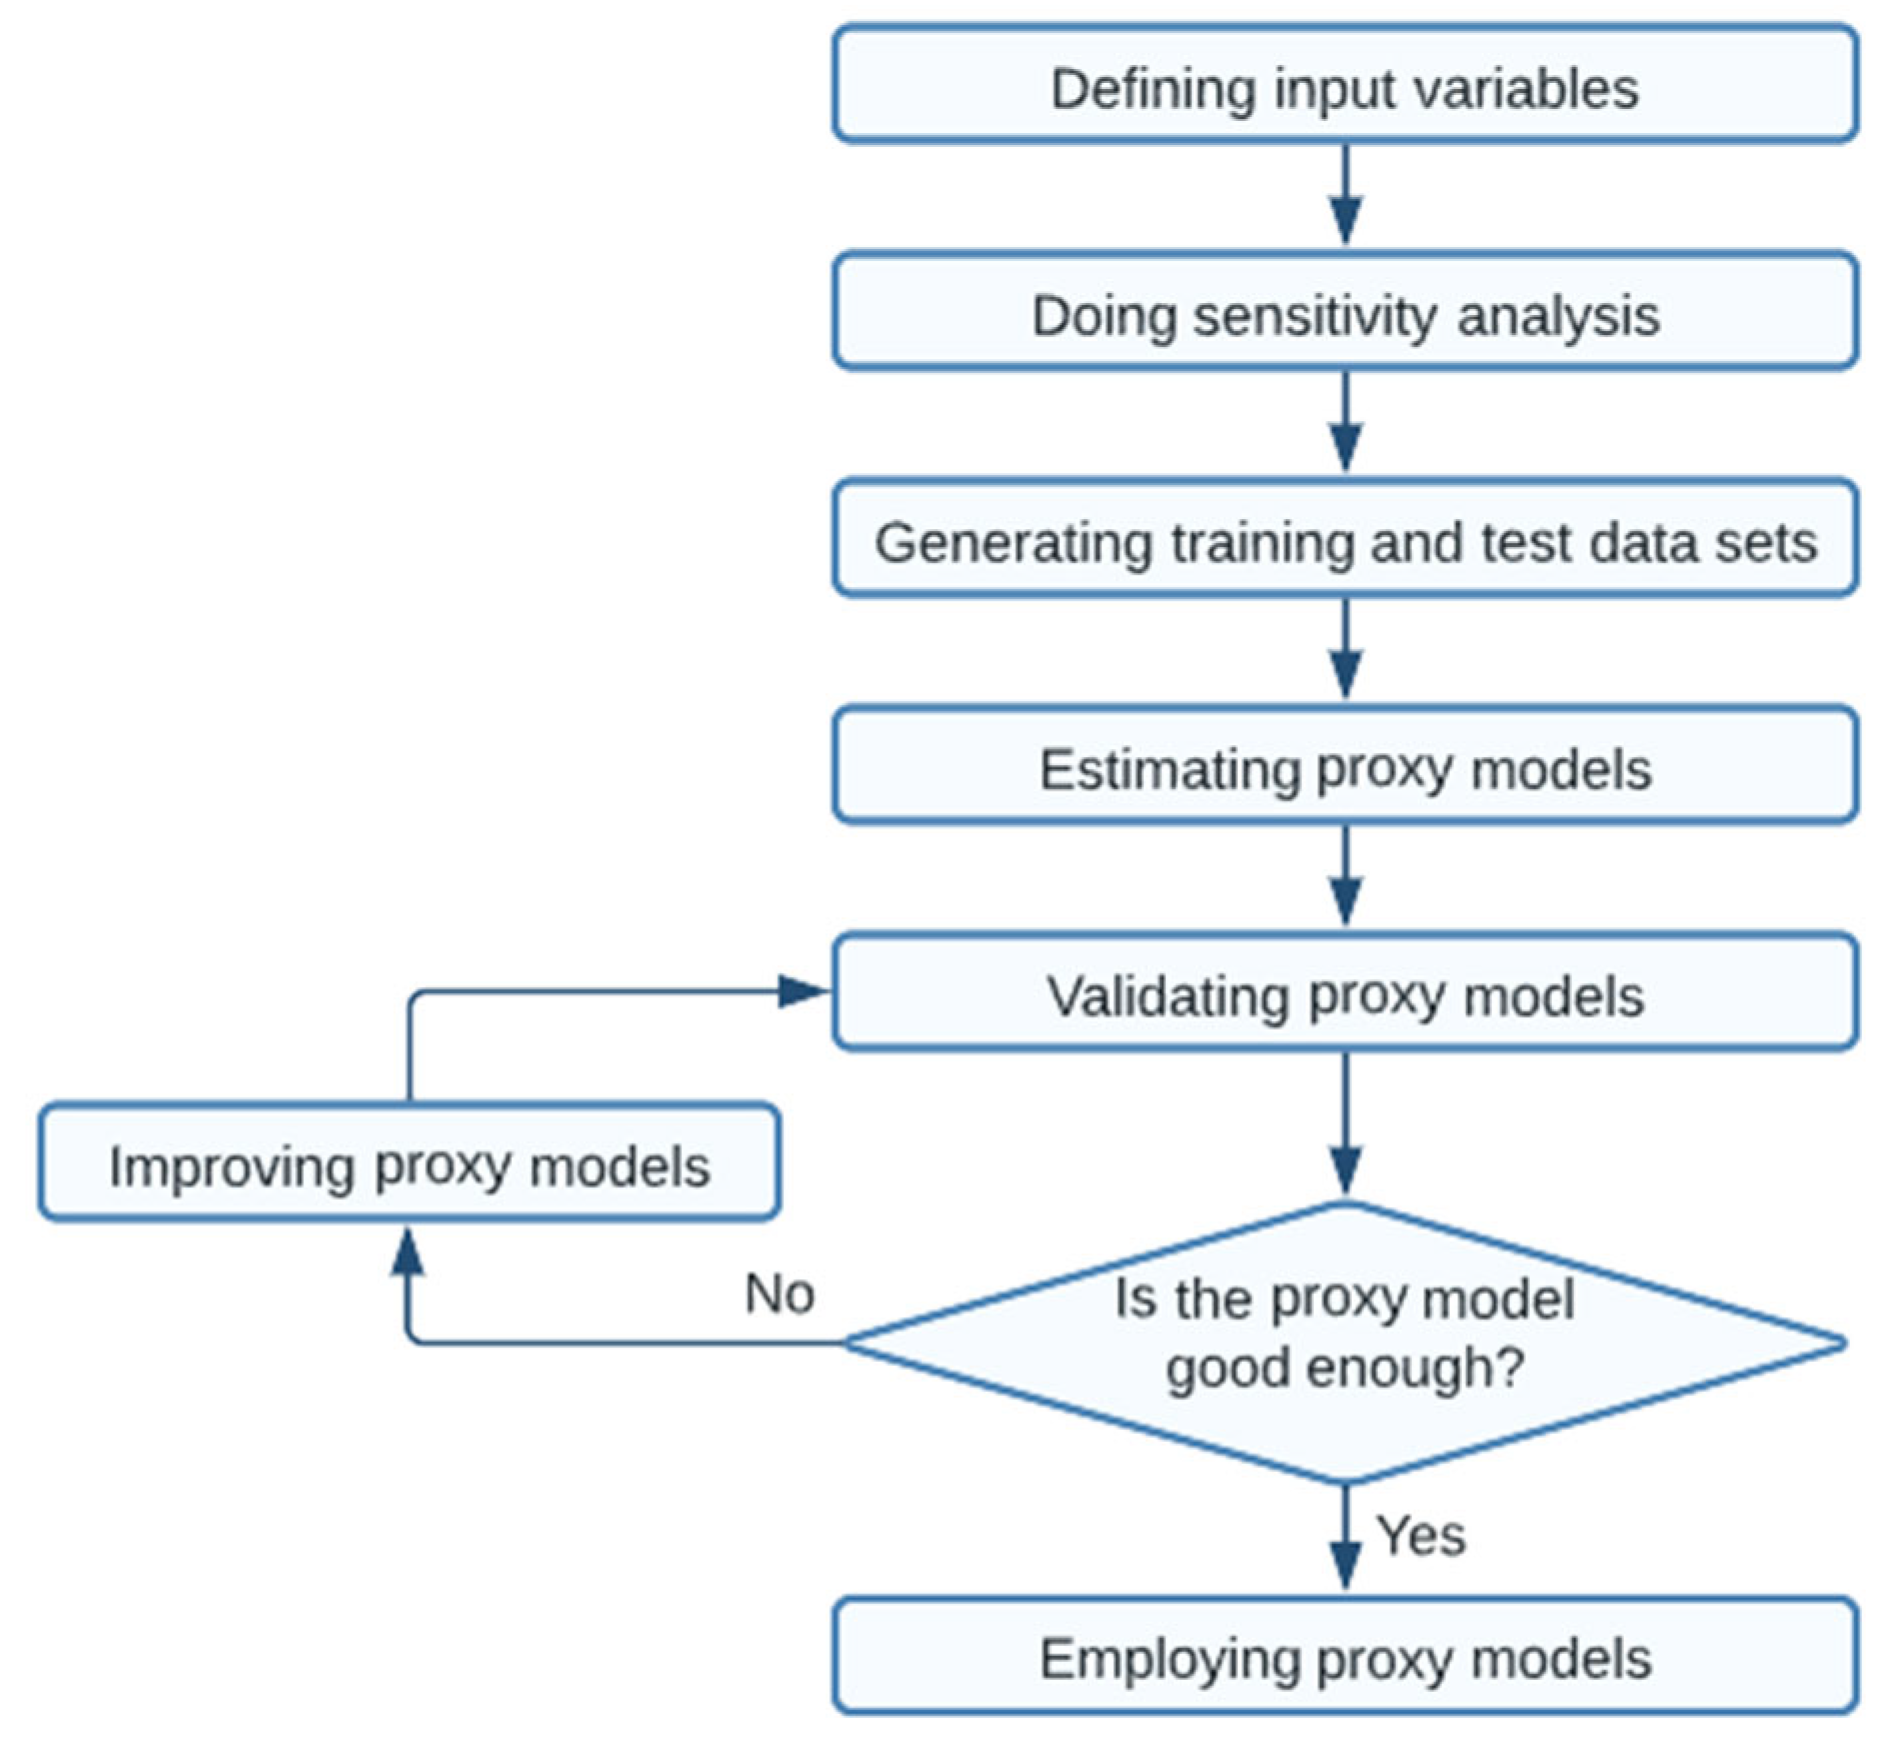
2.2. Development of the Data-Driven Proxy Model

Figure 9 represents the algorithm utilized to develop the data-driven proxy models in this study. The data sets and the algorithms of the model development are considered the most important elements for establishing a data-driven proxy model. To ensure that all aspects of the model are considered, an infinite-size data set is required, which is practically impossible [11,22]. Therefore, some experimental design techniques should be enlisted to extract the utmost information with the least simulations. The selection of the input variable highly depends on the type of problem and the level of knowledge of the project. It is recommended that all input variables are considered at the beginning and then unimportant parameters are omitted through the sensitivity analysis step. Indeed, sensitivity analysis filters out less significant parameters in the model, and consequently, an appropriate dataset can be prepared. The accuracy of the proxy model originates from the quality of training. As a result, a decent data set is required to train the proxy model appropriately. In the case of unacceptable estimation, the consistency and the quality of the training data sets should be improved as much as required. Improvement of the training data sets can be achieved either by enlarging the data sets or increasing the range or number of the input variables. Thereby, the verification of the model, which is based on prediction accuracy, is satisfied [23].

2.2.1. Data Set Generation

This study was conducted through the modeling and forecasting of oil and water production from an advanced horizontal well with different FCD completions in a synthetic reservoir with uncertain properties for 10 years. The reservoir properties were the model inputs, and it was also assumed that the value of the properties is uncertain. The uncertain reservoir parameters with their uncertainty range are reported in Table 1. The cumulative oil and water production were the model outputs and were used to evaluate the performance of advanced wells with various completion designs under uncertainty. In this paper, to reduce the complexity of the model development and uncertainty quantification, only the uncertainty in the reservoir properties was considered. However, in the model development, the inclusion of other uncertainties that can influence the performance of advanced wells such as uncertainties associated with hydraulic fracturing, skin factor, etc. is of great importance [24,25].
Sensitivity analysis assesses the contribution of the uncertainty of each model input to the accuracy of the model outcomes and identifies the most important parameters of the system. In this paper, in order to perform sensitivity analysis, differential sensitivity analysis, which is one of the common techniques used for this purpose, was simplified and used. In differential sensitivity analysis, the sensitivity of each input parameter is quantified by a sensitivity coefficient, which is essentially the ratio of the change in output to the change in input while all other parameters are kept constant. According to this approach, for a particular independent input variable Xi, the sensitivity coefficient, Φi, with respect to the desired output Y is calculated by Equation (4) as [26]:
ϕ i = Y X i ( X i Y )
where the quotient Xi/Y is added to normalize the coefficient by taking the effect of units out of the equation. For small changes in the input parameter, by neglecting the nonlinearities, the partial derivative in Equation (4) can be approximated as a finite difference and Equation (4) can be simplified as:
ϕ i = % Δ Y % Δ X i
Equation (5) was used to perform sensitivity analysis in this study. By perturbing each uncertain reservoir parameter given in Table 1 in such a way that ΔXi = ±10% and measuring the percentage change in the outputs (here cumulative oil and water production), the sensitivity coefficient of each reservoir parameter for the cumulative oil and water production was calculated. The obtained results are depicted as a tornado diagram in Figure 10. According to the presented results, among all the reservoir parameters, for both oil and water production, the sensitivity coefficient for the top six parameters is considerable. The sensitivity coefficient of the seventh parameter (maximum relative permeability of oil) compared to the top six parameters is considerably lower, and the last three parameters have a very small sensitivity coefficient as well. As a result, the top six parameters, were determined as the most impactful input variables for predicting both oil and water production. These input variables are given in Table 2 and are considered the model inputs for the proxy model development.
In this paper, a special proxy model for each type of well completion design was developed. This means that four main proxy models for forecasting oil and water production from an open-hole well and advanced wells with ICD, AICD, and AICV completion were developed. These four main proxy models were trained, validated, and tested separately and then they were used for uncertainty quantification for different types of well completion designs. The training and verification data sets were generated by coupling MATLAB and the Eclipse black oil simulator (E100). An efficient approach known as Latin hypercube sampling (LHS) was used for the design of the experiments. The LHS method is a pseudo-random sampling method based on stratification of the input probability distributions, as opposed to the Monte Carlo approach, which is based on a fully stochastic and memoryless sampling scheme [27]. The input domains consisted of the six variables given in Table 2, and to generate the training data sets, four samples were picked from each variable in the range of their uncertainty using the LHS method. As a result, for each of the 4 main proxy models, 4096 (46) data sets were generated for the training and improvement of the proxy models. In the same way, for each proxy model, 3 different samples for each input variable were used to generate 729 (36) data sets for validation and testing of the developed proxy models. Two-thirds of these 729 data sets were used for validation and one-third of them (240 data sets) were considered for the test.

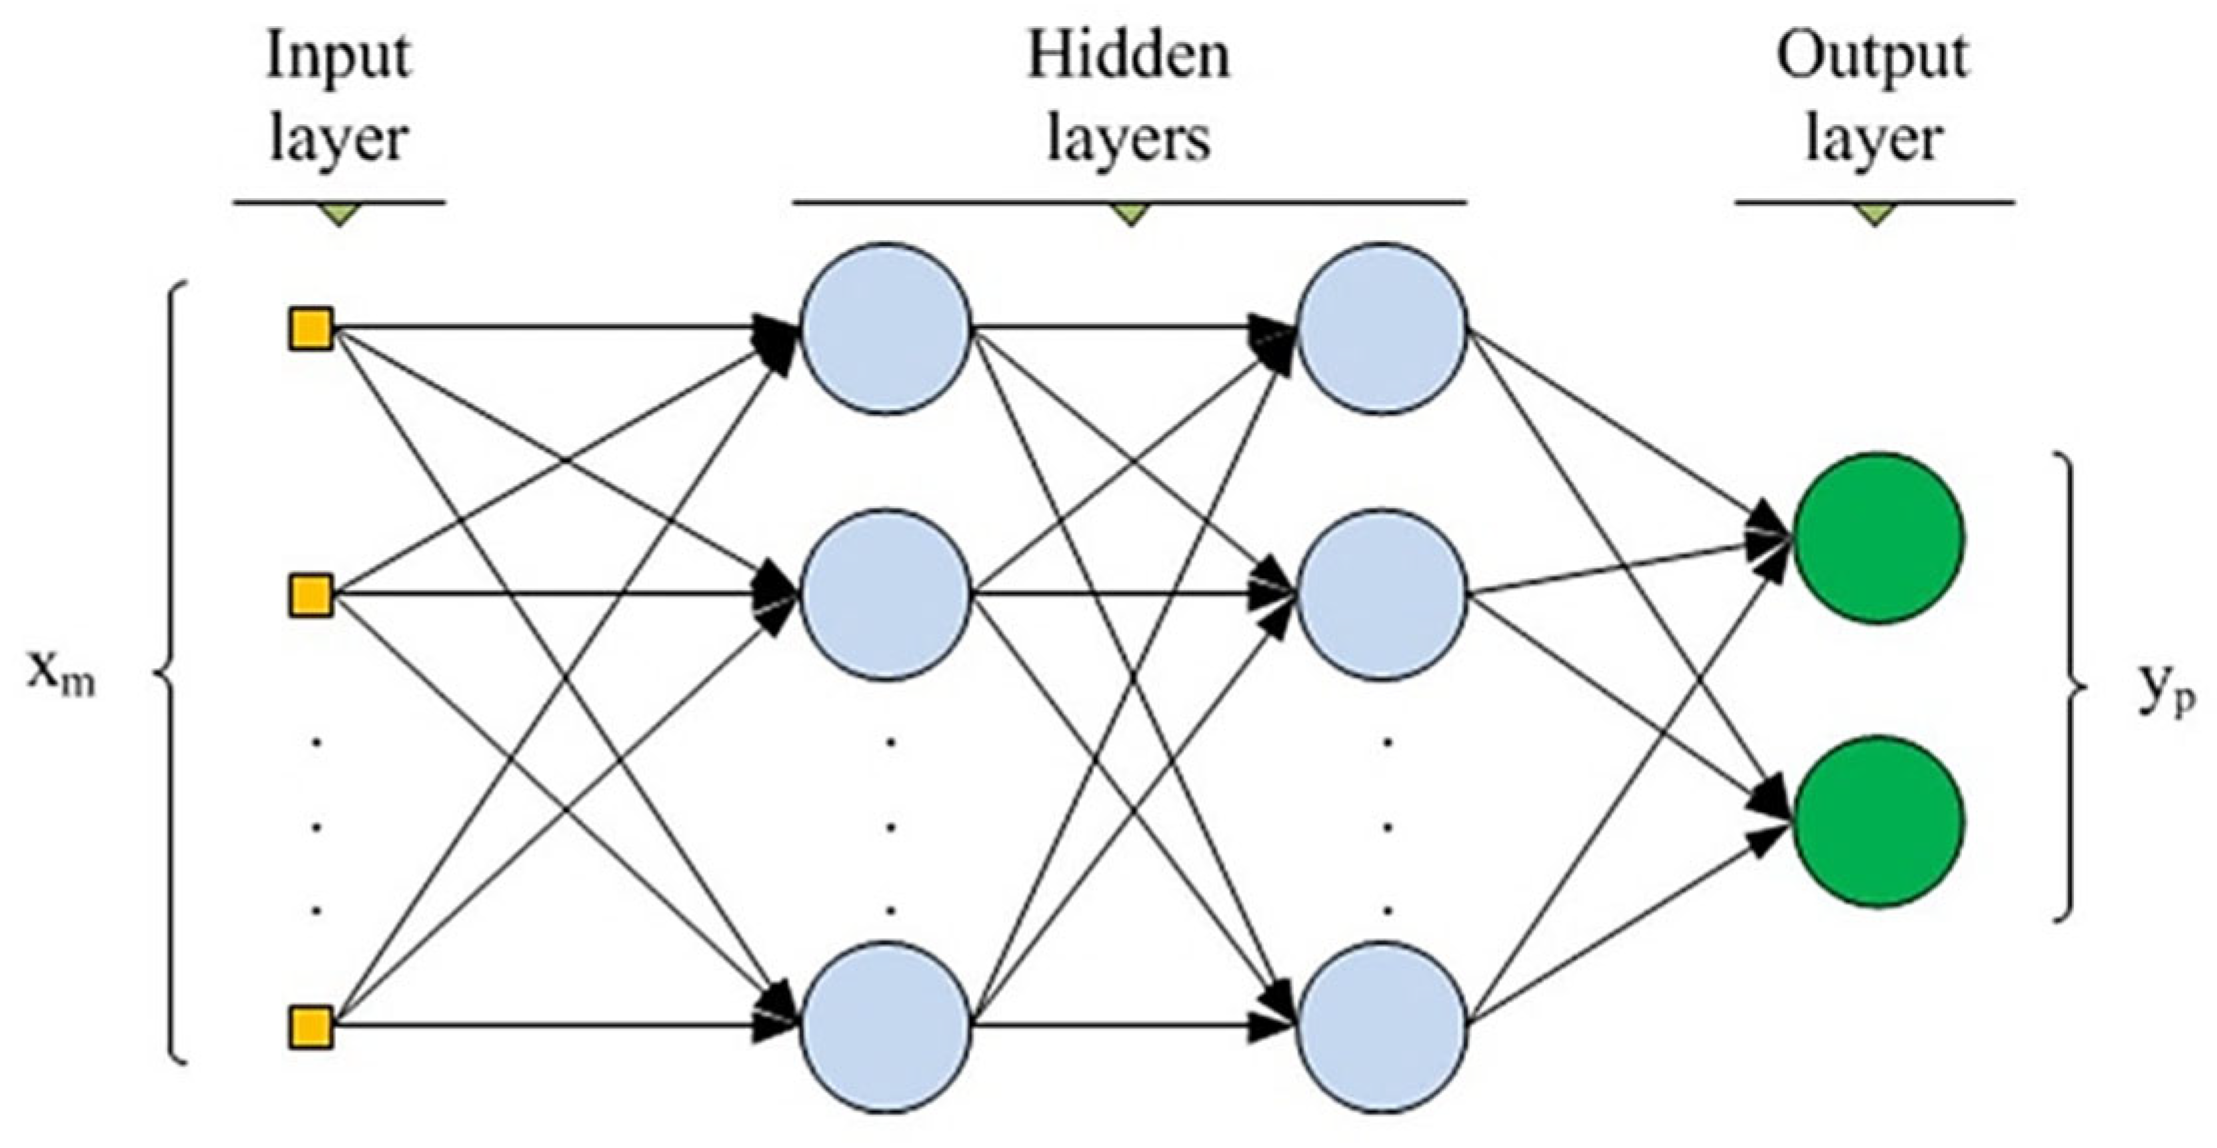
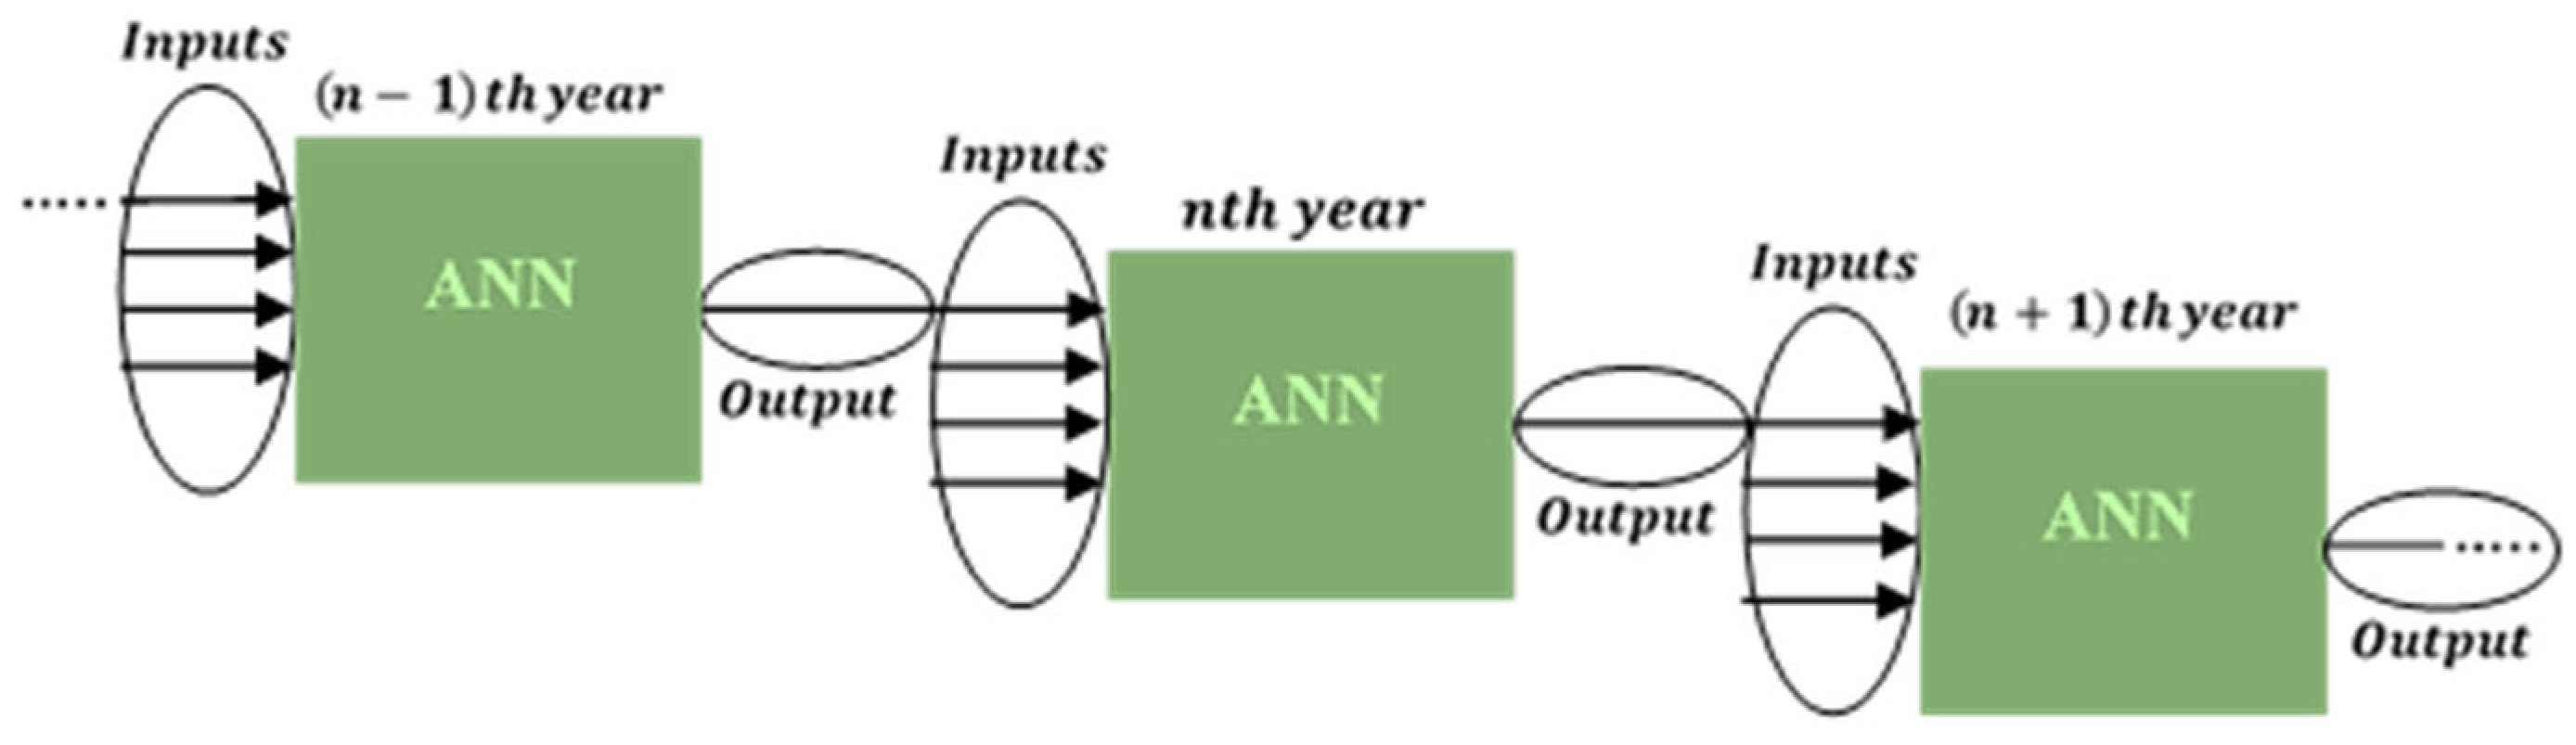
2.2.2. Architecture of the Proxy

Generally, based on the structure of the network and the operation of neurons, neural networks carry out a quite simple differentiable function. Indeed, after the learning phase and stabilization of the weight, the machine as a black box forecasts the phenomenon for new inputs [9]. Despite this, there are still some deterrents against the utilization of ANNs. In other words, the configuration of the architecture of ANNs (schematically shown in Figure 11), namely the number of layers and number of neurons in each layer, should be found while the identification of a better architecture is lacking [28].
A neural network is considered a good proxy when it predicts a new case with acceptable error. Therefore, evaluation of the model should be performed sequentially to avoid overtraining. In this way, cross-validation, as one of the most popular methods [11,13], was applied to stop learning when the validation error was increased. Overtraining also comes from a poorly structured network. Thereby, the identification of the appropriate number of hidden layers and their neurons is a requisite [7]. Moreover, the complexity of neural networks should also be limited. For this purpose, after finishing the learning phase, the pruning method was utilized to eliminate the connections with the smallest effect on the output error.

2.2.3. Training and Testing the Proxy

Before feeding the inputs to the machine for training, all values were normalized between [0, 1] based on the minimum value and maximum value. The outputs in the dataset accounted for the accumulative oil and water production over 10 years. Because of this, for the prediction of the fluid production of each year, the fluid production of the previous year was considered as input too, as schematically shown in Figure 12. To test the proxy, the values of inputs were ununiformly chosen in a way that the machine had never experienced, although these values were between the minimum and the maximum values.

3. Results and Discussions

3.1. Performance of the Developed Proxy Models

To evaluate the performance of the developed data-driven proxy, the errors in the prediction of oil and water production through advanced wells using such models were calculated for the test data sets within 10 years. According to the calculated errors shown in Figure 13, the proxy models predicted the oil production better than the water production. The mean error is presented as a horizontal line in the figure and the mean error values are given in Table 3. As can be seen, the developed data-driven proxy models are able to predict the production of oil and water with a mean error of less than 1% and 4%, respectively. Moreover, the proxy models for advanced wells with AICD and AICV show a better performance in predicting oil and water production compared to the proxy model for the ICD case. Moreover, to evaluate the speed of simulation, the simulation time of 5000 cases using the developed proxy models and the physics-based simulator was recorded. The simulation time of the use of the physics-based simulator was about 290 h while it took about 50 min for the proxy model to perform the simulations. In other words, the developed proxy model is about 350 times faster than the physics-based model. As a result, using the developed proxy models, some prediction accuracy is sacrificed but the speed of the simulation is considerably improved.

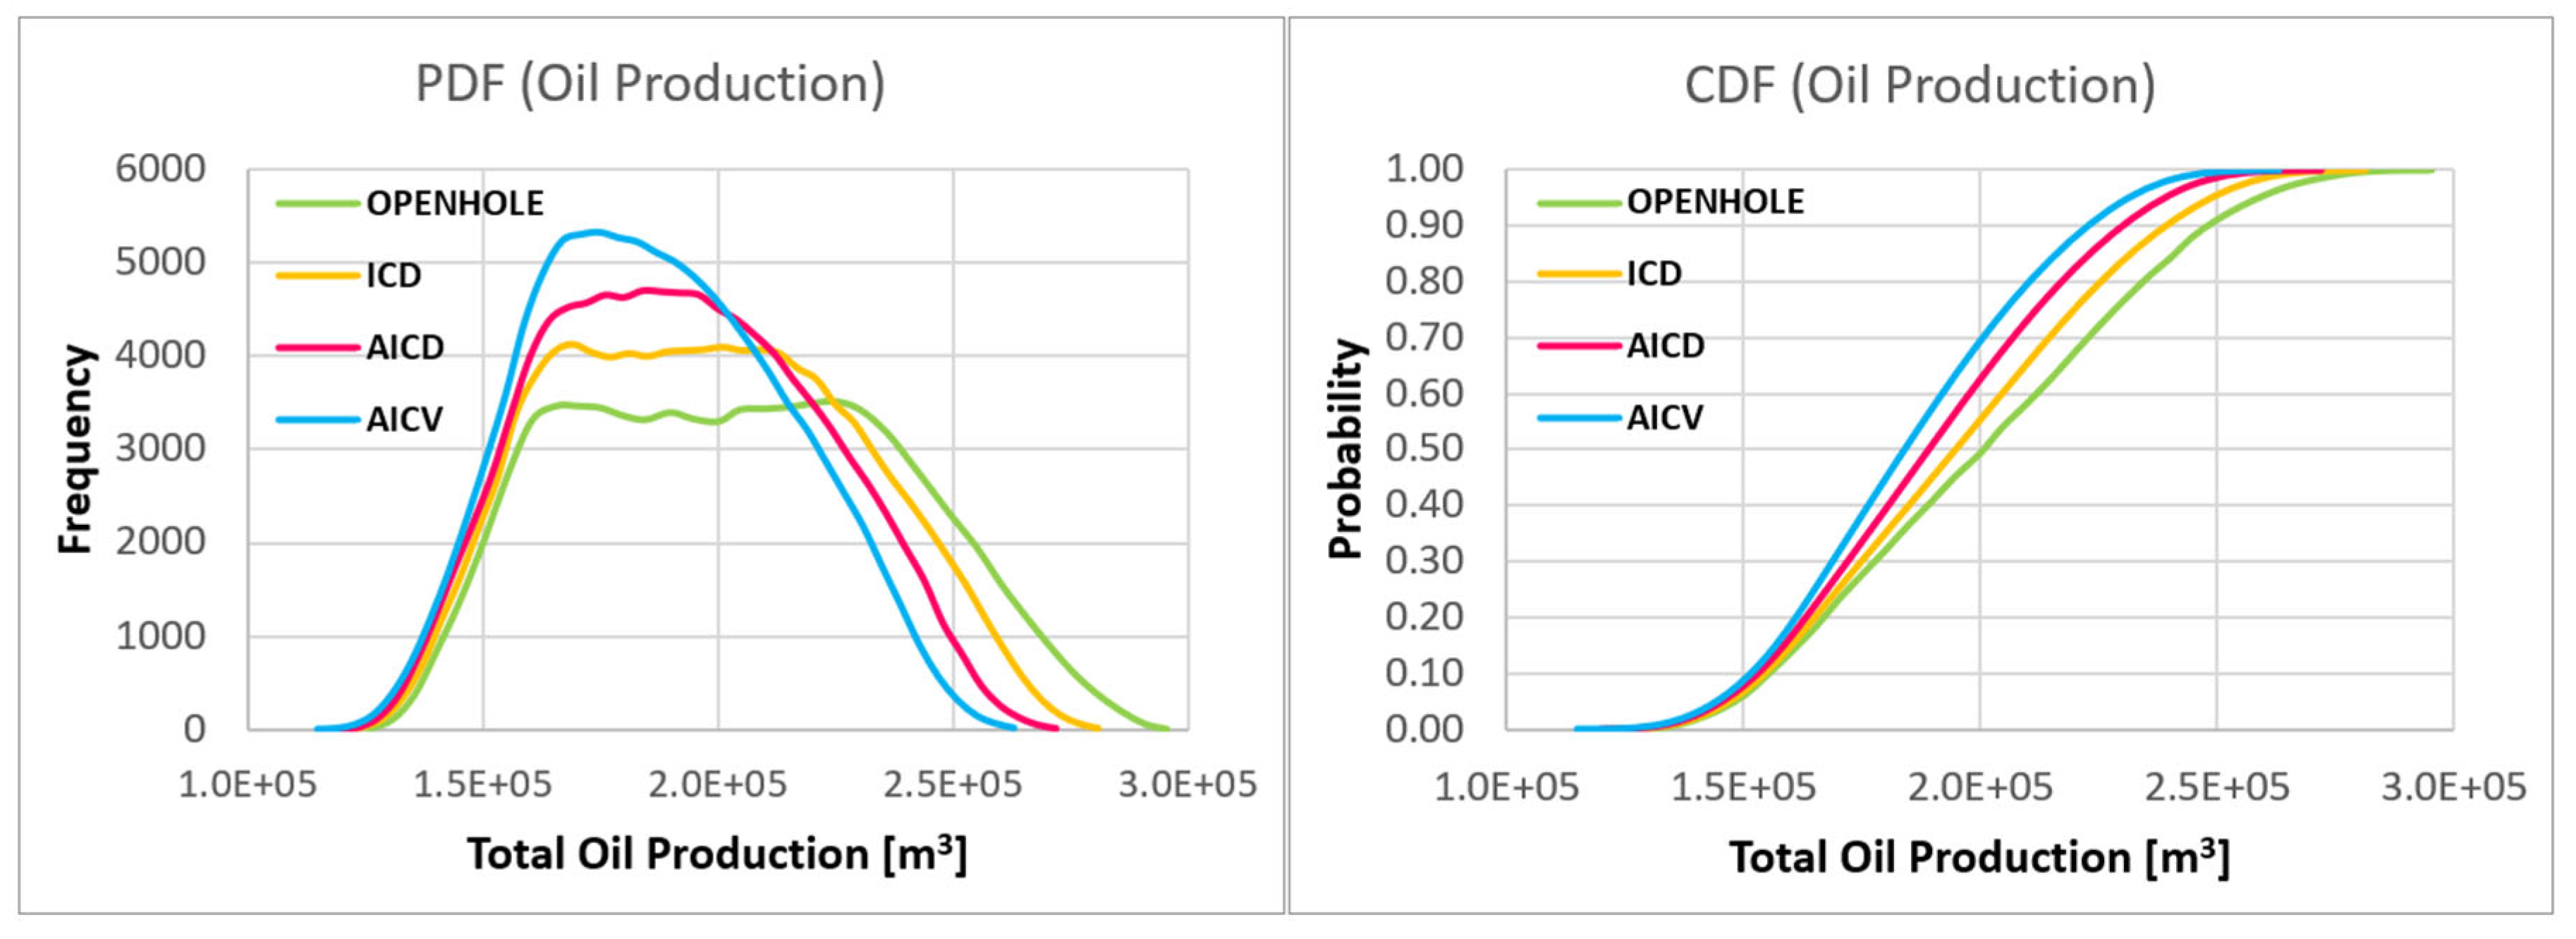
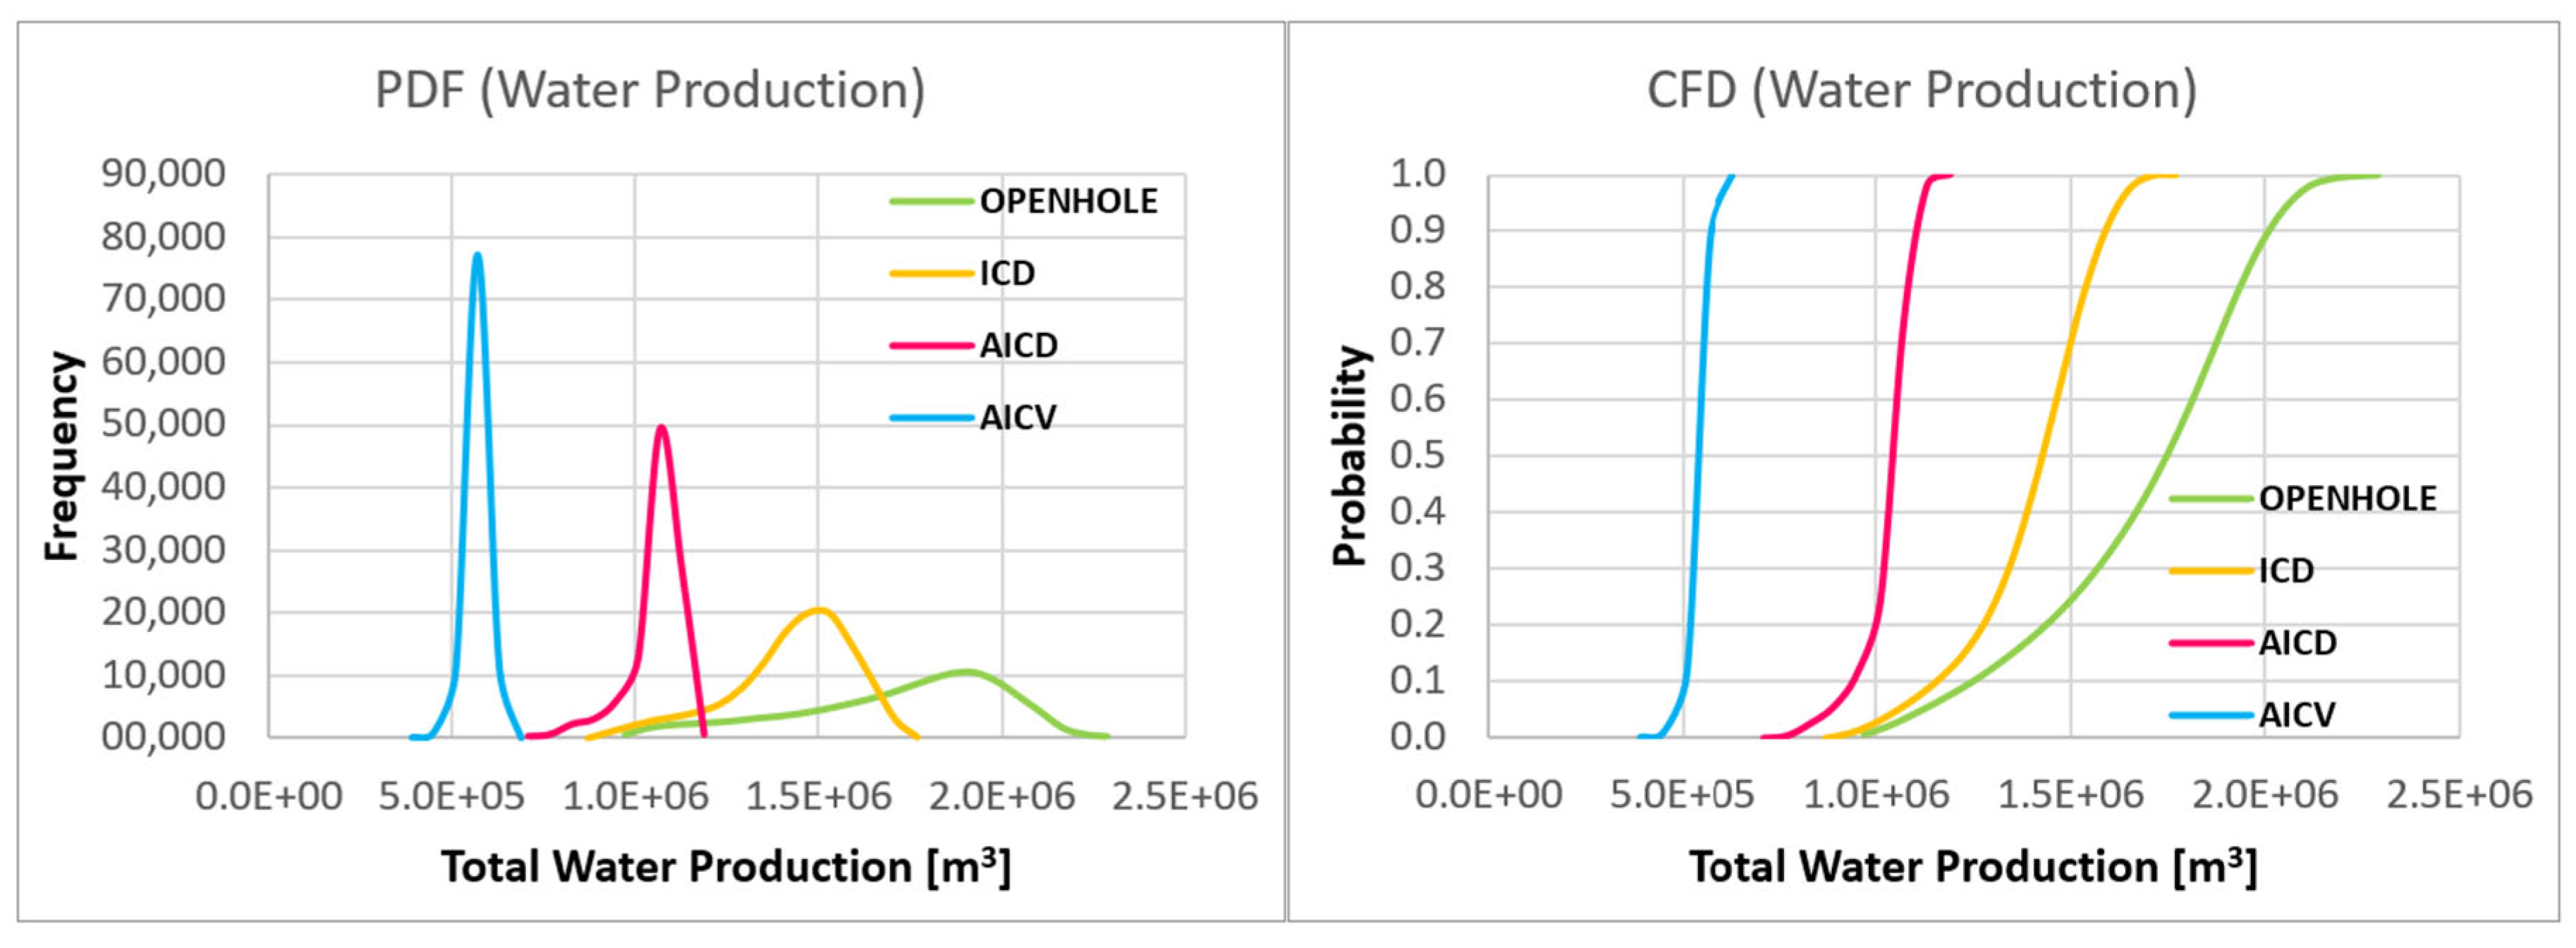
3.2. Evaluating the Performance of Advanced Wells under Uncertainty

In order to achieve a successful design for advanced wells, the performance of such wells needs to be assessed by taking the reservoir uncertainties into account. Therefore, uncertainty quantification is a crucial step in improving the advanced well completion design. Uncertainty quantification based on the probabilistic approaches is a very time-consuming process, where several simulations need to be performed to consider all possible scenarios. The use of data-driven proxy models can be considered a practical option to reduce the time of simulation for uncertainty quantification. In this study, using the developed proxy models for the open-hole and advanced wells, the performance of advanced wells with different FCD completions under uncertainty was assessed. Although there are different methods for probabilistic data sampling, Latin hypercubic sampling (LHS) was chosen as an efficient sampling method. By considering the range of uncertainty of the six most impactful parameters and taking seven samples in the range of the uncertainty of each parameter, 76 = 117,649 possible scenarios were specified using the LHS approach. Using the simulation results for all these scenarios, the probability distribution function (PDF) and cumulative distribution function (CDF) of the total oil and water production from advanced wells with different FCD completions after 10 years were determined. Figure 14 and Figure 15 show PDF and CDF for oil and water production for different completions after 10 years, respectively. Moreover, the mean (average), P10 (low estimation), P50 (best estimation), and P90 (high estimation) and P10/P90 range (risk) were calculated and are given in Table 4.
The applied production strategy noticeably impacts the performance of advanced wells. In this paper, the production strategy is based on producing oil with a constant bottom hole pressure (BHP) constrained by a specified maximum liquid production rate. Under this strategy, since open-hole wells basically give a bigger open area for the production of reservoir fluids and the pressure drawdown is constant, the liquid (both oil and water) production from open-hole wells is higher than that of advanced wells. As a result, open-hole completion leads to an increase in the production of both oil and water. Additionally, AICDs and AICVs remain fully open such as ICDs before the water breakthrough. These valves, however, partially close by increasing the water cut after the water breakthrough. Consequently, compared to ICD completion, AICD and AICV completions produce less oil and water. Because AICVs are more capable of being closed than AICDs, the liquid production (both oil and water) from an AICV completion is likewise lower than that of an AICD completion.
As can be seen in Figure 14 and Figure 15, considering the uncertainties in the reservoir properties, the mean value of cumulative water production employing AICDs and AICVs is significantly lower than ICD and open-hole completions. However, this comes with the cost of losing a small fraction of feasible oil recovery due to the application of the AICD and AICV technologies. According to the obtained results given in Table 4, the use of ICDs, AICDs, and AICVs reduces the mean value of cumulative water production in comparison to open-hole completion by 16.86%, 38.37%, and 65.86%, respectively. The mean oil recovery is also reduced by 3.43%, 5.88%, and 7.84%, respectively, due to the use of these FCDs. These simulation results are comparable to the reported results describing the performance of advanced wells in real cases. As an example, according to Tendeka [30], the use of advanced wells with AICD completion reduced water production by 40–50% in an oil field in western Canada. In the same way, the operator of a field in the Middle East reported that the use of advanced wells with AICV completion decreased the water cut by 68% [31].
According to the performed uncertainty assessment, the risk (P10 to P90) of water production is significantly reduced by the completion of an advanced well with the AICD and AICV technologies. According to the results, under the presence of uncertainty, the use of ICDs, AICDs, and AICVs mitigates the risk of water production by 42.86%, 89.27%, and 91.17% compared to an open-hole completion. Moreover, as can be seen in the figures, the probability distribution curves for both oil and water production are noticeably shrunk by the application of AICD and AICV completions, indicating that the use of these technologies can reduce the uncertainty and provide more reliable oil recovery.

4. Conclusions

In this study, the functionality of data-driven proxy models as an alternative for physics-driven models developed by commercial software packages for simulation and performance assessment of advanced wells with different completion designs was investigated. After that, the developed proxy models were applied for uncertainty quantification of oil recovery from advanced wells completed with different types of FCDs from a heterogenous reservoir with uncertain characteristics.
The results show that when the data-driven models for advanced wells were used, the simulation time was reduced by 350 times while the prediction accuracy showed a maximum error of 1% and 4% for oil and water production, respectively. As a result, it can be concluded that the use of the developed proxy models for the simulation of advanced wells results in some prediction accuracy being sacrificed, but the speed of the simulation is considerably improved.
According to the obtained results from the uncertainty quantification, the use of advanced wells completed with FCDs compared to an open-hole well can noticeably reduce the uncertainty in oil recovery and more reliable oil production can be achieved. Moreover, among the different types of FCDs, the AICV and AICD technologies were able to significantly limit the production of unwanted fluids by 38.37%, and 65.86%, respectively. Advanced wells completed by AICVs showed the best performance in reducing the risk associated with the production of unwanted fluids by decreasing the risk by 91%. Since the handling and separation of unwanted fluid have huge costs and carbon footprints, the use of advanced wells with AICD and AICV completions is a valuable measure in achieving cost-effective and low-carbon-footprint oil recovery. Comprehensive evaluation of the benefits and drawbacks of advanced wells completed by FCDs compared to conventional wells requires accurate and realistic NPV analysis and this is the subject of future studies.

Author Contributions

Conceptualization, A.M., J.T. and B.M.E.M.; Data curation, AM, J.T.; Formal analysis, A.M. and J.T.; Methodology, A.M., J.T. and B.M.E.M.; Project administration, B.M.E.M.; Software, A.M.; Supervision, B.M.E.M.; Validation, A.M. and J.T.; Visualization, A.M. and J.T.; Writing—original draft, A.M. and J.T.; Writing—review & editing, B.M.E.M. All authors have read and agreed to the published version of the manuscript.

Funding

We gratefully acknowledge the economic support from the Research Council of Norway and Equinor through Research Council Project No. 308817, ‘‘Digital Wells for Optimal Production and Drainage’’ (DigiWell). The APC was founded by University of South-Eastern Norway.

Conflicts of Interest

The authors declare no conflict of interest.

References

  1. Moradi, A.; Moldestad, B.M. Simulation of heavy oil production using smart wells. Scand. Simul. Soc. 2022, 263–270. [Google Scholar] [CrossRef]
  2. Triandi, M.; Chigbo, I.; Khunmek, T.; Ismail, I.M. Field Case: Use of Autonomous Inflow Control Devices To Increase Oil Production in a Thin Oil Rim Reservoir in the Gulf of Thailand. In Proceedings of the Abu Dhabi International Petroleum Exhibition & Conference, Abu Dhabi, United Arab Emirates, 12–15 November 2018. [Google Scholar]
  3. Moradi, A.; Samani, N.A.; Kumara, A.S.; Moldestad, B.M. Evaluating the performance of advanced wells in heavy oil reservoirs under uncertainty in permeability parameters. Energy Rep. 2022, 8, 8605–8617. [Google Scholar] [CrossRef]
  4. Khuri, A.I.; Mukhopadhyay, S. Response surface methodology. Wiley Interdiscip. Rev. Comput. Stat. 2010, 2, 128–149. [Google Scholar] [CrossRef]
  5. Alenezi, F.; Mohaghegh, S. A data-driven smart proxy model for a comprehensive reservoir simulation. In Proceedings of the 2016 4th Saudi International Conference on Information Technology (Big Data Analysis)(KACSTIT), Riyadh, Saudi Arabia, 6–9 November 2016; pp. 1–6. [Google Scholar]
  6. Yu, Y.; Liu, S.; Liu, Y.; Bao, Y.; Zhang, L.; Dong, Y. Data-driven proxy model for forecasting of cumulative oil production during the steam-assisted gravity drainage process. ACS Omega 2021, 6, 11497–11509. [Google Scholar] [CrossRef]
  7. Navrátil, J.; King, A.; Rios, J.; Kollias, G.; Torrado, R.; Codas, A. Accelerating physics-based simulations using end-to-end neural network proxies: An application in oil reservoir modeling. Front. Big Data 2019, 2, 33. [Google Scholar] [CrossRef] [PubMed] [Green Version]
  8. Guérillot, D.; Bruyelle, J. Uncertainty assessment in production forecast with an optimal artificial neural network. In Proceedings of the SPE Middle East Oil & Gas Show and Conference, Manama, Bahrain, 6–9 March 2017. [Google Scholar]
  9. Silva, C.; Maschio, C.; Schiozer, D.J. Use of neuro-simulation techniques as proxies to reservoir simulator: Application in production history matching. J. Pet. Sci. Eng. 2007, 57, 273–280. [Google Scholar] [CrossRef]
  10. Foroud, T.; Seifi, A.; AminShahidi, B. Assisted history matching using artificial neural network based global optimization method–Applications to Brugge field and a fractured Iranian reservoir. J. Pet. Sci. Eng. 2014, 123, 46–61. [Google Scholar] [CrossRef]
  11. Shaik, N.B.; Pedapati, S.R.; Dzubir, F.A.B. Remaining useful life prediction of a piping system using artificial neural networks: A case study. Ain Shams Eng. J. 2022, 13, 101535. [Google Scholar] [CrossRef]
  12. Otchere, D.A.; Ganat, T.O.A.; Gholami, R.; Ridha, S. Application of supervised machine learning paradigms in the prediction of petroleum reservoir properties: Comparative analysis of ANN and SVM models. J. Pet. Sci. Eng. 2021, 200, 108182. [Google Scholar] [CrossRef]
  13. Yuan, Z.; Huang, H.; Jiang, Y.; Li, J. Hybrid deep neural networks for reservoir production prediction. J. Pet. Sci. Eng. 2021, 197, 108111. [Google Scholar] [CrossRef]
  14. Mohaghegh, S. Virtual-Intelligence Applications in Petroleum Engineering: Part 1—Artificial Neural Networks. J. Pet. Technol. 2000, 52, 64–73. [Google Scholar] [CrossRef]
  15. Mohaghegh, S. Virtual-Intelligence Applications in Petroleum Engineering: Part 2—Evolutionary Computing. J. Pet. Technol. 2000, 52, 40–46. [Google Scholar] [CrossRef]
  16. Mohaghegh, S. Virtual-Intelligence Applications in Petroleum Engineering: Part 3—Fuzzy Logic. J. Pet. Technol. 2000, 52, 82–87. [Google Scholar] [CrossRef]
  17. Lie, K.-A. An Introduction to Reservoir Simulation Using MATLAB/GNU Octave: User Guide for the MATLAB Reservoir Simulation Toolbox (MRST); Cambridge University Press: Cambridge, UK, 2019. [Google Scholar]
  18. Bahadori, A. Fluid Phase Behavior for Conventional and Unconventional Oil and Gas Reservoirs; Gulf Professional Publishing: Woburn, MA, USA, 2016. [Google Scholar]
  19. ECLIPSE Reservoir Simulation Software: Reference Manual/Technical Description; Schlumberger: Houston, TX, USA, 2019.
  20. Raoufi, M.H.; Farasat, A.; Mohammadifard, M. Application of simulated annealing optimization algorithm to optimal operation of intelligent well completions in an offshore oil reservoir. J. Pet. Explor. Prod. Technol. 2015, 5, 327–338. [Google Scholar] [CrossRef] [Green Version]
  21. Elverhøy, A.B.; Aakre, H.; Mathiesen, V. Autonomous Inflow Control for Reduced Water Cut and/or Gas Oil Ratio. In Proceedings of the Offshore Technology Conference, Houston, TX, USA, 30 April–3 May 2018. [Google Scholar] [CrossRef]
  22. Teixeira, A.F.; Secchi, A.R. Machine learning models to support reservoir production optimization. IFAC-PapersOnLine 2019, 52, 498–501. [Google Scholar] [CrossRef]
  23. Zubarev, D.I. Pros and cons of applying proxy-models as a substitute for full reservoir simulations. In Proceedings of the SPE Annual Technical Conference and Exhibition, New Orleans, LA, USA, 4–7 October 2009. [Google Scholar]
  24. Tripoppoom, S.; Ma, X.; Yong, R.; Wu, J.; Yu, W.; Sepehrnoori, K.; Miao, J.; Li, N. Assisted History Matching in Shale Gas Well Using Multiple-Proxy-Based Markov Chain Monte Carlo Algorithm: The Comparison of K-Nearest Neighbors and Neural Networks as Proxy Model. Fuel 2020, 262, 116563. [Google Scholar] [CrossRef]
  25. Wang, J.; Olson, J.E. Auto-Optimization of Hydraulic Fracturing Design with Three-Dimensional Fracture Propagation in Naturally Fractured Multi-Layer Formations. In Proceedings of the SPE/AAPG/SEG Unconventional Resources Technology Conference, Virtual, 20–22 July 2020. [Google Scholar] [CrossRef]
  26. Hamby, D.M. A review of techniques for parameter sensitivity analysis of environmental models. Environ. Monit. Assess. 1994, 32, 135–154. [Google Scholar] [CrossRef] [PubMed]
  27. University of Oslo. Sampling Methods. Available online: https://www.uio.no/studier/emner/matnat/math/STK4400/v05/undervisningsmateriale/Sampling%20methods.pdf (accessed on 1 September 2022).
  28. Monteiro, D.D.; Ferreira-Filho, V.M.; Chaves, G.S.; De Santana, R.S.; Duque, M.M.; Granja-Saavedra, A.L.; Baioco, J.S.; Vieira, B.F.; Teixeira, A.F. Uncertainty analysis for production forecast in oil wells. In Proceedings of the SPE Latin America and Caribbean Petroleum Engineering Conference, Buenos Aires, Argentina, 17–19 May 2017. [Google Scholar]
  29. Geronimo, T.M.; Cruz, C.; Campos, F.D.; Aguiar, R.; Bianchi, E.C. MLP and ANFIS Applied to the Prediction of Hole Diameters in the Drilling Process. Artif. Neural Netw. —Archit. Appl. 2013, 27. [Google Scholar]
  30. Tendeka. Case Study: FloSure AICD Improves Heavy Oil Cold Production in Western Canada. Available online: https://www.tendeka.com/wp-content/uploads/AICDHeavy-Oil-Canada-update-2019.pdf (accessed on 1 September 2022).
  31. InflowControl. 68% Water Cut Reduction: 6 AICV® Wells within a Mature Heavy Oil Field. Available online: https://www.nsenergybusiness.com/wpcontent/uploads/sites/3/2020/10/Case-Study-3-AICV%C2%AE-Water-Shutoff_Control_2020_A4.pdf. (accessed on 1 September 2022).
Figure 1. Schematic of advanced well completion with FCD and SCS [2].
Energies 15 07484 g001
Figure 2. Schematic of the well and reservoir.
Energies 15 07484 g002
Figure 3. Porosity and permeability variations throughout the reservoir.
Energies 15 07484 g003
Figure 4. The physical oil properties as a function of the pressure at the reservoir temperature.
Energies 15 07484 g004
Figure 5. Illustration of the MSW model [20].
Energies 15 07484 g005
Figure 6. Performance curves of ICDs, AICDs, and AICVs for oil, water, and gas [21].
Energies 15 07484 g006
Figure 7. The derived mathematical models of AICDs and AICVs against the laboratory test data.
Energies 15 07484 g007
Figure 8. Cumulative oil and water production from open-hole and advanced wells with different FCD completions for the base case.
Energies 15 07484 g008aEnergies 15 07484 g008b
Figure 9. The workflow for proxy model development.
Energies 15 07484 g009
Figure 10. Sensitivity analysis of uncertain reservoir parameters.
Energies 15 07484 g010
Figure 11. Schematic diagram of a neural network with two hidden layers [29].
Energies 15 07484 g011
Figure 12. Schematic flow chart of the prediction in sequential years.
Energies 15 07484 g012
Figure 13. Prediction mean and relative error for the developed proxy models for the ICD, AICD, and AICV cases.
Energies 15 07484 g013
Figure 14. Probability and cumulative distribution function for oil production after 10 years.
Energies 15 07484 g014
Figure 15. Probability and cumulative distribution function for water production after 10 years.
Energies 15 07484 g015
Table 1. The reservoir characteristics with their uncertainty range.
ParameterMinMeanMaxUnit
Porosity0.150.210.27-
Absolute permeability100350800mD
Irreducible water saturation0.10.150.2-
Residual oil saturation0.050.10.15-
Maximum relative permeability of water0.20.40.5-
Maximum relative permeability of oil0.850.951-
Permeability anisotropy0.70.30.1-
Initial water saturation0.120.20.25-
Capillary pressure22.74Bar
Aquifer productivity index200010,00015,000m3/d/bar
Table 2. Uncertain input variables for uncertainty assessment.
ParameterMin.MeanMax.
Porosity0.150.210.27
Initial water saturation0.120.20.25
Irreducible water saturation0.10.150.2
Residual oil saturation0.050.10.15
Maximum relative permeability of water0.20.40.5
Absolute permeability100350800
Table 3. Prediction mean error for the developed proxy models.
CaseMean Error
OilWater
ICD 0.96%3.79%
AICD 0.48%1.98%
AICV 0.46%1.98%
Table 4. Summary of the obtained results from the uncertainty quantification.
CaseProduction [m3]MeanP10P50P90P10/P90 Range
OPENHOLEOil2.04 × 1051.56 × 1052.01 × 1052.47 × 1059.10 × 104
Water1.72 × 1061.24 × 1061.74 × 1062.01 × 1067.70 × 105
ICDOil1.97 × 1051.55 × 1051.94 × 1052.38 × 1058.30 × 104
Water1.43 × 1061.14 × 1061.42 × 1061.58 × 1064.40 × 105
AICDOil1.92 × 1051.54 × 1051.89 × 1052.29 × 1057.50 × 104
Water1.06 × 1069.36 × 1051.04 × 1061.10 × 1068.26 × 104
AICVOil 1.88 × 1051.53 × 1051.83 × 1052.22 × 1056.90 × 104
Water5.70 × 1054.98 × 1055.30 × 1055.66 × 1056.80 × 104
Publisher’s Note: MDPI stays neutral with regard to jurisdictional claims in published maps and institutional affiliations.

